SUPER – Sustainable Urbanisation and Land Use Practices in ...
69
SUPER – Sustainable Urbanisation and Land Use Practices in European Regions Applied Research Annex 4 – Sustainability assessment and scenarios
Transcript of SUPER – Sustainable Urbanisation and Land Use Practices in ...

SUPER – Sustainable Urbanisation and Land Use
Practices in European Regions
Applied Research
Annex 4 – Sustainability assessment and scenarios

Annex 4 – Sustainability assessment and scenarios This applied research activity is conducted within the framework of the ESPON 2020 Cooperation Programme. The ESPON EGTC is the Single Beneficiary of the ESPON 2020 Cooperation Programme. The Single Operation within the programme is implemented by the ESPON EGTC and co-financed by the European Regional Development Fund, the EU Member States and the Partner States, Iceland, Liechtenstein, Norway and Switzerland. This delivery does not necessarily reflect the opinion of the members of the ESPON 2020 Monitoring Committee. Authors David Evers (PBL Netherlands Environmental Assessment Agency), Ivana Katuric (URBANEX), Ries van der Wouden (PBL Netherlands Environmental Assessment Agency), Maarten van Schie (PBL Netherlands Environmental Assessment Agency), Frank van Rijn (PBL Netherlands Environmental Assessment Agency) On the basis of contributions from Lia van den Broek, Kersten Nabielek, Frank van Rijn, Ries van der Wouden, PBL - Netherlands Environmental Assessment Agency (Netherlands) Volker Schmidt-Seiwert, Anna Hellings, Regine Binot, Lukas Kiel, supported by Jonathan Terschanski, BBSR - Federal Institute for Research on Building, Urban Affairs and Spatial Development (Germany) Giancarlo Cotella, Umberto Janin Rivolin, Alys Solly, Erblin Berisha, Donato Casavola, Politecnico di Torino (Italy) Ivana Katurić, Mario Gregar, Sven Simov, Katarina Pavlek, Ranko Lipovac, URBANEX (Croatia) Joaquín Farinós-Dasí, Albert Llausàs, Carmen Zornoza-Gallego, University of Valencia (Spain) Dorota Celinska-Janowicz, Adam Ploszaj, Katarzyna Wojnar, University of Warsaw, Centre for European Regional and Local Studies - EUROREG (Poland) Mailin Gaupp-Berghausen, Erich Dallhammer, Bernd Schuh, Ursula Mollay, Roland Gaugitsch, Liudmila Slivinskaya, ÖIR GmbH - Austrian Institute for Regional Studies (Austria) Tristan Claus, University of Ghent (Belgium) Advisory Group Project Support Team: Isabelle Loris, Flanders Department of Environment (Belgium), Tamara Slobodova, Ministry of Transport and Construction (Slovakia), Harald Noreik, Ministry of Local Government and Modernisation, (Norway), Frederick-Christoph Richters, Ministry of Energy and Spatial Planning (Luxembourg) ESPON EGTC: Marjan van Herwijnen (project expert), György Alfoldy (financial expert) Information on ESPON and its projects can be found on www.espon.eu. The web site provides the possibility to download and examine the most recent documents produced by finalised and ongoing ESPON projects. © ESPON, 2020 Printing, reproduction or quotation is authorised provided the source is acknowledged and a copy is forwarded to the ESPON EGTC in Luxembourg. Contact: [email protected] ISBN: 978-2-919795-39-0

Annex 4 – Sustainability assessment and scenarios
SUPER – Sustainable Urbanisation and Land Use Practices in
European Regions
Version 06/11/2020

ESPON / SUPER / Final report i
Table of contents List of Maps ................................................................................................................................ ii List of Figures ............................................................................................................................. ii List of Tables .............................................................................................................................. ii Abbreviations ............................................................................................................................. iv
1 Sustainability assessment of modes of urbanization ........................................................ 1 1.1 Introduction ................................................................................................................ 1 1.2 Three modes of urbanization .................................................................................... 1 1.3 Compact urbanization/containment........................................................................... 4
1.3.1 Economic sustainability .................................................................................... 4 1.3.2 Ecological sustainability ................................................................................... 5 1.3.3 Social sustainability .......................................................................................... 5
1.4 Polycentric/clustered urbanization ............................................................................ 6 1.4.1 Economic sustainability .................................................................................... 7 1.4.2 Ecological sustainability ................................................................................... 8 1.4.3 Social sustainability .......................................................................................... 9
1.5 Diffuse urbanization .................................................................................................. 9 1.5.1 Economic sustainability .................................................................................. 11 1.5.2 Ecological sustainability ................................................................................. 12 1.5.3 Social sustainability ........................................................................................ 13
1.6 Matrix of urbanization modes versus sustainability indicators ................................ 14 1.7 Application of assessment framework .................................................................... 24
1.7.1 Object of application ...................................................................................... 24
2 Modelling urbanization in LUISETTA .............................................................................. 26 2.1 Introduction .............................................................................................................. 26 2.2 Methods ................................................................................................................... 27
2.2.1 Data used and required for modelling purposes ............................................ 27 2.2.2 Model setup and operation ............................................................................ 27 2.2.3 Scenarios ....................................................................................................... 30
2.3 Results .................................................................................................................... 32
3 SUPER scenarios ............................................................................................................ 35 3.1 Introduction .............................................................................................................. 35 3.2 Compact scenario ................................................................................................... 36
3.2.1 Rationale ........................................................................................................ 36 3.2.2 Policy package ............................................................................................... 37 3.2.3 Impacts ........................................................................................................... 38
3.3 Polycentric scenario ................................................................................................ 41 3.3.1 Rationale ........................................................................................................ 41 3.3.2 Policy package ............................................................................................... 42 3.3.3 Impacts ........................................................................................................... 43
3.4 Diffuse scenario ...................................................................................................... 46 3.4.1 Rationale ........................................................................................................ 46 3.4.2 Policy packages ............................................................................................. 47 3.4.3 Impacts ........................................................................................................... 47
3.5 Reflection on sustainability ...................................................................................... 51
4 References ...................................................................................................................... 53

ESPON / SUPER / Final report ii
List of Maps Map 3.1: Compact Urbanization - Change in urban area relative to starting year (2020-2050)
................................................................................................................................................. 40
Map 3.2: Compact Urbanization - Density in population per ha of urban fabric (2050) .......... 40
Map 3.3: Polycentric Urbanization - Change in urban area relative to that in starting year
(2020-2050) ............................................................................................................................. 44
Map 3.4: Polycentric Urbanization - Density in population per ha of urban fabric (2050) ....... 44
Map 3.5: Diffuse Urbanization - Change in urban are relative to that in starting year (2012-
2050) ........................................................................................................................................ 50
Map 3.6: Diffuse Urbanization - Density in population per ha of urban fabric (2050) ............. 50
List of Figures Figure 1.1: compact, polycentric and diffuse urban form illustrated .......................................... 2
Figure 2.1: A modified example script illustrating the code for calculating land use changes 28
Figure 2.2: The GeoDMS operating environment showing output for Malta ........................... 29
Figure 2.3: Simplified suitability map for urban land use (2012-2020 transition) .................... 31
Figure 2.4: Hamburg’s preferential sites of future urbanization in 2500 (left: compact) and
1000 (right: polycentric) scenario. In diffuse, only proximity to existing urbanization and roads
is considered (see image above showing urban suitability). ................................................... 31
Figure 2.5: Urbanization around Luxembourg City in 2050 in the compact (left), polycentric
(middle) and diffuse (right) scenarios ...................................................................................... 33
Figure 2.6: Change in urban land and average national density per country in the three
scenarios ................................................................................................................................. 34
Figure 3.1: Sample of compact scenario 2050 output for five selected regions ..................... 38
Figure 3.2: Sample of polycentric scenario 2050 output for five selected regions .................. 43
Figure 3.3: Sample of diffuse scenario 2050 output for five selected regions ........................ 48
List of Tables Table 1.1 modes of urbanization and aspects of sustainability (summary) .............................. 3

ESPON / SUPER / Final report iii
Table 1.2 modes of urbanization and aspects of sustainability (full table) .............................. 14
Table 2.1: model parameters and weights used for LUISETTA application in SUPER, with the
altered parameter highlighted. ................................................................................................. 28
Table 3.1: Key elements of the scenario storylines ................................................................. 35
Table 3.2: Key indicators for the three scenario storylines ..................................................... 36

ESPON / SUPER / Final report iv
Abbreviations AESOP Association of European Schools of Planning ARTS ESPON Assessment of Regional and Territorial Sensitivity BBSR Bundesinstitut für Bau-, Stadt- und Raumforschung (Federal Institute for
Research on Building, Urban Affairs and Spatial Development) CEMAT Council of Europe Conference of Ministers Responsible for Spatial/Regional
Planning CLC Corine Land Cover COMPASS ESPON Comparative Analysis of Territorial Governance and Spatial Planning
Systems in Europe EC European Commission ECP ESPON Contact Point ECTP European Council of Town Planners EEA European Environmental Agency ERDF ESPON
European Regional Development Fund European Territorial Observatory Network
ESPON EGTC ESPON European Grouping of Territorial Cooperation EU-LUPA ESPON European Land Use Patterns EU European Union GVA Gross Value Added ISOCARP International Society of City and Regional Planners ITI Integrated Territorial Investments JRC EU Joint Research Centre LCC (Corine) Land Cover Change LUE Land Use Efficiency MCA Multi-Criteria Assessment NUTS Nomenclature of Territorial Units for Statistics PBL Netherlands Environmental Assessment Agency POLITO PCG SCBA
Politecnico di Torino Project Coordination Group Societal Cost Benefit Analysis
SDG Sustainable Development Goal SPIMA ESPON Spatial Dynamics and Strategic Planning in Metropolitan Areas SUPER ESPON Sustainable Urbanization and Land Use Practices in European
Regions TANGO ESPON Territorial Approaches for New Governance TIA Territorial Impact Assessment

ESPON / SUPER / Final report 1
1 Sustainability assessment of modes of urbanization 1.1 Introduction The phenomenon commonly referred to as ‘urban sprawl’ has existed for a long time. Already during
the seventeenth and eighteenth centuries, elites of affluent cities like London and Amsterdam bought
land at a comfortable distance from the city to build summer (and sometimes permanent) residences.
The construction of railways in the nineteenth century accelerated this process, resulting in the first
commuter suburbs (Couch et al. 2007: 11; Hall 2014). However, it would take at least another century
before this became the dominant form of urbanization. Car ownership in combination with growing
prosperity in the post-war period allowed the suburban ideal to be enjoyed by an increasingly greater
number of people in the western world (Bruegmann 2005). Later, alerted by the massive report The
Costs of Sprawl in the US (RERC 1974) and similar findings in Europe, politicians began to worry
about the side effects of uncontrolled urbanization, and looked to spatial planning to manage urban
growth.
Today, the policy discourse centres on the concept of sustainability. Especially in Europe, there is a
palpable concern that current planning decisions and practices are negatively impacting future
generations and undermining long-term economic prosperity, social cohesion and ecological vitality
(Hennig et al. 2015; Jehling et al. 2018). Despite the plethora of studies on the impacts of various
kinds of urban development over the past decades, few scholars have attempted to systematically
compare the sustainability of different urbanization modes. One exception is Jabareen (2006) who
proposed a methodology to measure the sustainability of four contemporary urban planning concepts
(i.e. neo-traditionalist, compact city, urban containment and ecocity). In this document, we build on his
approach by widening and simplifying the concepts considered (for analytical clarity) and, rather than
only considering environmental sustainability, applying the multidimensional definition of sustainability
outlined in the Inception Report (ESPON 2019).1
1.2 Three modes of urbanization Sometimes a false dichotomy is invoked between interventionist urban-containment policies that
severely restrict urban growth, preferably with ‘zero land take’, and an implicit choice for ‘urban sprawl’
by taking a laissez-faire approach to urban development. The reality is far more complex. In addition
to the culturally embedded suburban ideal of owning a house with a garden and two-car garage
(Jackson, 1985; Fishman 1987), modern spatial planning was confronted with changing demographics
within the cities themselves such as a growing use of residential space by their inhabitants. A century
ago, an average of 4.5 people lived in every house in Amsterdam, but by the end of the 20th Century
this was less than 2 (Wintershoven 2000: 128-129). This made it difficult if not impossible to
accommodate growing housing demand within the existing urban fabric. Because of these tendencies,
new strategies were invented to direct urbanization to balance individual desires for space (including
1 The categories of Jabareen proved insufficiently distinctive as regards urban morphology to be useful for our purposes. For example, the ecocity mainly non-spatial elements such as green roofs and solar panels and could conceivably fit all urbanization modes. Similarly, we found the overlap between compact city and urban containment to be too great to be useful as distinct categories; in this project we use these terms interchangeably.
ESPON / SUPER / Final report 2
businesses) and the public interest (preservation of valuable cropland, natural habitats, support for
public services and infrastructure). This resulted in the production of a variety of urbanization models
and planning neologisms such as self-sufficient growth centres or garden cities, satellite towns and
green belts, or finger-shaped urban extensions. These strategies were later adapted as their side-
effects became apparent. For example, new towns created in the 1970s and 1980s increased traffic
congestion in the UK and Netherlands, prompting a move towards transit-oriented development in
more recent years (Cervero 1998).
To escape the binary world of ‘zero land take’ versus ‘urban sprawl’, avoiding the normative meanings
of these two terms, and doing justice to the real world of spatial planning, we discern three
archetypical modes of urbanization: compact urbanization (i.e. high-density compact cities with land-
take close to zero, often the result of urban containment strategies or geographical limitations),
polycentric urbanization (i.e. clustered, medium-density urbanization usually resulting from spatial
development policies like new towns, smart growth, TOD, some new urbanist designs, etc.) and
diffuse urbanization (i.e. low-density scattered urban development like monofunctional car-oriented
suburbs, ribbon development and exurban, often informal, construction). Other urbanization modes
certainly exist, but we concentrate on these three for the sake of analytic clarity. For the same reason,
even though we acknowledge that these modes are not mutually exclusive and can be combined in
practice, we evaluate them separately.
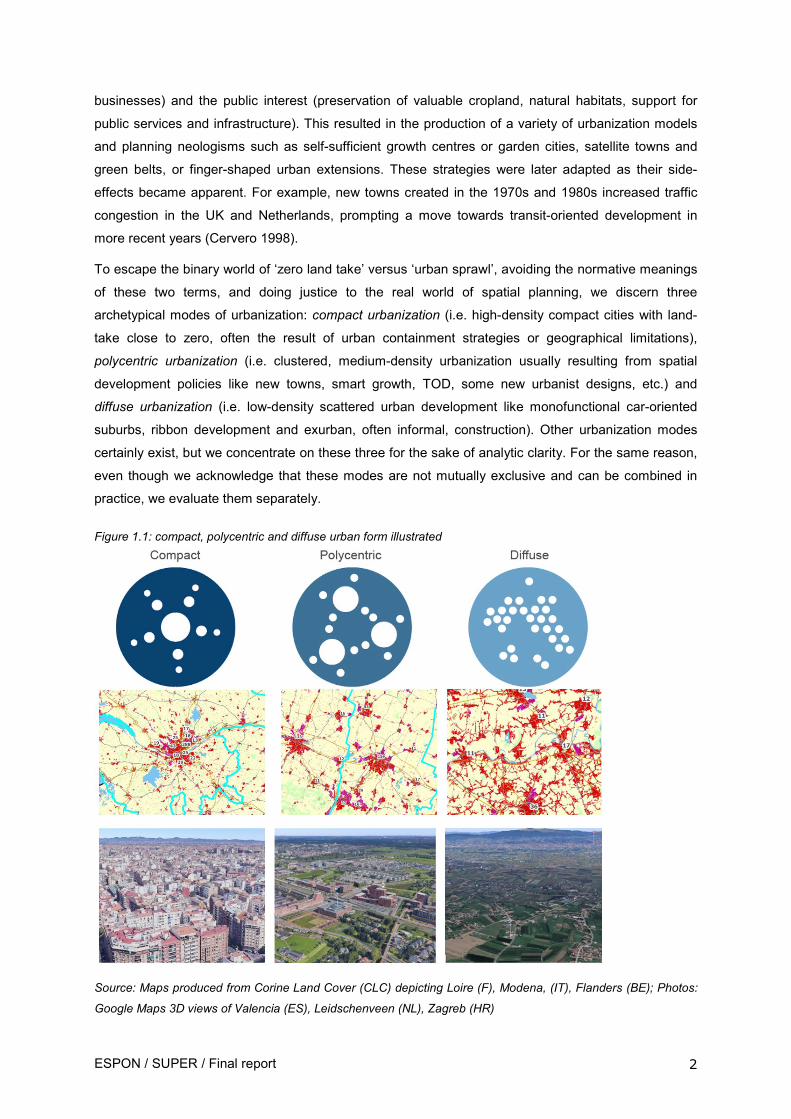
Figure 1.1: compact, polycentric and diffuse urban form illustrated
Source: Maps produced from Corine Land Cover (CLC) depicting Loire (F), Modena, (IT), Flanders (BE); Photos:
Google Maps 3D views of Valencia (ES), Leidschenveen (NL), Zagreb (HR)

ESPON / SUPER / Final report 3
The three modes of urbanization have variegated impacts on sustainability. Based upon an extensive
literature review of North American2 and European sources, we have estimated the various effects on
sustainability (the economic, ecological and social dimensions of sustainability). The findings of the
literature review are presented in full in the Table Modes of urbanization and aspects of sustainability,
including references to the source material. The table also provides an expert-judgement estimation of
the net impact for each sustainability indicator based on the reviewed literature (on a Likert scale
indicated by - - to + +). For the sake of readability, Table 1.1 presents the findings of this literature
review in a synthetic way, omitting the references and averaging out the weights for each indicator (+/-
usually means conflicting findings between studies). This is later explained in the following sections.
Table 1.1 modes of urbanization and aspects of sustainability (summary) Compact Polycentric Diffuse
Economic sustainability GDP, wealth +/- ++ + Public finance + + + - Jobs + + ++ +/- Accessibility +/- ++ +/- Business areas ++ ++ +/- Housing demand - + + Transportation costs +/- + - - Energy consumption + + - - Ecological sustainability Reducing mobility (by car) + + + + - - Reducing pollution, including CO2 + + + - - Green urban areas - + -/+ Biodiversity +/- +/- -- Land consumption + + - - Natural hazards - + +/- Climate change +/- + +/- Consumption of resources +/- + - Renewable energy +/- +/- +/- Space for future water retention + + + Circular economy + + - Social sustainability Health +/- +/- +/- Affordable housing +/- +/- + + Equity/inclusion +/- + - - Public and recreational space +/- + +/- Variety (high-rise, suburban, etc.) + + + Mixed-use areas + ++ - Satisfaction with home environment +/- + +
2 Although urban form differs between the continents, the richness of impact literature on urban containment and transit-oriented development in North America proved quite helpful in assessing the different aspects of sustainability. Moreover, many of the findings are generic enough to hold in both contexts (e.g. more transit opportunities affecting obesity or containment home prices).

ESPON / SUPER / Final report 4
1.3 Compact urbanization/containment Urban containment is a strategy to achieve a compact urban form. It restricts urban growth to no or
virtually no new unbuilt land being converted to urban use. The concept was developed in the 1970s
due to rising social and environmental problems related to scattered, uncontrolled and low-density
urbanization (Nelson et al. 2007). Urban containment policies are designed to limit urban expansion
outside delineated boundaries and encourage infill development and brownfield redevelopment inside
the urban area (Nelson et al. 2004). Moreover, urban containment policies attempt to “confront the
reasonable development needs of the community, region or state and accommodate them in a
manner that preserves public goods, minimises fiscal burdens, minimises adverse interactions
between land uses while maximising positive ones, improves the equitable distribution of the benefits
of growth, and enhances quality of life” (Nelson et al. 2004: 1). The first and most important strategic
way to achieve a compact urban form is the suppression of urban expansion by means of a growth
boundary in order to create a compact city structure. Development within the delineated boundary is at
moderate to high density. Sometimes the containment of a strong urban boundary is combined with a
strategy to allow the expansion of several neighbouring villages (satellites) within their own
boundaries. This strategy seeks to retain traditional rural land cover types as agricultural land, forest
and grassland as a ‘green belt’ around the city (Millward 2006).
One of the most comprehensive empirical sources available on the effects of this mode is The Social
Impacts of Urban Containment by Nelson et al. (2007), which relates to the experience in the United
States. This source has been supplemented with others which focus on Europe or adopt an
international comparative approach.
1.3.1 Economic sustainability In an empirical survey of US metropolitan areas3, Nelson et al. (2007) found a 30% higher net value
(not amount) of urban construction under containment regimes, implying positive economic
sustainability (p. 107). Other studies argue that this positive relationship is due to agglomeration
economies that induce growth of GDP and wealth creation. Companies cluster to decrease transport
costs and facilitate communication; proximity also helps create partnerships between companies
(Anas et al. 1998; Nelson et al. 2007). Furthermore, clustering produces job opportunities and the
development of business areas (OECD 2012). Inner-city brownfield redevelopment has helped to
revitalize urban economies in areas like Berlin and Hamburg (Hall 2014). In the US, cities which had
adopted containment strategies prior to 1985 demonstrated more construction activity by 1995 than
those that had not (Nelson 2007: 117). In addition to improving accessibility through proximity, a
compact city structure improves also the density needed for high-quality transport connections (but
with a higher risk of traffic congestion because of density). It also contributes to energy efficiency
(Norman et al. 2006; OECD 2012). However, Ouestlati et al. (2015) point out that urban containment
policies may cause possible restrictions of economic growth: as house prices increase and land for
3 The US and European concepts of urbanization and sustainable land use are different due to cultural-hitorical dissimilarities. These differences should be considered.

ESPON / SUPER / Final report 5
development becomes scarce, individuals and businesses may decide to relocate to areas where
more space is available.
1.3.2 Ecological sustainability Because urban containment reduces the amount of land converted to urban use, it scores, by
definition, well on this aspect of ecological sustainability (OECD 2012). Nelson et al. (2007) show that
these policies were effective in curbing ‘exurban’ development, defined as urbanization which is too
diffuse to be viably served by water or sewer infrastructure (p. 49). Recent studies in Australia
(Sushinsky et al. 2013) and Japan (Soga et al. 2014) emphasize the positive net effect of preserving
large open areas outside the compact-city boundaries on biodiversity, alongside a proven reduction in
the number of species inside the city. Development in compact cities often comes at the expense of
the remaining urban green areas, for example in Helsinki (Hautamäki 2019). In Amsterdam, three
million square metres of green space was lost over the last decade to urban development (Giezen et
al. 2018). Moreover, this mode scores worse on indicators like air pollution than diffuse urbanization
modes (Glaeser and Kahn 2010). On the other hand, shorter travel distances and a higher reliance on
public transport (OECD 2012; Marshall and Garrick 2012) generally reduce transport-related pollution
levels (Glaeser and Kahn 2010). Due to smaller energy consumption per capita and smaller air
pollution rates, compact cities are often related to sustainable urban concepts such as eco city, smart
city and low-carbon city (De Jong et al. 2015). According to Bibri and Krogstie (2017), sustainable
cities maximize efficiency of energy and material resources, create a zero–waste system, support
renewable energy production and consumption, promote carbon–neutrality and reduce pollution,
decrease transport needs and encourage walking and cycling, provide efficient and sustainable
transport, preserve ecosystems, emphasize design scalability and spatial proximity, and promote
liveability and sustainable community. Low carbon city concept especially emphasizes sustainable
energy consumption, effective carbon neutrality and reliance on renewable energy (De Jong et al.
2015). However, Van Der Waals (2000) is sceptical about the environmental benefits of compact
urbanization, emphasizing that effects should be considered from a long-term perspective and that
these strongly depend on social and economic trends and policies. Finally, Burby et al. (2001) warn
that compact city policies could increase the vulnerability of people and property to natural hazards
due to the high population densities. Furthermore, due to lower land consumption rates, there is more
flexibility with respect to land-use pattern and future ecological planning (Van Der Waals 2000;
Westerink et al. 2012). But since compact cities do not have enough space for the future production of
renewable energy (Broekman, POSAD and ECN 2017), land use outside borders of compact cities
must compensate for this. Regarding climate change mitigation, the compact city is considered by
many as the most appropriate urban form due to reduced releases of greenhouse gases. However,
due to reduced green areas, Zhou et al. (2017) warn that urban heat island effect is the strongest in
big and compact cities. Generally, climate change adaptation strategies highly depend on the
geographical location and the local climate (Pizarro 2009).
1.3.3 Social sustainability Regarding social sustainability, urban densification has been shown to increase housing prices, which
has a negative impact on affordable housing (Millward 2006). On the other hand, Burton (2003) and

ESPON / SUPER / Final report 6
Nelson et al. (2007) suggest that the compact city has the potential to promote social equity by
reducing car dependency and distances, which are important indicators of income, and lowering levels
of social segregation. Social sustainability can be enhanced by better accessibility of local services,
jobs and recreational spaces. However, as we already emphasized, green urban areas (which often
serve as recreational areas) are often diminished when densification occurs (Giezen et al. 2018).
Moreover, the impact of urban containment on public health is not straightforward. Some studies
emphasize the negative effect of the exposure to traffic noise (Moudon 2009), but other reports stress
that inhabitants of compact cities are healthier because they walk and cycle more thanks to shorter
travel distances (OECD 2012). Studies of life satisfaction in compact cities show different results:
some emphasize the positive effects of transport accessibility and mixed land-use (Mouratidis 2018),
while others point out the quality of housing, lower access to environmental amenities, noise and lack
of community involvement as negative aspects of living in a high-density neighbourhood (Howley et al.
2009). Furthermore, urban containment policies have a positive impact on social sustainability
regarding the re-use of urban areas and mixed-use areas. In Portland, Oregon (US), the urban growth
boundary has changed very little in total land area and development in the next 20 years is intended to
be accommodated within mixed use, urban infill, redevelopment, and brownfield development sites. A
study of the housing market in that city in the 1990-2000 period found that urban containment could
not be blamed for gentrification (Nelson et al. 2007), partly because this policy – like elsewhere – was
implemented in conjunction with affordable housing policies. In Amsterdam, mixed-use development
has been associated with the compact city concept since the 1980s (Hopperbrouwer and Louw 2005).
Westerink et al. (2012) analysed compact city strategies in four sample regions in Europe: brownfield
redevelopment and inner city renewal was emphasized as important strategies for Leipzig-Halle, while
multifunctional land-use and variety in housing were shown to be relevant for The Hague Region.
1.4 Polycentric/clustered urbanization Smart growth is a concept that emerged in the US during the 1990s in order to deal with the problems
arising from urban sprawl, traffic congestion, school overcrowding and air pollution (Stewart et al.
2006). It seeks to integrate economic, environmental, and social aspects of planning and
development. Important principles of the concept are land preservation (Daniels and Lapping 2005),
transportation accessibility and mixed land-use patterns that provide different urban amenities within
walking distance (Handy 2005). One of the most important strategies of concentrated urbanization is
Transit-oriented development (TOD).
TOD represents a strategy of concentrated urban growth that considers mixed-use development near,
and/or oriented to, public transport systems. Nowadays, it has become the dominant strategy for
concentrated urbanization. It corrects some negative effects of the 1970s new-town strategy, notably
the growth of private car use. TOD neighbourhoods are typically located within a radius of 400 to 800
metres from a public transit destination (e.g. train station, metro station, tram stop, BRT stop (Bus
Rapid Transit), bus stop, or even ferry stop), which is considered to be an acceptable walking
distance. According to this mode, these nodes are surrounded by relatively high-density development
with progressively lower-density development spreading outward. Common TOD features include

ESPON / SUPER / Final report 7
urban compactness, pedestrian and cycle-friendly environments, public and civic spaces near
stations, and stations as community hubs (Nordregio et al. 2016).
The early concepts of TOD have been developed in the United States and Europe in the late
Nineteenth and early Twentieth Centuries, when urban developments started to concentrate along the
streetcar and metro lines. After the Second World War, planners in Europe promoted suburban
development in satellite suburbs along transit corridors (e.g. Copenhagen, Stockholm) (Hall 2014;
Knowles 2012; Cervero 1998). Most recently, TODs have been related to the Smart Growth and New
Urbanism approaches. In the United States, TOD has become the dominant growth management
concept. Also, in European metropolitan areas, urban development along rail corridors is seen as a
target for achieving more cohesive territories and sustainable urban development (Papa and Bertolini
2015).
The final report of the JPI-financed CASUAL project (Co-creating Attractive and Sustainable Urban
Areas and Lifestyles) (Nordregio et al. 2016) discerns three types of TODs: single node, multi-node,
and corridor TOD. Single node TOD consists of a single circular neighbourhood based around heavy
rail stations in an urban or suburban area. Multi-node TOD follows a typical ‘beads-in-a-string’ pattern
by creating a regional network of nodes around heavy rail stations in order to realign entire urban
regions around rail transport. Corridor TOD is based around light rail or Bus Rapid Transit (BRT) stops
(which are more frequent than heavy-rail stops) and it follows a linear or ribbon-like development
pattern along the transit line(s) (Nordregio et al. 2016).
1.4.1 Economic sustainability Many studies underline a positive impact of TODs on economic sustainability. Like the urban
containment strategy, it creates enough density to profit from agglomeration economies. Nilsson and
Delmelle (2018) noted an increase in median incomes in neighbourhoods close to a new transit due to
better accessibility of jobs and services. It is important to note that TODs do not represent only well-
connected new residential areas – a lot of services and jobs are located within TODs as well. This
mode promotes the location of jobs near transit stations and developing job opportunities around
nodes (Van Lierop et al. 2017). In the Netherlands, planners attempt to ensure that major cities benefit
economically from each other by reducing travel times between hubs (Balz and Schrijnen 2009).
Successful implementation of TOD strategies can be seen in the city of Ørestad, Denmark (Hall 2014;
Knowles, 2012) and Denver (US) (Ratner and Goetz, 2013). Since the mid Twentieth Century,
Ørestad has been developed as Copenhagen’s linear new town around stations on an elevated,
driverless mini-metro line. Today it represents an important economic centre with highly developed
business, housing, retail, education and leisure functions. Accordingly, Ørestad is contributing to the
growth of Copenhagen’s urban region, but also relieving pressure from its Central Business Districts
(CBD) (Knowles 2012). In this way, TODs enhance the polycentric development of urban regions
(Papa and Bertolini 2015). In Denver, transit-oriented strategic planning has prompted a development
of mixed-use areas around rail transit stations and increased urban density. Thus, it represents a
successful strategy of reducing low-density scattered urban growth (Ratner and Goetz, 2013). Good
accessibility to public transportation network decreases car mobility, which has a positive impact on
ESPON / SUPER / Final report 8
transportation costs, especially regarding gasoline and private car-ownership (Ratner and Goetz
2013). Accordingly, Guthrie and Fan (2016) argue that transit access can dramatically reduce
household transportation expenditures. Ratner and Goetz (2013) further argue that better solutions in
transport and distribution of functions contribute to lower levels of energy consumption in general.
Furthermore, the value added from rail investments can be used to finance transit infrastructure as
well as other public spaces (Cervero and Murakami 2009). Regarding the housing market, TODs are
linked to new construction and urban development (Knowles 2012), so they are not restricting
economic growth as urban containment strategies might. Moreover, amenity-based elements and
accessibility benefits of TOD play an important positive role in urban land markets (Bartholomew &
Ewing, 2011).
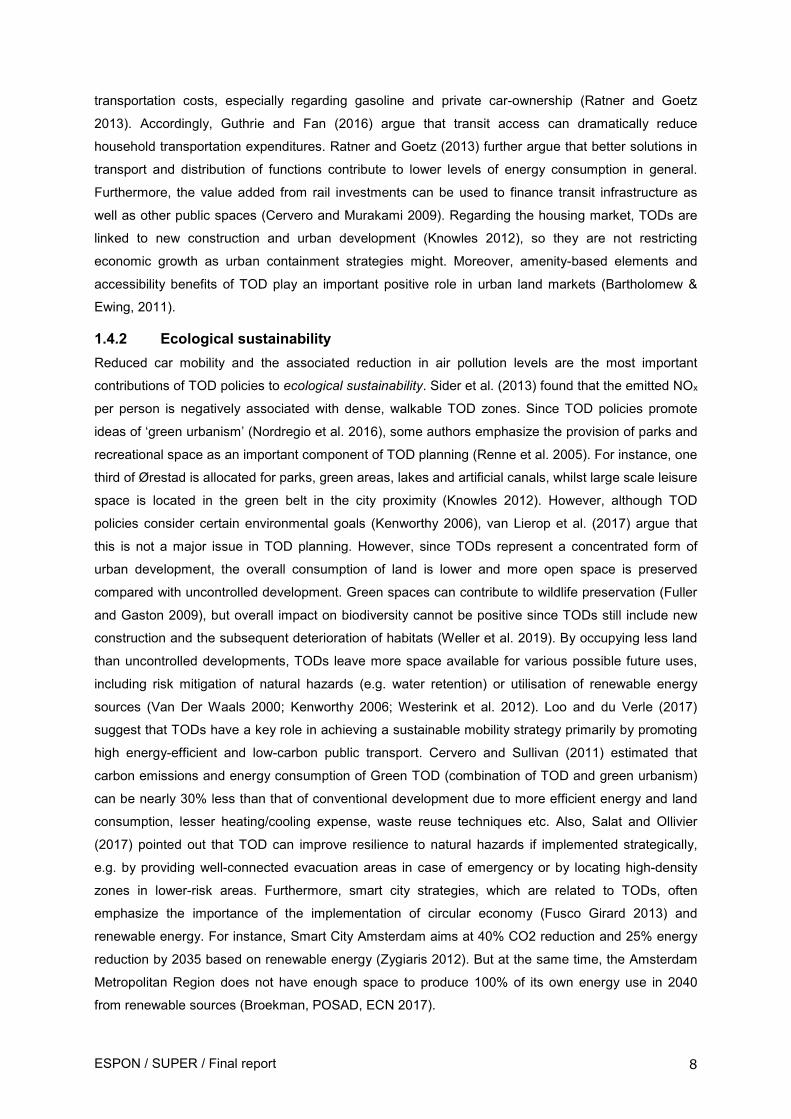
1.4.2 Ecological sustainability Reduced car mobility and the associated reduction in air pollution levels are the most important
contributions of TOD policies to ecological sustainability. Sider et al. (2013) found that the emitted NOx
per person is negatively associated with dense, walkable TOD zones. Since TOD policies promote
ideas of ‘green urbanism’ (Nordregio et al. 2016), some authors emphasize the provision of parks and
recreational space as an important component of TOD planning (Renne et al. 2005). For instance, one
third of Ørestad is allocated for parks, green areas, lakes and artificial canals, whilst large scale leisure
space is located in the green belt in the city proximity (Knowles 2012). However, although TOD
policies consider certain environmental goals (Kenworthy 2006), van Lierop et al. (2017) argue that
this is not a major issue in TOD planning. However, since TODs represent a concentrated form of
urban development, the overall consumption of land is lower and more open space is preserved
compared with uncontrolled development. Green spaces can contribute to wildlife preservation (Fuller
and Gaston 2009), but overall impact on biodiversity cannot be positive since TODs still include new
construction and the subsequent deterioration of habitats (Weller et al. 2019). By occupying less land
than uncontrolled developments, TODs leave more space available for various possible future uses,
including risk mitigation of natural hazards (e.g. water retention) or utilisation of renewable energy
sources (Van Der Waals 2000; Kenworthy 2006; Westerink et al. 2012). Loo and du Verle (2017)
suggest that TODs have a key role in achieving a sustainable mobility strategy primarily by promoting
high energy-efficient and low-carbon public transport. Cervero and Sullivan (2011) estimated that
carbon emissions and energy consumption of Green TOD (combination of TOD and green urbanism)
can be nearly 30% less than that of conventional development due to more efficient energy and land
consumption, lesser heating/cooling expense, waste reuse techniques etc. Also, Salat and Ollivier
(2017) pointed out that TOD can improve resilience to natural hazards if implemented strategically,
e.g. by providing well-connected evacuation areas in case of emergency or by locating high-density
zones in lower-risk areas. Furthermore, smart city strategies, which are related to TODs, often
emphasize the importance of the implementation of circular economy (Fusco Girard 2013) and
renewable energy. For instance, Smart City Amsterdam aims at 40% CO2 reduction and 25% energy
reduction by 2035 based on renewable energy (Zygiaris 2012). But at the same time, the Amsterdam
Metropolitan Region does not have enough space to produce 100% of its own energy use in 2040
from renewable sources (Broekman, POSAD, ECN 2017).

ESPON / SUPER / Final report 9
1.4.3 Social sustainability Regarding social sustainability, studies mostly note positive or neutral effects of TODs. Gunthrie and
Han (2016) emphasize that affordable housing is an important part of most TOD policies, while van
Lierop et al. (2017) find that lower-income passengers often represent the majority of transit users.
Delmelle and Nilsson (2019) warn that housing prices may increase due to enhanced transport
accessibility; however, their research shows that in the US lower-income residents did not move out of
new transit neighbourhoods at a disproportionate rate (Delmelle and Nilsson 2019). The majority of
transit neighbourhoods do not undergo dramatic changes in their socioeconomic composition in the
decade following the placement of the station (Nilsson and Delmelle 2018). Therefore, there is no
evidence that TODs promote social segregation and inequity, but neither do they discourage it. In
Paris, members of the urban elite live in the city centre (Financieel Dagblad 15-08-2019: 20-21), while
many of the poor live in the railway-connected banlieus. But TOD-like forms of concentrated
urbanization often result in the development of mixed-use areas (Pojani and Stead 2015; van Lierop et
al. 2017; Nordregio et al. 2016). These mixed-use areas can be seen in both Ørestad (Knowles 2012)
and Denver (Ratner and Goetz 2013). Pojani and Stead (2015) also state that mixed housing supply in
TODs should include both low-cost social housing and higher-end high-rise apartment buildings, which
enhances urban variety. The quality of life in TODs is increased by the provision of green public and
recreational spaces (Knowles 2012; Pojani and Stead 2015; van Lierop et al. 2017) and by the
walkable neighbourhood design (Morency et al. 2011; Guthrie and Fan 2016). On the other hand,
Pojani and Stead (2015) noted the problem of noise pollution in the TODs in the Netherlands due to
the proximity of the railway tracks. These problems were overcome by the construction of defensive
walls or by moving the transport infrastructure underground. However, in his comprehensive study of
sustainable urbanisation in Europe, Shaker (2015) found that the urban connectively measure was the
strongest predictor for explaining the variability of Human Wellbeing Index, thus signifying the
importance of anthropogenic corridors for improving conditions of human well-being. Furthermore,
Hamidi and Ewing (2020) suggested that compact places appeal to more than half of the young adult
population and that this demand should be met by providing dense, diverse, and well-designed
residential options through regional transportation plans and local planning and zoning.
1.5 Diffuse urbanization Diffuse urbanization is very similar to what is commonly referred to as urban sprawl. In our discussion
of this mode, we will refer to sources from the vast literature on urban sprawl, acknowledging that
definitions vary and that the term has a normative bias. As Bruegmann (2005) points out: “Whenever
the word “sprawl” is mentioned today, it triggers in the mind of most listeners an entire litany of alleged
woes, ranging from objective ones, such as the loss of cropland, to highly subjective ones like the
supposed ugliness of suburban subdivisions” (p. 137).
As a starting point to understanding diffuse urbanization, Longley et al. (2002) found two distinctive
morphologically oriented definitions of urban sprawl in the literature. In the literature of the 1950s and
1960s, it was often defined as a contiguous expansion of existing development from a central core at
lower densities – the city literally sprawls outwards. Other, more recent, definitions emphasize that this

ESPON / SUPER / Final report 10
development is often discontinuous; the urban growth is ‘scattered’ or ‘leapfrogs’ over vacant land.
The EEA definition uses both aspects in its definition:
...the physical pattern of low-density expansion of large urban areas, under market conditions, mainly into the surrounding agricultural areas. […] Development is patchy, scattered and strung out, with a tendency for discontinuity. (EEA 2016: 20)
Other definitions of urban sprawl that emphasize the physical manifestation include (OECD 2018) “an
urban development pattern characterised by low population density that can be manifested in multiple
ways” (p. 29). Low-density suburbs are often related to high car dependency (Newman and
Kentworthy 1999; OECD 2018), but Bruegmann (2005) concludes that although an increase in
mobility certainly made sprawl possible it did not necessarily cause it. However, car dependence, poor
street connectivity, and a poor spatial combination of land uses are often used as indicators of urban
sprawl (EEA 2016). Urban sprawl is also defined as a movement of human population from densely
populated metropolitan urban towns and cities into low-density, monofunctional and car dependent
communities (Margarita et al. 2017). The monofunctionality of residential suburbs is especially
emphasized in the studies of post-socialist cities in Eastern Europe (Ziobro 2019). According to
Galster et al. (2001), sprawl is in planning literature also defined as a cause of an externality, such as
high dependence on the automobile, isolation of the poor in the inner city, the spatial mismatch
between jobs and housing, or loss of environmental qualities.
According to Dieleman and Wegener (2004) urban sprawl is characterised by spatially segregated
land uses and leapfrog urban development, which is the opposite of multifunctional land use at one
location.
Recalling the dictionary definition of sprawl “to spread out carelessly or awkwardly” (Merriam-
Webster), the EEA also notes in its definition that, “Sprawl is the leading edge of urban growth and
implies little planning control of land subdivision” (EEA 2016: 20). Similarly, the real-estate slang-
based taxonomy A Field Guide to Sprawl calls it, “unregulated growth expressed as careless new use
of land and other resources as well as abandonment of older built areas” (Hayden 2004: 7).
Bruegmann (2005) takes a similar view: “low-density, scattered urban development without systematic
large-scale or regional public land-use planning” (p. 18), while Ouestlati et al. define it as, “a
multidimensional phenomenon, typified by an unplanned and uneven pattern of urban development
that is driven by a multitude of processes and which leads to the inefficient utilisation of land
resources” (Ouestlati et al. 2015: 1595). In the study of the metropolitan regions of Barcelona and
Milan, Pagliarin (2018) argues that urban sprawl is not unplanned, but originates from local planning
practices mainly performed by municipal authorities, while higher-level institutions play a decisive role
in land containment: “Urban sprawl is hence not necessarily an unplanned phenomenon, but rather a
‘differently planned’ local and regional land-use strategy” (Pagliarin 2018).
Stewart et al. (2006) suggests ways in which smart growth principles can mitigate the negative
outcomes of urban sprawl in a way that does not totally reject decentralized patterns of development,
specifically when low-density living tends to be the preferred choice of some consumers. These
principles include mixed land-use planning which provides different urban amenities within walking
distance, provision of green areas, and an improved accessibility by public transport system.

ESPON / SUPER / Final report 11
Therefore, diffuse urbanization does not necessarily represent a distinctly negative urban form, as
urban sprawl is often described.
1.5.1 Economic sustainability As diffuse urbanization is often created by the lack of controls, some studies argue that it reflects
market efficiency: urban land-use is allocated according to demand, which theoretically should result
in the greatest wealth creation and therefore has positive effects on economic sustainability.
Conversely, land-use controls result in a net welfare loss (Cheshire 2018). Longley et al. (2002) point
out that ‘urban sprawl’ proponents generally take an economic perspective, and that there is some
agreement it is reflective of (or even contributes to) economic well-being (Bruegmann 2005).
Economic profitability arises from the simple fact that building and development on greenfield is
usually much cheaper than the regeneration of brownfields (Bruegmann 2005). More specifically,
some studies find that diffuse urbanization is positively associated with increasing wealth (Ouestlati et
al. 2015): job growth is closely interlinked with housing demand. Diffuse urbanization is induced by
advances in economy and transportation technology, which allow the outward dispersal of
manufacturing, retail trade and housing, and increase the spatial demands of the city dwellers. In
Europe, ‘edge city’-like diffuse urbanization development around airports, technopoles and business
parks creates many jobs for high-skilled employees (Bontje & Burdach 2005). But these edge cities
are exceptions. Often, high-skilled jobs are more numerous in the city centres while low-skilled jobs
are located in the periphery (Ewing et al. 2016). Some studies report that job availability in diffused
suburbs is usually low and mostly relies on the establishment of shopping malls, whose operation is
not always successful (EEA 2016).
On the other hand, since the majority of jobs is still located in city centres or CBDs (OECD 2018),
accessibility of services and jobs is low in this urbanization mode due to the long distances. Moreover,
public transport is less developed due to lower population density, so there is a greater reliance on
cars (Antoniucci and Marella 2018; Cao and Hickman 2018). Accordingly, transportation costs are
much higher than in compact cities (Longley et al. 2002; EEA 2016). Higher costs are also associated
with traffic congestion and increasing needs for the extension of urban infrastructure in newly
developed regions (Hortas-Rico and Solé-Ollé 2010; Klug and Hayashi 2012; Cinyabuguma and
McConnell 2013; EEA 2016). At very low densities, other kinds of infrastructure (e.g. water or sewers)
are no longer viable (Nelson et al. 2007: 50) and are too expensive for the local government, which
results in an inefficient urban growth model (Gielen et al. 2019). Higher costs also occur as a result of
higher energy consumption and higher greenhouse gas emissions per person (Kenworthy et al. 1999;
EEA 2016). However, Bruegmann (2005) argues that congestion and commuting times tend to rise,
not fall, with density: evidence show that residents of low-density urban areas can travel around more
easily, and although being responsible for air pollution, car travel is comfortable and convenient.
Furthermore, Bruegmann (2005) criticizes the often stressed statements about the high costs of
automobile transport, saying that public transport receives a lot of governmental subsidies. He also
states that instead of restricting low-density development and attempting to remake cities to fit
traditional transportation modes, we should rather find new modes of transportation and explore more

ESPON / SUPER / Final report 12
efficient ways of energy consumption (Bruegmann 2005). Regarding housing market demands, diffuse
urbanization has a positive effect since it represents a fulfilment of needs for low-cost and low-density
housing (Longley et al. 2002; Bruegmann 2005).
1.5.2 Ecological sustainability The literature is overwhelmingly critical about the ecological sustainability of diffuse urbanization. In
particular, the EEA Report Urban Sprawl in Europe (2016) generally noted negative effects. Higher air
pollution per capita due to enhanced use of cars has been emphasized by several studies (Glaeser
and Kahn 2010). The problems of higher noise and light pollution are also recorded (Bennie et al.
2014). Since diffuse urbanization represents an extensive loss of agricultural land and open space
(Longley et al. 2002), it has a profoundly negative impact on biodiversity. The expansion of built-up
areas causes a loss of habitats and species, it increases landscape fragmentation, degradation of
ecological networks and a loss of existing green infrastructure (Alberti 2005). However, the intensity of
this impact depends on the abundance of green urban spaces and their crucial role in supporting
wildlife (Aronson et al. 2017). In low-income suburbs, green areas are scarce and poorly maintained,
while in the wealthier neighbourhoods they can be more abundant (Wolch et al. 2014). On the other
hand, Bruegmann (2005) points out that concerns about land consumption are often accentuated too
much: urban areas occupy much less space compared to agricultural or natural areas. Actually, one
should be also concerned about the agricultural consumption of land and its environmental issues.
Regarding vulnerability to natural hazards, studies show opposite views. Harmin and Gurran (2008)
argue that the loss of open natural spaces can contribute to increasing natural hazard risks, e.g. by
reducing potential space for future water retention in the case of dangerous floods (Hamin and Gurran
2008). On the contrary Westerink et al. (2012) note that the dispersed city has more space for water
storage and infiltration, making it less vulnerable to flood risk. Therefore, we can assume that
vulnerability highly depends on the type of urban development pattern, i.e. whether it represents a
contiguous or a discontinuous development, as was already defined by Longley et al. (2002).
Furthermore, a higher proportion of single households leads to a more resource-intensive living style
resulting in bigger resource consumption rates compared to compact cities (Dura-Guimera 2003;
Howley 2009; EEA 2016). Finally, US studies show that higher greenhouse emissions affect the
doubling of the annual number of extreme heat events in the most diffuse cities in comparison with the
most compact cities (Stone et al. 2010; EEA 2016). However, Zhou et al. (2017) found the strongest
positive correlation between urban heat island and the city size, followed by compactness, making
small and diffuse cities most preferable in sense of climate mitigation. In that sense, the results
obtained by Stone et al. (2010) in the US may be primary explained by a large surface area of diffused
cities. Diffuse urbanization has the highest rate of land consumption resulting in decreased available
space for potential future uses, e.g. water retention, renewable energy etc. (Haber 2007; Hamin and
Gurran 2009; EEA 2016). However, Bruegmann (2005) argues that citizens of low-density
neighbourhoods would probably be able to generate a great deal of the energy they need on their own
land, using wind, water, solar, and geothermal power sources.

ESPON / SUPER / Final report 13
There are a small number of dissenting voices that argue the ecological sustainability of this mode.
Clark, Burall, and Roberts (1993), for example, argue that sustainable development implies a self-
support economy which requires more land for buildings and outdoor activities and a general reduction
in net residential densities. Pizarro (2009) emphasized that diffuse urban forms, compared to compact
cities, represent much better strategies of climate change adaptation in hot and humid climates due to
enhanced ventilation of the area.
1.5.3 Social sustainability Many people choose to live in low-density suburbs due to low housing prices (Ouestlati et al. 2015;
EEA 2016; Ewing et al. 2016; Antoniucci and Marella 2018). Therefore, some forms of diffuse
urbanization have a positive effect upon social sustainability. Also, suburbs are a desirable place to
live because low-density housing offers more privacy and larger garden areas than densely built-up
compact cities (Longley et al. 2002), and it is easier to achieve private ownership (Lotfi et al. 2019).
Other studies conclude that living close to nature reduces stress (Wells & Evans 2003), while
Robertson (1990) argues that decentralised urbanization, as a return to the countryside, would help to
instil positive rural values.
However, affordable housing can cause negative social effects, especially regarding social equity and
mobility. Many studies have shown that social segregation is much more prominent in the cities
characterised by diffuse urbanization (Brade et al. 2009; Cassiers and Kesteloot 2012; Antoniucci and
Marella 2018). In the US, social mobility in low-income suburbs is particularly aggravated (Ewing et al.
2016). In the city of Detroit, urban sprawl is supposed to cause urban shrinkage and inner city decay,
which represents a centre of concentrated urban poverty with high crime rates (Xie et al. 2018). Talen
et al. (2018) argue that the dominant patterns in the US suburban landscapes, characterised by an
uneven distribution of services and amenities, are likely connected to a desire for separation.
Landscape patterns thus enable social separation and separation engenders inequity (Talen et al.
2018). Therefore, we can conclude that diffuse areas are not homogenous but can include both low-
income and high-income neighbourhoods. Accordingly, quality of life can be variable. For instance,
regarding public and recreational spaces, some studies of diffusely urbanised neighbourhoods
emphasized the high level of satisfaction of the residents (Garcia-Coll and Lopez-Villanueva 2018),
while others noted a reduction in recreational quality of natural and semi-natural areas (White et al.
2013). However, higher pollution rates can negatively affect human health. Noted problems include
respiratory problems (e.g. asthma) as a result of increased air pollution, insomnia and other effects on
health as a result of higher noise pollution (Frumkin et al. 2004), increased obesity, stress and
decreased physical activity (Costal et al. 1988; Ewing et al. 2003; Garden and Jalaludin 2009;
Montgomery 2013).

ESPON / SUPER / Final report 14
1.6 Matrix of urbanization modes versus sustainability indicators
Table 1.2 modes of urbanization and aspects of sustainability (full table)
Compact/containment Polycentric/clustered Diffuse urbanization
(close to) zero land take, compact cities TOD, new towns, smart growth, etc edge cities, sprawl, laissez-faire, etc
Economic sustainability
GDP, wealth
+ + agglomeration economies (Nelson et al. 2007; Anas et al. 1998; Storper and Venables 2004;
Glaeser 2011) ++
estimated positive results of agglomeration economies in the Netherlands 0,5 – 2% of GDP
(De Groot et al. 2010, 55-62) ++
Higher value urban development per capita (30%) than non-containment (Nelson et al.
2007) - -
20% less retail productivity due to UK containment policies (Cheshire et al. 2011)
- compact urban form may lead to
wage declines on neighbourhood level due to less land conversion (Chapple 2018)
+ increase in median incomes in
neighbourhoods close to a new transit (Nilsson and Delmelle 2018; Delmelle and Nilsson
2019) + +
example of Ørestad (Knowles 2012) Denver (Ratner and Goetz 2013)
better regional cooperation and coordination in Randstad (Meijers 2005)
++ estimated positive results of agglomeration
economies in the Netherlands 0,5 – 2% of GDP (De Groot et al. 2010, 55-62)
+ amenity-based elements of TOD play an
important positive role in urban land markets (Bartholomew and Ewing 2011)
+ sprawl can be associated with increasing
wealth (Ouestlati et al. 2015) +
building and development on greenfield is usually much cheaper than the regeneration of
brownfields (Bruegmann 2005) +
housing for wealthy people (big houses with gardens) or new factory sites (EEA 2016)
+/-
encouraging land conversion leads to higher tax revenues but also lower wages (Chapple 2018)
Public finance
+ + High quality infrastructure public services and amenities are usually viable in compact cities such as subways, parks, schools. Sometimes policies require pay-as-you grow (Evers et al.
2000)
+ Adequate public services and infrastructure
+ the value added from rail investments helps to finance transit infrastructure as well as other public spaces such as open spaces, paths and green corridors (Cervero and Murakami 2009)
- Low density areas usually not viable for high
quality infrastructure, services and amenities, costs are paid for by all taxpayers, or passed on to individuals (e.g. septic tanks) (Nelson et al. 2007)
- - a significant and positive effect on the unit cost of local public services, which results in an inefficient

ESPON / SUPER / Final report 15
urban growth model, higher expenditures on security, public transportation and community
wellbeing (Gielen et al. 2019)
Jobs
+ + central business district, associated with agglomeration economies (OECD 2018)
high-skilled jobs (Ewing et al. 2016)
+ jobs located closely to transit stations
(van Lierop et al. 2017) not a centre-periphery relationship - major cities do not compete when it comes to job
opportunities, but rather benefit economically from each other through reducing travel times
between hubs (Balz and Schrijnen 2009 ++
example of Ørestad (Knowles 2012) Denver (Ratner and Goetz 2013)
+/ - establishment of shopping malls – their operation
is not always financially successful new jobs related to lost ecosystem services (EEA 2016); smaller concentration of jobs than in the
CBD -
low skill jobs in the USA (Ewing et al. 2016) +
high-skilled jobs in some Edge cities ‘European style’ (technopoles, airports, business parks)
(Bontje & Burdach 2005)
Accessibility
+ shorter intra-urban travel distances, better
access to a diversity of local services and jobs (OECD 2012)
- Congestion can have a negative result on
economic growth (Anas et al. 1998)
+ + railway accessibility, walkable distance to the station (Papa and Bertolini 2015) (van Lierop
et al. 2017; Knowles 2012) ++
Combination of concentrated urbanization and railway infrastructure, efficient use of public
and sustainable transport Copenhagen, Stockholm (Hall 2014, 215-237; Cervero 1998,
109-154)
- less public transport, greater reliance on cars
(Antoniucci and Marella 2018; Cao and Hickman 2018; Ewing 1997)
+
Congestion and commuting times are lower in low-density cities (e.g. Kansas City, Oklahoma City) compared to high-density cities e.g. New
York or Tokyo (Bruegmann 2005)
Business areas
+ + CBD, (OECD 2018), high-skilled jobs
(Ewing et al. 2016) +
Inner city regeneration leads to economic growth Berlin, Hamburg (Hall 2014, 96-115)
+ + redevelopment of brownfields, inner city
building (Nelson et al. 2007; Couch, Sykes, Börstinghaus 2011; Nordregio et al., 2016; van
Lierop et al. 2017 – Vancouver)
++ example of Ørestad (Knowles 2012)
++
the CBD remains the main transit hub and the centre of activities (Loo and du Verle 2017)
- low skill jobs in the USA (Ewing et al. 2016)
+ High skill jobs in some of the European edge cities
(airports, technopoles, business parks) (Bontje and Burdach 2005)

ESPON / SUPER / Final report 16
Westerink et al. 2012 – e.g. Manchester and Leipzig-Halle
Housing demand / new construction
- possible restrictions of economic growth, as
house prices increase, development land becomes scarce and individuals and businesses decide to relocate to other cities where there is
still room for new development on the periphery (Ouestlati et al. 2015)
- reduced new housing supply (Mayer &
Somerville 2000), and increased market volatility (Huang & Tang 2012; Laughlin 2012)
- Restrictive land-use policy causes high prices for
houses, estimated economic loss in the Netherlands 0,5 % of GDP (Besseling et al. 2008,
13-77) -
so further increasing development risk […] makes all houses less affordable because fewer
get built (Cheshire 2018)
+ it considers new constructions (Knowles 2012;
Ratner and Goetz 2013)
+ TOD-based design is attractive for housing
market due to both amenity-based elements and accessibility benefits provided by transit
(Bartholomew and Ewing 2011)
+ TOD is positively correlated with residential property values around commuter railway
stations in the province of North-Holland, so local governments should encourage TOD as
one of the strategies for new construction (van der Zwet 2019)
+ fulfilment of low-cost and low-density housing
market needs (Longley et al. 2002)
+ housing market in less dense cities is more
resilient and affordable than in denser cities during a recession phase (Antoniucci and Marella
2016)
Transportation costs
+ lower transportation costs per capita (OECD
2012) -
Found an increase in local restrictiveness causes a 6.1% rise in commuting distances. The results underline the interdependence of local housing
and Labour markets (Cheshire et al. 2018)
+ lower transportation costs (reduced gasoline and car-ownership costs) (Ratner and Goetz
2013) +
transit access can dramatically reduce household transportation expenditures
(Guthrie and Fan 2016)
- - higher costs because of commuting
(Longley et al. 2002; Camagni et al. 2002; Bento et al. 2005; Travisi et al. 2010)
A higher demand for transport, increased car use and a higher cost for public transport
infrastructure (EEA 2016 - Ewing 1997; Kenworthy et al. 1999 )
Higher costs associated with traffic congestion and the extension of urban infrastructure in
newly developed regions (Hortas-Rico and Solé-Ollé 2010; Klug and Hayashi 2012; Cinyabuguma
and McConnell 2013)
Energy consumption + + -

ESPON / SUPER / Final report 17
more district-wide energy utilisation and local energy generation, less energy consumption per
capita (OECD 2012)
+ high-density urban core development is less energy and GHG intensive than low-density suburban development on a per capita basis
(Norman et al. 2006)
less energy consumption per capita due to better efficiency, promotion of the renewable
energy usage (Cervero and Sullivan 2011, Ratner and Goetz
2013, Loo and du Verle 2017)
Higher costs as a result of higher energy consumption per person (Kenworthy et al. 1999)
Higher energy consumption and higher greenhouse gas emissions per person –
(Kenworthy et al. 1999; Borrego et al. 2006; Duffy 2009; Waitt and Harada 2012; Jones and Kammen
2014)
Ecological sustainability
Reducing mobility (by car)
+ + reduced dependency on cars
(Nelson et al. 2007; Snellen et al. 2005; OECD 2018, 125)
+ +
residents of the denser communities with more mixed land uses drive fewer kilometers per day than those living in sparser, more homogenous
areas (Marshall and Garrick 2012)
+ + (Papa and Bertolini 2015; Nordregio et al.
2016; van Lierop et al. 2017) +
Concentrated urbanization close to the cities had a positive effect on sustainable
metropolitan development in the Netherlands (Van der Wouden 2015, 70-103; Hall 2014,
143-173)
- - increased mobility by cars
(Antoniucci and Marella 2018; Cao and Hickman 2018; Ingram 1998)
Reducing pollution, incl CO2
+ + reduced transport-related pollution
(Nelson et al. 2007; Glaeser & Kahn 2010)
+ reduced pollution from cars, smaller levels of
NOx per capita (Sider et al. 2013) +
reduction of carbon emission (Cervero and Sullivan 2011; Hasibuan et al. 2014)
- - „Higher air pollution per capita as a result of vehicle exhausts, fertilising substances, dust,
particles, road salt, oil, fuel and other substances which cause air and water pollution, and
eutrophication“ (EEA 2016 - Borrego et al. 2006; Rich and Loncore 2006; Navara and Nelson 2007;
Tu et al. 2007; Bart 2010);
Higher noise pollution (causing insomnia and other effects on health) Slabbekoorn and Peet
2003; Moudon 2009 Higher light pollution, modification of light
conditions and other visual stimuli Bennie et al. 2014

ESPON / SUPER / Final report 18
Green urban areas
- loss of green space due to urban development
and densification (Fuller and Gaston 2009; Giezen et al. 2018)
- loss of green urban areas in Helsinki by building
new economic and residential locations (Hautamäki 2019)
+ provision of parks and recreational space in
California (van Lierop et al. 2017; Rennes et al. 2005), and Ørestad (Knowles 2012)
-/+ lack of green spaces in low-income suburbs, but in
wealthier neighbourhoods they are abundant (Wolch et al. 2014)
Biodiversity
+/- inside the compact cities biodiversity is reduced,
but large green areas out of the city are left intact so overall it has a more positive impact
than the urban sprawl (OECD 2012, Sushinsky et al. 2013; Soga et al. 2014)
-
biodiversity potential is negatively correlated with urban density (Tratalos et al. 2007)
-
ecosystem wellbeing index negatively correlated with population density, patch cohesion index (a measure of physical connectedness) and patch
density (fragmentation index) (Shaker 2015)
+/- (Kenworthy 2006)
planning of TODs is generally considered to take into account certain environmental goals, e.g. green areas which support wildlife, green
neighbourhoods which enhance life quality etc. (but it depends on policies in certain
states (van Lierop et al. 2017) however, overall impact cannot be positive since it includes new
construction and deterioration of habitats -
loss of biodiversity in peri-urban zones (Weller et al. 2019)
- ecosystem wellbeing index negatively
correlated with population density, patch cohesion index (a measure of physical
connectedness) and patch density (fragmentation index) (Shaker 2015)
- - The loss of habitats for native species; sometimes creation of new habitats with special conditions,
the loss of species and the loss of biodiversity (Alberti 2005; Salvatti et al. 2018)
The increased fragmentation of the landscape: barrier effect, habitat fragmentation, disruption of migration pathways, impediment of dispersal, increased road mortality of wildlife, isolation of populations, degradation of ecological networks
and loss of existing green infrastructure (Alberti 2005; EEA 2006; EEA and FOEN 2011)
The reduced resilience of ecosystems (Scalenghe and Marsan 2009; Shochat et al. 2010)
- Loss of biodiversity in peri-urban zones (Weller et
al. 2019)
Land consumption +
preservation of agricultural land and open space (Nelson et al. 2007; OECD 2012)
+ higher preservation of open space compared
to urban sprawl (van Lierop et al. 2017) +
dense, compact and a balanced mixed land-use pattern around transit stops (Loo and du
Verle 2017) +
better coordination between transport and
- - Loss of agricultural land and open space (Longley
et al. 2002; EEA 2016 - Camagni et al. 2002; Pauleit et al. 2005; Eigenbrod et al. 2011; Wilson
and Chakraborty 2013) Removal and alteration of vegetation over large
areas (Pauleit et al. 2005)

ESPON / SUPER / Final report 19
land use (Duffhues and Bertolini 2016)
Natural hazards - risk and vulnerability
- high population density – higher vulnerability
(Burby et al. 2001)
+ TOD can make cities more resilient to natural
hazards if implemented strategically, i.e. planning should include identification of high
and low risk zones, well-connected refuge zones in case of emergency etc. (Salat and
Ollivier 2017)
+ more space for water storage and infiltration in the case of flood – lower risk (Westerink et al.
2012) -
the loss of open natural spaces can contribute to increasing natural hazards risk, e.g. by reducing
potential space for future water retention in case of dangerous floods (Hamin and Gurran 2008)
Climate change adaptation and mitigation
+ smaller impact than urban sprawl due to lower GHG releases (reduced car mobility, enhanced mass-transit system, lower infrastructure and energy costs (Hamin and Gurran 2008; Pizarro
2009) -
Compact cities with large surface area have the strongest impact on urban heat island (Zhou et
al. 2017) However, appropriate urban form strategy
regarding climate adaptation depends on the geographic location (Pizarro 2009)
+ smaller impact than urban sprawl due to lower GHG releases (reduced car mobility, enhanced mass-transit system, lower infrastructure and
energy costs (Pizarro 2009) However, appropriate urban form strategy
regarding climate adaptation depends on the geographic location (Pizarro 2009)
- - a doubling of the annual number of extreme heat
events in the most sprawled cities in comparison with the most
compact cities (Stone et al. 2010). +
Regarding urban heat island mitigation, small, disperse, and stretched
cities are preferable (Zhou et al. 2017) However, appropriate urban form strategy
regarding climate adaptation depends on the geographic location (Pizarro 2009)
Consumption of resources
+ optimum use of land resources (OECD 2012),
often related to sustainable urban concepts that maximize efficiency of energy and material
resources, create a zero–waste system, promote usage of renewable energy and carbon–
neutrality (Bibri and Krogstie 2017) -
Market interventions imply lower efficiencies (Cheshire 2018)
+ TOD is seen as a sustainable mobility strategy which reduces carbon footprint (Loo and du
Verle 2017) +
more efficient energy and land consumption, lesser heating/cooling expense, waste reuse
techniques contingent on high volumes (Green TODs - Cervero and Sullivan 2011)
- A higher proportion of single households, which leads to a more resource-intensive living style
(Dura-Guimera 2003; Howley 2009)
Space for future renewable energy
+ more flexibility with respect to land-use pattern
(Van Der Waals 2000; Westerink et al. 2012)
+ Smart City Amsterdam aims at 40% CO2
reduction and 25% energy reduction by 2035
- decrease in the availability of land
(Haber 2007); less flexibility with respect to land-

ESPON / SUPER / Final report 20
+ Austrian Spatial Development Concept – linking
renewable energy production strategies with agricultural policies, landscape and local
development (OECD 2012) district wide renewable energy utilisation and
smart grids (OECD 2012) -
In 2040, the Metropole region Amsterdam will not have enough land to produce 100% of its
own energy use from renewable sources (Broekman, Posad, ECN 2017)
based on renewable energy (Zygiaris 2012)
more flexibility with respect to land-use pattern (Van Der Waals 2000; Westerink et al.
2012) -
In 2040, the Metropole region Amsterdam will not have enough land to produce 100% of its
own energy use from renewable sources (Broekman, Posad, ECN 2017)
gie +
using renewable energy/fuels produced from the built environment to power transit
vehicles (Green TODs - Cervero and Sullivan 2011)
use pattern (Westerink et al. 2012)
+ citizens of low-density neighbourhoods should be able to generate a great deal of the energy they need on their own land using wind, water, solar,
and geothermal power sources (Bruegmann 2005)
Space for future water retention
+ more flexibility with respect to land-use pattern
(Van Der Waals 2000; Westerink et al. 2012).
+ more flexibility with respect to land-use
pattern (Van Der Waals 2000; Westerink et al. 2012).
+ more space for water storage and infiltration
(Westerink et al. 2012)
Space for future circular economy
+ more flexibility with respect to land-use pattern
(Van Der Waals 2000; Westerink et al. 2012).
+ smart growth is associated with circular economy principles (Fusco Girard 2013), more flexibility with respect to land-use
pattern (Van Der Waals 2000; Westerink et al. 2012)
- less flexibility with respect to land-use pattern
(Westerink et al. 2012)
Social sustainability
Health
+ better human health because of cycling and walking, recreational activities (OECD 2012)
-
Exposure to traffic noise (Moudon 2009)
+/- compactness is not significantly associated
+ walkable neighbourhood design, green areas
(Guthrie and Fan 2016), modal shift from car to transit contributes to
the volume of daily physical activity (e.g. walking to and from transit stations) (Morency
et al. 2011) -
- - Respiratory problems (e.g. asthma) as a result of
more air pollution (Frumkin et al. 2004) Increased obesity, stress and decreased physical
activity (Costal et al. 1988; Ewing et al. 2003; Garden and Jalaludin 2009)
+
Living close to nature reduces stress (Wells and

ESPON / SUPER / Final report 21
with body mass index in young adults for those staying in the same place for the entire period
(Hamidi and Ewing 2020)
noise pollution (Pojani and Stead 2015) Evans 2003)
Affordable housing
- - high housing prices (Millward 2006; Pozdena
2019) +/-
inconclusive because UGB usually linked to affordable housing policies (Nelson et al. 2007)
+ + lower-income passengers often represent the
majority of transit users, i.e. housing prices are low (van Lierop et al. 2017);
-/0 housing prices may increase due to improved
accessibility (Delmelle and Nilsson 2019) +
affordable housing is an important part of the TOD policies (Guthrie and Han 2016)
+ + (Ouestlati et al. 2015; Antoniucci and Marella
2018; EEA 2016; Ewing et al. 2016)
Equity/inclusion
+/- reduced car dependency (which is an important indicator of income) and lower levels of social
segregation, but high housing prices can have a negative effect (Burton 2003; Nelson et al. 2007)
+ high social upward mobility (Ewing et al. 2016)
+/- Polarization of incomes, but less spatial
segregation in Dutch cities (Buitelaar & Raspe 2016)
++ Evidence of racial desegregation in US cities by
improving city centres and ‘opening up suburbs’ (Nelson et al. 2007: 92)
+ in the USA lower-income residents have not
moved out of new transit neighbourhoods at a disproportionate rate (as a consequence of railway introduction) (Delmelle and Nilsson
2019) majority of transit neighbourhoods do not
undergo dramatic changes in their socioeconomic composition in the decade
following the placement of the station (Nilsson and Delmelle 2018)
- - social polarization between centre and suburbs
(Antoniucci and Marella 2018; Inner city decay in the USA (Xie et al. 2018)
Segregation based on income
(Thurston and Yezer 1994; Power 2001; Brade et al. 2009; Cassiers and Kesteloot 2012)
- Low social mobility in USA (Ewing et al. 2016)
-- Social separation and uneven distribution of
resources, services and amenities in the suburban landscape in the USA (Talen et al. 2018)
Public and recreational space
-
decrease of green areas (Giezen et al. 2018)
+ better accessibility to recreational space and
services (OECD 2012)
+ Abundant and well-planned, friendly to
pedestrians and cyclists, provision of public parks, sports centres, libraries and other public
facilities (Knowles 2012; Pojani and Stead 2015; Loo and du Verle 2017; van Lierop et al. 2017), example in Denver (Ratner and Goetz
2013)
+ (high level of satisfaction of the residents –
Barcelona Metropolitan Region – Garcia-Coll and Lopez-Villanueva 2018)
- The reduced recreational quality of natural and
semi-natural areas White et al. 2013
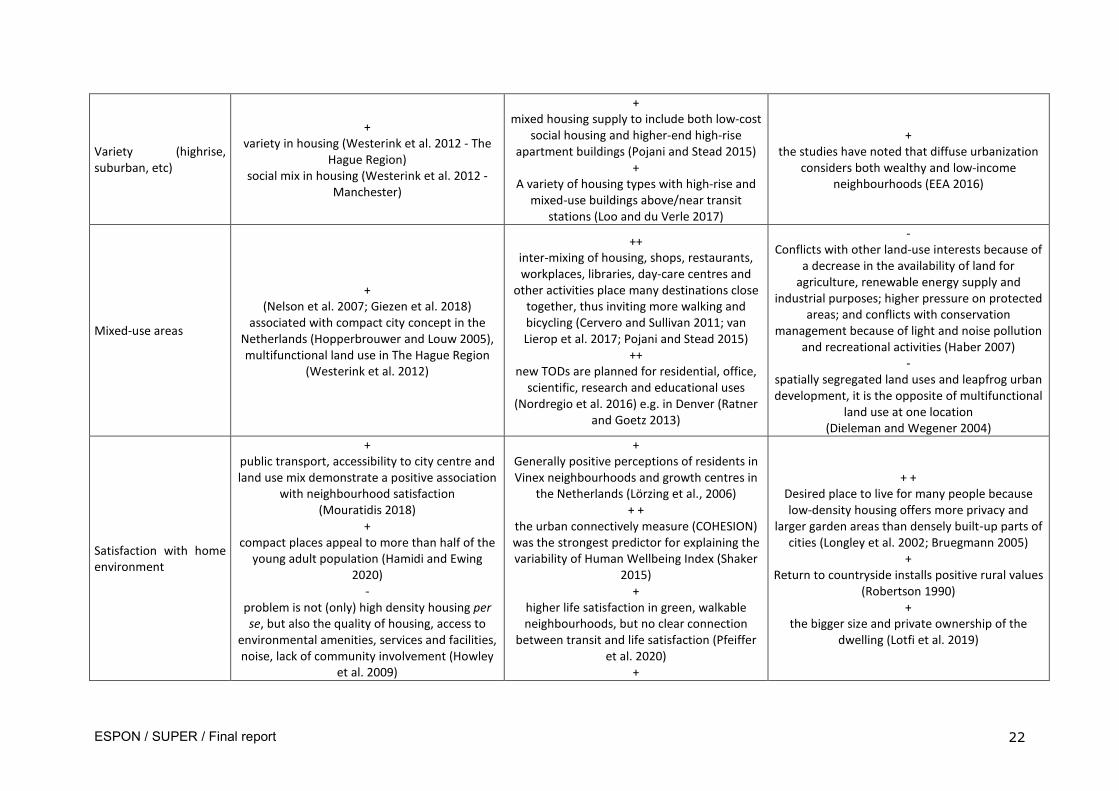
ESPON / SUPER / Final report 22
Variety (highrise, suburban, etc)
+ variety in housing (Westerink et al. 2012 - The
Hague Region) social mix in housing (Westerink et al. 2012 -
Manchester)
+ mixed housing supply to include both low-cost
social housing and higher-end high-rise apartment buildings (Pojani and Stead 2015)
+ A variety of housing types with high-rise and
mixed-use buildings above/near transit stations (Loo and du Verle 2017)
+ the studies have noted that diffuse urbanization
considers both wealthy and low-income neighbourhoods (EEA 2016)
Mixed-use areas
+ (Nelson et al. 2007; Giezen et al. 2018)
associated with compact city concept in the Netherlands (Hopperbrouwer and Louw 2005), multifunctional land use in The Hague Region
(Westerink et al. 2012)
++ inter-mixing of housing, shops, restaurants, workplaces, libraries, day-care centres and
other activities place many destinations close together, thus inviting more walking and bicycling (Cervero and Sullivan 2011; van Lierop et al. 2017; Pojani and Stead 2015)
++ new TODs are planned for residential, office,
scientific, research and educational uses (Nordregio et al. 2016) e.g. in Denver (Ratner
and Goetz 2013)
- Conflicts with other land-use interests because of
a decrease in the availability of land for agriculture, renewable energy supply and
industrial purposes; higher pressure on protected areas; and conflicts with conservation
management because of light and noise pollution and recreational activities (Haber 2007)
- spatially segregated land uses and leapfrog urban development, it is the opposite of multifunctional
land use at one location (Dieleman and Wegener 2004)
Satisfaction with home environment
+ public transport, accessibility to city centre and land use mix demonstrate a positive association
with neighbourhood satisfaction (Mouratidis 2018)
+ compact places appeal to more than half of the
young adult population (Hamidi and Ewing 2020)
- problem is not (only) high density housing per se, but also the quality of housing, access to
environmental amenities, services and facilities, noise, lack of community involvement (Howley
et al. 2009)
+ Generally positive perceptions of residents in Vinex neighbourhoods and growth centres in
the Netherlands (Lörzing et al., 2006) + +
the urban connectively measure (COHESION) was the strongest predictor for explaining the variability of Human Wellbeing Index (Shaker
2015) +
higher life satisfaction in green, walkable neighbourhoods, but no clear connection
between transit and life satisfaction (Pfeiffer et al. 2020)
+
+ + Desired place to live for many people because low-density housing offers more privacy and
larger garden areas than densely built-up parts of cities (Longley et al. 2002; Bruegmann 2005)
+ Return to countryside installs positive rural values
(Robertson 1990) +
the bigger size and private ownership of the dwelling (Lotfi et al. 2019)

ESPON / SUPER / Final report 23
compact places appeal to more than half of the young adult population (Hamidi and Ewing
2020)

ESPON / SUPER – Sustainable Urbanization and land-use Practices in European Regions / Interim Report
24
1.7 Application of assessment framework After identifying distinct modes of urbanization on particular examples of urban development,
the impact of that particular development on the three categories of sustainability can be
assessed according to the remarks written in the Table.
When applying this framework to draw conclusions regarding the sustainability of urban
developments some important caveats need to be borne in mind. First, although we have
attempted to make the normativity transparent by splitting up sustainability into its component
dimensions and by citing scientific sources as to the impacts, there is still an inherent
disciplinary bias as this topic is generally studied by environment and planning scholars.
Second, we wish to ensure that trade-offs are not ignored by aggregating effects across
dimensions (ecological versus economic sustainability) or by balancing differing findings in
the literature (one study showing high negative impacts and another showing high positive
impact does not necessarily mean zero impacts). Bruegmann (2005) echoes the
methodological point made above:
Because of the complexity of urban systems, however, it is often difficult to draw up such a balance sheet. […] this problem is compounded by the fact that the ‘solution’ to any given problem depends on the vantage point of the person doing the proposing (p. 222).
Third, there are countless intermediating factors, particularly governance, which calls for great
caution in assuming that the findings of one study in a particular territorial context will be
relevant for others. Addressing this point Dawkins et al. (2002) with respect to housing prices,
found that, “the effects of urban containment appear to be much more dependent on the style
of policy implementation, the structure of local housing markets, the pattern of existing land
ownership, and the stringency of other local regulations” than the practices of local planners.
Therefore, even if causality is demonstrated as regards the impact of a mode of urbanization
(i.e. it is a significant factor), other factors may be much more powerful in determining the final
effects.
1.7.1 Object of application As stated, this sustainability assessment framework can be used to gauge the impacts of
urban developments, for example those taken from case studies or from the pan-European
analysis. First, however, the modes of urbanization have to be identified from the empirical
evidence. Initially the idea was to link urbanization modes to land-use efficiency (e.g. urban
development per capita). If the studied urban area showed low-density expansion in that
period, it can be classified as a diffuse urbanization; if the studied urban area showed no
expansion, it can be identified as an urban containment or polycentric mode. However, as
expected, this classification is rather simple, and it only captures recent development,
whereas the vast majority of the urban structure was determined prior to 2000. Moreover, it is
possible that the new development is different from the existing structure. Another possibility
would be to use the cluster analysis using land-use and socioeconomic data. This typology,

ESPON / SUPER – Sustainable Urbanization and land-use Practices in European Regions / Interim Report
25
however, does not seem to bear any resemblance to the three modes of urbanization as
discussed above.
A more direct analysis is needed. Given that it is very difficult to identify urbanization modes in
an automated manner (this was also attempted in OECD 2018 with mixed results), the
SUPER performed a manual morphological analysis. The methodology and preliminary
analysis of results were presented in Annex 1, Section 3.4.

ESPON / SUPER – Sustainable Urbanization and land-use Practices in European Regions / Interim Report
26
2 Modelling urbanization in LUISETTA 2.1 Introduction The impact of policies and trends can be illustrated by modelling potential urbanization
patterns using quantitative land-allocation models. For instance, a PBL study simulated the
effects of the national government’s decision to abolish its urbanization policies using the
Ruimtescanner model (Kuiper and Evers 2011). At the EU level, the EU Joint Research
Centre (JRC) has developed the Land Use-based Integrated Sustainability Assessment
(LUISA) modelling platform for this purpose, which is similar in essence to the Dutch
Ruimtescanner model (e.g. Kompil et al. 2015; Barbosa et al. 2016). The JRC model has
recently been made available in an open source version called LUISETTA. Although some
functionality from the LUISA platform has been removed from LUISETTA, the land-use and
economic and demographic modules relevant to the SUPER are still included.
The LUISETTA model has been used in this project to produce an impression of potential
future land-use changes and urban morphologies by means of three scenarios. The model
runs until 2050 based on inputs which are elaborated below. The scenarios correspond with
the three modes of urbanization outlined earlier in this annex of compact, polycentric and
diffuse urbanization. This section describes the data on which this model runs, its internal
workings, displays preliminary output as well as the technical choices made in adapting the
scenarios to the capabilities of the model.
In brief, the scenarios hold all environmental, economic and technological variables constant.
The factors which vary are societal attitudes, which is expressed in the adoption of different
policy packages reflecting these attitudes. The compact scenario describes a disenchantment
with the suburban lifestyle and its perceived unsustainability. A combination of densification
and containment policies, drawn from the SUPER intervention database, are implemented to
create compact cities and spare the open countryside. These are maintained throughout the
scenario period. The situation in 2050 is described using the LUISETTA model output (this
Chapter) and the sustainability assessment framework (Chapter 1) as a basis. The same
approach is applied to the other two scenarios. The polycentric scenario describes a situation
where the feeling of community within small and medium sized towns is extolled. The
convenience of walkability within these urban areas coupled with good public transport
accessibility between them comprises the social attitudes of the scenario. The policy package
here is a combination of planned communities (e.g. new urbanism, post-war growth centres)
and transit-oriented development. The diffuse scenario describes a situation where individuals
and families have a strong preference for spacious surroundings, privacy, and comfort. The
policy package is one of stimulating home ownership, self-build and expanding road capacity;
it also entails the relaxation of environmental and planning controls on development. As with
the other scenarios, the situation in 2050 is described using other parts of the SUPER project
as a base. The models themselves are presented in Chapter 3 of this Annex in more detail.

ESPON / SUPER – Sustainable Urbanization and land-use Practices in European Regions / Interim Report
27
2.2 Methods 2.2.1 Data used and required for modelling purposes The LUISETTA model uses self-contained databases for its calculation of future land use.
This means that, in theory, the baseline scenario can be run without any additional input
whatsoever. Approximately 40 datasets are incorporated into the model, including information
on age, population, accessibility, distance to roads and water, slope of the terrain, soil
contamination, high-value farmland, etc. The model also contains an updated population grid
(Rosina et al. 2018) and includes burnt areas, roads, accessibility, water, administrative
jurisdictions and Natura 2000 areas.
The basemap for the model is a high-resolution (100m) version of the 2012 Corine land cover
map, updated using sources such as the GHSL (Rosina et al. 2018). The model only contains
information for EU member states (EU28). Projections for non-EU ESPON countries (Iceland,
Norway, Switzerland, Liechtenstein) were calculated based on national demographic
projections from Eurostat, which were then distributed over the respective NUTS2 regions in
these countries using the same assumptions contained in the LUISETTA model. Specifically,
the projections in household size converge to 1.8 across Europe in 2150. The trends for
urban land-use per household are based on 2000 and 2012 data.
2.2.2 Model setup and operation The LUISETTA model was employed to get an impression of the potential extent and
distribution of future urbanization and other land use changes. As stated, this is the open-
source version of LUISA (Land-Use based Integrated Sustainability Assessment model),
which has been extensively described in the scientific literature (e.g. Kompil et al. 2015).
Some modelling components from the LUISA platform have been removed from LUISETTA,
but land use and economic and demographic developments are still available. Therefore, the
scientific literature on the LUISA platform is applicable to the way LUISETTA was run in the
SUPER project. A detailed report specifically for the LUISETTA platform is forthcoming
(Jacobs-Crisioni et al., forthcoming)
The core of the LUISA modelling platform is a harmonised 100-meter resolution land use and
land cover map that upgrades the minimal mapping unit from 25 ha to 1 ha (Rosina et al.
2018). This is used in combination with physical-geographic information such as slope and
accessibility, 1km population grids (Batista e Silva et al. 2018) and economic projections, in
order to enable land-use changes to be calculated under differing socio-economic and policy
scenarios. For example, it is possible to model a ‘business as usual’ or ‘laissez faire’ scenario
versus a ‘no net land take’ or ‘compact development’ scenario (as demonstrated in Barbosa
et al. 2016). The major inputs and outputs are available for download online.
The version of LUISETTA used by PBL contained a baseline scenario. This scenario
contained values for 32 parameters which were calibrated for the full LUISA modelling suite.
This was deemed a viable starting position for a baseline (policy-poor) scenario for urban

ESPON / SUPER – Sustainable Urbanization and land-use Practices in European Regions / Interim Report
28
development. These parameters adjusted the “location specifics” (LocSpec), which inform the
suitability maps (more information below, see also Figure 2.3).
Not all the concomitant input data was available in LUISETTA however, and because a full
recalibration effort was not feasible, a plausible baseline scenario was created by giving a
strong weight to the variable nearness to existing population (Neigh_Qi). Consequently, the
adjusted baseline scenario simulates new urbanisation occurring predominantly near existing
urban areas. Other parameters with a relatively strong effect on location specifications were
nearness to water (ln_water and Neigh_ln_water) and nearness to roads (ln_roads and
Neigh_ln_roads). Table 2.1 provides an overview of all the variables and their weights in the
baseline.
Table 2.1: model parameters and weights used for LUISETTA application in SUPER, with the altered parameter highlighted. Constant 1.604
Elevation_100 -0.031
ln_yieldmaize -0.043
ln_yieldbarley 0.030
ln_yieldsugbeet -0.044
ln_yieldsunflow 0
ln_yieldwheat 0.111
ln_yield rapeseed
0
TownAccess 0
slope100_cont -0.084
RelPotAccess 0
sosl_100 0
natura2000 _v2011
-0.724
nda -0.848
Qi 0.019
Neigh_Elevation _100
0.033
Neigh_ln_ yieldmaize
-0.155
Neigh_ln_ yieldbarley
0
Neigh_ln_ yieldsugbeet
0
Neigh_ln_ yieldsunflow
-0.050
Neigh_ln_ yieldwheat
0.140
Neigh_ln_ yieldrapeseed
0.023
Neigh_Town Access
-0.057
Neigh_slope100_ cont
-0.203
Neigh_ RelPotAccess
-0.807
Neigh_sosl_100 0
Neigh_natura2000 _v2011
-0.218
Neigh_nda -0.331
Neigh_Qi 5
ln_roads -0.271
ln_water -1.127
Neigh_ln_roads 0.190
Neigh_ln_water 0.830
Figure 2.1: A modified example script illustrating the code for calculating land use changes

ESPON / SUPER – Sustainable Urbanization and land-use Practices in European Regions / Interim Report
29
Figure 2.2: The GeoDMS operating environment showing output for Malta
The model runs between 2012 and 2050 in five year intervals and performs three important
tasks for each five-year round.
• First, it considers a set demand for different types of land use, for example hectares
of urban fabric. This demand is derived from projections provided by other models at
the NUTS2 level which have been incorporated into the model.
• Second, the model distributes this demand over the landscape based on a
combination of factors, including the characteristics of the landscape and preferences
for the land use type. This produces a map of land-use change pressure (see Figure
2.3 for an example). As far as urban development is concerned, the suitability of
locations is based on distance to roads, water, existing population, and relative
accessibility.
• Third, a decision is made to alter the land use or not, bearing in mind the variable
transition costs between different types of land use. These costs are defined in a
transition matrix that includes all possible transitions between land covers.
The modelling framework allows for the input of maps that modify the LocSpecs. As outlined
above, LocSpecs define the suitability of a given 1 ha pixel for urban land use. The model
then allocates demand for new urban space to areas with non-zero urban suitability, starting

ESPON / SUPER – Sustainable Urbanization and land-use Practices in European Regions / Interim Report
30
with those areas deemed most suitable. The basic idea is to insert a map which creates a
spatial multiplier to the LocSpecs with values that typically run from 0 to 2. Multiplying by 0
makes that location completely unsuitable for urban land use. Multiplying by 2 makes that
location twice as suitable as compared to the baseline.
2.2.3 Scenarios Given the architecture of LUISETTA, at least three methods can be used to create scenarios:
• By altering demand for urban land, which should result in different development pressures;
• By altering location characteristics by inserting a map that modifies the attractiveness of locations (e.g. by making locations near train stations more attractive, or by making rural areas less attractive);
• By altering the cost of transitions, for example by making the transition from industrial/commercial to urban use ‘cheaper’ and therefore more likely.
The modes of urbanization outlined earlier were translated into scenario input by altering two
of these aspects: demand and location characteristics. Under specific explicit considerations
of e.g. transformation of industrial land, it would be useful to also consider altering transition
costs, but this was not deemed appropriate (too specific) given the specifications of the
scenarios. Since the model works with exogenously defined demand for urban land in
hectares, the policy-poor LUISETTA baseline data was employed for the diffuse urbanization
scenario.
The following three images within Figure 2.3 show how the LUISETTA model allocates
demand in the baseline scenario; the area shown is Nivelles in Belgium. In the first image, the
original situation is displayed from the 2012 basemap. The second, middle, image is the
suitability map, showing urban areas in black (unsuitable), protected nature in green
(relatively unsuitable), and highly suitable areas in darker shades of brown. The third image
shows the allocation in 2020 resulting on the balancing of demand, suitability, and transaction
costs according to the algorithm’s internal logic.
The manipulation of suitability to produce the compact and polycentric scenarios is presented
in Figure 2.4. The maps to alter the baseline scenario were based on the integrated land-use
basemap in LUISETTA. We then performed a smoothing function on this map to distinguish
large and medium-sized urban areas. Buffers were then drawn around these urban areas,
outside of which attractiveness was greatly reduced in order to encourage development within
the buffer (simulating an urban growth boundary). For the compact scenario, we used a strict
smoothing function, so that only the larger and more densely built-up urban areas were
included on the map. For the polycentric scenario, we used a less strict smoothing function,
so that smaller cities become focal points. Originally, we had tried to insert a map increasing
the attractiveness of rail stations to simulate transit-oriented development, but this proved
unsuccessful (it did not change results). It was not determined why this approach failed, but
perhaps it was associated with the fact that this map was not derived from the baseline map.
Therefore, the polycentric scenario in the model is truly ‘polycentric’ in the morphological

ESPON / SUPER – Sustainable Urbanization and land-use Practices in European Regions / Interim Report
31
sense rather than transit-oriented development, such as described in the assessment
framework. Because of this, the storyline of the scenario was adapted somewhat to reflect the
model’s shortcomings in this regard.
Figure 2.3: Simplified suitability map for urban land use (2012-2020 transition)
Figure 2.4: Hamburg’s preferential sites of future urbanization in 2500 (left: compact) and 1000 (right: polycentric) scenario. In diffuse, only proximity to existing urbanization and roads is considered (see image above showing urban suitability).
Simulating densification
In the compact scenario, a significant portion of new development should be realized in
existing urban areas. Because LUISETTA cannot simulate density, all new demand is
accommodated outside of existing areas, as urban areas are already considered ‘urban’ and

ESPON / SUPER – Sustainable Urbanization and land-use Practices in European Regions / Interim Report
32
therefore off-limits. Run normally, the compact scenario would produce just as much
urbanization on greenfields as the diffuse scenario, which is at odds with both scenario logic
as well as empirical reality. In order to deal with this problem, we adjusted the demand for
urban land downwards in the compact and polycentric scenarios, which is tantamount to
saying that this demand is being realized by infill development or densification. Demand was
cut in half in the compact scenario and by a third in the polycentric scenario.
For the adjustment of location characteristics that have a strong impact on the distribution of
new urban areas, we again followed the baseline scenario for diffuse urbanization, which
simply defines existing urbanization and roads as attractive locations (see Figure 2.3). For the
compact and polycentric scenarios we increased the appeal of areas near urban
agglomerations and lowered the attractiveness elsewhere (see Figure 2.4). This was done by
calculating the percentage of urbanised land within a radius of 2,500 meters and 1,000
meters for the compact and polycentric scenario respectively, squaring this percentage to
make the gradient stay closer to existing urban contours.
2.3 Results The output of the model is a modified high-resolution (100 m) version of the CLC2012 map for
each five-year period between 2015 and 2050 for all EU countries, with pixels classified into
urban, commercial, agricultural and natural categories. Urban use in LUISETTA refers to all
urban uses except industrial/commercial, and infrastructure, which were coded as separate
classes.
This output can be analysed both visually and statistically. In terms of statistics, the number of
pixels in different land-use classes can be counted and aggregated to administrative
boundaries. The output maps were analysed at the NUTS2 level (2016 borders) using ArcGIS
in combination with Python and SQLite to extract statistical information. The data was then
transferred from SQLite to Excel for further processing. Using Excel, we can present
aggregated changes in land use as well as changes in average population density per region
and per scenario. This allowed us to display differences between the scenarios for these
variables. A caveat is in order regarding the administrative boundaries. We used NUTS-2016
to match the other analyses of the SUPER project. However, LUISETTA uses NUTS-2010 to
perform its calculations. this could cause a differences for areas where the regional division
changed between 2010 and 2016, especially where a clear difference in regional growth
factors has been included in the model.

ESPON / SUPER – Sustainable Urbanization and land-use Practices in European Regions / Interim Report
33
Figure 2.5: Urbanization around Luxembourg City in 2050 in the compact (left), polycentric (middle) and diffuse (right) scenarios
Because the demographic data was fed in at the NUTS2 level, we aggregated the outputs at
this level as well as the national level. Figure 2.6 shows the national figures for the density of
urban area and change in total urban area (relative to the starting year of 2020); Iceland,
Norway, Liechtenstein and Switzerland were calculated using a slightly different method (see
section 2.2.1). The modelled data show an especially large difference between diffuse
urbanization and the other two scenarios in a number of countries. Compact urbanisation
tends to lead to less urbanisation than polycentric, although the distinction is less sharp in
some countries, most likely due to existing urban morphology. If we look at the average
national density these figures do not necessarily lead to a large divergence in density,
although figures at this scale of aggregation do not and cannot show the large changes that
may take place at the level of new developments (nor is LUISETTA equipped to model this).
When interpreting the results, we need to remember that changes in land use are modelled
through variable demand, suitability of sites and transaction costs. The reduction of 50% in
demand in the compact scenario did not produce commensurate 50% reduction in
urbanization. In some cases, changes in land-use preferences may not matter much, for
example when the area that is available for urbanisation is roughly the same in all three
scenarios. If we take the diffuse scenario as baseline, the model shows an average decrease
of 4% of urban area across Europe for both compact and polycentric. However, there are
clear differences between countries. In a few countries, the model even computed more
urban development (Bulgaria, Croatia, Germany, Latvia) in the compact scenario than in the
diffuse scenario. The compact scenario leads to the largest decreases in urbanization in
Iceland (17%), the UK (14%), Malta (12%), Belgium and Luxembourg (11%) and Sweden
(11%). In a few countries, the polycentric scenario leads to a larger decrease than the
compact scenario: most notably Estonia (6% difference), Latvia (5% difference), and
Denmark (4% difference). At first glance, these national differences might be explained by the
predominance of major urban centres, their shape, and the potential for infill. More analysis

ESPON / SUPER – Sustainable Urbanization and land-use Practices in European Regions / Interim Report
34
and more knowledge of the inner workings of the LUISETTA model would be needed to
explain these differences with a higher level of confidence.
Figure 2.6: Change in urban land and average national density per country in the three scenarios

ESPON / SUPER – Sustainable Urbanization and land-use Practices in European Regions / Interim Report
35
3 SUPER scenarios 3.1 Introduction Creating narratives about future development is a common spatial planning tool, particularly
for strategic decision-making (Albrechts et al., 2003; Throgmorton, 1996; Zonneveld, 2007).
The purpose of a scenario is to explore possible future pathways where the level of
uncertainty is too high to warrant a prognosis, but high enough to avoid mere speculation
(Dammers et al., 2013). In general, one can distinguish two types of scenarios: those that
hold policies constant except for a set number of external variables (environmental scenarios)
and those that vary according to policies (policy scenarios). The SUPER scenarios are of the
latter type; they seek to explore how three different policy orientations could result in
divergent urbanization and land use trajectories, and the implications of this on sustainability.
As such, they provide insight into different long-term policy strategies. These kinds of
scenarios have a long tradition in ESPON research (e.g. ESPON, 2006).
Given the policy scenario nature, all external variables such as demographic and
macroeconomic development, technology and climate change are held constant. Differing
societal attitudes comprise the scenario-specific variables, which result in the adoption of a
plausible policy package in that scenario. Using slightly different terminology, the scenarios
follow the longstanding debate on urban sprawl in the spatial planning literature. In the first
scenario, ‘compact’, urbanization is halted by 2050 by gradually directing all development
inwards in large urban regions, resulting in a compact urban structure. In the second,
‘polycentric’, urbanization is diverted to areas well-serviced by public transport, resulting in
clustered development. In the third, ‘diffuse’, urbanization occurs along roadways in peri-
urban and rural areas, resulting in a scattered settlement pattern.
Table 3.1: Key elements of the scenario storylines Elements Compact Polycentric Diffuse Constants Demographic development Slowdown in EU population growth and ageing.
Regional differentiation following prognoses. Macroeconomic development Low to medium growth in EU, regional variation Technological advancement Transport and information innovations Climate change More extreme weather events Variables Attitudes on mobility Walkability Multimodal Private car Attitudes on density Positive Mixed Negative Attitudes on governance Collectivist Interdependence Independence
In the scenario writeup, each storyline consists of three main parts. The first concerns the
rationale, which serves as a general introduction, and is aligned to the LUISETTA model
input. It consists of a provocative, but not entirely implausible, piece of fiction to make it clear
that these stories are not about making predictions, but about describing possible and
diverging futures based on a given scenario logic. The storytelling contains common
elements, such as identical sentences on demography, technology and climate change

ESPON / SUPER – Sustainable Urbanization and land-use Practices in European Regions / Interim Report
36
effects to emphasize that the model input is consistent across scenarios. The societal
reactions to these common drivers differ, however. Given this, the rationale section explains
how the quantitative and qualitative demand for urban space is modified by scenario-specific
societal attitudes (e.g. the magnitude of aging is the same in all scenarios, but the housing
preference of elderly people varies).
The second section presents the scenario policy package. It begins with a brief description
of policy aims to produce a plausible link between the societal attitudes described in the
rationale and the instruments chosen to influence urbanization and land use accordingly. The
second part describes the package of interventions implemented in the scenario, making
specific reference to evidence produced in the SUPER project (intervention database and
case studies).
The last section discusses the scenario impacts, based on the LUISETTA model output and
the SUPER sustainability assessment framework. It starts with a reflection on urbanization
and land-use change using the 2050 image. Each scenario will contain observations, such as
a description of the kinds of areas which saw the most urbanization, and how this affected
overall urban form by means of zooming in on specific areas. This is followed by a description
of impacts in each scenario using the three dimensions of sustainability. The indicators in the
table below, which are the same as those used for the sustainability assessment framework
(see Table 1.2), serve as a guide for this.
Table 3.2: Key indicators for the three scenario storylines Economic Ecological Social - GDP, wealth - Public finance - jobs - Accessibility - business areas - housing
demand/construction - Transportation costs - Energy consumption
- car mobility - pollution - greenhouse gasses - green urban areas - biodiversity - land consumption - natural hazards - climate change
adaptation and mitigation - resource consumption - renewable energy - water retention - circular economy
- health - affordable housing - equity/inclusion - public and recreational
space - housing variety - mixed-use areas - satisfaction with home and
surroundings
3.2 Compact scenario4 3.2.1 Rationale Starting in 2020, a prudent policy of urban containment was promoted throughout Europe to
avoid the wasteful, haphazard urbanization which had resulted in the destruction of natural
4A note on scenario names: we opted for names that are as neutral as possible . We also chose adjectives to ‘development’ that reflect the final morphological outcome (e.g. compact). Finally, the scenarios should sound different enough to avoid confusion (i.e. not containment, clustering and cluttered).

ESPON / SUPER – Sustainable Urbanization and land-use Practices in European Regions / Interim Report
37
resources, especially land consumption, and undermined the vitality of cities. A selection was
made from sustainable urban development policies that had proved successful in the past
plus some innovations. The result was that urbanization occurred in or near existing cities. By
2050, redevelopment, regeneration or infill development had become the norm.
Looking back, there were various reasons behind this course of action. Attitudes regarding
where and how to live had changed considerably. The generation that had grown up with the
Twentieth Century ideal of a single-family home and private car had passed on. The notion
that people would willingly commute for hours to a large home in a sprawling suburb or
remote village and waste their weekend mowing lawns and taxiing children back and forth to
dispersed activities, seemed by 2050 as alien as anachronistic – a tiny apartment at a good
location was preferable. In short, a change in mindset had occurred in which people preferred
convenience and flexibility to size and luxury in their housing decisions.
Many factors influenced this change. One was increased environmental awareness of citizens
as the effects of climate change became increasingly unavoidable; compact urban living was
widely praised for its sustainability. Moreover, the demographic pressure in Europe had
stabilized and the population aged significantly; there was a greater need to be close to
healthcare and sheltered-housing facilities in case of sudden illness. The digital connection
had become so pervasive and sophisticated that cyberspace was as important as physical
space. This was reflected in new attitudes towards mobility and proximity: being used to the
convenience of the online world, physical amenities should also be close at hand. Europe’s
great cities, with their mixed uses, walkability and excellent public transportation was an ideal
environment. As a result, the pressure for new homes, especially those distant from the
amenities and services in urban centres, waned whereas large cities thrived.
The millennials decided to reinvent urban areas to suit their needs. In order to produce urban
areas large enough to provide the quality they demanded – especially given the demographic
developments – an ambitious containment programme was introduced. The aim of the
strategy was to restrict urban growth to no or virtually no new unbuilt rural land being
converted to urban use in order to retain traditional rural land cover types as agricultural land,
forest and grassland around the city and to create the densities necessary for high-quality
urban amenities and infrastructure (Millward, 2006). Various policies enacted in the 2000-
2020 period provided inspiration for policy packages throughout Europe. These were
territorially differentiated for maximum impact.
3.2.2 Policy package In urban areas, especially metropolitan regions, various options were available. The most
obvious is to restrict urban expansion by imposing legal boundaries, thus increasing densities
and creating a more compact urban form. One of the most studied containment strategies is
the ‘urban growth boundary’ in Portland, Oregon (USA), but in Europe we also find London’s

ESPON / SUPER – Sustainable Urbanization and land-use Practices in European Regions / Interim Report
38
Green Belt, Corona Verde in Torino, Grüner Ring in Leipzig and the Metropolitan Cork Green
Belt. Similar strategies include regulations capping urbanization (e.g. the zero-growth plan of
the municipality of Cassinetta di Lugagnano), or legal devices that address sustainable land
use issues (e.g. in Tuscany, the 2014 regional law on soil consumption n.65/2014). These
interventions are sometimes called ‘outside game’ strategies because they concern outward
expansion (Rusk, 1999). These were supplemented with interventions oriented to the ‘inside
game’ that promote inner-city development. Inspiration was found in interventions
transforming underutilized areas (e.g. Reinventing Paris), enhancing the quality of existing
urban spaces (e.g. BENE – Berlin Programme on Sustainable Development) or regenerating
brownfield areas (e.g. Dublin Docklands and the Royal Seaport eco-district in the City of
Stockholm).
In rural areas, the focus was on limiting building in the countryside. Examples include swiss
anti-sprawl measures, German and Belgium caps on development, regeneration schemes
and farmland protection regulations such as in Valencia. Some countries possess transfer of
development rights schemes (e.g. the Dutch ‘red for green’ or the Portuguese Perequação
policy), which make planning permission for new buildings conditional on the demolition of old
ones. Finally, measures such as community-led regeneration processes were considered
such as the regeneration of abandoned areas in Casoria (Italy).
3.2.3 Impacts By 2050, the decades of consistent policy decisions on urbanization and land-use could be
read in the physical landscape. Green areas bordering large cities were sacrificed for urban
development, while those further afield (e.g. within a green belt) remained untouched. Within
cities, unbuilt spaces became scarcer and population densities higher as buildings increased
in height and as apartments were subdivided. Rural areas retained their rural character.
Some reflected on this development positively, while others were more sceptical about the
sustainability of this policy course. Did it serve the long-term economic, ecological and social
goals it aspired to?
Figure 3.1: Sample of compact scenario 2050 output for five selected regions
Figure 3.1 displays the typical urbanization pattern produced by the compact scenario by
2050 in the LUISETTA model. The dark red regions show the new urban fabric; the light red

ESPON / SUPER – Sustainable Urbanization and land-use Practices in European Regions / Interim Report
39
areas were already built-up at the beginning of the scenario period. Here we can see that new
development clings to existing urban areas, generally the larger cities. Some large polycentric
regions such as the Randstad and Ruhrgebiet coalesced, whereas the scattered suburban
development around cities like Milan and Warsaw had filled in. In Belgium, we see Brussels
filling in towards the south, as well as the spaces between Charleroi and Mons. In the area
between Bologna and Ravenna in Italy, development only occurred around a few large cities.
The same is true for Stockholm, where the main centre attracted most urbanisation. This
tendency was less evident in Constantia (Romania) due to the low development pressure
overall.
As Map 3.1 illustrates, the compact scenario produces urbanization in areas with large urban
centres, and many of the biggest cities can be discerned in the figure as the areas gaining the
most built-up area. Still, not every area gaining population gained the same amount of extra
urban space. Due to lower attractiveness or transaction costs regarding building locations,
some areas were not able to produce enough space to keep up with demand. In these
situations, there was further densification in the existing urban fabric – for example, by
redevelopments replacing single-family homes with apartments, adding floors to existing
buildings or subdividing homes into smaller (studio) units, sometimes to sublet. As displayed
in Map 3.2, we can see this densification in more areas than just large cities: also large parts
of Spain, Italy and southern Germany show more people living per hectare of urban fabric.
As regards economic sustainability, there were some clear advantages. Real estate values
increased considerably, as predicted (e.g. Nelson et al., 2012, p. 107; Nilsson & Delmelle,
2018) and urban economies flourished from the opportunities provided by brownfield
redevelopment (Hall, 2014). The proximity afforded by high densities allowed companies to
decrease transport costs and facilitate communication between firms (Anas et al., 1998;
Nelson et al., 2012). The compact city structure created inner-city jobs, aided the
development of central business districts and resulted in higher energy efficiency (OECD,
2012). In a compact city, heat exchange between buildings is greater, reducing energy costs
(Boyko & Cooper, 2011; Naess, 2006; OECD, 2012, p. 61). The need of materials for
buildings and road infrastructure also decreases due to efficiency gains (Naess, 2006).
However, land-use controls might result in a net welfare loss if one considers the slowed
growth outside the main cities (Cheshire et al., 2018). Finally, with respect to transportation,
the compact city structure made high-quality transport connections more viable, but also
increased the risks of congestion and overcrowded public transportation (de Nazelle et al.,
2010; Litman, 2019).

ESPON / SUPER – Sustainable Urbanization and land-use Practices in European Regions / Interim Report
40
Map 3.1: Compact Urbanization - Change in urban area relative to starting year (2020-2050)
Map 3.2: Compact Urbanization - Density in population per ha of urban fabric (2050)

ESPON / SUPER – Sustainable Urbanization and land-use Practices in European Regions / Interim Report
41
As regards ecological sustainability, the sparing of non-built space outside the city
boundaries can be viewed positively (Soga et al., 2014; Sushinsky et al., 2013). These
policies proved effective in curbing ‘exurban’ development, defined as urbanization which is
too diffuse to be viably served by water or sewer infrastructure, and which is highly car
dependent (Nelson et al., 2012, p.49). Given that urban form influences the choice between
walking, public transport and private vehicle (Owen, 2009; Pooley & Turnbull, 2000; Rajamani
et al., 2003), private car use decreased. Moreover, lower land consumption rates gave
flexibility with respect to future ecological planning (Van Der Waals, 2000; Westerink et al.,
2013). Innovations such as green roofs, vertical gardens and tiny urban forests provide much-
needed ecological services in compact urban areas. Nevertheless, development in compact
cities usually comes at the expense of urban green areas, for example in Helsinki
(Hautamäki, 2019) and Amsterdam (Giezen et al., 2018). Given the fact that the new
development in this scenario is at a higher density, this trade-off should be positive on
balance in quantitative terms. Qualitatively it can be debated whether a hectare of community
garden, park or football field in a city is more valuable in terms of sustainability than a distant
hectare of agricultural land. In fact, sacrificing these kinds of green spaces can aggravate
local pollution concentrations (Glaeser & Kahn, 2010), urban heat island effects and
vulnerability to natural hazards (Burby et al., 2001). Finally, it proved increasingly difficult to
find space for renewable energy in the compact city (Marco Broekman et al., 2017).
As regards social sustainability, the containment scenario held some disadvantages.
Housing prices tended to rise, and where no vigorous affordable housing policy was
implemented, lower-income households became priced out. In some places, this manifested
itself in discriminatory practices, such as against immigrants. As feared, contagious diseases
can spread more rapidly in densely populated areas. In addition, there are increased
nuisances such as noise and pollution as well as diminished access to green spaces (Giezen
et al., 2018). Inhabitants of compact cities are potentially healthier because they walk and
cycle more (OECD, 2012), but are simultaneously exposed to more air pollution unless this is
also reduced by other measures. In addition, the shorter distances reduce car dependency,
thus lowering social segregation and improving access to local services, jobs and recreational
spaces (Nelson et al., 2012). Finally, smaller physical distance between people increases
interaction between different social classes and origins, tradition, custom and culture (Jacobs,
1961).
3.3 Polycentric scenario 3.3.1 Rationale Starting in 2020, a policy of urban clustering had been promoted throughout Europe to avoid
both the disadvantages of haphazard urbanization, which deplete natural resources and
undermine the vitality of cities, and the disadvantages of urban containment which create big-
city problems and ran counter to the housing preferences of many citizens. A careful selection

ESPON / SUPER – Sustainable Urbanization and land-use Practices in European Regions / Interim Report
42
was made from sustainable urban development policies that had proved successful in the
past plus some innovations. The result was to encourage urbanization in and around midsize
towns, preferably near rail stations. By 2050, a more polycentric pattern of development
began to emerge.
Looking back, there were various reasons behind this course of action. Attitudes regarding
where and how to live had consistently shown that people appreciated urban lifestyles with
amenities nearby, but also wished to live somewhere where the open countryside was within
arm’s reach and avoided big-city problems like traffic congestion and noise and air pollution.
In the wake of faceless globalization, pandemics, climate change and other external threats,
people desired the security and scale of a midsize community. So, despite bold predictions of
grand revolutions in urban development heralded by new technologies and rapid societal
change, the desired city structure in 2050 followed the ancient polycentric pattern of towns.
Many factors influenced this change. Rebelling against the populist revolt of previous
generations, interdependence was embraced: the theory of neo-medievalism and post-
territorialism which had seemed absurd in 2020, gradually became accepted as functional
relationships became more important than jurisdictions – even national borders. In addition,
environmental awareness of citizens increased as the effects of climate change became
increasingly unavoidable; the reaction to extreme weather events demanded cross-border
cooperation and walkable human-scale communities with good public transportation fit the
environmentally aware mindset. Moreover, the demographic pressure in Europe had
stabilized and the population aged significantly; many elderly people sought out the familiarity
of traditional town structures and appreciated the comfort and sociality of collective transport.
Moreover, digital connection had become so pervasive and sophisticated that cyberspace
was as important as physical space. This became reflected in new attitudes towards mobility
and proximity. The ideal of owning a private car waned, spurred in part by the availability of
other transport services.
The millennials decided to reinvent urban areas to suit their needs. A policy package was
devised to promote ‘smart’ polycentric growth that sought a balance between economic,
environmental, and social aspects of planning and development while making efficient land-
use decisions (Daniels & Lapping, 2005). An important aspiration is to provide good access to
urban amenities (Handy, 2005), often by locating new compact neighbourhoods within one
kilometre from a rail station or by building light-rail connections in midsize towns (Bertolini et
al., 2012; Papa & Bertolini, 2015). A number of policies enacted in the 2000-2020 period
provided inspiration for policy packages throughout Europe. These were territorially
differentiated for maximum impact.
3.3.2 Policy package With respect to urban areas, a number of developments provided inspiration. One of the most
prominent examples was Ørestad, Copenhagen’s linear new town built around elevated light-
rail stations. There were other examples in Europe, such as the Dutch stedenbaan project

ESPON / SUPER – Sustainable Urbanization and land-use Practices in European Regions / Interim Report
43
and many densification schemes near S-Bahn stations in Germany. Other urban plans that
promote a polycentric urban structure and low-density expansion included the 2007 General
Urban Development Plan of the City of Sofia and the City of Stockholm which integrated land
use, housing and transport planning was pursued (Paulsson, 2020). Finally, the Helsinki
region introduced agreements on land use, housing and transport (MAL) to great effect.
The same philosophy could also be applied in rural areas, by encouraging new development
around rural stations rather than in car-dependent areas, or by favouring development
contiguous to current buildings. At the regional level, the general development plan of the City
of Stara Zagora encourages a new polycentric urban model for the future development of the
city and its surroundings and the Tri-City metropolitan area in Poland planning promotes a
harmonious development of the metropolitan area, enhancing public transport.
3.3.3 Impacts By 2050, the decades of sustained policy decisions on urbanization and land-use could be
read in the physical landscape. Some green areas near large cities had been sacrificed for
urban development, but others remained largely intact. Cities spawned new settlements along
infrastructure routes, particularly at train stations, like a string of beads. This allowed those
living in these clusters, proximity to the surrounding rural area, while at the same time
providing access to urban amenities via the rail line. Some reflected on this development
positively, while others were more sceptical about the sustainability of this policy course. Did it
serve the long-term economic, ecological and social goals it aspired to?
Figure 3.2: Sample of polycentric scenario 2050 output for five selected regions
Figure 3.2 displays the typical urbanization pattern produced by the polycentric scenario by
2050 in the LUISETTA model. The dark red regions show the new urban fabric; the light red
areas were already built-up at the beginning of the scenario period. Here we can see that
smaller towns are preferred locations for new development. In the Randstad region and
Bologna-Ravenna region, it accentuated the already polycentric urban structure but
sometimes resulted in towns growing into each other. Similar tendencies were apparent in the
case of the, the Constantia region in Romania, but were dampened by the low growth overall.
Stockholm which already had polycentricity as a long-term planning strategy saw
development continue on the ‘fingers’ stretching outwards from the core city.

ESPON / SUPER – Sustainable Urbanization and land-use Practices in European Regions / Interim Report
44
Map 3.3: Polycentric Urbanization - Change in urban area relative to that in starting year (2020-2050)
Map 3.4: Polycentric Urbanization - Density in population per ha of urban fabric (2050)

ESPON / SUPER – Sustainable Urbanization and land-use Practices in European Regions / Interim Report
45
The aggregated model output for the polycentric scenario regarding urban development
shows that conversion to urban land use occurred mainly in more populated regions. Partly
for this reason, some countries show internal divisions such as France, Germany and Italy,
while others are more homogeneous (Belgium). The polycentric scenario also produced
increased densities (Map 3.4). The main cities gained more population than urban fabric, but
this tendency was also visible many regions, particularly along the Mediterranean coast. In
areas with less development pressure like rural France or Scandinavia or Romania, this was
less pronounced.
The polycentric scenario clearly had a positive impact on economic sustainability. Like the
urban containment scenario, it created enough density through clustering to profit from
agglomeration economies (Rosenthal & Strange, 2008; Storper & Venables, 2004). On top of
this, it created more space for business, thus relieving pressure from the Central Business
Districts (Knowles, 2012). Many major cities benefitted economically from each other by
reducing travel times between hubs, although some continued to compete with each other,
thus undermining synergy (Balz & Schrijnen, 2016; Meijers, 2005). Because this scenario did
connect the urbanization process to the development of public transport infrastructure, the
accessibility of services and jobs of many residential areas improved. The polycentric
scenario provided housing supply for both low income and high-income households. In many
urban areas, open green spaces could be preserved.
This scenario had mostly positive impacts on ecological sustainability. In many urban
areas, dense, walkable zones and good public transport connections reduced car mobility and
air pollution levels (Sider et al., 2013). Because of the polycentric spatial pattern, residential
areas were often close to open green spaces like parks and recreational space. Given the
polycentric pattern more space was available for various possible future uses, including risk
mitigation of natural hazards (e.g. water retention) or utilization of renewable energy sources
(Kenworthy, 2006; Van Der Waals, 2000; Westerink et al., 2013), than in the compact
scenario. On the other hand, some urban areas did not have enough space to produce all of
its own energy use from renewable sources, as predicted (Marco Broekman et al., 2017).
Also, the polycentric scenario often led to a reduction of biodiversity in the area since new
construction was still considered (Weller et al., 2019).
Regarding social sustainability, both positive and negative effects were noted. Affordable
housing was an important part of most clustering strategies. However, housing prices may
increase due to enhanced transport accessibility, depending on regulations and policy
schemes (Nilsson & Delmelle, 2018). In some areas the clustering strategies discouraged
social segregation and inequity, by deliberately building mixed residential areas. But in other
areas they promoted it, by allowing the affluent to live in the historical city centres, whereas
the poor were driven to the urban fringe. Often, the quality of life in residential areas
increased by the provision of green public and recreational spaces (Knowles, 2012; Pojani &
Stead, 2015; van Lierop et al., 2017) and by the walkable neighbourhood design (Guthrie &

ESPON / SUPER – Sustainable Urbanization and land-use Practices in European Regions / Interim Report
46
Fan, 2016). In some residential areas, noise pollution grew because of the proximity of
railway tracks (Pojani & Stead, 2015), although new technologies reduced this impact.
3.4 Diffuse scenario 3.4.1 Rationale Starting in 2020, a bold policy of urban diffusion was embarked upon to allow and encourage
Europeans to enjoy the pleasures of countryside living. It was felt that citizens should have
more control over where and how they wanted to live. Why should hard-working people be
forced by government bureaucrats to live in crowded cities when there was ample space
outside to enjoy the fruits of their labour? The increased demand for housing in a natural
environment was facilitated by planners. Urban design concentrated on granting as much
privacy and green space to individuals as possible through large-lot zoning and long
driveways. Given the low densities, public services and infrastructure were minimal: new
developments – mostly as detached family homes or second homes – were built on existing
roadways and were often self-sufficient. By 2050, low-density urban functions had displaced
agriculture in high-growth regions and most families in Europe revelled in the comforts of a
spacious home with an even more spacious yard.
Looking back, there were various reasons behind this course of action. Attitudes regarding
where and how to live had become increasingly individualistic rather than collective. Since
2020 a countermovement of ‘unplugging’ gained in popularity as tranquillity and privacy
became luxuries; ideally this should occur in a somewhat remote setting, where the hum of
delivery drones was less intrusive. After the Corona pandemic of 2020, the prospect of being
quarantined to a large house with a garden was seen as far preferable to being confined to a
tiny apartment, to say nothing of the enhanced risk of contagion in dense urban areas.
Many factors influenced this change. One was increased environmental awareness of citizens
as the effects of climate change became increasingly unavoidable. Many sought high ground
in order to avoid the flooding after extreme weather events. The increasing heat-island effects
had further increased the popularity of building a home in an attractive, green environment.
Moreover, the demographic pressure in Europe had stabilized and the population aged
significantly; there was enough space to spread out, and many desired to spend their
retirement years in spacious, more rural, surroundings. Many coveted the ideal of off-the-grid
living in remote eco-communities. Moreover, digital connection had become so pervasive and
sophisticated that cyberspace was as important as physical space. This could be seen in
changing attitudes towards mobility and proximity. It was perfectly possible to work, visit
family, shop or play together at any distance. If necessary, one could travel physically in a
personal solar-powered self-driving vehicle (equipped with full VR capability) which would
skilfully navigate the thick traffic on the roads or, if in a hurry, order a lift from a transport
drone.
The millennials reinvented urban areas to suit their needs. Government policy was called on
to make it feasible to claim a stake in the good life in the countryside: diffuse development is

ESPON / SUPER – Sustainable Urbanization and land-use Practices in European Regions / Interim Report
47
not unplanned but originates from local planning practices mainly performed by municipal
authorities (Burriel de Orueta, 2009; Pagliarin, 2018). To achieve this, planning departments
were made leaner, and land-use decisions streamlined and simplified. Self-empowerment
was further stimulated by generous fiscal arrangements for homebuilding, private transport
and energy independence. More importantly, restrictive measures at higher tiers regarding
conservation of landscapes, natural areas and the like were abolished or relaxed. A number
of policies enacted in the 2000-2020 period provided inspiration for policy packages
throughout Europe. These were territorially differentiated for maximum impact.
3.4.2 Policy packages In urban areas, governments prioritized the building of eco-villages and promoted self-
sufficiency of the new inhabitants. One example is the Oosterwold area in the Netherlands
which suspends most planning restrictions, allowing landowners to build whatever they want,
provided they do so in coordination with their neighbours and that they pay all infrastructure
and service costs (Cozzolino et al., 2017; Jansma et al., 2013). Similarly, the Belgian tradition
of allowing new homes along existing roads was viewed as a way to save on public costs. As
cities became emptier, more extensive use of them became feasible; the Parckfarm project in
Brussels on urban agriculture pointed a way forward.
In rural areas, it was decided to cordon off the most valuable natural areas (Natura 2000) and
make the rest open to development, thus maximizing the opportunity for people to realize
their dream of a house in the country. Policy can also directly support this dream, by for
example providing fiscal incentives for housing outside urban areas, as was done in Lithuania
to promote shrinking areas near large cities. Finally, amnesty could be granted for illegal
second-home development, such as in Croatia.
3.4.3 Impacts Urbanization largely occurred piecemeal: first areas near existing urban areas were built up,
and gradually development radiated outwards into more rural and natural areas. By 2050,
these areas had absorbed a significant portion of the urban population, resulting in an
absolute decline within cities, heralding the beginning of a post-urban era. Meanwhile, the
countryside surrounding urban areas assumed first exurban, and then increasingly suburban
characteristics, until they met the next town. Some reflected on this development positively,
while others were more sceptical about the sustainability of this policy course. Did it serve the
long-term economic, ecological and social goals it aspired to?

ESPON / SUPER – Sustainable Urbanization and land-use Practices in European Regions / Interim Report
48
Figure 3.3: Sample of diffuse scenario 2050 output for five selected regions
Figure 3.2 displays the typical urbanization pattern produced by the diffuse scenario by 2050
in the LUISETTA model. The dark red regions show the new urban fabric; the light red areas
were already built-up at the beginning of the scenario period. The diffusion of low-density
urbanization along roadways was visible throughout the European territory. The Brussels-
Antwerp area become an even more amorphous urban field than before and the scattered
development in Romania became slightly more so given the low development pressure. On
the other hand, the Randstad exhibits extensive ribbon development, which is
uncharacteristic for the Netherlands. Not only agricultural land was consumed: in the Bologna
and Ravenna region as well as in Stockholm, hills and protected natural areas progressively
succumbed to development pressure.
The diffuse scenario shows the most net increase in urbanization of the three scenarios; there
is a 120-140% increase or more across the majority of the territory modelled, making it
difficult to discern hotspots (see Map 3.5). Areas which show less urban growth include parts
of Germany, Bulgaria, Switzerland, and Norway (although the latter two were calculated using
a slightly different method). Despite the local diffusion and reduction of densities, at the
regional level many areas increased their density. This is most pronounced in high-growth
urban regions which comprise the ‘Blue Banana’ stretching from the UK to Italy and along the
Spanish coast.
In many urban areas, the diffuse development scenario had positive as well as negative
impacts on economic sustainability. The allocation of urban land followed the rules of the
market. Because of lower land prices, building and development on greenfield were usually
much cheaper than the regeneration of brownfields (Bruegmann, 2006). This resulted in lower
prices for both industrial buildings, offices, and housing. Therefore, low land prices stimulated
housing demand and job growth (Oueslati et al., 2015). This was followed by an advance in
economy and transportation technology, which allowed more dispersed spatial distribution of
people and economic activities. However, many locations in the dispersed urban pattern
could not be connected to public transport. Travelling by car remained the default way of
transportation. Accordingly, transportation costs were much higher than in compact cities
(EEA & FOEN, 2016; Longley et al., 2002). Higher costs were also associated with traffic
congestion and increasing needs for the extension of urban infrastructure in newly developed
regions (Cinyabuguma & McConnell, 2013; EEA & FOEN, 2016; Hortas-Rico & Solé-Ollé,
2010; Klug & Hayashi, 2012). Costs for local public services increase including the security,

ESPON / SUPER – Sustainable Urbanization and land-use Practices in European Regions / Interim Report
49
waste collection, sanitation, road cleaning; and public lighting (Gielen et al., 2019).
Furthermore, low-density living increased energy consumption per person (Couch et al.,
2008; EEA & FOEN, 2016; Newman & Kenworthy, 1999). Despite the development of
technology and transport, the majority of jobs were still located in city centres or Central
Business Districts (OECD, 2018), and accessibility of central services and jobs was lower due
to long distances. Over time, as jobs followed suit, some became closer to residential areas,
but the lower densities did not necessarily mean shorter distances.
Regarding ecological sustainability, this scenario had mostly negative impacts. Air pollution
levels as a whole were higher than in the other scenarios, due to enhanced use of cars and
less regulation regarding emissions (Glaeser & Kahn, 2010; Norman et al., 2006). On the
other hand, this pollution was less acute given the more extensive use of space. Problems of
higher noise and light pollution were also observed (Bennie et al., 2014), but with the same
caveat that this was dispersed over a larger area. Because of the extensive land use, there
was a loss of agricultural land and open space, resulting in a decrease of biodiversity of
species dependent on this kind of land use. On the other hand, the greater number of green
and open urban spaces (e.g. unbuilt plots, large backyards, parks) provided other species
with a new habitat. Regarding climate change, this scenario had negative as well as positive
impacts. Transition to more sustainable energy sources proved to be more difficult than in the
other scenarios due to higher land consumption rates, and the dispersed spatial pattern
increased the surface area of urban ‘heat islands’ (EEA & FOEN, 2016; Stone et al., 2010).
However, well-planned diffuse urbanization provided more land for buildings and outdoor
activities, including urban green space (Wolch et al., 2014) and allowed for better climate
adaptation strategies (e.g. space for water retention).
Regarding social sustainability, this scenario had positive as well as negative impacts.
Because of low housing prices, people could easily move to low-density suburbs, which
offered a desirable place to live for most people (García-Coll & López-Villanueva, 2018), as
they offered privacy and large gardens (Longley et al., 2002). For many inhabitants, living
close to nature reduced stress and provided a feeling of well-being. But there were also
negative impacts, especially regarding social equity and mobility (Kenyon, 2011; Morency et
al., 2011). In many urban areas, segregation was much more prominent than in the other
scenarios (Antoniucci & Marella, 2018). Moreover, in some urban areas the dispersion led to
inner-city decline, disadvantaging those who chose to remain (Xie et al., 2018).

ESPON / SUPER – Sustainable Urbanization and land-use Practices in European Regions / Interim Report
50
Map 3.5: Diffuse Urbanization - Change in urban are relative to that in starting year (2012-2050)
Map 3.6: Diffuse Urbanization - Density in population per ha of urban fabric (2050)

ESPON / SUPER – Sustainable Urbanization and land-use Practices in European Regions / Interim Report
51
3.5 Reflection on sustainability The three scenarios elaborated in this chapter are not intended as predictions nor as a
scientifically valid ex-ante assessment of policy choices. Instead, they offer a structured way
to reflect on the inestimable complexity and diversity of Europe and the various trade-offs and
synergies inherent in land-use decisions. They are also intended to drive home the fact that
the direction urbanization takes is the result of human decision-making, and therefore can be
influenced by concerted action. In short, the scenarios need not be likely or realistic as long
as they are plausible enough stimulate a discussion on the advantages and disadvantages of
policy directions with respect to sustainability.
How can we compare the scenarios with respect to sustainability? The individual outcomes
described above were based on the sustainability assessment framework presented in
Chapter 1, and cited sources drawn directly from Table 1.2. This already establishes a link
between the storyline and the scientific literature. In order to make a more general
comparison across scenarios, we consulted the more synthetic Table 1.1 which provided a
simpler overview.
From this analysis we find that none of the three scenarios is a clear ‘winner’ in terms of
sustainability. Even diffuse development, usually labelled as sprawl, is not negative on all
counts. The wide variety of results and the futility of trying to balance fundamentally different
values (e.g. health, jobs, biodiversity) in a scientific manner means that one cannot tally the
results to obtain a net sustainability score, even within individual dimensions. Moreover, the
large number of ambiguous results (+/-) confirms that such aggregation would lead to
unfounded conclusions anyway. Most importantly, the scores were given on the basis of best
judgement of researchers, and do not reflect actual preferences of elected officials who are
charged with actually making the decisions in a particular territory. The weight given to
indicators is ultimately a political choice.
Looking closer at the economic dimension, a disciplinary bias might be present. The few
economic and ‘sprawl apologist’ studies consulted argue that diffuse development is closest
to market distribution, hence efficient and wealth-producing. Most of the other collected
sources disagree due to missed agglomeration effects, high energy and transportation costs
as well as the strain on public finance. The compact and polycentric scenarios score roughly
equally but in different categories. Regions suffering from stagnant housing production may
look more favourably on polycentric, for example, whereas those with severely limited
budgets may gravitate towards compact urbanization.
The ecological dimension presents a similar overall picture but is riddled with internal
dilemmas and feedback. For example, the lower overall pollution levels in compact and
polycentric is offset by higher concentrations. To make an educated policy decision, it is
therefore necessary to assess this trade off with respect to the local situation, for example, if
unhealthy concentrations have already been reached. Similarly, the ecological benefit of
conserving land through density in the compact and polycentric scenarios also implies less

ESPON / SUPER – Sustainable Urbanization and land-use Practices in European Regions / Interim Report
52
space for ecological services and renewable energy. Which route is most attractive will again
depend on local policy objectives. The diffuse scenario is generally negative on all
environmental indicators except space for water retention.
The social dimension, finally, presents a much different picture. Here, the diffuse scenario
does not lag behind the others, showing some clear advantages over the other two in terms of
individualistic indicators such as housing affordability and satisfaction with residential
environment. It fares less positively in terms of mixed-use areas and social inclusion.
Although urban containment should drive up housing prices, such policies are generally
implemented alongside affordable housing policies, which offsets this impact. Interestingly,
given the heightened interest in health with respect to COVID-19 pandemic, the results were
too mixed to offer any real guidance on this matter.
In conclusion, the scenarios and the assessment framework provide a way for decision-
makers and policymakers to talk about urbanization and land-use decisions. It opens up a
space for policymakers, and indeed everyone, to reflect on fundamental choices without
becoming mired in the minutiae of everyday struggles or notions of plausibility or feasibility.
As such it provides a structured forum for discussion, which can promote a common
understanding of long-term issues, find common ground, and pave the way to commitment to
strategic collective action.
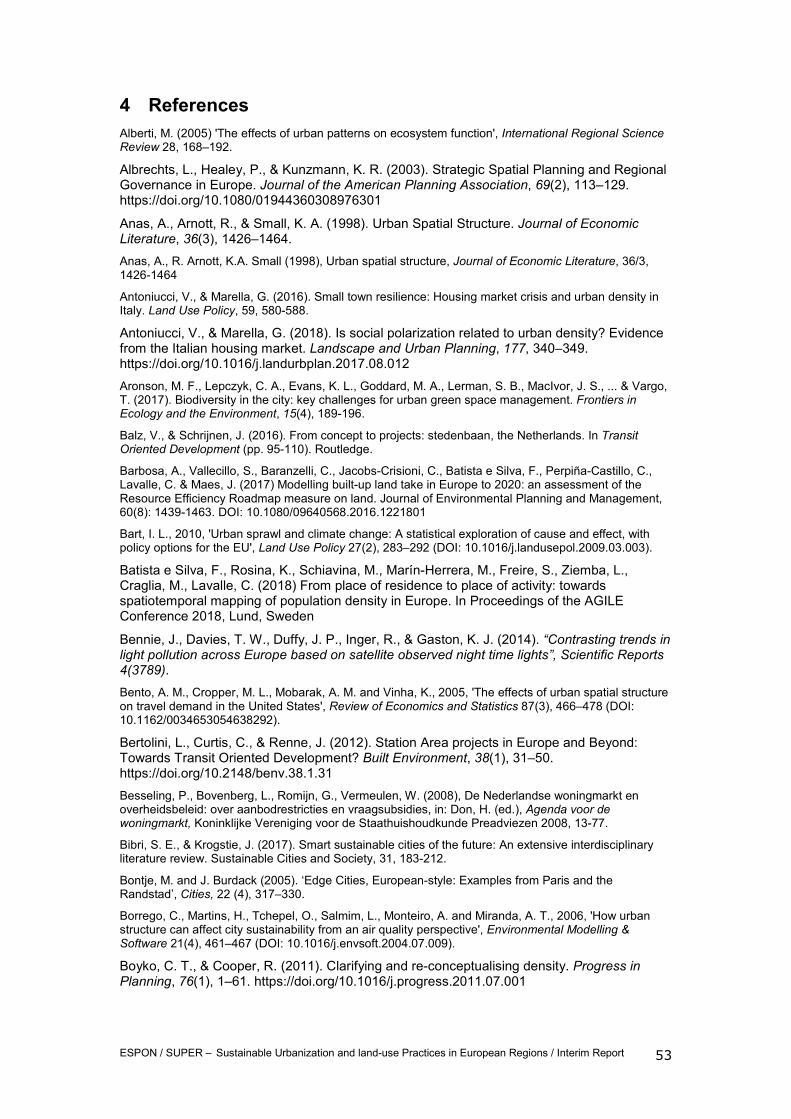
ESPON / SUPER – Sustainable Urbanization and land-use Practices in European Regions / Interim Report
53
4 References Alberti, M. (2005) 'The effects of urban patterns on ecosystem function', International Regional Science Review 28, 168–192.
Albrechts, L., Healey, P., & Kunzmann, K. R. (2003). Strategic Spatial Planning and Regional Governance in Europe. Journal of the American Planning Association, 69(2), 113–129. https://doi.org/10.1080/01944360308976301
Anas, A., Arnott, R., & Small, K. A. (1998). Urban Spatial Structure. Journal of Economic Literature, 36(3), 1426–1464. Anas, A., R. Arnott, K.A. Small (1998), Urban spatial structure, Journal of Economic Literature, 36/3, 1426-1464
Antoniucci, V., & Marella, G. (2016). Small town resilience: Housing market crisis and urban density in Italy. Land Use Policy, 59, 580-588.
Antoniucci, V., & Marella, G. (2018). Is social polarization related to urban density? Evidence from the Italian housing market. Landscape and Urban Planning, 177, 340–349. https://doi.org/10.1016/j.landurbplan.2017.08.012 Aronson, M. F., Lepczyk, C. A., Evans, K. L., Goddard, M. A., Lerman, S. B., MacIvor, J. S., ... & Vargo, T. (2017). Biodiversity in the city: key challenges for urban green space management. Frontiers in Ecology and the Environment, 15(4), 189-196.
Balz, V., & Schrijnen, J. (2016). From concept to projects: stedenbaan, the Netherlands. In Transit Oriented Development (pp. 95-110). Routledge.
Barbosa, A., Vallecillo, S., Baranzelli, C., Jacobs-Crisioni, C., Batista e Silva, F., Perpiña-Castillo, C., Lavalle, C. & Maes, J. (2017) Modelling built-up land take in Europe to 2020: an assessment of the Resource Efficiency Roadmap measure on land. Journal of Environmental Planning and Management, 60(8): 1439-1463. DOI: 10.1080/09640568.2016.1221801
Bart, I. L., 2010, 'Urban sprawl and climate change: A statistical exploration of cause and effect, with policy options for the EU', Land Use Policy 27(2), 283–292 (DOI: 10.1016/j.landusepol.2009.03.003).
Batista e Silva, F., Rosina, K., Schiavina, M., Marín-Herrera, M., Freire, S., Ziemba, L., Craglia, M., Lavalle, C. (2018) From place of residence to place of activity: towards spatiotemporal mapping of population density in Europe. In Proceedings of the AGILE Conference 2018, Lund, Sweden
Bennie, J., Davies, T. W., Duffy, J. P., Inger, R., & Gaston, K. J. (2014). “Contrasting trends in light pollution across Europe based on satellite observed night time lights”, Scientific Reports 4(3789). Bento, A. M., Cropper, M. L., Mobarak, A. M. and Vinha, K., 2005, 'The effects of urban spatial structure on travel demand in the United States', Review of Economics and Statistics 87(3), 466–478 (DOI: 10.1162/0034653054638292).
Bertolini, L., Curtis, C., & Renne, J. (2012). Station Area projects in Europe and Beyond: Towards Transit Oriented Development? Built Environment, 38(1), 31–50. https://doi.org/10.2148/benv.38.1.31 Besseling, P., Bovenberg, L., Romijn, G., Vermeulen, W. (2008), De Nederlandse woningmarkt en overheidsbeleid: over aanbodrestricties en vraagsubsidies, in: Don, H. (ed.), Agenda voor de woningmarkt, Koninklijke Vereniging voor de Staathuishoudkunde Preadviezen 2008, 13-77.
Bibri, S. E., & Krogstie, J. (2017). Smart sustainable cities of the future: An extensive interdisciplinary literature review. Sustainable Cities and Society, 31, 183-212.
Bontje, M. and J. Burdack (2005). ‘Edge Cities, European-style: Examples from Paris and the Randstad’, Cities, 22 (4), 317–330.
Borrego, C., Martins, H., Tchepel, O., Salmim, L., Monteiro, A. and Miranda, A. T., 2006, 'How urban structure can affect city sustainability from an air quality perspective', Environmental Modelling & Software 21(4), 461–467 (DOI: 10.1016/j.envsoft.2004.07.009).
Boyko, C. T., & Cooper, R. (2011). Clarifying and re-conceptualising density. Progress in Planning, 76(1), 1–61. https://doi.org/10.1016/j.progress.2011.07.001

ESPON / SUPER – Sustainable Urbanization and land-use Practices in European Regions / Interim Report
54
Brade, I., Herfert, G. and Wiest, K., 2009, 'Recent trends and future prospects of socio-spatial differentiation in urban regions of Central and Eastern Europe: A lull before the storm?', Cities 26(5), 233–244.
Broekman, POSAD, ECN (2017), Ruimtelijke verkenning energietransitie MRA, Amsterdam
Bruegmann, R., 2005, Sprawl — A compact history, New edition, University of Chicago Press.
Buitelaar, E., and Raspe, O. (2016), De verdeelde triomf, Ruimtelijke verkenningen 2016, Den Haag: PBL
Burby, R.J., Nelson, A.C., Parker, D., Handmer, J. (2001). Urban Containment Policy and Exposure to Natural Hazards: Is There a Connection?, Journal of Environmental Planning and Management, 44(4), 475–490.
Burriel de Orueta, E. L. (2009). Los límites del planeamiento urbanístico municipal. El ejemplo valenciano. Documents d’anàlisi Geogràfica, 54, 033–054. Burton, E., (2003). Housing for an Urban Renaissance: Implications for Social Equity, Housing Studies 18(4), 537–562.
Camagni, R., Cristina, M. G. and Rigamonti, P., 2002, 'Urban mobility and urban form: the social and environmental costs of different patterns of urban expansion', Ecological Economics 40(2), 199–216 (DOI: 10.1016/S0921-8009(01)00254-3).
Cao, M., Hickman, R. (2018). Car dependence and housing affordability: An emerging social deprivation issue in London?, Urban Studies 55(10), 2088-2105.
Cassiers, T., and C. Kesteloot (2012), Socio-spatial inequalities and social cohesion in European cities, Urban Studies, 49/9, 1909-1949
Cervero, R. (1998), The Transit Metropolis, Washington D.C./Covelo CA: The Island Press
Cheng, J., Bertolini, L. (2013). Measuring urban job accessibility with distance decay, competition and diversity, Journal of Transport Geography 30, 100-109.
Cheshire, P. (2018). Broken market or broken policy? The unintended consequences of restrictive planning. National Institute Economic Review, 245(1), R9-R19.
Cheshire, P. (2018). Broken market or broken policy? The unintended consequences of restrictive planning. National Institute Economic Review, 245(1), R9-R19. Clark, Mike, Paul Burall, and Peter Roberts (1993) A sustainable economy. In Planning for a sustainable environment, ed. Andrew Blowers. London: Earthscan.
Cheshire, P., Hilber, C. A., & Koster, H. R. (2018). Empty homes, longer commutes: the unintended consequences of more restrictive local planning. Journal of Public Economics, 158, 126-151.
Cheshire, P., Hilber, C., & Kaplanis, I. (2011). Land use planning: the impact on retail productivity. Centre for Economic Performance, LSE.
Cinyabuguma, M., & McConnell, V. (2013). Urban growth externalities and neighborhood incentives: Another cause of urban sprawl? Journal of Regional Science, 53(2), 332–348. Costal, G., Pickup, L. and Martino, V., 1988, 'Commuting — A further stress factor for working people: Evidence from the European Community', International Archives of Occupational and Environmental Health 60(5), 377–385.
Couch C., Sykes, O. & Börstinghaus, W. (2011) Thirty years of urban regeneration in Britain, Germany and France: the importance of context and path dependency. Progress in Planning 75, 1-52.
Couch, C., Petschel-Held, G., & Leontidou, L. (2008). Urban Sprawl in Europe: Landscape, Land-Use Change and Policy. John Wiley & Sons.
Cozzolino, S., Buitelaar, E., Moroni, S., & Sorel, N. (2017). Experimenting in Urban Self-organization. Framework-rules and Emerging Orders in Oosterwold (Almere, The Netherlands). 4(2), 11.
Dammers, E., van ’t Klooster, S., de Wit, B., Hilderink, H., & Petersen, A. (2013). Scenarios maken voor milieu, natuur en ruimte: Een handreiking. Planbureau voor de Leefomgeving. Daniels, T. L., Lapping, M., (2005) Land Preservation: An Essential Ingredient in Smart Growth, Journal of Planning Literature 19, 316-329.
Dawkins, C. J., & Nelson, A. C. (2002). Urban containment policies and housing prices: an international comparison with implications for future research. Land Use Policy, 19(1), 1-12.

ESPON / SUPER – Sustainable Urbanization and land-use Practices in European Regions / Interim Report
55
De Groot, H., Marlet, G., Teulings, C., Vermeulen, W. (2010), Stad en land, Den Haag: CPB.
De Jong, M., Joss, S., Schraven, D., Zhan, C., & Weijnen, M. (2015). Sustainable–smart–resilient–low carbon–eco–knowledge cities; making sense of a multitude of concepts promoting sustainable urbanization. Journal of Cleaner production, 109, 25-38.
de Nazelle, A., Morton, B. J., Jerrett, M., & Crawford-Brown, D. (2010). Short trips: An opportunity for reducing mobile-source emissions? Transportation Research Part D: Transport and Environment, 15(8), 451–457. https://doi.org/10.1016/j.trd.2010.04.012 Delmelle, E., & Nilsson, I. (2019). New rail transit stations and the out-migration of low-income residents. Urban Studies, 0042098019836631.
Dieleman, F., & Wegener, M. (2004). Compact city and urban sprawl. Built environment, 30(4), 308-323.
Duffy, A., 2009, 'Land use planning in Ireland — A life cycle energy analysis of recent residential development in the greater Dublin area', The International Journal of Life Cycle Assessment 14(3), 268–277 (DOI: 10.1007/s11367-009-0059-7).
Dura-Guimera, A., 2003, 'Population deconcentration and social restructuring in Barcelona, a European Mediterranean city', Cities 20(6), 387–394.
EEA and FOEN, 2011, Landscape fragmentation in Europe — Joint EEA–FOEN report, EEA Report No 2/2011, European Environment Agency, Swiss Federal Office for the Environment.
EEA, & FOEN. (2016). Urban sprawl in Europe. European Environment Agency and Swiss Federal Office for the Environment. http://bookshop.europa.eu/uri?target=EUB:NOTICE:THAL16010:EN:HTML EEA, 2006, Urban sprawl in Europe — The ignored challenge, EEA Report No 10/2006, European Environment Agency.
Eigenbrod, F., Bell, V. A., Davies, H. N., Heinemeyer, A., Armsworth, P. R. and Gaston, K. J., 2011, 'The impact of projected increases in urbanization on ecosystem services', Proceedings of the Royal Society of London B: Biological Sciences 278, 3201–3208 (DOI: 10.1098/rspb.2010.2754).
ESPON. (2006). Spatial Scenarios and Orientations in relation to the ESDP and Cohesion Policy. ESPON. Evers, D., E. Ben-Zadok, and A. Faludi (2000), “The Netherlands and Florida: Two Growth Management Strategies,” International Planning Studies, 5(1), pp. 7–23.
Ewing, R. (1997), Is Los Angeles-style sprawl desirable? Journal of the American Planning Association, 63/1, 107-126
Ewing, R., Hamidi, S., Grace, J.B., Wei, Y.D. (2016). Does urban sprawl hold down upward mobility?, Landscape and Urban Planning 148, 80-88.
Ewing, R., Pendall, R. and Chen, D., 2003, 'Measuring sprawl and its transportation impacts', Transportation Research Record: Journal of the Transportation Research Board 1831(1), 175–183.
Faludi, A. (2018). The Poverty of Territorialism: A Neo-Medieval View of Europe and European Planning. Edward Elgar Publishing. Fishman, R. (1987) Bourgeois Utopias: the rise and fall of suburbia, Basic Books, New York.
Frumkin, H., Frank, L. and Jackson, R. J., 2004, Urban sprawl and public health — Designing, planning, and building for healthy communities, 1st ed, Island Press, Washington, DC.
Fuller, R. A., & Gaston, K. J. (2009). The scaling of green space coverage in European cities. Biology letters, 5(3), 352-355.
Fusco Girard, L. (2013). Toward a smart sustainable development of port cities/areas: The role of the “Historic Urban Landscape” approach. Sustainability, 5(10), 4329-4348.
Galster, G., Hanson, R., Ratcliffe, M. R., Wolman, H., Coleman, S., & Freihage, J. (2001). Wrestling sprawl to the ground: defining and measuring an elusive concept. Housing policy debate, 12(4), 681-717.
García-Coll, A., & López-Villanueva, C. (2018). The Impact of Economic Crisis in Areas of Sprawl in Spanish Cities. Urban Science, 2(4), 113. https://doi.org/10.3390/urbansci2040113 Garden, F. and Jalaludin, B., (2009). Impact of urban sprawl on overweight, obesity, and physical activity in Sydney, Australia, Journal of Urban Health 86(1), 19–30.
ESPON / SUPER – Sustainable Urbanization and land-use Practices in European Regions / Interim Report
56
Gielen, E., Riutort-Mayol, G., Miralles i Garcia, J. L., & Palencia Jiménez, J. S. (2019). Cost assessment of urban sprawl on municipal services using hierarchical regression. Environment and Planning B: Urban Analytics and City Science, 239980831986934. https://doi.org/10.1177/2399808319869345 Giezen, M., Balicki, S., Arundel, R. (2018). Using Remote Sensing to Analyse Net Land-Use Change from Conflicting Sustainability Policies: The Case of Amsterdam, ISPRS International Journal of Geo-information 7,381.
Glaeser, E. (2011), Triumph of the city, NY: Penguin Press
Glaeser, E. and M.E. Kahn (2010), The greenness of cities: Carbon dioxide emissions and urban development, Journal of Urban Economics, 67-3, 404-418.
Gordon, P., and H.W. Richardson (1997), Are Compact Cities a Desirable Planning Goal? Journal of the American Planning Association, 63/1, 95-106
Guthrie, A., & Fan, Y. (2016). Developers' perspectives on transit-oriented development. Transport Policy, 51, 103-114.
Guthrie, A., & Fan, Y. (2016). Developers’ perspectives on transit-oriented development. Transport Policy, 51, 103–114. https://doi.org/10.1016/j.tranpol.2016.04.002 Haber, W., 2007, 'Energy, food, and land — The ecological traps of humankind', Environmental Science and Pollution Research International 14(6), 359–365.
Hall, P. (2014). Cities of Tomorrow: An Intellectual History of Urban Planning and Design Since 1880. Wiley-Blackwell. Hamin, E.M., Gurran, N. (2009). Urban form and climate change: Balancing adaptation and mitigation in the U.S. and Australia, Habitat International 33, 238-245.
Handy, S. (2005). Smart growth and the transportation-land use connection: What does the research tell us? International Regional Science Review, 28(2), 146–167.
Hautamäki, R. (2019). Contested and constructed greenery in the compact city: A case study of the Helsinki city plan 2016. Journal of Landscape Architecture, 2019(1), 20–29. Hennig, E. I., Schwick, C., Soukup, T., Orlitová, E., Kienast, F., & Jaeger, J. A. (2015). Multi-scale analysis of urban sprawl in Europe: Towards a European de-sprawling strategy. Land Use Policy, 49, 483-498.
Hoppenbrouwer, E., & Louw, E. (2005). Mixed-use development: Theory and practice in Amsterdam's Eastern Docklands. European Planning Studies, 13(7), 967-983.
Hortas-Rico, M., & Solé-Ollé, A. (2010). ’Does urban sprawl increase the costs of providing local public services? Studies, 47(7), 1513–1540.
Howley, P. (2009). “Attitudes towards compact city living: Towards a greater understanding of residential behaviour”, Land Use. Policy, 26(3), 792–798. Howley, P., 2009, 'Attitudes towards compact city living: Towards a greater understanding of residential behaviour', Land Use Policy 26(3), 792–798.
Huang, H., & Tang, Y. (2012). Residential land use regulation and the US housing price cycle between 2000 and 2009. Journal of Urban Economics, 71(1), 93–99.
Ingram, G.K. (1998), Patterns of metropolitan development: what have we learned?. Urban Studies 35/7, 1019-1035.
Jabareen, Y. R. (2006). Sustainable urban forms: Their typologies, models, and concepts. Journal of planning education and research, 26(1), 38-52.
Jackson, Kenneth T. (1985) Crabgrass Frontier: the suburbanization of the United States, Oxford University Press, Oxford.
Jacobs, J. (1961). The Death and Life of Great American Cities. Vintage.
Jacobs-Crisioni, C., Lavalle, C., Baranzelli, C., Perpiña Castillo, C. (forthcoming) Luisetta: a light version of the LUISA modelling framework. Report in preparation, European Commission, Joint Research Centre.

ESPON / SUPER – Sustainable Urbanization and land-use Practices in European Regions / Interim Report
57
Jansma, J. E., Veen, E., Dekking, A., & Visser, A. (2013, May 23). Urban Agriculture: How to Create a Natural Connection between the Urban and Rural Environment in Almere Oosterwold (NL). REAL CORP 2013. Jehling, M., Hecht, R., & Herold, H. (2018). Assessing urban containment policies within a suburban context—An approach to enable a regional perspective. Land use policy, 77, 846-858.
Jones, C. and Kammen, D. M., 2014, 'Spatial distribution of U.S. household carbon footprints reveals suburbanization undermines greenhouse gas benefits of urban population density', Environmental Science & Technology 48(2), 895–902 (DOI: 10.1021/es4034364).
Kenworthy, J. R. (2006). The eco-city: Ten key transport and planning dimensions for sustainable city development. Environment and Urbanization, 18(1), 67–85. Kenworthy, J. R., Laube, F. B., Newman, P., Barter, P., Raad, T., Poboon, C. and Guia Jr, B., 1999, 'An international sourcebook of automobile dependence in cities 1960–1990' (http://trid.trb.org/view.aspx?id=648499).
Kenyon, S. (2011). Transport and social exclusion: Access to higher education in the UK policy context. Journal of Transport Geography, 19(4), 763–771. https://doi.org/10.1016/j.jtrangeo.2010.09.005
Klug, S., & Hayashi, Y. (2012). ’Urban Sprawl and local infrastructure in Japan. And Germany’, Journal of Infrastructure Systems, 18(4), 232–241.
Knowles, R. D. (2012). Transit Oriented Development in Copenhagen, Denmark: From the Finger Plan to Ørestad. Journal of Transport Geography, 22, 251–261. https://doi.org/10.1016/j.jtrangeo.2012.01.009 Knowles, R. D. (2012). Transit oriented development in Copenhagen, Denmark: from the finger plan to Ørestad. Journal of transport Geography, 22, 251-261.
Kompil M. et al. (2015) European cities: territorial analysis of characteristics and trends - An application of the LUISA Modelling Platform. Ispra: JRC. doi:10.2788/737963. Kuiper, R. and D. Evers (2011) Ruimtelijke opgaven in beeld achtergronden bij de ex-ante evaluatie structuurvisie infrastructuur en ruimte, Den Haag: PBL.
Laughlin, R.B. (2012). Land use regulation: Where have we been, where are we going?, Cities 29, S50-S55.
Litman, T. (2019). Guide to Valuing Walking and Cycling Improvements and Encouragement Programs (p. 88). Victoria Transit Policy Institute. Longley, P., Batty, M., Chin, N. (2002). Sprawling Cities and Transport: preliminary findings from Bristol, UK, University College London, Centre for Advanced Spatial Analysis and Department of Geography.
Lörzing, H., Klemm, W., van Leeuwen, M., & Soekimin, S. (2006). Vinex! Een morfologische verkenning. Ruimtelijk Planbureau.
Marco Broekman, POSAD, & ECN. (2017). Ruimtelijke verkenning energietransitie MRA, Amsterdam. MRA. Margarita, A., Evangelos, G., & Aristotelis, N. (2017). The effect of major market and societal trends on public transport in European cities. Transportation research procedia, 24, 105-112.
Mayer, C. J., & Somerville, C. T. (2000). Land use regulation and new construction. Regional Science and Urban Economics, 30(6), 639–662.
Meijers, E. (2005). Polycentric Urban Regions and the Quest for Synergy: Is a Network of Cities More than the Sum of the Parts? Urban Studies, 42(4), 765–781. https://doi.org/10.1080/00420980500060384
Millward, H. (2006). Urban containment strategies: A case-study appraisal of plans and policies in Japanese, British, and Canadian cities. Land Use Policy, 23(4), 473–485. https://doi.org/10.1016/j.landusepol.2005.02.004 Montgomery, C. (2013) Happy City: transforming our lives through urban design, Penguin Books: New York.

ESPON / SUPER – Sustainable Urbanization and land-use Practices in European Regions / Interim Report
58
Morency, C., Trépanier, M., & Demers, M. (2011). Walking to transit: An unexpected source of physical activity. Transport Policy, 18(6), 800–806. https://doi.org/10.1016/j.tranpol.2011.03.010 Moudon, A.V. (2009), Real noise from the urban environment: how ambient community noise affects health and what can be done about it. American Journal of Preventive Medicine, 37-2, 167-171.
Naess, P. (2006). Urban Structure Matters: Residential Location, Car Dependence and Travel Behaviour. Routledge. Navara, K. J. and Nelson, R. J., 2007, 'The dark side of light at night: Physiological, epidemiological, and ecological consequences', Journal of Pineal Research 43(3), 215–224 (DOI: 10.1111/j.1600-079X.2007.00473.x).
Nelson, A., Dawkins, P. C. J., & Sanchez, P. T. W. (2007). The Social Impacts of Urban Containment. Ashgate. Nelson, A.C., Dawkins, C.J., Sanchez, T.W. (2004) Urban Containment and Residential Segregation: A Preliminary Investigation, Urban studies 41, 423-439.
Newman, P., & Kenworthy, J. (1999). Sustainability and cities: Overcoming automobile dependence. Newman, P., Kenworthy, J. (1999) Sustainability and cities: overcoming automobile dependence. Island Press.
Nilsson, I., & Delmelle, E. C. (2018). Transit investments and neighborhood change: On the likelihood of change. Journal of Transport Geography, 66, 167–179. Nordregio, Austrian Institute for Spatial Planning & OTB Research for the Built Environment, Delft University of Technology (2016). Co-creating Attractive and Sustainable Urban Areas and Lifestyles: Exploring new forms of inclusive urban governance, Synthesis Report from the CASUAL Project, Stockholm: Nordregio.
Norman, J., MacLean, H. L., & Kennedy, C. A. (2006). Comparing High and Low Residential Density: Life-Cycle Analysis of Energy Use and Greenhouse Gas Emissions. Journal of Urban Planning and Development, 132(1), 10–21. https://doi.org/10.1061/(ASCE)0733-9488(2006)132:1(10) OECD (2012), Compact City Policies: A Comparative Assessment, OECD Green Growth Studies, OECD Publishing. Available from: htpp://dx.doi.org/10.1787/9789264167865-en
OECD (2018), Rethinking Urban Sprawl: Moving Towards Sustainable Cities, OECD Publishing, Paris. http://dx.doi.org/10.1787/9789264189881-en
Oueslati, W., Alvanides, S., & Garrod, G. (2015). Determinants of urban sprawl in European cities. Urban Studies, 52(9), 1594–1614. https://doi.org/10.1177/0042098015577773
Owen, D. (2009). Green Metropolis. Why Living Closer, and Driving Less Are the Keys to Sustainability. Carcinogenesis, 34, 368.
Pagliarin, S. (2018). Linking processes and patterns: Spatial planning, governance and urban sprawl in the Barcelona and Milan metropolitan regions. Urban Studies, 55(16), 3650–3668. https://doi.org/10.1177/0042098017743668
Papa, E., & Bertolini, L. (2015). Accessibility and Transit-Oriented Development in European metropolitan areas. Journal of Transport Geography, 47, 70–83. https://doi.org/10.1016/j.jtrangeo.2015.07.003 Pauleit, S., Ennos, R. and Golding, Y., 2005, 'Modeling the environmental impacts of urban land use and land cover change — A study in Merseyside, UK', Landscape and Urban Planning 71(2–4), 295–310 (DOI: 10.1016/j.landurbplan.2004.03.009).
Paulsson, A. (2020). The city that the metro system built: Urban transformations and modalities of integrated planning in Stockholm. Urban Studies, 004209801989523. https://doi.org/10.1177/0042098019895231 Pizarro, R. (2009). Urban form and climate change: towards appropriate development patterns to mitigate and adapt to global warming. In Planning for Climate Change (pp. 57-69). Routledge.

ESPON / SUPER – Sustainable Urbanization and land-use Practices in European Regions / Interim Report
59
Pojani, D., & Stead, D. (2015). Transit-Oriented Design in the Netherlands. Journal of Planning Education and Research, 35(2), 131–144. https://doi.org/10.1177/0739456X15573263
Pooley, C. G., & Turnbull, J. (2000). Modal choice and modal change: The journey to work in Britain since 1890. Journal of Transport Geography, 8(1), 11–24. https://doi.org/10.1016/S0966-6923(99)00031-9 Power, A., 2001, 'Social exclusion and urban sprawl: Is the rescue of cities possible?', Regional Studies 35(8), 731–742 (DOI: 10.1080/00343400120084713).
Rajamani, J., Bhat, C. R., Handy, S., Knaap, G., & Song, Y. (2003). Assessing Impact of Urban Form Measures on Nonwork Trip Mode Choice After Controlling for Demographic and Level-of-Service Effects. Transportation Research Record, 1831(1), 158–165. https://doi.org/10.3141/1831-18 Ratner, K. A., & Goetz, A. R. (2013). The reshaping of land use and urban form in Denver through transit-oriented development. Cities, 30, 31-46.
Renne, J., J. Wells, A. Voorhees, and E. Bloustein. 2005. Transit-Oriented Development: Developing a Strategy to Measure Success. Transportation Research Board. Research results digest 294, Washington, DC.
RERC (1974) The costs of sprawl, Real Estate Research Corporation.
Rich, C. and Loncore, T., 2006, Ecological consequences of artificial light, Island Press.
Robertson, James (1990) “Alternative futures for cities” In: The living city: Towards a sustainable future, ed. David Cadman and Geoffrey K. Payne, 127-35. London: Routledge & Kegan.
Rosenthal, S. S., & Strange, W. C. (2008). The attenuation of human capital spillovers. Journal of Urban Economics, 64(2), 373–389. https://doi.org/10.1016/j.jue.2008.02.006 Rosina, K., F. Batista e Silva, P. Vizcaino, M. Herrera, S. Freire & M. Schiavina (2018) Increasing the detail of European land use/cover data by combining heterogeneous data sets. International Journal of Digital Earth. DOI: 10.1080/17538947.2018.1550119
Rusk, D. (1999). Inside Game Outside Game: Winning Strategies for Saving Urban America. Brookings Institution Press. Salat, S., Ollivier, G. 2017. Transforming the Urban Space through Transit-Oriented Development: The 3V Approach. World Bank, Washington, DC. © World Bank. https://openknowledge.worldbank.org/handle/10986/26405 License: CC BY 3.0 IGO
Scalenghe, R. and Marsan, F. A., 2009, 'The anthropogenic sealing of soils in urban areas', Landscape and Urban Planning 90(1–2), 1–10 (DOI: 10.1016/j.landurbplan.2008.10.011).
Shochat, E., Lerman, S. B., Anderies, J. M., Warren, P. S., Faeth, S. H. and Nilon, C. H., 2010, 'Invasion, competition, and biodiversity loss in urban ecosystems', BioScience 60(3), 199–208 (DOI: 10.1525/bio.2010.60.3.6).
Sider, T., Alam, A., Zukari, M., Dugum, H., Goldstein, N., Eluru, N., & Hatzopoulou, M. (2013). Land-use and socio-economics as determinants of traffic emissions and individual exposure to air pollution. Journal of Transport Geography, 33, 230-239.
Slabbekoorn, H. and Peet, M., 2003, 'Ecology: Birds sing at a higher pitch in urban noise', Nature 424(6946), 267–267 (DOI: 10.1038/424267a).
Snellen, D., H. Hilbers & A. Hendriks (2005) Nieuwbouw in beweging. Een analyse van het ruimtelijk mobiliteitsbeleid van Vinex, Rotterdam/Den Haag: Nai Uitgevers/Ruimtelijk Planbureau.
Soga, M., Yamaura, Y., Koike, S., & Gaston, K. J. (2014). Land sharing vs. Land sparing: Does the compact city reconcile urban development and biodiversity conservation?, Journal of Applied Ecology 51, 1378–1386. Stewart, D., Sirr, L., Kelly, R. (2006) Smart Growth: A Buffer Zone Between Decentrist And Centrist Theory? International Journal of Sustainable Development 1, 1-13.
Stone, B., Hess, J. J., & Frumkin, H. (2010). Research urban form and extreme heat events: Are sprawling cities more vulnerable to climate change than compact cities? Environmental Health Perspectives, 118(10), 1425–1428.

ESPON / SUPER – Sustainable Urbanization and land-use Practices in European Regions / Interim Report
60
Storper, M., & Venables, A. J. (2004). Buzz: Face-to-face contact and the urban economy. Journal of Economic Geography, 4(4), 351–370. https://doi.org/10.1093/jnlecg/lbh027 Sushinsky, J.R., Rhodes, J.R., Possingham, H.P., Gill, T.K., Fuller, R.A. (2013). How should we grow cities to minimize their biodiversity impacts?, Global Change Biology 19, 401-410. doi: 10.1111/gcb.12055
Talen, E., Wheeler, S. M., & Anselin, L. (2018). The social context of US built landscapes. Landscape and urban planning, 177, 266-280.
Throgmorton, J. A. (1996). Planning as persuasive storytelling: The rhetorical construction of Chicago’s electric future. University of Chicago Press. Thurston, L. and Yezer, A. M. J., 1994, 'Causality in the suburbanization of population and employment', Journal of Urban Economics 35(1), 105–118 (DOI: 10.1006/juec.1994.1006).
Tratalos, J., Fuller, R. A., Warren, P. H., Davies, R. G., & Gaston, K. J. (2007). Urban form, biodiversity potential and ecosystem services. Landscape and Urban Planning, 83, 308-317.
Travisi, C. M., Camagni, R. and Nijkamp, P., 2010, 'Impacts of urban sprawl and commuting: A modelling study for Italy', Journal of Transport Geography 18(3), 382–392.
Tu, J., Xia, Z.-G., Clarke, K. C. and Frei, A., 2007, 'Impact of urban sprawl on water quality in eastern Massachusetts, USA', Environmental Management 40(2), 183–200 (DOI: 10.1007/s00267-006-0097-x).
Van Der Waals, J. (2000). The compact city and the environment: A review. Tijdschrift Voor Economische En Sociale Geografie, 91(2), 111–121. https://doi.org/10.1111/1467-9663.00099 Van der Wouden, R. (ed.), De ruimtelijke metamorfose van Nederland, Rotterdam – Den Haag: nai010 - PBL
van Lierop, D., Maat, K., & El-Geneidy, A. (2017). Talking TOD: Learning about transit-oriented development in the United States, Canada, and the Netherlands. Journal of Urbanism: International Research on Placemaking and Urban Sustainability, 10(1), 49–62. https://doi.org/10.1080/17549175.2016.1192558 van Lierop, D., Maat, K., & El-Geneidy, A. (2017). Talking TOD: Learning about transit-oriented development in the United States, Canada, and the Netherlands. Journal of Urbanism: International Research on Placemaking and Urban Sustainability, 10(1), 49-62.
Waitt, G. and Harada, T., 2012, 'Driving, cities and changing climates', Urban Studies 49(15), 3 307–3 325 (DOI: 10.1177/0042098012443858).
Weller, R., Drodz, Z., & Kjaersgaard, S. P. (2019). Hotspot cities: Identifying peri-urban conflict zones. Journal of Landscape Architecture, 2019(1), 8–19. Wells, N.M., and G.W. Evans (2003), Nearby nature, a buffer of life stress among rural children, Environment and Behavior, 35/3, 3011-330.
Westerink, J., Haase, D., Bauer, A., Ravetz, J., Jarrige, F., & Aalbers, C. B. (2013). Dealing with sustainability trade-offs of the compact city in peri-urban planning across European city regions. European Planning Studies, 21(4), 473–497. White, M. P., Pahl, S., Ashbullby, K., Herbert, S. and Depledge, M. H., 2013, 'Feelings of restoration from recent nature visits', Journal of Environmental Psychology 35, 40–51 (DOI: 10.1016/j.jenvp.2013.04.002).
Wilson, B. and Chakraborty, A., 2013, 'The environmental impacts of sprawl: Emergent themes from the past decade of planning research', Sustainability 5(8), 3302–3327 (DOI: 10.3390/su5083302).
Wintershoven, L., (2000). Demografisch eeuwboek Amsterdam, Ontwikkelingen tussen 1900 en 2000, Amsterdam, dienst Ruimtelijke ordening.
Wolch, J. R., Byrne, J., & Newell, J. P. (2014). Urban green space, public health, and environmental justice: The challenge of making cities ‘just green enough’, Landscape and Urban Planning 125, 234-244. Wolch, J.R., Byrne, J., Newell, J.P. (2014). Urban green space, public health, and environmental justice: The challenge of making cities ‘just green enough’, Landscape and Urban Planning 125, 234-244.

ESPON / SUPER – Sustainable Urbanization and land-use Practices in European Regions / Interim Report
61
Xie, Y., Gong, H., Lan, H., & Zeng, S. (2018). Examining shrinking city of Detroit in the context of socio-spatial inequalities. Landscape and Urban Planning, 177, 350–361. https://doi.org/10.1016/j.landurbplan.2018.03.002 Zhou, B., Rybski, D., & Kropp, J. P. (2017). The role of city size and urban form in the surface urban heat island. Scientific reports, 7(1), 4791.
Ziobro, A. (2019). Urban Sprawl in the Context of Cracow City Limit. In IOP Conference Series: Materials Science and Engineering (Vol. 471, No. 11, p. 112036). IOP Publishing.
Zonneveld, W. (2007). “Unraveling Europe’s Spatial Structure through Spatial Visioning”, pp.191-208 in: A. Faludi (2007) (ed.), Territorial Cohesion and the European Model of Society, Cambridge, MA: Lincoln Institute of Land Policy. Zygiaris, S. (2013). Smart city reference model: Assisting planners to conceptualize the building of smart city innovation ecosystems. Journal of the Knowledge Economy, 4(2), 217-231.
ESPON / SUPER – Sustainable Urbanization and land-use Practices in European Regions / Interim Report
62
ISBN: 978-2-919795-39-0
ESPON 2020 – More information
ESPON EGTC 4 rue Erasme, L-1468 Luxembourg - Grand Duchy of Luxembourg Phone: +352 20 600 280 Email: [email protected] www.espon.eu, Twitter, LinkedIn, YouTube
The ESPON EGTC is the Single Beneficiary of the ESPON 2020 Cooperation Programme. The Single Operation within the programme is implemented by the ESPON EGTC and co-financed by the European Regional Development Fund, the EU Member States and the Partner States, Iceland, Liechtenstein, Norway and Switzerland.