SUNY Spring 2011 Report Card
44
REPORT CARD 2011 the Power of
-
Upload
marcel-catafago -
Category
Documents
-
view
216 -
download
3
description
Initial SUNY-wide report card for SUNY Spring 2011
Transcript of SUNY Spring 2011 Report Card

REPORT CARD 2011
thePower of

When we launched The Power of SUNY in April
2010, we committed the resources of SUNY to
a singular goal — to drive New York’s economic
revitalization and enhanced quality of life. We
promised to build a better SUNY, while staying
focused on our three-part mission — To Learn,
To Search, To Serve. We also proclaimed
This Report Card is a product of that promise. Through it, we embrace our public mission to
“move the dial” in a positive direction regarding critical social issues facing the state, the nation,
and the world. And we are embracing accountability by laying out our goals — small and big, immediate
and long-term — and asking New Yorkers to hold us accountable.
This document is the culmination of intense discussion and research by more than 300
scholars, experts, and other stakeholders who make up what we call our Innovation Teams — one
for each of our Six Big Ideas — and Transformation Teams — seven groups aligned to our objective of
internal improvement. Many of New York’s best and brightest in their fields, representing SUNY’s vast
institutional diversity, academic breadth, and geographic reach, volunteered for a true team effort.
These teams continue to serve as a central implementation mechanism for The Power of SUNY. Their
steadfast service and unwavering commitment to the plan are crucial to its success. Development
of the Report Card, like that of The Power of SUNY itself, was unprecedented in its inclusivity and
aggressive in its approach. True to form, we think you’ll find the metrics used to measure our success
to be equally encompassing and ambitious.
No other institution of higher education in the country is taking itself to task in such a
comprehensive, explicit, and transparent manner. The level of public accountability provided by this
Report Card is truly a first for SUNY, for New York, and for the nation.
Thank you for taking this journey with us.
Nancy L. Zimpher
Chancellor, The State University of New York
Six Big Ideas:
SUNY and the Entrepreneurial Century
SUNY and the Seamless Education Pipeline
SUNY and a Healthier New York
SUNY and an Energy-Smart New York
SUNY and the Vibrant Community
SUNY and the World
Finally, we vowed to use data to carry out the plan
in an absolutely transparent and responsible manner.
Letter from the Chancellor

Report Card GuideAs noted, the purpose of this Report Card is to monitor our progress in implementing The Power of SUNY. While a unique endeavor among systems of higher education, the effort is
not intended simply as an exercise in self-promotion, nor should the reader ascribe a punitive quality to the Report Card — we are not scoring our performance for purposes of
assigning failing grades or meting out negative consequences. Instead, given the tremendous effort in developing the strategic plan, our deep commitment to its goals, and our philosophy of
constant improvement, it only seems fitting that we measure our progress.
Moreover, as a self-assessment and progress tool, SUNY’s Report Card has the added benefit of “telling our story” and documenting our contribution to New York State’s health and
vitality in a concise and efficient manner. To this end, the Report Card can further our advocacy efforts with policy makers and external stakeholders, thus helping advance our cause
of increased state support and regulatory flexibility.
I. FORMATWe have divided our Report Card into three sections:
A Competitive SUNY, which brings to life our Power
of SUNY commitment to building a better university;
Diversity Counts, which tracks our commitment
to building upon our rich tradition of providing
opportunity to traditionally underserved populations
and better preparing students for the myriad of
complex issues they will face as the next generation
of state, national, and international leaders; and
A Competitive New York, which tracks our progress
in implementing the strategies associated with our
Six Big Ideas. In each section, you will find metrics
that represent national best practices and objective
data designed to hold us accountable to the task
of driving New York’s economic recovery. Numbers
throughout this document are rounded for ease of
reading. In some places that means totals and sub-
categories do not match exactly.
As our data collection becomes more sophisticated and we experience progress, we anticipate
the metrics will be displayed in a more consistent way.
Finally, this Report Card represents our commitment to constant improvement toward implementation
of The Power of SUNY. Metrics that show improvement over time will also demonstrate progress
toward implementation. The establishment of targets or goals, based upon national standards, will
better help us understand the context and pace of our progress. Accordingly, future editions of this
Report Card will include specific targets for improvement, based upon national trends and data.
SUNY’s Report Card represents a work in progress. It will improve with time,
experience, and feedback that you, as the reader, provide.II. THE EVOLUTIONARY NATURE OF THE REPORT CARDThe Report Card you see today will most certainly
evolve over the course of the next several years.
In fact, this first edition represents our baseline
year wherein we establish the place from which
we begin to show progress and improvement.
We also fully anticipate that over time, new metrics
will be added and others abandoned. Certainly, core
metrics, particularly those that track standard and
well-accepted measures will remain constant. In
other areas, however, experience will teach us
something about gaps in precision, areas for
improvement, and measures that do not actually
track real progress.
Throughout this report, you will also see
a metric defined, but without associated data.
In such instances, we have identified a metric
we believe is important to track, but for which
we lack data today. Our commitment is to develop
the necessary processes or systems to collect
this data in a timely fashion and to incorporate
the results of this work into future editions of the
Report Card.
You will also note that the metrics chosen for
this Report Card do not measure progress in
exactly the same way. Throughout the document
you will see a mix of hard numbers and percentages,
as well as measures that assess processes instead
of outcomes. In each case, we have tried to choose
metrics that best advance the achievement of the
goal in question.
III. DEFINITIONS & KEYThis document represents data summarized over
the entire State University of New York System.
In addition, each of the following definitions will
assist you in reading and understanding the
significance of our Report Card:
BASELINE DATA: Assesses SUNY’s status in terms
of data available for the 2008–2009 academic year,
except where noted.
OUTPUT METRIC: A metric that tracks progress
toward achieving a particular goal.
PROCESS METRIC: A metric that tracks
progress toward implementing a process,
program, or system that is critical to achieving
a particular goal.
WORK-IN-PROGRESS METRIC: A metric for which
data is not readily available.
CONDITION MEASURE: Sometimes referred to as
a “top-line metric,” this measure, included in each
of the Six Big Idea sections, efficiently defines the
overall issue or societal condition SUNY seeks to
influence by making progress on the metrics
specified in each section. Generally the condition
is not something SUNY can control by itself
because improvement requires action from a
multitude of institutions, policy makers, and
individuals. Instead, by moving the dial for the
metrics identified in each of the Six Big Idea
sections, SUNY has the ability to positively impact
the condition and influence change.
Denotes: OUTPUT METRIC
Denotes: PROCESS METRIC
Denotes: SUNY WORK IN PROGRESS
Denotes: CONDITION MEASURE

A COMPETITIVE SUNY
By building a better SUNY, we not only improve upon the delivery of our core mission, but also better
enable implementation of the strategic plan. Accordingly, the metric set forth in A Competitive SUNY
tracks our progress in improving the delivery of our core mission — To Learn, To Search, To Serve.
In selecting these metrics, we looked to national best practices and existing databases to inform our
thinking. In this section you will find the essential measurements that define modern public higher
education. SUNY’s strength is rooted in its connectedness as a system, so throughout this document
you will find data for the entire University, along with specific aspects for our specialized components.
• TO LEARN
• TO SEARCH
• TO SERVE
• STUDENTS AND FACULTY
• FINANCIAL HEALTH

To Learn
GRADUATION RATES
FIRST TIME, FULL-TIME BACHELOR’S DEGREE
TRANSFER ASSOCIATE’S DEGREE OR CERTIFICATE
TRANSFER BACHELOR’S DEGREE
FIRST TIME, FULL-TIME ASSOCIATE’S DEGREE OR CERTIFICATE
88%
55%
62%
26%
83%
61%
76%
75%
61%
24%
77%
56%
RETENTION RATESSUNY SUCCESS
SUNY SUCCESSTraditional measures of graduation rates do not
take into consideration students who elect to make
certain transfer decisions. Because transfer is such
an important aspect of SUNY’s system, we developed
this measurement to quantify the rates at which
our students earn degrees or certificates within the
standard time frame regardless of transfer behavior.
In other words, this item measures; 1) students who
stay at one SUNY school; 2) students who transfer
between two or more four-year schools; or 3)
students who transfer between two or more two-
year schools.
GRADUATION RATESGraduation rate is the percentage of students
entering college for the first time in a full-time
capacity with the intention of earning a degree or
certificate and are successful in a specific amount
to time — for an associate’s degree that time frame
is three years; for a bachelor’s degree it is six years.
RETENTION RATESIn order to graduate, students must first return
for their second year in college. Retention rates
count the percentage of students entering college
for the first time in a full-time capacity returning
for year two.
A COMPETITIVE SUNY

COURSES AVAILABLE ONLINE The ability to take courses online is increasingly important:
here we intend to track their availability.
STUDENTS ENGAGED IN INTERNSHIPS AND COOPERATIVE EDUCATIONWork experience is an important enrichment
activity for our students, and we strongly believe
in encouraging internships. We think this is
important to our students and the future economy
of the state. Similarly, co-op education (a paid
internship while students earn credit toward their
degree) is an important strategy to improve college
completion to scale statewide.
RECRUITMENT AND ENROLLMENT OF STUDENTS FROM HISTORICALLY UNDERREPRESENTED POPULATIONSOur commitment to, and belief in, the power of diversity is at the very core of SUNY’s mission and
the reason for its creation. We are very focused on creating diversity opportunities. Access to
higher education is critical, and so we must hold ourselves accountable for reaching out to AND
attracting students from historically underrepresented populations. In future years we will be adding
economically disadvantaged populations to this item.
39,000 applications from historically underrepresented populations vs. 143,000 total applications
To be comparable to applications, enrollment is for entering students in the fall of 2008.
22,000 students enrolled from historically underrepresented populations vs. 122,000 total new enrollment
STEM GRADUATESIn the knowledge economy, STEM credentials — a degree in science, technology, engineering, or math
— are increasingly valuable to the individual. Some have gone so far as to say that a strong corps of
STEM graduates is critical to our nation’s future prosperity and security.
9,940 STEM Graduates
STUDENT/FACULTY RATIOSThe number of students per faculty member,
adjusted to represent a full-time assignment.
STATE-OPERATED CAMPUSES
COMMUNITY COLLEGES
15.6:1*
20.5:1
NOTE: *This figure includes highly labor-intensive clinical and research faculty; for example, academic health science center faculty rations are by necessity considerably lower. In future years, we may consider alternate configurations of this element.
NON-TRANSFER BACHELOR’S DEGREE
TRANSFER BACHELOR’S DEGREE
NON-TRANSFER ASSOCIATE’S DEGREE
TRANSFER ASSOCIATE’S DEGREE
133
70
135
71
NUMBER OF CREDITS AT GRADUATIONOne in three SUNY students is a transfer student,
meaning these students attend more than one
college in the course of their higher-education
career before completing a degree. Therefore, the
ability to seamlessly transfer within SUNY is critical.
This metric compares the number of credits earned
by transfer students vs. non-transfer students.
A COMPETITIVE SUNY

LIBRARY CIRCULATION AND E-RESOURCE DOWNLOADSThe depth of a university’s library holdings was once
the measure of an active academic enterprise. Today,
the availability of online resources is just as important.
This item uses data for the calendar year 2008.
OUR RESEARCH ENTERPRISE
To Search
FACULTY/STUDENT RESEARCH AND CREATIVE PRODUCTIVITY
RESEARCH EXPENDITURES*
RESEARCH EXPENDITURESPER TENURE-TRACK FACULTY
NUMBER OF LICENSES* EXECUTED
NUMBER OF FACULTY AND STUDENTS PARTICIPATING IN SPONSORED GRANTS*
• 38,300 Publications (2003-2005)• 123,100 Citations (2003-2005)
• $849,961,000 all SUNY• $720,332,000 Doctoral Campuses only
• $123,000 all SUNY• $255,000 Doctoral Campuses only
• Faculty – 3,920• Students – 5,290• Total – 9,210
• 49 IN 2008–9
Publishing or executing original scholarly or creative work is a hallmark of academia. Having other academics cite or reference your work is a badge of honor.
Tracking how much is spent on research activity is the national standard for evaluating the breadth of a research enterprise. Why is this item presented by amount spent versus dollars awarded? For a couple of reasons: First, many research grants are multi-year projects, and using annual expenditures is a nationally accepted way to develop a comparable figure on an annual basis. Second, many colleges and universities contribute operating dollars to their research enterprises and those funds are equally important.
Total dollar figures, especially of this magnitude, can be hard to evaluate. Looking at research expenditures per tenure and tenure-track faculty can be more meaningful.
In the process of bringing new intellectual property — i.e., discoveries — to the market, executing a license is a milestone. It is at this juncture that a new discovery receives external validation.
Looking at the number of faculty and students involved in sponsored grants is an indicator of how engaged our learning community is in research activity.
CIRCULATION (HOLDINGS: BOOKS, JOURNALS, MANUSCRIPTS)
E-RESOURCE DOWNLOADS
3,020,000
A COMPETITIVE SUNY
NOTE: *Represents figures from four-year schools only as reported by the SUNY Research Foundation.

To Serve
GRADUATES EMPLOYED IN NEW YORK STATESUNY’s mission is to prepare our students well for
the workforce — so they get good jobs, stay in New
York, and become productive citizens.
MEDIAN INCOME OF GRADUATES EMPLOYED IN NEW YORK STATEOne way to differentiate jobs from good jobs
is to look at income. We believe higher education
has a tangible value in the market place, and we
seek to define that value here.
GRADUATES IN SUPPORT OF NEW YORK STATE WORKFORCE NEEDSThe Department of Labor projects which industries
are most in need of qualified workers. SUNY
is focused on providing highly skilled graduates
to fill those needs that require a college degree
or certificate.
AFFORDABILITY/COMPARATIVE DEBT OBLIGATION UPON GRADUATIONMore than 30 percent of SUNY students receive
some form of financial assistance; for many, higher
education would be out of reach without it. For
students who benefit from financial assistance, the
affordability of a SUNY education (and the value of a
SUNY degree in the job market) can be measured in
part by their ability to manage and, eventually, settle
student debt post graduation.
DIVERSITY CONTENT IN THE CURRICULUM AND COURSE OFFERINGSIn an increasingly diverse world, our students must be
culturally competent. We think by providing the right
balance of diversity content in our curriculum, we can
help students gain these important skills. Tracking
curricular opportunities, we think, will allow us to strike
this balance. You will see similar measures focusing on
different areas in this Report Card.
SYSTEM ENERGY CONSUMPTIONAs one of the largest energy consumers in New York,
SUNY can tangibly impact the state’s energy use. It’s
a matter of leadership, but also a matter of economics
— using less energy means more money can be put
towards our students and our academic mission. We are
using a measure of consumption per square foot to be in
line with New York’s Executive Order 111.
140,565 BTU/sf
PURCHASING POWERAs one of New York’s largest and most important
assets, SUNY contributes directly to the local economy.
Beyond providing education and jobs, SUNY is a mass
purchaser of goods and services. Other than personal
services — all expenditures other than salaries and
benefits — is one way to think about the purely monetary
impact SUNY makes.
SUNY’s annual purchasing power: $2,848,451,000
A COMPETITIVE SUNY
PATIENTS SERVED BY OUR HOSPITALS
DOCTOR RETENTION FROM OUR MEDICAL SCHOOLS
TOTAL HOSPITAL AND CLINICAL EMPLOYMENT
• Inpatients: 67,000• Outpatients: 1,077,000
81% of our medical students are from New York
13,540 employees
Our three teaching hospitals (Upstate Medical University, Downstate Medical Center, and Stony Brook University) are the medical safety net for vast portions of New York.
Our medical schools are the vehicle through which native New Yorkers become doctors. This is important because these individuals are far more likely to stay in New York and practice medicine.
Our teaching hospitals are a major source of employment.

STUDENTS REPORTING RECEIVING AN ENRICHING EDUCATIONAL EXPERIENCE
STUDENTS REPORTING A SUPPORTIVE CAMPUS ENVIRONMENT
STUDENTS SATISFIED WITH STUDENT-FACULTY INTERACTION
STUDENTS SATISFIED WITH THE LEVEL OF ACADEMIC CHALLENGE
STUDENTS REPORTING AN ACTIVE AND COLLABORATIVE LEARNING EXPERIENCE
40% 47% 54%
63%
50%
67%
10%
55%
55% 60%
57%
60% 63%
50%
42% 49% 55%
SUNY TOP TOP
Students and Faculty
AVERAGE TIME TO DEGREEThe longer it takes for students to complete their
degrees, the higher the personal cost of their
education. While there are many personal factors that
can impact the time it takes a given student to earn a
college degree, promising college careers can also be
prolonged or derailed indefinitely as a consequence
of budget restrictions or flaws in policy. SUNY is
committed to eliminating obstacles and increasing the
number of graduates of its two-, four-, and five-year
programs to complete their course requirements on
time. These figures include full- and part-time students.
TIME TO EMPLOYMENT UPON GRADUATIONOur mission is to prepare students to be career ready
upon graduation. By tracking how long it takes our
students to find jobs we can begin to understand how
well we execute that mission.
INTERNATIONAL STUDENTSInternational diversity is important in developing a
globally competent student body — something we talk
more about in the SUNY and the World section.
18,200 international students: 4%
DIVERSITY OF FACULTY AND STAFFIt’s important to us that the diversity of our students is
reflected in the diversity of our university leadership.
We use standard federal classifications.
STUDENT DIVERSITYSUNY was founded with the intention to provide fair
access to higher education, without regard to ethnicity.
We use standard federal classifications.
RACE
TOTAL
WHITE NON-HISPANIC ALL MINORITIES Black Non-Hispanic
Hispanic
Asian/Pacific Islander
Native American/ Alaskan
NON-RESIDENT ALIEN
UNKNOWN
PERCENTAGENUMBER
439,500 100%
286,800 65%
90,600 21%
39,200 9%
29,400 7%
19,700 4%
2,200 1%
18,200 4%
44,000 10%
FIRST TIME BACHELOR’S DEGREE
FIRST TIME ASSOCIATE’S DEGREE
4.5 years
4.6 years
TOTAL EMPLOYEES
WHITE NON-HISPANIC ALL MINORITIES Black Non-Hispanic
Hispanic
Asian/Pacific Islander
Native American/ Alaskan
NON-RESIDENT ALIEN
PERCENTAGENUMBERRACE
85,800 100%
68,600 80%
13,300 16%
6,900 8%
3,000 3%
3,200 4%
300 <1%
3,900 4%
TENURE AND TENURE-TRACK FACULTYTenure and tenure-track faculty form the basis of campus culture and a college’s scholarly core.
They are supported in teaching by talented adjunct faculty.
STATE-OPERATED CAMPUSES: 64% COMMUNITY COLLEGES: 54%
STUDENT AND FACULTY SATISFACTIONFor students, higher education is a pivotal investment of time, money, and ambition that
will shape every life step that follows. For faculty, it’s a life commitment to excellence.
Each group’s assessment of its academic experience at SUNY is critical to the institution’s
continued improvement. This year we will focus on student satisfaction as evaluated by the
National Survey of Student Engagement (NSSE). In particular, we are interested in the
percent of our students satisfied with the instruction and course, campus, facilities,
and support services.
A COMPETITIVE SUNY
The percent of SUNY’s faculty who are tenured or tenure-tracked is:

STATE SUPPORT PER STUDENT FTEState support is a critical piece of SUNY’s
overall budget.
Diversifying revenue streams and engaging our friends
and supporters are two important reasons to increase
our fundraising. We use CAE*** reporting standards.
ALUMNI GIVING RATEAlumni Donors = SUNY graduates who have made
one or more gifts in the past year
Alumni On Record = living graduates for whom
SUNY has a current address
Alumni on Record/Alumni Donors = alumni giving rate
COMPETITIVE SUNY
Financial Health
FULLY LOADED COST PER STUDENTKnowing the specific cost to educate a student
is critical to good management, budgeting, and
prioritizing. These figures are based on a system-
wide formula recently developed and applied to the
state-operated campuses.
HOSPITAL FINANCIAL SUPPORT TO ACADEMIC HEALTH EDUCATIONAL ENTERPRISEAcademic health and hospital ledgers can be
complex. Large amounts of money rapidly
moving in and out can suggest an organization
flush with cash, however the truth is bills
and obligations. Potentially more confusing,
but critical to consideration, is the financial
connection between the academic health
enterprise (medical school) and the hospital.
TOTAL COST PER STUDENT FTE*†:
INSTRUCTIONAL COST PER STUDENT FTE †
RESEARCH AND PUBLIC SERVICE COSTS:
Direct Instruction:
Administrative Costs:
Capital Expenditures:
$15,940
$7,570
$14,470
$5,000
$1,900
$1,470
A COMPETITIVE SUNY
STATE OPERATED**
COMMUNITY COLLEGES
$8,290
$2,770
NOTE: *Excludes Fringe benefits. The fully loaded expenditures include direct costs for each of the missions, plus a distribution of related sup-port costs. Note that the research expenditures do not include expendi-tures at the Research Foundation. ** The related state funding includes support for the core budget and for debt service/capital expenditures. Funding for university-wide programs, system administration, fringe benefits, and SUNY hospitals are not included. *** CAE: Council for Aid to Education – www.cae.org. † FTE indicates full-time equivalent stu-dents or faculty to ensure that comparisons aren’t skewed by part-time students and faculty.
STATE-OPERATED CAMPUSES
COMMUNITY COLLEGES
8%
1%
In 2008-09 our three hospitals contributed
significantly to our medical school budgets.
$186,500,000 contributed to medical school budgets from hospital revenues
CLASSROOM UTILIZATION RATEClassroom utilization rate is an industry standard
measurement of how much use a single classroom
space gets compared to a predetermined expectation.
FACILITY MASTER PLAN PROGRESS AND UPDATESThe SUNY Construction Fund is executing an extensive
facilities master-planning process. We think it is the best
of its kind in the country. This item tells you how many
campus-facility master plans have been completed:
0 in 2008–9 (the first year of our program)
OPERATION AND MAINTENANCE OF BUILDINGS AND GROUNDSStewardship of buildings and grounds is critical to our
educational mission and to diminishing future critical
maintenance backlogs. We are working to give you two
numbers here: one will represent total dollars spent on
maintenance and operation per student. The second will
tell you how effective our program is.
$232,821,000 Donated to SUNY Campuses
†

DIVERSITY COUNTSThe Power of SUNY made promises to embed SUNY’s commitment to diversity in everything we do. Diversity enriches our lives and the educational experience: it invigorates conversations, awakens curiosity, and widens perspectives. Diversity also ensures our campuses mirror the rapidly changing world, creating an environment that prepares our students to be culturally competent so they can succeed anywhere.
• DIVERSITY COUNTS IN A COMPETITIVE SUNY
• DIVERSITY COUNTS IN A COMPETITIVE NEW YORK

Diversity CountsThe educational and social benefits of diversity within higher education are clear. The concept is
vital to American and international business efforts to hire and maintain a diverse workforce. Major
American businesses, the U.S. military, and other entities have clearly expressed the skills needed
in today’s increasingly global marketplace, which can only be developed through exposure to widely
diverse people, cultures, ideas, and viewpoints. The U.S. Supreme Court acknowledged this need, and
the supporting social science, in its seminal examination of, and justification for, diversity in higher
education in the case of Grutter v. Bollinger (2003).
Beyond being a pathway to culturally competent employment, SUNY campuses are also the
training grounds for many future corporate and community leaders. As the Supreme Court
recognized, the path to leadership should be visibly open to talented and qualified individuals of every
race and ethnicity in order to cultivate a set of leaders with legitimacy in the eyes of the citizenry.
The SUNY student body is sewn from the threads of our nation’s diverse quilt, where the views of all
students across the educational spectrum are sought out and given voice.
In sum, SUNY’s diverse educational environments create an intellectual climate that fosters
respect for differences, stimulates innovation, encourages collaboration, and prepares students
to live and work productively in a multiracial and multiethnic society.
The modern SUNY System was created more
than fifty years ago through Governor Nelson
D. Rockefeller’s vision to greatly expand
New York’s educated citizenry. His goal was
to provide opportunities where none existed
for the racial and religious groups that were
targets of discrimination and the economically
disadvantaged who could not afford private
colleges. Today, New York is the third most
populous state in the nation and one of the
most culturally diverse. SUNY reflects and
values that diversity, which is truly one of
our greatest strengths.
At SUNY, we recognize our diversity
makes us stronger and smarter. We respect,
encourage, and promote all aspects of human
difference. Diversity enriches lives and the
educational experience. By capitalizing on
diversity, our SUNY campuses invigorate
conversations, awaken curiosity, foster civic
engagement, and widen perspectives.

UNKNOWN FEMALE
Diversity Counts in a Competitive SUNY
In A Competitive SUNY, we looked at a number of measurements typically associated with responsible 21st-century higher education. In this section, we seek to look at the same elements, but using disaggregated data to highlight opportunities for us to better serve underrepresented populations. For the purposes of data integrity, we have used federal Department of Education classifications.
TOTALWHITENON-HISPANIC
BLACKNON-HISPANIC HISPANIC
ASIAN/PACIFIC ISLANDER
NATIVE AMERICAN/ALASKAN
NON-RESIDENTALIEN UNKNOWN MALE FEMALE
56%56% 56% 56% 56% 50% 55% 56% 53% 58%
77%77% 74% 76% 81% 63% 73% 80% 78% 76%
65%61% 54% 61% 72% 51% 69% 64% 61% 66%
83%83% 83% 83% 89% 68% 85% 86% 83% 85%
TRANSFER - ASSOC
TRANSFER - BA
FT FT - ASSOC
FT FT - BA
RETENTION RATES
SUCCESS RATES
GRADUATES IN SUPPORT OF NEW YORK STATE WORKFORCE NEEDS
22%
61%
22%
62%
22% 14% 15% 22% 18% 43% 29% 16% 27%
62% 52% 54% 65% 50% 70% 61% 59% 63%
25% 10% 14% 18% 17% 21% 20% 19% 26%
63% 55% 56% 69% 47% 45% 67% 58% 66%
TRANSFER - ASSOC (2 year)
TRANSFER - BA (4 year)
FT FT - ASSOC (3 year)
FT FT - BA (6 year)
GRADUATION RATES
TOTALWHITENON-HISPANIC
BLACKNON-HISPANIC HISPANIC
ASIAN/PACIFIC ISLANDER
NATIVE AMERICAN/ALASKAN
NON-RESIDENTALIEN MALE
STUDENTS WHO HAVE STUDIED ABROAD
DIVERSITY OF FACULTY AND STAFF
TOTALWHITENON-HISPANIC
BLACKNON-HISPANIC HISPANIC
ASIAN/PACIFIC ISLANDER
NATIVE AMERICAN/ALASKAN
NON-RESIDENTALIEN MALE FEMALE
FULL-TIME STAFF
PART-TIME FACULTY
PART-TIME STAFF
FULL-TIME FACULTY
TOTAL EMPLOYEES
6,45042%
46,02054%
8,09049%
23,00059%
8,48058%
9,08058%
39,76046%
8,49051%
16,10041%
6,10042%
7805%
3,8504%
2702%
8102%
2,00014%
50<1%
270<1%
50<1%
140<1%
30<1%
1,0407%
3,2304%
4203%
1,3303%
4403%
3802%
2,9803%
3402%
1,7104%
5504%
6104%
6,8608%
5703%
4,79012%
8806%
12,68082%
68,59080%
14,92090%
30,31078%
10,68073%
15,530100%
85,780100%
16,570100%
39,100100%
14,580100%
TOTALWHITENON-HISPANIC
BLACKNON-HISPANIC HISPANIC
ASIAN/PACIFIC ISLANDER
NATIVE AMERICAN/ALASKAN
NON-RESIDENTALIEN UNKNOWN MALE FEMALE
3.33.2 3.7 3.2 2.5 3.6 2.1 2.5 3.4 3.3
3.23.2 3.5 3.2 3.1 3.4 2.5 3.1 3.2 3.2
4.44.4 4.7 4.0 3.7 5.1 3.7 4.1 4.1 4.5
4.54.5 4.9 4.6 4.5 4.9 4.0 4.5 4.6 4.5
TRANSFER - ASSOC
TRANSFER - BA
FT FT - ASSOC
FT FT - BA
AVERAGE TIME TO DEGREE
64,06052%
80,98057%
58,36048%
-
61,64043%
2,6102%
14,31010%
3,6503%
11,66010%
-500<1%
710<1%
11,8108%
5,0604%
18,06013%
9,2808%
20,17014%
12,19010%
79,87065%
75,15053%
122,420100%
142,620100%
APPLICATIONS - Historically Underrepresented
ENROLLMENT - Historically Underrepresented
ENROLLMENT - EconomicallyDisadvantaged
RECRUITMENT OF STUDENTS FROM HISTORICALLY UNDERREPRESENTED AND/OR ECONOMICALLY DISADVANTAGED POPULATIONS
TOTALWHITENON-HISPANIC
BLACKNON-HISPANIC HISPANIC
ASIAN/PACIFIC ISLANDER
NATIVE AMERICAN/ALASKAN
NON-RESIDENTALIEN UNKNOWN
TWO OR MORE RACES MALE FEMALE
DIVERSITY CONTENT IN THE CURRICULUM
ACTIVEMILITARYDUTY
PROPORTION OF UNDERGRADUATE AND GRADUATE/PROFESSIONAL STUDENTS BY ETHNICITY AND GENDER
TOTALWHITENON-HISPANIC
BLACKNON-HISPANIC HISPANIC
ASIAN/PACIFIC ISLANDER
NATIVE AMERICAN/ALASKAN
NON-RESIDENTALIEN UNKNOWN MALE
NATIONAL GUARD OR ACT RESERVE VETERANFEMALE
GRADUATES/PROFESSIONAL
UNDERGRADUATES
TOTAL
217,39055%
3,07050
241,490 55%
3,170 50
24,10059% -
100
181,19045%
470
198,03045%
480
16,84041%
1
40,30010%
43,99010%
3,6909%
11,0203%
18,1504%
7,13017%
2,120<1%
2,240<1%
130<1%
17,5304%
19,7204%
2,1905%
28,0907%
29,4507%
1,3603%
37,2309%
39,2209%
1,9905%
262,31066%
286,77065%
24,46060%
398,580100%
439,520100%
40,940100%

Diversity Counts in a Competitive New York
The Power of SUNY made six clear commitments to diversity opportunities within the Six Big Ideas. In this section, we hold ourselves accountable to those promises.
DIVERSITYCOUNTS
SUNY AND THE ENTREPRENEURIAL CENTURYWe have looked at overall SUNY graduates in STEM disciplines. Here, we look
specifically at underserved populations achieving degrees in STEM fields.
SUNY AND THE SEAMLESS EDUCATION PIPELINE*The Strive National Cradle to Career Network
provides a framework for building community-
based and data-drive educational solutions.
You can learn more at: www.strivenetwork.org.
Our Strive adaptations will employ a number
of evidence-based intervention strategies aimed
at increasing the number of vulnerable students
achieving a high-school diploma and entering
college prepared for college-level work. Here
we will first track the implementation of these
strategies within Strive sites, toward tracking
their effectiveness.
TOTALWHITENON-HISPANIC
BLACKNON-HISPANIC HISPANIC
ASIAN/PACIFIC ISLANDER
NATIVE AMERICAN/ALASKAN
NON-RESIDENTALIEN UNKNOWN MALE FEMALE
MASTERS
GRADUATE CERTIFICATES
BACHELORS
DOCTORAL
ASSOCIATE
UNDERGRADUATE CERTIFICATES
GRADUATES IN STEM FIELDS BY ETHNICITY AND GENDER
30017%
4020%
2,11036%
56037%
21038%
1548%
1,52083%
15080%
3,71064%
96063%
35062%
2052%
1307%
63%
71012%
503%
305%
413%
301%
11%
4307%
77051%
28051%
310%
6<1%
32%
20<1%
5<1%
3<1%
-
603%
84%
64011%
805%
305%
-
1005%
2012%
2304%
202%
143%
13%
1006%
74%
2805%
302%
81%
26%
1,41077%
14074%
3,52060%
57037%
19035%
2068%
1,830100%
180100%
5,820100%
1,520100%
560100%
30100%
NOTE: *No Strive adaptations have been developed in New York yet.
SUNY AND AN ENERGY-SMART NEW YORKIn A Competitive New York, we commit to delivering Energy-Smart education opportunities to the SUNY
community. Here, we focus specifically on those programs offered to low-income families with the ultimate
goal of reducing the proportion of disposable income those families are spending on energy costs.
MEASURE CAMPUS-BASED PROGRAMS DESIGNED TO EDUCATE LOW-INCOME FAMILIES IN BECOMING ENERGY-SMART
SUNY AND THE VIBRANT COMMUNITYAs our campuses design specific service-learning
plans we will measure the development — and
then results — of those aimed at serving vulnerable
and underserved populations. We will call these
“Diversity Counts” service-learning opportunities.
Service-learning plans called for by the SUNY and
the Vibrant Community Innovation Team have not
yet been developed.
CERTIFIED DIVERSITY COUNTS SERVICE-LEARNING OPPORTUNITIES
SUNY AND THE WORLDStudy-abroad opportunities often feel out of reach
for many, but as SUNY places increasing value on
them, it must do so for all populations.
STUDY-ABROAD AND INTERNATIONAL STUDENTS STUDYING AT SUNY BY ETHNICITYINTERVENTION STRATEGIES
DEVELOPED FOR HISTORICALLY UNDERREPRESENTED POPULATIONS
TOTALWHITENON-HISPANIC
BLACKNON-HISPANIC HISPANIC
ASIAN/PACIFIC ISLANDER
NATIVE AMERICAN/ALASKAN
NON-RESIDENTALIEN UNKNOWN MALE FEMALE
MASTERS
FIRSTPROFESSIONAL
GRADUATE CERTIFICATES
BACHELORS
DOCTORAL
ASSOCIATE
TOTAL
UNDERGRADUATE CERTIFICATES
3,41083%
6,95079%
44078%
1,65080%
75087%
16066%
48053%
7088%
68017%
1,87021%
13022%
42020%
12013%
8034%
43047%
1012%
3108%
7108%
306%
26013%
708%
208%
202%
45%
14<1%
1602%
31%
502%
506%
209%
202%
68%
30<1%
40<1%
2<1%
5<1%
-
2<1%
1<1%
1<1%
1403%
7709%
203%
28014%
607%
26028%
207%
23%
1704%
3704%
305%
1105%
304%
31%
203%
23%
3308%
85010%
8014%
27013%
10012%
207%
505%
912%
3,10076%
5,92067%
40070%
1,11053%
55064%
17068%
55059%
5068%
4,090 100%
8,830100%
570100%
2,070100%
860100%
240100%
920100%
80100%
GRADUATES WITH HEALTHCARE CREDENTIALS BY ETHNICITY
SUNY AND A HEALTHIER NEW YORKWe have looked at graduates in health care fields. Here, we disaggregate that data.

• SUNY AND AN ENERGY-SMART NEW YORK
• SUNY AND THE VIBRANT COMMUNITY
• SUNY AND THE WORLD
Just over a year ago, SUNY presented Six Big Ideas — areas where SUNY could focus its capacity and expertise to make a difference for the State of New York. We promised to link resources and expertise in targeted and quantifiable ways. In the pages that follow, we have translated these Big Ideas into condition measures, processes, and outcome metrics that we think drive A Competitive New York.
• SUNY AND THE ENTREPRENEURIAL CENTURY
• SUNY AND THE SEAMLESS EDUCATION PIPELINE
• SUNY AND A HEALTHIER NEW YORK
A COMPETITIVE NEW YORK

SUNY andThe Entrepreneurial Century
Entrepreneurship is to the knowledge economy what the assembly line was to industrialism. In higher education, federal research dollars are the fuel, and by increasing our ability to capture funding we are able to create more jobs in New York. More importantly, they’ll be jobs people want, because SUNY has a unique ability to align its breadth and scale with business and industry, taking our solutions and making them viable for real-world applications.
RESEARCH EXPENDITURES BYECONOMIC DEVELOPMENT REGION*We’ve already looked at SUNY’s total research
expenditures, but in New York, and especially
under the leadership of Governor Andrew Cuomo
and Lieutenant Governor Robert Duffy, regional
collaboration is critical. Therefore, we plan to build
research capacity regionally.
A COMPETITIVE NEW YORK
REGION EXPENDITURES*CAPITAL $294,137,000
$53,700,000
$5,790,000
$177,513,000
$7,689,000
$5,902,000
$51,738,000
$11,252,000
$39,843,000
$202,398,000
LONG ISLAND
CENTRAL NEW YORK
FINGER LAKES
MID-HUDSON
MOHAWK VALLEY
NEW YORK CITY
NORTH COUNTRY
SOUTHERN TIER
WESTERN NEW YORK
NEW YORK STATE RESEARCH EXPENDITURES
NEW YORK STATE JOBS CREATED
NEW YORK STATE AVERAGE WAGE VS. NATIONAL AVERAGE SALARY
$4,500,000,000(According to Excell Partners, Inc.).
58,000(According to New York State Department of Labor).
$60,384 (According to the New York State Department of Labor). vs.$43,460 (According to the New York State Department of Labor Bureau of Statistics).
JOBS CREATED THROUGH SPONSORED PROGRAMSSTAR METRICS is a federally sponsored effort to
quantify impact of federally funded research.
Using its methodology we can determine how
many jobs are directly supported by SUNY’s
research enterprise.
Jobs supported by SUNY research: 5,360
THE NUMBER OF INVENTION DISCLOSURES*Successful research can be measured by
the knowledge and innovation we produce.
Through regional technology-transfer offices,
SUNY is able to leverage strengths across
campuses. Measuring invention disclosures
is a critical moment in the process of bringing
inventions to market.
320* inventions disclosed
ENTREPRENEURIAL CURRICULUM CONTENT AND ACTIVITESTo create the next generation of leaders, we must
embed entrepreneurial training in our coursework
and in extracurricular activities.
SUNY’S ENTREPRENEURIAL SUPPORT OF NEW YORK BUSINESS AND INDUSTRYFor SUNY to become a major driver of economic
revitalization, we must provide the right kind of
support to the business community. This includes
qualified and talented graduates, access to our
research enterprise, and high-quality training
programs. We will evaluate our effectiveness
by partnering with businesses and business
organizations to create a semi-annual survey.
“The future belongs to those who can create, nurture, and commercialize intellectual capital, and the place where that happens is here.” – Carl T. Hayden, Chairman, SUNY Board of Trustees
NOTE: * Represents figures from four-year schools only as reported by the SUNY Research Foundation.

SUNY andThe Seamless Education Pipeline
SUNY views education as a pipeline, which encompasses all that we learn from the day we are born through our experiences in the workforce. As New York State and the nation seek to fix the leaks in the education pipeline, SUNY has the capacity and a plan to lead the charge.
“It is a myth that one person or group can fix education by themselves, no matter how visionary or passionate. Only by working together — public and private institutions of higher education, state education departments, school districts, elected officials, civic, philanthropic and corporate leaders — will we see results.” – Nancy L. Zimpher, Chancellor, The State University of New York
“Education — educating more people and educating them better — appears to be the best single bet that a society can make.” – David Leonhardt, Columnist, The New York Times
CRADLE-TO-CAREER NETWORKSSUNY is committed to the Strive concept — a
framework for developing community-based,
data-driven partnerships to address learning
outcomes for our most vulnerable populations.
A Strive network engages leaders in Pre-K-
through-12 schools, higher education,
business and industry, community
organizations, government leaders, parents,
and other stakeholders. Together we will:
Increase the number of New York sites
qualifying for membership in the Strive
National Cradle to Career Network and as
a result effectively work toward closing
the achievement gap and increasing
career entry.
0 sites in 2008–9
SUNY WORKSBy partnering with business and industry leaders, economic development organizations, and private foundations, SUNY
will create a unique new cooperative-education initiative. SUNY Works will allow students to earn salaries and college
credits while simultaneously completing their degree and gaining on-the-job training and experience that will garner
job opportunities in high-need 21st-century fields in New York upon graduation. SUNY is committed to: Increasing the
number of students enrolled in cooperative-education programs and successfully gaining employment as
a result of their co-op experience.
19 of 100 New York State ninth graders graduate from college in the standard time frame (According to the National Center for Public Policy and Higher Education)
Average New York State unemployment rate: 5.3% (According to the United State Department of Labor Bureau of Statistics)
SMART SCHOLARS EARLY COLLEGE HIGH SCHOOLSHistorically underrepresented high-school students
are in desperate need of additional opportunities to
get a head start on college. One way SUNY can
make this possible is through the implementation
of Smart Scholars Early College High Schools. The
network was developed as a collaboration between
EdWorks/KnowledgeWorks Foundation, the New York
State Education Department, the Bill & Melinda Gates
Foundation, colleges and universities, school
districts, and community organizations to allow
students to earn both a high-school diploma and
up to two years of college credit while they are in
high school. With these partners, SUNY will: Increase
the number of historically underrepresented
high-school students receiving college-level
credits in ECHS, and consequently increase the
numbers of those students admitted to college.
SUNY URBAN-RURAL TEACHER CORPSAs recommended by the National Council for Accreditation
of Teacher Education (NCATE) Blue Ribbon Panel on
Clinical Preparation and Partnerships for Improved Student
Learning in November 2010, SUNY will transform its
undergraduate and graduate teacher education programs
by offering teacher training akin to the clinical training
that medical professionals receive. Collectively, students
training in the new and improved programs and program
graduates will be known as the SUNY Urban-Rural Teacher
Corps (URTC). To develop the URTC, SUNY will:
Develop clinically rich teacher-education
programs at SUNY campuses toward increasing
the number of SUNY graduates prepared and
teaching in hard-to-serve schools.
0 programs in 2008–9
A COMPETITIVE NEW YORK

SUNY andA Healthier New York
Building a virtual SUNY Institute for Health Policy and Practice (IHPP) will harness and leverage capacity across all 64 SUNY campuses. SUNY will address health issues for our students and faculty in a defined environment — our campuses — and then take “what works” to scale statewide and nationwide.
Development of the SUNY Institute for Health Policy and Practice.
THE RIGHT HEALTH PROFESSIONALS IN THE RIGHT PLACESThe lack of enough well-trained health care professionals
is well known and felt nationwide. SUNY is committed to
changing this dynamic by:
• Producing more well-trained
healthcare workers.
• Analyzing specific needs both geographically
and by the type of professional required.
THE SUNY WELLNESS NETWORKOne in four undergraduate students arrives at
college with one or more significant and chronic
health challenges. We know some of the biggest
risk factors facing our SUNY family; others require
investigation. Therefore SUNY will:
• Use industry standards to execute a
behavioral risk-assessment study.
• Become the largest system to
become entirely tobacco free.
“We all — everyone – have something in common. Each and every one of us will someday be a patient.” – Dr. David Smith, President,
SUNY Upstate Medical University
To be on the forefront of effective, outcome-based
healthcare we need to ramp up our research base
and use “level one” evidence to create the SUNY
Scale — a measure of quality healthcare.
SUNY knows it must:
• Increase funding to strengthen
the IHPP — $4,637,500 in 2008-9.
• Increase funding for the four
SUNY REACH pillars*.
• Develop the SUNY SCALE.
NOTE: *SUNY REACH is a program to promote increased research, especially collaborative research in the areas of cancer, infectious disease, disorders of the nervous system, diabetes, and cardiovascular disease.
A COMPETITIVE NEW YORK

SUNY andAn Energy-Smart New York
Some believe the green energy economic revolution will be akin to the development and proliferation of the personal computer. By 2030 the U.S. Renewable Energy Market is estimated to be worth $4.5B; similarly, the U.S. Green Collar Workforce is estimated to top 250,000 by 2020. SUNY’s expertise in applied research and its ability to take it to scale will allow us to prepare New York State to capture an outsized share of that market and workforce while leading to a decrease in New York’s energy consumption. SUNY sees the road to realizing this ambition in three parts: Education, Research, and Consumption Practices.
New York’s share of the Renewable Energy Market and Green Collar Workforce
“SUNY has embraced our natural role as a source for research and innovation, and we are leveraging it to break new ground in clean energy technology that will encourage discovery, innovation, demonstration, education, and commercialization of green - and renewable - energy solutions and prepare the workforce that will lead New York’s new economy. We are turning words and ideas into action and jobs — this is the very essence of The Power of SUNY.” – Nancy L. Zimpher, Chancellor,
The State University of New York
INVENTION DISCLOSURES*Similarly, we seek to enhance our technology
transfer process to identify, protect, and
commercialize SUNY’s intellectual property
portfolio and grow the number of invention
disclosures related to energy disciplines made
by our faculty and student researchers.
ENERGY-SMART CONSUMPTIONFinally, controlling consumption is critical.
As one of the largest energy consumers in
New York, SUNY can lead the way to more
responsible usage practices. A thorough evaluation is in progress to build and assess the impact of a deep, broad, and effective green curriculum.
SYSTEM ENERGY CONSUMPTION
SYSTEM CARBON FOOTPRINT (MTCO2E)
SYSTEM RENEWABLE ENERGY
• BTUs/Ft2 – consumption per space (in line with Executive Order 111): 140,565 • MMBTUs/AAFTE – consumption per student: 61.97
• Emissions/Ft2 – per space: .0116• Emissions/AAFTE – per student: 5.1352
• Produced: 645,169 kWh• Utilized: 27,395,169 kWh
NOTE: *Represents figures from 4-year schools only as reported by the SUNY Research Foundation.
ENERGY-SMART EDUCATIONStep one is to prepare a generation of Energy-Smart
graduates — an educated citizenry that has the skills
and drive to take on 21st-century green jobs.
At the same time, SUNY needs to take a more active
role in providing continuing community education
and energy-management recommendations.
ENERGY-SMART RESEARCHAs we have committed to tracking research
expenditures in total and by region, we
seek to focus on — and significantly grow —
expenditures in the Energy-Smart disciplines.
This measurement includes research in
the following areas: Smart-Energy Grid
technologies, energy-efficiency technologies,
energy storage, alternative and renewable
sources, energy for transportation, and
energy policy.
Energy-Smart research expenditures: $23,524,400
A COMPETITIVE NEW YORK

SUNY andThe Vibrant Community
Strong communities are at the heart of economic revitalization. They foster investment, improve quality of life, and grow stronger citizens. As anchor institutions, our influence is widely felt. Our scholars can quantify our contributions to the well-being of our communities, and our SUNY family can provide significant impact.
Well-being Index for New York State Counties
1) Increasing campus-community engagement is central to our mission as a public university
system. We’ve identified two ways in which SUNY can better serve its local communities:
Establish service-learning plans tailored to the needs and capabilities of each campus that
produce evidence-based results to the communities.
2) Require the implementation of a signature engagement project at each campus — a long-
term, ever-changing tailored project to meet the community’s needs.
“Locality matters, as John Dewey wrote in 1927, ‘democracy begins at home and home must be the neighborly community’… No institution can make such significant contributions to the quality of life in their communities and cities as colleges and universities…” – Ira Harkavy, Founding Director and Associate Vice President, Netter Center for Community Partnerships, University of Pennsylvania
SUNY PASSPORTWith a plethora of arts and culture opportunities at the fingertips of all New Yorkers, we will
encourage our students and faculty to take advantage of these opportunities by: Partnering
with 250 or more organizations across New York State for reduced or waived
cost to cultural or recreational activities.
Current Partners: 0
The Carnegie Elective Classification for Community Engagement and the President’s Higher
Education Community Service Honor Roll are the gold standard in recognizing effective community
service. Therefore, SUNY will: Increase the number of SUNY campuses recognized by the
Carnegie Elective Classification for Community Engagement and/or the President’s
Higher Education Community Service Honor Roll.
Currently Recognized Campuses: 5
QUANTIFYING THE IMPACT OF VOLUNTEERISM AND COMMUNITY SERVICE RENDERED BY SUNY Each year, SUNY students, faculty, and staff perform hundreds of thousands of hours of
community service. IndependentSector.org values community service in New York at
$28.52 per hour. Using this figure, we can quantify the impact of those volunteer hours —
and then double it.
A COMPETITIVE NEW YORK

SUNY andThe World
Sustained economic prosperity requires a global approach. For New York, comprehensive internationalization will mean more global trade and an increase in personal income and job creation. SUNY can tangibly support this vision for New York by training an army of globally competent graduates with the experience and preparation necessary for their successes to transcend borders and return back home.
BUILDING A GLOBAL STUDENT TALENT POOLSUNY students will drive New York’s workforce of tomorrow, so they must possess a series of skills and
experiences that will enable them to thrive in a competitive global marketplace. It starts here in New York —
learning a foreign language or interacting with international students in the classroom and in the dorm.
But it also extends beyond: students must be encouraged to study abroad and get real, hands-on experience
bridging cultural divides.
Enrollment in Education Abroad:
International Students: 18,200
EARNING INTERNATIONAL PRESTIGESUNY’s ability to prepare its students for
participation in the global knowledge economy
is best exemplified by the recognition of those
students as successful international scholars.
An increase in scholarships from organizations
such as Fulbright, Gates, and Rhodes helps to
raise the global profile of all students.
HARNESSING THE IMPACT OF INTERNATIONAL STUDENTSWhile educating generations of globally
prepared students is a multi-year process,
the impact of SUNY’s efforts will be felt
immediately. Increasing the number of
international students studying at SUNY
not only provides a more rounded experience
for others, but also contributes directly to
New York’s economy.
BUILDING A GLOBAL FACULTY TALENT POOLFaculty excellence and activity is the
only way to ensure comprehensive and
sustained internationalization. When
faculty members are awarded fellowships
from prestigious international entities, SUNY
expands its profile and builds new and vital
partnerships across the globe.
ECONOMIC IMPACT OF INTERNATIONAL ACTIVITY***The global activity of our students, faculty, and staff
not only encourages academic discourse throughout
the world, it brings grants, contracts, and cooperative
agreements back home to benefit New York. SUNY
expands its reach when it invests abroad and when
investments from abroad are in turn made to SUNY.
Number of prestigious international scholarships awarded to SUNY students: 64
Number of international fellowships to faculty and staff: 18
Economic impact of international students: $406,802,000**
Economic impact of international research activities: $42,528,000
“Globalization is a new reality. So the question is, what do we do to compete? The only way we can keep our edge is to keep educating.” – Vivek Wadhwa, Director of Research, Center for Entrepreneurship and Research Commercialization, and Executive in Residence, Pratt School of Engineering, Duke University
NOTE:All data in this section reflects 2009-10. *May not fully account for exports to Canada ** According to NAFSA: Association of International Educators *** According to the SUNY Research Foundation.
TOTAL 44,940
4,900
39,500
540POST GRADUATE
INTRODUCTORY UNDERGRADUATE
ADVANCED UNDERGRADUATE
STUDENTS ENROLLED IN FOREIGN LANGUAGE COURSES
NEW YORK STATE EXPORTS(INTERNATIONAL)*
NEW YORK STATE JOB CREATION
NEW YORK STATE AVERAGE WAGE
$39,211,000,000 (According to the U.S. Department of Commerce, Bureau of Census).
-237,100 (According to New York State Department of Labor).
$57,794 (According to the New York State Department of Labor).
A COMPETITIVE NEW YORK
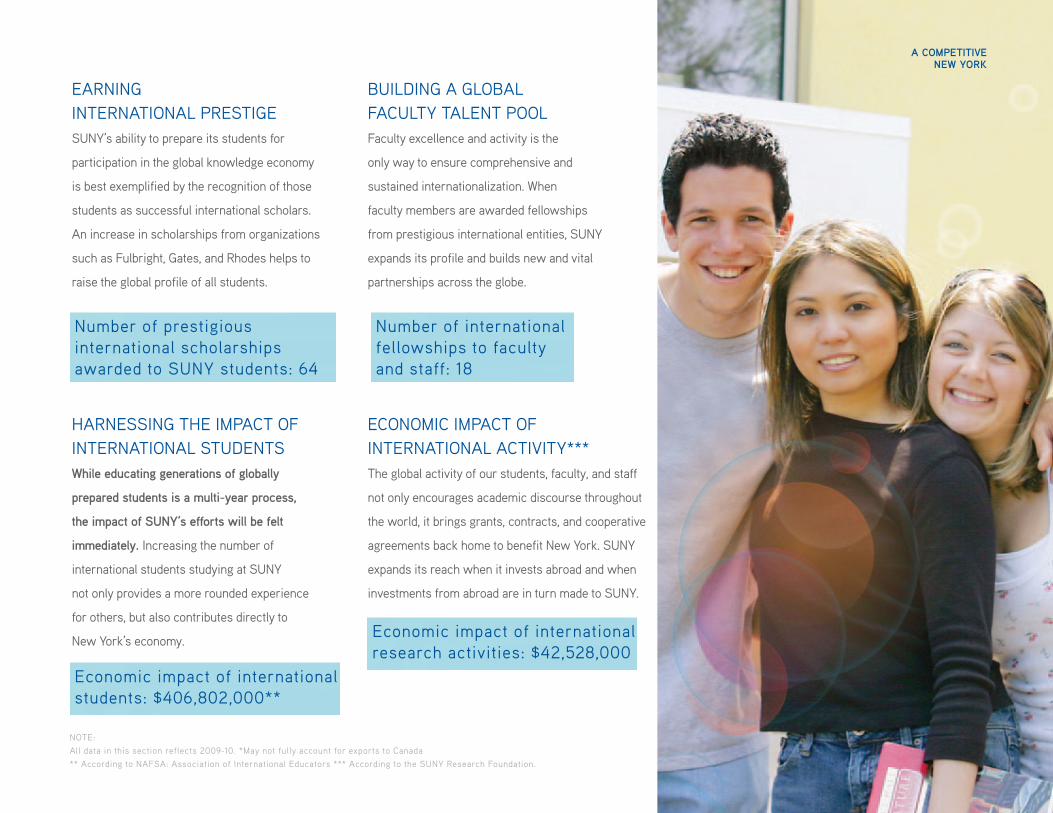
SUNY andThe World
Sustained economic prosperity requires a global approach. For New York, comprehensive internationalization will mean more global trade and an increase in personal income and job creation. SUNY can tangibly support this vision for New York by training an army of globally competent graduates with the experience and preparation necessary for their successes to transcend borders and return back home.
BUILDING A GLOBAL STUDENT TALENT POOLSUNY students will drive New York’s workforce of tomorrow, so they must possess a series of skills and
experiences that will enable them to thrive in a competitive global marketplace. It starts here in New York —
learning a foreign language or interacting with international students in the classroom and in the dorm.
But it also extends beyond: students must be encouraged to study abroad and get real, hands-on experience
bridging cultural divides.
Enrollment in Education Abroad:
International Students: 18,200
EARNING INTERNATIONAL PRESTIGESUNY’s ability to prepare its students for
participation in the global knowledge economy
is best exemplified by the recognition of those
students as successful international scholars.
An increase in scholarships from organizations
such as Fulbright, Gates, and Rhodes helps to
raise the global profile of all students.
HARNESSING THE IMPACT OF INTERNATIONAL STUDENTSWhile educating generations of globally
prepared students is a multi-year process,
the impact of SUNY’s efforts will be felt
immediately. Increasing the number of
international students studying at SUNY
not only provides a more rounded experience
for others, but also contributes directly to
New York’s economy.
BUILDING A GLOBAL FACULTY TALENT POOLFaculty excellence and activity is the
only way to ensure comprehensive and
sustained internationalization. When
faculty members are awarded fellowships
from prestigious international entities, SUNY
expands its profile and builds new and vital
partnerships across the globe.
ECONOMIC IMPACT OF INTERNATIONAL ACTIVITY***The global activity of our students, faculty, and staff
not only encourages academic discourse throughout
the world, it brings grants, contracts, and cooperative
agreements back home to benefit New York. SUNY
expands its reach when it invests abroad and when
investments from abroad are in turn made to SUNY.
Number of prestigious international scholarships awarded to SUNY students: 64
Number of international fellowships to faculty and staff: 18
Economic impact of international students: $406,802,000**
Economic impact of international research activities: $42,528,000
“Globalization is a new reality. So the question is, what do we do to compete? The only way we can keep our edge is to keep educating.” – Vivek Wadhwa, Director of Research, Center for Entrepreneurship and Research Commercialization, and Executive in Residence, Pratt School of Engineering, Duke University
NOTE:All data in this section reflects 2009-10. *May not fully account for exports to Canada ** According to NAFSA: Association of International Educators *** According to the SUNY Research Foundation.
TOTAL 44,940
4,900
39,500
540POST GRADUATE
INTRODUCTORY UNDERGRADUATE
ADVANCED UNDERGRADUATE
STUDENTS ENROLLED IN FOREIGN LANGUAGE COURSES
NEW YORK STATE EXPORTS(INTERNATIONAL)*
NEW YORK STATE JOB CREATION
NEW YORK STATE AVERAGE WAGE
$39,211,000,000 (According to the U.S. Department of Commerce, Bureau of Census).
-237,100 (According to New York State Department of Labor).
$57,794 (According to the New York State Department of Labor).
A COMPETITIVE NEW YORK

ConclusionThis Report Card gives us a series of baseline metrics using data from the 2008-9 academic year. It
presents a starting point—which we will revisit annually beginning this September.
As we work toward realizing The Power of SUNY plan by building a stronger SUNY and, in turn, a
stronger New York, we vow to be transparent and urge you to hold us accountable by utilizing this
initial Report Card and its follow-up companions, which will be published annually. We hope you have
found this Report Card helpful and we welcome your feedback and engagement.
With these products to guide us, and with your help, SUNY will continue to be a source of immense
pride for all of New York.
Together, we are
thePower of
Today’s SUNY is a system created with
excellence in every dimension. It’s a system
we take great pride in, but also one that we
believe can do even more for students and
families, faculty and staff, alumni, and
ultimately all New Yorkers.
In developing our strategic plan — The Power
of SUNY — we took ourselves to task and
challenged the system to reach its full
potential by sustaining its core mission of
teaching, research, and service, and also
by fulfilling a need in New York State for an
economic-revitalization champion.

REPORT CARD 2011
thePower of