SunTrust at Merrill Lynch Banking & Financial Services Conference
25
Merrill Lynch Banking and Financial Services Conference November 13, 2008 Mark A. Chancy Chief Financial Officer
-
Upload
finance20 -
Category
Economy & Finance
-
view
362 -
download
1
Transcript of SunTrust at Merrill Lynch Banking & Financial Services Conference

Merrill Lynch Banking and Financial Services ConferenceNovember 13, 2008
Mark A. ChancyChief Financial Officer
Important Cautionary Statement About Forward-Looking Statements
The following should be read in conjunction with the financial statements, notes and other information contained in the Company’s 2007 Annual Report on Form 10-K, Quarterly Reports on Form 10-Q, and Current Reports on Form 8-K.
This presentation includes non-GAAP financial measures to describe SunTrust’s performance. The reconciliation of those measures to GAAP measures are provided within this presentation. In this presentation, net interest income and net interest margin are presented on a fully taxable-equivalent (“FTE”) basis, and ratios are presented on an annualized basis. The FTE basis adjusts for the tax-favored status of income from certain loans and investments. The Company believes this measure to be the preferred industry measurement of net interest income and provides relevant comparison between taxable and non-taxable amounts.
This presentation may contain forward-looking statements. Statements that do not describe historical or current facts, including statements about beliefs and expectations, are forward-looking statements. These statements often include the words “believes,” “expects,” “anticipates,” “estimates,” “intends,” “plans,” “targets,” “initiatives,” “potentially,” “probably,” “projects,” “outlook” or similar expressions or future conditional verbs such as “may,” “will,” “should,” “would,” and “could.” Such statements are based upon the current beliefs and expectations of management and on information currently available to management. The forward-looking statements are intended to be subject to the safe harbor provided by Section 27A of the Securities Act of 1933 and Section 21E of the Securities Exchange Act of 1934. Such statements speak as of the date hereof, and we do not assume any obligation to update the statements made herein or to update the reasons why actual results could differ from those contained in such statements in light of new information or future events.
Forward-looking statements are subject to significant risks and uncertainties. Investors are cautioned against placing undue reliance on such statements. Actual results may differ materially from those set forth in the forward-looking statements. Factors that could cause actual results to differ materially from those described in the forward-looking statements can be found in Exhibit 99.3 to our Current Reports on Form 8-K filed on October 23, 2008 with the Securities and Exchange Commission and available at the Securities and Exchange Commission’s internet site (http://www.sec.gov), which is incorporated by reference herein. Those factors include: difficult market conditions have adversely affected our industry; current levels of market volatility are unprecedented; the soundness of other financial institutions could adversely affect us; there can be no assurance that recently enacted legislation will stabilize the U.S. financial system; the impact on us of recently enacted legislation, in particular the Emergency Economic Stabilization Act of 2008 and its implementing regulations, and actions by the FDIC, cannot be predicted at this time; credit risk; weakness in the economy and in the real estate market, including specific weakness within our geographic footprint, has adversely affected us and may continue to adversely affect us; weakness in the real estate market, including the secondary residential mortgage loan markets, has adversely affected us and may continue to adversely affect us; as a financial services company, adverse changes in general business or economic conditions could have a material adverse effect on our financial condition and results of operations; changes in market interest rates or capital markets could adversely affect our revenue and expense, the value of assets and obligations, and the availability and cost of capital or liquidity; the fiscal and monetary policies of the federal government and its agencies could have a material adverse effect on our earnings; we may be required to repurchase mortgage loans or indemnify mortgage loan purchasers as a result of breaches of representations and warranties, borrower fraud, or certain borrower defaults, which could harm our liquidity, results of operations and financial condition; clients could pursue alternatives to bank deposits, causing us to lose a relatively inexpensive source of funding; consumers may decide not to use banks to complete their financial transactions, which could affect net income; we have businesses other than banking which subject us to a variety of risks; hurricanes and other natural disasters may adversely affect loan portfolios and operations and increase the cost of doing business; negative public opinion could damage our reputation and adversely impact our business and revenues; we rely on other companies to provide key components of our business infrastructure; we rely on our systems, employees and certain counterparties, and certain failures could materially adversely affect our operations; we depend onthe accuracy and completeness of information about clients and counterparties; regulation by federal and state agencies could adversely affect our business, revenue and profit margins; competition in the financial services industry is intense and could result in losing business or reducing margins; future legislation could harm our competitive position; maintaining or increasing market share depends on market acceptance and regulatory approval of new products and services; we may not pay dividends on our common stock; our ability to receive dividends from our subsidiaries accounts for most of our revenue and could affect our liquidity and ability to pay dividends; significant legal actions could subject us to substantial uninsured liabilities; recently declining values of residential real estate may increase our credit losses, which would negatively affect our financial results; deteriorating credit quality, particularly in real estate loans, has adversely impacted us and may continue to adversely impact us; disruptions in our ability to access global capital markets may negatively affect our capital resources and liquidity; any reduction in our credit rating could increase the cost of our funding from the capital markets; we have in the past and may in the future pursue acquisitions, which could affect costs and from which we may not be able to realize anticipated benefits; we depend on the expertise of key personnel; we may not be able to hire or retain additional qualified personnel and recruiting and compensation costs may increase as a result of turnover, both of which may increase costs and reduce profitability and may adversely impact our ability to implement our business strategy; our accounting policiesand methods are key to how we report our financial condition and results of operations, and these require us to make estimates about matters that are uncertain; changes in our accounting policies or in accounting standards could materially affect how we report our financial results and condition; our stock price can be volatile; our disclosure controls and procedures may not prevent or detect all errors or acts of fraud; our financial instruments carried at fair value expose us to certain market risks; our revenues derived from our investment securities may be volatile and subject to a variety of risks; we may enter into transactions with off-balance sheet affiliates or our subsidiaries that could result in current or future gains or losses or the possible consolidation of those entities; and we are subject to market risk associated with our asset management and commercial paper conduit businesses.

2
Investment Thesis
Diversified Franchise
• Meaningful consumer and commercial platforms
• Attractive, diverse geographic profile• Strong market share in core markets• Significant fee-oriented activities
complement spread-based business
• Strengthened capital ratios • Attractive, long-term dividend growth • Diversified sources of funding; large, stable
deposit base is primary source of liquidity• Diversified credit profile • Aggressively managing risk positions
Strategic Initiatives for Growth
• Improving efficiency and productivity
• Generating momentum with revenue initiatives
• Continuing to optimize balance sheet and business mix
Stable Base of Operations Provides Foundation for Future Growth
Solid Capital Structure and Balance Sheet
3
Diversified Franchise
Diversified Franchise
4
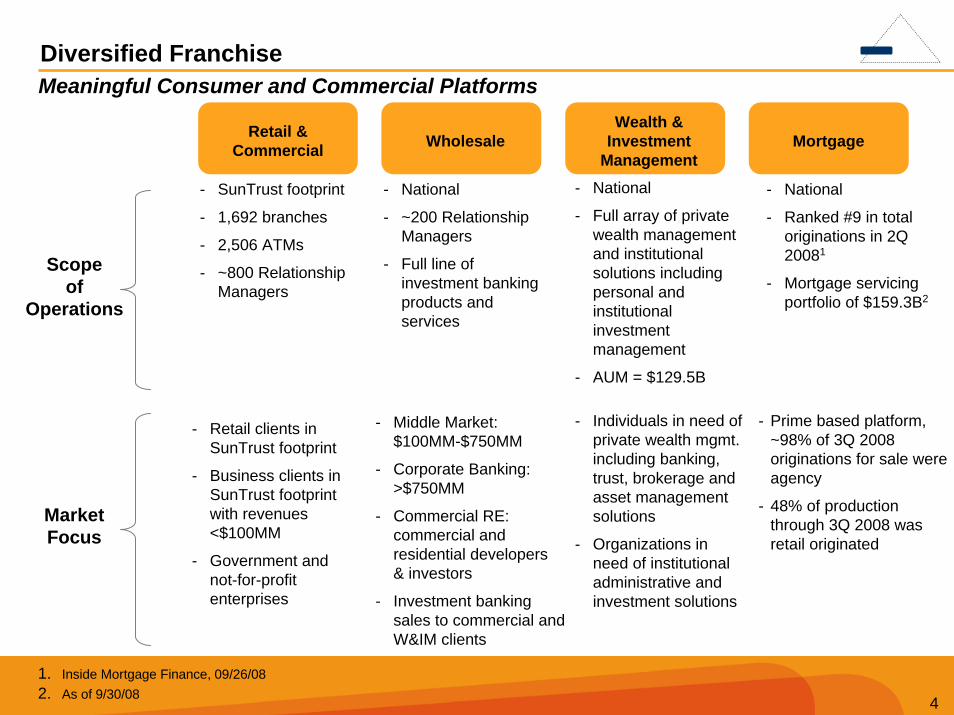
Diversified Franchise
Retail & Commercial Wholesale Mortgage
Wealth & Investment
Management
Scope of
Operations
- National
- ~200 Relationship Managers
- Full line of investment banking products and services
Meaningful Consumer and Commercial Platforms
Market Focus
- Middle Market: $100MM-$750MM
- Corporate Banking: >$750MM
- Commercial RE: commercial and residential developers & investors
- Investment banking sales to commercial and W&IM clients
- National
- Full array of private wealth management and institutional solutions including personal and institutional investment management
- AUM = $129.5B
- National
- Ranked #9 in total originations in 2Q 20081
- Mortgage servicing portfolio of $159.3B2
- SunTrust footprint
- 1,692 branches
- 2,506 ATMs
- ~800 Relationship Managers
- Individuals in need of private wealth mgmt. including banking, trust, brokerage and asset management solutions
- Organizations in need of institutional administrative and investment solutions
- Prime based platform, ~98% of 3Q 2008 originations for sale were agency
- 48% of production through 3Q 2008 was retail originated
- Retail clients in SunTrust footprint
- Business clients in SunTrust footprint with revenues <$100MM
- Government and not-for-profit enterprises
1. Inside Mortgage Finance, 09/26/082. As of 9/30/08
5
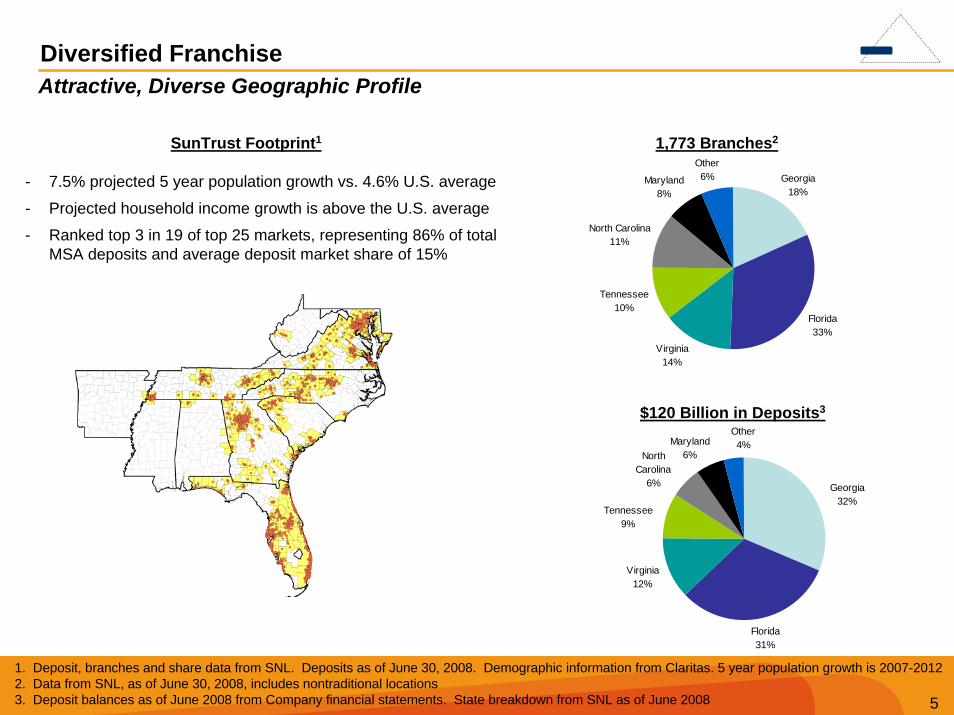
Other4%
Florida31%
North Carolina
6%
Tennessee9%
Virginia12%
Georgia32%
Maryland6%
Diversified Franchise
1,773 Branches2
Other6%
Florida33%
North Carolina11%
Tennessee10%
Virginia14%
Georgia18%
Maryland8%
$120 Billion in Deposits3
Attractive, Diverse Geographic Profile
1. Deposit, branches and share data from SNL. Deposits as of June 30, 2008. Demographic information from Claritas. 5 year population growth is 2007-20122. Data from SNL, as of June 30, 2008, includes nontraditional locations 3. Deposit balances as of June 2008 from Company financial statements. State breakdown from SNL as of June 2008
SunTrust Footprint1
- 7.5% projected 5 year population growth vs. 4.6% U.S. average
- Projected household income growth is above the U.S. average
- Ranked top 3 in 19 of top 25 markets, representing 86% of total MSA deposits and average deposit market share of 15%
6
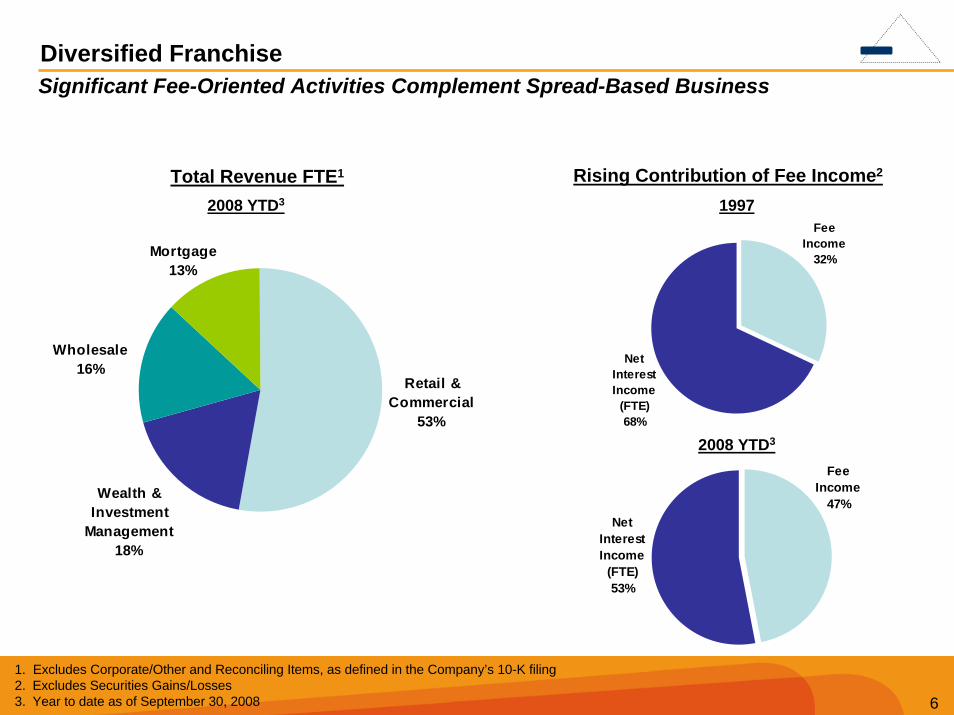
Retail & Commercial
53%
Wholesale16%
Mortgage13%
Wealth & Investment
Management18%
Diversified Franchise
Fee Income
47%Net
InterestIncome
(FTE)53%
Total Revenue FTE1 Rising Contribution of Fee Income2
Fee Income
32%
Net InterestIncome
(FTE)68%
1997
2008 YTD3
1. Excludes Corporate/Other and Reconciling Items, as defined in the Company’s 10-K filing2. Excludes Securities Gains/Losses3. Year to date as of September 30, 2008
Significant Fee-Oriented Activities Complement Spread-Based BusinessSignificant Fee-Oriented Activities Complement Spread-Based Business
2008 YTD3
7
Solid Capital and Balance Sheet
8
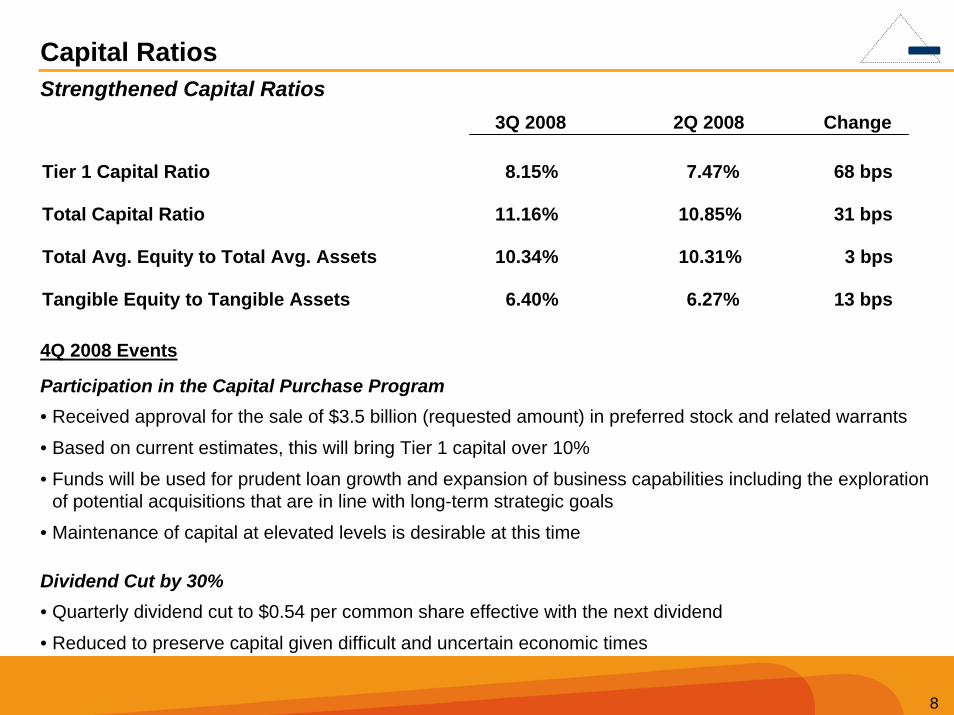
Strengthened Capital Ratios 3Q 2008 2Q 2008 Change
Tier 1 Capital Ratio 8.15% 7.47% 68 bps
Total Capital Ratio 11.16% 10.85% 31 bps
Total Avg. Equity to Total Avg. Assets 10.34% 10.31% 3 bps
Tangible Equity to Tangible Assets 6.40% 6.27% 13 bps
Capital Ratios
Participation in the Capital Purchase Program• Received approval for the sale of $3.5 billion (requested amount) in preferred stock and related warrants
• Based on current estimates, this will bring Tier 1 capital over 10%
• Funds will be used for prudent loan growth and expansion of business capabilities including the exploration of potential acquisitions that are in line with long-term strategic goals
• Maintenance of capital at elevated levels is desirable at this time
Dividend Cut by 30%• Quarterly dividend cut to $0.54 per common share effective with the next dividend
• Reduced to preserve capital given difficult and uncertain economic times
4Q 2008 Events
9
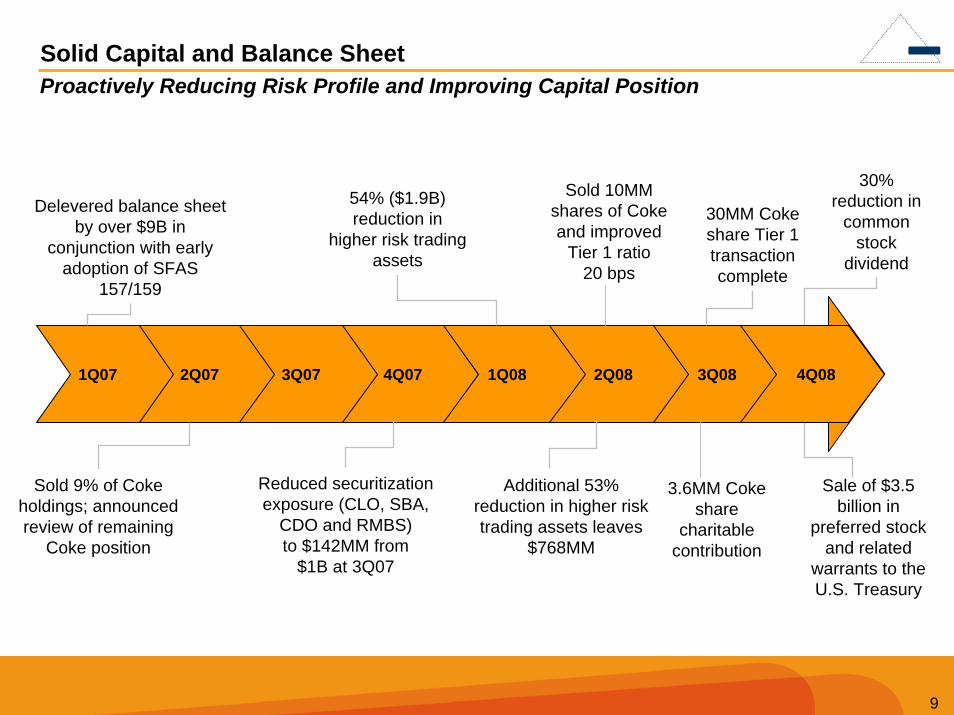
Solid Capital and Balance SheetProactively Reducing Risk Profile and Improving Capital Position
4Q072Q071Q07 3Q07
Delevered balance sheet by over $9B in
conjunction with early adoption of SFAS
157/159
Reduced securitization exposure (CLO, SBA,
CDO and RMBS)to $142MM from
$1B at 3Q07
Sold 9% of Coke holdings; announced review of remaining
Coke position
1Q08
54% ($1.9B) reduction in
higher risk trading assets
2Q08 3Q08
Sold 10MMshares of Coke and improved
Tier 1 ratio 20 bps
Additional 53% reduction in higher risk trading assets leaves
$768MM
30MM Coke share Tier 1 transaction complete
3.6MM Coke share
charitable contribution
Sale of $3.5 billion in
preferred stock and related
warrants to the U.S. Treasury
30% reduction in
common stock
dividend
4Q08
10
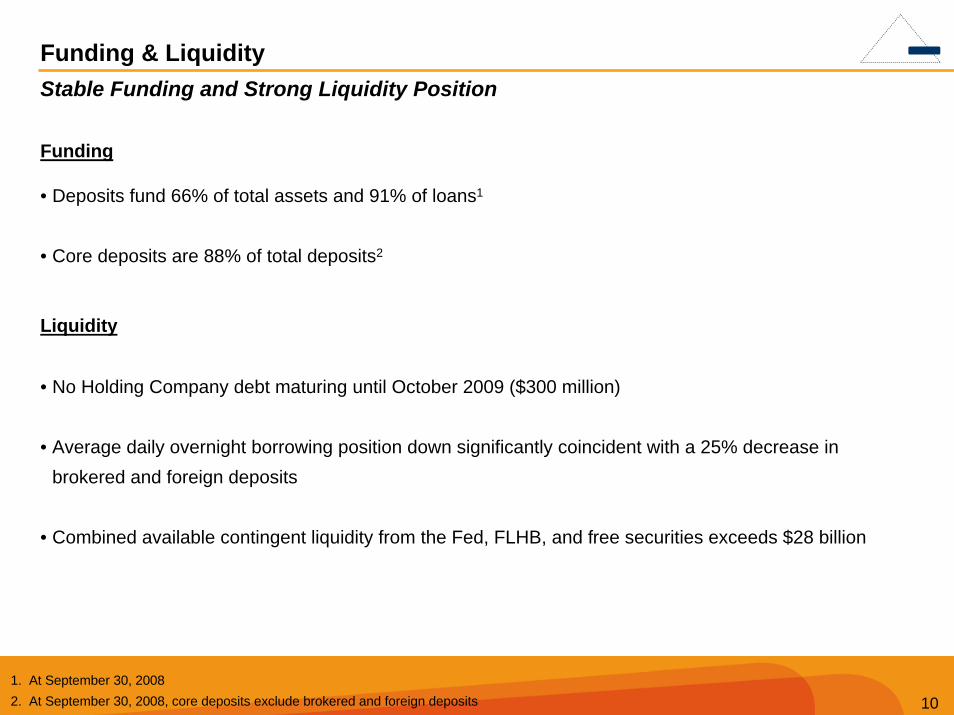
Funding & LiquidityStable Funding and Strong Liquidity Position
Funding
• Deposits fund 66% of total assets and 91% of loans1
• Core deposits are 88% of total deposits2
Liquidity
• No Holding Company debt maturing until October 2009 ($300 million)
• Average daily overnight borrowing position down significantly coincident with a 25% decrease in brokered and foreign deposits
• Combined available contingent liquidity from the Fed, FLHB, and free securities exceeds $28 billion
1. At September 30, 20082. At September 30, 2008, core deposits exclude brokered and foreign deposits
11
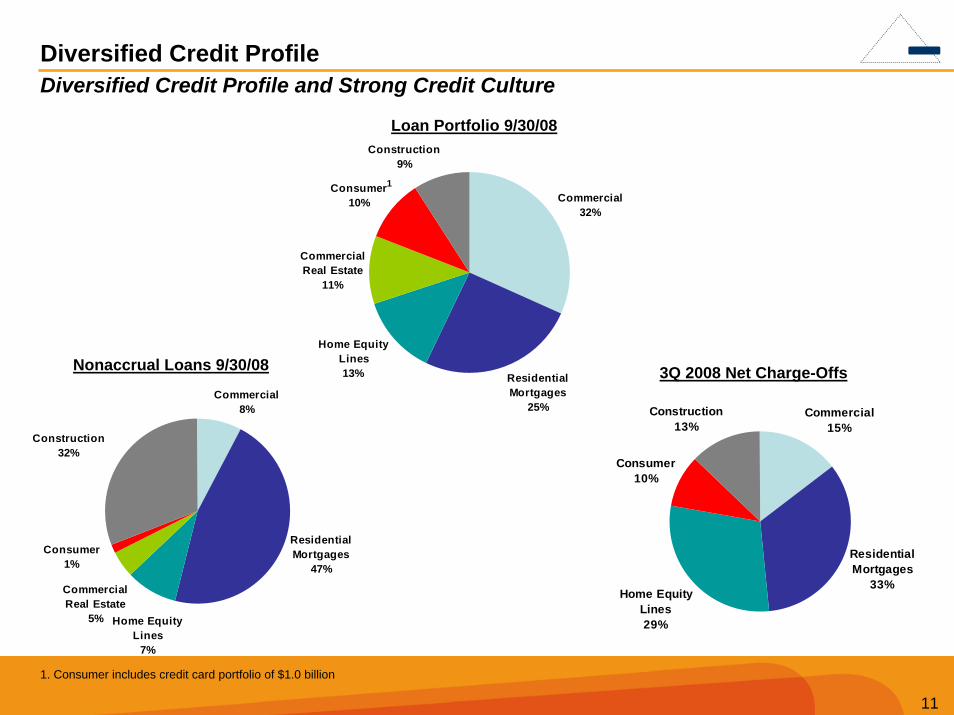
Home Equity Lines13%
Commercial Real Estate
11%
Consumer10%
Construction9%
Residential Mortgages
25%
Commercial32%
Commercial15%
Residential Mortgages
33%Home Equity
Lines29%
Consumer10%
Construction13%
Diversified Credit Profile
Commercial8%
Residential Mortgages
47%
Construction32%
Consumer1%
Commercial Real Estate
5% Home Equity Lines
7%
Nonaccrual Loans 9/30/08 3Q 2008 Net Charge-Offs
Loan Portfolio 9/30/08
Diversified Credit Profile and Strong Credit Culture
1
1. Consumer includes credit card portfolio of $1.0 billion
12
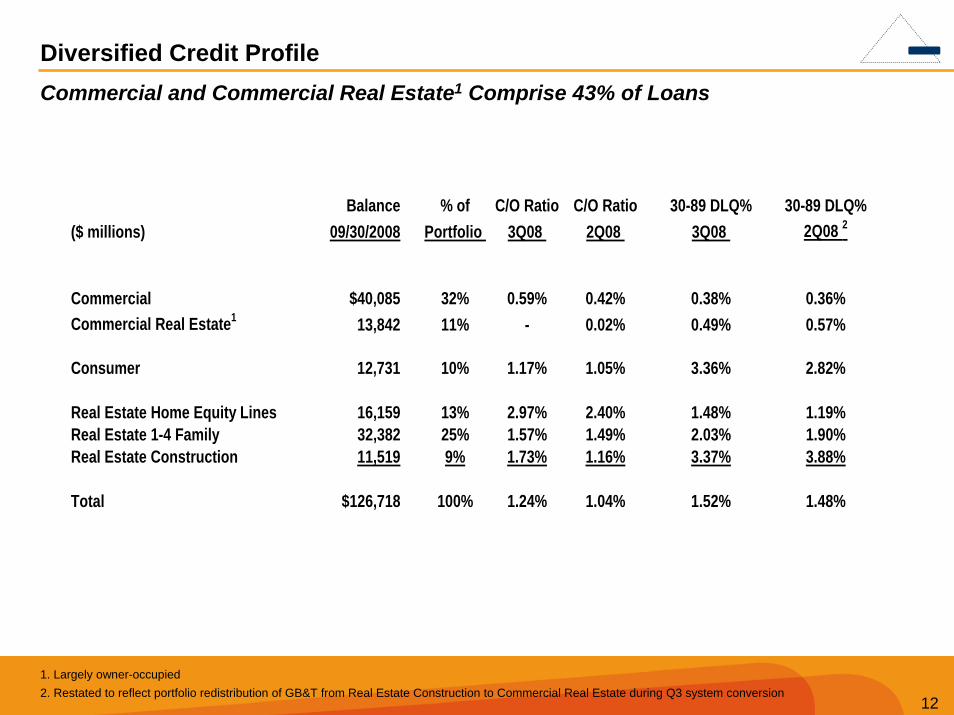
Diversified Credit ProfileCommercial and Commercial Real Estate1 Comprise 43% of Loans
1. Largely owner-occupied 2. Restated to reflect portfolio redistribution of GB&T from Real Estate Construction to Commercial Real Estate during Q3 system conversion
Balance % of C/O Ratio C/O Ratio 30-89 DLQ% 30-89 DLQ%($ millions) 09/30/2008 Portfolio 3Q08 2Q08 3Q08 2Q08 2
Commercial $40,085 32% 0.59% 0.42% 0.38% 0.36%Commercial Real Estate1 13,842 11% - 0.02% 0.49% 0.57%
Consumer 12,731 10% 1.17% 1.05% 3.36% 2.82%
Real Estate Home Equity Lines 16,159 13% 2.97% 2.40% 1.48% 1.19%Real Estate 1-4 Family 32,382 25% 1.57% 1.49% 2.03% 1.90%Real Estate Construction 11,519 9% 1.73% 1.16% 3.37% 3.88%
Total $126,718 100% 1.24% 1.04% 1.52% 1.48%
13
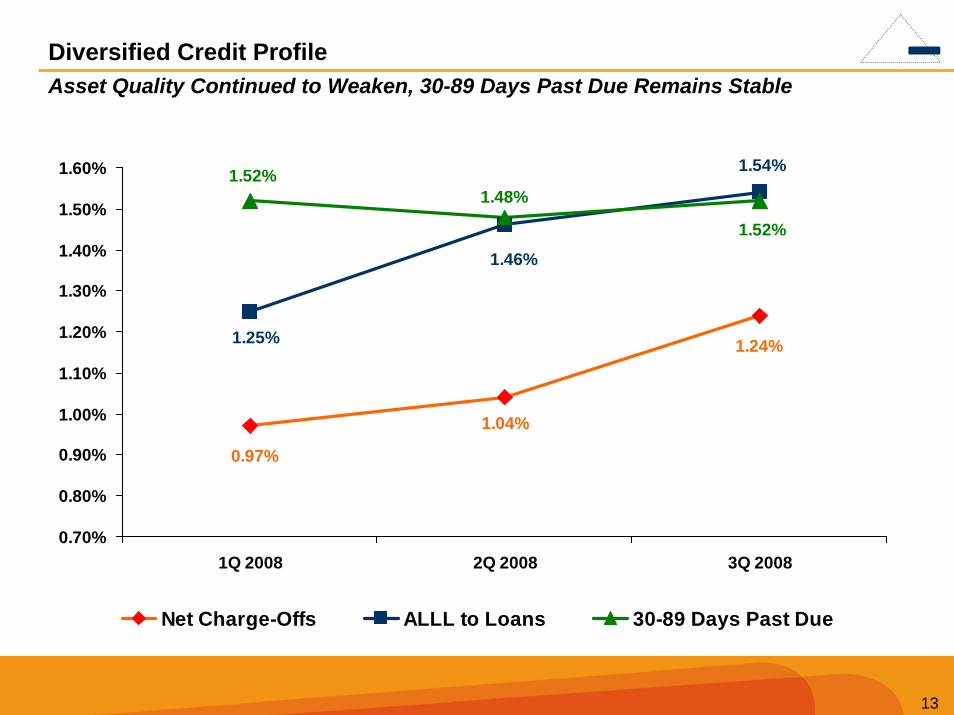
Diversified Credit ProfileAsset Quality Continued to Weaken, 30-89 Days Past Due Remains Stable
1.24%
1.04%
0.97%
1.54%
1.25%
1.46%
1.52%
1.52%1.48%
0.70%
0.80%
0.90%
1.00%
1.10%
1.20%
1.30%
1.40%
1.50%
1.60%
1Q 2008 2Q 2008 3Q 2008
Net Charge-Offs ALLL to Loans 30-89 Days Past Due
14
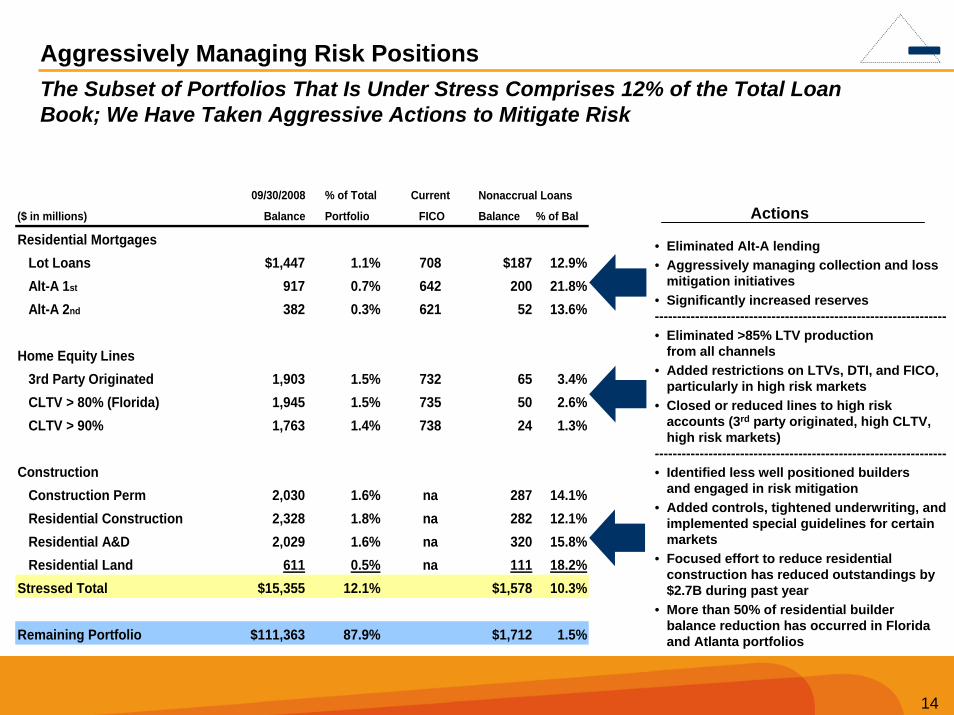
The Subset of Portfolios That Is Under Stress Comprises 12% of the Total Loan Book; We Have Taken Aggressive Actions to Mitigate Risk
Aggressively Managing Risk Positions
• Eliminated Alt-A lending• Aggressively managing collection and loss
mitigation initiatives• Significantly increased reserves-----------------------------------------------------------------• Eliminated >85% LTV production
from all channels• Added restrictions on LTVs, DTI, and FICO,
particularly in high risk markets • Closed or reduced lines to high risk
accounts (3rd party originated, high CLTV, high risk markets)
-----------------------------------------------------------------• Identified less well positioned builders
and engaged in risk mitigation• Added controls, tightened underwriting, and
implemented special guidelines for certain markets
• Focused effort to reduce residential construction has reduced outstandings by $2.7B during past year
• More than 50% of residential builder balance reduction has occurred in Florida and Atlanta portfolios
Actions09/30/2008 % of Total Current
($ in millions) Balance Portfolio FICO Balance % of Bal
Residential Mortgages Lot Loans $1,447 1.1% 708 $187 12.9% Alt-A 1st 917 0.7% 642 200 21.8% Alt-A 2nd 382 0.3% 621 52 13.6%
Home Equity Lines 3rd Party Originated 1,903 1.5% 732 65 3.4% CLTV > 80% (Florida) 1,945 1.5% 735 50 2.6% CLTV > 90% 1,763 1.4% 738 24 1.3%
Construction Construction Perm 2,030 1.6% na 287 14.1% Residential Construction 2,328 1.8% na 282 12.1% Residential A&D 2,029 1.6% na 320 15.8% Residential Land 611 0.5% na 111 18.2%Stressed Total $15,355 12.1% $1,578 10.3%
Remaining Portfolio $111,363 87.9% $1,712 1.5%
Nonaccrual Loans
15
Strategic Initiatives for Growth
16
Strategic Initiatives for Growth
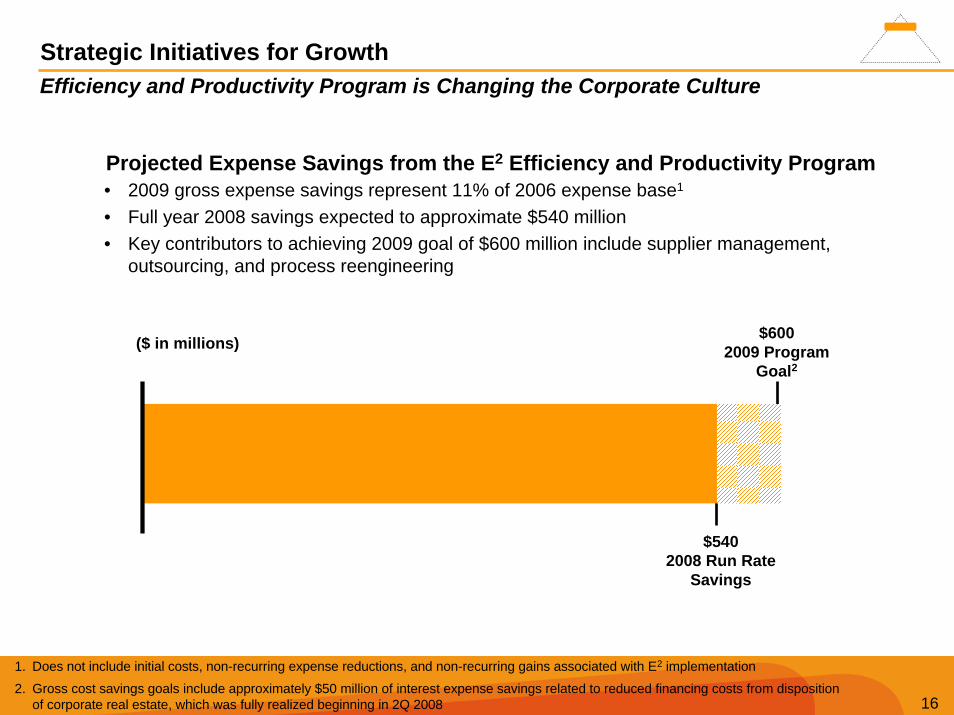
• 2009 gross expense savings represent 11% of 2006 expense base1
• Full year 2008 savings expected to approximate $540 million• Key contributors to achieving 2009 goal of $600 million include supplier management,
outsourcing, and process reengineering
1. Does not include initial costs, non-recurring expense reductions, and non-recurring gains associated with E2 implementation
2. Gross cost savings goals include approximately $50 million of interest expense savings related to reduced financing costs from disposition of corporate real estate, which was fully realized beginning in 2Q 2008
Projected Expense Savings from the E2 Efficiency and Productivity Program
Efficiency and Productivity Program is Changing the Corporate Culture
($ in millions)
$540 2008 Run Rate
Savings
$600 2009 Program
Goal2
17
Strategic Initiatives for Growth
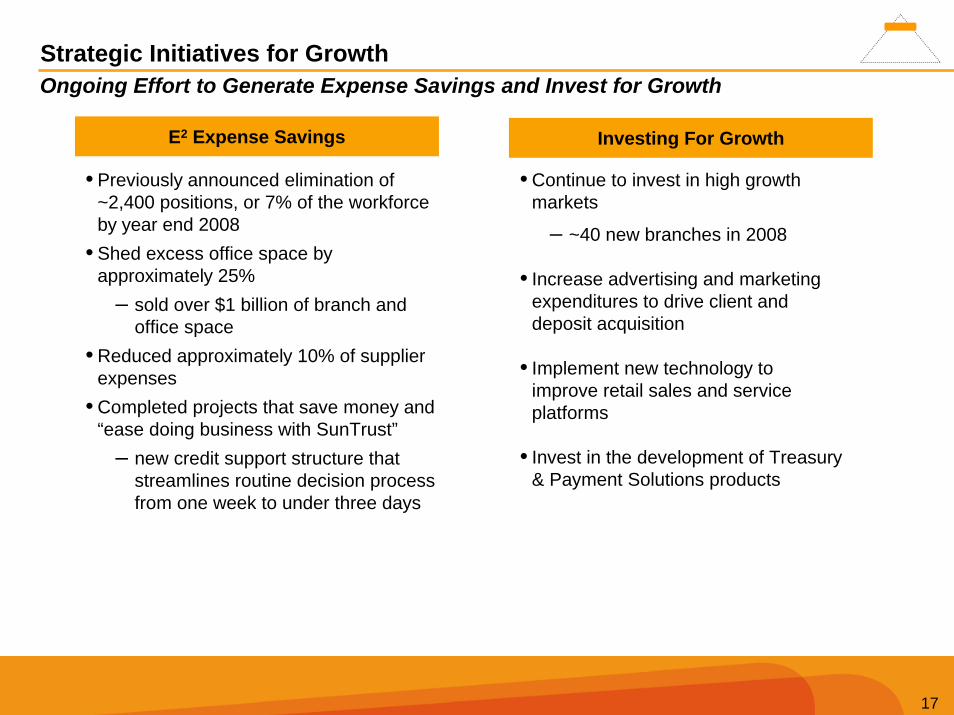
Investing For GrowthE2 Expense Savings
• Previously announced elimination of ~2,400 positions, or 7% of the workforce by year end 2008
• Shed excess office space by approximately 25%
– sold over $1 billion of branch and office space
• Reduced approximately 10% of supplier expenses
• Completed projects that save money and “ease doing business with SunTrust”
– new credit support structure that streamlines routine decision process from one week to under three days
• Continue to invest in high growth markets
– ~40 new branches in 2008
• Increase advertising and marketing expenditures to drive client and deposit acquisition
• Implement new technology to improve retail sales and service platforms
• Invest in the development of Treasury & Payment Solutions products
Ongoing Effort to Generate Expense Savings and Invest for Growth
18
Strategic Initiatives for Growth
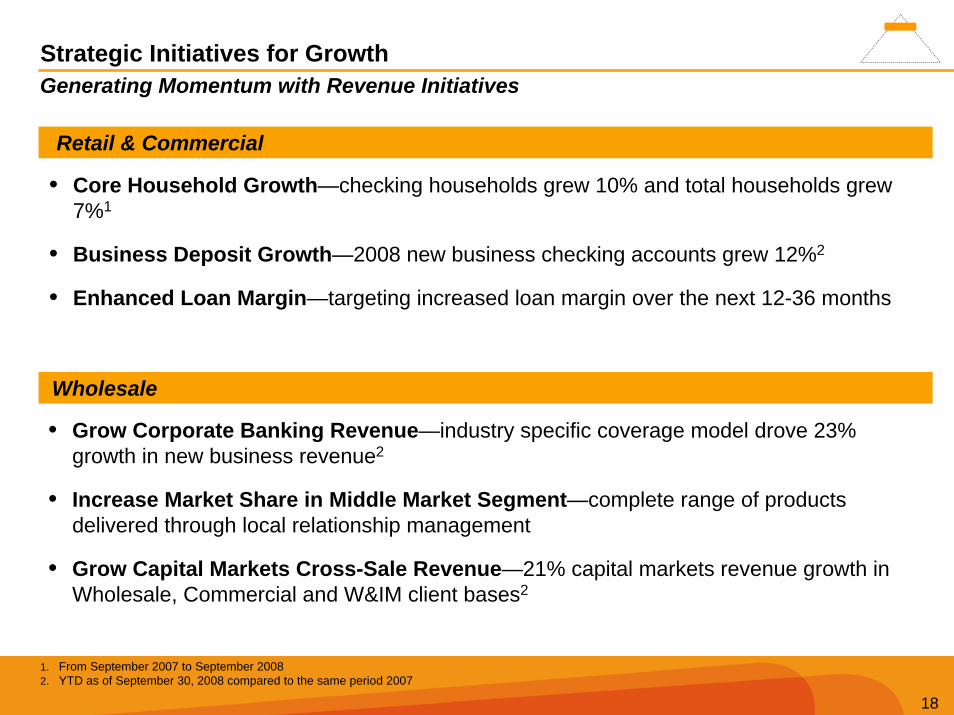
Retail & Commercial
Wholesale
Generating Momentum with Revenue Initiatives
• Grow Corporate Banking Revenue—industry specific coverage model drove 23% growth in new business revenue2
• Increase Market Share in Middle Market Segment—complete range of products delivered through local relationship management
• Grow Capital Markets Cross-Sale Revenue—21% capital markets revenue growth in Wholesale, Commercial and W&IM client bases2
• Core Household Growth—checking households grew 10% and total households grew 7%1
• Business Deposit Growth—2008 new business checking accounts grew 12%2
• Enhanced Loan Margin—targeting increased loan margin over the next 12-36 months
1. From September 2007 to September 20082. YTD as of September 30, 2008 compared to the same period 2007
19
Strategic Initiatives for Growth
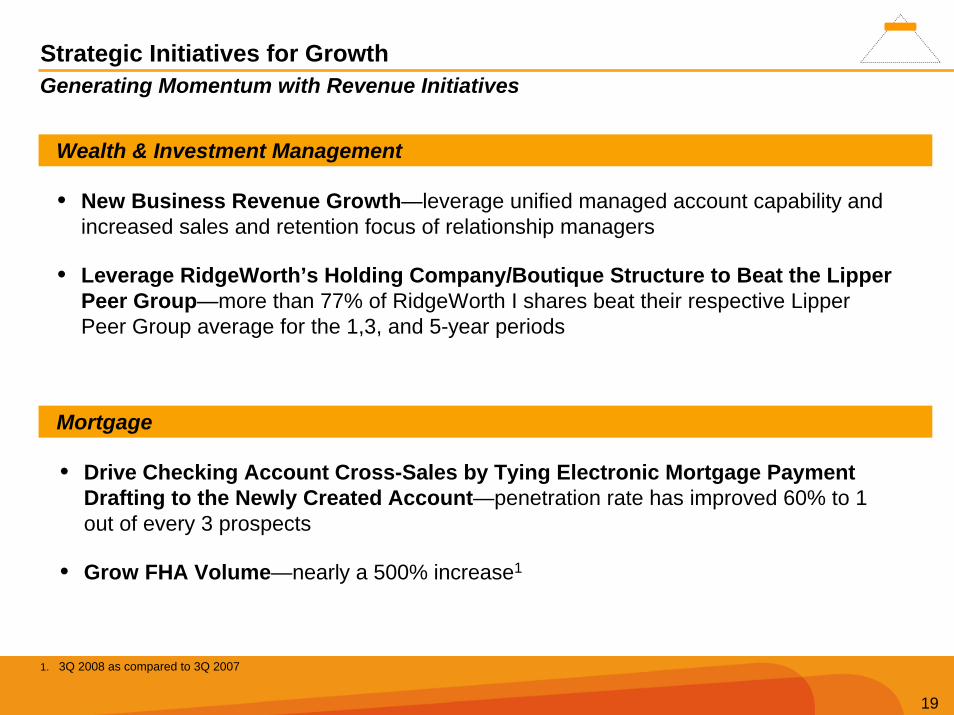
Wealth & Investment Management
Generating Momentum with Revenue Initiatives
• New Business Revenue Growth—leverage unified managed account capability and increased sales and retention focus of relationship managers
• Leverage RidgeWorth’s Holding Company/Boutique Structure to Beat the Lipper Peer Group—more than 77% of RidgeWorth I shares beat their respective Lipper Peer Group average for the 1,3, and 5-year periods
Mortgage
• Drive Checking Account Cross-Sales by Tying Electronic Mortgage Payment Drafting to the Newly Created Account—penetration rate has improved 60% to 1 out of every 3 prospects
• Grow FHA Volume—nearly a 500% increase1
1. 3Q 2008 as compared to 3Q 2007
20
Strategic Initiatives for Growth
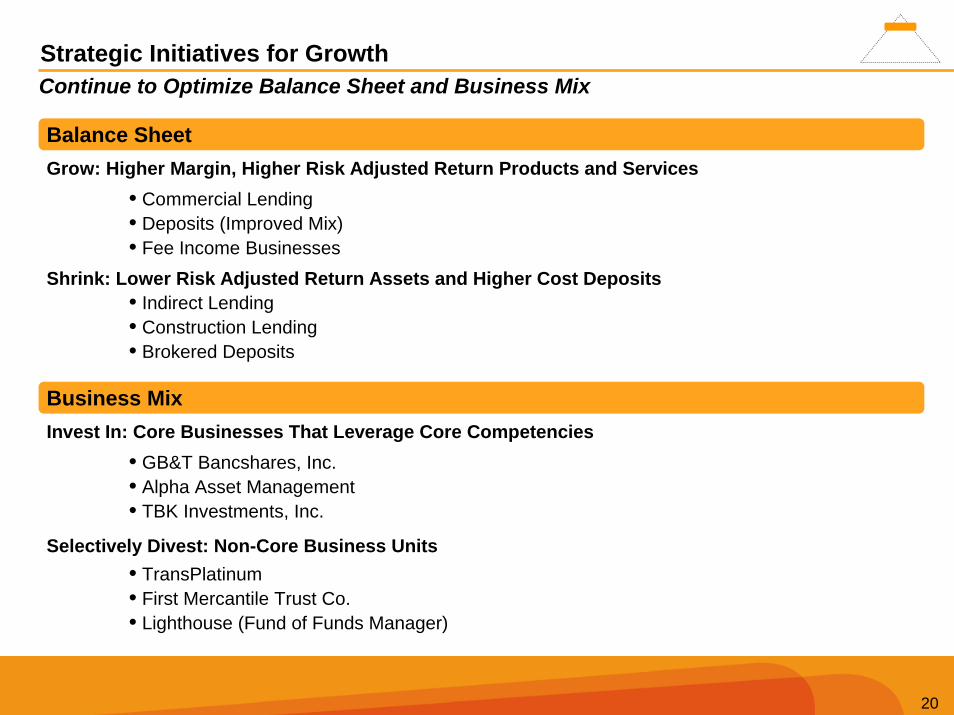
• GB&T Bancshares, Inc.• Alpha Asset Management• TBK Investments, Inc.
Selectively Divest: Non-Core Business Units• TransPlatinum• First Mercantile Trust Co.• Lighthouse (Fund of Funds Manager)
Continue to Optimize Balance Sheet and Business Mix
Balance SheetGrow: Higher Margin, Higher Risk Adjusted Return Products and Services
• Commercial Lending• Deposits (Improved Mix)• Fee Income Businesses
• Indirect Lending• Construction Lending• Brokered Deposits
Shrink: Lower Risk Adjusted Return Assets and Higher Cost Deposits
Business MixInvest In: Core Businesses That Leverage Core Competencies
21
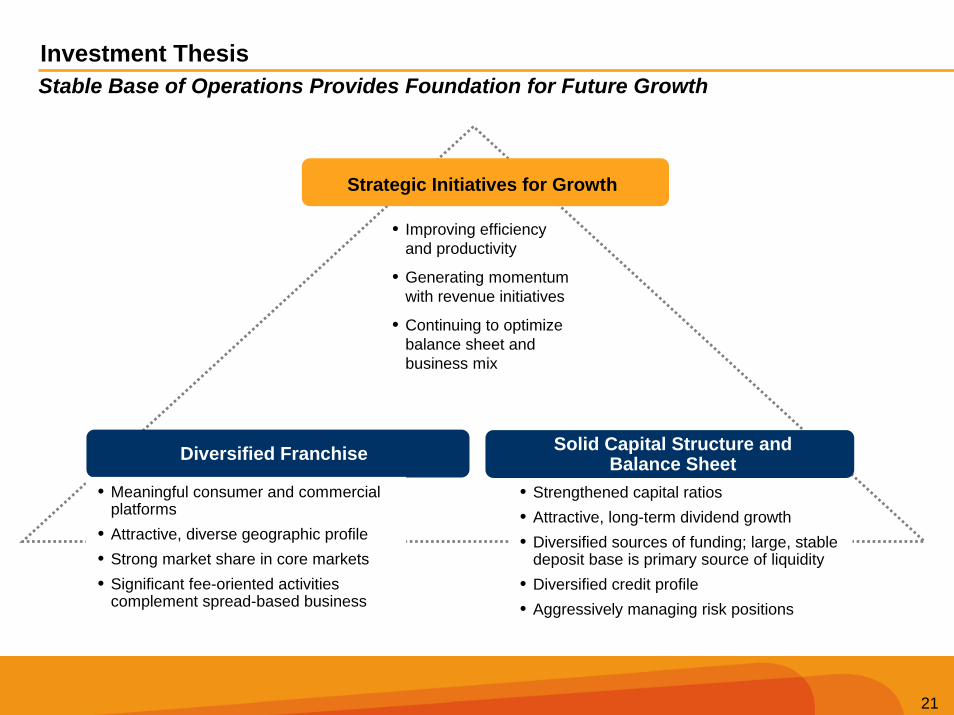
Investment Thesis
Diversified Franchise
• Meaningful consumer and commercial platforms
• Attractive, diverse geographic profile• Strong market share in core markets• Significant fee-oriented activities
complement spread-based business
• Strengthened capital ratios • Attractive, long-term dividend growth • Diversified sources of funding; large, stable
deposit base is primary source of liquidity• Diversified credit profile • Aggressively managing risk positions
Strategic Initiatives for Growth
• Improving efficiency and productivity
• Generating momentum with revenue initiatives
• Continuing to optimize balance sheet and business mix
Stable Base of Operations Provides Foundation for Future Growth
Solid Capital Structure and Balance Sheet
Merrill Lynch Banking and Financial Services ConferenceNovember 13, 2008
Mark A. ChancyChief Financial Officer
23
Appendix
24
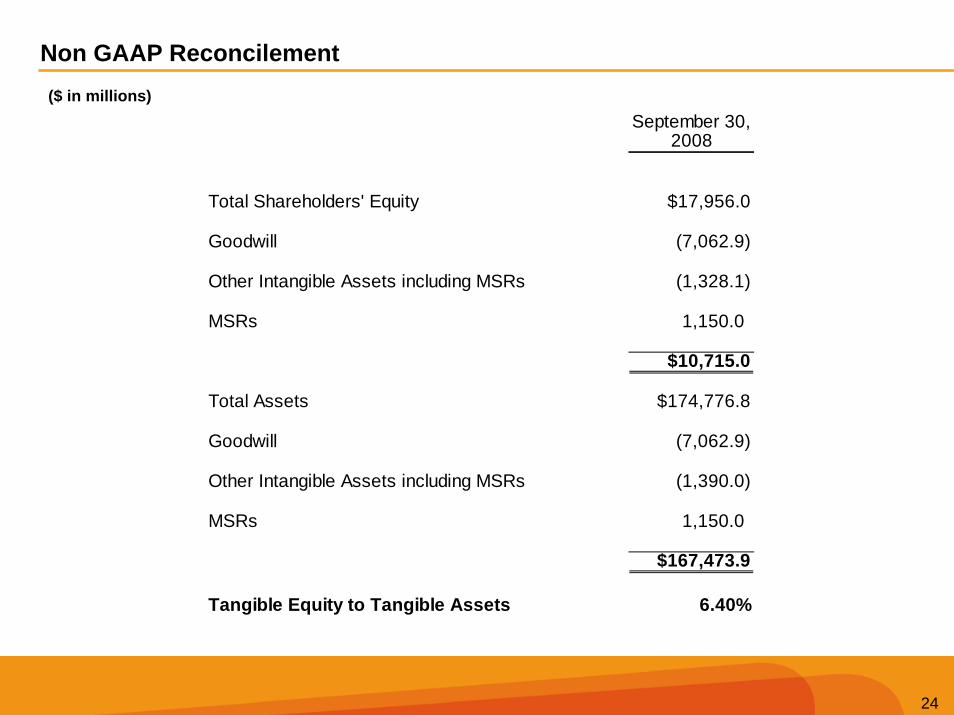
September 30,2008
Total Shareholders' Equity $17,956.0
Goodwill (7,062.9)
Other Intangible Assets including MSRs (1,328.1)
MSRs 1,150.0
Tangible Equity $10,715.0
Total Assets $174,776.8
Goodwill (7,062.9)
Other Intangible Assets including MSRs (1,390.0)
MSRs 1,150.0
Tangible Assets $167,473.9
Tangible Equity to Tangible Assets 6.40%
Non GAAP Reconcilement($ in millions)