Sunil Hi Tech Engineers Ltd BUY -...
23
Sunil Hi Tech Engineers Ltd BUY - 1 - Tuesday, 17 th October, 2017 This document is for private circulation, and must be read in conjunction with the disclaimer on the last page. STOCK POINTER Target Price ₹ 33.5 CMP ₹ 12.7 Index Details Sunil Hitech is no novice when it comes to executing the infrastructure business. In fact, not many are aware that Sunil Hitech has successfully executed 46129 MW of power infrastructure, the highest by any infrastructure company in the country. As it shifts focus from power to roads, infrastructure projects, we believe that Sunil Hitech will be successful in executing the latter with equal aplomb. However, the market is not valuing its full potential due to the recent turbulence around the change in promoter ownership and consequent concerns over the likely impact on its business prospects. To make matters worse, the general apathy towards the infrastructure sector and declining profitability of the power segment had only accentuated matters further. However, we believe that the worst is behind us and redressal of the problems stated above should improve business prospects significantly. Erstwhile promoters (parents of Mr. Sunil Gutte) have exited the company by selling their holdings in the open market. The present promoters are consolidating their holding and infusing equity to the tune of Rs. ~107 crores (through warrants) and on fully exercising the warrants, the promoters holding, should improve to 48.5% from the current 35.4%. We believe that the promoter may also undertake creeping acquisition to enhance the stake further. This augurs well for bolstering confidence of investors as the skin in the game is enhanced. We are optimistic about the company’s prospects, given that: Sensex 32609 Nifty 10234 Industry Engineering Scrip Details MktCap (` cr) 477.6 BVPS (`) 13.6 O/s Shares (Cr) 37.9 AvVol 15.16Lakhs 52 Week H/L 23.4/8.3 Div Yield (%) 0.6 FVPS (`) 1.0 Shareholding Pattern Shareholders % Promoters 35.4 Public 64.6 Total 100.0 SHEL vs. Sensex 0 5 10 15 20 25 0 5000 10000 15000 20000 25000 30000 35000 SENSEX SHEL Key Financials (` in Cr) Y/E Mar Net Sales EBITDA PAT EPS (Rs) EPS Growth (%) RONW (%) ROCE (%) P/E (x) EV/EBITDA (x) 2017 2559.6 202.3 39.5 1.0 -32.3 8.0 16.8 12.1 4.5 2018E 2999.5 261.3 56.6 1.3 22.1 9.3 18.2 9.9 4.4 2019E 3684.9 347.6 81.3 1.5 18.0 10.5 19.2 8.4 4.1 2020E 4218.1 401.7 87.9 1.6 8.2 9.8 18.7 7.8 4.1
Transcript of Sunil Hi Tech Engineers Ltd BUY -...
Sunil Hi Tech Engineers Ltd BUY
- 1 - Tuesday, 17th October, 2017
This document is for private circulation, and must be read in conjunction with the disclaimer on the last page.
ST
OC
K P
OIN
TE
R
Target Price ₹ 33.5 CMP ₹ 12.7
Index Details Sunil Hitech is no novice when it comes to executing the
infrastructure business. In fact, not many are aware that Sunil Hitech
has successfully executed 46129 MW of power infrastructure, the
highest by any infrastructure company in the country. As it shifts
focus from power to roads, infrastructure projects, we believe that
Sunil Hitech will be successful in executing the latter with equal
aplomb.
However, the market is not valuing its full potential due to the recent
turbulence around the change in promoter ownership and
consequent concerns over the likely impact on its business
prospects. To make matters worse, the general apathy towards the
infrastructure sector and declining profitability of the power
segment had only accentuated matters further.
However, we believe that the worst is behind us and redressal of the
problems stated above should improve business prospects
significantly. Erstwhile promoters (parents of Mr. Sunil Gutte) have
exited the company by selling their holdings in the open market. The
present promoters are consolidating their holding and infusing
equity to the tune of Rs. ~107 crores (through warrants) and on fully
exercising the warrants, the promoters holding, should improve to
48.5% from the current 35.4%.
We believe that the promoter may also undertake creeping
acquisition to enhance the stake further. This augurs well for
bolstering confidence of investors as the skin in the game is
enhanced.
We are optimistic about the company’s prospects, given that:
Sensex 32609
Nifty 10234
Industry Engineering
Scrip Details
MktCap (` cr) 477.6
BVPS (`) 13.6
O/s Shares (Cr) 37.9
AvVol 15.16Lakhs
52 Week H/L 23.4/8.3
Div Yield (%) 0.6
FVPS (`) 1.0
Shareholding Pattern
Shareholders %
Promoters 35.4
Public 64.6
Total 100.0
SHEL vs. Sensex
0
5
10
15
20
25
0
5000
10000
15000
20000
25000
30000
35000
SENSEX SHEL
Key Financials (` in Cr)
Y/E Mar Net
Sales EBITDA PAT
EPS
(Rs)
EPS
Growth (%)
RONW
(%)
ROCE
(%)
P/E
(x)
EV/EBITDA
(x)
2017 2559.6 202.3 39.5 1.0 -32.3 8.0 16.8 12.1 4.5 2018E 2999.5 261.3 56.6 1.3 22.1 9.3 18.2 9.9 4.4 2019E 3684.9 347.6 81.3 1.5 18.0 10.5 19.2 8.4 4.1 2020E 4218.1 401.7 87.9 1.6 8.2 9.8 18.7 7.8 4.1

- 2 - Tuesday, 17th October, 2017
This document is for private circulation, and must be read in conjunction with the disclaimer on the last page.
Order book of 5018 crores as on 30th June, 2017 (2x FY17 revenues)
continues to remain robust and this should lead to sustaining the strong
revenue growth of 18.1% CAGR to Rs. 4218.1 by FY20.
Margins are set to expand as the revenue share of the high margin road
business improves. We expect margins to improve by ~160 bps to 9.5% by
FY20.
Recently, the company won a Hybrid Annuity Model (HAM) project for Rs
982 crores. We believe that the high ROCE HAM projects would encourage
the management to up its bidding for further such projects as the way
forward.
Earnings are expected to grow at a CAGR of 30.6% to Rs 87.9 crores by
FY20 with a healthy improvement in return ratios of ROE and ROCE by 180
bps and 200bps to 9.8% and 18.7% respectively.
With ratios returning to industry levels, the valuation is also expected to
improve sharply.
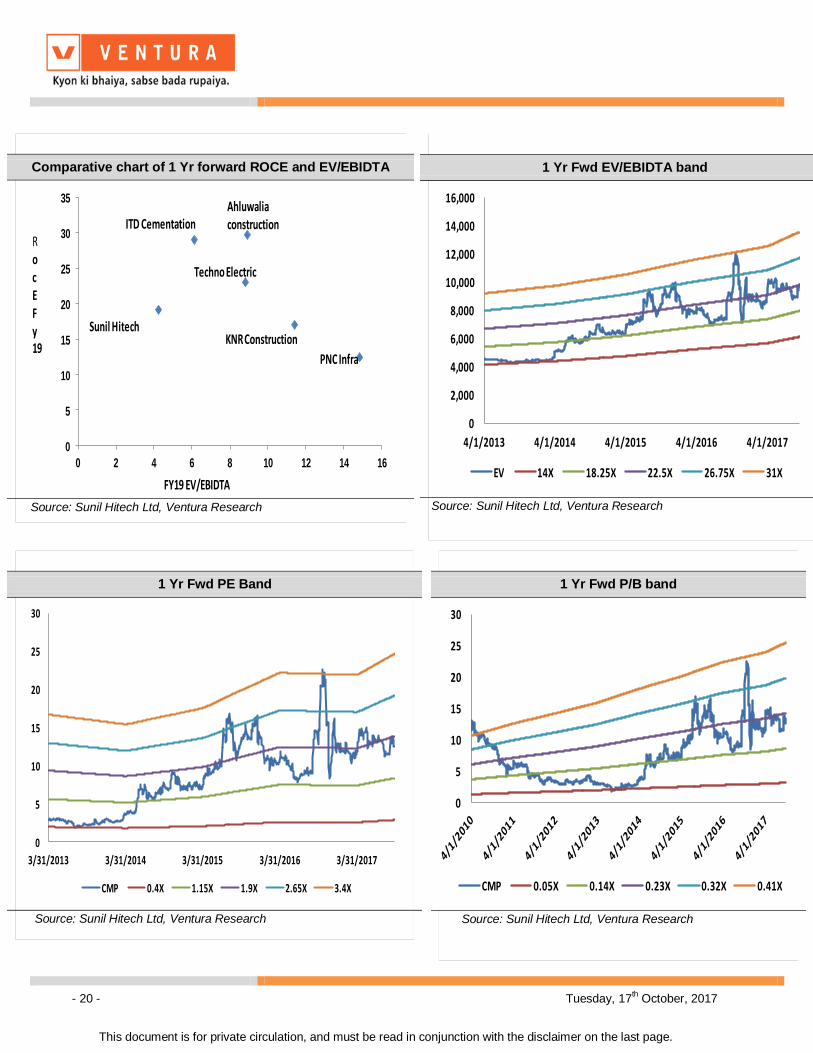
Currently the stock trades at 4.1x FY19 EV/EBITDA which is at a significant
discount of ~83% to the median industry level of 9.2x FY19EV/EBIDTA. We
recommend a BUY at the CMP of Rs 12.7 for a price target of Rs 33.5,(7.5x
FY19EV/EBIDTA) representing an upside of 165.7% over a period of 24
months.

- 3 - Tuesday, 17th October, 2017
This document is for private circulation, and must be read in conjunction with the disclaimer on the last page.
Company Background
Sunil Hitech Engineers Limited (SHEL), a major Engineering, Procurement &
Construction (EPC) Company, started its journey as M/s. Sunil Engineering
Works (SEW) in 1984 (a proprietary company led by Mr. Ratnakar M. Gutte). In
1998, the company got incorporated as Sunil HiTech Engineers Pvt. Ltd. The
company was converted into Sunil Hitech Engineers Ltd (“SHEL” or “The
Company”) on, 18th August 2005 and got listed in 2006. The company
undertakes EPC projects across the business segments of power, roads,
building construction and has an impressive list of marquee clients. Recently,
the company has also won an award for a HAM project.
Business Verticals of Sunil Hitech Ltd
Source :Sunil Hitech Ltd, Ventura Research, (FY17 consolidated segment wise classification not yet available), RS- Revenue share
Impressive portfolio of marquee clients
Source :Sunil Hitech Ltd, Ventura Research (FY17 consolidated segment wise classification not yet available)

- 4 - Tuesday, 17th October, 2017
This document is for private circulation, and must be read in conjunction with the disclaimer on the last page.
Key Investment Highlights
Strong revenue growth on the cards
Historically revenues grew at a scorching pace but margins were
sacrificed
Over the period FY07 to FY13, the revenues of SHEL grew at a handsome
CAGR of 42.7% to Rs 1252.8 crore in FY13 from Rs 148.3 crore clocked in
FY07. This growth journey was primarily driven by order wins from the power
sector and the business margins peaked at 14.6% (in FY11). However, with new
projects coming to a standstill amidst intense competition, margins took a hit
falling by 300bps over the period FY11-13. Realizing the shifting dynamics of
the power segment, the company took a conscious decision to diversify towards
road EPC as they are high ticket orders as compared to power EPC business
and thus with increasing contribution from road EPC, margins are expected to
get a boost.
The period FY14-17 saw margins stagnate below 10% (except FY16 where
margins just touched 10%) and hit a trough of 7.9% in FY17 due to a one time
write off to the tune of Rs 19.5 crore on account of bad debts. Despite poor
margins the revenues have grown at a healthy CAGR of 17.6% from Rs 1574.6
crore in FY14 to Rs 2559.6 crore in FY17.
Although the management has guided for >10% margins in coming years as
activity in road segment gathers pace, we would like to err on the side of caution
and require to see the proof in the pudding. We have therefore built margins of
8.7%/9.4%/9.5% in FY18/19/20.
Historical strong growth at the cost of margins
0
2
4
6
8
10
12
14
16
18
0
500
1000
1500
2000
2500
3000
3500
4000
4500
FY07 FY08 FY09 FY10 FY11 FY12 FY13 FY14 FY15 FY16 FY17 FY18E FY19E FY20E
Sales EBIDTA EBIDTA margins (%)
Rs in cr
(%)Margins were compressed from FY14-17
Margins to return to >10% levels.Margins > 10%
CAGR 42.7%
Source: Sunil Hitech Ltd, Ventura Research
Margins fell in FY17 due to one time write off on account of bad debt to the tune of Rs
19.5 crores.

- 5 - Tuesday, 17th October, 2017
This document is for private circulation, and must be read in conjunction with the disclaimer on the last page.
During FY15-17, the revenues from the roads witnessed a sharp ramp up as the
order book bulged.
Strong order backlog to maintain high growth in revenues
With a current order book of Rs 5018 crore, we expect net revenues to grow at a
CAGR of 18.1% from Rs 2559.6 crore in FY17 to Rs 4218.1 crore in FY20 on
the back of:
a) The NHAI plans to build 50,000 km of roads worth USD 2.5 billion by
2022 as part of a long term goal of doubling the length of the national
highway network to 2,00,000 km.
b) The management has guided for an order intake of 3500-4000 crore
in FY18, which will help the company maintain an order book size of
2x-2.2x company’s sales.
c) The company has received LoA for four/six laning of the Bodhre to
Dhule stretch of new NH-211 from NHAI in Maharashtra under the
Hybrid Annuity Model (HAM) of Rs 982 crore.
Sunil Hitech has historically seen strong order book and is expected to maintain the growth
Particulars (Rs in crores) FY12 FY13 FY14 FY15 FY16 FY17 FY18E FY19E FY20E
Opening order book 1702.0 1723.4 2295.0 3243.0 3580.0 3249.6 5189.2 5863.8 6743.4
Add: Order Inflow** 979.2 1824.5 2522.6 2173.5 1690.9 4499.2 3674.1 4564.5 5229.6
Less: Execution* 957.8 1252.8 1574.6 1836.5 2021.3 2559.6 2999.5 3684.9 4218.1
Closing order book 1723.4 2295.0 3243.0 3580.0 3249.6 5189.2 5863.8 6743.4 7754.9
a)Civil and sructural 1420.5 1338.5 1086.6 901.5 630.3 269.3
b)Roads 494.4 863.5 3183.5 3664.8 3767.8 3289.8
c)Others 1665.1 1047.6 919.1 1297.5 2345.3 4195.8
Revenues 957.8 1252.8 1574.6 1836.5 2021.3 2559.6 2999.5 3684.9 4218.1
Book to bill (x) 1.8 1.8 2.1 1.9 1.6 2.0 2.0 1.8 1.8
Source: Sunil Hitech Ltd, Ventura Research (Order book bifurcation not available for FY12-14)
As revenues from roads picks up….EBIDTA will improve
Particulars (Rs in cr) FY15 FY16 FY17
Roads revenue 0.0 101.2 327.9
Roads order book 494.4 863.5 3183.5
Overall EBIDTA margins in % 9.4 10.2 7.9
Source: S Source: Sunil Hitech Ltd, Ventura Research

- 6 - Tuesday, 17th October, 2017
This document is for private circulation, and must be read in conjunction with the disclaimer on the last page.
Further the management has guided for an order intake of 3500-4000 crore in
FY18, which will help the company to maintain order book size of ~2x
company’s sales.
We believe that Sunil Hitech should achieve its guidance as the company is
slowly carving a niche in the road segment which is visible from the fact that
recently the company’s qualification for Road EPC projects from NHAI and
MORTH was upgraded to 2/4/6 lanes from erstwhile 2/4 lane projects. Similarly,
the company is now qualified to bid for EPC projects worth upto Rs 700 crore
(500 crore earlier) and BOT and Annuity projects of upto Rs 1200 crore (900
crore earlier). Besides EPC for roads, the company has also forayed into EPC
for various high growth sectors like solar, railways, water and sewage
management.
Going forward HAM will be the preferred vehicle for Road EPC thrust
Recently, SHEL has won its first HAM project to construct and widen the
existing 2-lane Bodhre to Dhule road section of NH-211 to four/six lane
configuration in the State of Maharashtra for a consideration of Rs 982 crores.
Besides this, there is also a provision of 6% inflation over the awarded price for
the project. The project is to be completed by April, 2021. SHEL will execute the
project through its subsidiary in which it will have a 70% stake. As per the
management, the total cost of the project is around Rs 800 crores and the
company will receive a grant from NHAI to the tune of Rs 425 crore, which will
bring down the project cost to Rs 375 crores. Of this Rs 375 crore, the equity
component will be for Rs 75 crores while the remaining component will be raised
via debt. This project will open doors for SHEL to win many such projects in the
HAM segment in the future.
HAM project capital structure
Particulars Rs in cr Rs in cr Rs in cr
Awarded Price 982.0
Cost of Project
i) Grant by NHAI 425
ii) Funding to be done
Debt @ 80% 300.0
Equity @ 20% 75.0 375.0 800.0
Source: Sunil Hitech Ltd, Ventura Research

- 7 - Tuesday, 17th October, 2017
This document is for private circulation, and must be read in conjunction with the disclaimer on the last page.
We have valued the HAM project of Rs 982 crore separately by discounting the
future cash profits @ 9.2% (which is the weighted average cost of capital) and
have arrived at the present value of future cash profits. Accordingly, we have
arrived at the share value of Rs 5.6 by March, 20.
Onward strategy: More of Roads, less of Power
SHEL has selected to focus on road building (via EPC or HAM) and civil
construction projects while moderating exposure to Balance of Plant power
projects which enjoys low margins as compared to roads. This will progressively
increase the minimum hurdle rate as far as profitability is concerned, enable
cost-effective project execution, timely receivables and a lower debt
dependence. This has begun to strengthen the Company’s overall margins and
business sustainability in the last three years. Further the segment has also
proved to be highly margin accretive and management expects the margins to
be around ~12-14% in this segment in the future.
The road segment is also expected to be a big contributor to the order book of
the company going forward (current order book of Rs 3183.5 crore). This is also
visible by the fact that the order book for roads has increased at a staggering
rate of 153.8% over FY15-17.
Value of HAM project per share
Valuation of HAM project
FV at end of Mar,20 320.5 crores
FV at end of Mar,19 293.6 crores
FV at end of Mar,18 269.0 crores
PV as on 30th Sept,2017 @ 9.2% 257.2 crores
No of shares as on date 37.8 nos
Value per share as on date 6.8 Rs/share
No of shares as on Mar 18 51.0 nos
Value per share as on Mar 18 5.3 Rs/share
No of shares as on Mar 19 57.2 nos
Value per share as on Mar 19 5.1 Rs/share
No of shares as on Mar 20 57.2 nos
Value per share as on Mar 20 5.6 Rs/share
Source: Sunil Hitech Ltd, Ventura Research

- 8 - Tuesday, 17th October, 2017
This document is for private circulation, and must be read in conjunction with the disclaimer on the last page.
We expect overall revenues from the road segment to grow at a CAGR of 54.4%
over FY17-20 to Rs 1478 crore in FY20 as the company starts booking
revenues from the HAM project.
Further, the company expects to receive early completion bonus for the
Bankura-Purulia project in the range of Rs 9.5-10 crores, which proves the
company’s execution capability in the road segment.
Road order book grew at CAGR of 153.8%
494.4
863.5
3183.5
0
500
1000
1500
2000
2500
3000
3500
FY15 FY16 FY17
Road order book
Rs in cr
Source: Sunil Hitech Ltd, Ventura Research
Road revenues expected to see significant jump
0
2
4
6
8
10
12
14
0
200
400
600
800
1000
1200
1400
1600
FY17* FY18E FY19E FY20E
Rs in crores (%)
Source: Sunil Hitech Ltd, Ventura Research *Consolidated figure is estimated from standalone figure breakup

- 9 - Tuesday, 17th October, 2017
This document is for private circulation, and must be read in conjunction with the disclaimer on the last page.
EPC for Power (Structural & Civil)
The Company entered this business vertical space in 1998 and was associated
with the completion of 46129 MW worth of power plants in India, the largest by
any company.
The Company specialises in EPC / turnkey projects up to 800MW, erection of
boilers, TG and auxiliaries, BTG renovation and modernisation, T&D projects,
overhauling, operation and maintenance of power plants upto 600 MW.
Further, the Company possesses in-house engineering and fabrication
competence in boiler components through subsidiary SEAM Industries Limited
(94% holding).
The company also plans to foray into EPC for solar power projects and as a
pilot, the company commissioned a self owned 5 MW EPC renewable energy
project in Solapur (through a 100%-subsidiary) for establishing qualification for
the EPC solar sector. The plant generated revenues of Rs 5.9 crore in FY17.
We expect revenues from Civil & Structural business to remain more or less
stable as the company focuses more and more on road EPC. As per our
Ongoing road projects and their status of completion
Name of the Project and authority Scope Amt in cr Date of LOA Completion Year
Bankura- Purulia Road Section of NH60 A- MORTH 84 Km 322.0 3/31/2017 Mar-18
Sitamrahi- Jaynagar- narahia section of NH-104
MORTH 28.5Km 154.7 10/15/2015 May-18
Sitamrahi- Jaynagar- narahia section of NH-104
MORTH 77.1 Km 319.7 10/15/2015 Dec-18
Madhugiri- Mulbagal Road Section MORTh 56.5 Km 122.0 2/27/2015 Jul-17
Hunli- Anini Stretch - NHIDCL 92.5 Km 434.0 9/12/2016 Oct-19
Bodhre - Dulhe Section of NH -211- NHDP-IV 67.2 Km 982.0 3/2/2017 Apr-21
Parli-Pimpa Dahiguda Road- MORTH 18.4 Km 134.5 3/30/2017 Jun-19
Mehkar to Ajispur -MORTH 35.8 Km 160.2 3/31/2017 Jul-17
Ajanta- Buldhana- Khamgaon- Shegaon- Deori
Road- MORTH 49.1 km 257.4 3/31/2017 Aug-19
Nanded- Bhokar- Himayatnagar- Kinwat-Sarkhani-
Mahur-Arni Road- MORTH 57 km 308.2 3/30/2017 Jun-19
Kutchery Chowk-Ranchi-Piska Mre-Biju Para
section- NHAI 34 km 235.9 3/31/2017
Appointed date yet
to be finalised
Total 3430.5
S Source: Sunil Hitech Ltd, Ventura Research

- 10 - Tuesday, 17th October, 2017
This document is for private circulation, and must be read in conjunction with the disclaimer on the last page.
estimates, we expect a dip in revenues in FY18 from this segment mainly due to
a decline in the order book. However, post that, we expect the company to again
pick up activity in this segment and to return to ~811 crore levels by FY20.
Major Projects undertaken for Power
Project Description CV Inr crs
Koradi- MAHAGENCO
Civil, structural & Arch works of
3x660W Main plant package 215.0
DB Power- Raigad, CG
Civil, structural & Arch works of
2x660W Main plant & BOP
package 170.0
NTPC Kudgi
Construction of Ash Dyke for
3x800MW 183.0
NTPC Meja
CW and make up water system
package of 2x660MW 174.9
MAHAGENCO Parli
Balance of Plant (BOP) Package on
EPC Basis 487.0
BHEL North Karanpura
Main Plant Civil works package of
Unit-1 &3, 3x660 200.0
ACPL/Abir Singhi Rtarai
Erection testing & Commissioning
of boilers for 2x600 MW 130.0
Source: Sunil Hitech Ltd, Ventura Research
Civil & structural revenues to see flat growth
6
7
8
9
10
0
100
200
300
400
500
600
700
800
900
FY17* FY18E FY19E FY20E
Rs in crores (%)
Source: Sunil Hitech Ltd, Ventura Research *Consolidated figure is estimated from standalone figure breakup

- 11 - Tuesday, 17th October, 2017
This document is for private circulation, and must be read in conjunction with the disclaimer on the last page.
Solid waste management- A high growth opportunity
Sunil Hitech views this segment as a high-growth business and possesses the
requisite technical expertise to execute large and complex projects in the urban
solid waste management space. Further, the company is undertaking Solid
Waste Management projects worth Rs 220 crore at Patna (Bihar) and Kolhapur
(Maharashtra).
EPC Buildings- Steady Performace
The Company entered the buildings space for Public Works Department (PWD)
and other Govt. departments, providing construction services for hospitals,
national institutions, government housing projects, industrial, commercial
buildings, hostels and industrial sheds etc. SHEL is qualified for up to Rs 500
crores for a single project for government buildings. However, SHEL has said
that it would focus more on institutional buildings like IITs, IIMs, AIIMS and
administration building, etc. The company’s order book in this segment stands at
Rs 630.1 crore as on 31st March, 2017. The Company enjoys a margin of 7.5-
9% in this segment.
We expect overall revenues from the Buildings segment to grow at a CAGR of
6.7% over FY17-20 to Rs 687.1 crore in FY20.
Buildings EPC to see moderate growth
6
7
8
9
10
0
100
200
300
400
500
600
700
800
FY17* FY18E FY19E FY20E
Rs in crores (%)
Source: Sunil Hitech Ltd, Ventura Research
* Consolidated figure is estimated from standalone figure breakup

- 12 - Tuesday, 17th October, 2017
This document is for private circulation, and must be read in conjunction with the disclaimer on the last page.
O & M – a high margin business
Over the years, the Company has extended its business to operations,
overhauling and maintenance (renovation and modernization) for power and
steel plants. The Company’s service portfolio covers the entire spectrum of
operations and maintenance - boilers, turbine generators and auxiliaries; repair,
modification and rehabilitation for utility boilers up to 800 MW; pressure plants,
milling system, rotating parts and ducting; high pressure/low pressure piping
works; renovation, modernisation and retrofitting of ESP; coal and ash handling
plants. We expect overall revenues from the segment to grow at a CAGR of
15.5% over FY17-20 to Rs 950 crore in FY20.
Major Projects for EPC Buildings
Projects Description
CV INR
(Crs.)
Kanpur- KDA Construction of EWS Houses 89.4
Singreni- SCCL
Construction of Staff quarters, GM
Bungalow at Singareni TPP 92.3
Bihar -BSHB
Construction of 1054 flats at Dalpatpur
(G+11) 415.5
Firozabad-UPRNNL
Construction of medical college
buildings 130.0
Bathinda & Govindval Construction of Central Sudhar Griha 350.0
Source: Sunil Hitech Ltd, Ventura Research
OM/BoP to see good growth
6
7
8
9
10
0
100
200
300
400
500
600
700
800
900
1000
FY17* FY18E FY19E FY20E
Rs in crores(%)
Source: Sunil Hitech Ltd, Ventura Research
* Consolidated figure is estimated from standalone figure breakup

- 13 - Tuesday, 17th October, 2017
This document is for private circulation, and must be read in conjunction with the disclaimer on the last page.
Manufacturing
SHEL undertakes manufacturing of Super heater and re-heater coils,
Economizer and LTSH coils, Water wall panels, High pressure parts bend,
Technological structures for power and process industry, Tanks and vessels
Piping, Boiler pressure parts tubes up to 660 MW, Collection and emitting
electrodes of ESP. Most of the manufacturing work is done by its subsidiary
Seam Industries Limited.
We expect overall revenues from the segment to grow at a CAGR of 30% over
FY17-20 to Rs 292 crore in FY20.
Fresh Infusion of equity by promoters- lends credence to the growth story
and will help shore up debt to equity
In order to meet the working capital requirements and future capex of the
company, the promoter of the company has been allotted 7.4 crore warrants at
conversion price of Rs 14.43 for 1 equity share of FV of Rs 1. Further, the
promoter of the company has already got 34.75 lakh warrants issued which is
convertible at Rs 55.4 (The price after bonus and split works out to be Rs 2.77
per share). Thus, the promoter of the company has committed ~Rs 107 crore
over the next 18 months which will help the company to maintain debt at
sustainable levels. Further, we believe that the promoter group will try to infuse
more funds into the business to shore up their holding in the company in the
long run. Prior to Mr Sunil Gutte taking over as CEO/MD, the erstwhile promoter
Mr Ratnakar Gutte (Father of Mr Sunil Gutte) had exited his shareholding by
selling his stake in the open market. Subsequently, he resigned from the
company and from his post.
Boilers & Auxiliaries to see good growth
6
7
8
9
10
0
50
100
150
200
250
300
350
FY17* FY18E FY19E FY20E
Rs in crores (%)
Source: Sunil Hitech Ltd, Ventura Research
* Consolidated figure is estimated from standalone figure breakup

- 14 - Tuesday, 17th October, 2017
This document is for private circulation, and must be read in conjunction with the disclaimer on the last page.
Proposed listing of its 2 subsidiaries- VAG Buildtech Limited and Seam
Industries Ltd on the SME platform to help unlock value
VAG Buidtech Limited is the infrastructure development arm of SHEL and
focuses on urban infrastructure, solid waste management and road
development. In 2017, the company achieved topline of 185.9 crore and PAT of
Rs 4.0 crore,
Seam Industries Limited manufactures boiler pressure parts and components,
industrial boilers, ROB and RUB railway girder slabs, steel pipes, and pipe
fittings etc and complements Sunil Hitech’s EPC Projects. It had achieved a
topline of Rs 149.0 Crores and a PAT of Rs 2.6 crores for the year ended 31st
March 2017.
As per the BSE filling dated 18.08.2017, the company has proposed to list its 2
subsidiaries VAG Buildtech Limited (subsidiary of SHEL with 74% stake as on
today) and SEAM Industries Ltd (subsidiary of SHEL with 94% stake as on
today) for fresh issue of equity shares. We believe that potential listing will help
the company to raise money for its future projects in both the subsidiaries and
will also help in unlocking of value for SHEL.
Financials of VAG Buildtech Pvt Ltd
Particulars
Year Ending FY15 FY16 FY17
Contract Receipts 150.5 174.8 185.9
Other Income 1.2 0.2 0.2
PBDIT 9.8 11.0 4.2
Interest Expenses 2.7 3.4 3.9
Depreciation 0.1 0.2 0.3
PAT 4.7 5.0 4.0
Cash Accruals 4.8 5.1 4.3
Term Debt- Secured 3.1 3.3 6.5
Term Debt – Unsecured - 3.1 -
Short Term Borrowings 0.0 17.1 24.3
Tangible Net Worth 10.0 16.1 20.1
Rs in crores
Source: Sunil Hitech Ltd, Ventura Research
Financials of SEAM Industries Ltd
Particulars
Year Ending FY15 FY16 FY17
Contract Receipts 165.8 156.9 149.0
Other Income 0.8 0.6 0.4
PBDIT 20.9 15.7 12.2
Interest Expenses 9.3 8.2 8.8
Depreciation 4.9 3.6 3.4
PAT 4.2 2.4 2.6
Cash Accruals 9.1 6.0 6.0
Term Debt- Secured 9.6 4.5 2.3
Term Debt- Unsecured 3.0 8.4 9.7
Short Term Borrowings 38.3 43.0 38.0
Tangible Net Worth 38.6 41.0 43.7
Rs in crores
Source: Sunil Hitech Ltd, Ventura Research

- 15 - Tuesday, 17th October, 2017
This document is for private circulation, and must be read in conjunction with the disclaimer on the last page.
Key Risks
SHEL has contingent liabilities of Rs 796 crore as on 31st March,2017
Infra companies normally have a huge amount of contingent liabilities in their
books by way of performance guarantees. Although this is inherent risk for every
infra company, going forward, we expect an increase in such contingent
liabilities as the company aims to bid for more and more road projects.
Other Risks
1. Delay in project execution can shift revenue trajectory
2. Major policy changes
Contingent liability comparison of peer companies
Particulars (Rs. in Crs.) FY15 FY16 FY17
Sunil Hitech
Cont liabilities 28.4 638.6 796.0
Networth 411.2 466.7 519.7
Revenues 1,836.5 2,021.3 2,559.6
As a % of networth 6.9 136.8 153.2
Dilip buildcon
Cont liabilities 2,409.6 2,246.2 2,900.0
Networth 805.1 932.1 1,719.0
Revenues 2,762.0 4,300.5 5,319.2
As a % of networth 299.3 241.0 168.7
PNC infra
Cont liabilities 1,137.7 1,274.7 1,631.7
Networth 871.1 1,357.9 1,461.0
Revenues 1,860.9 2,836.8 2,252.3
As a % of networth 130.6 93.9 111.7
Ashoka buildcon
Cont liabilities 1,215.5 2,970.7 3,541.8
Networth 1,356.9 1,714.6 1,671.7
Revenues 2,290.1 2,223.7 2,904.9
As a % of networth 89.6 173.3 211.9
Sou Source: Sunil Hitech, Ventura Research

- 16 - Tuesday, 17th October, 2017
This document is for private circulation, and must be read in conjunction with the disclaimer on the last page.
Financial Performance
In Q1FY18, SHEL Ltd reported a robust 23.5% growth in its standalone topline
to Rs 548.4 crore from Rs 444.0 crore reported in Q1FY17. The EBIDTA
margins declined by around 60 bps, from 9.6% to 9.0%, due to an increase in
contract and site expenses. The total PAT stood at Rs 13.7 crore as against Rs
11.2 crore in Q1FY17, registering growth of 23.2% YoY.
During FY17, SHEL’s consolidated topline stood at Rs 2559.6 crore, registering
a growth of 26.6% YoY. The EBIDTA margin decreased by ~228 bps YoY to
7.9%, mainly due to the writing of bad debts to the tune of Rs 19.5 crore in the
power segment. The PAT stood at Rs 39.5 crore, declining by 26.1% YoY
mainly due to lower margins and an increase in interest costs.
Financial Performance (Rs in crores)
Description Q1FY18* Q1FY17* FY17 FY16
Profit & Loss Statement
Net Sales 548.4 444.0 2559.6 2021.3
Growth(%) 23.5% 26.6%
Total Expenditure 499.2 401.4 2357.3 1815.4
% of sales 91.0% 90.4% 92.1% 89.8%
EBDITA 49.1 42.6 202.3 205.9
EBDITA Margin % 9.0% 9.6% 7.9% 10.2%
Other Income 5.6 4.1 13.3 14.2
PBDIT 54.7 46.7 215.7 220.1
Depreciation 8.6 7.7 38.2 36.8
Interest 25.4 22.0 110.9 98.4
Exceptional items 0.0 0.0 0.0 0.0
PBT 20.8 17.0 66.6 85.0
Margin % 3.8% 3.8% 2.6% 4.2%
Tax Provisions 7.0 5.8 25.9 29.1
Minority Interest NA NA -1.2 -2.4
Reported PAT 13.7 11.2 39.5 53.4
Margin % 2.5% 2.5% 1.5% 2.6%
Sou Source: Sunil Hitech Ltd, Ventura Research *Standalone figures

- 17 - Tuesday, 17th October, 2017
This document is for private circulation, and must be read in conjunction with the disclaimer on the last page.
Financial Outlook
The revenue trajectory is expected to continue to grow, going forward, as the
management expects to maintain its order book at ~2x trailing sales to fuel its
growth. We expect overall revenues to grow at a CAGR of 18.1% over FY17-20
to Rs 4218.1 crore from Rs 2559.6 crore reported in FY17. We expect the
EBIDTA of the company to move from Rs 202.3 crore in FY17 to Rs 401.7 crore
in FY20. The margins are expected to move gradually to 9.5% in FY20 from
7.9% in FY17 as the company plans to increase its revenue share of Road EPC
in the overall sales mix (Road EPC has better margins of ~12% relative to other
segment).
We expect the profitability to more than double by FY20 to Rs 87.9 crore from
Rs 39.5 crore in FY17. However, the conversion of warrants will remain an
overhang on the EPS in the short term and hence we expect the EPS to grow to
Rs 1.6 in FY20 from Rs 1 posted in FY17.
Revenues, EBIDTA and PAT margins
0
2
4
6
8
10
12
14
0
500
1000
1500
2000
2500
3000
3500
4000
4500
FY12 FY13 FY14 FY15 FY16 FY17 FY18E FY19E FY20E
Net sales EBIDTA (%) PAT (%)
Rs in cr (%)
Source: Sunil Hitech Ltd, Ventura Research

- 18 - Tuesday, 17th October, 2017
This document is for private circulation, and must be read in conjunction with the disclaimer on the last page.
We expect the company to post better return ratios and increase its interest and
debt paying capacity due to the expansion of EBIDTA. However, we expect the
working capital cycle to stay moderate as SHEL tries to add more and more
orders in roads and institutional building, which will keep debtor days at an
elongated level of ~ 3 months.
Improving financials to boost ROE and ROCE
0
5
10
15
20
25
FY12 FY13 FY14 FY15 FY16 FY17 FY18E FY19E FY20E
ROE (%) ROCE (%)
(%)
So Source: Sunil Hitech Ltd, Ventura Research
Operating cycle to remain moderate
0
20
40
60
80
100
120
140
160
180
FY12 FY13 FY14 FY15 FY16 FY17 FY18E FY19E FY20E
Inventory days Receivable days Payable days Total
No of days
So Source: Sunil Hitech Ltd, Ventura Research

- 19 - Tuesday, 17th October, 2017
This document is for private circulation, and must be read in conjunction with the disclaimer on the last page.
Valuation
We initiate coverage on Sunil Hitech as a BUY with a SOTP price objective of
Rs 33.5, representing a potential upside of 165.7% over a period of 24 months
from the CMP of Rs 12.7.
Valuation table
Particulars Basis
Multiple
(x)
EV ( Rs in
crores)
Value of Civil & Strucutral business FY20E EBIDTA- 60.8 crore 6.1 370.9
Value of EPC for Buildings FY20E EBIDTA- 61.8 crores 6.2 383.2
Valuation of EPC for Roads FY20E EBIDTA- 124.8 crores 7.0 873.6
Value of Boilers & Auxiliaries FY20E EBIDTA- 20.4 crores 6.1 124.4
Value of BoP, O&M FY20E EBIDTA- 96.0 crores 8.0 768.0
Total EV excluding HAM project 2520.1
Less- FY20 Debt 1138.2
Add- FY20 Cash 212.2
Market Capitalisation 1594.0
No of shares outstanding 57.2
Value per share 27.9
Value per share of HAM project 5.6
Total value per share 33.5
Source: Sunil Hitech Ltd, Ventura Research
- 20 - Tuesday, 17th October, 2017
This document is for private circulation, and must be read in conjunction with the disclaimer on the last page.
1 Yr Fwd PE Band
0
5
10
15
20
25
30
3/31/2013 3/31/2014 3/31/2015 3/31/2016 3/31/2017
CMP 0.4X 1.15X 1.9X 2.65X 3.4X
Source: Sunil Hitech Ltd, Ventura Research
1 Yr Fwd P/B band
0
5
10
15
20
25
30
CMP 0.05X 0.14X 0.23X 0.32X 0.41X
Source: Sunil Hitech Ltd, Ventura Research
Comparative chart of 1 Yr forward ROCE and EV/EBIDTA
0
5
10
15
20
25
30
35
0 2 4 6 8 10 12 14 16
Ahluwaliaconstruction
Techno Electric
KNR Construction
PNC Infra
Sunil Hitech
ITD CementationRocEFy19
FY19 EV/EBIDTA
Source: Sunil Hitech Ltd, Ventura Research
1 Yr Fwd EV/EBIDTA band
0
2,000
4,000
6,000
8,000
10,000
12,000
14,000
16,000
4/1/2013 4/1/2014 4/1/2015 4/1/2016 4/1/2017
EV 14X 18.25X 22.5X 26.75X 31X
Source: CMI Source: Sunil Hitech Ltd, Ventura Research

- 21 - Tuesday, 17th October, 2017
This document is for private circulation, and must be read in conjunction with the disclaimer on the last page.
Peer Comparison (Rs in crores)
Y/E March Sales EBITDA PAT
EBITDA
Margin (%)
PAT Margin
(%) ROE(%) ROCE(%) P/E P/BV
EV/
EBITDA
Sunil Hitech
2016 2021.3 205.9 53.4 10.2 2.6 12.2 19.5 6.9 0.8 3.7
2017 2559.6 202.3 39.5 7.9 1.5 8.0 16.8 12.1 0.9 4.5
2018E 2999.5 261.3 56.6 8.7 1.9 9.3 18.2 9.9 0.8 4.4
2019E 3684.9 347.6 81.3 9.4 2.2 10.5 19.2 8.4 0.8 4.1
PNC Infratech
2016 2346.1 407.3 177.2 17.4 7.6 17.8 15.6 65.0 2.0 19.8
2017 2109.9 624.1 118.3 29.6 5.6 13.3 9.8 25.4 2.1 23.9
2018E 2513.8 482.5 158.1 19.2 6.3 9.6 9.4 87.6 2.0 19.8
2019E 3607.0 622.4 201.9 17.3 5.6 12.0 12.5 29.7 1.8 14.8
KNR Construction
2016 993.7 174.2 126.4 17.5 12.7 15.1 11.4 12.8 2.1 23.0
2017 1641.6 264.0 125.8 16.1 7.7 15.2 31.0 23.6 3.3 15.6
2018E 1938.7 337.7 172.0 17.4 8.9 14.5 17.2 22.9 2.0 13.0
2019E 2321.5 392.6 188.5 16.9 8.1 14.4 17.1 19.9 1.7 11.4
J kumar Infra
2016 1366.2 248.4 103.2 18.2 7.6 10.0 16.8 18.4 1.6 8.6
2017 1572.8 249.4 105.6 15.9 6.7 7.9 13.6 18.5 1.4 8.5
2018E 1851.7 312.0 127.4 16.8 6.9 11.5 15.6 12.0 1.1 6.5
2019E 2325.6 395.6 164.7 17.0 7.1 12.1 16.2 9.3 1.0 5.2
ITD Cementation
2016 3088.6 209.9 48.1 6.8 1.6 9.1 27.5 48.1 4.2 11.0
2017E 2433.1 267.5 88.7 11.0 3.6 14.6 20.4 29.4 4.0 8.7
2018E 2927.5 314.6 129.1 10.7 4.4 18.8 22.8 18.8 3.3 7.2
2019E 3508.9 381.6 167.3 10.9 4.8 19.7 29.1 15.1 2.8 6.1
Ahluwalia Construction
2016 1246.9 160.8 84.4 12.9 6.8 22.2 27.7 24.1 4.8 12.9
2017 1426.5 173.0 86.0 12.1 6.0 18.5 25.9 24.4 4.1 11.7
2018E 1601.6 197.6 108.8 12.3 6.8 18.3 27.9 19.8 3.4 10.4
2019E 1791.1 228.2 132.8 12.7 7.4 18.4 29.8 15.9 2.8 8.9
Techno Electric
2016 1091.0 221.3 116.2 20.3 10.7 12.0 12.9 25.9 3.4 15.0
2017 1339.1 312.5 192.4 23.3 14.4 18.1 18.0 23.7 4.1 14.0
2018E 1536.5 352.9 231.9 23.0 15.1 19.2 23.3 15.5 2.9 10.1
2019E 1812.2 395.7 270.5 21.8 14.9 19.4 23.1 13.2 2.4 8.8
Source: Sunil Hitech Ltd, Ventura Research

- 22 - Tuesday, 17th October, 2017
This document is for private circulation, and must be read in conjunction with the disclaimer on the last page.
Financials & Projections
Y/E March, Fig in ` Cr FY17 FY18E FY19E FY20E Y/E March, Fig in ` Cr FY17 FY18E FY19E FY20E
Profit & Loss Statement Per Share Data (Rs)
Net Sales 2559.6 2999.5 3684.9 4218.1 Adj. EPS 1.0 1.3 1.5 1.6
% Chg. 27% 17% 23% 14% Cash EPS 2.1 2.2 2.4 2.6
Total Expenditure 2357.3 2738.2 3337.3 3816.3 Book Value 13.7 15.8 15.7 17.4
% Chg. 30% 16% 22% 14% DPS 0.1 0.1 0.1 0.1
EBDITA 202.3 261.3 347.6 401.7 Capital, Liquidity, Returns Ratio
EBDITA Margin % 7.9% 8.7% 9.4% 9.5% Debt / Equity (x) 1.2 1.1 1.2 1.2
Other Income 13.3 15.0 17.0 20.0 Current Ratio (x) 1.4 1.4 1.4 1.4
PBDIT 215.7 276.3 364.6 421.7 ROE (%) 8.0 9.3 10.5 9.8
Depreciation 38.2 40.7 47.5 55.1 ROCE (%) 16.8 18.2 19.2 18.7
Interest 110.9 136.3 174.4 212.3 Dividend Yield (%) 0.0 0.0 0.0 0.0
Exceptional items 0.0 0.0 0.0 0.0 Valuation Ratio (x)
PBT 66.5 99.2 142.7 154.3 P/E 12.1 9.9 8.4 7.8
Tax Provisions 25.9 39.7 57.1 61.7 P/BV 0.9 0.8 0.8 0.7
Reported PAT 40.6 59.5 85.6 92.6 EV/Sales 0.4 0.4 0.4 0.4
Minority Interest -1.2 -3.0 -4.3 -4.6 EV/EBIDTA 4.5 4.4 4.1 4.1
PAT 39.5 56.6 81.3 87.9 Efficiency Ratio (x)
PAT Margin (%) 2% 2% 2% 2% Inventory (days) 50 45 46 50
RM / Sales (%) 50% 52% 53% 53% Debtors (days) 90 95 97 100
Tax Rate (%) 39% 40% 40% 40% Creditors (days) 82 80 78 75
Balance Sheet Cash Flow Statement
Share Capital 37.8 51.0 57.2 57.2 Profit Before Tax 73.0 99.2 142.7 154.3
Reserves & Surplus 477.0 629.2 793.8 881.7 Depreciation 38.2 40.7 47.5 55.1
Money against share warrants 4.8 22.4 0.0 0.0 Working Capital Changes (134.7) (223.9) (278.4) (244.8)
Minority Interest 18.7 21.7 25.9 30.6 Others 87.7 81.7 100.3 130.6
Borrowings 144.77 188.97 247.83 294.61 Operating Cash Flow 64.2 (2.4) 12.1 95.2
Other liabilities 122.3 133.8 159.8 179.6 Capital Expenditure (28.8) (50.0) (90.0) (100.0)
Total Liabilities 805.5 1047.0 1284.5 1443.6 Other Investment Activities (9.3) (0.2) (11.7) (11.8)
Gross Block 526.1 576.1 666.1 766.1 Cash Flow from Investing (38.1) (50.2) (101.7) (111.8)
Less: Acc. Depreciation 251.9 292.6 340.1 395.2 Changes in Share Capital 6.6 126.3 67.1 -
Net Block 274.3 283.6 326.0 370.9 Changes in Borrowings 96.0 154.3 226.0 153.4
Non current Investments 30.8 46.0 74.7 106.5 Dividend and Interest (110.0) (136.3) (174.4) (212.3)
Long term Loans & Advances 51.9 63.6 90.0 109.7 Cash Flow from Financing (7.4) 144.2 118.7 (58.9)
Other Non Current assets 10.3 12.0 14.0 15.0 Net Change in Cash 18.7 91.7 29.1 (75.5)
Net Current assets 438.1 641.7 779.7 841.6 Opening Cash Balance 148.2 166.9 258.6 287.7
Total Assets 805.5 1047.0 1284.5 1443.6 Closing Cash Balance 166.9 258.6 287.7 212.2

- 23 - Tuesday, 17th October, 2017
This document is for private circulation, and must be read in conjunction with the disclaimer on the last page.
Disclosures and Disclaimer
Ventura Securities Limited (VSL) is a SEBI registered intermediary offering broking, depository and portfolio management services to clients. VSL is member of BSE, NSE and MCX-SX. VSL is a depository participant of NSDL. VSL states that no disciplinary action whatsoever has been taken by SEBI against it in last five years except administrative warning issued in connection with technical and venial lapses observed while inspection of books of accounts and records.
Ventura Commodities Limited, Ventura Guaranty Limited, Ventura Insurance Brokers Limited and Ventura Allied Services Private Limited are associates of VSL. Research Analyst (RA) involved in the preparation of this research report and VSL disclose that neither RA nor VSL nor its associates (i) have any financial interest in the company which is the subject matter of this research report (ii) holds ownership of one percent or more in the securities of subject company (iii)
have any material conflict of interest at the time of publication of this research report (iv) have received any compensation from the subject company in the past twelve months (v) have managed or co-managed public offering of securities for the subject company in past twelve months (vi) have received any compensation for investment banking merchant banking or brokerage services from the subject company in the past twelve months (vii) have received any
compensation for product or services from the subject company in the past twelve months (viii) have received any compensation or other benefits from the subject company or third party in connection with the research report. RA involved in the preparation of this research report discloses that he / she has not served as an officer, director or employee of the subject company. RA involved in the preparation of this research report and VSL discloses that they have not
been engaged in the market making activity for the subject company. Our sales people, dealers, traders and other professionals may provide oral or written market commentary or trading strategies to our clients that reflect opinions that are contrary to the opinions expressed herein. We may have earlier issued or may issue in future reports on the companies covered herein with recommendations/ information inconsistent or different those made in this report. In reviewing
this document, you should be aware that any or all of the foregoing, among other things, may give rise to or potential conflicts of interest. We may rely on information barriers, such as "Chinese Walls" to control the flow of information contained in one or more areas within us, or other areas, units, groups or affiliates of VSL. This report is for information purposes only and this document/material should not be construed as an offer to sell or the solicitation of an offer
to buy, purchase or subscribe to any securities, and neither this document nor anything contained herein shall form the basis of or be relied upon in connection with any contract or commitment whatsoever. This document does not solicit any action based on the material contained herein. It is for the general information of the clients / prospective clients of VSL. VSL will not treat recipients as clients by virtue of their receiving this report. It does not constitute a personal recommendation or take into account the particular investment objectives, financial situations, or needs of clients / prospec tive clients. Similarly, this document
does not have regard to the specific investment objectives, financial situation/circumstances and the particular needs of any specific person who may receive this document. The securities discussed in this report may not be suitable for all investors. The appropriateness of a particular investment or strategy will depend on an investor's individual circumstances and objectives. Persons who may receive this document should consider and independently evaluate whether
it is suitable for his/ her/their particular circumstances and, if necessary, seek professional/financial advice. And such person shall be responsible for conducting his/her/their own investigation and analysis of the information contained or referred to in this document and of evaluating the merits and risks involved in the securities forming the subject matter of this document. The projections and forecasts described in this report were based upon a number of estimates and
assumptions and are inherently subject to significant uncertainties and contingencies. Projections and forecasts are necessarily speculative in nature, and it can be expected that one or more of the estimates on which the projections and forecasts were based will not materialize or will vary significantly from actual results, and such variances will likely increase over time. All projections and forecasts described in this report have been prepared solely by the authors of this report
independently of the Company. These projections and forecasts were not prepared with a view toward compliance with published guidelines or generally accepted accounting principles. No independent accountants have expressed an opinion or any other form of assurance on these projections or forecasts. You should not regard the inclusion of the projections and forecasts described herein as a representation or warranty by VSL, its associates, the authors of this
report or any other person that these projections or forecasts or their underlying assumptions will be achieved. For these reasons, you should only consider the projections and forecasts described in this report after carefully evaluating all of the information in this report, including the assumptions underlying such projections and forecasts. The price and value of the investments referred to in this document/material and the income from them may go down as well as up,
and investors may realize losses on any investments. Past performance is not a guide for future performance. Future returns are not guaranteed and a loss of original capital may occur. Actual results may differ materially from those set forth in projections. Forward-looking statements are not predictions and may be subject to change without notice. We do not provide tax advice to our clients, and all investors are strongly advised to consult regarding any potential
investment. VSL, the RA involved in the preparation of this research report and its associates accept no liabilities for any loss or damage of any kind arising out of the use of this report. This report/document has been prepared by VSL, based upon information available to the public and sources, believed to be reliable. No representation or warranty, express or implied is made that it is accurate or complete. VSL has reviewed the report and, in so far as it includes current or
historical information, it is believed to be reliable, although its accuracy and completeness cannot be guaranteed. The opinions expressed in this document/material are subject to change without notice and have no obligation to tell you when opinions or information in this report change. This report or recommendations or information contained herein do/does not constitute or purport to constitute investment advice in publicly accessible media and should not
be reproduced, transmitted or published by the recipient. The report is for the use and consumption of the recipient only. This publicat ion may not be distributed to the public used by the public media without the express written consent of VSL. This report or any portion hereof may not be printed, sold or distributed without the written consent of VSL. This document does not constitute an offer or invitation to subscribe for or purchase or deal in any securities and neither this
document nor anything contained herein shall form the basis of any contract or commitment whatsoever. This document is strictly confidential and is being furnished to you solely for your information, may not be distributed to the press or other media and may not be reproduced or redistributed to any other person. The opinions and projections expressed herein are entirely those of the author and are given as part of the normal research activity of VSL and are given as of
this date and are subject to change without notice. Any opinion estimate or projection herein constitutes a view as of the date of this report and there can be no assurance that future results or events will be consistent with any such opinions, estimate or projection. This document has not been prepared by or in conjunction with or on behalf of or at the instigation of, or by arrangement with the company or any of its directors or any other person. Information in this
document must not be relied upon as having been authorized or approved by the company or its directors or any other person. Any opinions and projections contained herein are entirely those of the authors. None of the company or its directors or any other person accepts any liab ility whatsoever for any loss arising from any use of this document or its contents or otherwise arising in connection therewith. The information contained herein is not intended for publication or
distribution or circulation in any manner whatsoever and any unauthorized reading, dissemination, distribution or copying of this communication is prohibited unless otherwise expressly authorized. Please ensure that you have read “Risk Disclosure Document for Capital Market and Deri vatives Segments” as prescribed by Securities and Exchange Board of India before investing in Securities Market.
Ventura Securities Limited Corporate Office: 8
th Floor, ‘B’ Wing, I Think Techno Campus, Pokhran Road no. 02, Off Eastern Express Highway , Thane (West) 400 607.