
Sungsup Ra and Zhigang Li - adb.org · the 15-year period from 2016 to 2030, or $1.7 trilli on per...
35
ASIAN DEVELOPMENT BANK CLOSING THE FINANCING GAP IN ASIAN INFRASTRUCTURE Sungsup Ra and Zhigang Li ADB SOUTH ASIA WORKING PAPER SERIES NO. 57 June 2018
Transcript of Sungsup Ra and Zhigang Li - adb.org · the 15-year period from 2016 to 2030, or $1.7 trilli on per...

ASIAN DEVELOPMENT BANK
CLOSING THE FINANCING GAP IN ASIAN INFRASTRUCTURESungsup Ra and Zhigang Li
ADB SOUTH ASIAWORKING PAPER SERIES
NO. 57
June 2018

ADB South Asia Working Paper Series
Closing the Financing Gap in Asian Infrastructure Sungsup Ra and Zhigang Li
No. 57 | June 2018
Sungsup Ra is a director at the Human and Social Development Division (SAHS), South Asia Department, Asian Development Bank (ADB); and Zhigang Li is a social sector specialist at SAHS, ADB. We thank Kairon Shayne D. Garcia for her excellent research assistance to this report.

Creative Commons Attribution 3.0 IGO license (CC BY 3.0 IGO)
© 2018 Asian Development Bank6 ADB Avenue, Mandaluyong City, 1550 Metro Manila, PhilippinesTel +63 2 632 4444; Fax +63 2 636 2444www.adb.org
Some rights reserved. Published in 2018.
ISSN 2313-5867 (print), 2313-5875 (electronic)Publication Stock No. WPS189402-2DOI: http://dx.doi.org/10.22617/WPS189402-2
The views expressed in this publication are those of the authors and do not necessarily reflect the views and policies of the Asian Development Bank (ADB) or its Board of Governors or the governments they represent.
ADB does not guarantee the accuracy of the data included in this publication and accepts no responsibility for any consequence of their use. The mention of specific companies or products of manufacturers does not imply that they are endorsed or recommended by ADB in preference to others of a similar nature that are not mentioned.
By making any designation of or reference to a particular territory or geographic area, or by using the term “country” in this document, ADB does not intend to make any judgments as to the legal or other status of any territory or area.
This work is available under the Creative Commons Attribution 3.0 IGO license (CC BY 3.0 IGO) https://creativecommons.org/licenses/by/3.0/igo/. By using the content of this publication, you agree to be bound by the terms of this license. For attribution, translations, adaptations, and permissions, please read the provisions and terms of use at https://www.adb.org/terms-use#openaccess.
This CC license does not apply to non-ADB copyright materials in this publication. If the material is attributed to another source, please contact the copyright owner or publisher of that source for permission to reproduce it. ADB cannot be held liable for any claims that arise as a result of your use of the material.
Please contact [email protected] if you have questions or comments with respect to content, or if you wish to obtain copyright permission for your intended use that does not fall within these terms, or for permission to use the ADB logo.
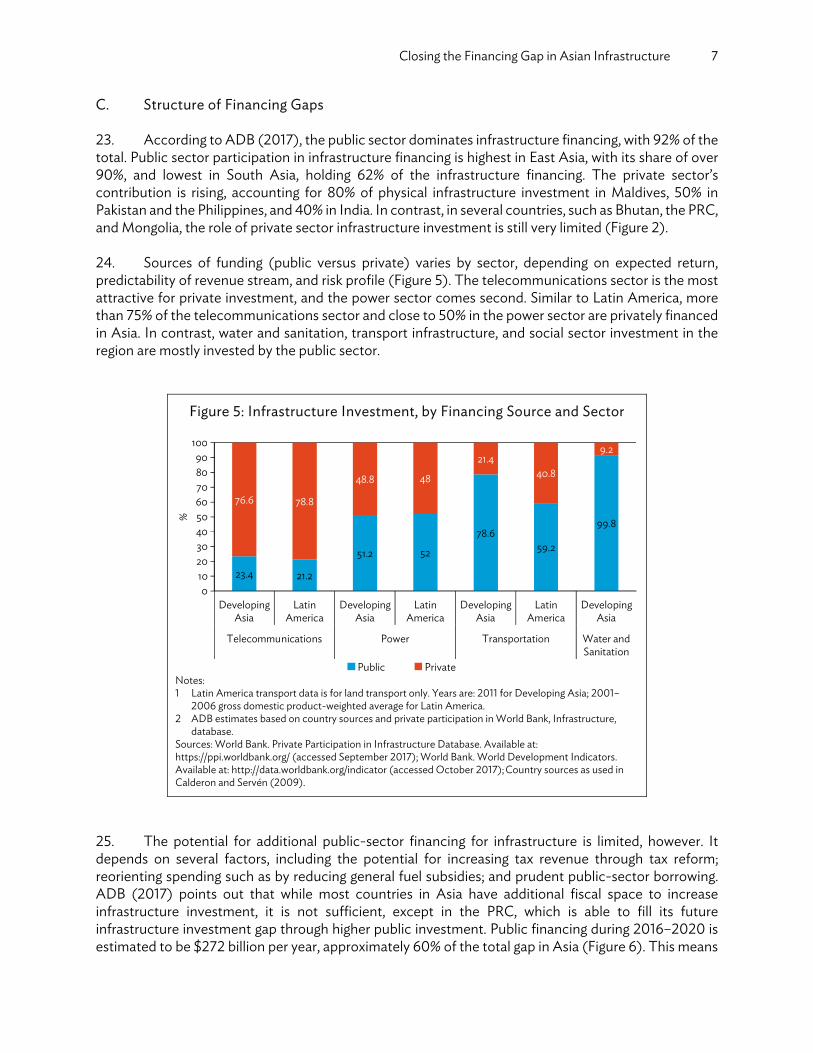
Notes: In this publication, “$” refers to United States dollars. ADB recognizes “China” as the People’s Republic of China, and “Korea” as the Republic of Korea. Corrigenda to ADB publications may be found at http://www.adb.org/publications/corrigenda.
CONTENTS
TABLES AND FIGURES ........................................................................................................................................iv ABBREVIATIONS ................................................................................................................................................... v ABSTRACT ...............................................................................................................................................................vi I. INTRODUCTION ......................................................................................................................................... 1 II. HOW WIDE IS ASIA’S INFRASTRUCTURE FINANCING GAP? ................................................. 3 A. Economic Infrastructure ................................................................................................................. 3 B. Social Infrastructure ......................................................................................................................... 5 C. Structure of Financing Gaps ........................................................................................................... 7 III. WHY HAVE ASIA’S SAVINGS LARGELY FAILED TO FINANCE ITS INFRASTRUCTURE NEEDS? ........................................................................................................... 8 A. Cross-border Investment Paradox .............................................................................................................. 8
B. Sources of Failure ............................................................................................................................................. 11
IV. HOW TO BRIDGE THE FINANCING GAP ....................................................................................... 16 A. Solution Framework ........................................................................................................................................ 16 B. Role of Multilateral Development Banks ................................................................................................ 18 C. Latest Developments in Infrastructure Financing Modalities in Asia ........................................... 19 D. Caveat of New Initiatives for Infrastructure Financing ...................................................................... 21 V. CONCLUSION ........................................................................................................................................... 22 REFERENCES ......................................................................................................................................................... 25
TABLES AND FIGURES TABLES 1 Infrastructure Investment Gap in Asia, 25 Developing Member Countries ......................................... 1 2 Portfolio Investment Assets Position from Asia to the World and Vice Versa ................................. 10 3 Total Gross Savings, Reserves, and Net Investment in Selected Countries ...................................... 10 FIGURES 1 Gross Domestic Product per Capita and Infrastructure Index, 2011 ...................................................... 2 2 Current Infrastructure Investment in Asia, by Country and Source of Financing (2015) ............... 4 3 Infrastructure Investment, Current and Projected, by Sector ................................................................... 5 4 Current Infrastructure Investment in Social Sector ...................................................................................... 6 5 Infrastructure Investment, by Financing Source and Sector ..................................................................... 7 6 Infrastructure Financing Gap, Public versus Private, 2016–2020 ........................................................... 8 7 Investment Assets Positions from Developing Asia and Pacific Region to the World and Vice Versa .................................................................................................................. 11 8 Risk–Return Profiles of Infrastructure Investments in Relation to Traditional Asset Classes ................................................................................................................................. 13 9 Partnering with Financing Intermediaries for Wholesale Lending ........................................................ 20 10 Partnering with Financing Intermediaries to Develop the Bond Market ............................................ 20 11 Developing Local Currency Bond Market ...................................................................................................... 21
ABBREVIATIONS ADB – Asian Development Bank DMC – developing member country GDP – gross domestic product IIFCL – India Infrastructure Finance Company Limited MDB – multilateral development bank OECD – Organisation for Economic Co-operation and Development PPP – public–private partnership PRC – People’s Republic of China UN – United Nations UNESCO – United Nations Educational, Scientific and Cultural Organization US – United States WHO – World Health Organization

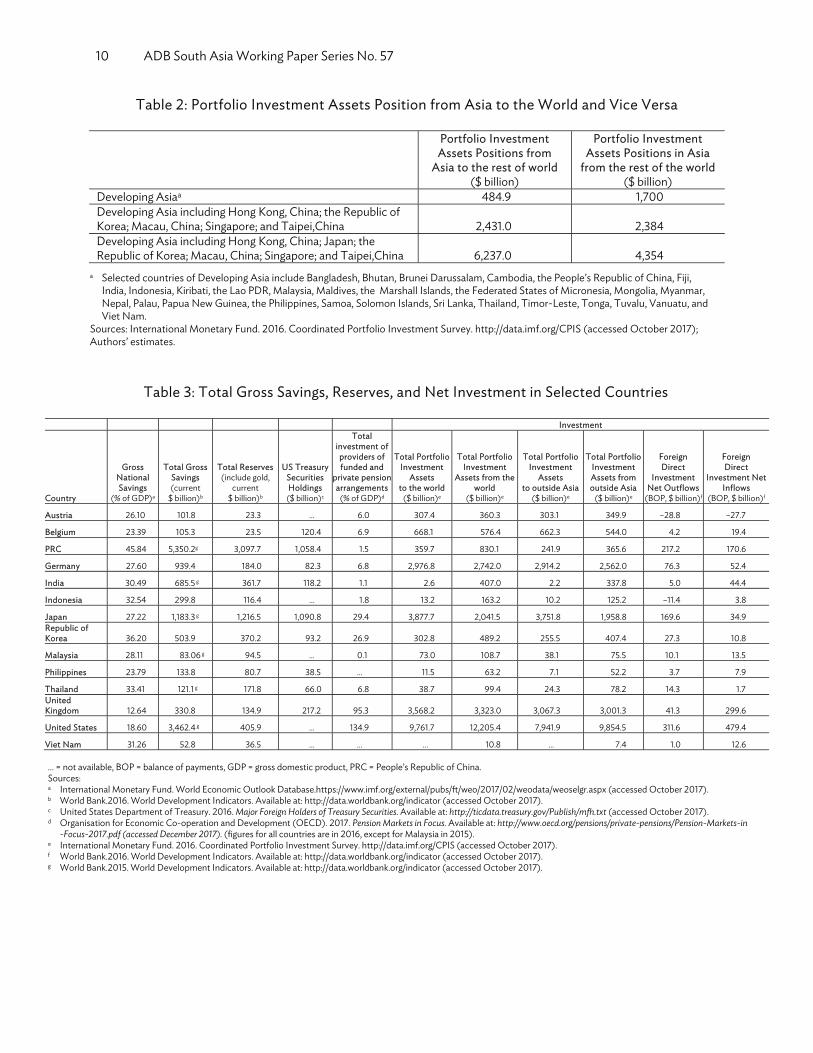
ABSTRACT Infrastructure investment in Asia faces a massive financing gap, both in “hard” and “soft” infrastructure, despite the region’s high savings. Underlying this gap is a capital flow paradox in which Asia’s outflow of portfolio funds far exceeds the inflow. To change this, solutions in at least three areas are necessary: innovative measures to mitigate constraints, preparation of bankable projects, and mitigation of risks. This study presents examples from actual investment projects to illustrate the latest developments addressing some fundamental constraints on infrastructure financing.

“[t]he infrastructure story is tantalizing—trillions of dollars needed in infrastructure upgrades and a global wall of money seeking yield. Yet the investable universe is small
and funds take a long time to invest...” (BlackRock 2014)
I. INTRODUCTION 1. Asia continues to suffer a massive infrastructure financing deficit. The Asian Development Bank (ADB) in 2017 estimated a financing gap in this area of $459 billion per year, or about 2.4% of developing Asia’s gross domestic product (GDP).1 Add in the expected need for funding of “social” infrastructure, such as health and education, and the gap almost doubles to $907 billion. 2. This is because Asia’s developing countries spend only about $881 billion a year on infrastructure, well below an estimated need of $1.34 trillion per year from 2016 until 2030 (Table 1). Demand for infrastructure investment is only bound to grow as the region realizes its economic potential (Figure 1).
Table 1: Infrastructure Investment Gap in Asia, 25 Developing Member Countries
Countries
EstimatedCurrent
Investment (2015)
Projection (2016–2020)
Future Annual Needs Gap (% of GDP)
Total (25 Asian DMCs) 881 1,340 459 (2.4) Total without PRC 195 503 308 (5.0) PRC 686 837 151 (1.2)
DMC = developing member country, GDP = gross domestic product, PRC = People’s Republic of China. Notes: $ billion in 2015 prices. Gap = Investment needs – Current Investment Source: ADB (2017a).
3. As such, unless Asian countries undertake measures to address the underlying problems, the shortfall will continue and the infrastructure gap widen even more. These actions could include, among others, a stronger pipeline of infrastructure investments, a reduction in their perceived risks, removal of institutional constraints on investment, clearer definition of infrastructure as an asset class, and better capital markets to draw in more homegrown investment. 4. For now, however, even though Asia and the Pacific maintains the highest savings rates in the world, it still invests significantly more of these funds abroad than it does within the region. In 2015, savings rates in one-third of Asian economies were more than 30%, far above their western counterparts. In the People’s Republic of China (PRC), the rate reaches as much as 45% and gross savings exceed $5 trillion. It also continues to accumulate unusually high foreign exchange reserves. Yet, as of the end of December 2016, Asia had invested $6.2 trillion in the rest of the world, while the rest of the world had invested $4.4 trillion in Asia.
1 The implied financing gap is at 2015 prices and the data are from Asian Development Bank publication, Meeting Asia’s
Infrastructure Needs.

2 ADB South Asia Working Paper Series No. 57
Figure 1: Gross Domestic Product per Capita and Infrastructure Index, 2011
GDP = gross domestic product, Lao PDR = Lao People’s Domestic Republic, PRC = People’s Republic of China. Notes: The infrastructure index is computed based on first principal component of infrastructure stocks in roads, airport, electricity, telephone, mobile, broadband, water, and sanitation. Higher values represent greater infrastructure availability. Sources: World Bank. World Development Indicators. Available at: http://data.worldbank.org/indicator (accessed October 2017); Asian Development Bank (ADB). 2017a. Meeting Asia’s Infrastructure Needs. Asian Development Bank, Manila.
5. Underlying these simultaneously massive savings and a yawning infrastructure gap is a “global capital flows paradox.” This refers to the coexistence of three unusual phenomena in the global financial system: (i) a huge outflow of capital from emerging markets into the industrialized countries, (ii) accumulation of foreign reserves in emerging economies, and (iii) expected negative returns on those foreign reserves (Summers 2006). 6. Another part of the problem is fiscal: that is, in meeting any such large financing need, it is not enough to simply raise fiscal spending. Indeed, many Asian countries are incapable of doing so—Asian countries can only meet around half of the projected gap due to restrictions on debt expansion, tax reform, and reallocation of fiscal spending. 7. Transforming even a small part of the region’s massive savings pool to greater infrastructure investment in Asia would substantially ease the projected infrastructure gap. The Financing Gap in the Literature 8. The literature estimating the size of the infrastructure financing gap is growing rapidly. In 2017, ADB calculated that its 45 developing member countries (DMCs) would need to invest $26 trillion over the 15-year period from 2016 to 2030, or $1.7 trillion per year. This amount included the costs of climate mitigation and adaptation (climate-adjusted estimate). It also updated its widely recognized estimate from 2009, compiled alongside the ADB Institute, projecting that developing Asia would need to invest
Afghanistan
Armenia
Azerbaijan
Bangladesh
Bhutan
PRC
FijiGeorgia
Hong Kong, China
Indonesia
India
Kazakhstan
Kyrgyz RepublicCambodia
Kiribati
Republic of Korea
Lao PDR
Sri Lanka
Maldives
Mongolia
Malaysia
Nepal
Pakistan
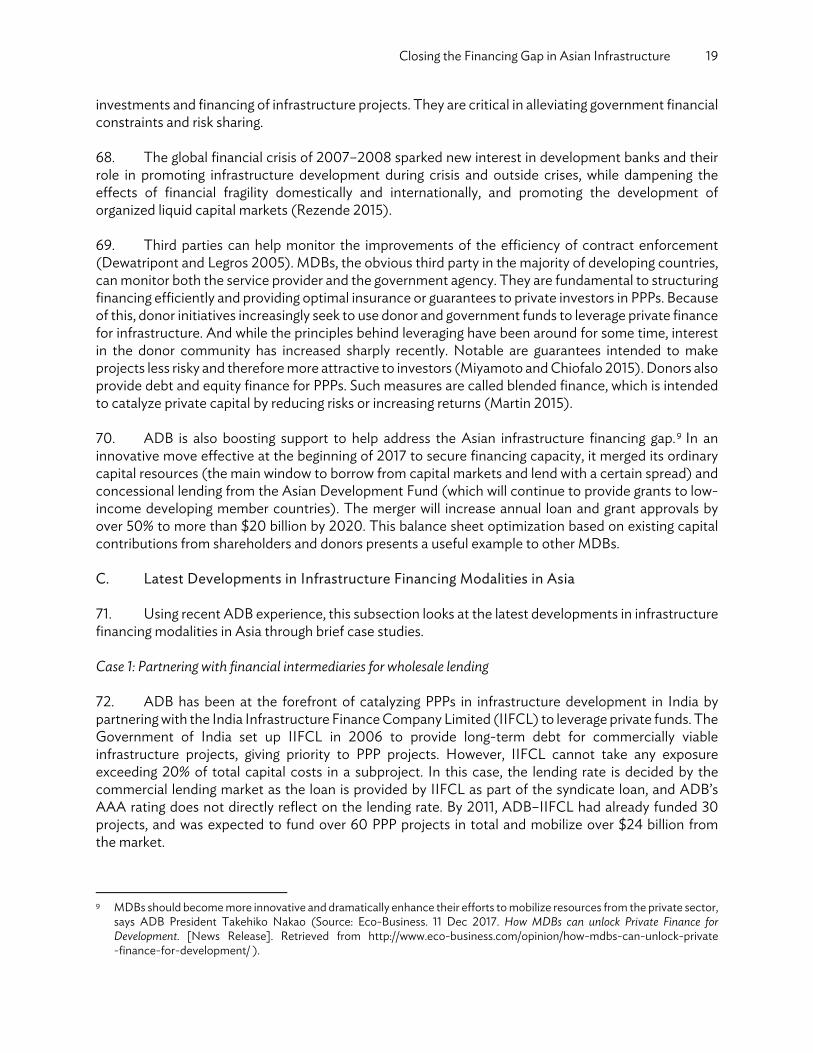
PhilippinesPapua New Guinea
Singapore
Solomon Islands
Thailand
Tajikistan
TurkmenistanTonga
UzbekistanViet Nam
Vanuatu
Samoa
6
7
8
9
10
11
- 2 4 6 8 10 12
Nat
ural
log
of G
DP
Per C
apita
($ in
201
0 Pr
ices
)
Infrastructure Index

Closing the Financing Gap in Asian Infrastructure 3
a total slightly above $8 trillion (in 2008 prices) from 2010 to 2020, or almost $750 billion a year to build the infrastructure needed. That study looked at 32 of 45 DMCs. Both studies covered four sectors: transport, power, telecommunications, and water supply and sanitation. 9. However, the current literature has a few limitations. Existing estimates of the infrastructure financing gap have paid most attention to “economic infrastructure” and much less attention to “social infrastructure,” mainly education and health. This could lead policy to show a significant bias toward so-called “hard” infrastructure. 10. The literature mostly either takes a global perspective or focuses on more developed economies or other regions, especially Latin America. Asia has received less attention even though it accounts for the largest share of infrastructure investment and, possibly, the biggest future financing gap. 11. Very few studies have explored practical policies and innovations to address the financing gap based on actual infrastructure projects. A similar observation is made in Griffith-Jones et al. (2017): “Even though much of the conventional discussion about the role of development banks relies on market failures to provide a theoretical basis for their existence, there is little discussion about how development banks operate, their different intervention models, products and markets targeted, and regulatory issues.” 12. This study’s contribution to the literature is therefore three-fold. It focuses on Asia, discusses potential solutions in-depth based on experience on the ground, and includes social infrastructure in its scope of estimation. As will be shown, the financing gap in “social infrastructure” may be as massive as that of “economic infrastructure” and deserve the same attention.
II. HOW WIDE IS ASIA’S INFRASTRUCTURE FINANCING GAP? 13. This study defines infrastructure broadly, including economic (hard) infrastructure—mainly transport, energy, water and sanitation, and telecommunications—and social (soft) infrastructure such as education and health. In contrast to economic infrastructure, which is mainly on capital, social infrastructure also includes recurrent spending in this study. This is partly because both capital and recurrent spending are typically planned and financed together and hardly separable, and partly because data available do not allow for estimating the financing gap for capital and recurrent spending separately. Following Asian Development Bank (ADB 2017), for economic infrastructure, the infrastructure financing gap is defined as the difference between the recommended or estimated infrastructure investment needs for a country and its actual infrastructure investment over recent years. For social infrastructure, projections of needs are not available, so to measure the gap the study uses the difference between actual social sector spending and benchmark spending (as recommended by international agencies). A. Economic Infrastructure 14. ADB (2017a) also provides the latest comprehensive estimates of the financing gap for physical infrastructure (or economic infrastructure) in Asia.2 As noted in the introduction, it estimates that the
2 Physical infrastructure includes roads, highways, railroads, airports, sea ports, electricity, telecommunications, water supply
and sanitation.

4 ADB South Asia Working Paper Series No. 57
region requires $1.3 trillion per year of economic infrastructure investment from 2016 to 2020 (in 2015 prices), the analysis restricted to 25 developing member countries (DMCs) covering 2016–2020.3 This amount is $459 billion higher than the current infrastructure investment in these economies, equivalent to 2.4% of these economies’ total gross domestic product (GDP) during the same period (Table 1). 15. Extending to 2016–2030 and expanding country coverage to 45 DMCs, the annual economic infrastructure investment need increases to $1.7 trillion, or $26 trillion over 15 years. The investment needs are based on projections of a set of economic and demographic variables that influence demand or supply of infrastructure services and the historical, cross-country relationship between physical stocks and these variables. 16. Among Asian DMCs, the People’s Republic of China (PRC) has a relatively lower financing gap: its $686 billion current annual investment is $151 billion less than the projected infrastructure investment for 2016 to 2020. Although that is a large amount, it is only 1.2% of the PRC’s GDP (Table 1). In contrast, for the rest of the 24 countries, the annual financing gap is $308 billion—around 5% of GDP.
Figure 2: Current Infrastructure Investment in Asia, by Country and Source of Financing (2015)
* = public sector includes central government budget only, GDP = gross domestic product, PRC = People’s Republic of China. Sources: Country sources for public sector investments; World Bank. Private Participation in Infrastructure Database. https://ppi.worldbank.org/ (accessed September 2017); World Bank. World Development Indicators. Available at: http://data.worldbank.org/indicator (accessed October 2017); Asian Development Bank (2017a).
17. Figure 2 also shows current infrastructure financing of selected Asian economies. The share of current infrastructure investment to GDP ranges from about 2% for Bangladesh to close to 7% for the PRC. Other countries investing more than 5% of its GDP in infrastructure included Bhutan, India, Maldives, and Viet Nam in 2015. 3 The 25 DMCs include Afghanistan, Armenia, Bangladesh, Bhutan, Cambodia, the PRC, Fiji, India, Indonesia, Kazakhstan,
Kiribati, the Kyrgyz Republic, Malaysia, Maldives, the Marshall Islands, the Federated States of Micronesia, Mongolia, Myanmar, Nepal, Pakistan, Papua New Guinea, the Philippines, Sri Lanka, Thailand, and Viet Nam.
86.8 6.6
5.7 5.45.1 4.9
4.3 4.1 3.72.6
Public
%of
GD
P
Private
2.6 2.5 2.4 2.3 2.1 2.1 1.9 1.8 1.7
7654321
PRCBhutan
Viet NamIndia
Maldives Fiji
Georgia*
Sri Lanka
Armenia*
IndonesiaNepal*
Myanmar
Philippines*
Singapore
Pakistan
Mongolia
Papua New Guinea*
Bangladesh*
Thailand-

Closing the Financing Gap in Asian Infrastructure 5
18. The biggest infrastructure financing gap, meanwhile, is in the transport sector ($600 billion per year), followed by power ($300 billion) (Figure 3). The investment gap for water and sanitation is around $100 billion per year, while the gap in telecommunications is small.
Figure 3: Infrastructure Investment, Current and Projected, by Sector
Notes: 1 For Transportation, Power, Water and Sanitation, Telecommunications: Current Investment is based
on 2011 figures. Investment needs are for 2016–2030 divided by 15 years. 2 For Education and Health: Figures only include 18 DMCs; Year coverage: 2009 (Education) and 2013
(Health) for the Philippines; 2013 for Fiji, India, Thailand, and Viet Nam; 2014 for Armenia, Bangladesh, Bhutan, Indonesia, Nepal, Pakistan, Sri Lanka, and Timor-Leste; 2011 (Education) and 2014 (Health) for Mongolia; 2015 (Education) and 2014 (Health) for Kazakhstan; 2014 for the Kyrgyz Republic; 2012 for Georgia; and 2012 (Education) and 2014 (Health) for the People’s Republic of China.
Source: Asian Development Bank (2017a).
B. Social Infrastructure 19. The financing gap in the social sector, including education and health, is also wide. Although few studies are available to estimate the gross funding gap for the social sector in Asia, comparing actual social sector spending with the benchmark can provide the necessary information. This study adopts the United Nations Educational, Scientific and Cultural Organization (UNESCO) recommendation as a benchmark for education spending needs and the World Health Organization (WHO) benchmark for health spending needs. 20. In this study, the total education investment covers general government education expenditure (current, capital, and transfers). It includes transfer-funded expenditure from international sources to government. Total health investment refers to total health expenditure as the sum of public and private health. It includes the provision of health services (preventive and curative); family planning; nutrition; and emergency aid designated for health, excluding those allocated for water and sanitation. UNESCO recommends that 6% of GDP be allotted for education, and the WHO recommends that 5% of GDP be spent on health (Singh 2010). 4 The difference between education or health expenditure and the UNESCO or WHO benchmarks is used to estimate the education and health spending gaps.
4 Recommendation on education expenditure as mentioned by UN Special Rapporteur on the Right to Education; Kishore
Singh at the UNESCO Future Seminar on “Innovative Financing for Education” in 2010; Recommendation on health expenditure as implied in WHO World Health Report 2010.
386
982
240
557
62152
44 53
673
1,048867 939
0
200
400
600
800
1000
1200Cu
rrent
Inve
stm
ent
Ann
ual
Nee
ds
Curre
ntIn
vest
men
t
Ann
ual
Nee
ds
Curre
ntIn
vest
men
t
Ann
ual
Nee
ds
Curre
ntIn
vest
men
t
Ann
ual
Nee
ds
Curre
ntIn
vest
men
t
Ann
ual
Nee
ds
Curre
ntIn
vest
men
t
Ann
ual
Nee
ds
Waterand Sanitation
Telecommu-nications
Health
$ bi
llion
PowerTransportation Education

6 ADB South Asia Working Paper Series No. 57
21. In 2016, $673 billion was spent on education, and $867 billion on health in 18 major DMCs (Figure 3). The Kyrgyz Republic, Mongolia, the PRC, Thailand, and Viet Nam spent above 4% of GDP in both education and health. Bangladesh, Kazakhstan, and Pakistan spent less than 3% of GDP on either education or health. In addition, although the spending of most developing Asian countries on education and health is balanced, some spend much more on education than health (Bhutan, Timor-Leste), while other Asian countries spend much more on health than education (Armenia, Georgia, Nepal, the PRC, the Philippines, and Sri Lanka).5 22. Following the approach described above, the total social sector spending gap in Asia is estimated at $448 billion, almost equivalent to the total physical infrastructure investment gap (Figure 4). Most of the gap comes from the education sector, which amounts to $376 billion, with just $72 billion for health. It is important to note that this study is measuring the gap on public spending in education and health, which includes not only capital, but also recurrent spending. Hence, the scope of financing gap is wider than that estimated for economic infrastructure, which mostly cover capital spending. As less than 20% of social sector spending is on capital, and more than 80% on recurrent spending (staff salaries), the financing gap for capital will likely be smaller than estimated. Due to data limitation, however, this study is not able to disaggregate the spending on the “hard” and “soft” sides of the social sector spending.
Figure 4: Current Infrastructure Investment in Social Sector
GDP = gross domestic product; PRC = People’s Republic of China; UNESCO = United Nations Educational, Scientific and Cultural Organization; WHO = World Health Organization. Notes: Years covered: 2009 (Education) and 2013 (Health) for the Philippines; 2013 for Fiji, India, Thailand, and Viet Nam; 2014 for Armenia, Bangladesh, Bhutan, Indonesia, Nepal, Pakistan, Sri Lanka, and Timor-Leste; 2011 (Education) and 2014 (Health) for Mongolia; 2015 (Education) and 2014 (Health) for Kazakhstan; 2014 for the Kyrgyz Republic; 2012 for Georgia; 2012 (Education) and 2014 (Health) for the PRC; and 2015 for Singapore. Sources: United Nations. United Nations Educational, Scientific and Cultural Organization (UNESCO) Institute for Statistics. Available at: http://uis.unesco.org/ (accessed October 2017); World Health Organization. Global Health Expenditure database. Available at: http://www.who.int/health-accounts/ ghed/en/ (accessed October 2017); Country government budget documents for education and health capital investment.
5 UNESCO Institute for Statistics. Available at: http://uis.unesco.org/ (accessed October 2017); WHO. Global Health
Expenditure database. Available at: http://www.who.int/health-accounts/ghed/en/ (accessed October 2017); World Bank. World Development Indicators. Available at: http://data.worldbank.org/indicator (accessed October 2017).
Closing the Financing Gap in Asian Infrastructure 7
C. Structure of Financing Gaps 23. According to ADB (2017), the public sector dominates infrastructure financing, with 92% of the total. Public sector participation in infrastructure financing is highest in East Asia, with its share of over 90%, and lowest in South Asia, holding 62% of the infrastructure financing. The private sector’s contribution is rising, accounting for 80% of physical infrastructure investment in Maldives, 50% in Pakistan and the Philippines, and 40% in India. In contrast, in several countries, such as Bhutan, the PRC, and Mongolia, the role of private sector infrastructure investment is still very limited (Figure 2). 24. Sources of funding (public versus private) varies by sector, depending on expected return, predictability of revenue stream, and risk profile (Figure 5). The telecommunications sector is the most attractive for private investment, and the power sector comes second. Similar to Latin America, more than 75% of the telecommunications sector and close to 50% in the power sector are privately financed in Asia. In contrast, water and sanitation, transport infrastructure, and social sector investment in the region are mostly invested by the public sector.
Figure 5: Infrastructure Investment, by Financing Source and Sector
Notes: 1 Latin America transport data is for land transport only. Years are: 2011 for Developing Asia; 2001–
2006 gross domestic product-weighted average for Latin America. 2 ADB estimates based on country sources and private participation in World Bank, Infrastructure,
database. Sources: World Bank. Private Participation in Infrastructure Database. Available at: https://ppi.worldbank.org/ (accessed September 2017); World Bank. World Development Indicators. Available at: http://data.worldbank.org/indicator (accessed October 2017); Country sources as used in Calderon and Servén (2009).
25. The potential for additional public-sector financing for infrastructure is limited, however. It depends on several factors, including the potential for increasing tax revenue through tax reform; reorienting spending such as by reducing general fuel subsidies; and prudent public-sector borrowing. ADB (2017) points out that while most countries in Asia have additional fiscal space to increase infrastructure investment, it is not sufficient, except in the PRC, which is able to fill its future infrastructure investment gap through higher public investment. Public financing during 2016–2020 is estimated to be $272 billion per year, approximately 60% of the total gap in Asia (Figure 6). This means
23.4 21.2
51.2 52
78.659.2
99.8
76.6 78.8
48.8 48
21.440.8
9.2
0102030405060708090
100
%
DevelopingAsia
LatinAmerica
DevelopingAsia
LatinAmerica
DevelopingAsia
LatinAmerica
DevelopingAsia
Telecommunications Power Transportation Water andSanitation
Public Private

8 ADB South Asia Working Paper Series No. 57
that private financing will have to increase from the current $62.5 billion to $250 billion to fill the remaining gap. Facilitating private infrastructure financing is therefore critical.
Figure 6: Infrastructure Financing Gap, Public versus Private, 2016–2020
PRC = People’s Republic of China. Note: Numbers may not add up to total due to rounding. Source: ADB (2017a) estimates.
III. WHY HAVE ASIA’S SAVINGS LARGELY FAILED TO FINANCE ITS INFRASTRUCTURE NEEDS?
26. Leading economies in developing Asia have accumulated massive savings and foreign reserves in recent years. For example, while the People’s Republic of China (PRC) is still a developing economy, its total gross savings and foreign reserves exceed many advanced economies in Europe and America, including the United States (US). However, as noted, Asia’s efforts to draw on its own foreign exchange savings and reserves to fund the region’s investment have been weak, and this is not limited to infrastructure. Addressing this paradox may lead to the fundamental solution for the infrastructure investment gap.
A. Cross-border Investment Paradox
“… the most surprising development in the international financial system over the last half dozen years…is the large flow of capital from the world's most successful emerging markets to the traditional industrial countries, and the associated enormous buildup of reserves in the developing world (Summers 2006).”
27. In a lecture in 2006 at the Reserve Bank of India, Lawrence Summers summarized this as the “Global Capital Flows Paradox,” which has three features:
(i) a large flow of capital from the world's most successful emerging markets to the traditional
industrial countries, and the associated enormous buildup of reserves in the developing world;
Public:$272 billion
Public:$121 billion
Private:$187 billion
Private:$187 billion
050
100150
200250300350400450500
Gap with the PRC[$459 billion]
Gap without the PRC[$308 billion]
Ann
ual I
nves
tmen
t Gap
($ b
illion
in 2
015 p
rices
)

Closing the Financing Gap in Asian Infrastructure 9
(ii) global reserves of emerging markets that far exceed any previous criterion of reserve needs for financial protection; and
(iii) very low expected real returns on these reserves. 28. Although it is still unclear what the fundamental driving forces of this paradox are, Asia has clearly suffered this problem, and the same observation still holds more than one decade after Summers. Even counting the portfolio assets only, Asia invested $6.2 trillion in the rest of the world as of the end of December 2016, while the rest of the world invest $4.4 trillion in Asia.6 This nearly $2 trillion gap is consistent with the “large outflow of capital” Summers observed. 29. If only one-quarter of this net outflow from Asia were retained in Asia and invested in infrastructure, the infrastructure financing gap would be filled. 30. The economies that have accumulated massive savings and exported them are industrialized, especially Japan. It invests $4 trillion in portfolio assets outside of Asia. If Japan is excluded, Asia’s inflow and outflow of portfolio capital would be almost balanced (Table 2). If Hong Kong, China; Macau, China; the Republic of Korea; Singapore; and Taipei,China are also excluded, the inflow would be more than three times the outflow. Hence, the global capital flow paradox is mostly driven by developed economies in Asia. 31. Table 3 also indicates total portfolio investment assets from select major countries in Asia to and from the rest of the world. It suggests the following:
(i) Japan and the Republic of Korea have high savings rates (around 30%), accumulate high reserves (much of the reserves are invested in US treasury bills), and most of their portfolio investments are outside of Asia. For Japan, for example, $3.75 trillion out of $3.88 trillion of portfolio investment (or 97%) is outside of Asia. All these features are consistent with the capital flow paradox.
(ii) Emerging economies show growing potential investment opportunities but are yet to play important roles due to less developed financial markets. For example, the PRC’s savings reach 46%, its gross savings are five times those of Japan; its total reserves three times Japan’s, and its investment in US treasury bills is comparable to that of Japan. However, the cross-border portfolio investment of the PRC is less than 10% of Japan’s. The potential for such emerging economies to use their high savings for infrastructure investment in Asia is clear.
(iii) The excessive outflow of portfolio capital was similar for debt and equity securities. The majority of Asia’s total investment in debt and equity left Asia, only 4.9% in debt and 2.6%, in equity stayed in Asia.
(iv) The scale of capital flow in the form of direct investment is much smaller than that of portfolio investment, especially for more developed economies. Interestingly, a much larger share of direct investment stayed in Asia (40%), compared with portfolio investment (less than 5% staying in Asia) (Figure 7). However, data available is not enough to compare the direct investment in and out of Asia, so it is unclear if there is a net outflow of direct investment, like portfolio investment.
6 Total portfolio investment assets from Asia is the sum of investments from Hong Kong, China; Japan; Macau, China;
the Republic of Korea; Singapore; Taipei,China, as well as the selected countries of Developing Asia that include Bangladesh, Bhutan, Brunei Darussalam, Cambodia, the Federated States of Micronesia, Fiji, India, Indonesia, Kiribati, the Lao PDR, Malaysia, Maldives, Mongolia, Myanmar, Nepal, Palau, Papua New Guinea, the People’s Republic of China, the Philippines, the Marshall Islands, Samoa, Solomon Islands, Sri Lanka, Thailand, Timor-Leste, Tonga, Tuvalu, Vanuatu, and Viet Nam.
10 ADB South Asia Working Paper Series No. 57
Table 2: Portfolio Investment Assets Position from Asia to the World and Vice Versa
Portfolio Investment Assets Positions from
Asia to the rest of world ($ billion)
Portfolio Investment Assets Positions in Asia
from the rest of the world ($ billion)
Developing Asiaa 484.9 1,700 Developing Asia including Hong Kong, China; the Republic of Korea; Macau, China; Singapore; and Taipei,China 2,431.0 2,384 Developing Asia including Hong Kong, China; Japan; the Republic of Korea; Macau, China; Singapore; and Taipei,China 6,237.0 4,354
a Selected countries of Developing Asia include Bangladesh, Bhutan, Brunei Darussalam, Cambodia, the People’s Republic of China, Fiji, India, Indonesia, Kiribati, the Lao PDR, Malaysia, Maldives, the Marshall Islands, the Federated States of Micronesia, Mongolia, Myanmar, Nepal, Palau, Papua New Guinea, the Philippines, Samoa, Solomon Islands, Sri Lanka, Thailand, Timor-Leste, Tonga, Tuvalu, Vanuatu, and Viet Nam.
Sources: International Monetary Fund. 2016. Coordinated Portfolio Investment Survey. http://data.imf.org/CPIS (accessed October 2017); Authors’ estimates.
Table 3: Total Gross Savings, Reserves, and Net Investment in Selected Countries
Investment
Country
Gross National Savings
(% of GDP)a
Total Gross Savings (current
$ billion)b
Total Reserves (include gold,
current $ billion)b
US Treasury Securities Holdings
($ billion)c
Total investment of
providers of funded and
private pension arrangements
(% of GDP)d
Total Portfolio Investment
Assets to the world
($ billion)e
Total Portfolio Investment
Assets from the world
($ billion)e
Total Portfolio Investment
Assets to outside Asia
($ billion)e
Total Portfolio Investment Assets from outside Asia
($ billion)e
Foreign Direct
Investment Net Outflows
(BOP, $ billion)f
Foreign Direct
Investment Net Inflows
(BOP, $ billion)f
Austria 26.10 101.8 23.3 … 6.0 307.4 360.3 303.1 349.9 –28.8 –27.7
Belgium 23.39 105.3 23.5 120.4 6.9 668.1 576.4 662.3 544.0 4.2 19.4
PRC 45.84 5,350.2g 3,097.7 1,058.4 1.5 359.7 830.1 241.9 365.6 217.2 170.6
Germany 27.60 939.4 184.0 82.3 6.8 2,976.8 2,742.0 2,914.2 2,562.0 76.3 52.4
India 30.49 685.5 g 361.7 118.2 1.1 2.6 407.0 2.2 337.8 5.0 44.4
Indonesia 32.54 299.8 116.4 … 1.8 13.2 163.2 10.2 125.2 –11.4 3.8
Japan 27.22 1,183.3 g 1,216.5 1,090.8 29.4 3,877.7 2,041.5 3,751.8 1,958.8 169.6 34.9 Republic of Korea 36.20 503.9 370.2 93.2 26.9 302.8 489.2 255.5 407.4 27.3 10.8
Malaysia 28.11 83.06 g 94.5 … 0.1 73.0 108.7 38.1 75.5 10.1 13.5
Philippines 23.79 133.8 80.7 38.5 … 11.5 63.2 7.1 52.2 3.7 7.9
Thailand 33.41 121.1 g 171.8 66.0 6.8 38.7 99.4 24.3 78.2 14.3 1.7 United Kingdom 12.64 330.8 134.9 217.2 95.3 3,568.2 3,323.0 3,067.3 3,001.3 41.3 299.6
United States 18.60 3,462.4 g 405.9 … 134.9 9,761.7 12,205.4 7,941.9 9,854.5 311.6 479.4
Viet Nam 31.26 52.8 36.5 … … … 10.8 … 7.4 1.0 12.6 … = not available, BOP = balance of payments, GDP = gross domestic product, PRC = People’s Republic of China. Sources: a International Monetary Fund. World Economic Outlook Database.https://www.imf.org/external/pubs/ft/weo/2017/02/weodata/weoselgr.aspx (accessed October 2017). b World Bank.2016. World Development Indicators. Available at: http://data.worldbank.org/indicator (accessed October 2017). c United States Department of Treasury. 2016. Major Foreign Holders of Treasury Securities. Available at: http://ticdata.treasury.gov/Publish/mfh.txt (accessed October 2017). d Organisation for Economic Co-operation and Development (OECD). 2017. Pension Markets in Focus. Available at: http://www.oecd.org/pensions/private-pensions/Pension-Markets-in
-Focus-2017.pdf (accessed December 2017). (figures for all countries are in 2016, except for Malaysia in 2015). e International Monetary Fund. 2016. Coordinated Portfolio Investment Survey. http://data.imf.org/CPIS (accessed October 2017). f World Bank.2016. World Development Indicators. Available at: http://data.worldbank.org/indicator (accessed October 2017). g World Bank.2015. World Development Indicators. Available at: http://data.worldbank.org/indicator (accessed October 2017).

Closing the Financing Gap in Asian Infrastructure 11
Figure 7: Investment Assets Positions from Developing Asia and Pacific Region to the World and Vice Versa
Notes: 1. For debt securities and equity assets, others include all countries except the Asian developing
countries in that include Bangladesh, Bhutan, Brunei Darussalam, Cambodia, the People’s Republic of China, Fiji, India, Indonesia, Kiribati, the Lao People’s Democratic Republic, Malaysia, Maldives, the Marshall Islands, the Federated States of Micronesia, Mongolia, Myanmar, Nepal, Palau, Papua New Guinea, the Philippines, Samoa, Solomon Islands, Sri Lanka, Thailand, Timor-Leste, Tonga, Tuvalu, Vanuatu, and Viet Nam; European countries that include: Albania, Austria, Belgium, Bosnia and Herzegovina, Bulgaria, Croatia, Cyprus, Czech Republic, Denmark, Estonia, Finland, France, Germany, Greece, Hungary, Iceland, Ireland, Italy, Republic of Kosovo, Latvia, Lithuania, Luxembourg, Macedonia, Malta, Montenegro, the Netherlands, Norway, Poland, Portugal, Romania, San Marino, Republic of Serbia, Slovak Republic, Slovenia, Spain, Sweden, Switzerland, Turkey, and United Kingdom; and the United States (US).
2. For Regional Outward Investment Positions: figures for (i) the US include North and Central America; (ii) Developing Asia includes the whole Asia and Oceania; and (iii) others include North Africa, sub-Saharan Africa, North Atlantic and Caribbean, South America, economies of the Persian Gulf, and other near and Middle East economies.
Sources: a International Monetary Fund. 2016. Coordinated Portfolio Investment Survey.
http://data.imf.org/CPIS (accessed October 2017). b International Monetary Fund. 2015. Coordinated Direct Investment Survey. http://data.imf.org/CDIS
(accessed October 2017). c Authors’ estimates.
B. Sources of Failure 32. Why have Asia’s high savings, especially private savings, not been invested within the region, especially in infrastructure? The constraints contributing to this problem can be classified by whether they reduce the supply of funds (making it costly to channel funds to infrastructure) or whether they reduce demand for funds (due to the limited supply of viable projects). 33. Recent studies mostly point to the latter factor as the major hindrance to closing the infrastructure financing gap. For instance, the Global Infrastructure Facility (2016) identified the following critical barriers, which are intrinsically related: weak pipeline of viable projects, high risks and high perception of risks (regulatory, legal, political, economic, and financial), and infrastructure not well-defined as an asset class.
32.3 32.716.8
11.9 17.9
14.9
4.92.6 41.8
50.9 46.826.5
01020304050%
60708090
100
Debt Securities Assetsfrom Developing Asia
Equity Assetsfrom Developing Asia
Regional OutwardInvestment Positions
from Asia
United States Euro Developing Asia Others

12 ADB South Asia Working Paper Series No. 57
34. This study emphasizes three key factors. One factor lies on the fund supply side, which is the significant financial, fiscal, and other institutional constraints to investing in infrastructure. The other two factors are on the fund demand side: (i) insufficient and poorly designed projects with returns insufficient to attract investment; and (ii) high infrastructure investment risks, some specific to Asia, may have made infrastructure investment in the region less attractive to Asian investors.
1. Financial, Fiscal, and other Institutional Constraints 35. An environment that is not conducive to investment is clearly a major reason for the shortage of infrastructure investment in Asia. This is not only critical in less developed economies, but may also be relevant for developed countries in the region, including Japan and the Republic of Korea. In these developed economies, financial markets are developed and the funds available for investing in infrastructure is huge, but cross-border investment rules and regulation often hold investors back from funding infrastructure projects. The tightening of financial regulations since the 2008 financial crisis contributes to this. 36. Moreover, the lack of innovative financing products to engage private financing also hinders the investment by these developed economies within Asia. For example, while infrastructure has been more widely accepted as a distinct asset class in recent years (BlackRock 2015; Roberts et al. 2015; Russ, Thambiah, and Foscari 2010), it is not yet an asset class for investors in Asia. 37. By nature, infrastructure assets differ from other asset classes in several ways:
(i) Infrastructure typically presents significant entry barriers and tends toward monopoly. As a result, it would appear financially less sensitive to the economic cycle than many other types of assets (Blanc-Brude et al. 2016).
(ii) Demand for essential services tends to be stable over the medium to long term. This results in infrastructure being associated with lower risks, especially once it reaches the brownfield stage (Bhattacharya 2012).
(iii) Infrastructure investments are diverse as they offer a broad universe of investments ranging from mature assets to opportunistic investment strategies offering a variety of risk–return profiles (Figure 8).
38. For an asset class to be well-defined, there must be information about a group of securities (debt, equity) that share similar characteristics, behave similarly in the market, and are subject to similar laws and regulations. These are still obstacles to overcome in Asia. 39. Persistent information asymmetries exist in Asia, and information about projects, their risks, and actual demand are not shared efficiently. The lack of transparency on the real returns of infrastructure investments prevents investors from comparing the risk–return profiles of projects. 40. Asia is vast and consists of many countries with different legal and regulatory environments. Projects thus face different laws and regulations across countries and require different contractual terms and structures to fit the local context. The lack of standardization requires investors to assess each project and jurisdiction separately. This can increase total project costs by 1%–5% (McKinsey Global Institute 2016). While institutional investors can evaluate projects in this manner, it is not as efficient as a platform to share information and compare projects in a standardized fashion. Retail investors do not have access to the information or networks that institutional investors do, which means that they cannot

Closing the Financing Gap in Asian Infrastructure 13
make rational investment decisions about infrastructure in emerging and developing economies. This greatly reduces the pool of capital available for financing infrastructure globally.
Figure 8: Risk–Return Profiles of Infrastructure Investments in Relation to Traditional Asset Classes
Source: Russ and Foscari (2010).
41. These uncertainties prevent the development of an asset class that could be priced efficiently and traded freely. Without this definition, the demand for infrastructure finance in emerging and developing economies will not align with the supply of finance for long-dated, inflation-linked returns. 42. Inattention to social and environmental protection in large-scale infrastructure projects in developing countries are also criticized and limit infrastructure investment. This issue is particularly relevant for Asia, where dense populations, rapidly rising income levels, and awareness of living quality makes environmental and social safeguards one of the most important considerations in investing in infrastructure.
2. Weak Preparation of Bankable Projects 43. Currently, developing Asia lacks a supportive policy environment and project-structuring capacity to generate bankable projects for investment. This is particularly true in the utility and social infrastructure sectors, which do not provide adequate economic returns, but meet the social needs of the citizens. 44. Meanwhile, infrastructure projects are complex. As Mckinsey Global Institute (2016, 23) notes, about 70% of the pipeline now available to equity investors is greenfield projects, which the authors view as much riskier than brownfield projects with demonstrated returns.7 Before deciding to proceed with
7 A brownfield project is one that is already built and operating; a greenfield project is one still under development.
Fixed Income
Greenfield Infrastructure
Equities
Brownfield Infrastructure
• Seasoned toll roads• Social Infrastructure
• Electricity generation• Gas processing• Ports
• Airports• Desalination• Rail Infrastructure
• Greenfield Project Development• New toll roads• Merchant power plants
Expe
cted
retu
rns
Expected risk

14 ADB South Asia Working Paper Series No. 57
an investment, the private sector needs to be assured that a project is investment-ready. Hence, poorly designed and planned projects raise financing costs significantly, a major reason infrastructure projects cannot mobilize private sector financing (Beckers and Stegemann 2013). 45. In addition, an efficient government will have a pipeline of clearly viable projects for investment and communicate this to the marketplace. Yet, such investment-ready projects are lacking in Asia, a key constraint on attracting private investment. The need is thus urgent to design and develop bankable infrastructure projects with proper designs and using appropriate models. This could include various public–private partnership (PPP) models, appropriate instruments (such as concessional financing for less-developed countries), and other innovative approaches. 46. Importantly, it is not for lack of viable projects that project pipelines are limited, but because governments lack the capacity, experience, or understanding of the private sector needed to prepare investment-ready projects. This means many projects are delivered to the market with insufficient information for investors to determine whether they are bankable. Several reasons explain the inadequate quality of project preparation:
(i) Governments may not develop strategic infrastructure plans or plan, sector-wide, to maximize economic and financial efficiency, which would allow them to optimize project selection and meet needs efficiently.
(ii) Governments in Asia mostly have limited experience working with the private sector. This means they may not be familiar with private sector expectations, or the analysis they will conduct to consider investing in a project. Importantly, the project management frameworks governments use are typically incompatible with those of the private investors. This makes it costly for those investors to participate in infrastructure projects or, if they do participate, introduces new challenges to the financial management of the projects.
(iii) The cost of preparing a project (e.g., project planning and elaboration) in developing economies with little experience in project preparation can be up to 10% of total project costs (G20 2011). This is much higher than the costs in countries with more experience in project preparation. Due to limited fiscal resources, governments in Asia are often unable to bear these costs (Studart, Gallagher, Bhattacharya 2016, 25). On the private side, not all developers are willing to bear project development costs. Developers typically expect to recover project development costs through the eventual fees charged to customers, the government, or a donor. When governments regulate tariffs, this may limit the developer’s ability to recover the cost of developing the projects.
3. High Infrastructure Investment Risks
47. Risks are the major reason infrastructure investment in Asia falls short, despite huge demand for infrastructure projects. A good example is country risk: that is, state entities’ weak capacity for meeting contractual obligations, which runs the risk of either explicit breach of contract or failure to pay. In developing Asia, ADB rates 41% of economies in the bottom categories on country risk (6 or 7 for the highest country risk), and another 31% are unrated (ADB 2017b). Standard & Poor’s measure of sovereign risk put 26% of developing Asia below investment grade, at BBB–, and leaves 59% unrated. Only 15% are investment grade and therefore acceptable to international lenders. “The regulatory, macroeconomic, and political risks present in many [emerging market and developing economies]

Closing the Financing Gap in Asian Infrastructure 15
countries result in a hurdle rate of return that is too high, resulting in limited bankable projects for private investment additionally” (GIF 2016). 48. Inconducive investment environments may lead investors to associate infrastructure projects in Asia with a higher credit risk. Worse, some private investors only want to hold debt instruments from more or less safe infrastructure assets, preferably with guarantees. As a result, investors in private infrastructure generally cluster in the relative safety of the brownfield infrastructure asset class, in which yields are no longer that attractive. Greenfield infrastructure projects, meanwhile, attract far fewer investors, as these types of project are exposed to construction, regulatory, and demand risk. They also present much longer payback periods. 49. Among standard transport and energy infrastructure projects, meanwhile, the investor would face limited construction risk, but may face demand and regulatory risks instead. And construction is a bigger concern in unusual investments, among them, nuclear reactors, long tunnels, or major urban redevelopment projects. 50. Products that address the risks in financing Asia’s infrastructure investment at both the project and country level, as well as market failures and economy-wide impacts, are thus crucial for attracting additional investments in infrastructure. “Private lenders may be unwilling to lend to projects with high levels of risk unless sufficient credit enhancements or de-risking mechanisms are in place” (GIF 2016). However, some countries may present long-term infrastructure projects that, although otherwise viable, provide no guarantees to address construction, demand, or exchange rate risks, or provide no securitization of underlying assets by financial intermediaries. As such, those projects will not be funded.
4. Long-Term Investors Yet to Play Their Role in Asia 51. The long-term investor, naturally, is in a better position to invest in longer-term global infrastructure assets, where competition is likely to be less and demand for funding is huge. Hence, there is hope such investors can play a major role in filling the infrastructure financing gap. 52. This has not materialized in Asia, for two reasons. The scale of pension funds in the region, especially developing Asia including the PRC, remains much smaller than developed economies outside of Asia. Most of the pension funds in Asia are in industrialized countries (Table 3). Inderst (2016) estimates that approximately $17 trillion of private capital is available in Asia and the Pacific. The bulk of this is in Japan and Australia. 53. Another reason is that fund allocation has remained below their target allocations to infrastructure in reality. Only about 1% is invested in infrastructure (Inderst and Stewart 2014; Kaminker and Stewart 2012), which the World Bank estimates to be $1 trillion. The World Economic Forum reckons that about $700 billion is directly invested in illiquid assets such as private equity, real estate, and infrastructure. “All funds that reported a separate target allocation to infrastructure were below targets at the end of 2014” (OECD 2016, 19–20), especially during the development stage. A Preqin (2016) survey pointed out that institutional investors have current allocations well below their targets for infrastructure projects as the challenges facing the sector have increased, including regulatory, political, and macroeconomic risks. For instance, as of 2015, public pension funds were on average targeting a 5.1% allocation, but had only a 3.2% actual allocation, while, for insurance companies, the allocations were a 3.9% target, but only 2.9% actual. The private pension fund target was 4.3% against 2.5% actual allocation.

16 ADB South Asia Working Paper Series No. 57
54. An exception is sovereign wealth funds, at $7 trillion globally, about 40% based in Asia, and 29% of which is invested in infrastructure (Inderst 2016).
IV. HOW TO BRIDGE THE FINANCING GAP A. Solution Framework 55. Asia needs to address the major barriers to infrastructure development such as the weak pipeline of viable projects, high-risk perception, institutional constraints, and poor definition of infrastructure as an asset class. Three strategic solutions can address the constraints. These are (i) innovative measure to mitigate constraints, (ii) preparation of bankable projects, and (iii) mitigation of risks.
1. Innovative Measures to Mitigate Institutional Constraints to Facilitate Financing of Infrastructure
56. Policy and regulatory reforms are needed to improve the investment climate for greater private sector participation. At the same time, operations can be improved by streamlining business processes with lean principles in, but not limited to, approval and review. Although institutional constraints normally take time to improve, such as in cross-border investment rules and regulations, innovative financing solutions can be effective over a shorter period. 57. Central banks could play a more active role in providing the funding necessary to allow development banks to finance development (Rezende 2015). In particular, instead of targeting sovereign bonds, monetary authorities would buy debt issued by development banks, especially those financing infrastructure and other corporate activities. This would effectively eliminate funding constraints on the development bank’s balance sheets. This proposal has also been embraced by one of the world’s most powerful bond managers, which advocated that “[t]he European Central Bank should retool its asset purchase programme to fund a wave of new infrastructure spending across the continent” (Foley and Jones 2016). This means “the central bank has the opportunity to unleash hundreds of billions of dollars in new economic activity by shifting more of its purchases towards bonds issued by the various national and supranational organizations, such as the European Investment Bank, that fund infrastructure and provide trade finance” (Foley and Jones 2016). 58. Two new multilateral development banks were established in 2015, the Asian Infrastructure Investment Bank and the New Development Bank. However, mere establishment of new infrastructure financing institutions will not be sufficient to close the infrastructure gap. The existing and new institutions need to develop innovative financing mechanisms and instruments that use Asian (national, subregional, and regional) and international savings for infrastructure development. For example, the region can introduce schemes such as wholesale banking through financial intermediaries, or B-loan syndications that commercial banks and other eligible financial institutions can fund, with ADB acting as lender of record. In addition, the bond market can be developed (such as through the Asian Bond Market Initiative). 59. Development banks have set up a number of “infrastructure investment platforms,” although international attention has been somewhat lacking. Such specialized investment platforms mainly seek to direct the major streams of capital from public and private long-term savings into infrastructure. The World Bank Group launched a new major initiative with the Global Infrastructure Facility (GIF), officially established at its October 2014 Annual Meeting. It offers services for identifying and preparing projects

Closing the Financing Gap in Asian Infrastructure 17
and has budgeted $80 million for project preparation. On the downstream side, the GIF is budgeting $200 million. Viewed against the gargantuan global need for $1 trillion dollars a year for the next 2 decades, however, these efforts appear insufficient. 60. Donor agencies and governments have also coordinated to create more substantial support for PPPs through project facilitation platforms. These bring together public and private financers and aim to connect global financial flows with infrastructure needs in developing countries (and developed countries in some cases). Such platforms include the G20 Global Infrastructure Hub, which was created in 2014, the African Development Bank’s Africa 50 Infrastructure Fund set up in 2015, the World Economic Forum and Organisation for Economic Co-operation and Development (OECD) Sustainable Development Investment Partnership, launched at the Third International Conference on Financing Development in 2015, and the World Bank’s Global Infrastructure Facility created in 2014 (OECD 2015). 61. Blended Finance refers to a “complementary” use of grants (or grant-equivalent instruments) and nongrant financing from private and public sources for financing on terms to make projects financially viable and financially sustainable (Mustapha, Prizzon, and Gavas 2014). Blended finance aims for conditions that “crowd-in” private investment by injecting grant financing into commercial projects. The facilities in this sort of financing may combine grants from aid agencies with long-term financing as loans or equity by Development Finance Institutions and private financers. Some blended finance instruments include output-base aid, that is, grant-subsidies that require compliance with the delivery of specific services, such as electricity and water and sanitation for poor people (Miyamoto and Biousse 2014; Mustapha, Prizzon, and Gavas 2014). 62. The market needs a fully investable emerging market infrastructure debt index to serve as a benchmark and possibly the basis for an investment product. An index like this could promote liquidity and provide institutional and retail investors insight and access into the emerging market infrastructure space (GIF 2016). While there are a few infrastructure indexes, most are composed of a small number of bonds, many not sufficiently liquid for the index to be fully investable.
2. Preparation of Bankable Projects 63. Project preparation facilities are needed to support infrastructure project development in Asia, from project design to commercial close. According to the Multilateral Development Bank Working Group on Infrastructure (2011), project preparation facilities, are generally grant-financed instruments created to streamline the preparation of infrastructure projects, increasing their quantity and quality. It is estimated that the cost of such facilities for complex PPPs in infrastructure is from 5% to 10% of total project costs. The group says the facilities can be multiregional and multisectoral or focus on specific regions and sectors, normally hosted by multilaterals, although some bilaterals create their own facilities to support domestic companies. The Asia Pacific Project Preparation Facility (hosted by ADB), is an example. 64. Developing a high-quality pipeline of bankable projects includes developing an enabling environment for investment, defining, and identifying projects, and preparing and structuring them through the following means (GIF 2016).
(i) Identify reform measures to develop an enabling environment: (a) Identify sector-level reform, including legal, regulatory, and institutional reforms to
enable successful project development and facilitate investment. (ii) Define potential projects:
(a) sector planning and development road map; and

18 ADB South Asia Working Paper Series No. 57
(b) project definition and screening─needs and options assessment, project pre-feasibility studies, initial fiscal analysis, and assessment of implementation options (public or private).
(iii) Conduct project preparation and investment feasibility assessment: (a) detailed feasibility studies, including technical feasibility, market analysis,
engineering estimates, geotechnical or resource assessments, environmental and social impact assessments;
(b) investment appraisal─financial viability assessment, fiscal impact analysis, and economic analysis;
(c) PPP structuring─risk identification and allocation; and (d) commercial appraisal, including initial market sounding.
(iv) Carry out quality assurance of government project pipelines: (a) Conduct verification service to ensure line ministries have done appropriate due
diligence and projects are sufficiently well-prepared (e.g., a rapid third-party assessment of the quality and completeness of a project’s preparation by GIF).
(b) Recommend a set of actions to improve the project’s preparation so that it meets the expectations of investors and bidders.
3. Mitigating risks
65. As noted, political and financial risks dampen institutional investor appetite for infrastructure projects even though these can yield more than long-term government bonds at relatively low risk. To address this constraint, several risk-mitigating measures can be explored to de-risk projects to a level that makes them conducive to investment (GIF 2016):
(i) Contingent subordinated guarantees (a “risk sharing” facility for the lender to bear some risk) can help raise the debt rating.
(ii) A regulatory risk cover facility can be established to cover the debt service default caused by regulatory changes (for instance, a reduction in feed-in tariffs for renewable energy projects).
(iii) A counterparty risk cover facility can be established to cover nonpayment or late payment by less creditworthy state-owned enterprises without a counter indemnity from the government.
(iv) A contingent refinancing facility can be established to allow commercial banks to extend their loan tenors by providing a refinancing guarantee.
66. Cases later in this section illustrate progress in implementing these measures. B. Role of Multilateral Development Banks 67. Multilateral development banks’ (MDBs), uniquely combining technical expertise and long-term relations with governments,8 have made them indispensable in the origination of greenfield
8 This includes existing MDBs such as ADB and the World Bank; new MDBs such as the Asian Infrastructure Investment
Bank and New Development Bank–Brazil, Russia, India, the People’s Republic of China, and South Africa (BRICS); bilateral development banks or agencies (such as the Japan Bank for International Cooperation and the Japan International Cooperation Agency); as well as the Export–Import Bank of China, and Korea Export–Import Bank, investment banks, regional cooperation institutions, and special national institutions.
Closing the Financing Gap in Asian Infrastructure 19
investments and financing of infrastructure projects. They are critical in alleviating government financial constraints and risk sharing. 68. The global financial crisis of 2007–2008 sparked new interest in development banks and their role in promoting infrastructure development during crisis and outside crises, while dampening the effects of financial fragility domestically and internationally, and promoting the development of organized liquid capital markets (Rezende 2015). 69. Third parties can help monitor the improvements of the efficiency of contract enforcement (Dewatripont and Legros 2005). MDBs, the obvious third party in the majority of developing countries, can monitor both the service provider and the government agency. They are fundamental to structuring financing efficiently and providing optimal insurance or guarantees to private investors in PPPs. Because of this, donor initiatives increasingly seek to use donor and government funds to leverage private finance for infrastructure. And while the principles behind leveraging have been around for some time, interest in the donor community has increased sharply recently. Notable are guarantees intended to make projects less risky and therefore more attractive to investors (Miyamoto and Chiofalo 2015). Donors also provide debt and equity finance for PPPs. Such measures are called blended finance, which is intended to catalyze private capital by reducing risks or increasing returns (Martin 2015). 70. ADB is also boosting support to help address the Asian infrastructure financing gap.9 In an innovative move effective at the beginning of 2017 to secure financing capacity, it merged its ordinary capital resources (the main window to borrow from capital markets and lend with a certain spread) and concessional lending from the Asian Development Fund (which will continue to provide grants to low-income developing member countries). The merger will increase annual loan and grant approvals by over 50% to more than $20 billion by 2020. This balance sheet optimization based on existing capital contributions from shareholders and donors presents a useful example to other MDBs. C. Latest Developments in Infrastructure Financing Modalities in Asia 71. Using recent ADB experience, this subsection looks at the latest developments in infrastructure financing modalities in Asia through brief case studies. Case 1: Partnering with financial intermediaries for wholesale lending 72. ADB has been at the forefront of catalyzing PPPs in infrastructure development in India by partnering with the India Infrastructure Finance Company Limited (IIFCL) to leverage private funds. The Government of India set up IIFCL in 2006 to provide long-term debt for commercially viable infrastructure projects, giving priority to PPP projects. However, IIFCL cannot take any exposure exceeding 20% of total capital costs in a subproject. In this case, the lending rate is decided by the commercial lending market as the loan is provided by IIFCL as part of the syndicate loan, and ADB’s AAA rating does not directly reflect on the lending rate. By 2011, ADB–IIFCL had already funded 30 projects, and was expected to fund over 60 PPP projects in total and mobilize over $24 billion from the market.
9 MDBs should become more innovative and dramatically enhance their efforts to mobilize resources from the private sector,
says ADB President Takehiko Nakao (Source: Eco-Business. 11 Dec 2017. How MDBs can unlock Private Finance for Development. [News Release]. Retrieved from http://www.eco-business.com/opinion/how-mdbs-can-unlock-private -finance-for-development/ ).

20 ADB South Asia Working Paper Series No. 57
Figure 9: Partnering with Financing Intermediaries for Wholesale Lending
ADB = Asian Development Bank, ICICI Bank = Industrial Credit and Investment Corporation of India; IDBI Bank = Industrial Development Bank of India, IIFCL = India Infrastructure Finance Company Limited, GSec = Government Security, OCR = Ordinary Capital Resources, p.a. = per annum. Notes: Ordinary capital resource lending rate is 1.6%. Currently 3-year Gsec rate in India is around 6.4% and effective interest rate is around 7.7% (IMF Article 4). Source: Asian Development Bank project data.
Case 2: Partnering with financial intermediaries to develop the bond market 73. ADB also partnered with IIFCL to provide partial credit guarantees to raise the ratings of project bonds to attract private investment.10 IIFCL raises funds from domestic and overseas markets under sovereign guarantees, and these funds then provide long-term debt to PPP special purpose vehicles.
Figure 10: Partnering with Financing Intermediaries to Develop the Bond Market
ADB = Asian Development Bank, IIFCL = India Infrastructure Finance Company Limited, RPVPL = ReNew Power Ventures Private Ltd. Source: Asian Development Bank project data.
10 Roy, A. 2015. Innovative Financing: The Case of India Infrastructure Company. World Bank blog. Retrieved from:
http://blogs.worldbank.org/ppps/innovative-financing-case-india-infrastructure-finance-company.
ADB
FinancingIntermediary
OCR lending$1.9 billion
Subloan: Delhi International Airport(India, 2007, Rs2.8 billion)Tenor: 17 yearsRate: 10.5% p.a.10-year GSec rate: 6.6%Lead Commercial Bank: ICICI Bank
Subloan: Mumbai International Airport(India, 2007, Rs2.8 billion)Tenor: 17 yearsRate: 3-year Gsec + 2.15%10-year GSec rate: 6.6%Lead Commercial Bank: IDBI Bank
Syndicate loanADB–IIFCL: 20%
Commercial banks: 80%
IIFCL Project (specialpurpose vehicle)
ADB
RPVPL project bond (India, 2015, Rs4.5 billion)Tenor: 17.5 yearsGuarantee fee: 1.2%Bond interest rate: 1.5% below market rate
Partial creditguarantee
ProjectBonds
Project bondissuance
IIFCL
Project (specialpurpose vehicle)

Closing the Financing Gap in Asian Infrastructure 21
74. IIFCL provides the partial credit guarantee to project bonds, while ADB would risk share up to 50% of IIFCL’s underlying exposure. For instance, ADB and IIFCL have jointly guaranteed a $68 million project bond for ReNew Power Ventures Private Ltd., an independent power producer, for wind energy-related investment. IIFCL guaranteed a maximum of 28% of the bond, raising the credit rating of the bond to AA+, subject to IIFCL payment of a guarantee fee to the government, which is equivalent to 1.2% of the total lending value. Case 3: Developing local currency bond markets 75. MDBs can also provide direct guarantees to projects for issuing local currency bonds. For instance, the Tiwi–Makban Climate Bond is the first project bond ever issued in local currency in the power sector in the Philippines and will fund investment in geothermal power plants. ADB provided credit enhancement through a guarantee of 75% of principal and interest on the bond.
Figure 11: Developing Local Currency Bond Market
ADB = Asian Development Bank. Source: Asian Development Bank.
D. Caveat of New Initiatives for Infrastructure Financing 76. When infrastructure investment is assessed for its bankability, this could imply that investor needs are prioritized over social outcomes when the provision of public service is reorganized to accommodate the imperative of generating competitive returns for private investors (O’Neill 2013). The public good becomes “subordinate to the imperative of designing a commercially viable contract” (Fine and Hall 2012, 58). Infrastructure’s noncommercial outcomes or purposes are marginalized, with access regulated by capacity to pay, and multiple purposes that could otherwise attach to infrastructure are reduced to guaranteeing profitability for investors. 77. The significant use of private investment for financing infrastructure (and the need to generate revenue streams), and therefore the need to attract it, may determine both the location and design of projects. The public sector would lose the ability to cross-subsidize commercially less attractive investments.
Guarantor
Partial creditguarantee
Project bondissuance
Tiwi–Makban Climate Bond(Philippines, 2016, �10.7 billion)Tenor: 17 yearsGuarantee: Up to 75% of principal and interestGuarantee fee: Paid by project company at market rateBond interest rate: Confidential
Project (specialpurpose vehicle)
Project Bonds
ADB

22 ADB South Asia Working Paper Series No. 57
78. The transformation of infrastructure into an asset class that is traded internationally produces tendencies toward standardization of PPP processes. This includes those standards bearing on contracts and the regulatory environment to suit investor needs rather than to reflect local specificities. For example, the proposal of the United Nations Economic Commission for Europe for a PPP standard for health care policy has no specific features drawing on the health sector as opposed to those for instance power or transport (Bayliss and Van Waeyenberge 2017). The specific sector becomes incidental to the broader purpose of generating revenue streams for financial investors. 79. While PPPs raise private finance for infrastructure, their ability to do so critically depends on the policies and the creditworthiness of the public sector. Increasing the involvement of the private sector in infrastructure provision in developing countries necessitates strong institutions to attract investors to implement PPPs and to regulate the private sector. Evidence suggests that countries with high public investment attract strong private investment, while countries with low public investment attract little private investment (Calderón and Servén 2009). 80. Compared with public procurement, PPPs place significant demand on the state at all stages, from preproject preparation to contract negotiation and management, and complexities multiply alongside project scale (Romero 2015, IEG 2014). IEG (2014) finds that upstream donor support that seeks to address weak state capacity in the context of PPPs, “failed in almost half of the cases because of the complexity and political implications of the reform processes.” 81. The cost of capital of PPPs relative to public funding, and assumption of risk, has proved to be significantly higher than initially estimated (IMF 2016). Fiscal risks on PPPs are considered higher than in budget financing. Private financing costs are typically higher, as governments can borrow more cheaply than the private sector. PPPs also involve large deal and consultancy fees. Engel, Fischer, and Galetovic (2010, 17) present evidence that costs incurred for legal, technical, and financial advice can reach 10% of the total cost of the project. Costs can escalate because of contract renegotiations, the incidence of which has been high (Guasch et al. 2014, p. 22). Costs are increased by government guarantees and various forms of subsidies to PPP investors (contingent liabilities) (Bova et al. 2016). As the result of these constraints, even in economies that make strong use of them, PPPs typically make up only about 5%–10% of overall investment in economic infrastructure (McKinsey Global Institute 2016, p.19)
V. CONCLUSION 82. Asia needs a huge investment in infrastructure to sustain the growth momentum that had built up over several decades. but the region is still falling short in this area. Of an estimated need for investment of $1.34 trillion a year for 2016–2020 in physical infrastructure, Asia’s developing countries invest about $881 billion. 83. Investment in social infrastructure in the region is likewise lacking. Using United Nations data for education and World Health Organization data for health in estimating needed spending in these two sectors, the gap with actual spending is estimated at around $448 billion. 84. Observers have puzzled for many years over why Asia, with the world’s highest domestic savings rates and massive foreign reserves, has been unable to close the infrastructure investment gap by tapping this obviously massive pool of liquidity. Private sector institutional investor interest in infrastructure assets in Asia (such as from pension funds) has also been disappointing.

Closing the Financing Gap in Asian Infrastructure 23
85. In 2006, economist Lawrence Summers suggested that a “global capital flows paradox” may explain the investment shortfalls in the developing world. He pinpointed three factors, including a huge outflow of capital from emerging markets into industrialized countries, the massive buildup of foreign reserves in emerging economies, and the expected negative returns on those foreign reserves (Summers 2006). 86. The apparent conundrum is embodied in Asia in, among other things, the region’s portfolio investment of $6.2 trillion outside of Asia, yet investment from outside the region into Asia of just $3.2 trillion. 87. Among this paper’s conclusions is that addressing this issue can lead to a fundamental solution for the infrastructure investment gap. The study pinpoints several major reasons for the shortage of investment. Among these is an environment inconducive to intraregional investment, with cross-border investment rules and regulations in place that often curtail funding infrastructure projects. This is true even in the developed countries, such as Japan and the Republic of Korea, with their developed financial markets and ample funds for investment. 88. Another reason is the lack of innovative financing products that hinders private investment from the developed economies within Asia, with “infrastructure” not even deemed a distinct “asset class” as it is elsewhere. Potential investors are hindered by the scarcity of “suitable” potential investments in the region. Asian authorities do not have the supportive policy and project-structuring capacity to generate bankable projects for investment, that is, for commercially viable projects that meet the stringent requirements of the major sources of investment capital. 89. This study argues further that it is not for a lack of viable projects that project pipelines in Asia are limited, but rather, because governments do not have the capacity, experience, or understanding of the private sector needed to prepare investment-ready projects. 90. Other important factors include that this inconducive investment environment in Asia may lead investors to associate infrastructure projects in the region with a higher credit risk. 91. Although long-term investors are relatively better placed for investing in longer-term global infrastructure assets, these have not yet fulfilled the hope that they will invest sufficient funds to close the infrastructure financing gap. This is because pension funds in Asia remain much smaller than those in developed economies outside of Asia, and because these Asian funds are invested in the industrialized countries, among other things. 92. To overcome the paradox at the heart of this study, Asia needs to address these major barriers to infrastructure development: the weak pipeline of viable projects, the perception that its investments entail higher risk, the constraints on institutional investment, and poor definition of infrastructure as an asset class.

REFERENCES Asian Development Bank (ADB). 2017a. Meeting Asia’s Infrastructure Needs. Manila: ADB. ————. 2017b. Asian Development Outlook 2017 Update. Asian Development Bank, Manila. ADB and ADB Institute. 2009. Infrastructure for a Seamless Asia. Tokyo: Asian Development Bank
Institute and Asian Development Bank. Bayliss, K., and E. V. Waeyenberge. 2017. Unpacking the Public–Private Partnership Revival. Journal of
Development Studies. 54:4. pp. 577–593. Beckers, F., and U. Stegemann. 2013. A Risk Management Approach to a Successful Infrastructure
Project. Mckinsey&Company, Capital Projects & Infrastructure. https://www.mckinsey .com/industries/capital-projects-and-infrastructure/our-insights/a-risk-management-approach-to-a-successful-infrastructure-project.
Bhattacharyay, B. N. 2012. Modes of Asian Financial Integration: Financing Infrastructure. In B. N.
Bhattacharyay, M. Kawai, R. M. Nag, eds. Infrastructure for Asian Connectivity. ADB and Edward Elgar Pubishing. https://www.adb.org/sites/default/files/publication/159325/adbi-infra-asian -connectivity.pdf.
Blanc-Brude, F., R. Delacroce, C. Mandri-Perrot, J. Schwartz, and T. Whittaker. 2016. Data Collection for
Infrastructure Investment Banking. EDHEC Infrastructure Institute: Singapore. BlackRock. 2014. Dealing with Divergence: 2015 Investment Outlook. Available at: https://www
.blackrock.com/corporate/en-au/literature/whitepaper/bii-2015-investment-outlook-us.pdf. ————. 2015. Infrastructure Investment: Bridging the Gap Between Public and Investor Needs. Available at:
https://www.blackrock.com/corporate/en-lu/literature/whitepaper/viewpoint-infrastructure -investment-november-2015.pdf
Bova, E., M. Ruiz-Arranz, F. Tascani, and E. Ture. 2016. The Fiscal Costs of Contingent Liabilities: A New
Dataset. IMF Working Paper No. 16/14. Washington, DC: IMF. Calderón, C., and L. Servén. 2009. Infrastructure in Latin America: An Update, 1980–2006. Washington,
DC: World Bank. Unpublished. Dewatripont, M., and P. Legros. 2005. Public–Private Partnerships: Contract Design and Risk Transfer.
EIB Papers. 5/2005. European Investment Bank, Economics Department. Eco-Business. 2017. How MDBs Can Unlock Private Finance for Development. News Release. 11 Dec.
Retrieved from http://www.eco-business.com/opinion/how-mdbs-can-unlock-private-finance -for-development/.
Engel, E., R. Fischer, and A. Galetovic. 2010. The Economics of Infrastructure Finance: Public–Private
Partnerships Versus Private Provision. Documentos de Trabajo. No. 276. Centro de Economia Aplicada. Universidad de Chile.

26 References
Fine, B., and D. Hall. 2012. Terrains of Neoliberalism: Constraints and Opportunities for Alternative Models of Service Delivery. In D. McDonald and G. Ruiters, eds. Alternatives to Privatization: Public Options for Essential Services in the Global South. London: Routledge.
Foley, S., and C. Jones. 2016. Quantitative Easing Should Fund Infrastructure, says BlackRock. Financial
Times. http://positivemoney.org/2016/12/quantitative-easing-should-fund-infrastructure-says -blackrock-ft/
G20. 2011. Supporting Infrastructure Development in Low-Income Countries. G20.
http://www.g20dwg.org/documents/pdf/view/13/ Global Infrastructure Facility (GIF). 2016. Making Infrastructure Rewarding. A Report by the Global
Infrastructure Facility. Griffiths, J., M. Martin, J. Pereira, and T. Strawson. 2014. Financing for Development Post-2015 Improving
the Contribution of Private Finance. European Parliament, and Directorate-General for External Policies of the Union. Luxembourg: Publications Office.
Guasch, J. et al. 2014. Renegotiation of PPP Contracts: An Overview of Its Recent Evolution in Latin
America. Discussion Paper. No. 2014-18. International Transport Forum. Paris: Organisation for Economic Co-operation and Development (OECD).
Independent Evaluation Group (IEG). 2014. World Bank Group Support to Public–Private Partnerships:
Lessons from Experience in Client Countries, FY02-12. World Bank Independent Evaluation Group. Washington, DC: World Bank. http://documents.worldbank.org/curated/en/ 405891468334813110/pdf/93629-REVISED-Box394822B-PUBLIC.pdf
Inderst, G. 2016. Infrastructure Investment, Private Finance, and Institutional Investors: Asia from a
Global Perspective. ADBI Working Paper. No. 555. Tokyo: Asian Development Bank Institute. http://www.adb.org/publications/infrastructure-investment-private-finance-and-institutional -investors-asia-global
Inderst, G., and F. Stewart. 2014. Institutional Investment in Infrastructure in Emerging Markets and
Developing Economies. PPIAF Publication. World Bank Group. http://documents.worldbank.org/ curated/en/748551468337163636/Institutional-investment-in-infrastructure-in-emerging -markets-and-developing-economies
International Monetary Fund (IMF). 2015. Coordinated Direct Investment Survey.
http://data.imf.org/CDIS (accessed October 2017). ————. 2015. Making public investment more efficient. Staff Report. Washington, DC: IMF. ————. 2016. Coordinated Portfolio Investment Survey. http://data.imf.org/CPIS (accessed October
2017). ————. 2017. World Economic Outlook Database. https://www.imf.org/external/pubs/ft/weo/2017/02/
weodata/weoselgr.aspx (accessed October 2017). Kaminker, Ch., and F. Stewart. 2012. The Role of Institutional Investors in Financing Clean Energy. OECD
Working Papers on Finance, Insurance and Private Pensions. No. 23. OECD Publishing.

References 27
Martin, M. 2015. Private and Blended Development Cooperation: Assessing their Effectiveness and Impact for Achieving the SDGs. 2016 Development Cooperation Forum Policy Briefs. No. 7.
McKinsey Global Institute. 2016. Bridging Global Infrastructure Gaps. http://www.mckinsey.com/
industries/capital-projects-and-infrastructure/our-insights/bridging-global-infrastructure-gaps (accessed 17 October 2016).
Miyamoto, K., and E. Chifalo. 2015. Official Development Finance for Infrastructure: Support by
Multilateral and Bilateral Development Partners. OECD Development Cooperation Working Paper. No. 25. Paris: OECD.
Miyamoto, K., and K. Biousse. 2014. Official Support for Private Sector Participation in Developing
Country Infrastructure. OECD Development Co-operation Working Papers. No. 19. Paris: OECD. Multilateral Development Banks (MDB) Working Group on Infrastructure. 2011. Infrastructure Action
Plan. http://documents.worldbank.org/curated/en/828751468331900533/pdf/655610BR0 v10Se0Official0Use0Only090.pdf
Mustapha, S., A. Prizzon, M. Gavas. 2014. Topic Guide: Blended Finance for Infrastructure and Low-Carbon
Development. United Kingdom: Evidence on Demand. https://assets.publishing.service.gov.uk/ media/57a089b6e5274a31e0000218/EoD_Topic_Guide_Long_January14_Blending_Finance.pdf
O’Neill, P. 2013. The Financialisation of Infrastructure: The Role of Categorisation and Property
Relations. Cambridge Journal of Regions, Economy and Society. 6. pp. 441–454. Organisation for Economic Co-operation and Development (OECD). 2015. Official Development
Finance for Infrastructure. OECD Report to G20 Finance Ministers and Central Bank Governors IIWG meeting in Berlin and G20 Finance Ministers and Central Bank Governors. Paris: OECD.
————. 2017. Pension Markets in Focus. http://www.oecd.org/pensions/private-pensions/Pension
-Markets-in-Focus-2017.pdf (accessed December 2017). Preqin. 2016. Preqin Investor Outlook: Alternative Assets, H1 2016. http://docs.preqin.com/reports/Preqin
-Investor-Outlook-Alternative-Assets-H1-2016.pdf Rezende, F. 2015. Why Does Brazil’s Banking Sector Need Public Banks? What Should BNDES Do? PSL
Quarterly Review. 68 (274). October. Roberts, M., Patel, J., Minella, G. 2015. Why Invest in Infrastructure?. Research Report. Deutsche Asset
and Wealth Management. http://infrastructure.dws.com/content/_media/Research_Deutsche _AWM_Why_Invest_in_Infrastructure_May_2015.pdf
Romero, M-J. 2015. What Lies Beneath? A Critical Assessment of PPPs and their Impact on Sustainable
Development. Brussels: European Network on Debt and Development. http://www.eurodad.org/ whatliesbeneath

28 References
Roy, A. 2015. Innovative Financing: The Case of India Infrastructure Company. World Bank blog. Retrieved from: http://blogs.worldbank.org/ppps/innovative-financing-case-india-infrastructure-finance -company.
Russ, D., Y. Thambiah, and N. Foscari. 2010. Can Infrastructure Investing Enhance Portfolio Efficiency?
White Paper. London, UK: Credit Suisse Asset Management (CSAM). Singh, K. 2010. Legal and Policy Framework for Financing Basic Education. 2010. Paper presented at the
UNESCO Future Seminar on Innovative Financing for Education. http://www.ohchr.org/ Documents/Issues/Education/SeminaInnovativeFinancingEducation.pdf (accessed October 2017).
Studart, R., K. P. Gallagher, and A. Bhattacharya. “Infrastructure for Sustainable Development: The Role
of National Development Banks. Unpublished. Summers, L.H. 2006. “Reflections on Global Account Imbalances and Emerging Markets Reserve
Accumulations.” L.K. Jha Memorial Lecture. Reserve Bank of India. United Nations Educational, Scientific, and Cultural Organization (UNESCO) Institute for Statistics.
http://uis.unesco.org/ (accessed October 2017). United States Department of Treasury. 2016. Major Foreign Holders of Treasury Securities.
http://ticdata.treasury.gov/Publish/mfh.txt. (accessed October 2017). World Bank. Private Participation in Infrastructure Database. https://ppi.worldbank.org/ (accessed
September 2017). ————. World Development Indicators. http://data.worldbank.org/indicator (accessed October 2017). World Health Organization. Global Health Expenditure database. http://www.who.int/health
-accounts/ghed/en/ (accessed October 2017). ————. 2010. Health Systems Financing: The Path to Universal Coverage. World Health Report. Geneva.

ASIAN DEVELOPMENT BANK6 ADB Avenue, Mandaluyong City1550 Metro Manila, Philippineswww.adb.org
Closing the Financing Gap in Asian Infrastructure
Infrastructure investment in Asia, both in economic and social infrastructure, faces a massive financing gap despite the region’s high savings. The cause of this gap is a capital flow paradox in which Asia’s outflow of portfolio funds far exceeds the inflow. To change this, three areas must be improved: innovative measures to mitigate constraints, preparation of bankable projects, and mitigation of risks. This study provides an overview of key issues in filling infrastructure financing gaps in Asia, and presents examples from actual investment projects to illustrate latest developments addressing some fundamental constraints.
About the Asian Development Bank
ADB’s vision is an Asia and Pacific region free of poverty. Its mission is to help its developing member countries reduce poverty and improve the quality of life of their people. Despite the region’s many successes, it remains home to a large share of the world’s poor. ADB is committed to reducing poverty through inclusive economic growth, environmentally sustainable growth, and regional integration.
Based in Manila, ADB is owned by 67 members, including 48 from the region. Its main instruments for helping its developing member countries are policy dialogue, loans, equity investments, guarantees, grants, and technical assistance.