
Madhavan 2015. Innovation Systems and Increasing Reformulation ...

Design and Early Validation (using FPGA) of Temperature
Resilient Clock Distribution Networks for 3D ICs
Sung Joo Park and Madhavan Swaminathan
Interconnect and Packaging Center
Georgia Institute of Technology, Atlanta, GA
[email protected], [email protected]
Nitish Natu,
Physical Design Team
Oracle, Santa Clara, CA
nitish.natu @oracle.com
Byunghyun Lee, Sang Min Lee, Woong Hwan Ryu, and Kee Sup Kim
System LSI Business, Device Solutions
Samsung Electronics Co., Ltd, Yongin, Korea
{byhy.lee, sm69.lee, woong.h.ryu, kee.sup.kim}@samsung.com
Abstract— Clock Distribution Networks (CDN) in three
dimensional ICs face problems due to temperature and gradients
observed across the die. The propagation delay of paths in the
CDN varies and leads to mismatch in skew at the distribution
points. This could potentially harm the system by violating setup
and hold timing constraints. Compensation techniques can
however be integrated with the CDN to compensate for the
effects due to thermal gradients. Two such techniques called
adaptive supply voltage and controllable path delay were
implemented and are presented in this paper. An FPGA-based
test vehicle was used to validate these techniques. Finally the
overhead of area and power is analyzed and the performance
improvement is observed.
Keywords-3D IC, TSV (Throung Silicon Via), Temperature
gradient, CDN (Clock Distribution Network), Propagation Delay.
I. INTRODUCTION
State-of-the art integrated circuits contain more than a
billion transistors on a single die. Most of the advancement is
achieved by technology scaling but it comes with its share of
drawbacks including process variability, increased leakage
currents and lithography limitations. Progress in chip
packaging is regarded as reinforcement to technology scaling
in an attempt to keep up with Moore’s law [1].
A newly introduced technique using Through-Silicon-Vias
(TSVs) enables vertical stacking of ICs with advantages of
small form factor and reduced production cost. However, the
largest concern has been heat management in these 3D
structures. The architecture creates thermal gradients that vary
during operation of the system [2].
Synchronous digital systems thrive on the reliability of the
clock distribution networks as they translate to integrity of the
data paths. The clock distribution network (CDN) has some of
the largest fanouts and longest distances. A higher frequency
of operation makes the clock signals are crucial and largely
sensitive to temperature variations across the chip [3, 4].
Die 2
CDN
Die 1
Voltage
Regulator
Clock
Generator
Interposer
PCB
Heat Sink
TSV
Thermal
Interface
MaterialFan
Clock Distribution
Fan
(b)(a) Figure 1. (a) 3D system configuration and (b) Temperature profile [5].
This paper assumes a 3D structure in which an interposer
is mounted on a PCB. Three dies are stacked on top of the
interposer followed by the heat sink. The clock distribution
network resides in the sandwiched die while the top and
bottom dies show any digital or mixed signal logic. The
configuration is shown in Figure 1 [5].
Thermal analysis of the structure provides the temperature
maps. These are converted into a grid and the individual
values are superimposed on the electrical characterization
simulations to obtain the delay profile along the CDN. The
thermal profile of the center die (CDN) was analyzed by
changing the power distribution across all three dies. The
profile with a high gradients chosen from electro-thermal
simulation cases represents the worst case and was
superimposed on the electrical characteristics of the CDN.
Clock waveform at loads observed is shown in Figure 2.
Additional delay and skew caused by temperature gradient is
clearly visible in the graph [5]. In this paper, we expand
compensation techniques shown in [5] to overcome
temperature effects, and show early validation with a
prototype using an FPGA based test vehicle.
(a) (b)
0.2 0.4 0.6 0.8 1.0 1.2 1.4 1.6 1.80.0 2.0
0.0
0.2
0.4
0.6
0.8
1.0
1.2
-0.2
1.4
time, nsec
Fro
ntP
anel_
eye(S
1_00,1
e9)
Fro
ntP
anel_
eye(S
1_04,1
e9)
Fro
ntP
anel_
eye(S
1_05,1
e9)
Fro
ntP
anel_
eye(S
1_09,1
e9)
Fro
ntP
anel_
eye(S
1_40,1
e9)
Fro
ntP
anel_
eye(S
1_44,1
e9)
Fro
ntP
anel_
eye(S
1_45,1
e9)
Fro
ntP
anel_
eye(S
1_49,1
e9)
Fro
ntP
anel_
eye(S
1_50,1
e9)
Fro
ntP
anel_
eye(S
1_54,1
e9)
Fro
ntP
anel_
eye(S
1_55,1
e9)
Fro
ntP
anel_
eye(S
1_59,1
e9)
Fro
ntP
anel_
eye(S
1_90,1
e9)
Fro
ntP
anel_
eye(S
1_94,1
e9)
Fro
ntP
anel_
eye(S
1_95,1
e9)
Fro
ntP
anel_
eye(S
1_99,1
e9)
Fro
ntP
anel_
eye(V
RE
F,1
e9)
50 ps 195 ps
Time [ns] Time [ns]
Vo
lta
ge
[V
]
Figure 2. Timing simulation results showing temperature gradient effect in a
3D IC. (a) Without and (b) With temperature gradient [5].
This paper is organized as follows. The compensation techniques used to overcome the problem of variation in propagation delay and skew due to temperature are described in Section II. The details of an FPGA-based test vehicle are given in Section III. This section also demonstrates the implementation scheme for the compensation techniques using an FPGA. Section IV shows the tests that were used to validate the compensation techniques and their results followed by conclusion in Section V.
II. SOLUTIONS
The variations in delay caused by thermal gradients can be
compensated by adjusting different parameters of the buffer.
Two methods incorporating this fundamental principle are
shown here. The first is called Adaptive Supply Voltage
scaling and the second is termed as Controllable Path Delay.
These methods have been expanded here as compared to [5].
A. Adaptive Supply Voltage
The adaptive voltage approach is based on the fact that the
mobility and in turn the threshold voltage of an buffer is
127978-1-4799-3643-4/14/$31.00 ©2014 IEEE
affected by the temperature gradient across it. The other
controls of these parameters include bias voltages and VDD.
This requirement of temperature sensors and level converters
hampers the ability to scale the design which is critical. It can
be achieved by modifying [6]. The changes include the
introduction of a feedback network and use of an error
amplifier.
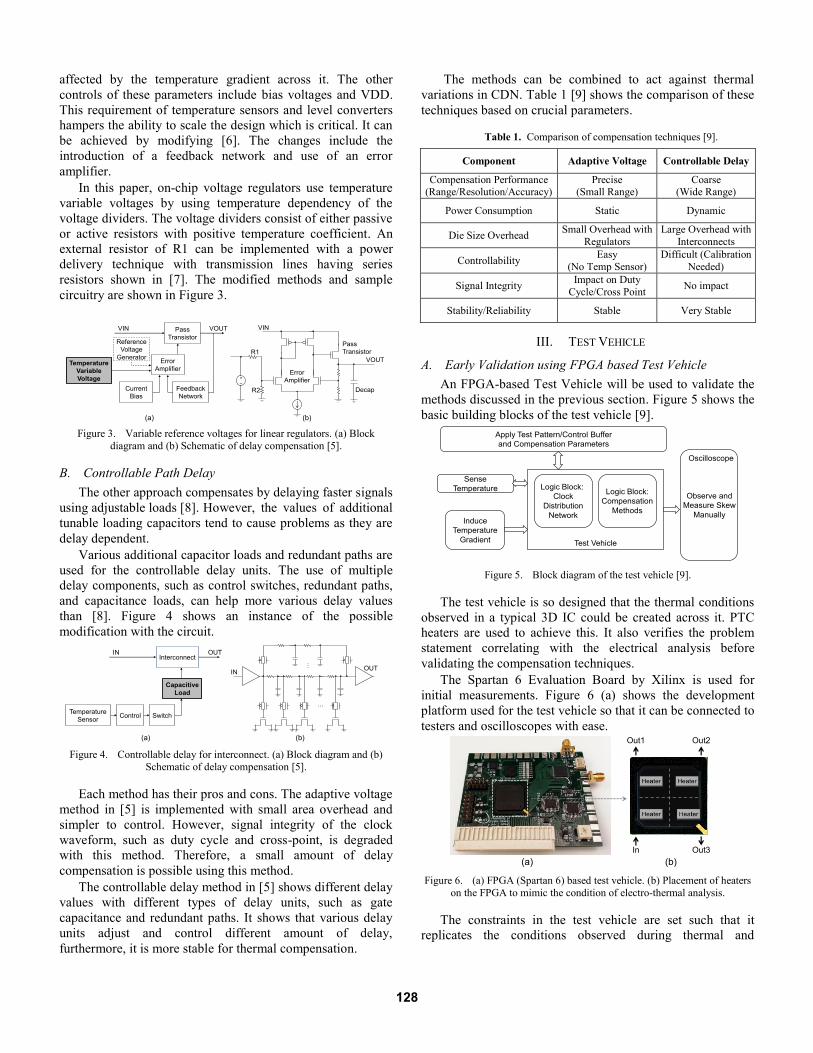
In this paper, on-chip voltage regulators use temperature
variable voltages by using temperature dependency of the
voltage dividers. The voltage dividers consist of either passive
or active resistors with positive temperature coefficient. An
external resistor of R1 can be implemented with a power
delivery technique with transmission lines having series
resistors shown in [7]. The modified methods and sample
circuitry are shown in Figure 3.
(b)
Error
Amplifier
Feedback
Network
Current
Bias
Pass
TransistorReference
Voltage
Generator
VIN VOUT
Temperature
Variable
Voltage
VIN
VOUT
Decap
Error
Amplifier
Pass
TransistorR1
R2
+
–
(a) Figure 3. Variable reference voltages for linear regulators. (a) Block
diagram and (b) Schematic of delay compensation [5].
B. Controllable Path Delay
The other approach compensates by delaying faster signals
using adjustable loads [8]. However, the values of additional
tunable loading capacitors tend to cause problems as they are
delay dependent.
Various additional capacitor loads and redundant paths are
used for the controllable delay units. The use of multiple
delay components, such as control switches, redundant paths,
and capacitance loads, can help more various delay values
than [8]. Figure 4 shows an instance of the possible
modification with the circuit.
(b)(a)
Capacitive
Load
InterconnectIN OUT
ControlTemperature
SensorSwitch
…
…
INOUT
Figure 4. Controllable delay for interconnect. (a) Block diagram and (b)
Schematic of delay compensation [5].
Each method has their pros and cons. The adaptive voltage
method in [5] is implemented with small area overhead and
simpler to control. However, signal integrity of the clock
waveform, such as duty cycle and cross-point, is degraded
with this method. Therefore, a small amount of delay
compensation is possible using this method.
The controllable delay method in [5] shows different delay
values with different types of delay units, such as gate
capacitance and redundant paths. It shows that various delay
units adjust and control different amount of delay,
furthermore, it is more stable for thermal compensation.
The methods can be combined to act against thermal
variations in CDN. Table 1 [9] shows the comparison of these
techniques based on crucial parameters.
Table 1. Comparison of compensation techniques [9].
Component Adaptive Voltage Controllable Delay
Compensation Performance (Range/Resolution/Accuracy)
Precise (Small Range)
Coarse (Wide Range)
Power Consumption Static Dynamic
Die Size Overhead Small Overhead with
Regulators
Large Overhead with
Interconnects
Controllability Easy
(No Temp Sensor)
Difficult (Calibration
Needed)
Signal Integrity Impact on Duty
Cycle/Cross Point No impact
Stability/Reliability Stable Very Stable
III. TEST VEHICLE
A. Early Validation using FPGA based Test Vehicle
An FPGA-based Test Vehicle will be used to validate the
methods discussed in the previous section. Figure 5 shows the
basic building blocks of the test vehicle [9].
Test Vehicle
Logic Block:
Clock
Distribution
Network
Logic Block:
Compensation
Methods
Induce
Temperature
Gradient
Sense
TemperatureObserve and
Measure Skew
Manually
Apply Test Pattern/Control Buffer
and Compensation Parameters
Oscilloscope
Figure 5. Block diagram of the test vehicle [9].
The test vehicle is so designed that the thermal conditions
observed in a typical 3D IC could be created across it. PTC
heaters are used to achieve this. It also verifies the problem
statement correlating with the electrical analysis before
validating the compensation techniques.
The Spartan 6 Evaluation Board by Xilinx is used for
initial measurements. Figure 6 (a) shows the development
platform used for the test vehicle so that it can be connected to
testers and oscilloscopes with ease.
(b)(a)
In
Out1
Out3
Out2
Figure 6. (a) FPGA (Spartan 6) based test vehicle. (b) Placement of heaters
on the FPGA to mimic the condition of electro-thermal analysis.
The constraints in the test vehicle are set such that it
replicates the conditions observed during thermal and
128

electrical analysis.. The Spartan 6 FPGA is built on the 45nm
technology node and used temperature range of between 85˚C
and 125˚C. The artificial temperature gradients are created
using 4 external PTC heaters due to the size, as shown in
Figure 6 (b).
The CDN is coded in Verilog on the Xilinx ISE Design
Suite. The Plan Ahead tool is then used to ensure that the
CDN has been implemented in the form of H-Tree
architecture. The iSim waveform analyzer is used to verify
the design. The delays were modeled using ‘#delay’
statements and had direct temperature dependence.
B. Implementation of Compensation Techniques
The scheme to implement Adaptive Voltage method
essentially changes the VDD of the in-path buffers. The
buffers were built using switch modeling in Verilog so that an
external port can feed supply voltages to them as shown in
Figure 7 (a). The voltages on this IO port are changed in order
to speed up the buffers [9].
(a) (b)
Path Control
Chain of D-Flipflops
Source Buffer
Destination Buffer
Demux
Delay
Control
Internal FPGA Logic
IO Ports acting as Supply
Voltage Ports
Clock Generator
CLKin VCCin
Power Line
I/O Ports
Figure 7. Implementation schemes for compensation techniques with (a)
Adaptive supply voltage and (b) Controllable path delay [8].
Figure 7 (b) shows the implementation scheme for the
Controllable Path Delay technique. The control unit selects
the no. of D flip-flops to be connected between source and
destination buffers thus varying the delay along the path.
The combination of techniques called for an algorithm to
exercise control on the amplitudes of their usage. It starts by
getting temperature across the CDN which translates to
fetching of data from the memory of the FPGA in the test
vehicle. The data represents the predefined temperature maps
which in turn give the delays across various paths. The
algorithm will compare the delays to a threshold, determine
whether a correction is needed and if so, select the correct
compensation technique to go ahead with.
The RTL code for the test vehicle contained the primary
CDN with modifications to accommodate the corrective
techniques and a control unit which represented the
implementation of the algorithm.
IV. VALIDATION
A. Measurement Results
The PTC heaters are controlled by changing their supply
voltages to create the required thermal gradient. The results of
the experiment are shown in Figure 8. Figure 8 (a) shows that
the linear relationship between delay and temperature remains
regardless of the source and distribution points which change
across the floorplan of the FPGA and corresponds to results of
the electrical analysis.
The adjustment of supply voltage compensates for the
propagation delay resulting for the temperature rise. The
improvement in thermal response of the propagation delay can
be seen in Figure 8 (b).
(b)(a)
4.6
4.8
5
5.2
5.4
5.6
80 90 100 110 120 130
Pro
pa
ga
tio
n D
ela
y (
ns)
Temperature (˚C)
Out1
Out2
Out3
4.6
4.8
5
5.2
5.4
5.6
80 90 100 110 120 130
Pro
pa
ga
tio
n D
ela
y (
ns
)
Temperature (˚C)
Out1
Out2
Out3
Figure 8. (a) Variation in delay by temperature at various distribution points
and (b) Improved thermal response due to the adaptive voltage technique.
Figure 8 (a) shows a deterioration of delay as temperature
rises without the presence of any compensation techniques.
Alternatively, Figure 8 (b) gives a better response as the slope
of increase in the delay is reduced significantly due to
Adaptive Voltage technique. A conclusion that the adaptive
voltage technique can improve the response of propagation
delay against temperature can be drawn from the figure above.
A performance improvement of 63%, based on the
propagation delays measured before and after the application
of the technique, was observed.
0
20
40
60
80
100
120
140
3.5
4
4.5
5
5.5
6
6.5
7
0 200 400 600 800 1000 1200
Te
mp
era
ture
(˚C
)
Pro
pa
ga
tio
n D
ela
y (
ns
)
Time (sec)
Out1 Out2 Out3 Temp
Figure 9. Real time compensation test with the adaptive voltage technique.
A more practical test case was applied by changing the
temperature in real time in a random fashion. This was
accomplished by loading the preset values of temperature at
predetermined time steps into the control unit. The time steps
are at irregular intervals due to the heating time which is
largely governed by the PTC heaters. Figure 9 shows the
results for various IO configurations shown in Figure 7.
Time and temperature are swept while measuring the
propagation delay. As seen in the figure, the deviation of
propagation delay is reduced to 200ps as against a 600-650ps
deviation observed without the adaptive voltage technique
thus marking resilience to temperature.
129

The controller is made aware of the current temperature
value slightly after the change takes place accounting for
delay calculation in actual implementation. The original
response for this test case can be seen in Figure 10 (a) where
the skews are to the order of 1.2-1.8ns. The compensation
techniques improve the performance bringing down skews to
about 400ps as seen in Figure 10 (b).
(b)(a)
2
2.5
3
3.5
4
4.5
5
80 90 100 110 120 130
Pro
pa
ga
tio
n D
ela
y (
ns
)
Temperature (˚C)
Out1
Out2
Out3
2
2.5
3
3.5
4
4.5
5
80 90 100 110 120 130
Pro
pa
ga
tio
n D
ela
y (
ns
)
Temperature (˚C)
Out1
Out2
Out3
Figure 10. (a) Variation in delay by temperature (b) Compensation using
controllable delay.
The skew is stable across the CDN as can be seen in
Figure 11. The temperature sweeps cease to affect the skews
as the compensation techniques come in place. Interconnects
still inherit some skew which varies by length and thus the
skew values do not approach an absolute zero.
0
20
40
60
80
100
120
140
0
1
2
3
4
5
6
7
0 200 400 600 800 1000 1200
Te
mp
era
ture
(˚C
)
Pro
pa
ga
tio
n D
ela
y (
ns
)
Time (sec)
Out1 Out2 Out3 Temp
Figure 11. Real time compensation test with the controllable delay technique.
B. Analysis
The performance improvement observed due to
implementation of the compensation techniques show a
decrease from 6.8 ns to 2.9 ns, a 57 % improvement. It also
causes a degradation in power and area. The increased
immunity against temperature through the compensation
techniques come at the cost of these overheads. The control
unit and algorithm implementation contribute towards die
space and consume power while they are active.
The circuitry of the control unit is the primary reason for
increase in area. In the test vehicle, this translates to about 5%
additional area usage post-synthesis. The modifications
required in the buffer structure might also contribute to this.
The change is amplified in the test vehicle due to lack of
customization ability of the FPGA.
Variation in the supply voltage will has a near non-
negligible effect on the total power consumption of the
system. The controllable delay method encourages charge
sharing and the variation in bias voltage might lead to an
increase in leakage power. Distribution of power in the test
vehicle is estimated with the PowerPC estimator tool. Total
power increased from 0.8W to 1.3W. However, the power
overhead can be much smaller when the concepts are
implemented and optimized on a customized chip.
V. CONCLUSION
This paper attempts to compensate for the effects and
performance degradation in CDN that is inevitable in presence
of thermal gradients. It does so using active compensation
techniques termed as adaptive supply voltage and controllable
path delay. An FPGA-based test vehicle is used to
demonstrate the problem statement by creating artificial
thermal gradients and in turn observing their effect on the
implemented CDN. It also validates the effectiveness of
compensation methods to counter the effects of thermal
gradients. Test results show that the clock skew decreases
from 6.8ns to about 2.9ns, marking a correlation between
simulations and the measurements. Furthermore, degradation
in power and area due to the added hardware is justified
against the performance improvements observed. An IC
customized for implementation of the compensation
techniques is in works. It is designed to minimize the
overheads while maintaining immunity towards temperature.
ACKNOWLDEGEMENT
This work was sponsored by Samsung Electronics Co., Ltd.
REFERENCES
[1] S. Borkar et al., “Parameter variations and impact on circuits and microarchitecture,” Proc. of DAC, vol. 64, pp. 338-342, 2003.
[2] M. Swaminathan and K. J. Han, “Design and modeling for 3D ICs and interposers,” World Scientific Publishing Co., 2013.
[3] J. Xie and M. Swaminathan, “Electrical-thermal co-simulation of 3D integrated systems with micro-fluidic cooling and Joule heating effects,” IEEE Trans. on CPMT, vol. 1, no. 2, pp. 234-246, 2011.
[4] E. G. Friedman, “Clock distribution networks in synchronous digital integrated circuits,” Proc. of the IEEE, vol. 89, no. 5, pp. 665-692, 2001.
[5] S. J. Park et al., “Timing analysis for thermally robust clock distribution network design for 3D ICs,” in Proc. IEEE 22nd Conf. of EPEPS, 2013.
[6] K. Shakeri and J. D. Meindl, “Temperature variable supply voltage for power reduction,” in Proc. of ISVLSI, pp. 1-4, 2002.
[7] S. K. Kim et al., “Implementation of Power Transmission Lines for Field Programmable Gate Arrays for Managing Signal and Power Integrity,” International Symposium on EMC, 2013.
[8] A. Chakraborty et al., “Dynamic thermal clock skew compensation using tunable delay buffers,” IEEE Trans. on VLSI Systems, vol. 16, no. 6, pp. 639-649, 2008.
[9] N. Natu, “Design and prototyping of temperature resilient clock distribution networks,” M.S. thesis, Dept. Elect. Eng., Georgia Institute of Technology, Atlanta, GA, 2014.
130


![MidFrequencyDecoupling Using Embedded DecouplingCapacitors ...epsilon.ece.gatech.edu/publications/2005/01563756.pdf · [9] Prathap Muthana et al,"Design, Modeling and Characterization](https://static.fdocuments.in/doc/165x107/5f5b05ec9d76b50f12145208/midfrequencydecoupling-using-embedded-decouplingcapacitors-9-prathap-muthana.jpg)


