Sunflower english february 2015
27
1
-
Upload
sunfloweril -
Category
Business
-
view
1.932 -
download
1
Transcript of Sunflower english february 2015
1
DisclaimerThis presentation is made for convenience purposes only and is not designed to obviate the need to inspect the reports publicly released by Sunflower
presentation of the future information and the said explanations should not be deemed as a promise and/or guarantee of the company’s future performance Thethe reports publicly released by Sunflower
Sustainable Investments Ltd., including the financial statements. Certain information as presented in the presentation includes declarations
the company s future performance. The Company’s actual performance may materially differ from the future information provided by the Company in good faith The aforesaid does notpresentation includes declarations,
statements of opinion, expectations, assessments and forecasts including in connection with the industry to which the company belongs which are forward
good faith. The aforesaid does not constitute advice, invitation, an offer or a recommendation to buy securities of the Company. The purchase of securities of the Company shall be made only basedcompany belongs, which are forward
looking. The information is based, inter alia, on estimates and assumptions which may not materialize and/or transpire as wrong and involve risks information and
the Company shall be made only based on the Company’s valid prospectus on the date of purchase and the immediate reports. Anyone making use of information appearing in the presentationwrong and involve risks, information and
events which are difficult to foresee and/or are unclear, and therefore the
information appearing in the presentation, bears sole responsibility therefore.
2
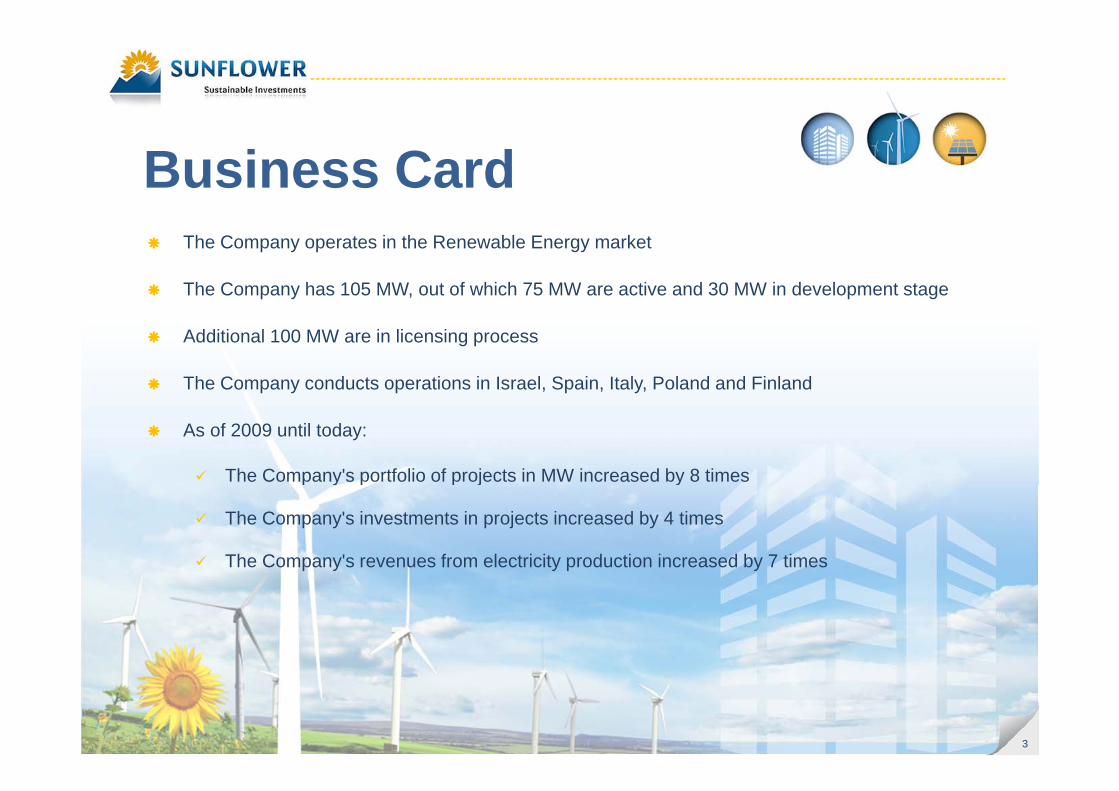
Business Card The Company operates in the Renewable Energy market
The Company has 105 MW, out of which 75 MW are active and 30 MW in development stage
Additional 100 MW are in licensing process
The Company conducts operations in Israel, Spain, Italy, Poland and Finland
As of 2009 until today:
The Company's portfolio of projects in MW increased by 8 timesy j y
The Company's investments in projects increased by 4 times
The Company's revenues from electricity production increased by 7 times
33
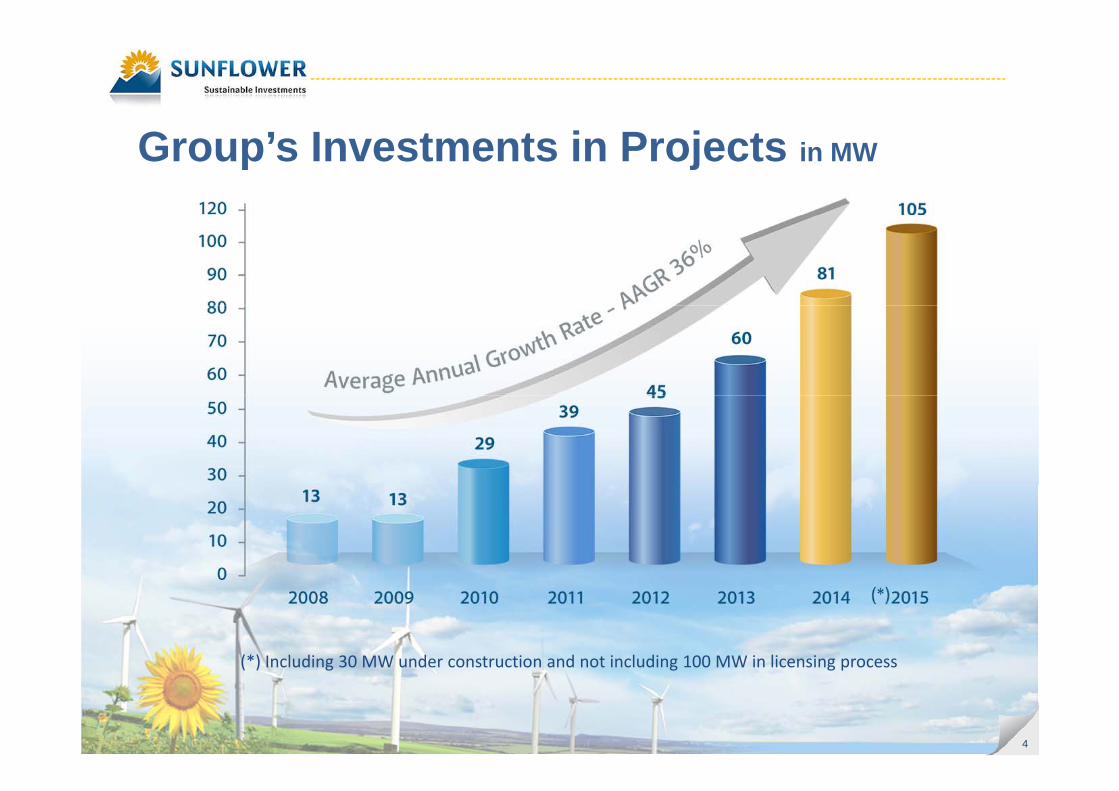
Group’s Investments in Projects in MW
(*) Including 30 MW under construction and not including 100 MW in licensing process
4
( ) Including 30 MW under construction and not including 100 MW in licensing process
4
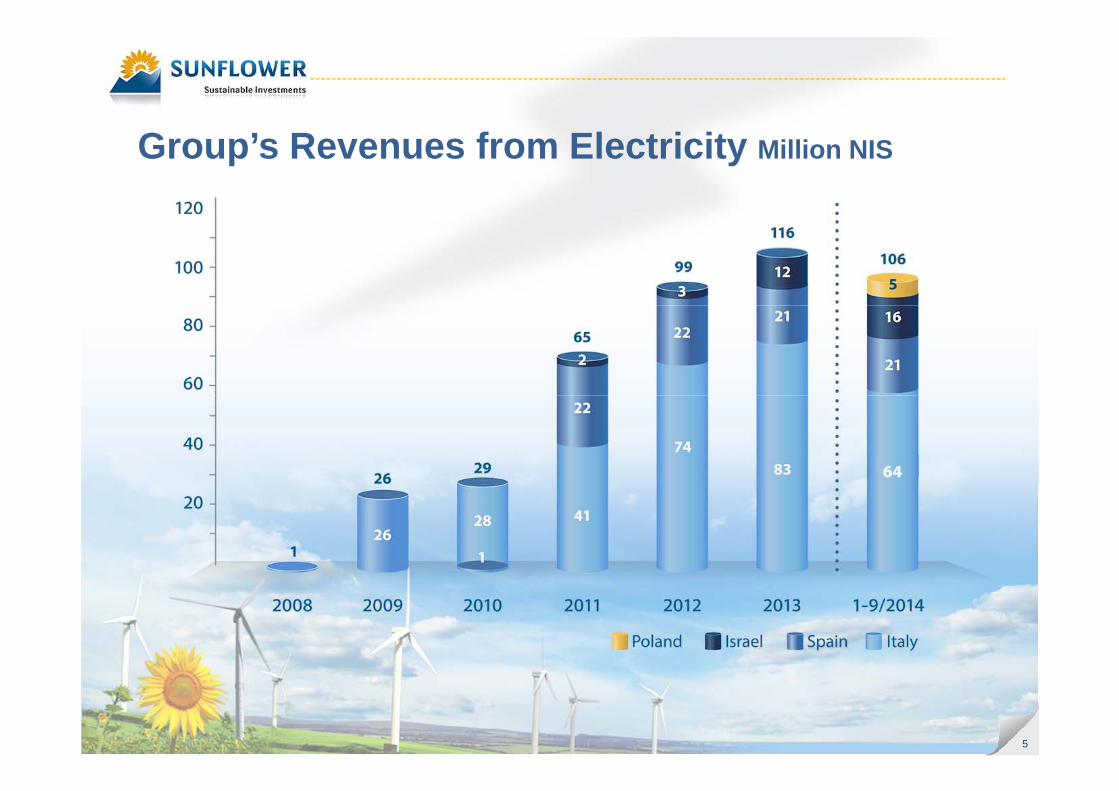
Group’s Revenues from Electricity Million NIS
55
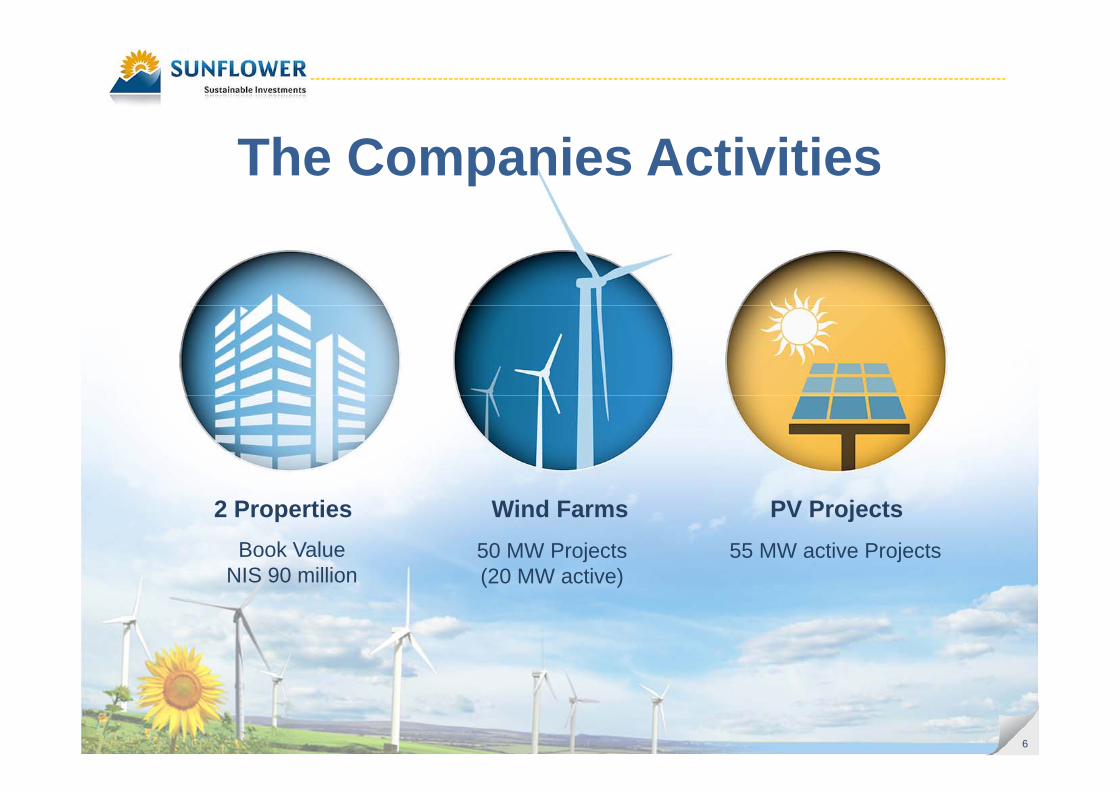
The Companies Activities
55 MW active Projects50 MW Projects (20 MW active)
Book Value NIS 90 million
PV ProjectsWind Farms2 Properties
(20 MW active)NIS 90 million
66
PV is the third largest field of renewable energy sector after water and wind
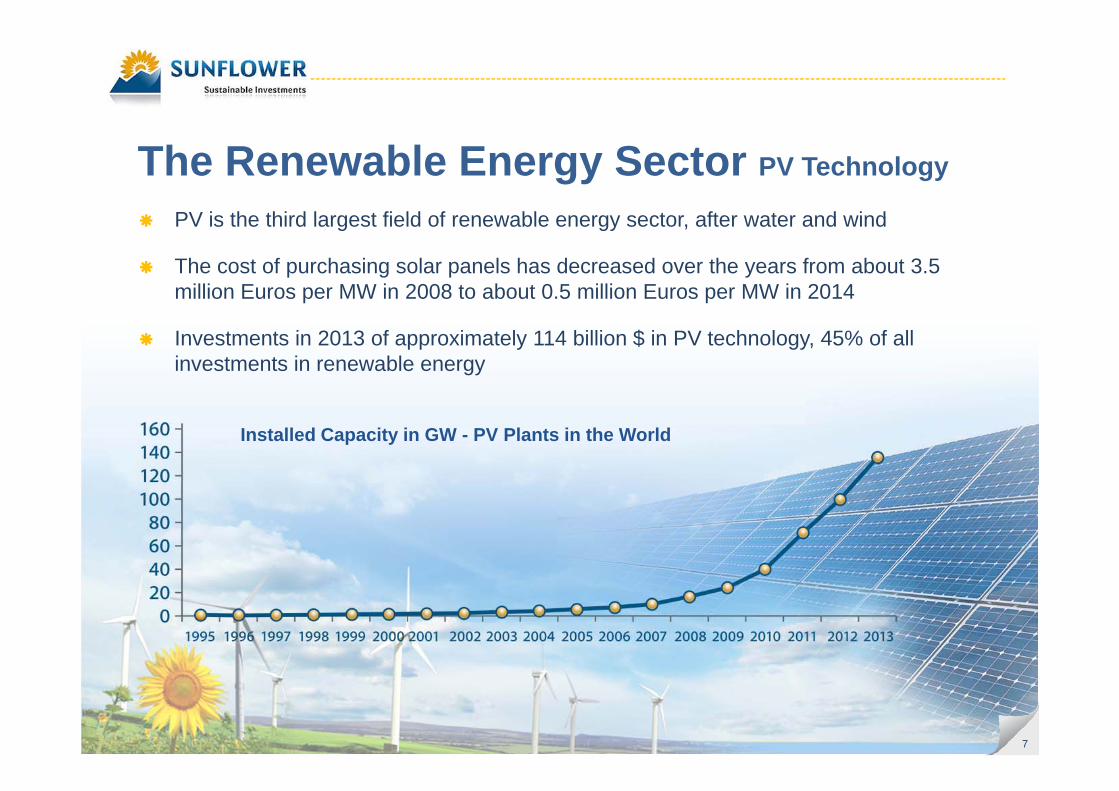
The Renewable Energy Sector PV Technology
PV is the third largest field of renewable energy sector, after water and wind
The cost of purchasing solar panels has decreased over the years from about 3.5 million Euros per MW in 2008 to about 0.5 million Euros per MW in 2014
Investments in 2013 of approximately 114 billion $ in PV technology, 45% of all investments in renewable energy
Installed Capacity in GW - PV Plants in the World
77
Developing renewable energy sector in the western world
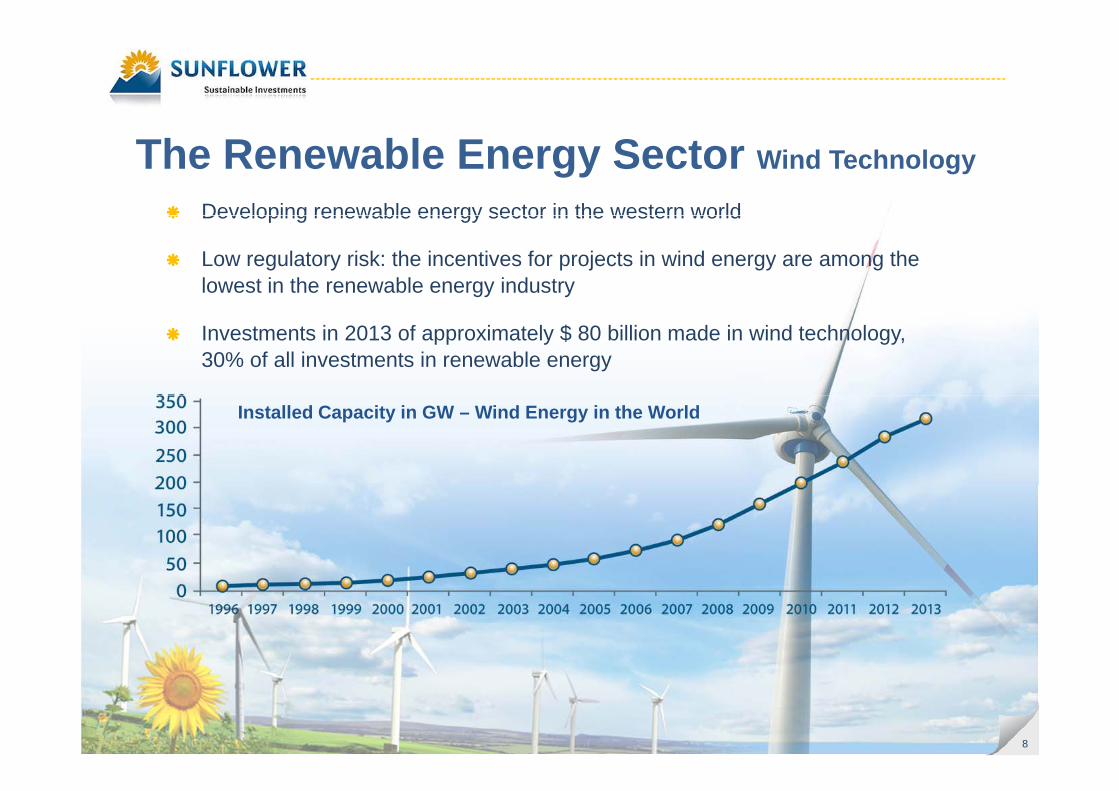
The Renewable Energy Sector Wind Technology
Developing renewable energy sector in the western world
Low regulatory risk: the incentives for projects in wind energy are among the lowest in the renewable energy industry
Investments in 2013 of approximately $ 80 billion made in wind technology, 30% of all investments in renewable energy
Installed Capacity in GW – Wind Energy in the World
88
99
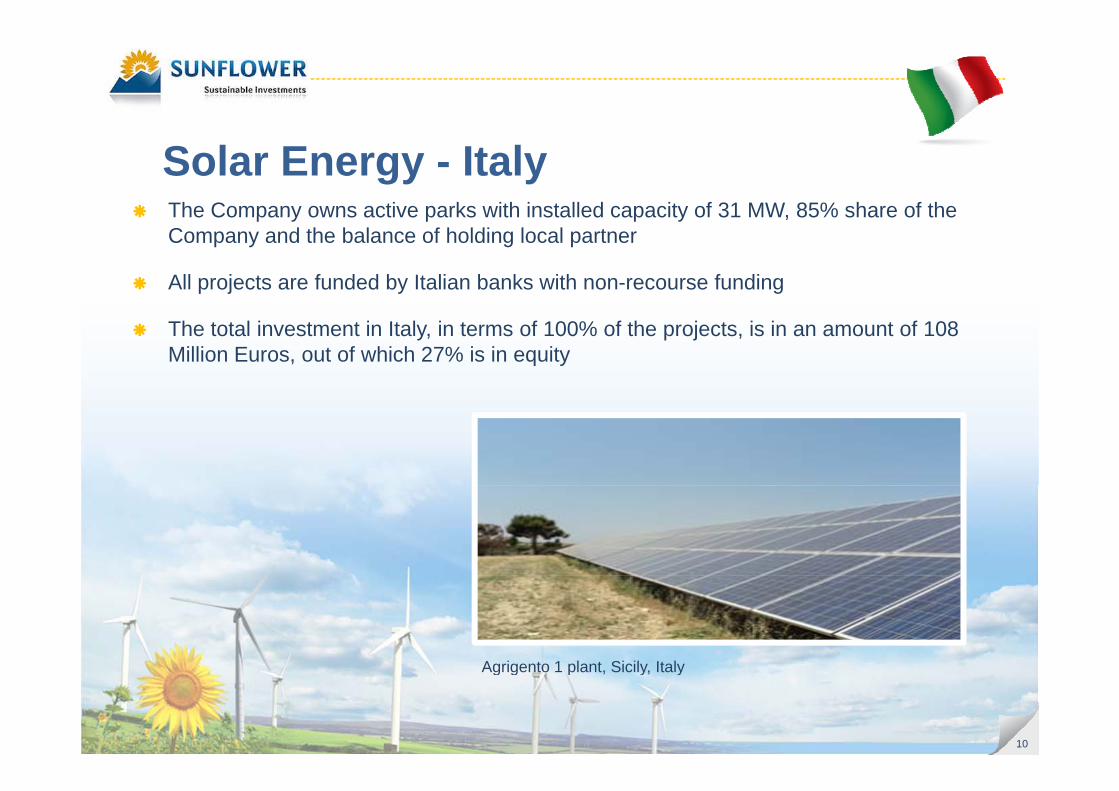
Solar Energy - Italy The Company owns active parks with installed capacity of 31 MW, 85% share of the The Company owns active parks with installed capacity of 31 MW, 85% share of the
Company and the balance of holding local partner
All projects are funded by Italian banks with non-recourse funding
The total investment in Italy, in terms of 100% of the projects, is in an amount of 108 Million Euros, out of which 27% is in equity
Agrigento 1 plant Sicily Italy
10
Agrigento 1 plant, Sicily, Italy
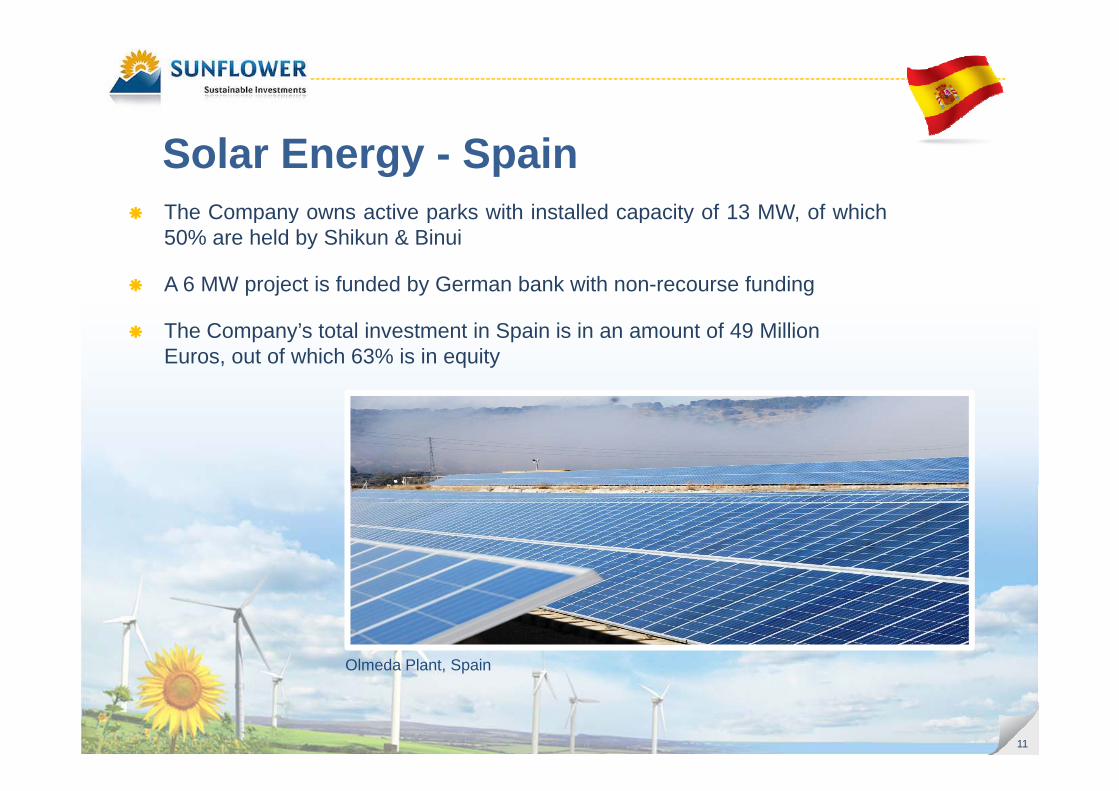
Solar Energy - Spain The Company owns active parks with installed capacity of 13 MW of which The Company owns active parks with installed capacity of 13 MW, of which
50% are held by Shikun & Binui
A 6 MW project is funded by German bank with non-recourse funding
The Company’s total investment in Spain is in an amount of 49 Million Euros, out of which 63% is in equity
Olmeda Plant Spain
11
Olmeda Plant, Spain
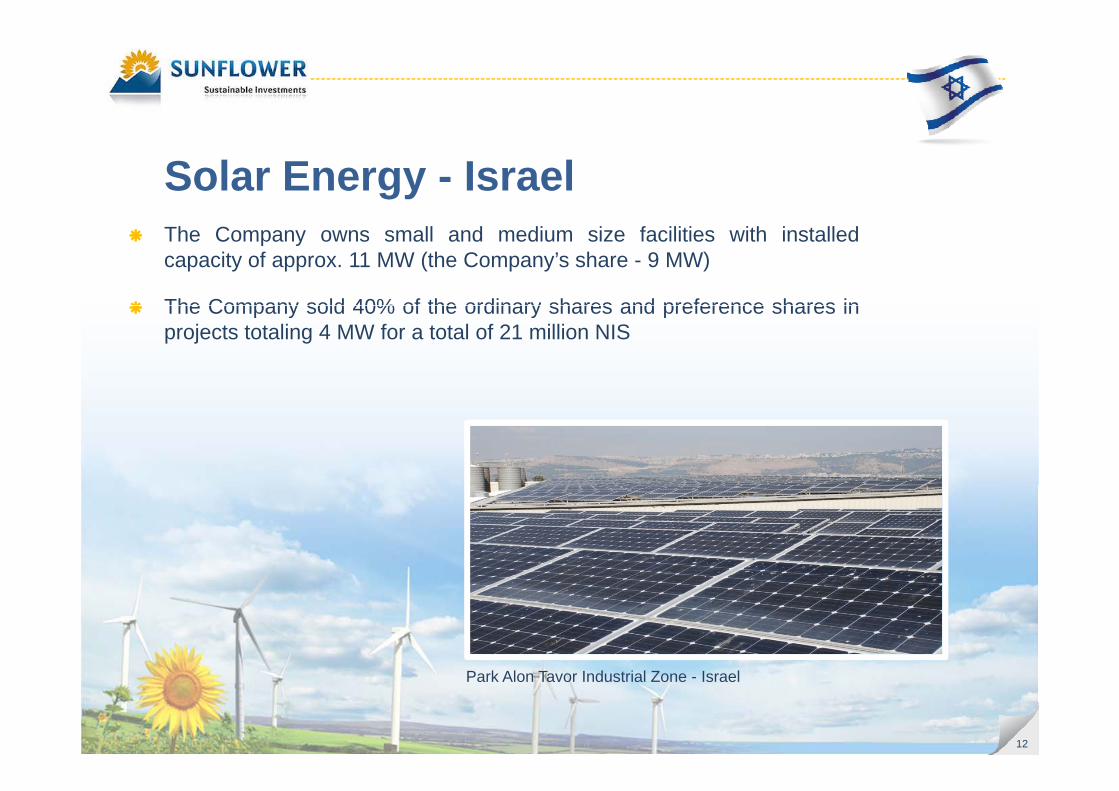
Solar Energy - Israel The Company owns small and medium size facilities with installed
capacity of approx. 11 MW (the Company’s share - 9 MW)
The Company sold 40% of the ordinary shares and preference shares in The Company sold 40% of the ordinary shares and preference shares inprojects totaling 4 MW for a total of 21 million NIS
12
Park Alon Tavor Industrial Zone - Israel
1313
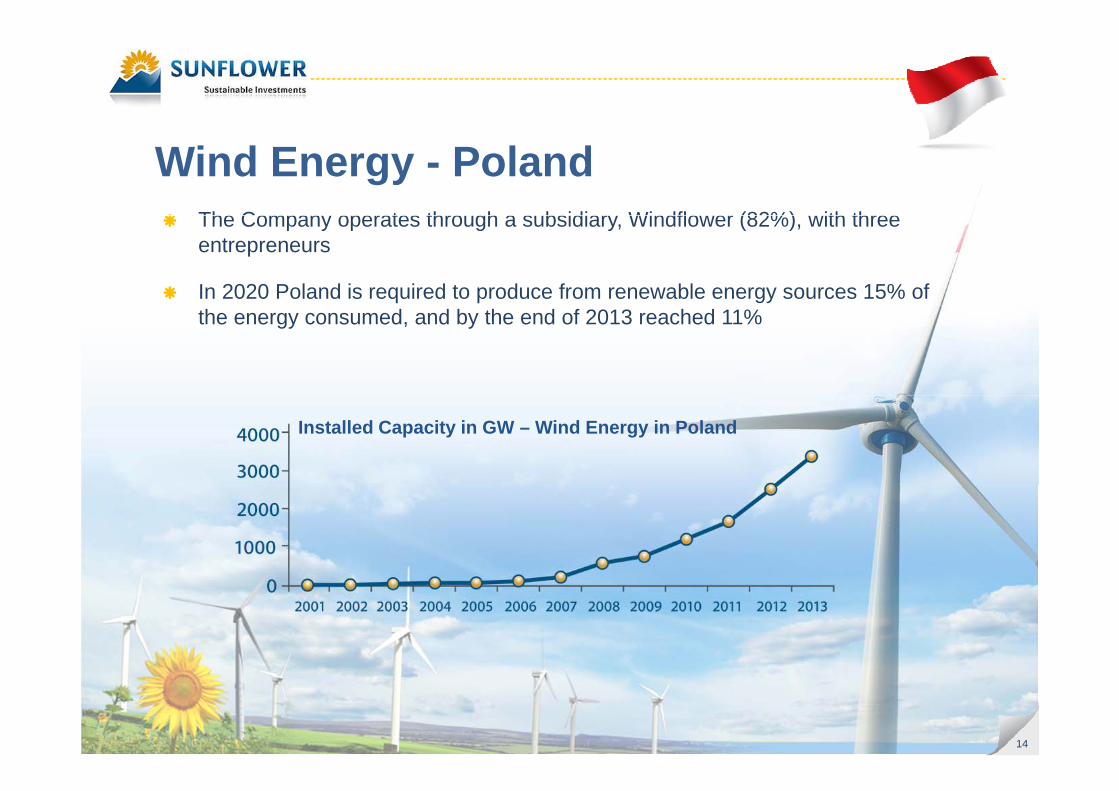
Wind Energy - Poland The Company operates through a subsidiary Windflower (82%) with three The Company operates through a subsidiary, Windflower (82%), with three
entrepreneurs
In 2020 Poland is required to produce from renewable energy sources 15% of the energy consumed, and by the end of 2013 reached 11%
Installed Capacity in GW – Wind Energy in Poland
1414
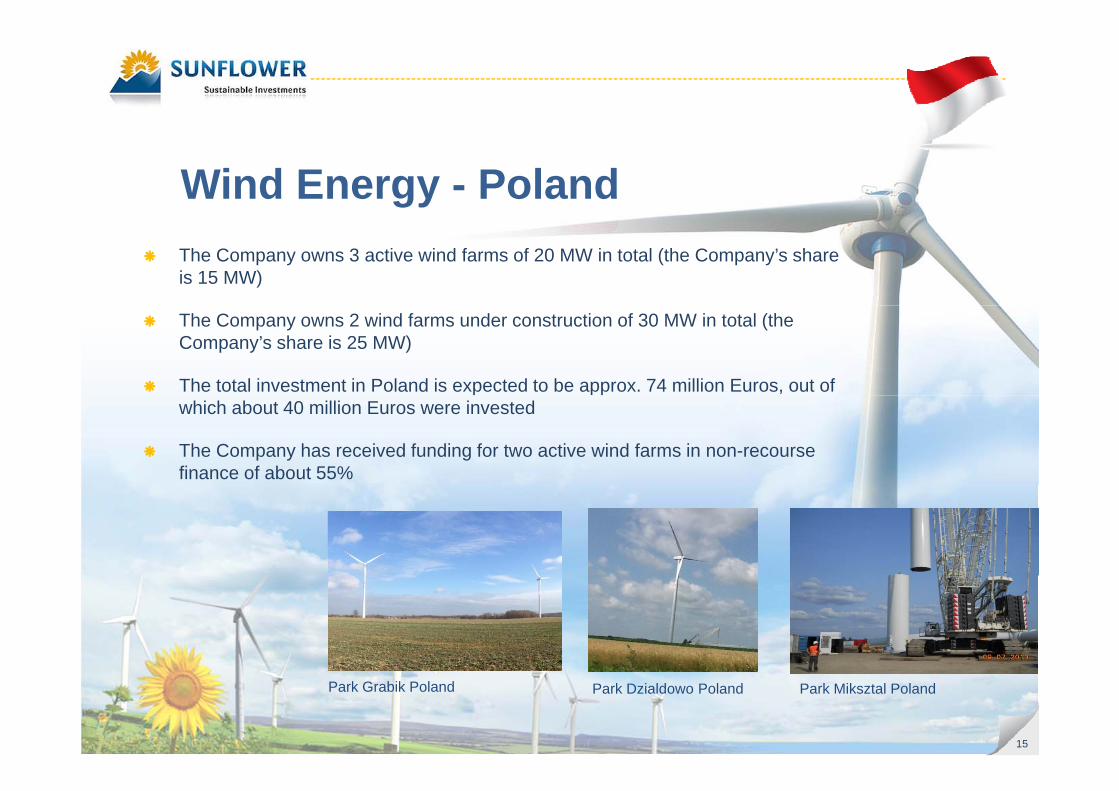
Wind Energy - Poland The Company owns 3 active wind farms of 20 MW in total (the Company’s share
is 15 MW)
The Company owns 2 wind farms under construction of 30 MW in total (the Company’s share is 25 MW)
The total investment in Poland is expected to be approx. 74 million Euros, out of which about 40 million Euros were invested
The Company has received funding for two active wind farms in non-recourse finance of about 55%
15
Park Miksztal PolandPark Grabik Poland Park Dzialdowo Poland
15
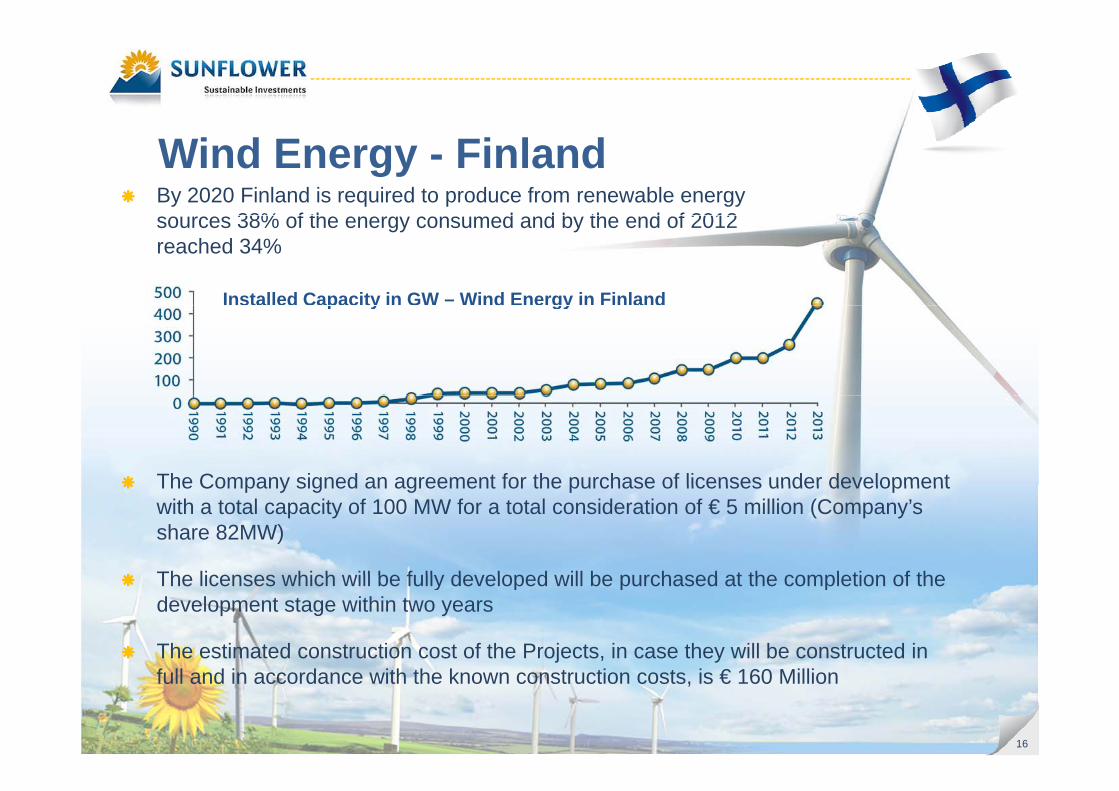
Wind Energy - Finland By 2020 Finland is required to produce from renewable energy
38% f th d d b th d f 2012sources 38% of the energy consumed and by the end of 2012 reached 34%
Installed Capacity in GW – Wind Energy in Finlandp y gy
The Company signed an agreement for the purchase of licenses under development The Company signed an agreement for the purchase of licenses under development with a total capacity of 100 MW for a total consideration of € 5 million (Company’s share 82MW)
The licenses which will be fully developed will be purchased at the completion of the The licenses which will be fully developed will be purchased at the completion of the development stage within two years
The estimated construction cost of the Projects, in case they will be constructed in
16
full and in accordance with the known construction costs, is € 160 Million
16
Summary of the Group’s InvestmentsAverage
P j t dProjected
A lAverage C t
Term of I ti
Company’s Sh i
Company’s Sh
Total I iti l
Total I t t
Country Incentive
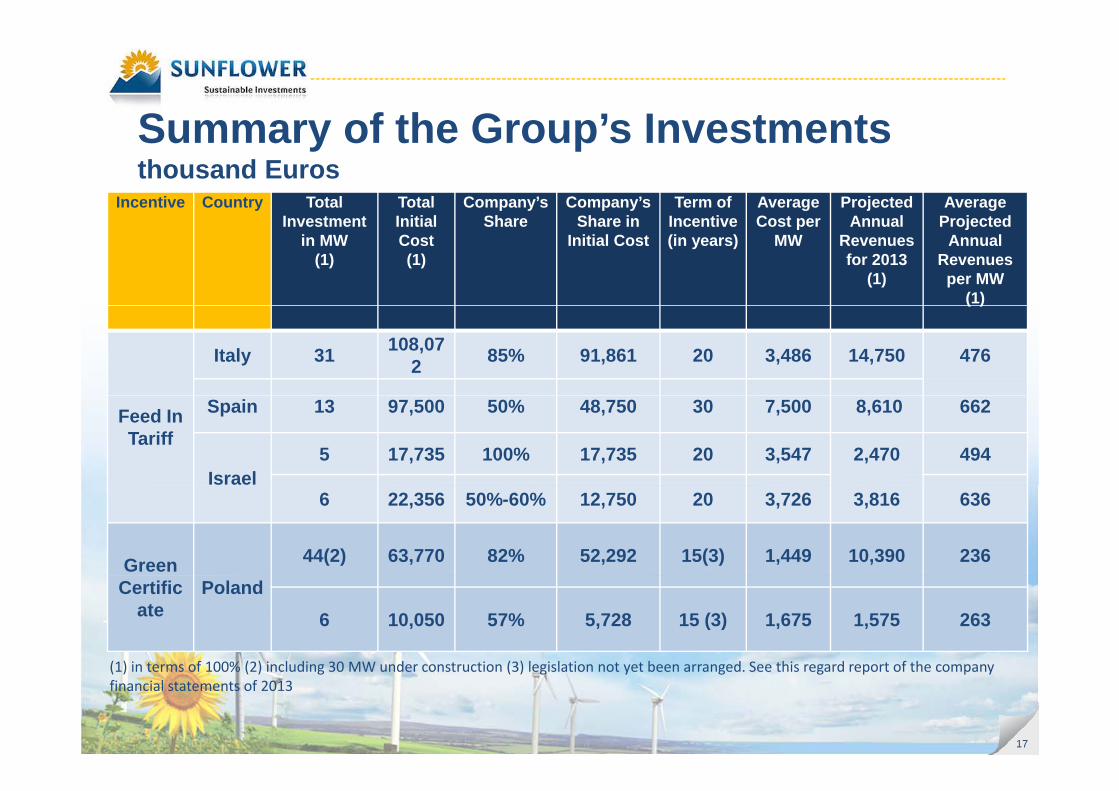
Summary of the Group s Investmentsthousand Euros
Projected Annual
Revenues per MW
(1)
Annual Revenues for 2013
(1)
Cost per MW
Incentive (in years)
Share in Initial Cost
ShareInitial Cost (1)
Investment in MW
(1)
( )
47614,7503,48620 91,86185%108,07231Italy
Feed In Tariff
6628,6107,5003048,75050%97,50013Spain
4942,4703,5472017,735100%17,7355Israel
6363,8163,7262012,75050%-60%22,3566
23610,3901,44915(3)52,29282%63,77044(2)GreenPolandCertific
ate 2631,5751,67515 (3)5,72857%10,0506
(1) in terms of 100% (2) including 30 MW under construction (3) legislation not yet been arranged See this regard report of the company
17
(1) in terms of 100% (2) including 30 MW under construction (3) legislation not yet been arranged. See this regard report of the company financial statements of 2013
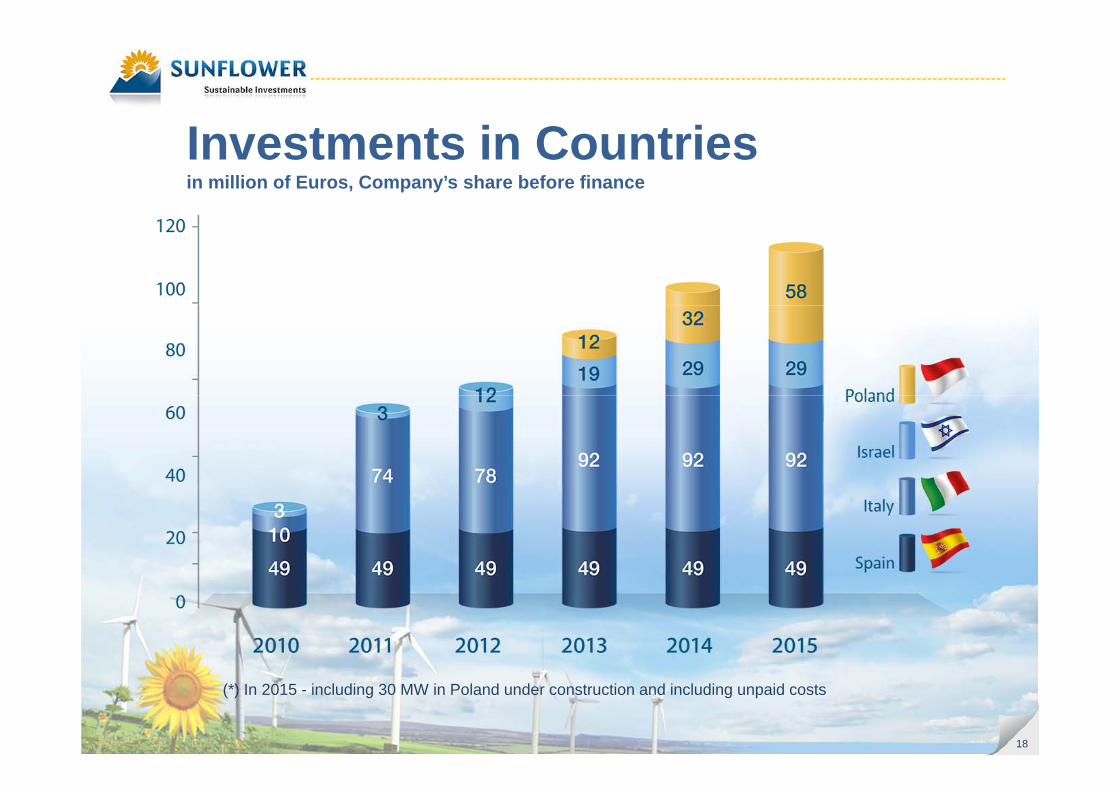
I t t i C t iInvestments in Countries in million of Euros, Company’s share before finance
18
(*) In 2015 - including 30 MW in Poland under construction and including unpaid costs
18
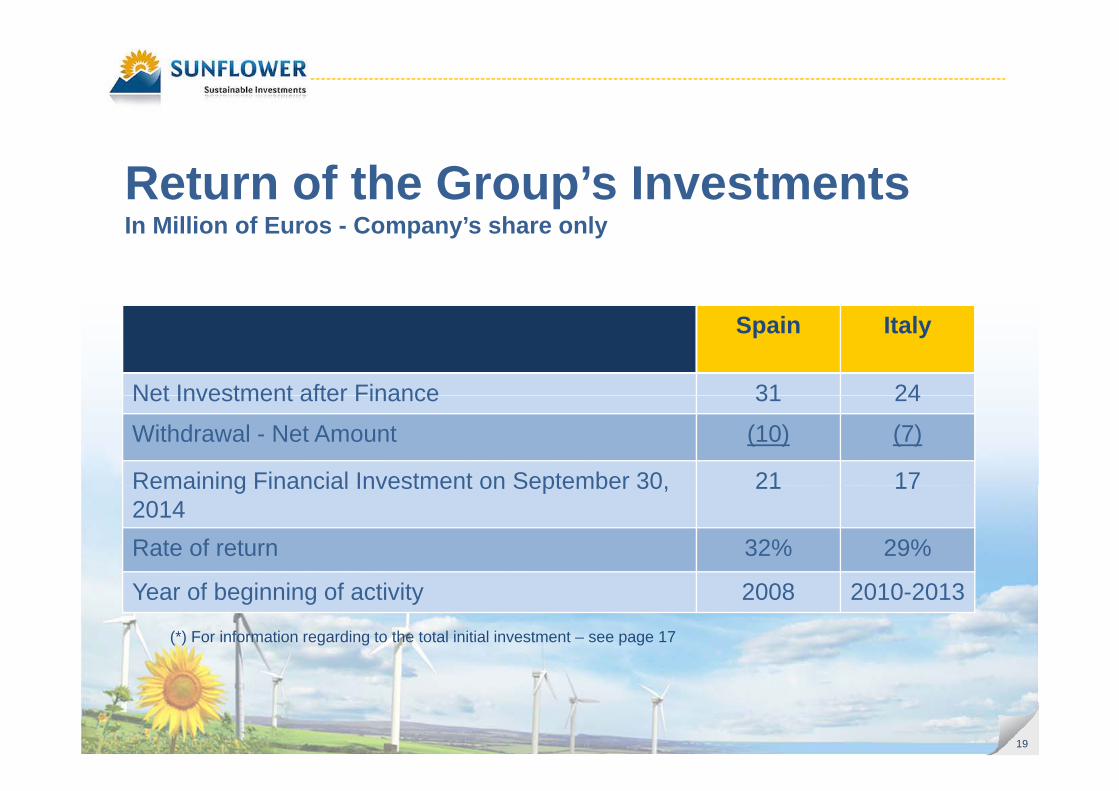
Return of the Group’s Investments f CIn Million of Euros - Company’s share only
ItalySpain
2431Net Investment after Finance 2431Net Investment after Finance
(7)(10)Withdrawal - Net Amount
1721Remaining Financial Investment on September 30 1721Remaining Financial Investment on September 30, 2014
29%32%Rate of return
2010-20132008Year of beginning of activity
(*) For information regarding to the total initial investment – see page 17
19
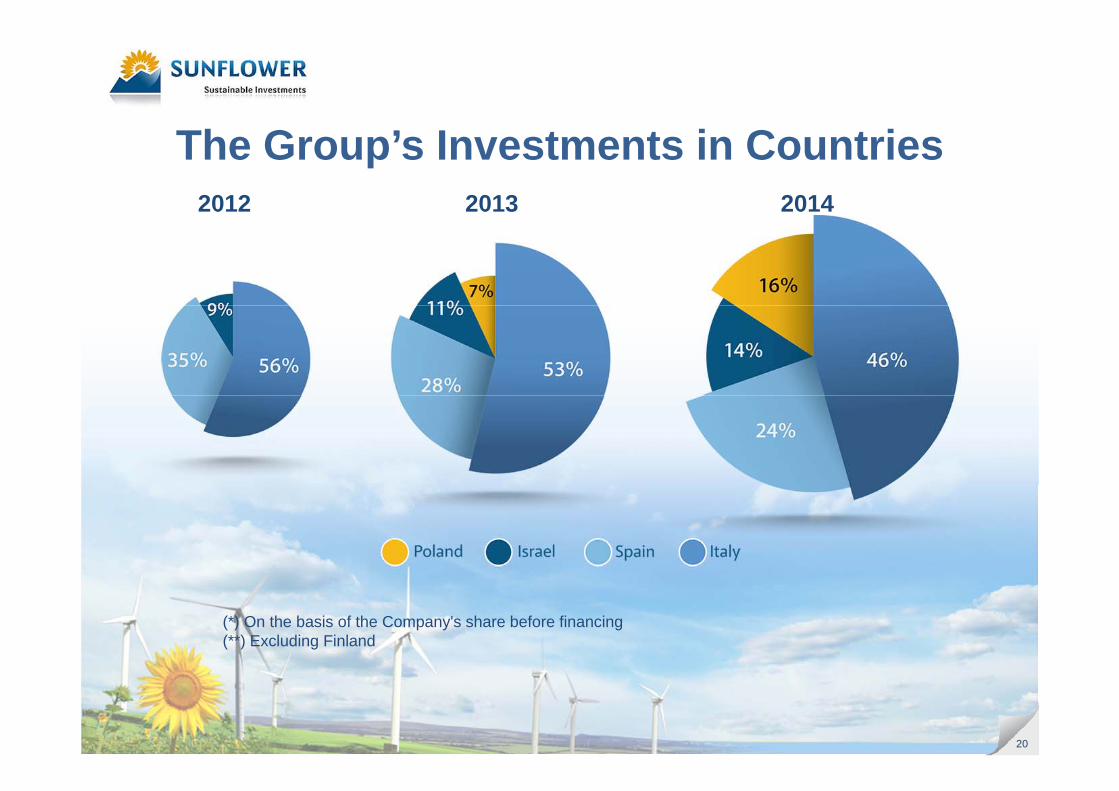
2012 2013 2014
The Group’s Investments in Countries
(*) On the basis of the Company's share before financing(**) Excluding Finland
2020
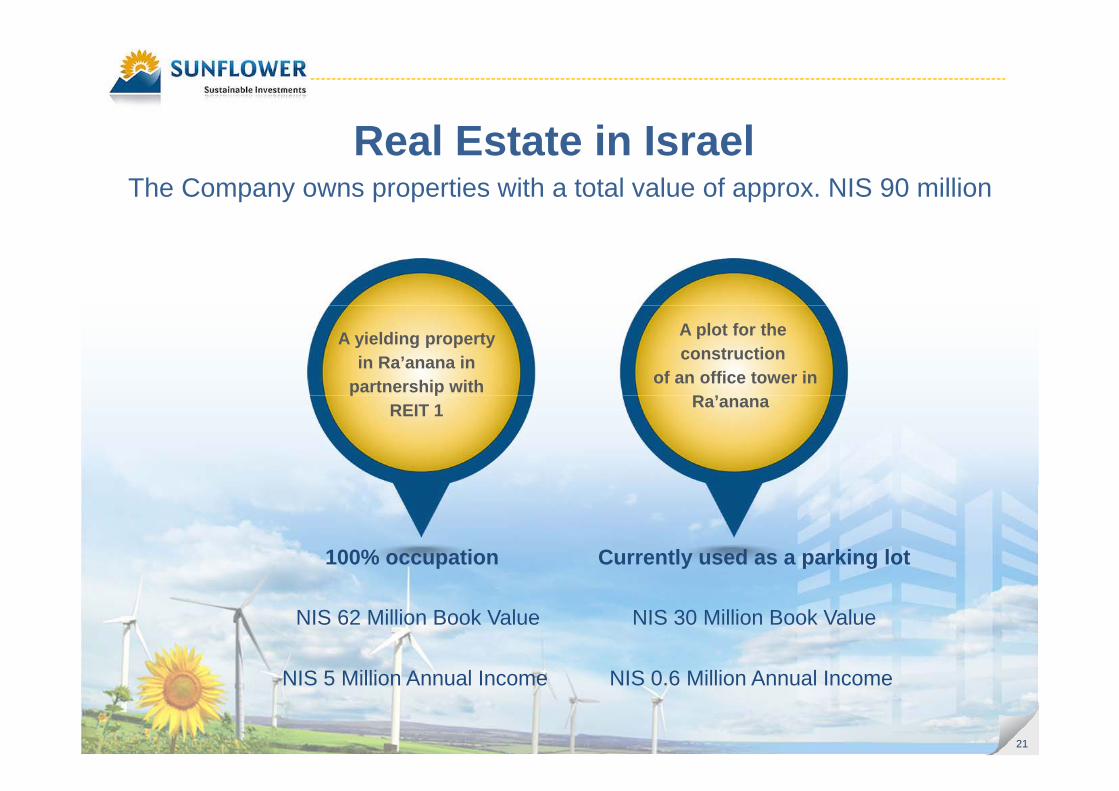
R l E t t i I lReal Estate in Israel The Company owns properties with a total value of approx. NIS 90 million
A plot for the construction
of an office tower in R ’
A yielding property in Ra’anana in
partnership with Ra’anana
p pREIT 1
Currently used as a parking lot100% occupation
NIS 30 Million Book ValueNIS 62 Million Book Value
2121
NIS 0.6 Million Annual Income NIS 5 Million Annual Income
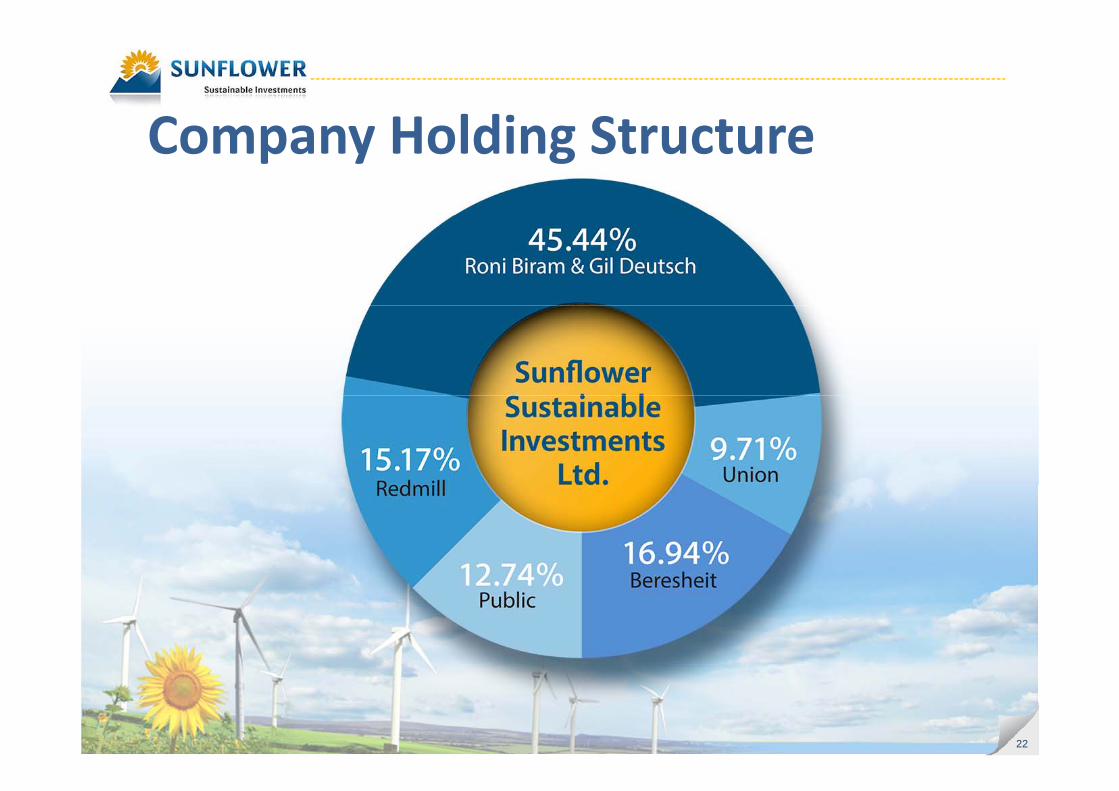
Company Holding StructureCompany Holding Structure
2222
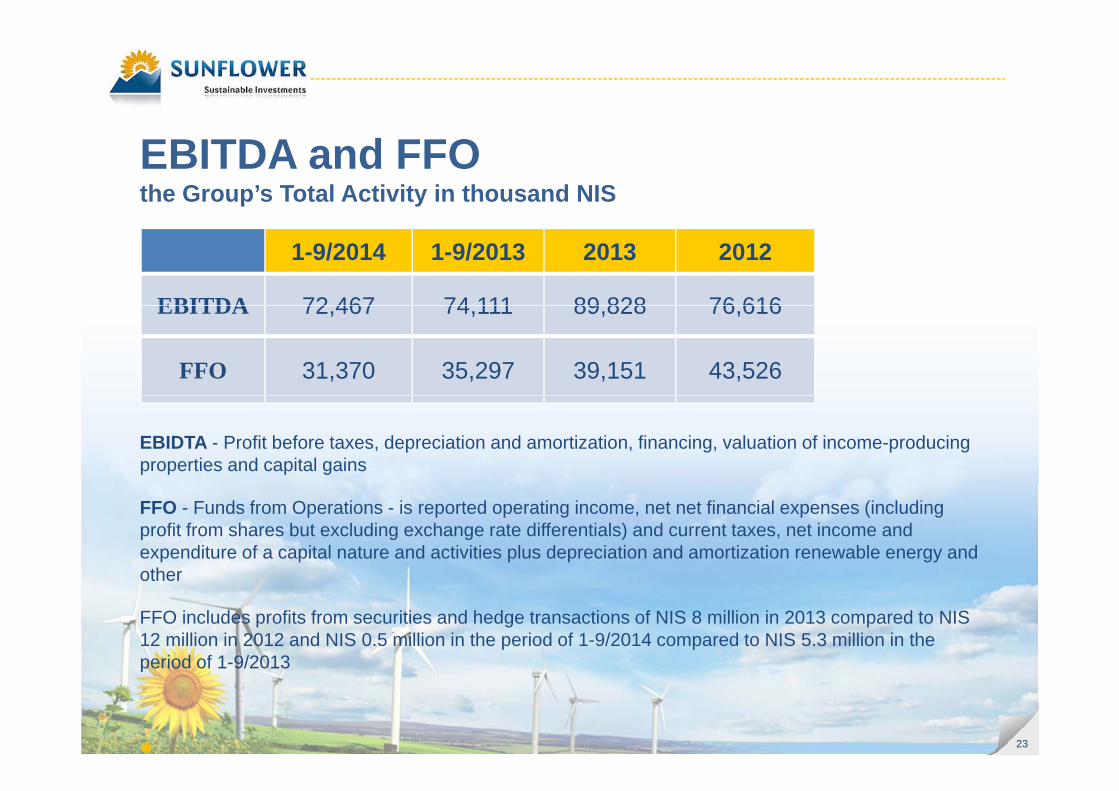
EBITDA and FFOthe Group’s Total Activity in thousand NIS
201220131-9/20131-9/2014
76 61689 82874 11172 467EBITDA 76,61689,82874,11172,467EBITDA
43,52639,15135,29731,370FFO
EBIDTA - Profit before taxes, depreciation and amortization, financing, valuation of income-producing properties and capital gains
FFO - Funds from Operations - is reported operating income, net net financial expenses (including profit from shares but excluding exchange rate differentials) and current taxes, net income and expenditure of a capital nature and activities plus depreciation and amortization renewable energy and otherother
FFO includes profits from securities and hedge transactions of NIS 8 million in 2013 compared to NIS 12 million in 2012 and NIS 0.5 million in the period of 1-9/2014 compared to NIS 5.3 million in the period of 1-9/2013
23
period of 1 9/2013
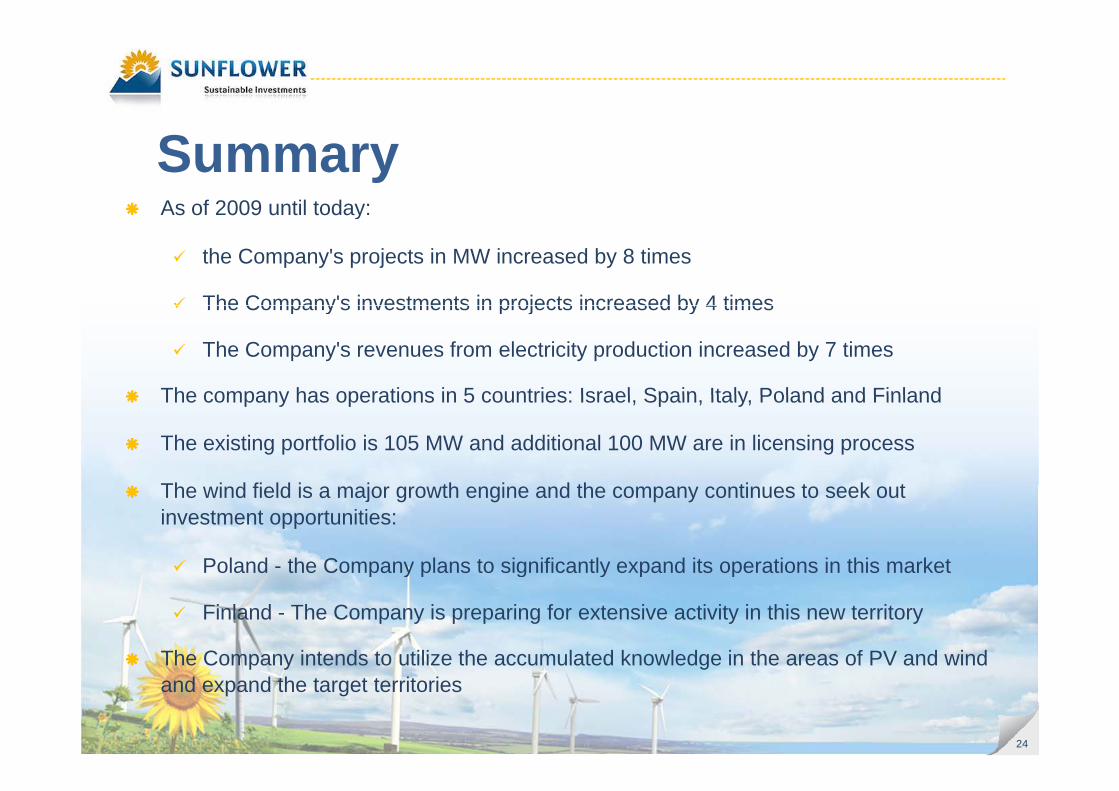
As of 2009 until today:
Summaryy
the Company's projects in MW increased by 8 times
The Company's investments in projects increased by 4 times The Company s investments in projects increased by 4 times
The Company's revenues from electricity production increased by 7 times
The company has operations in 5 countries: Israel Spain Italy Poland and Finland The company has operations in 5 countries: Israel, Spain, Italy, Poland and Finland
The existing portfolio is 105 MW and additional 100 MW are in licensing process
Th i d fi ld i j th i d th ti t k t The wind field is a major growth engine and the company continues to seek out investment opportunities:
Poland - the Company plans to significantly expand its operations in this marketp y p g y p p
Finland - The Company is preparing for extensive activity in this new territory
The Company intends to utilize the accumulated knowledge in the areas of PV and wind
24
The Company intends to utilize the accumulated knowledge in the areas of PV and wind and expand the target territories

2525
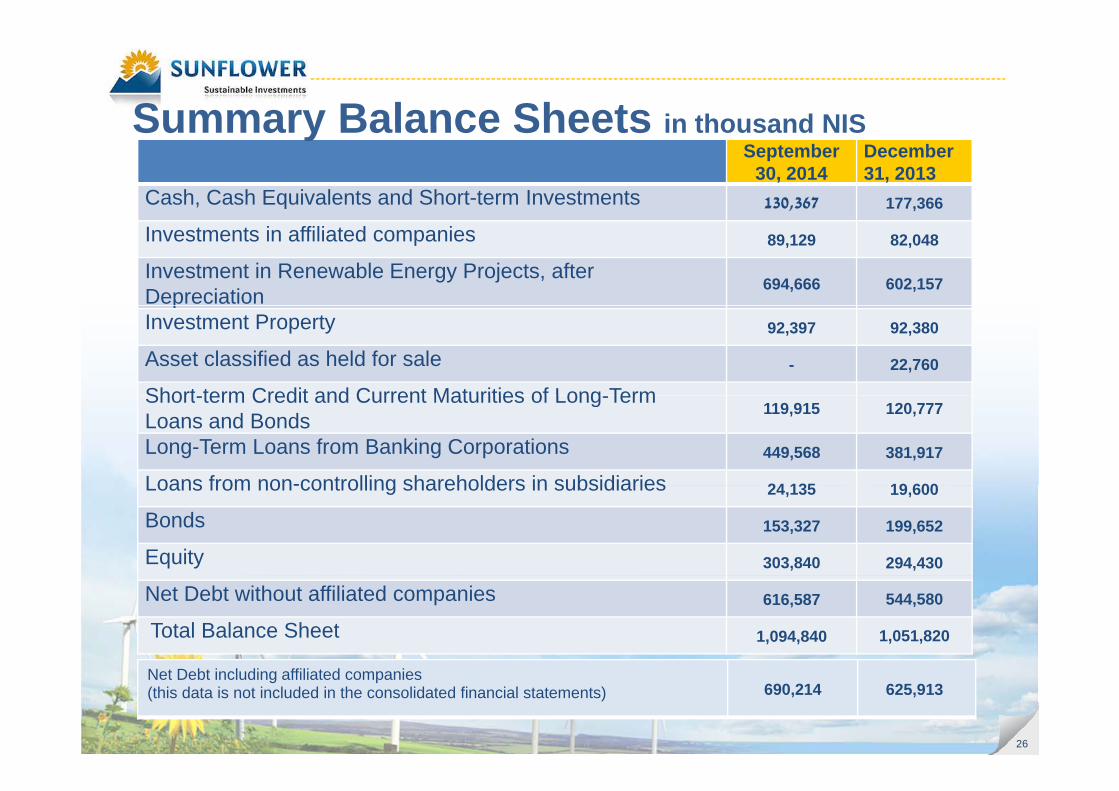
Summary Balance Sheets in thousand NISDecember 31, 2013
September30, 2014
177,366130,367Cash, Cash Equivalents and Short-term Investments
Summary Balance Sheets in thousand NIS
82,04889,129Investments in affiliated companies
602,157694,666Investment in Renewable Energy Projects, after Depreciationp
92,38092,397Investment Property
22,760-Asset classified as held for sale
Short term Credit and Current Maturities of Long Term120,777119,915
Short-term Credit and Current Maturities of Long-Term Loans and Bonds
381,917449,568Long-Term Loans from Banking Corporations
19 60024 135Loans from non-controlling shareholders in subsidiaries 19,60024,135Loans from non-controlling shareholders in subsidiaries
199,652153,327Bonds
294,430303,840Equity
544,580616,587Net Debt without affiliated companies
1,051,8201,094,840Total Balance Sheet
26
625,913690,214Net Debt including affiliated companies
(this data is not included in the consolidated financial statements)
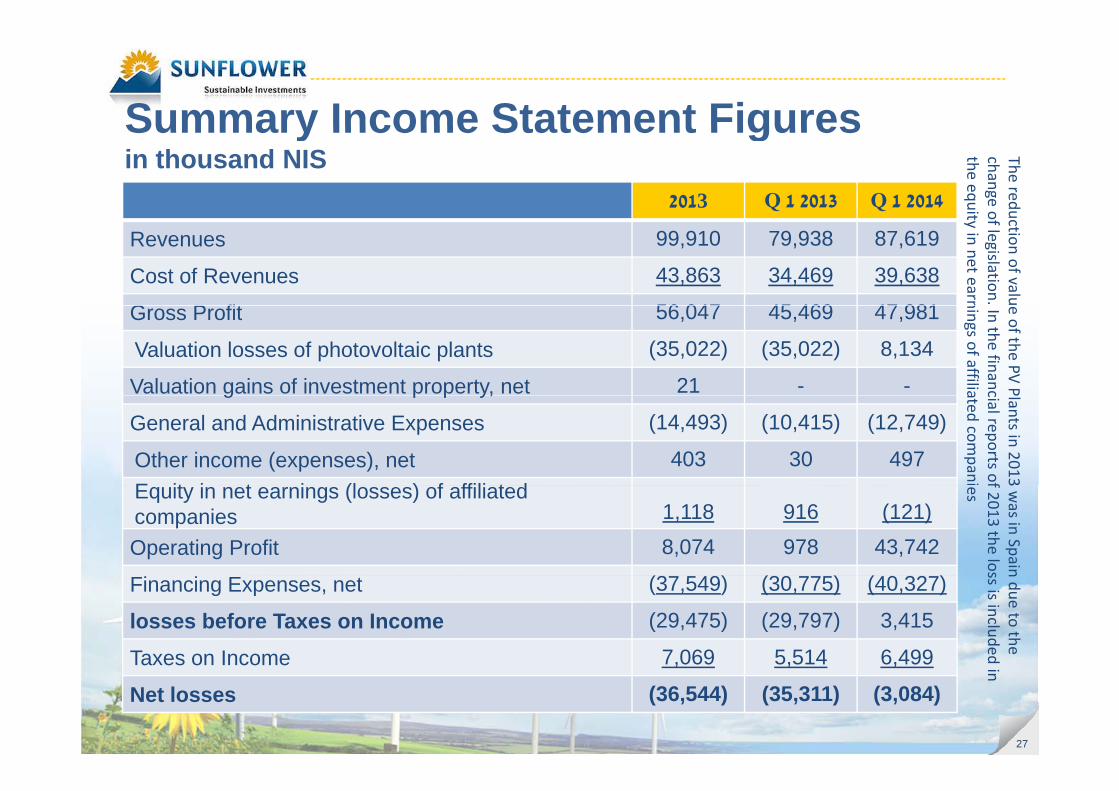
Summary Income Statement Figures
Q 1 2014Q 1 20132013
Summary Income Statement Figures in thousand NIS The redu
change othe equit
87,61979,93899,910Revenues
39,63834,46943,863Cost of Revenues
47 98145 46956 047G P fit
uction of valuof legislation. ty in net earn
47,98145,46956,047Gross Profit
8,134)35,022()35,022(Valuation losses of photovoltaic plants
--21Valuation gains of investment property, net
e of the PV PIn the financ
nings of affiliag p p y,
)12,749()10,415()14,493(General and Administrative Expenses
49730403Other income (expenses), net E it i t i (l ) f ffili t d
Plants in 2013cial reports ofated com
pani
)121(9161,118Equity in net earnings (losses) of affiliated companies
43,7429788,074Operating Profit
3 was in Spain
f 2013 the loses
)40,327()30,775()37,549(Financing Expenses, net
3,415)29,797()29,475(losses before Taxes on Income6,4995,5147,069Taxes on Income
n due to the ss is included
27
,,,Taxes on Income
)3,084()35,311()36,544(Net losses
in