Summer Economic Statement - Summary
11
Government of Ireland Summer Economic Statement 2021 - summary Summer Economic Statement - Summary July 2021 Prepared by the Departments of Finance and Public Expenditure and Reform finance.gov.ie
Transcript of Summer Economic Statement - Summary
Government of Ireland Summer Economic Statement 2021 - summary
Summer Economic Statement - Summary
July 2021
Prepared by the Departments of Finance and
Public Expenditure and Reform
finance.gov.ie

Government of Ireland Summer Economic Statement 2021 - summary
SUMMARY1 ˃ The Summer Economic Statement (SES) sets out the Government’s medium-term budgetary
strategy and establishes the parameters for discussion ahead of Budget 2022. ˃ The SES is being published in an environment of increasingly positive economic indicators –high
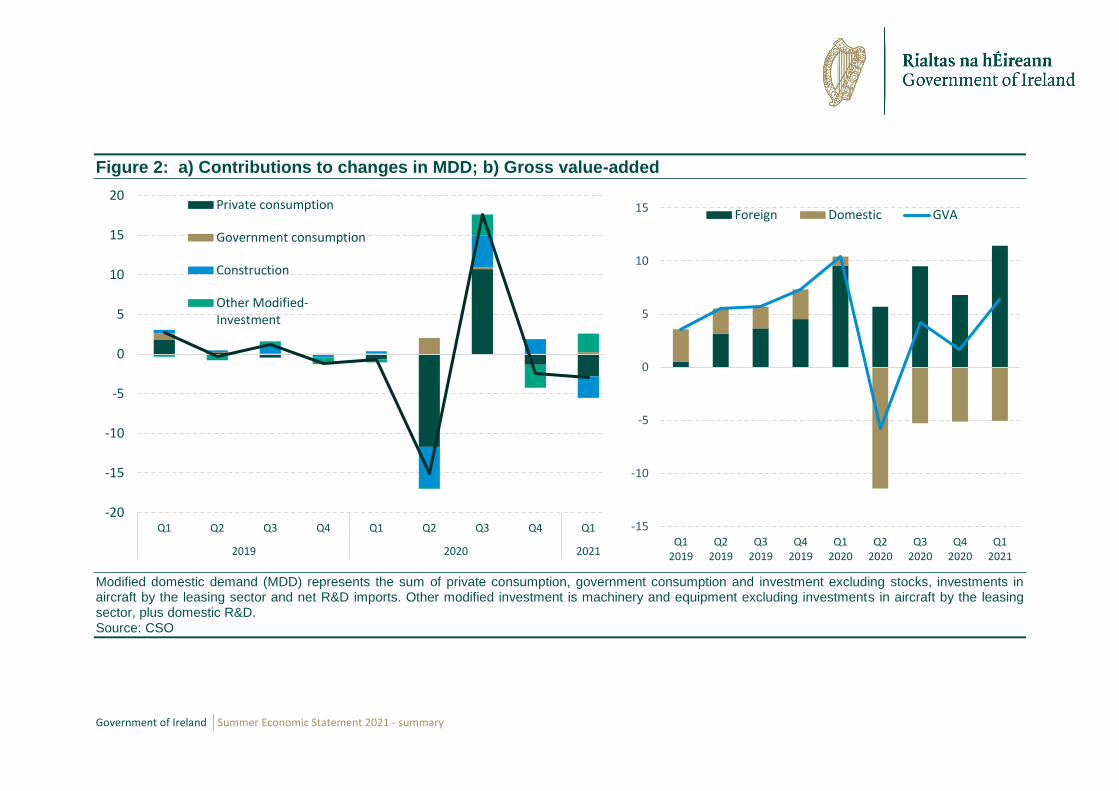
frequency data on consumer expenditure and job postings show signs of a strong economic recovery taking hold in line with the easing of public health restrictions (figure 1). Similarly, modified domestic demand (MDD) is rebounding after a steep decline last year (figure 2), although these measures will of course be contingent upon the trajectory of the pandemic in the coming months.
˃ The recovery in the economy is reflected in upward revisions to GDP (to 8 ¾ per cent growth this
year) and revenues (revised upward by €1.6 billion relative to the projections in April’s Stability Programme Update), based on continuing strength in taxation receipts.
˃ Although the emergence of a new, highly transmissible variant (‘delta’) is a concern, the success
of Ireland’s vaccination programme has led to a weakening in the relationship between new Covid-19 cases and hospitalisations. As the vaccination programme continues at pace, the citation of case numbers as a shorthand for the impact of the pandemic has less direct relevance than had been the case earlier in the pandemic (figure 3).
˃ Government has acted decisively to support households and businesses on an unprecedented
scale, making over €38 billion available over two years (table 1) in direct support measures alone. The recent Economic Recovery Plan made available up to an additional €5 billion in further supports as Ireland begins to recover from the worst of the pandemic.
˃ This level of support, although clearly appropriate, has come at a significant cost, with Ireland’s
budgetary deficit as measured by GNI* (a more accurate measure of the domestic economy than GDP) likely to be among the highest in Europe both this year and next (figure 4).
˃ Government is committed to returning the public finances to a sustainable position so that Ireland
does not become a fiscal outlier. Accordingly, the SES sets out a medium-term budgetary strategy to guide policy decisions, operationalised through an expenditure rule whereby core (non-Covid) expenditure growth will be fixed at the estimated trend growth rate of the economy.
˃ This expenditure rule is consistent with reaching a headline deficit broadly in line with the fiscal
position of comparable European countries by the mid-part of the decade (table 2). ˃ A progressive restoration of the public finances will place Ireland’s public debt ratio back on a
gradual downward trajectory (figure 5), reversing the temporary increase incurred by the extraordinary funding required to address the effects of the pandemic.
˃ The deficit will be reduced in a gradual, incremental manner, reflecting the Government’s commitment to investment in capital expenditure (figure 6) to meet the goals of the National Development Plan and the priorities set out in the Programme for Government.
1 Please note that figure and table references above vary from those in the main SES publication.

Government of Ireland Summer Economic Statement 2021 - summary
Figure 1: a) Revolut spending data; b) Indeed job postings
a. Source: Revolut; 7-day moving average, spending per user, indexed to February 2020.
b. Source: Indeed, 7-day moving average, per cent change relative to 1 February 2020.
0
20
40
60
80
100
120
140
160
01
/02
/202
0
01
/03
/202
0
01
/04
/202
0
01
/05
/202
0
01
/06
/202
0
01
/07
/202
0
01
/08
/202
0
01
/09
/202
0
01
/10
/202
0
01
/11
/202
0
01
/12
/202
0
01
/01
/202
1
01
/02
/202
1
01
/03
/202
1
01
/04
/202
1
01
/05
/202
1
-80
-60
-40
-20
0
20
40
01/0
2/20
20
06/0
3/20
20
09/0
4/20
20
13/0
5/20
20
16/0
6/20
20
20/0
7/20
20
23/0
8/20
20
26/0
9/20
20
30/1
0/20
20
03/1
2/20
20
06/0
1/20
21
09/0
2/20
21
15/0
3/20
21
18/0
4/20
21
22/0
5/20
21
25/0
6/20
21
New postings Total postings
Government of Ireland Summer Economic Statement 2021 - summary
Figure 2: a) Contributions to changes in MDD; b) Gross value-added
Modified domestic demand (MDD) represents the sum of private consumption, government consumption and investment excluding stocks, investments in aircraft by the leasing sector and net R&D imports. Other modified investment is machinery and equipment excluding investments in aircraft by the leasing sector, plus domestic R&D. Source: CSO
-20
-15
-10
-5
0
5
10
15
20
Q1 Q2 Q3 Q4 Q1 Q2 Q3 Q4 Q1
2019 2020 2021
Private consumption
Government consumption
Construction
Other Modified-Investment
-15
-10
-5
0
5
10
15
Q12019
Q22019
Q32019
Q42019
Q12020
Q22020
Q32020
Q42020
Q12021
Foreign Domestic GVA

Government of Ireland Summer Economic Statement 2021 - summary
Figure 3: Vaccination – weakening of the relationship between infection and hospitalisation
Source: Department of Health, UK Government. Based on a plot by Colin Angus. The Y-axis in both plots has been truncated for visualisation purposes. These plots compare daily new Covid-19 cases reported (‘flow’) with the total number (‘stock’) of patients with Covid-19 in hospital.

Government of Ireland Summer Economic Statement 2021 - summary
Table 1: Covid-19 direct expenditure measures, € billions
2020 2021 Total % GNI*
Social Protection 10.07 10.06 20.13 9.5
of which:
Pandemic Unemployment Payment 5.09 3.32 8.41 4.0
EWSS/TWSS 4.53 2.37 6.90 3.3
Other (illness benefit, activation measures, etc.) 0.45 1.50 1.95 0.9
ERP extension of the EWSS (Q3 2021) 1.22 1.22 0.6
ERP extension PUP 0.45 0.45 0.2
ERP provision for EWSS extension (Q4 2021) 1.20 1.20 0.6
Health 2.60 1.86 4.46 2.1
of which: capacity, equipment, PPE, testing 2.60 1.86 2.1
Education 0.33 0.31 0.64 0.3
of which: Roadmap for Reopening Schools 0.14 0.1
Further and Higher Education 0.32 0.15 0.47 0.2
Business, Enterprise & Innovation 0.93 0.34 1.26 0.6
of which:
Liquidity supports and Business Restart Grants 0.49 0.2
July Stimulus including additional funds for Restart Grants 0.45 0.2
Business Support Schemes 0.34 0.2
Housing, Local Government and Heritage 1.11 0.50 1.61 0.8
of which:
Commercial Rates Waiver 0.90 0.29 0.6
ERP extension to the Commercial Rates Waiver 0.16 0.1
Transport 0.61 0.44 1.05 0.5
of which: Public Service Obligation 0.46 0.37 0.4
Other 0.64 0.41 1.05 0.5
Total allocated 16.60 14.07 30.66 14.5
Covid Contingency Fund - earmarked expenditure 0.70 0.3
Provision for 2022 Covid expenditure 6.80 2.9
TOTAL DIRECT EXPENDITURE 16.60 14.77 38.16 17.8
Source: Department of Finance, Department of Public Expenditure and Reform The figures above relate to resources made available. Outturn costs will differ. Rounding may affect totals. GNI* relates to modified Gross National Income and is projected at c. €208bn for 2020, €216bn for 2021 and €232bn for 2022.

Government of Ireland Summer Economic Statement 2021 - summary
Figure 4: EU Member State deficits a) 2021; b) 2022, per cent of GDP (unless stated)
Source: European Commission Spring Forecasts, Department of Finance.
-0.3-2.1
-3.2-3.3
-4.3-4.6-4.6-4.7
-5.0-5.1-5.1
-5.6-6.5
-6.8-7.3
-7.5-7.5-7.6-7.6-7.6
-8.0-8.0
-8.2-8.5-8.5-8.5
-9.4-10.0
-11.7-11.8
-14.0 -12.0 -10.0 -8.0 -6.0 -4.0 -2.0 0.0
LU
DK
BG
SE
PL
HR
FI
PT
NL
IE (GDP)
CY
EE
SK
HU
LV
EU
DE
BE
ES
AT
RO
Euro Area
LT
CZ
SI
FR
IE (GNI*)
EL
IT
MT
-0.1-0.5
-1.4-1.8
-1.9-2.0-2.0
-2.1-2.3
-2.5-3.0
-3.2-3.2
-3.3-3.4-3.4
-3.7-3.8
-4.1-4.5
-4.7-4.7
-4.9-5.2
-5.4-5.5
-5.8-6.0
-6.2-7.1
-8.0 -7.0 -6.0 -5.0 -4.0 -3.0 -2.0 -1.0 0.0
LUSEDKNLBGCYLVFIPLDEATHRELEE
IE (GDP)PTEU
Euro AreaSK
HUSI
FRBEESCZ
MTITLT
IE (GNI*)RO

Government of Ireland Summer Economic Statement 2021 - summary
Table 2: Budgetary strategy
2021 2022 2023 2024 2025
Expenditure ceiling 90.7 88.2 85.1 89 93.2
Total budget package 5.5 4.7 4.5 4.8 5.0
Budgetary decisions* 3.2 3 3.2 3.4
Yet to be allocated** 1.5 1.5 1.6 1.6
of which: tax measures 0.5 0.5 0.5 0.5
Voted spending
Temporary 14.8 8.1 1 0.7 0.5
Permanent 75.9 80.1 84.1 88.3 92.8
Growth in permanent spending, per cent 7.8 5.5 5 5 5
Core current 66.1 69.2 72.4 75.7 79.3
Core capital 9.8 10.9 11.7 12.7 13.4
Change in core capital 0 1.1 0.8 1 0.8
GGB, per cent GDP -5.1 -3.4 -1.8 -1.6 -1.5
GGB, per cent of GNI* -9.4 -6.2 -3.3 -3 -2.8
Source: Department of Finance *ELS, demographics, NDP and public pay **to fund enhanced public services and social welfare package Note: Rounding may affect totals.

Government of Ireland Summer Economic Statement 2021 - summary
Figure 5: a) General government debt-to-income; b) Interest-to-revenue ratios
Source: CSO and Department of Finance.
0
20
40
60
80
100
120
140
160
180
20
10
20
11
20
12
20
13
20
14
20
15
20
16
20
17
20
18
20
19
20
20
20
21
20
22
20
23
20
24
20
25
General Government Debt-to-GDP
General Government Debt-to-GNI*
SGP Threshold
0
2
4
6
8
10
12
14
20
10
20
11
20
12
20
13
20
14
20
15
20
16
20
17
20
18
20
19
20
20
20
21
20
22
20
23
20
24
20
25
forecast

Government of Ireland Summer Economic Statement 2021 - summary
Figure 6: Capital expenditure, 2019-2025, € billions and per cent of GNI*
Source: Department of Public Expenditure and Reform.
0.0%
1.0%
2.0%
3.0%
4.0%
5.0%
6.0%
0.0
2.0
4.0
6.0
8.0
10.0
12.0
14.0
16.0
2019 2020 2021 2022 2023 2024 2025
Gross Voted Capital Expenditure (incl NRRP), Bn % GNI*

Government of Ireland Summer Economic Statement 2021 - summary
Tithe an Rialtas, Sráid Mhuirfean Uacht, Baile Átha Cliath 2, D02 R583, Éire Government Buildings, Upper Merrion Street, Dublin 2, D02 R583, Ireland T:+353 1 676 7571 @IRLDeptFinance www.gov.ie/finance