Visualizing the Bureau of Labor Statistics Employment Dataset by Siva Mohan and Curran Kelleher.

Visualizing Data and Summary Statistics
Introduction to Evolution and Scientific InquiryDr. Spielman; [email protected]

Quantitative vs. Categorical variables
● Quantitative variables are described by data as numbers○ Height of a plant○ Number of legs on an octopus○ Length of gestation time
● Categorical variables are described by data as categories ○ Colors ○ Species names○ iPhone models

There are two types of quantitative data
● Continuous○ Any real-number value within some range○ Example: height, weight, ○ If it can be a decimal, it is continuous
● Discrete (also known as discontinuous in book)○ Values are in indivisible units, i.e. whole or counting numbers○ "Count data"○ If it can NOT have a decimal (i.e. there are not 2.5 people), it is discrete
● Note: discreet is different.

How we represent data depends on what kind it is
Histogram Boxplot Bar plot Scatterplot
Visualize quantitative data Visualize categorical data*
Visualize how two quantitative variables relate
*Commonly used for quantitative data as well, but it “shouldn’t be”
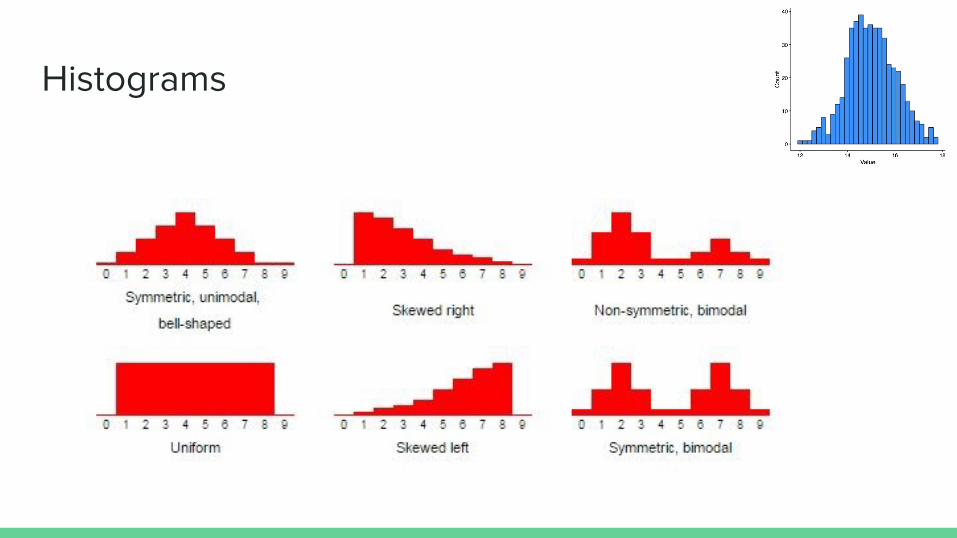
Histograms

Boxplots

Boxplots vs. histograms

Barplots
In my garden, there are…
● 18 orange flowers● 37 pink flowers● 62 red flowers● 15 white flowers

Barplots for quantitative data
Height of bar = meanLength of tick = 2*standard deviation (usually!)

Barplots can be very misleading though!
Mean
std dev

Scatterplots
● X-axis shows independent variable
● Y-axis shows dependent (response) variable

Describing the location of a distribution
● Location is a fancy word for “center”○ Mean and median for quantitative data○ Mode for categorical data

Describing the spread of a distribution
● Range○ 1, 2, 3, 7, 9 → 8○ 1, 2, 3, 7, 9, 500 → 499
● Standard deviation○ Variance = s2
● Interquartile Range (IQR)○ Middle 50% of the numbers (goes with median)

Comparing spreads of two different distributions

A note on the word population
● In biology, a population is group of organisms of a single species who live around the same area
● In statistics, a population is total set of observations, data points, etc. that can be made
○ Except in a few cases, we generally never know the population

Statistical Inference: Does my sample represent the true population?

How well does my sample represent the population?
● Standard Error: The distance between my measured statistic and the true population parameter
● SEM = Standard Error of the Mean

Standard deviation vs standard error
● Standard Deviation: how does the sample vary around the sample mean?○ Low SD = very narrow○ High SD = lots of spread
● Standard error of the mean: how does the sample mean compare to the population mean?
○ Low SEM: sample mean is very close to “true” mean○ High SEM: sample mean is very far from “true” mean○ Generally larger sample size yields lower SEM

Describing relationships between quantitative variables● One common measure is correlation● The Pearson Correlation Coefficient: -1 <= r <= 1

Major Correlation Caveats
● Linear relationship only! (for now)○ Curves use different types of correlation coefficients
● CORRELATION 👏 IS 👏 NOT 👏 CAUSATION 👏○ http://www.tylervigen.com/spurious-correlations

Explore quantitative data visualization
https://sjspielman.shinyapps.io/plot-iris/
http://guessthecorrelation.com/