Summary Report submitted for the HCS Approach Peer Review...
61
1 Summary Report submitted for the HCS Approach Peer Review Process HCS Study Project Title: Carbon Stock Assessment of PT Musim Mas (PT MM) Company/Organisation: PT Gagas Dinamiga Aksenta dan PT Musim Mas Contact person: Dr. Gan Lian Tiong Date: July 27, 2018
-
Upload
doannguyet -
Category
Documents
-
view
214 -
download
0
Transcript of Summary Report submitted for the HCS Approach Peer Review...

1
Summary Report submitted for the HCS Approach Peer Review Process
HCS Study Project Title:
Carbon Stock Assessment of
PT Musim Mas (PT MM)
Company/Organisation: PT Gagas Dinamiga Aksenta dan
PT Musim Mas
Contact person: Dr. Gan Lian Tiong
Date: July 27, 2018

2
Table of Contents
1. Project description ......................................................................................................................................... 4
1.1 Location and size of study area ....................................................................................................................... 4
1.2 Overview of proposed plantation development............................................................................................. 5
1.3 Description of surrounding landscape ............................................................................................................ 8
1.4 Map of the site within the region ................................................................................................................... 9
1.5 Relevant data sets available .......................................................................................................................... 10
1.6 List of any reports/assessments used in the HCS assessment ...................................................................... 11
2. HCS assessment team and timeline ............................................................................................................... 12
2.1 Names and qualifications .............................................................................................................................. 12
2.2 Time period for major steps in the study...................................................................................................... 13
3. Community engagement/ FPIC ..................................................................................................................... 14
3.1 Summary of community engagement, FPIC, participatory mapping ............................................................ 14
3.2 Summary of Social Impact Assessment......................................................................................................... 22
4. High Conservation Value assessment ............................................................................................................ 27
4.1 Summary and link to public summary report ............................................................................................... 27
5. Environmental Impact Assessment ............................................................................................................... 34
5.1 Summary ....................................................................................................................................................... 34
6. Land cover image analysis ............................................................................................................................ 36
6.1 Area of Interest and how it was defined....................................................................................................... 36
6.2 Description of images used for classification ................................................................................................ 38
6.3 Sample image ................................................................................................................................................ 38
6.4 Method of stratification and software used ................................................................................................. 38
6.5 Map of initial vegetation classes, with legend .............................................................................................. 39
6.6 Table of total hectares per vegetation class ................................................................................................. 42
6.7 Summary of which areas are potential HCS forest, subject to further analysis ........................................... 42
7. Forest inventory results ................................................................................................................................ 44
7.1 Inventory sample design and plot rational ................................................................................................... 44
7.2 Map indicating plots ..................................................................................................................................... 45
7.3 Forest inventory team members and roles .................................................................................................. 45
7.4 Methodology used for forest sampling......................................................................................................... 46
7.5 Methodology used for carbon calculations .................................................................................................. 47
7.6 Indicative photos of each vegetation class ................................................................................................... 48

3
7.7 Statistical analysis (allometric used, confidence tests, justification) ............................................................ 52
7.8 Summary of statistical analysis of carbon stock results per vegetation class .............................................. 54
7.9 Forest inventory results ................................................................................................................................ 54
8. Land Cover Classification .............................................................................................................................. 56
8.1 Refined land cover map with title, date, legend and any HCS forest patches identified ............................. 56
9. Patch Analysis Result .................................................................................................................................... 57
9.1 Results of Decision Tree ................................................................................................................................ 57
9.2 Comments on Decision Tree outcome (including pre-RBA and RBA results) ............................................... 59
10. Indicative Land Use Plan ............................................................................................................................. 60
10.1 Summary of results of final ground verification ........................................................................................... 60
10.2 Final HCS map ............................................................................................................................................... 60
10.3 Overview of forest conservation management and monitoring activities to be included in the
Conservation and Development (land use) Plan ...................................................................................................... 61
10.4 List of activities still to be carried out before Conservation and Development Plan can be finalised ......... 61

4
1. Project description 1.1 Location and size of study area
PT Musim Mas (PT MM) is an oil palm plantation that administratively situated in Pangkalan Kuras (Betung Village,
Talau Village, Tanjung Beringin, and Batang Kulim Village) and Pangkalan Lesung Sub District (Pesaguan Village and
Pangkalan Lesung Village), Pelalawan District, Riau Province, Republic of Indonesia. The location of PT MM in the
map of Indonesia is presented in Figure 1.
The concession of PT MM area is situated at 0°6'19.79" LU - 0°8'9.23" LS and 101°56'17.09" - 102°7'15.05" BT, and
geographically between Kampar River and Indragiri River, more precisely it is located in the upper stream of Nilo
River which is a tributary of Kampar River.
PT MM has one nucleus, two KKPA and five Kas Desa. The total concession area of PT Musim Mas (nucleus) is
28,333.10 ha. Total planted area in PT Musim Mas (nucleus) is 23,801.43 ha, KKPA Merbau Sakti is 1,066.13 ha,
KKPA Rawa Tengkuluk is 802 ha, KKPA Betung is 157.98 ha and 17 ha for Kas Desa (total 5 Kas Desa). The total HCV
area in PT Musim Mas (nucleus) is 1,448.47 ha. HCV management plan has been developed for these areas and
implementation is on-going. PT Musim Mas has been certified by RSPO, certified on 6th January 2009 and the KKPA
certified on 2nd March 2011. Recertification (for second 5 years) was succssfully completed on 6th January 2014.
Figure 1. The Location of PT MM in the map of Indonesia

5
Figure 2. The location of PT MM in the map of Riau Province.
1.2 Overview of proposed plantation development
The permits that have been obtained by the company are inclusive of, Social Environment Impact Assessment
(AMDAL), the Plantation Business Permit (Izin Usaha Perkebunan) and Land Title (HGU). The followings are the list
of the licenses and recommendations that have been obtained by PT MM:
Table 1. Types of permits and recommendations PT Musim Mas
No Licenses and
recommendations Issued by Number and date Note
1 Deed of Establishment Notary M. Sutan Nasution No. 40 Date: 21 June 1972
2 Adjustment Article of
Association Notary Hustiati, SH No. 105 Date: 19 May 2008

6
No Licenses and
recommendations Issued by Number and date Note
3 Taxpayer Notification
Number
Tax Serve Office, Medan
(Directorate General of
Taxation, Medan Regional
Office)
01.100.016.3-092.000
4 Location Permit (Izin Lokasi)
Riau Governor No. KPTS.52/I.L-VI/1991 dated
on 29 June 1991 12,000 Ha
Head of National Land Bureau
(BPN) Kampar District
No.KPTS.29/KP/XI/1994 dated
on 8 November 1994 with
extension
9,000 Ha
No.KPTS.67/KP/X/1996 dated on
07 October 1996 5,331 Ha
No.KPTS.68/KP/X/1996 dated on
07 October 1996 3,775 Ha
Head of National Land Bureau
(BPN) Kampar District
No. KPTS.69/KP/X/1996 dated
on 7 October 1996 399 Ha
Head of National Land Bureau
(BPN) Kampar District
No. KPTS.73/KP/XIV/1996 dated
on 28 November 1996 9,500 Ha
Head of National Land Bureau
(BPN) Kampar District
No. 15/460/60-62.ZN-ZP/03.97
dated on 20 March 1997 4,400 Ha
5 Forest Release Ministry of Forestry 478/Kpts-II/1990 20 September
1990 30,560.25 Ha
6
Social Environment
Impact Assessment
(AMDAL)
Environmental Impact
Management Agency
Pelalawan District
660/Bapedalda/2006 dated on
July 2006
Environmental Impact
Management Agency
Pelalawan District
KPTS.660/BLH/2011/451 dated
on 14 October 2011
7 Plantations Business Permit
(IUP)
Chief Investment Coordination
Agency
No.616/T/PERKEBUNAN
INDUSTRI/1999/ dated on 23
November 1999
Chief Investment Coordination
Agency
No.30/1/IU/II/PMDN/INDUTRI/2
010 dated on 01 July 2010
Pelalawan Regent
IUP No.
Kpts.525/Disbun/2009/238
Dated on 7 April 2009
8 Land Use Title
(HGU)
Agrarian State Minister / No 03 dated on 01 June 1994 3,383.2 Ha
Head of BPN No 04 dated on 01 June 1994 3,788.4673 Ha
Agrarian State Minister / No 05 dated on 01 June 1994 1,956.4294 Ha

7
No Licenses and
recommendations Issued by Number and date Note
Head of BPN No 01 dated on 02 April 1997 3,775 Ha
Agrarian State Minister / No 02 dated on 02 April 1997 5,331 Ha
Head of BPN No 03 dated on 02 April 1997 399 Ha
Agrarian State Minister / No 01 dated on 21 November
1997 9,700 Ha
PT MM is part of Musim Mas Group which has committed to production of sustainable palm oil following the RSPO
sustainability management system. PT MM has conducted the High Conservation Value (HCV) Assessment, Social
Environment Impact Assessment (AMDAL) and Social Impact Assessment (SIA). The HCV assessment in PT MM was
conducted in September 2007 by independent Assessor, Aksenta. A HCV re-assessment was also conducted by
Aksenta in May 2015, the team leader from Aksenta have been licensed by the HCV Assessor Licensing Scheme,
where the report of HCV has been satisfactory in HCVRN (https://www.hcvnetwork.org/als/public-summaries). In
conjunction with the HCV re-assessment, land use change analysis (LUCA) was also conducted using satellite data,
field assessment and verification with the FPIC document for land use right compensation. PT MM has already had
the environmental management and monitoring (RKL/RPL) since July 1997 and the SEIA was conducted in July
2006. Due to increase POM capacity, PT MM then conducts new SEIA in September 2011 by CV Tri Unggul
Konsultan. “The SIA was conducted by Aksenta in June 2007 and the social management have been developed and
implemented, this is a part of the social updated.
The summary of results from HCV assessments within the PT MM concession by HCV Assessor Licensing Scheme
showed four out of six high conservation values areas, namely HCV 1, HCV 3, HCV 4, HCV 6 are present in PT MM
concession. The important element of HCV 1 is significant concentrations of species RTE (presence of Manis
javanicus, Batagur affinis, Hylobates agilis, Scleropages formosus) at regional level and corridor of Sun Beer
(Helarctos malayanus). The important element of HCV 3 is ecosystem of peat swamp forest. The HCV 4 related with
basic ecosystem for significant erosion control area. Lastly, HCV 6 is sacred graveyard (Makam Puteri Bungsu
Berdarah Putih).
The result of SIA and ESIA shows that in general, the positive findings of PT MM’ existence provides financial
contributions to the regency area and national development generally through taxes and retributions instrument.
Infrastructure improvement such as transportation access, health care service and education are positive
contributions from the existence of large-scale investment. At the local level, the management provides the
opportunity to build partnership with local village community in the form of smallholders’ scheme system (KKPA &
Kas Desa village oil palm development) and many social support types to local village community.
The potential negative social impact is related to the company’s operations such as, the rivers which are used by
the village communities may be polluted by the company’s activities. Nevertheless, the outcomes of SIA are aimed
at supporting the functions of production sustainability.

8
Musim Mas Group became a member of the POIG in November 2015. Adhering to the requirement of POIG
Verification done in 2017, Musim Mas Group has started to align the current CSA assessment with regards to
conducting field verification, participative mapping and patch analysis following the HCSA toolkit. The PT MM HCS
Summary Report is presented herewith. PT MM has conducted water accountabiliy analysis following the Water
Footprint model by the Water Footprint Network. This is part of PT MM’s commitment to the POIG Charter.
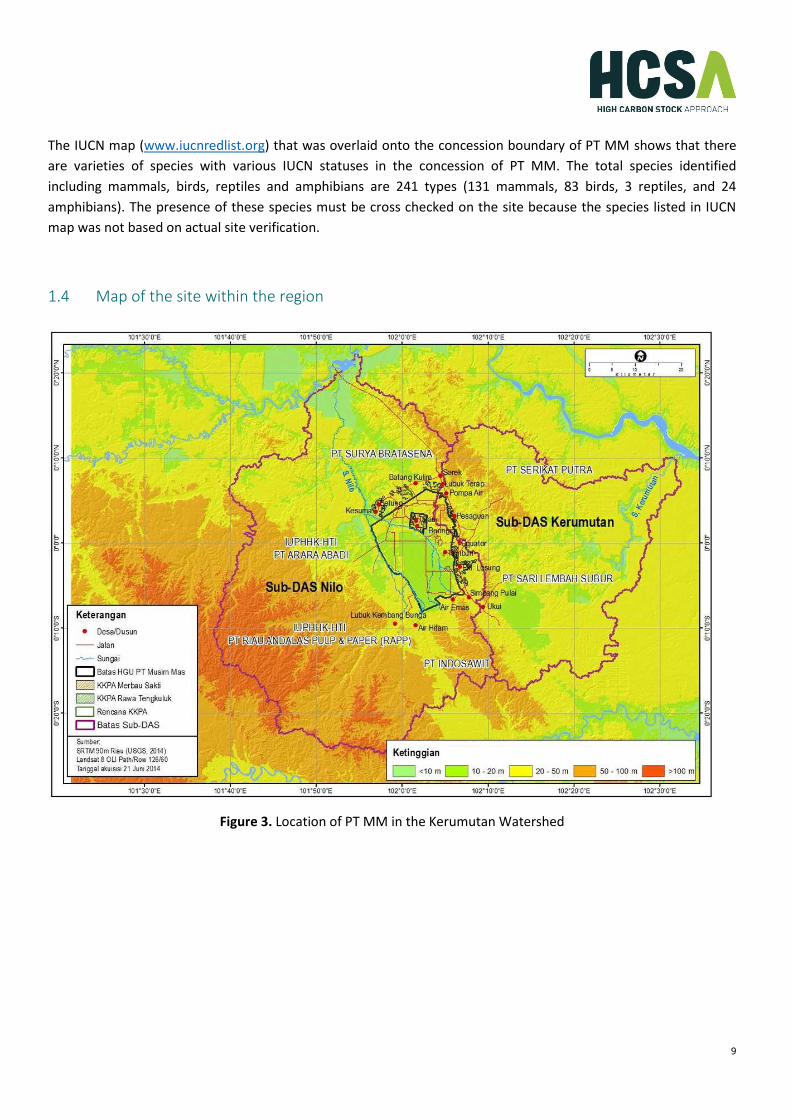
1.3 Description of surrounding landscape
The concession of PT MM is situated in the Nilo Sub-Watershed as defined by the Minister of Environment and
Forestry of Indonesia. The forest cover which is assessment based on the Hansen (2015) forest cover data set
shows that the Nilo Sub-Watershed has forest cover less than 30%, based on this we can conclude that PT MM is
situated in low forest cover landscape.
The concession is not located in the IBA (Important Bird Areas). The nearest IBA is Siak-Kampar Forest Peat Swamp,
located approximately 40 km in the east. The concession also not located in Ramsar area. The nearest conservation
areas are Tesso Nilo National Park (TNTN) located approximately 10 km in the southwest and Kerumutan Wildlife
Reserve which located approximately 35 km in the east of PT MM. TNTN which is the nearest conservation area has
no connectivity to the concession of PT MM. This is because, between the concession of PT MM and TNTN, there
are another concession namely PT RAPP and PT Arara Abadi and also several villages namely Lubuk Kembang Bunga
Village and Air Hitam Village. Nevertheless, Nilo River from TNTN flows through towards PT MM concession, in
which Nilo River is located in the western border of the concession area. In general, the surrounding area of PT MM
has been developed into Palm oil and acacia plantation.
From all animal species in which the presence was identified in the concession, 13 of them are listed in the Red List
IUCN 2014 with various statuses such as Critically Endangered, Endangered and Vulnerable. Those animals are
Sunda pangolin (Manis javanicus, CR), Southern river terrapin (Batagur affinis, CR), Agile gibbon (Hylobates agilis,
EN), Asian arowana (Scleropages formosus, EN), Sun bear (Helarctos malayanus, VU), Southern pig-tailed macaque
(Macaca nemestrina, VU), Sunda slow loris (Nycticebus coucang, VU), Sambar deer (Rusa unicolor, VU), Asian small-
clawed otter (Aonyx cinerea, VU), False gharial (Tomistoma schlegelii, VU), King cobra (Ophiophagus hannah, VU),
Asiatic softshell turtle (Amyda cartilaginea, VU), and Amboina box turtle (Cuora amboinensis, VU). The area is also
known as part of the Sumatran Tiger distribution area (Panthera tigris sumatrae-CR), Sumatran Elephant (Elephas
maximus sumatranus-CR) and Tapir Malaya (Tapirus indicus-EN) (IUCN, 2015). The management and monitoring
plan for those and other species has been developed. The results of wildlife monitoring indicate that these three
species are no longer present in the area.
Six of the thirteen species namely Southern river terrapin, Asian arowana, Asian small-clawed otter, False gharial,
Asiatic softshell turtle, and Amboina box turtle are related closely to aquatic environment such as rivers and peat
forest. The other species are terrestrial animal in which their livelihoods depend on the natural vegetation. The
remaining natural vegetation in the concession area is the riparian peat scrub along Napo River and the scrub on
the western concession.
9
The IUCN map (www.iucnredlist.org) that was overlaid onto the concession boundary of PT MM shows that there
are varieties of species with various IUCN statuses in the concession of PT MM. The total species identified
including mammals, birds, reptiles and amphibians are 241 types (131 mammals, 83 birds, 3 reptiles, and 24
amphibians). The presence of these species must be cross checked on the site because the species listed in IUCN
map was not based on actual site verification.
1.4 Map of the site within the region
Figure 3. Location of PT MM in the Kerumutan Watershed
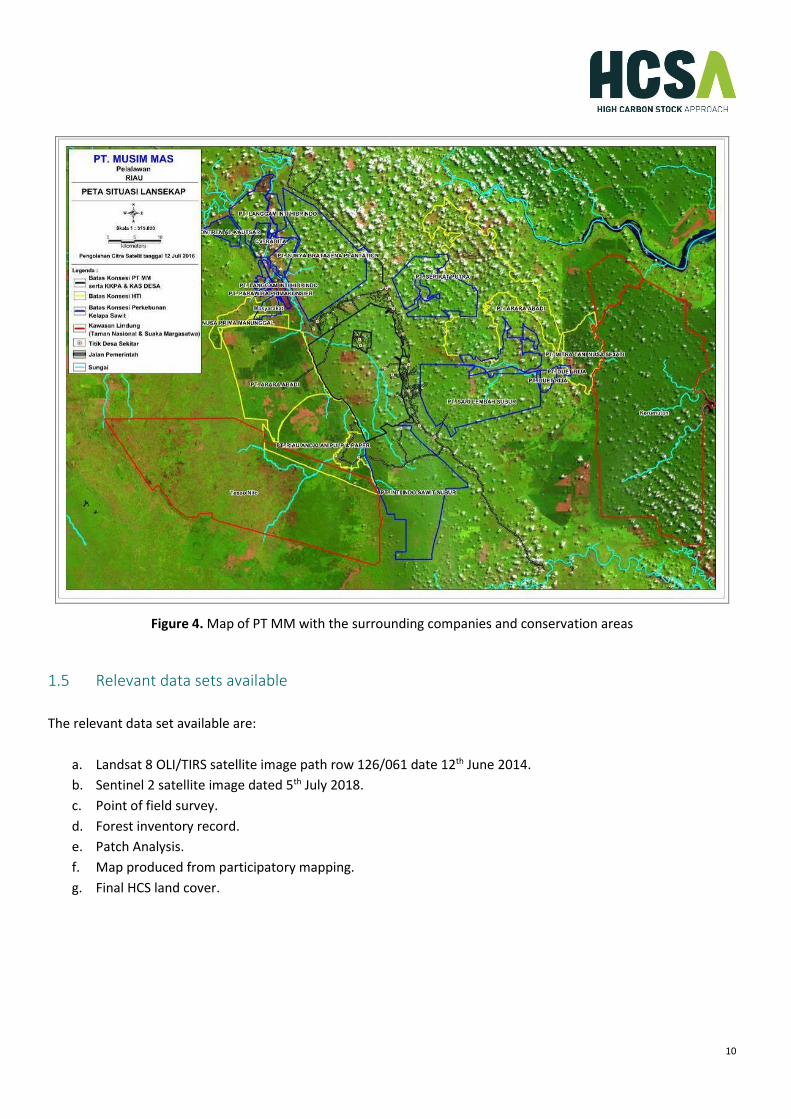
10
Figure 4. Map of PT MM with the surrounding companies and conservation areas
1.5 Relevant data sets available
The relevant data set available are:
a. Landsat 8 OLI/TIRS satellite image path row 126/061 date 12th June 2014.
b. Sentinel 2 satellite image dated 5th July 2018.
c. Point of field survey.
d. Forest inventory record.
e. Patch Analysis.
f. Map produced from participatory mapping.
g. Final HCS land cover.
11
1.6 List of any reports/assessments used in the HCS assessment
The HCS Assessment is a series of processes in which combining a number of data and information that are related
to each other. The information used in the HCS assessment process comes from:
a. Social and Environmental Impact Assessment report (AMDAL) PT MM.
b. High Conservation Value (HCV) assessment report PT MM.
c. Social Impact Assessment (SIA) report PT MM.
d. Participatory Mapping PT MM.
e. Carbon Stock Assessment report PT MM.
12
2. HCS assessment team and timeline 2.1 Names and qualifications
The HCS assessment was conducted by PT Gagas Dinamiga Aksenta or known as Aksenta, with Pak Anwar Muzakkir
as its team leader. The team members were consisting of three people that have expertise in remote sensing,
carbon measurement and biodiversity. Aksenta was not a Registered Practitioner Organization at the time of
assessment, but at the time this report is written, PT Aksenta is already listed as a Registered Practitioner
Organization.
The high carbon stock assessment in PT MM was conducted before the HCSA toolkit and other HCSA secretariat
requirements were determined. The HCSA procedure that was first introduced in December 2015 required that the
HCS assessment team be led by HCSA Registered Practitioner from Registered Practitioner Organization and at least
two people from the HCS team are Registered Practitioner. These conditions cannot be fulfilled because there was
no such scheme yet when Aksenta was appointed to conduct the CSA in May 2015. Nevertheless, all the team
members have the required skill and experience in Carbon Stock Assessment. The education background,
experience and role of each team member are as follow:
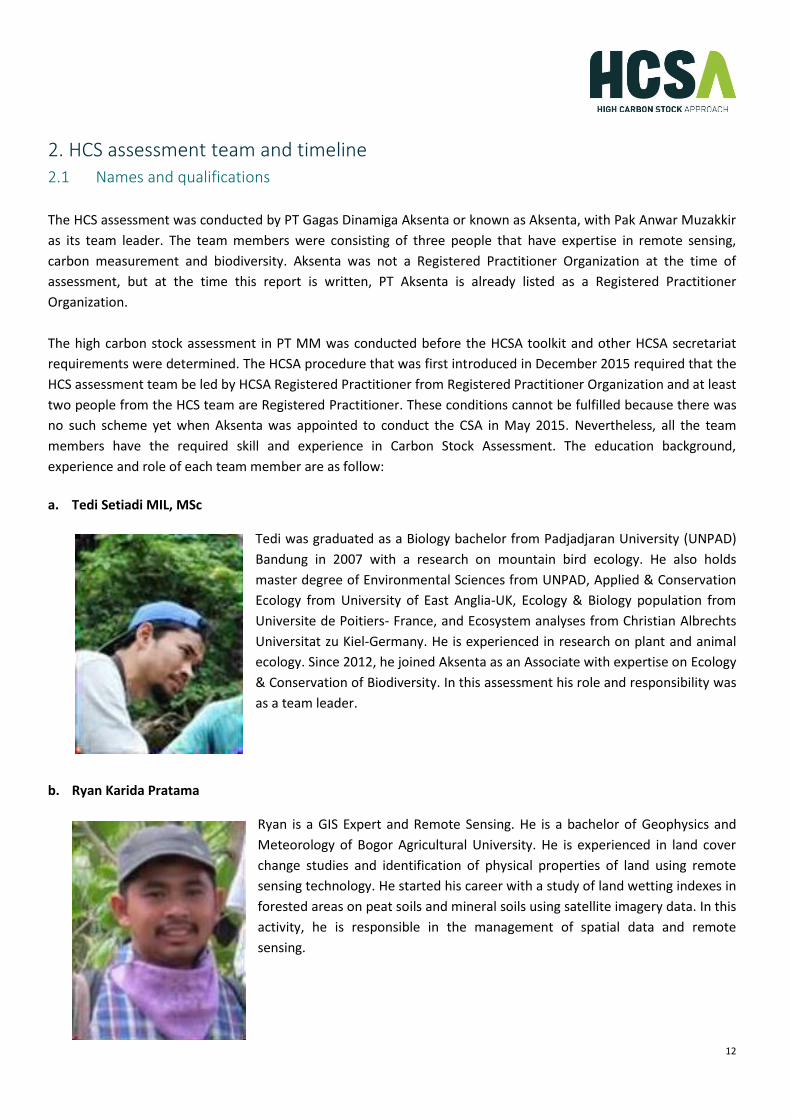
a. Tedi Setiadi MIL, MSc
Tedi was graduated as a Biology bachelor from Padjadjaran University (UNPAD)
Bandung in 2007 with a research on mountain bird ecology. He also holds
master degree of Environmental Sciences from UNPAD, Applied & Conservation
Ecology from University of East Anglia-UK, Ecology & Biology population from
Universite de Poitiers- France, and Ecosystem analyses from Christian Albrechts
Universitat zu Kiel-Germany. He is experienced in research on plant and animal
ecology. Since 2012, he joined Aksenta as an Associate with expertise on Ecology
& Conservation of Biodiversity. In this assessment his role and responsibility was
as a team leader.
b. Ryan Karida Pratama
Ryan is a GIS Expert and Remote Sensing. He is a bachelor of Geophysics and
Meteorology of Bogor Agricultural University. He is experienced in land cover
change studies and identification of physical properties of land using remote
sensing technology. He started his career with a study of land wetting indexes in
forested areas on peat soils and mineral soils using satellite imagery data. In this
activity, he is responsible in the management of spatial data and remote
sensing.
13
c. Reza Abdillah
Reza Abdillah S. Hut. He has an educational background of forest resource
conservation and ecotourism from Bogor Agricultural University. He is
experienced in GIS and remote sensing techniques for conservation biology and
land use issues. He did some research in spatial analysis & spatial modelling and
land cover analysis using GIS technique and remote sensing. Currently he works
as a GIS Specialist in Aksenta. In this assessment, his role and responsibility was
as a GIS expert, data collection of ground cover biomass and soil organic carbon
and spatial data management and remote sensing.
2.2 Time period for major steps in the study
High carbon stock assessments are conducted through a series of activities. The series of processes are as follows:
a. HCV Assessment PT MM by PT Gagas Dinamiga Aksenta: September 2007.
b. Social Impact Assessment PT MM by PT Gagas Dinamiga Aksenta: June 2010.
c. HCV Re-assessment PT MM by PT Gagas Dinamiga Aksenta: May 2015.
d. Carbon Stock Assessment PT MM by PT Gagas Dinamiga Aksenta: June 2015.
e. Verification and Participatory Mapping conducted by PT MM Team on October 2017 – June 2018.
f. Patch analysis decision tree conducted by PT MM Team on July 2018.

14
3. Community engagement/ FPIC 3.1 Summary of community engagement, FPIC, participatory mapping
FPIC Process
As part of the process of Free, Prior and Informed Consent (FPIC), procedures to ensure that there is participation
in the social and environmental harmony in the operation and development of the oil palm planting project by PT
MM, consultation with the relevant stakeholders is to provide opportunities for communication and sharing the
information/opinion/suggestions between the PT MM and the affected stakeholders to move forward for the
benefit and common progress. PT MM has established standard operating procedures for stakeholder consultation,
stakeholder’s engagement, land acquisition and compensation procedures based on the principle of free, prior and
informed consent. The company also has established the complaint and grievance procedures so that the problem-
solving process is done through discussion and mutual deliberation.
Based on the requirement of the Free Prior and Informed Consent (FPIC), the land acquisition process should
involve local communities from the very beginning of the palm oil plantation development plan. This is important
to ensure that the local community understands the purpose and impacts to them, whether positive or negative,
before giving consent to the land acquisition. The FPIC processes that have been carried out by PT MM are:
1. Preliminary key stakeholder engagement
As a preliminary engagement the management of PT MM has carried out formal and informal engagement to
key stakeholders such as head of villages, traditional leaders and any public figures. Formal engagement was
carried out by inviting the stakeholder into a stakeholder meeting, whereas informal engagement is more to
open discussion when the general affair team meets with the related stakeholder. The objectives of this
activities were to get an idea about the social condition of the local communities, about the perception of the
local communities to PT MM and identify any improvement need to be made before PT MM start their
activities.
2. High Conservation Value, Social Impact Assessment and Carbon Stock Assessment
PT MM has conducted HCV assessment in September 2007. The assessment was conducted by a consultant
team from PT Gagas Dinamiga Aksenta (Aksenta) which is an assessment team that has been recognized by
RSPO (RSPO Approved HCV Assessor). The HCV assessment was conducted based on the Toolkit for
Identification of High Conservation Value Areas, 2003. The study was conducted for the location permit area of
PT MM and surrounding villages. A HCV re-assessment was also conducted by Aksenta in May 2015, which
covers the nucleus and the smallholders. The team leader from Aksenta has been licensed by the HCV Assessor
Licensing Scheme, where the report of HCV has been declared as satisfactory by the HCV Resource Network
(https://www.hcvnetwork.org/als/public-summaries). Summary of HCV assessment is discussed in Chapter 4.
PT MM has also conducted a social impact assessment in September 2007. The social impact assessment was
conducted by an independent consultant who has competence in social impact assessment, namely PT Gagas
Dinamiga Aksenta (Aksenta). The study included a location permit covering an area of PT MM and its
surrounding villages. The summary of SIA is discussed in Chapter 3.2.
15
In June 2015, PT MM conducted a carbon stock assessment. The assessment was also conducted by PT Gagas
Dinamiga Aksenta (Aksenta). The purpose of the assessment was to measure the potential carbon stock in the
undeveloped area of PT MM and map its distribution.
3. Environmental and Social Impact Assessment
The development of PT MM palm oil plantation is realized to have an impact to the physical, chemical,
biological, social, economic, cultural and public health of local communities around the concession of PT MM,
both positive and negative impacts. To know the possible impacts of the development of PT MM plantations, a
social and Environmental and Social Impact Assessment or better known as AMDAL was conducted for PT MM.
The AMDAL assessment activity was conducted in September 2011 by CV Tri Unggul Konsultan. Preparations of
Environmental Impact Assessment (ANDAL) of PT MM plantation activities are based on the Regulation of State
Minister of Environment Number 08 Year 2006 About Guideline of Preparation of Environmental Impact
Analysis and other related regulations. The detailed information of environmental and social impact
assessment is discussed in chapter 5.
4. Stakeholder Consultation
The stakeholder consultation is conducted regularly with local community in respective villages. The
consultation is held to collect the aspirations and inputs from the stakeholders and as a means of
communication with the stakeholder especially local community.
Based on the engagement that has been conducted by PT MM, in general the local communities around the
concession of PT MM support the operation of PT MM. In the regular stakeholder consultation (SHC) PT MM
allows all the participants to ask questions, provide feedback or share their experience. The local community
can also write their question if they feel embarrassed to speak, they can also come to the office to meet the
management of PT MM. Beside the formal SHC, PT MM also have complained and grievance procedure that
can be accessed by anyone. PT MM also has General Affair teams on the field who can help the local
communities to pass their enquiries to the management of PT MM. All the concerns and feedbacks are
collected and used to develop the social management plan of PT MM.
In general, communication and relations with the community villages have been well established, the presence
of the company is accepted by the community and has a positive impact on the development of the
surrounding community such as employment, economic development, CSR programs, smallholders’ scheme
(KKPA) and village garden development program (Kebun Kas Desa). Related on the conservation areas (HCV &
HCS), it was seen that generally the communities support for PT MM in the management and development of
sustainable oil palm plantations carried out as well as forest protection / conservation (HCS / HCV) programs
that would be carried out. Support efforts have been implemented as seen in the mutual agreement between
the company and the village in managing the conservation area in a participatory manner. The summary of
responses and feedbacks from the stakeholder are presented in Table 2 below.
16
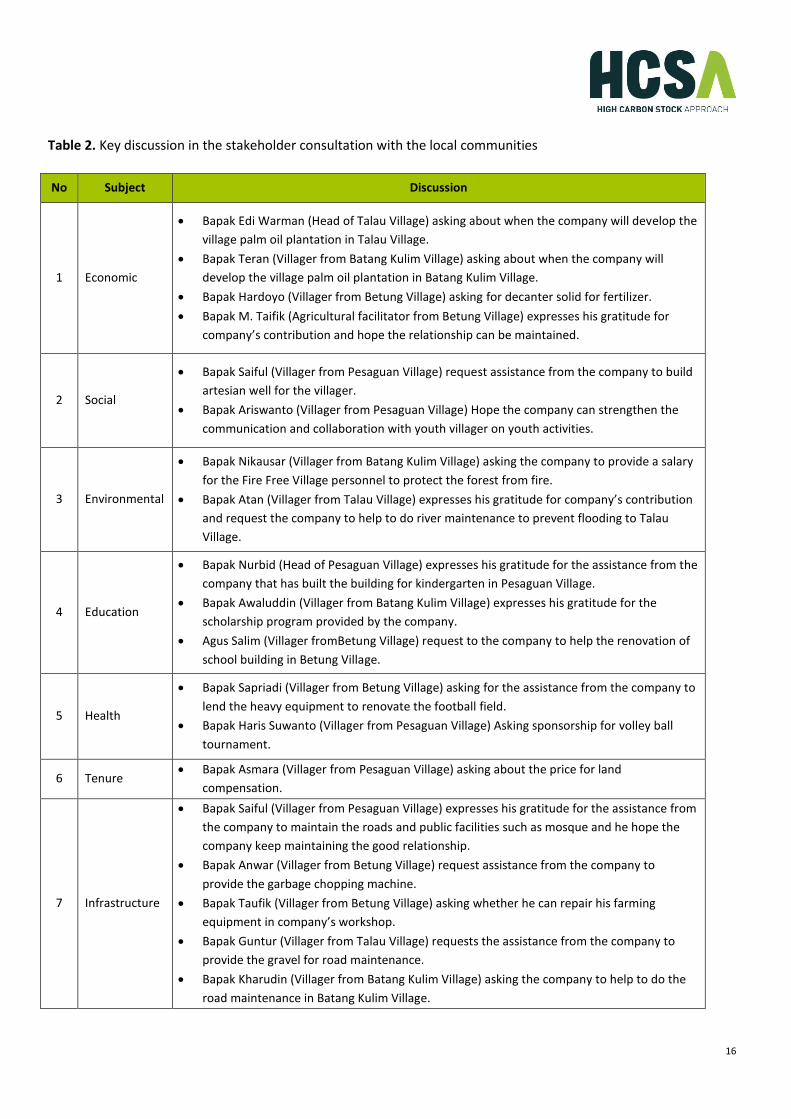
Table 2. Key discussion in the stakeholder consultation with the local communities
No Subject Discussion
1 Economic
• Bapak Edi Warman (Head of Talau Village) asking about when the company will develop the
village palm oil plantation in Talau Village.
• Bapak Teran (Villager from Batang Kulim Village) asking about when the company will
develop the village palm oil plantation in Batang Kulim Village.
• Bapak Hardoyo (Villager from Betung Village) asking for decanter solid for fertilizer.
• Bapak M. Taifik (Agricultural facilitator from Betung Village) expresses his gratitude for
company’s contribution and hope the relationship can be maintained.
2 Social
• Bapak Saiful (Villager from Pesaguan Village) request assistance from the company to build
artesian well for the villager.
• Bapak Ariswanto (Villager from Pesaguan Village) Hope the company can strengthen the
communication and collaboration with youth villager on youth activities.
3 Environmental
• Bapak Nikausar (Villager from Batang Kulim Village) asking the company to provide a salary
for the Fire Free Village personnel to protect the forest from fire.
• Bapak Atan (Villager from Talau Village) expresses his gratitude for company’s contribution
and request the company to help to do river maintenance to prevent flooding to Talau
Village.
4 Education
• Bapak Nurbid (Head of Pesaguan Village) expresses his gratitude for the assistance from the
company that has built the building for kindergarten in Pesaguan Village.
• Bapak Awaluddin (Villager from Batang Kulim Village) expresses his gratitude for the
scholarship program provided by the company.
• Agus Salim (Villager fromBetung Village) request to the company to help the renovation of
school building in Betung Village.
5 Health
• Bapak Sapriadi (Villager from Betung Village) asking for the assistance from the company to
lend the heavy equipment to renovate the football field.
• Bapak Haris Suwanto (Villager from Pesaguan Village) Asking sponsorship for volley ball
tournament.
6 Tenure • Bapak Asmara (Villager from Pesaguan Village) asking about the price for land
compensation.
7 Infrastructure
• Bapak Saiful (Villager from Pesaguan Village) expresses his gratitude for the assistance from
the company to maintain the roads and public facilities such as mosque and he hope the
company keep maintaining the good relationship.
• Bapak Anwar (Villager from Betung Village) request assistance from the company to
provide the garbage chopping machine.
• Bapak Taufik (Villager from Betung Village) asking whether he can repair his farming
equipment in company’s workshop.
• Bapak Guntur (Villager from Talau Village) requests the assistance from the company to
provide the gravel for road maintenance.
• Bapak Kharudin (Villager from Batang Kulim Village) asking the company to help to do the
road maintenance in Batang Kulim Village.
17
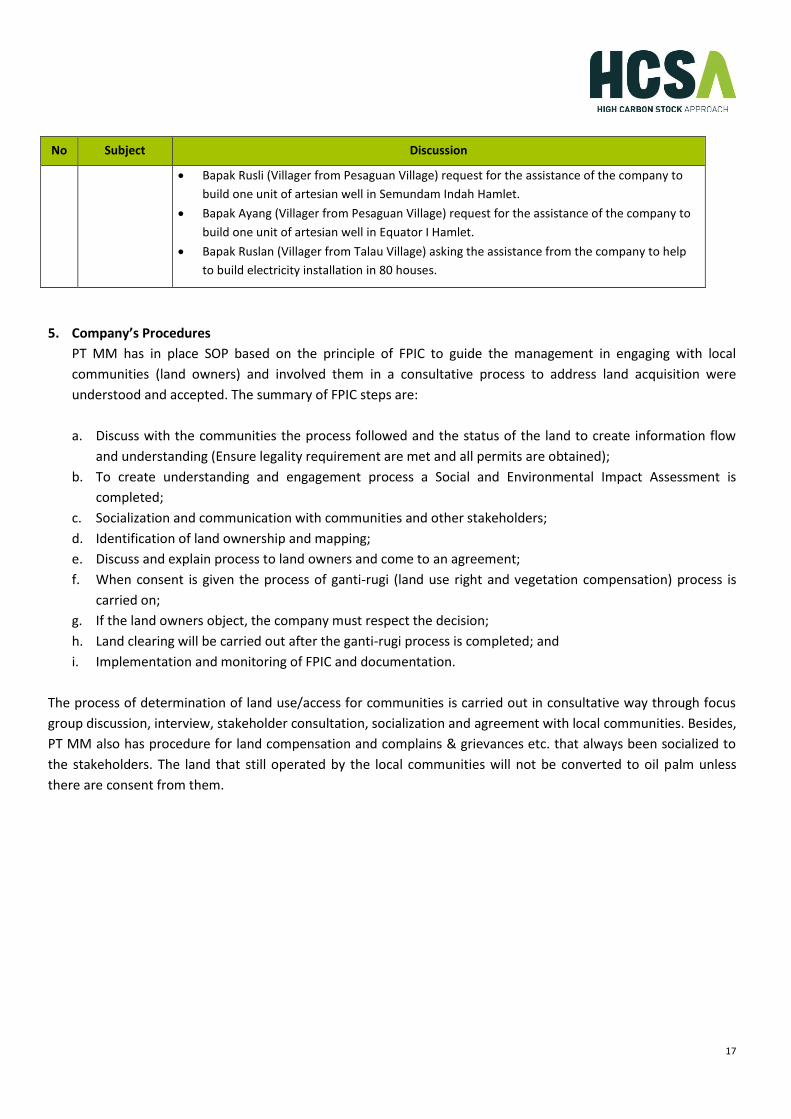
No Subject Discussion
• Bapak Rusli (Villager from Pesaguan Village) request for the assistance of the company to
build one unit of artesian well in Semundam Indah Hamlet.
• Bapak Ayang (Villager from Pesaguan Village) request for the assistance of the company to
build one unit of artesian well in Equator I Hamlet.
• Bapak Ruslan (Villager from Talau Village) asking the assistance from the company to help
to build electricity installation in 80 houses.
5. Company’s Procedures
PT MM has in place SOP based on the principle of FPIC to guide the management in engaging with local
communities (land owners) and involved them in a consultative process to address land acquisition were
understood and accepted. The summary of FPIC steps are:
a. Discuss with the communities the process followed and the status of the land to create information flow
and understanding (Ensure legality requirement are met and all permits are obtained);
b. To create understanding and engagement process a Social and Environmental Impact Assessment is
completed;
c. Socialization and communication with communities and other stakeholders;
d. Identification of land ownership and mapping;
e. Discuss and explain process to land owners and come to an agreement;
f. When consent is given the process of ganti-rugi (land use right and vegetation compensation) process is
carried on;
g. If the land owners object, the company must respect the decision;
h. Land clearing will be carried out after the ganti-rugi process is completed; and
i. Implementation and monitoring of FPIC and documentation.
The process of determination of land use/access for communities is carried out in consultative way through focus
group discussion, interview, stakeholder consultation, socialization and agreement with local communities. Besides,
PT MM also has procedure for land compensation and complains & grievances etc. that always been socialized to
the stakeholders. The land that still operated by the local communities will not be converted to oil palm unless
there are consent from them.
18
Participatory Mapping
In October 2017, PT MM conducted a participatory mapping activity with local community of surrounding villages.
Participatory mapping is defined as a process of making a map by the community aimed at describing the
relationship of land and / or other resources with the community. Participatory Mapping is an important step in
respecting, protecting and realizing local people's rights to Free Prior Informed Consent (FPIC). The right to FPIC is
seen as one of the most important principles in international human rights law to protect indigenous peoples and
local communities.
In its implementation, Participatory Mapping provides not only important benefits in the description of land
relations and / or other resources with related communities, but also can help prevent and mitigate potential land
disputes related to community ownership and utilization of land. From the participatory mapping there has been
obtained several maps, such as land use maps, village boundary maps and land ownership maps.
1. Land use and land use planning
The result of land use identification shows that in general the condition of land cover around PT MM is
monoculture plantation (oil palm and acacia plantations). In addition, there are also cultivated lands that
belong to the local communities. The main commodities that usually planted by the local communities are oil
palm and rubber. Almost the entire area around PT MM has been opened or once occupied by local
community. Natural vegetation can only be found within company’s concessions (conservation areas managed
by PT Arara Abadi and PT Musim Mas). The land use planning map is presented in Figure 5 and the village
boundaries map is presented in Figure 6.
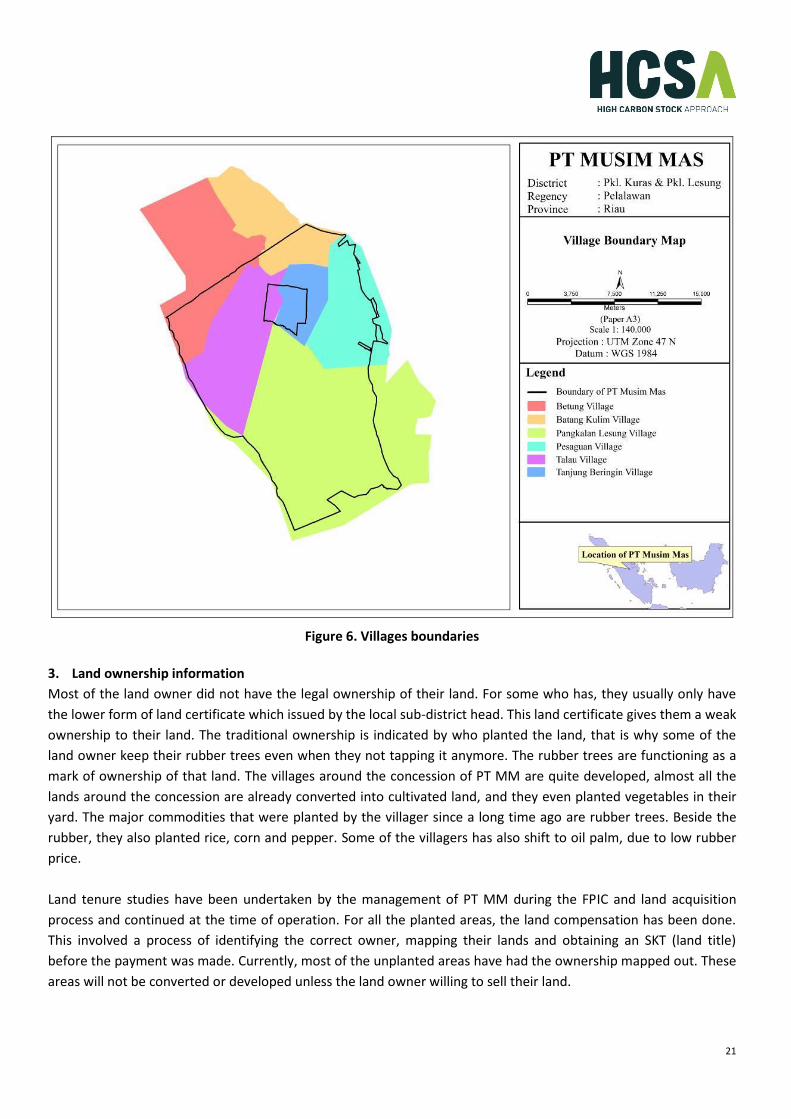
2. Village boundary maps
The participatory mapping activities in PT MM involve six villages surrounding the concession of PT MM. Those
six villages were Betung Village, Batang Kulim Village, Pangkalan Lesung Village, Pesaguan Village, Talau Village
and Tanjung Beringin Village.
The participatory mapping team PT MM consists of people from the operational, general affair, survey and
sustainability team. This company’s participatory mapping team help the villagers to create their own
participatory mapping team. This village’s participatory team is the one who will do the mapping on the field
with the help from company’s participatory mapping team. The company’s participatory mapping team
conduct the training on how to use GPS for mapping activities.
In the participatory mapping activity, the participatory mapping team of PT MM and participatory mapping of
the six villages conduct field visit to determine the indicative boundary of each village. Participatory mapping
team of PT MM and village team were walking together and locate several points as the village edges. All points
that were taken during the filed visit then connected one to another to form indicative village boundary. The
role of the company in this activity is as a facilitator to assist the villages to determine their own village
boundaries. This indicative boundary map can later be used by the government as consideration to set the
definitive boundary for each village. The villages boundaries presented in Figure 6 are still indicative. The PM
activities are intended to assist the government to identify the indicative boundary recognized by the local
communities. The role of the company in this activity is as a facilitator.
19
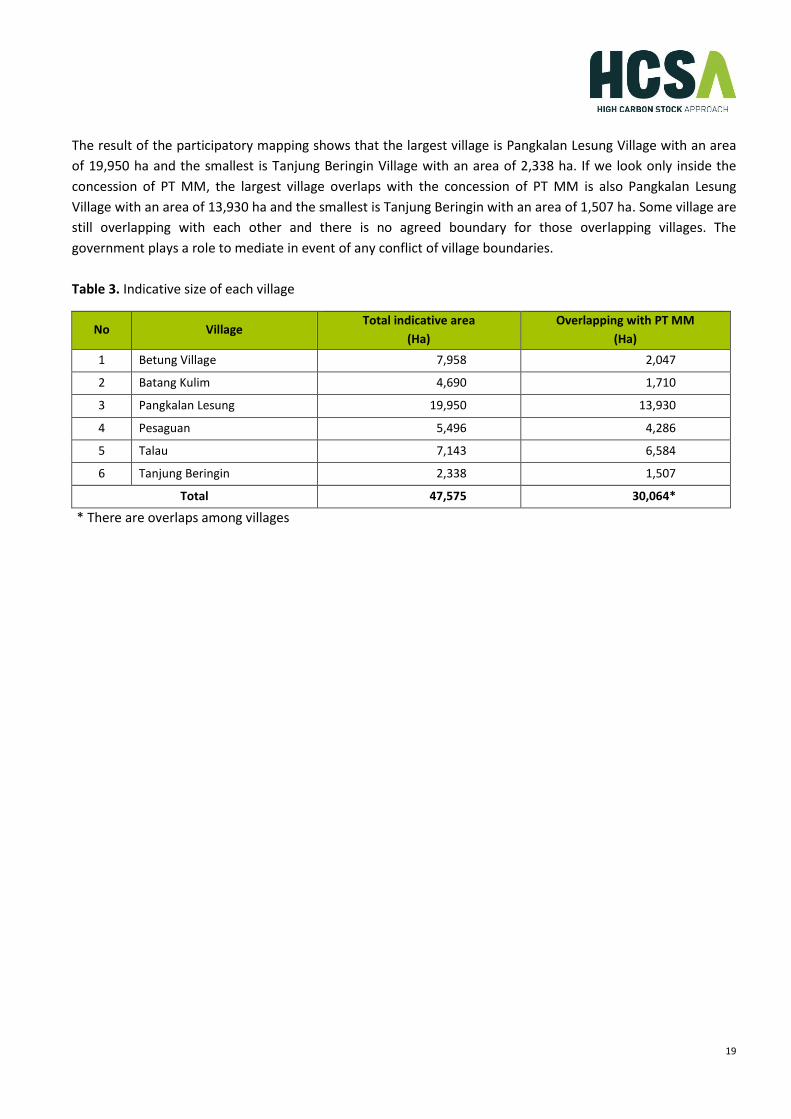
The result of the participatory mapping shows that the largest village is Pangkalan Lesung Village with an area
of 19,950 ha and the smallest is Tanjung Beringin Village with an area of 2,338 ha. If we look only inside the
concession of PT MM, the largest village overlaps with the concession of PT MM is also Pangkalan Lesung
Village with an area of 13,930 ha and the smallest is Tanjung Beringin with an area of 1,507 ha. Some village are
still overlapping with each other and there is no agreed boundary for those overlapping villages. The
government plays a role to mediate in event of any conflict of village boundaries.
Table 3. Indicative size of each village
No Village Total indicative area
(Ha)
Overlapping with PT MM
(Ha)
1 Betung Village 7,958 2,047
2 Batang Kulim 4,690 1,710
3 Pangkalan Lesung 19,950 13,930
4 Pesaguan 5,496 4,286
5 Talau 7,143 6,584
6 Tanjung Beringin 2,338 1,507
Total 47,575 30,064*
* There are overlaps among villages

20
Figure 5. Participatory Land Use Map
21
Figure 6. Villages boundaries
3. Land ownership information
Most of the land owner did not have the legal ownership of their land. For some who has, they usually only have
the lower form of land certificate which issued by the local sub-district head. This land certificate gives them a weak
ownership to their land. The traditional ownership is indicated by who planted the land, that is why some of the
land owner keep their rubber trees even when they not tapping it anymore. The rubber trees are functioning as a
mark of ownership of that land. The villages around the concession of PT MM are quite developed, almost all the
lands around the concession are already converted into cultivated land, and they even planted vegetables in their
yard. The major commodities that were planted by the villager since a long time ago are rubber trees. Beside the
rubber, they also planted rice, corn and pepper. Some of the villagers has also shift to oil palm, due to low rubber
price.
Land tenure studies have been undertaken by the management of PT MM during the FPIC and land acquisition
process and continued at the time of operation. For all the planted areas, the land compensation has been done.
This involved a process of identifying the correct owner, mapping their lands and obtaining an SKT (land title)
before the payment was made. Currently, most of the unplanted areas have had the ownership mapped out. These
areas will not be converted or developed unless the land owner willing to sell their land.

22
The indicative presence of local community garden was assessed from the SIA, HCV Assessments and participatory
mapping. The local community garden usually considered as the area that needed to provide basic needs for local
communities or as source of income to fulfil the basic needs (HCV 5). Basic needs of the local community such as
rice, vegetables, fruits, fish and meat are met from cultivation or taken from the forest and river, besides they can
also purchase it from local stores around the village and sub district. The other needs such as cooking oil, wheat
flour, salt, sugar, tea, coffee etc. are also available from the local stores. The basic commodities are available either
from the cultivation, natural or from the local stores. The availability is also relatively stable in terms of price,
supply and stock. Access and prices of the basic needs with decent quality for consumption is relatively affordable
by the local communities.
Considering the availability of alternative sources for basic needs and source of income for the local communities
and the availability, stability, affordability and quality of the basic commodities it can be concluded that the food
security of the local communities is good and the community is able to meet their needs for food.
The income of the local communities around the concession of PT MM is still dependent on commodities, especially
oil palm and rubber. The other sectors such as agriculture, animal husbandry, fisheries, handicraft, transportation,
oil palm etc. are still not well developed yet. The decreasing area for shifting cultivation, the ban on land burning by
government, the price of rubber commodity that relatively unstable, low availability of employment and others can
also affect the income of the local community and will affect the stability of the local economy. The participatory
mapping identifies areas that important for food security. The activity also shows that food crops are commonly
found around the settlement areas or planted on the yard of the house. Even though the activity does not calculate
the minimum area for community garden but those areas have been identified in this participative mapping. This
information will be taken into account in the development of PT MM social management plan.
3.2 Summary of Social Impact Assessment
Assessors and their credentials
The Social Impact Assessment of PT MM was carried out by Aksenta which is located at Jl. Gandaria VIII/10,
Kebayoran Baru, Jakarta 12130; Telephone/fax: +62 21 739- 6518, E-mail: [email protected]. The Aksenta
team for the Social Impact Assessment consists of members with multi-discipline in the social/economic aspects
and professional in social assessment, resource economy and social relationships. The team members are:
Table 4. Assessors and their credentials
Name Expertise Social Impact Assessment
Dwi R. Muhtaman Forest and timber product certification, RSPO certification, coffee certification, social strategy.
Team leader, social auditor, certification
Ganip Gunawan Social relation, trainer and facilitator. Social
Bayu Shantiko Natural resource economy and study on social development in rural areas.
Social/Economy

23
Assessment Methods
Social Impact Assessment on the ground was carried out in several methods as follow:
a. Document review. Conducted for documents available with the company and other documents obtained
from other important stakeholders.
b. Observation. Conducted for condition, utilization, and management of land and natural resources, and the
community livelihoods.
c. Semi-structured interviews. Conducted for plantation management, staffs, employees, formal and informal
leaders, and members of the community.
d. FGD (Focus Group Discussion). Community FGD was conducted including the employee and staff
representatives.
e. Workshop. Inter-village workshop.
The SIA for PT MM was conducted using two combined methodologies namely; stakeholder analysis and social
impact assessment employing sustainable livelihood framework. Data were compiled through literature study,
observation, interview and FGD, thus several important points were highlighted / concluded in the latter part. In
the focus group discussion, the respondents expressed their opinions of important issues which were compiled in
the framework of sustainable livelihood with the form of asset which resulted in specific impact assessment in the
social aspect of communities. Five aspects related to sustainable livelihood, namely human, physical, social,
financial and natural assets using the identified components and displayed in matrix table, analysed and scored
qualitatively and quantitatively. The steps in SIA implementation include the following:
a. Identifying and describe activities leading to scoping.
b. Predicting (or analysing) impact trend and identifying how the parties make their responses.
c. Formulating recommendation and necessary action plan.
d. Assessing the process and preparing recommendations for compensation (financial or non-financial).
e. Describing potential for skill development and capacity building for communities.
f. Recommending institutions and coordination among parties.
g. Planning implementation and program monitoring.
Assessment finding
Plantation area of PT MM is immediately adjacent to the community settlement. Village directly interacted with the
plantation include Tanjung Beringin Village, Talau Village, Betung Village, Desa Batang Kulim, Kesuma Village,
Pangkalan Lesung Village and Air Hitam Village. The first two villages are located in the plantation surrounded by
HGU area, both villages are considered as “major enclave” in the plantation area. The existence of PT MM has
cumulatively changed of community's livelihood. The change of land use management in this area bears major
impact on the economic and culture of the communities. The facts that collected from the field shows the
handover of land property through purchase and sell transaction in area near PT MM is become more intensive
since the large-scale oil palm operation.

24
The positive impacts of PT MM’s development are financial contributions to the regency area and national
development generally through taxes and retributions instrument. Infrastructure improvement such as
transportation access, health care service and education are positive contributions from this large-scale
investment. At the local level, the management provides opportunities to build partnership with local village
community in the form of plasma-nucleus oil palm and many social support types to local village community.
The presence of PT MM has become motivator of developments within the local plantation community. The
Positive change is the economic development which is improved in aggregate better than before. On the other
hand, there are potential negative impacts on the local community. For instance, this relates to the limitation of
work and business opportunity. Low adaptation ability of the community may be the hindrance for the community
to reap the potential benefits. The potential negative social risks will need management inputs to transform social
risk into social potential for betterment or improvement to the livelihood of the local communities. PT MM has
mitigated the potential social impacts by assisting the local communities and villages in developing their land into
oil palm holdings to generate income and improve their livelihood.
Based on identification of the assessment, the guideline of social policy and social impact management as follows:
a. Guideline of Social Policy:
Management unit PT MM makes clear and measured vision, mission and in social management aspect. This
vision, mission and strategy constitute main base to arrange social management programs. The initiation
related to community interest shall involve the community, started from planning, performance,
monitoring/evaluation. This community involving also includes social vision, mission and strategy
arrangement of the company.
b. Social impact management:
• Economic development of surrounding community aspect
• Change of culture and lifestyle aspect
• Social relation aspect
• Public Services
PT MM has developed scheme smallholder in form of KKPA with surrounding villagers, with average area of 2 ha for
each family. The development was carried out in stages starting from 2001. Development of KKPA was part of the
CSR programmes. The company has collaborated with two co-operations namely Rawa Tengkuluk Cooperation in
Pangkalan Lesung Sub District and Merbau Sakti Cooperation in Pangkalan Kuras Sub District to develop KKPA.
Rawa Tengkuluk Cooperation consists of four farmer groups with members of 401 families from Pangkalan Lesung
Village and Pesaguan Village with a total area of 802 ha. Merbau Sakti Cooperation consists of nine farmer groups
with members of 432 families from Sorek Satu Village, Batang Kulim Village, Betung Village and Tanjung Beringin
Village with a total area of 864 ha (data as per assessment time).
The company has also developed Kas Desa with a total area of 17 ha, which consist of 5 ha for Pangkalan Lesung,
Betung and Tanjung Beringin villages respectively and 1 ha for Talau and Batang Kulim villages respectively. These
Kas Desa are for village development. Merbau Sakti Cooperation plans to develop new oil palm holdings with a
total of 202 ha, while Batang Kulim village has proposed to develop 5 ha and Talau village has proposed to develop

25
4 ha of new plantation (Kebun Kas Desa). KKPA and Kas Desa program conducted by PT Musim Mas is seen as
successful by the local communities. They have requested PT Musim Mas to expand the KKPA scheme and Kas
Desa. The village communities believe that the support of the company under KKPA scheme will significantly
increase the income of the KKPA farmers and village.
SIA Management Plan
PT MM has developed the plans for the social impacts as the operational efforts on social mitigation. The social
development and preparation of management & monitoring plans for PT MM was mainly based on SEIA and the
Social Impact Assessment, in principle, referred to the related laws in Indonesia. The management for the Social
and Environmental Impacts aimed to be managed consistently with appropriate work performance standards. The
scope of the development and preparation of management & monitoring plans included all of the potential impacts
by the plantation activities. The development and preparation of management & monitoring plans guidelines
include:
a. Land Acquisition (and Compensation) Program Through Sustainable Communication & Relationships
Based on the assessment that has been carried out, the general social conditions PT MM were pretty good.
Therefore, the emphasis the company in land acquisition program is clear and transparent. The scope for
this management and monitoring included the process of land acquisition and land compensation which
referred to the principles of Free, Prior and Informed Consent (FPIC) such as: socializing and communicating
regarding the activities involving the acquisition of land by the local government, verification of the legality
of land ownership, land compensation in accordance with SOP and documenting activities.
b. Participation Program Improvement Companies in the Health, Education and Environmental
Management Around Good Company
• Health Sector: Generally, most people are very dependent on the quality of river water, given these
conditions, the company designing health programs and infrastructure that relies on participation in
activities for improved health in the community. Activities in the form of health education and fogging
collaboration with the local health agency and participate in the provision of clean water.
• Education: The Company recognizes that communities around the company can be developed to be
prosperous, but because the location is remote the lack of access to education and jobs that require
higher education is evident. As a result, the average level of education is relatively low. The scope for
this management and monitoring included the participation of the company in increasing the human
resource such as; i) encourage local people who are poor financially to enable continuous education
until college with scholarship program, ii) participate in increasing the level basic education and iii)
giving opportunity to pursue senior High School of Vocational for (Praktek Kerja Lapangan).
• Field of Environmental Management: neighbourhood improvement activities include: river water
quality testing and socialization to maintain the condition of river border. Focus of activity in the form
of management and monitoring of water quality, preparation and implementation of Environmental
Management & Monitoring Plans (RKL & RPL).
26
The Management Plans of PT Musim Mas, Participation of Company in Increasing Local Economic
The scope for this management and monitoring included: a) recruit local people as workers accord with the needed
of the company, b). opening opportunity of cooperation for contractor and local supplier accord with standard and
quality requirements of the company, c) Participate in the development of local economy and CSR projects such as
smallholders’ scheme (KKPA and village oil palm development).
Although the social impact assessment (SIA) was done in 2007, the results of the SIA were used as baseline
information in developing the social management program plan. The management and monitoring plan was
prepared together with the consultants through a workshop. The programme was also consulted with and
approved by communities around the PT MM concession. Since then, PT MM has programmes and also conducted
yearly reviews of the programmes. In its implementation PT MM has also conducted stakeholder consultations with
surrounding communities periodically to gauge for changes in social conditions as well as to gather input for the
evaluation of the implemented management and monitoring programmes.
27
4. High Conservation Value assessment 4.1 Summary and link to public summary report
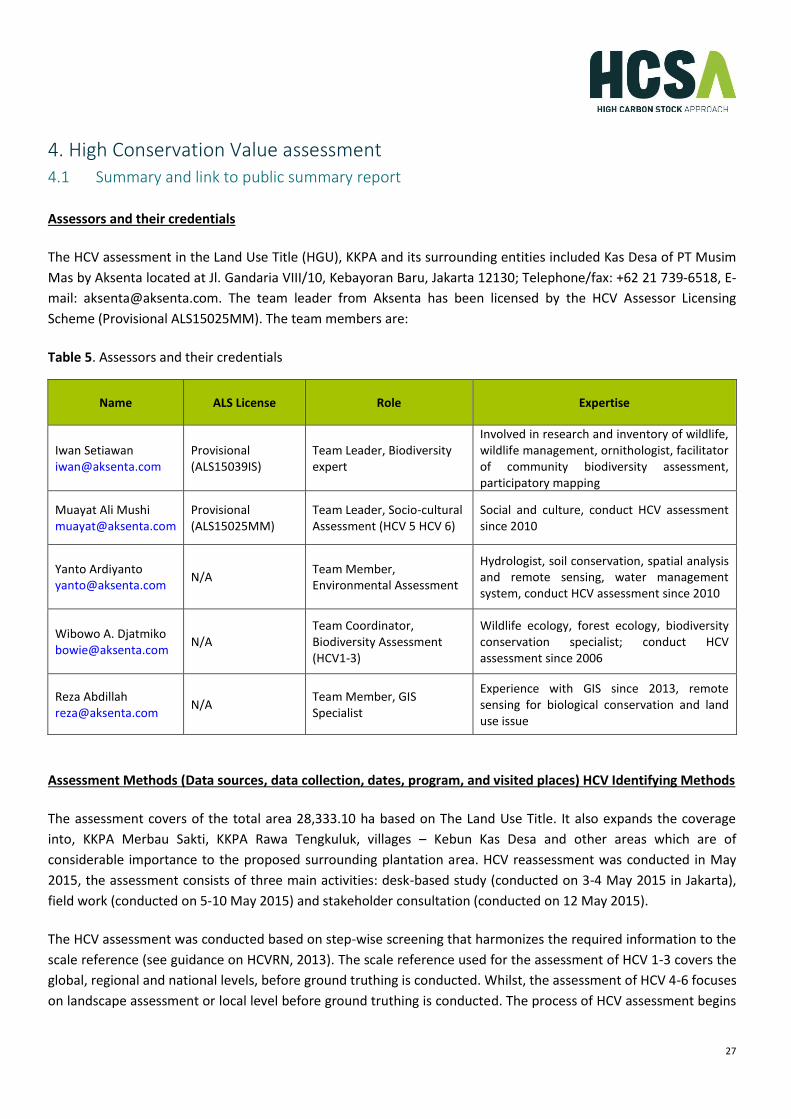
Assessors and their credentials
The HCV assessment in the Land Use Title (HGU), KKPA and its surrounding entities included Kas Desa of PT Musim
Mas by Aksenta located at Jl. Gandaria VIII/10, Kebayoran Baru, Jakarta 12130; Telephone/fax: +62 21 739-6518, E-
mail: [email protected]. The team leader from Aksenta has been licensed by the HCV Assessor Licensing
Scheme (Provisional ALS15025MM). The team members are:
Table 5. Assessors and their credentials
Name ALS License Role Expertise
Iwan Setiawan [email protected]
Provisional (ALS15039IS)
Team Leader, Biodiversity expert
Involved in research and inventory of wildlife, wildlife management, ornithologist, facilitator of community biodiversity assessment, participatory mapping
Muayat Ali Mushi [email protected]
Provisional (ALS15025MM)
Team Leader, Socio-cultural Assessment (HCV 5 HCV 6)
Social and culture, conduct HCV assessment since 2010
Yanto Ardiyanto [email protected]
N/A Team Member, Environmental Assessment
Hydrologist, soil conservation, spatial analysis and remote sensing, water management system, conduct HCV assessment since 2010
Wibowo A. Djatmiko [email protected]
N/A Team Coordinator, Biodiversity Assessment (HCV1-3)
Wildlife ecology, forest ecology, biodiversity conservation specialist; conduct HCV assessment since 2006
Reza Abdillah [email protected]
N/A Team Member, GIS Specialist
Experience with GIS since 2013, remote sensing for biological conservation and land use issue
Assessment Methods (Data sources, data collection, dates, program, and visited places) HCV Identifying Methods
The assessment covers of the total area 28,333.10 ha based on The Land Use Title. It also expands the coverage
into, KKPA Merbau Sakti, KKPA Rawa Tengkuluk, villages – Kebun Kas Desa and other areas which are of
considerable importance to the proposed surrounding plantation area. HCV reassessment was conducted in May
2015, the assessment consists of three main activities: desk-based study (conducted on 3-4 May 2015 in Jakarta),
field work (conducted on 5-10 May 2015) and stakeholder consultation (conducted on 12 May 2015).
The HCV assessment was conducted based on step-wise screening that harmonizes the required information to the
scale reference (see guidance on HCVRN, 2013). The scale reference used for the assessment of HCV 1-3 covers the
global, regional and national levels, before ground truthing is conducted. Whilst, the assessment of HCV 4-6 focuses
on landscape assessment or local level before ground truthing is conducted. The process of HCV assessment begins
28
with pre-assessment, data collection from the site and public consultation. The collected data and information will
be analysed further, and the discovered HCV will be mapped out.
Pre-assessment
Pre-assessment is the initial process of HCV identification. Pre-assessment covers activities as follow: (i) collect the
data and information on the development and the management of the existing estate and management planning,
(ii) collect the secondary data and information from various sources (report, journal, book, statistic data, basic
map), including information on biodiversity aspect and issue (global, regional, national, even local level),
environment (especially on soil and water conservation) and socio-cultural, and (iii) analyse and validate the
collected data and information and spatial analysis of basic map.
Data collection
Data collection in the field focuses on the area potentially classified as HCV area based on pre-assessment result.
The collection of data and information is focused on the HCV element and attribute by using the methods as follow:
a. Participatory mapping.
b. Ground truthing. Ground truthing is the field verification of the land cover from the interpretation of
Landsat satellite that is conducted during pre-assessment. At the same time when ground truthing is
conducted, the collection of data and information also being conducted on site. The activity is being done
by HCV assessor, either being done as a group per location or parallel for each section of assessment. This
depends on the area potentially classified as HCV area.
c. Data collection on the field. The collection of data on the field is being done simultaneously with ground
truthing. The purpose of this activity is to verify the existence of HCV element and attribute, in which it will
be the basic to determine whether there is HCV in that particular area.
d. Interview with the community in the assessment area Interview with the community or the company
worker is being conducted to gain information about the existence of HCV element and attribute.
Public Consultation
Public consultation is a face-to-face meeting with key stakeholders in the assessment area, such as local
community, village government, regency government, relevant institutions in the regency and companies operating
around the assessment area.
Data analysis and HCV mapping
The data collected on site are compiled and tabulated based on the area of assessment. Initially, the data collected
on site are compiled and tabulated separately in accordance with each section assessed (biodiversity,
environmental service, and socio-cultural). For each section, the HCV element and attribute found on site is listed.
Furthermore, the analysis will be conducted to justify the existence or non-existence of HCV elements and to
determine the boundary of HCV area.

29
Figure 7. HCV Map PT MM
Summary of HCV Findings
The Land Use Change Analysis in PT MM area that was done by Aksenta in 2015, shows that since November 2005
there is no primary forest in assessment area. The Landsat satellite imagery of 2005 showed that oil palm is the
dominant land cover in the concession current condition based on satellite imagery of Landsat 8, March 2015 also
showed that most of the land in assessment area has been planted with oil palm. The remaining land covers are
degraded secondary forest, shrub and open land. The condition of natural peat swamp vegetation around Napo
and Bengkarai rivers is still good as conservation area.
The assessment area is located outside the Important Bird Area (IBA) territory. The nearest IBA territory is Siak-
Kampar Peat swamp Forest, which located approximately 30 km to the east. The assessment area is not a Ramsar
area. The nearest conservation area is Tesso Nilo National Park, which located approximately 10 km to the
Southwest and Kerumutan wildlife reserve, which located 35 km to the East. Between the plantation and Tesso Nilo
National Park there are Nilo River and PT Arara Abadi concession.
The result of the assessment shows that there are four HCV categories present in assessment area, which are HCV
1, HCV 3, HCV 4 and HCV 6. There are two types of HCV in assessment area; first, a suitable area to maintain the
30
continuity of HCV elements so it is feasible as a HCV area; second, an area which not HCV, but their presence can
support the HCV areas. The second type is categorized as HCV Management Area (HCV-MA).
The assessment area consists of Nucleus Estates Plantations, KKPA and Kas Desa. The result of HCV assessment
shows that there are no HCV areas present in KKPA Rawa Tengkuluk and KKPA Merbau Sakti. HCV areas are also not
present in Kas Desa Pangkalan Lesung, Kas Desa Betung, Kas Desa Tanjung Beringin, Kas Desa Talau and Kas Desa
Batang Kulim. HCV areas are not found in the areas that will be developed into new oil palm holdings/plantation
(expansion oil palm in KKPA Merbau Sakti, Kas Desa Batang Kulim and Kas Desa Talau). HCV areas are only sighted
within the concession of PT MM (nucleus).
The result of the assessment shows that there are 13 locations of HCV areas in the nucleus, which is one HCV 6 in
Estate 1 (Tambun Village). Five single HCV 4, five single HCV 1 and two compounds HCV (HCV 1, 3 and 4). HCVMA
are located in four locations. The total areas identified as HCV and Management Area (HCV-MA) about 1,448.47 ha.
Potential areas for oil palm plantings as corporate social responsibility (CSR) projects /smallholders’ scheme (KKPA
& Kas Desa) in villages in the vicinity outside of the HGU do not contain primary forest, HCV area and the general
land covers are cultivated area and shrub mixed with tree crops.
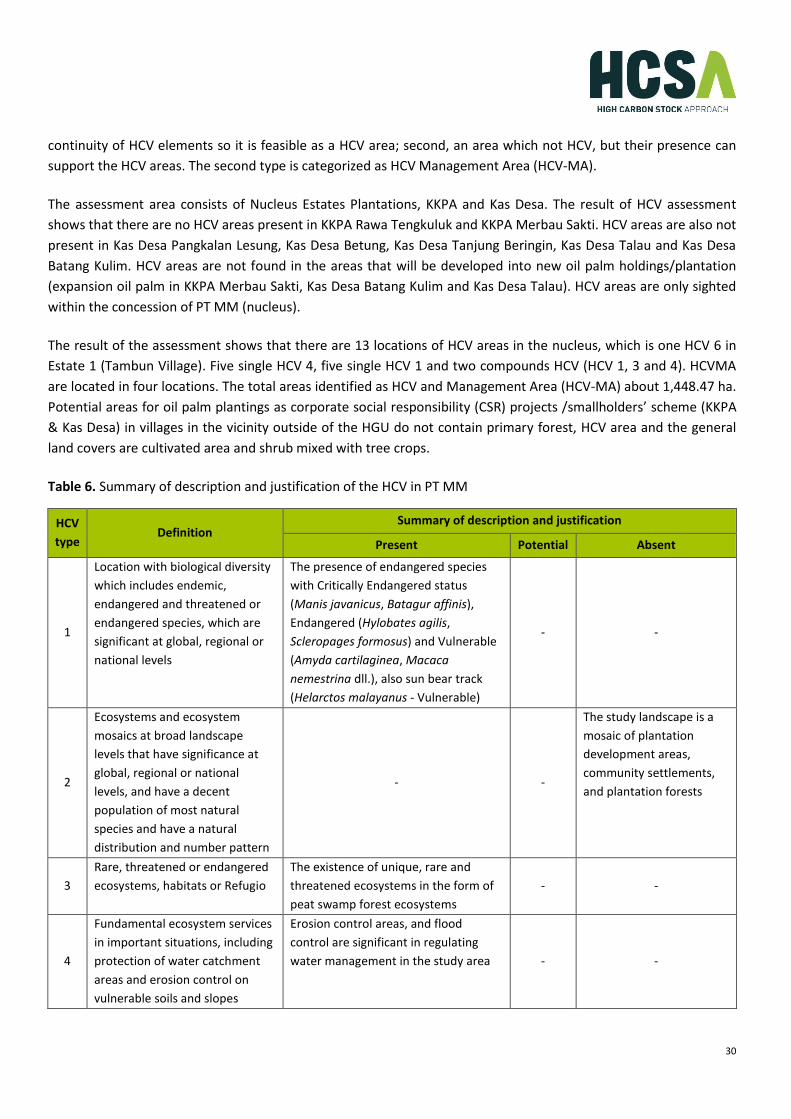
Table 6. Summary of description and justification of the HCV in PT MM
HCV
type Definition
Summary of description and justification
Present Potential Absent
1
Location with biological diversity
which includes endemic,
endangered and threatened or
endangered species, which are
significant at global, regional or
national levels
The presence of endangered species
with Critically Endangered status
(Manis javanicus, Batagur affinis),
Endangered (Hylobates agilis,
Scleropages formosus) and Vulnerable
(Amyda cartilaginea, Macaca
nemestrina dll.), also sun bear track
(Helarctos malayanus - Vulnerable)
- -
2
Ecosystems and ecosystem
mosaics at broad landscape
levels that have significance at
global, regional or national
levels, and have a decent
population of most natural
species and have a natural
distribution and number pattern
- -
The study landscape is a
mosaic of plantation
development areas,
community settlements,
and plantation forests
3
Rare, threatened or endangered
ecosystems, habitats or Refugio
The existence of unique, rare and
threatened ecosystems in the form of
peat swamp forest ecosystems
- -
4
Fundamental ecosystem services
in important situations, including
protection of water catchment
areas and erosion control on
vulnerable soils and slopes
Erosion control areas, and flood
control are significant in regulating
water management in the study area - -

31
HCV
type Definition
Summary of description and justification
Present Potential Absent
5
Fundamental locations and
resources to meet the basic
needs of local communities or
indigenous peoples (for
livelihoods, health, food, water,
etc.), identified through
interactions with communities or
indigenous peoples concerned
- -
The land owner has turned
the land into an oil palm
plantation and
monoculture rubber; not
the only source for
meeting basic needs; and
wants to sell if the price is
suitable.
6
Location, resources, habitat, and
landscape with cultural,
archaeological, or historical
significance at the global or
national level, and / or cultural,
ecological, economic or religious
/ sacred interests for the
traditional culture of local /
indigenous communities,
identified through interaction
with the community or related
indigenous peoples.
The existence of an area that has
historical value for the community. It is
the grave of the White-blooded
Princess
- -
Development of HCV and SIA Management Plans
The development and preparation of HCV and SIA management and monitoring plans for PT MM was implemented
in phases involving several parties: that is Estate Department, the Pubic Relation and Sustainability Department.
The implementation of the HCV and SIA management & monitoring plans in the field will be implemented by
experienced personnel who possessed the relevant knowledge and technical skills. Sustainability and Audit &
Certification Staff, with the assistance of the Pubic Relation Team, stationed at the location, will provide support in
these activities.
The Estate Manager is directly responsible on the implementation of the plans of management and monitoring. In
addition, the Senior Estate Manager is accountable in fulfilling of the requirements for the plan and as well as
responsible in analysing the input results from the monitoring plans. The General Manager is accountable and
responsible to ensure that the Overall Development Plan including the management of HCV and SIA is implemented
according to the time plan and budget. The management team is supported and supervised by the Regional
General Manger. The Head Office Estate Department, Public Relation (Humas) Department, and Sustainability
Department will provide the overall support in the implementation of the development plan.
Stakeholders to be involved
The process of the HCV and SIA development and preparation of management plans and monitoring PT MM also
involved relevant stakeholders such as governmental offices, The Plantation and Forestry Office, The Office for
32
River Management-BPDAS, local communities, the government of local village and Sub-District, and other
company’s (private sector) of Forestry and Plantation include peer review HCV Management & Monitoring by
expertise.
Consultation with the relevant stakeholders to provide opportunities for communication and sharing the
information/opinion/suggestions between the PT MM and the workers, contractors, suppliers, consumers,
government agencies and communities to move forward for the benefit and common progress. This is also part of
the process of FPIC procedures to ensure that there is a balance in the social and environmental harmony in the
development of the oil palm planting project between PT MM and the local communities, relevant government
agencies, concerned stakeholders, NGOs etc.
HCV Management Plan
The HCV development and preparation of management & monitoring plans was based on the recommendations by
independent consultants from Aksenta. This process provides data and information related to the presence of the
HCV areas in the HGU, the key HCV elements, the actual conditions included the potential threats, and the
recommendations for the management.
Plan for HCV Monitoring and Regular Review of Data
The basic programs and activities that fulfil the HCV management are in regular monitoring and review. The
purpose of review is to measure the achievements, effectiveness, efficiency, impacts, and sustainability of the
programs. Thus, the purpose of monitoring is to evaluate whether the activities run as they are expected; whether
the outputs of the process are as they were projected previously; and whether the resources investments (human,
fund, time) are as they were planned.
Monitoring and review are aimed to a set of indicators as the key performance indicators and should be managed
systematically, consistently, and well documented. The monitoring should be implemented regularly, and it is
dependent on the classifications of the activities and the target indicator to evaluate the detail of such activities is
presented in the Activities Plan Matrix. The review should be conducted at the end of the management periodical
plan, that is in the end of the third years (summation review) and every six months (formative review).
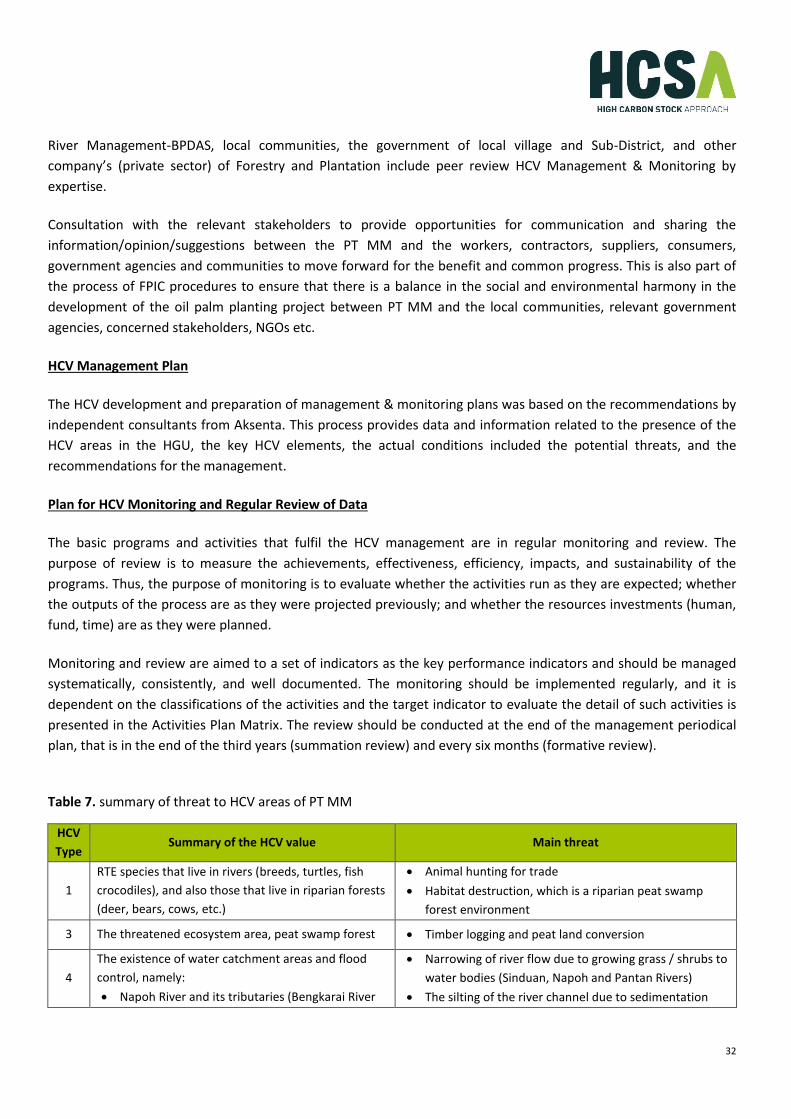
Table 7. summary of threat to HCV areas of PT MM
HCV
Type Summary of the HCV value Main threat
1
RTE species that live in rivers (breeds, turtles, fish
crocodiles), and also those that live in riparian forests
(deer, bears, cows, etc.)
• Animal hunting for trade
• Habitat destruction, which is a riparian peat swamp
forest environment
3 The threatened ecosystem area, peat swamp forest • Timber logging and peat land conversion
4
The existence of water catchment areas and flood
control, namely:
• Napoh River and its tributaries (Bengkarai River
• Narrowing of river flow due to growing grass / shrubs to
water bodies (Sinduan, Napoh and Pantan Rivers)
• The silting of the river channel due to sedimentation

33
and Sinduan River), Sinduan River tributary
(Pantan River), Pantan River tributary (Pelintai
River)
• Nilo River tributary (Air Hitam River) and Air
Hitam River tributaries (Pemahang River and
Lelan River)
from inside and outside of the plantation. The threat
from within is morpho-erosion of river roads and cliffs
(in some parts of the Air Hitam River). The results of
erosion from outside the area are carried into the
plantation area
• Liquid waste from land application / WWTP carried by
surface runoff to Pantan or Sinduan River (especially
from around mill in Estate III)
Area as a natural firebreak, that is
• The river is wide enough with a relatively stable
water discharge throughout the year, namely the
Napoh and Air Hitam River.
• Wetland ecosystem in the form of peat swamps
around the border of the Napoh River
Fluctuations in high flow rates between rainy and dry
seasons (for the Napoh River trubitay).
6 The Tomb of the White-blooded Princess and the
surrounding environment overgrown with large trees Expansion of oil palm plantations owned by newcomers

34
5. Environmental Impact Assessment 5.1 Summary
PT MM has developed the plans for the conservation impacts and social impacts as the operational efforts on social
and conservation mitigation. The social development and preparation of management & monitoring plans for PT
MM was mainly based on SEIA and the Social Impact Assessment, in principle, referred to the related laws in
Indonesia. Based on the SIA results for PT MM by Aksenta and the Environmental Management & Monitoring Plans
of PT MM document, the management for the Social and Environmental Impacts was aimed to be managed
consistently with appropriate work performance standards. The scope of the development and preparation of
management & monitoring plans included all of the potential impacts by the plantation activities. The development
and preparation of management & monitoring plans guidelines include:
Land Acquisition (and Compensation) Program Through Sustainable Communication & Relationships
Based on the Social Impact Assessment has been carried out, the general social conditions PT MM were pretty
good. Therefore, the emphasis the company in land acquisition program is clear and transparent. The scope for this
management and monitoring included the process of land acquisition and land compensation which referred to the
principles of Free, Prior and Informed Consent (FPIC) such as: socializing and communicating regarding the activities
involving the acquisition of land by the local government, verification of the legality of land ownership, land
compensation in accordance with SOP and documenting activities.
Participation Program Improvement Companies in the Health, Education and Environmental Management
around Good Company
Health Sector: Generally, most people are very dependent on the quality of river water, given these conditions, the
company designing health programs and infrastructure that relies on participation in activities for improved health
in the community. Activities in the form of health education and fogging collaboration with the local health agency
and participate in the provision of clean water.
Education: The Company recognizes that communities around the company can be developed to be prosperous,
but because the location is remote the lack of access to education and jobs that require higher education is
evident. As a result, the average level of education is relatively low. The scope for this management and monitoring
included the participation of the company in increasing the human resource such as:
• Encourage local people who are poor financially to enable continuous education until college with
scholarship program.
• Participate in increasing the level basic education (Peduli Pendidikan).
• Giving opportunity to do apprenticeship.
Field of Environmental Management: neighbourhood improvement activities include: river water quality testing
and socialization to maintain the condition of river border. Focus of activity in the form of management and
monitoring of water quality, preparation and implementation of Environmental Management & Monitoring Plans
(RKL & RPL).
35
The Management Plans of PT Musim Mas, Participation of Company in Increasing Local Economic
The scope for this management and monitoring included:
• Recruit local people as workers accord with the needed of the company.
• Opening opportunity of cooperation for contractor and local supplier accord with standard and quality
requirements of the company.
• Participate in the development of local economy and CSR projects such as smallholder scheme (KKPA and
village oil palm development).

36
6. Land cover image analysis 6.1 Area of Interest and how it was defined
Area of Interest (AOI) considered in the Carbon Stock Assessment (CSA) by Aksenta in 2015 was the balance
unplanted areas that covers an area of 1,452.8 ha. All planted and existing set aside areas (HCV areas and riparian
buffer zones) were excluded from the assessment. In 2018, PT MM completing the Carbon Stock Assessment by
conducting the second phase of the HCSA assessment those are Participatory Mapping (2017) and Patch Analysis
Decision Tree (2018).
Figure 8. AOI
HCSA Toolkit recommended that at a very minimum, a zone of one kilometre beyond the concession borders is
necessary to ensure forest cover in the landscape is taken into consideration. Considering the recommendation, the
second phase of the analysis is including the entire concession of PT MM and 5 km buffer as AOI. The 5 km is opted
to cover the potential HCS area in larger landscape to cover potential village development programme which might
come in later years. The AOI is presented in Figure 8 above. The image used was Landsat 8 OLI-TIRS Satellite Image
with 30m resolution. There was minimum cloud or haze on the defined AOI, so there were no complementary
images needed.

37
The HCS assessment was conducted in 2014 using Landsat satellite imagery at June 2014. The land cover in 2014
may change through time, so PT MM compare the land cover in 2014 with the land cover in 2018 to know whether
there are massive changes in the landscape or not. The comparison of the two land cover is presented in Figure 9
below. The Sentinel 2 satellite image dated 5 July 2018 with the resolution of 10 m was selected as comparison. The
July satellite image was selected because it was the best satellite image available with the cloud cover between 5 to
10 %.
From Figure 9 below, we can see that in 2014, the disturbed forest was located on the Northwest inside the
concession and Eastern part outside the concession. More than 90% of areas inside the concession have been
developed in 2014. In 2018, the disturbed forest is still present in the same location. Some of forest areas in the
Eastern part, outside of the concession has been cleared and in 2018 converted into forest plantation (Acacia). In
general, the land cover between 2014 and 2018 is more or less the same, so the satellite imagery from 2014 still
can be used in 2018. The usage of satellite images from 2014 is also will not underestimate the current HCS area
present on the field.
Figure 9. Comparison between 2014 and 2018 Satellite Image
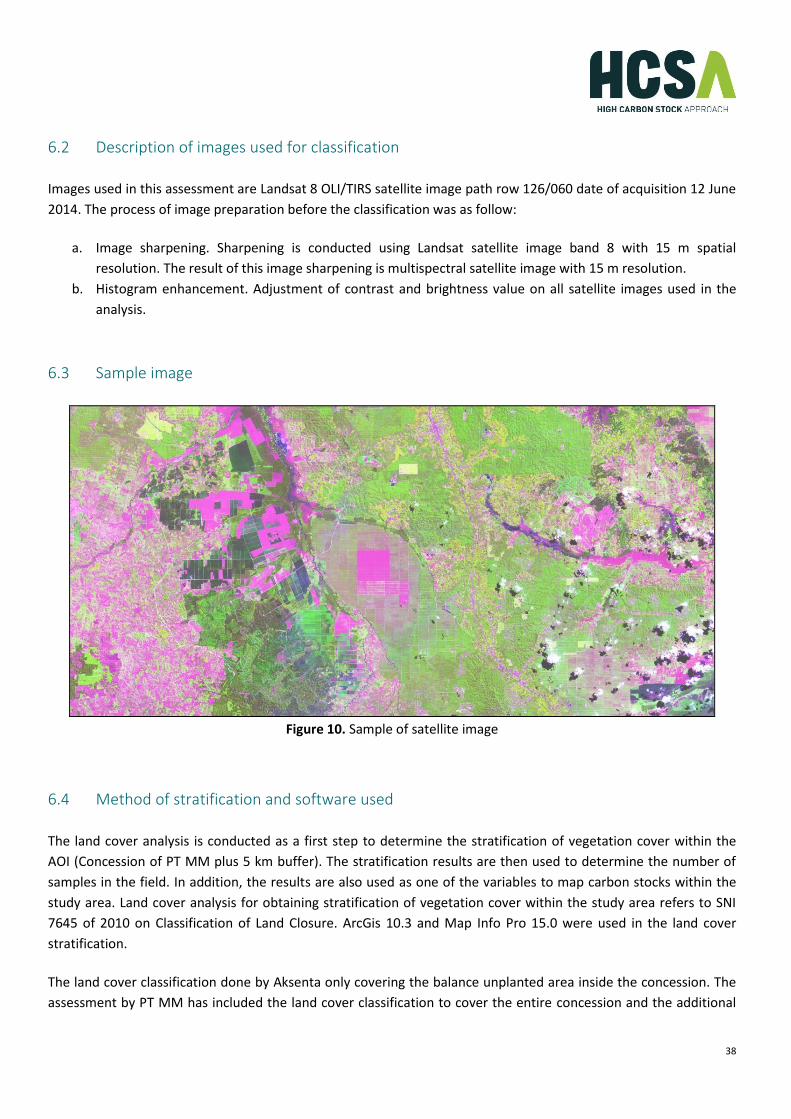
38
6.2 Description of images used for classification
Images used in this assessment are Landsat 8 OLI/TIRS satellite image path row 126/060 date of acquisition 12 June
2014. The process of image preparation before the classification was as follow:
a. Image sharpening. Sharpening is conducted using Landsat satellite image band 8 with 15 m spatial
resolution. The result of this image sharpening is multispectral satellite image with 15 m resolution.
b. Histogram enhancement. Adjustment of contrast and brightness value on all satellite images used in the
analysis.
6.3 Sample image
Figure 10. Sample of satellite image
6.4 Method of stratification and software used
The land cover analysis is conducted as a first step to determine the stratification of vegetation cover within the
AOI (Concession of PT MM plus 5 km buffer). The stratification results are then used to determine the number of
samples in the field. In addition, the results are also used as one of the variables to map carbon stocks within the
study area. Land cover analysis for obtaining stratification of vegetation cover within the study area refers to SNI
7645 of 2010 on Classification of Land Closure. ArcGis 10.3 and Map Info Pro 15.0 were used in the land cover
stratification.
The land cover classification done by Aksenta only covering the balance unplanted area inside the concession. The
assessment by PT MM has included the land cover classification to cover the entire concession and the additional

39
surrounding landscape (5 km beyond the concession of PT MM). The method used in land cover analysis is
supervised classification and visual classification method. The training area for the supervised classification were
defined based on examination experience with mapping of land cover and after the ground thruthing in-field
observations also consultation with local communities during participatory mapping, post classification was
undertaken based on the actual condition. Sentinel 2 July 2018 also used to clarify the actual condition. Visual
classification that classify objects on the surface based on the colour, the band 654 (http://landsat.usgs.gov) are
used to correct the result of supervised classification. After obtaining the land cover class, this classification result is
then used as a basis for determining the number of samples of vegetation plots in the field and as a site for ground
verification (ground truthing).
6.5 Map of initial vegetation classes, with legend
Initial vegetation classes done by Aksenta in 2015 covers the balance unplanted areas only, all planted and existing
set aside areas (HCV areas and riparian buffer zones) were excluded from the stratification. The result of the
stratification shows that the land cover on the balance unplanted areas consists of scrub, cultivated land and open
land. In 2018, PT MM continue the carbon stock assessment to the high carbon stock assessment and include the
entire area of PT MM and the area 5 km around the concession of PT MM.
Figure 11. Initial land use map by Aksenta
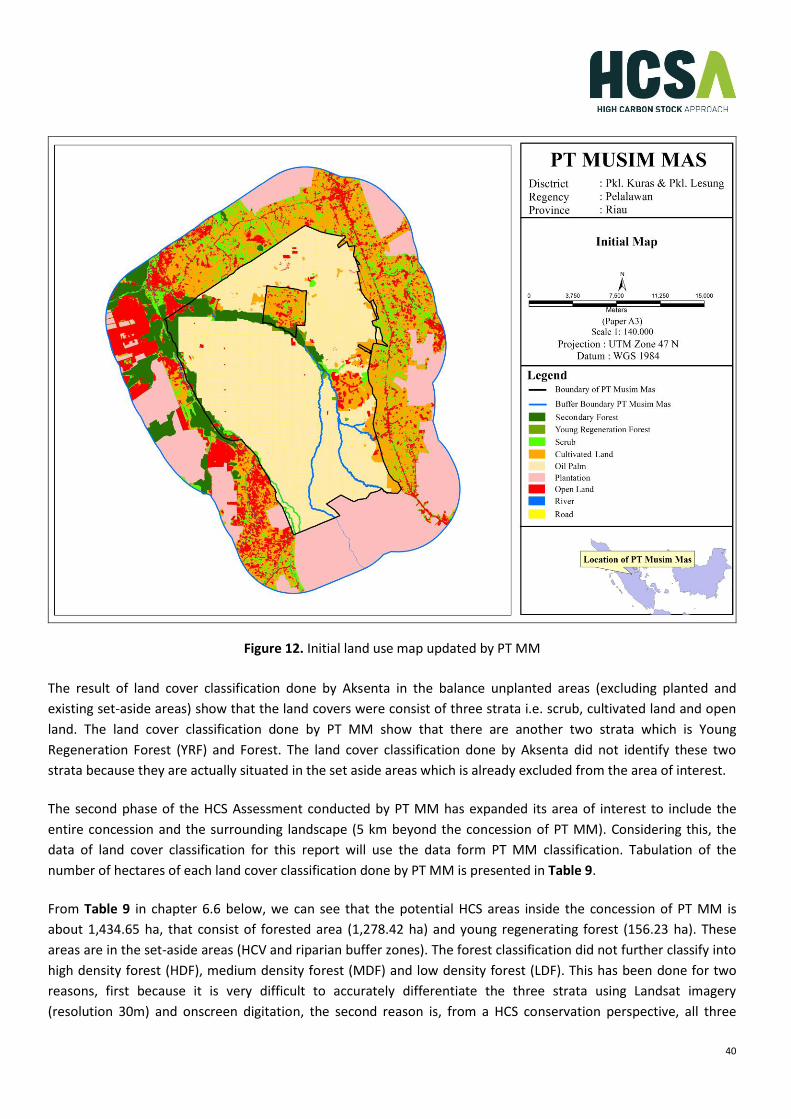
40
Figure 12. Initial land use map updated by PT MM
The result of land cover classification done by Aksenta in the balance unplanted areas (excluding planted and
existing set-aside areas) show that the land covers were consist of three strata i.e. scrub, cultivated land and open
land. The land cover classification done by PT MM show that there are another two strata which is Young
Regeneration Forest (YRF) and Forest. The land cover classification done by Aksenta did not identify these two
strata because they are actually situated in the set aside areas which is already excluded from the area of interest.
The second phase of the HCS Assessment conducted by PT MM has expanded its area of interest to include the
entire concession and the surrounding landscape (5 km beyond the concession of PT MM). Considering this, the
data of land cover classification for this report will use the data form PT MM classification. Tabulation of the
number of hectares of each land cover classification done by PT MM is presented in Table 9.
From Table 9 in chapter 6.6 below, we can see that the potential HCS areas inside the concession of PT MM is
about 1,434.65 ha, that consist of forested area (1,278.42 ha) and young regenerating forest (156.23 ha). These
areas are in the set-aside areas (HCV and riparian buffer zones). The forest classification did not further classify into
high density forest (HDF), medium density forest (MDF) and low density forest (LDF). This has been done for two
reasons, first because it is very difficult to accurately differentiate the three strata using Landsat imagery
(resolution 30m) and onscreen digitation, the second reason is, from a HCS conservation perspective, all three

41
classes are already in the set-aside areas for conservation so there is limited benefit in trying to differentiate the
classes.
Accuracy Test
Accuracy testing is needed to get a quantitative assessment generated through the classification process of
maximum likelihood. To measure the accuracy of the initial interpretation and the results of the ground truthing, a
Kappa index value is calculated using this formula:
Table 8. Land cover verification result
Initial class
Ground Truthing
Total Producer
accuracy
User
accuracy Forest YRF Scrub Cultivated
Land
Open
Land
Forest 5 - - - - 5 100% 100%
YRF - - - - - 0 - -
Scrub - 1 1 - - 2 50% 50%
Cultivated Land - - - 6 - 6 100% 100%
Open Land - - 1 - 2 3 100% 67%
Total 5 1 2 6 2 16
Producer's Accuracy is the map accuracy from the point of view of the map maker (the producer). The User's
Accuracy is the accuracy from the point of view of a map user, not the map maker. The calculation of the producer
and user accuracy above shows that the land classification for forest and cultivated land has the highest producer
and user accuracy whereas the lowest is scrub.
Overall Accuracy is essentially telling us out of all of the reference sites what proportion were mapped correctly.
The Kappa Coefficient is generated from a statistical test to evaluate the accuracy of a classification. Kappa index is

42
essentially evaluated how well the classification performed as compared to just randomly assigning values. The
calculation of Kappa index and Overall accuracy also shows good result (above 80%) so the classification can be
accepted.
6.6 Table of total hectares per vegetation class
Table 9. Table of total hectares per vegetation class
Land cover class Number of Hectares* % of total concession
Potential HCS classes:
High Density Forest
1,278.42 4.51 Medium Density Forest
Low Density Forest
Young Regenerating Forest 156.23 0.55
Sub-total 1,434.65 5.06
Non-HCS classes, e.g.:
Scrub 451.30 1.59
Open Land 551.56 1.95
Mines, smallholder agriculture, plantation, etc. 25,895.59 91.40
Sub-total 26,898.45 94.94
TOTAL 28,333.10 100.00
* Area based on software ArcGis
6.7 Summary of which areas are potential HCS forest, subject to further analysis
In HCS Approach Toolkit, the potential HCS forest cut-off lies between the Scrub and Young Regenerating Forest
categories, where YRF, LDF, MDF, and HDF are considered HCS forest (Figure 13). From Table 9, the land cover in
the AOI consists of five strata which include forest and young regeneration forest that classified as HCS area.
Further analysis will be carried out for these two categories.
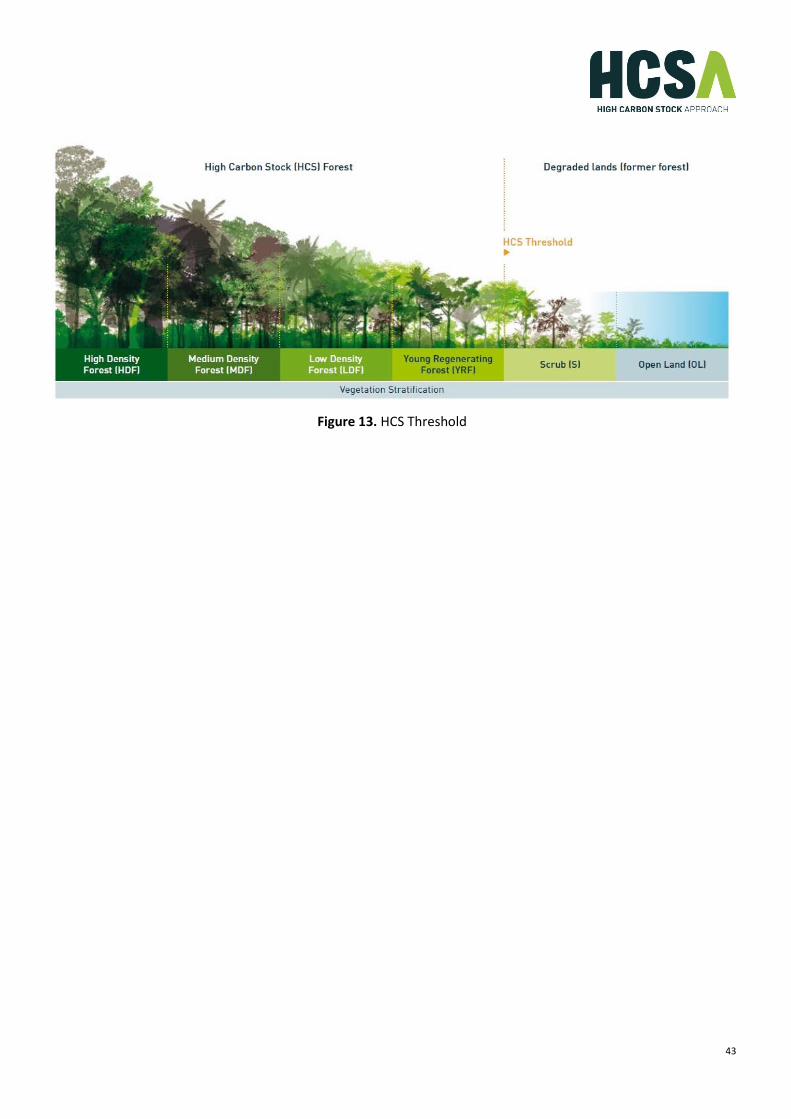
43
Figure 13. HCS Threshold

44
7. Forest inventory results 7.1 Inventory sample design and plot rational
Field sampling method in this activity was conducted using Stratified Random Sampling to improve its accuracy.
This method can produce more precise estimates than other methods (MacDicken, 1997). Stratification becomes
very effective to be used because it affects the increase in homogeneity within each stratum. This system also
reduces the possibility of large differences between plots and increases accuracy even with a small number of plots.
Therefore, vegetation type and density is an important criterion in stratification of the study area. In addition,
systematic sampling was done in each plot to facilitate the team to search plot in the field. However, the technical
aspects of field implementation that facilitate the survey team were also taken into consideration, so that the
implementation can be effective and efficient in terms of time and cost.
The number of sampling plots in the field is adjusted to the result of land cover stratification as described in the
previous section. Random sample plots was generated by using the “create random point tools in ArcGIS”. In each
land cover strata there were three random sample plots taken. In each sample plot a path is made of three plots as
replicate as illustrated in Figure 14. Total number of sampling plots taken was 11 plots that consist of 3 plots in
open land, 2 plots in shrub and 6 plots in cultivated land. Besides, PT MM has also conducted annual carbon stock
measurement within the set-aside areas using the same method as Aksenta. The measurement was conducted in 5
plots which all located in forested area.

45
7.2 Map indicating plots
Figure 14. Sampling Plots
The result of ground truthing shows that areas that were previously classified as scrub turn out to be cultivated
land. The cultivated land consists of young rubber, oil palm and other horticulture. The areas those were previously
classified as scrub then re-classified as cultivated land. This condition can be found on the Northern part of the
concession especially in Talau and Betung Villages and on the Southern part of the concession especially in
Pangkalan Lesung village
7.3 Forest inventory team members and roles
a. Tedi Setiadi: Team Leader and Biodiversity expert
b. Ryan Karida Pratama: GIS expert
c. Reza Abdillah: Carbon expert
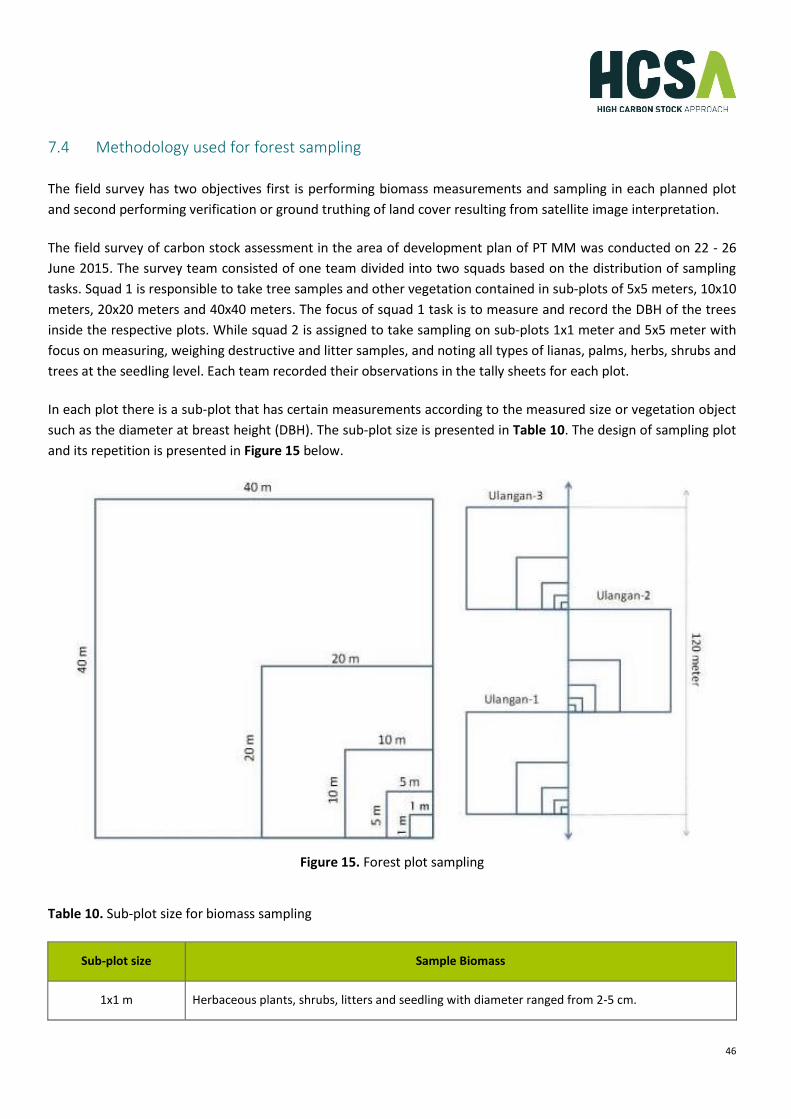
46
7.4 Methodology used for forest sampling
The field survey has two objectives first is performing biomass measurements and sampling in each planned plot
and second performing verification or ground truthing of land cover resulting from satellite image interpretation.
The field survey of carbon stock assessment in the area of development plan of PT MM was conducted on 22 - 26
June 2015. The survey team consisted of one team divided into two squads based on the distribution of sampling
tasks. Squad 1 is responsible to take tree samples and other vegetation contained in sub-plots of 5x5 meters, 10x10
meters, 20x20 meters and 40x40 meters. The focus of squad 1 task is to measure and record the DBH of the trees
inside the respective plots. While squad 2 is assigned to take sampling on sub-plots 1x1 meter and 5x5 meter with
focus on measuring, weighing destructive and litter samples, and noting all types of lianas, palms, herbs, shrubs and
trees at the seedling level. Each team recorded their observations in the tally sheets for each plot.
In each plot there is a sub-plot that has certain measurements according to the measured size or vegetation object
such as the diameter at breast height (DBH). The sub-plot size is presented in Table 10. The design of sampling plot
and its repetition is presented in Figure 15 below.
Figure 15. Forest plot sampling
Table 10. Sub-plot size for biomass sampling
Sub-plot size Sample Biomass
1x1 m Herbaceous plants, shrubs, litters and seedling with diameter ranged from 2-5 cm.

47
5x5 m All kind of Lianas, palms, trees with the Diameter on Breast Height (DBH) ranged from 5-10 cm,
dead trees with diameter ranged from 5-10 cm.
10x10 m All trees with DBH ranged from 10-20 cm, dead trees with DBH ranged from 10-20 cm, dead wood
with diameter ranged from 10-30 cm.
20x20 m All trees with DBH ranged from 20-35 cm, dead trees with diameter 20-35 cm, dead wood with
diameter more than 30 cm.
40x40 m All trees with DBH more than 35 cm.
7.5 Methodology used for carbon calculations
IPCC (2006) and RSPO (2014) mentioned carbon pools in the field consisting of above ground biomass (AGB), below
ground biomass (BGB), necromass of dead wood (woody debris), litters, and soil carbon. Based on the HCSA toolkit,
the measurement of carbon stocks is calculated from above ground biomass. The methodology used in carbon
calculation was non-destructive sampling or non-harvesting carbon analysis method. In practice, the measurement
of carbon was done by measuring the diameter of the tree trunk. The diameter was measured at the breast high
(DBH), it is about 130 centimetres from the ground or at the breast height of an adult. The measured DBH values
were then incorporated into the allometric equations that were previously obtained at the desk study review prior
to the field assessment. The allometric equations used are allometric equations for estimating the biomass of a tree
using its diameter value.
The results of allometric equations and laboratory analysis produce an alleged value on dry or biomass weight
levels and not in carbon units. Analysis of carbon content in an object or carbon source requires specific method
and special equipment that high in cost. In addition, up to now, there are still differences in method of determining
carbon content at the biomass and necromass levels. Therefore, to obtain the estimated value of carbon originating
from biomass and necromass in the study area the general value of global level 0.47 of biomass and necromass
value is used (IPCC, 2006). This also complies with SNI 7724:2011 on “Measurement and calculation of carbon
stock: Field measurement for ground-based forest carbon accounting”. Based on those two standards, the general
equation for estimating the value of total carbon stock on the field is as follow:
CS = 0.47 x AGB
CS = Carbon stock
AGB = Above ground biomass
0.47 = Conversion factor
In order to know the total amount of carbon stocks in the study area, extrapolation of the carbon values resulting
from the calculation in each plot is required. In this carbon stock assessment, extrapolation of carbon stocks is
based on the size of previously classified stratum.

48
7.6 Indicative photos of each vegetation class
Forest
N O R T H
S O U T H
E A S T
W E S T
C A N O P Y

49
Scrub
N O R T H
W E S T
E A S T
S O U T H
C A N O P Y

50
Open Land
N O R T H
S O U T H
E A S T
W E S T
C A N O P Y
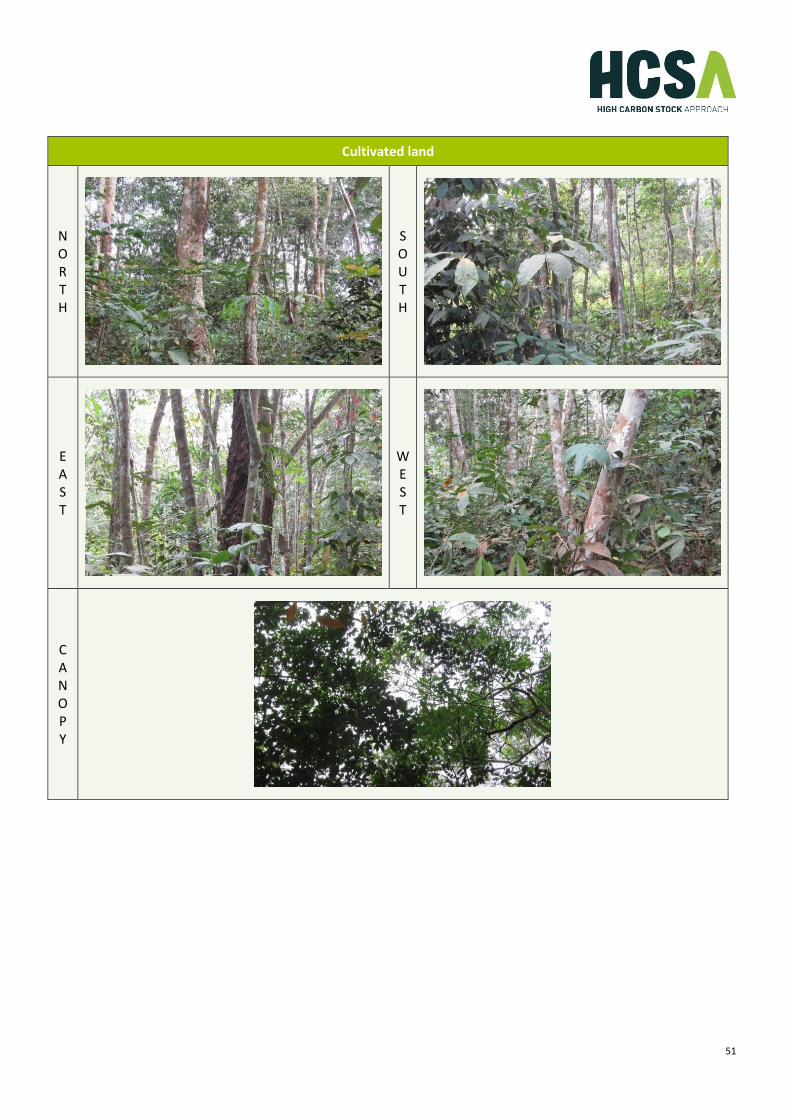
51
Cultivated land
N O R T H
S O U T H
E A S T
W E S T
C A N O P Y
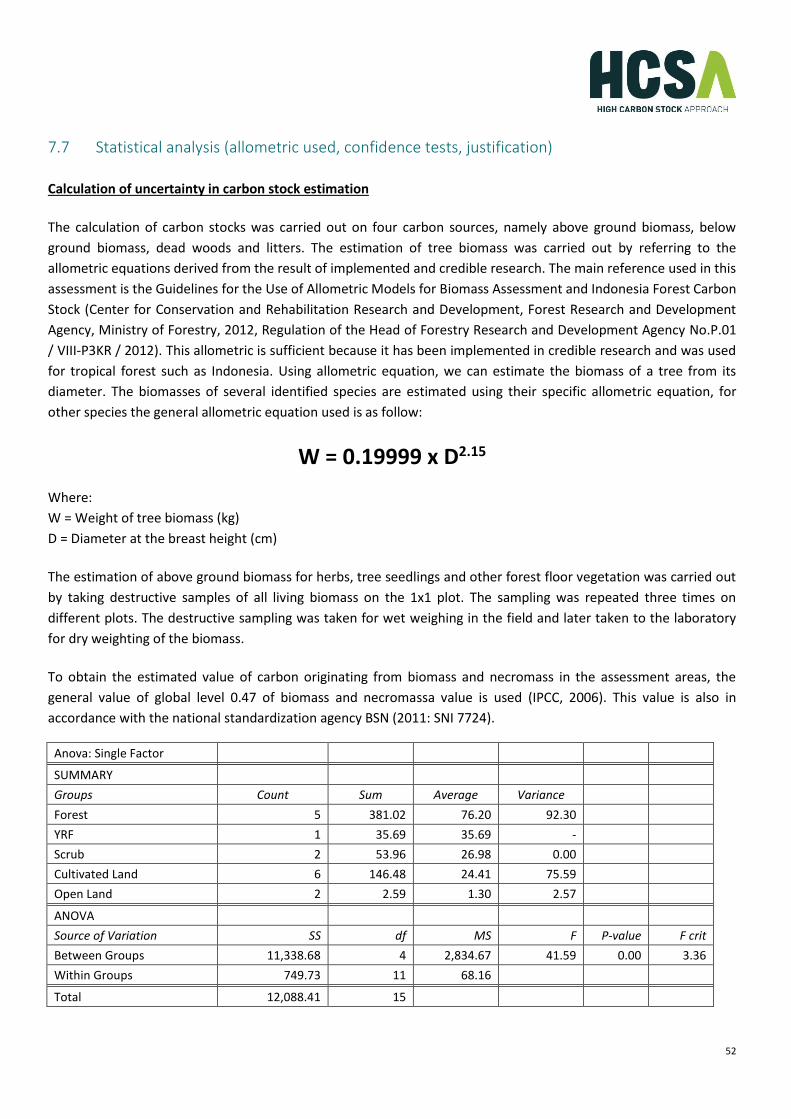
52
7.7 Statistical analysis (allometric used, confidence tests, justification)
Calculation of uncertainty in carbon stock estimation
The calculation of carbon stocks was carried out on four carbon sources, namely above ground biomass, below
ground biomass, dead woods and litters. The estimation of tree biomass was carried out by referring to the
allometric equations derived from the result of implemented and credible research. The main reference used in this
assessment is the Guidelines for the Use of Allometric Models for Biomass Assessment and Indonesia Forest Carbon
Stock (Center for Conservation and Rehabilitation Research and Development, Forest Research and Development
Agency, Ministry of Forestry, 2012, Regulation of the Head of Forestry Research and Development Agency No.P.01
/ VIII-P3KR / 2012). This allometric is sufficient because it has been implemented in credible research and was used
for tropical forest such as Indonesia. Using allometric equation, we can estimate the biomass of a tree from its
diameter. The biomasses of several identified species are estimated using their specific allometric equation, for
other species the general allometric equation used is as follow:
W = 0.19999 x D2.15
Where:
W = Weight of tree biomass (kg)
D = Diameter at the breast height (cm)
The estimation of above ground biomass for herbs, tree seedlings and other forest floor vegetation was carried out
by taking destructive samples of all living biomass on the 1x1 plot. The sampling was repeated three times on
different plots. The destructive sampling was taken for wet weighing in the field and later taken to the laboratory
for dry weighting of the biomass.
To obtain the estimated value of carbon originating from biomass and necromass in the assessment areas, the
general value of global level 0.47 of biomass and necromassa value is used (IPCC, 2006). This value is also in
accordance with the national standardization agency BSN (2011: SNI 7724).
Anova: Single Factor
SUMMARY
Groups Count Sum Average Variance
Forest 5 381.02 76.20 92.30
YRF 1 35.69 35.69 -
Scrub 2 53.96 26.98 0.00
Cultivated Land 6 146.48 24.41 75.59
Open Land 2 2.59 1.30 2.57 ANOVA
Source of Variation SS df MS F P-value F crit
Between Groups 11,338.68 4 2,834.67 41.59 0.00 3.36
Within Groups 749.73 11 68.16 Total 12,088.41 15

53
Conclusion: Because the F > F crit (41.59 > 3.36), therefore we reject the null hypothesis. The means of the five
populations are not equal and at least one of the means is different at the 95% confidence level. However, the
ANOVA does not tell you where the difference lies, so Scheffé Test was performed.
Scheffe analysis
Variables N SS Average
Forest 5 369.20 76.20
YRF 1 0.00 35.69
Scrub 2 0.00 26.98
Cultivated Land 2 377.96 24.41
Open Land 6 2.57 1.30
SSE 749.73
MSE 68.16
p 0.05
k 5
N 16
F(p, k-1, N-k) 3.36
Pair Wise Differences Between Sample Means
Land Cover Strata Forest YRF Scrub Cultivated Land Open Land
Forest 40.51 49.22 51.79 74.91
YRF 8.71 11.28 34.39
Scrub 2.57 25.68
Cultivated Land 23.12
Open Land
Scheffe Comparison Values
Land Cover Strata Forest YRF Scrub Cultivated Land Open Land
Forest 33.15 25.32 18.33 25.32
YRF 37.07 32.69 37.07
Scrub 24.71 30.27
Cultivated Land 24.71
Open Land
Significant Differences
Land Cover Strata Forest YRF Scrub Cultivated Land Open Land
Forest Yes Yes Yes Yes
YRF No No No
Scrub No No
Cultivated Land No
Open Land

54
From the result of Scheffé test above, we can see that the forest stratum is significantly different (α=0.05) with
other strata. The YRF, Scrub, Cultivated land and Open Land strata did not significantly different with each other as
can be seen in the table above.
7.8 Summary of statistical analysis of carbon stock results per vegetation class
Table 11. Summary of statistical analysis of carbon stock results per vegetation class
Land cover
Class
Number of
plots
Stems
per ha
Basal
area
Average
Carbon stock
Standard
error
95% confidence limits
Lower Higher
Open land 2 787.50 17,246.82 1.30 1.60 -13.08 15.68
Shrub 2 1,687.50 56,660.73 26.98 0.06 26.46 27.50
Cultivated 6 1,881.25 58,738.59 24.41 8.69 15.29 33.53
YRF 1 3,331.25 202,035.72 35.69 - - -
LDF
5 3,682.50 398,925.08 76.20 9.61 67.78 84.62 MDF
HDF
7.9 Forest inventory results
Table 12. Forest inventory class
Land cover class
Average
carbon
value
Physical description of the land cover, e.g. species mix, forest type (pioneer,
regenerating, primary etc.), diameter distribution, structural indices, maturity indices,
etc.
Open land 1.30 Recently cleared land for replanting by company or local communities. The land mostly
covered by grass, other understory plants and small trees/seedlings.
Scrub 26.98
The scrub found in the concession of PT MM was a degraded area, mainly due to
intensive logging and land clearing for agricultural purpose. The scrub found scattered
around the concession forming thin belt of vegetation from north to south along the
Napo River. The ground on this area were covered by thick grass, fern and Macaranga
sp.’s and Syzygium sp.’s seedling. On the sapling level, the vegetation was dominated by
Syzygium sp. The same condition also found in pole level. Different with sapling and
pole level, on the tree level, there were more species found and were dominated by
Macaranga triloba. The presence of Macaranga triloba is one of the sign of succession.
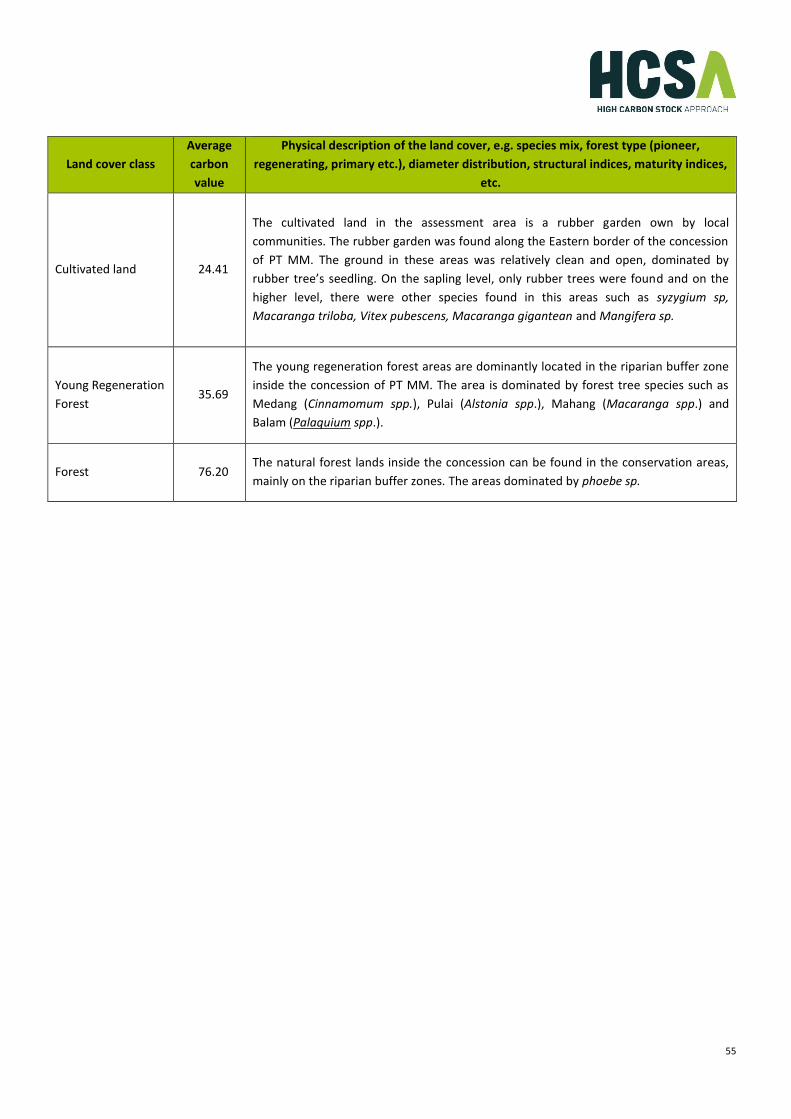
55
Land cover class
Average
carbon
value
Physical description of the land cover, e.g. species mix, forest type (pioneer,
regenerating, primary etc.), diameter distribution, structural indices, maturity indices,
etc.
Cultivated land 24.41
The cultivated land in the assessment area is a rubber garden own by local
communities. The rubber garden was found along the Eastern border of the concession
of PT MM. The ground in these areas was relatively clean and open, dominated by
rubber tree’s seedling. On the sapling level, only rubber trees were found and on the
higher level, there were other species found in this areas such as syzygium sp,
Macaranga triloba, Vitex pubescens, Macaranga gigantean and Mangifera sp.
Young Regeneration
Forest 35.69
The young regeneration forest areas are dominantly located in the riparian buffer zone
inside the concession of PT MM. The area is dominated by forest tree species such as
Medang (Cinnamomum spp.), Pulai (Alstonia spp.), Mahang (Macaranga spp.) and
Balam (Palaquium spp.).
Forest 76.20 The natural forest lands inside the concession can be found in the conservation areas,
mainly on the riparian buffer zones. The areas dominated by phoebe sp.

56
8. Land Cover Classification 8.1 Refined land cover map with title, date, legend and any HCS forest patches identified
The land cover map was refined based on the result of ground verification. Some of the areas that were interpreted
as shrub were actually cultivated land. This condition can be found in the Northern part of the concession especially
in Talau and Betung Villages and on the Southern part of the concession especially in Pangkalan Lesung village.
Figure 16. Refined land cover map
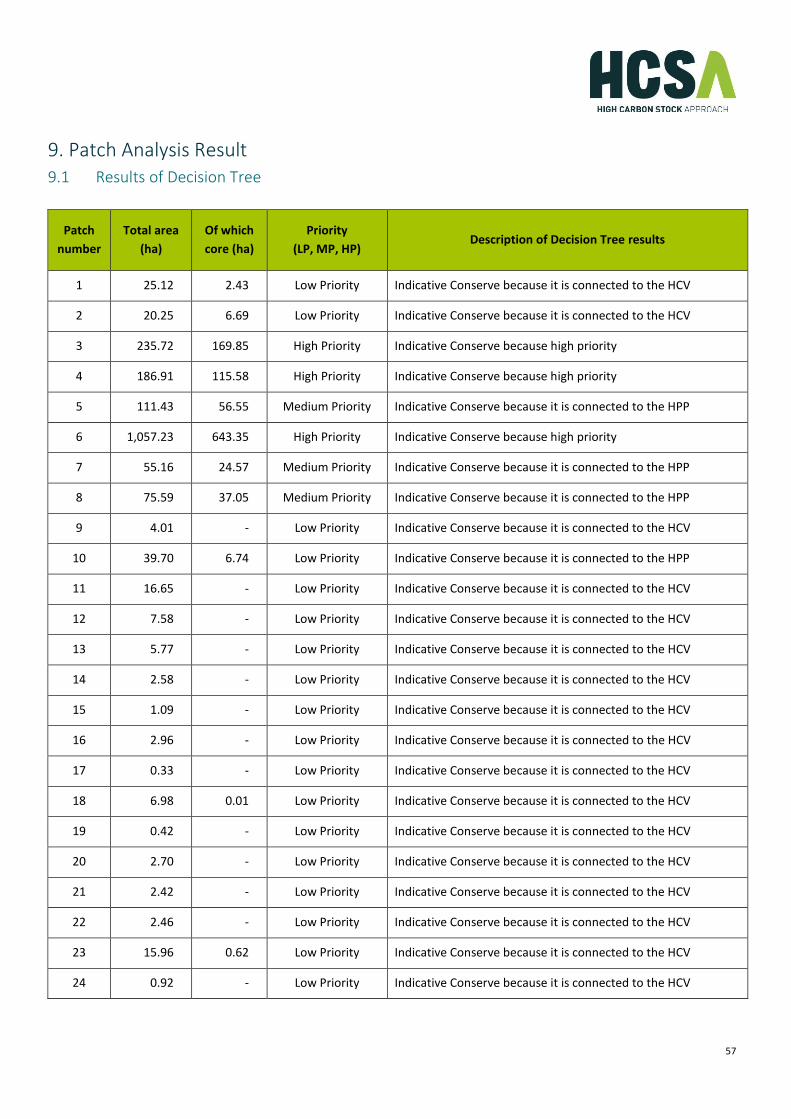
57
9. Patch Analysis Result 9.1 Results of Decision Tree
Patch
number
Total area
(ha)
Of which
core (ha)
Priority
(LP, MP, HP) Description of Decision Tree results
1 25.12 2.43 Low Priority Indicative Conserve because it is connected to the HCV
2 20.25 6.69 Low Priority Indicative Conserve because it is connected to the HCV
3 235.72 169.85 High Priority Indicative Conserve because high priority
4 186.91 115.58 High Priority Indicative Conserve because high priority
5 111.43 56.55 Medium Priority Indicative Conserve because it is connected to the HPP
6 1,057.23 643.35 High Priority Indicative Conserve because high priority
7 55.16 24.57 Medium Priority Indicative Conserve because it is connected to the HPP
8 75.59 37.05 Medium Priority Indicative Conserve because it is connected to the HPP
9 4.01 - Low Priority Indicative Conserve because it is connected to the HCV
10 39.70 6.74 Low Priority Indicative Conserve because it is connected to the HPP
11 16.65 - Low Priority Indicative Conserve because it is connected to the HCV
12 7.58 - Low Priority Indicative Conserve because it is connected to the HCV
13 5.77 - Low Priority Indicative Conserve because it is connected to the HCV
14 2.58 - Low Priority Indicative Conserve because it is connected to the HCV
15 1.09 - Low Priority Indicative Conserve because it is connected to the HCV
16 2.96 - Low Priority Indicative Conserve because it is connected to the HCV
17 0.33 - Low Priority Indicative Conserve because it is connected to the HCV
18 6.98 0.01 Low Priority Indicative Conserve because it is connected to the HCV
19 0.42 - Low Priority Indicative Conserve because it is connected to the HCV
20 2.70 - Low Priority Indicative Conserve because it is connected to the HCV
21 2.42 - Low Priority Indicative Conserve because it is connected to the HCV
22 2.46 - Low Priority Indicative Conserve because it is connected to the HCV
23 15.96 0.62 Low Priority Indicative Conserve because it is connected to the HCV
24 0.92 - Low Priority Indicative Conserve because it is connected to the HCV
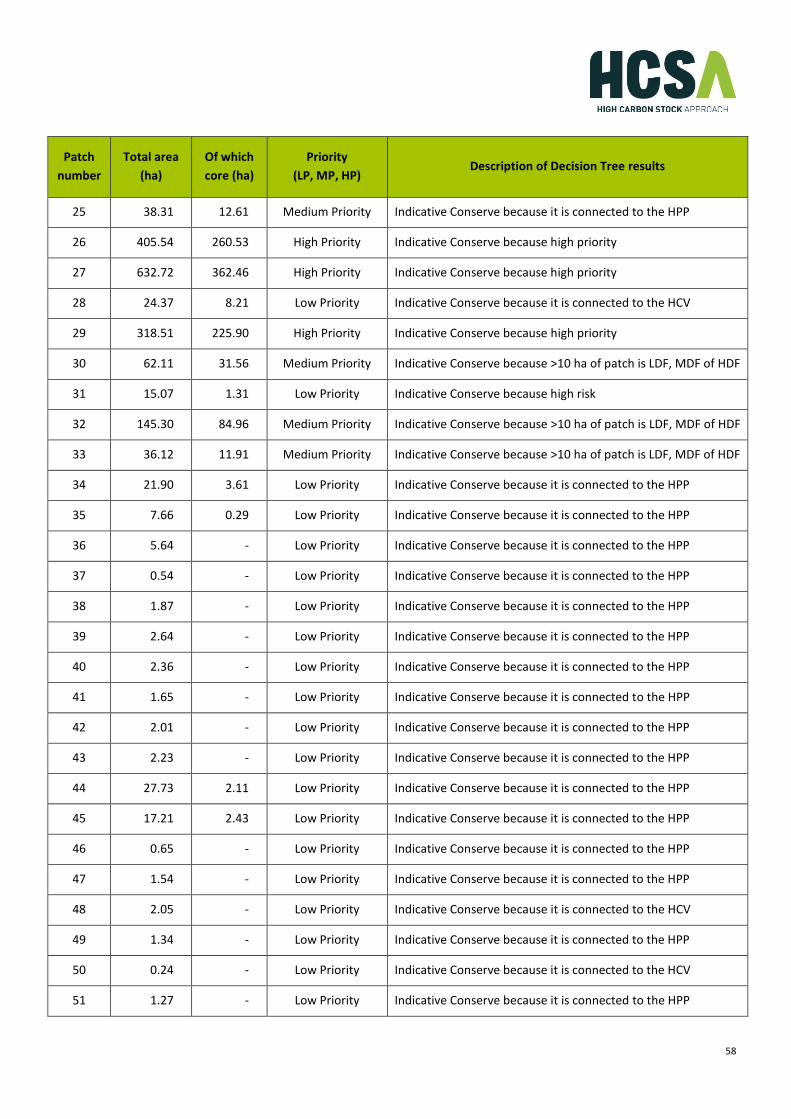
58
Patch
number
Total area
(ha)
Of which
core (ha)
Priority
(LP, MP, HP) Description of Decision Tree results
25 38.31 12.61 Medium Priority Indicative Conserve because it is connected to the HPP
26 405.54 260.53 High Priority Indicative Conserve because high priority
27 632.72 362.46 High Priority Indicative Conserve because high priority
28 24.37 8.21 Low Priority Indicative Conserve because it is connected to the HCV
29 318.51 225.90 High Priority Indicative Conserve because high priority
30 62.11 31.56 Medium Priority Indicative Conserve because >10 ha of patch is LDF, MDF of HDF
31 15.07 1.31 Low Priority Indicative Conserve because high risk
32 145.30 84.96 Medium Priority Indicative Conserve because >10 ha of patch is LDF, MDF of HDF
33 36.12 11.91 Medium Priority Indicative Conserve because >10 ha of patch is LDF, MDF of HDF
34 21.90 3.61 Low Priority Indicative Conserve because it is connected to the HPP
35 7.66 0.29 Low Priority Indicative Conserve because it is connected to the HPP
36 5.64 - Low Priority Indicative Conserve because it is connected to the HPP
37 0.54 - Low Priority Indicative Conserve because it is connected to the HPP
38 1.87 - Low Priority Indicative Conserve because it is connected to the HPP
39 2.64 - Low Priority Indicative Conserve because it is connected to the HPP
40 2.36 - Low Priority Indicative Conserve because it is connected to the HPP
41 1.65 - Low Priority Indicative Conserve because it is connected to the HPP
42 2.01 - Low Priority Indicative Conserve because it is connected to the HPP
43 2.23 - Low Priority Indicative Conserve because it is connected to the HPP
44 27.73 2.11 Low Priority Indicative Conserve because it is connected to the HPP
45 17.21 2.43 Low Priority Indicative Conserve because it is connected to the HPP
46 0.65 - Low Priority Indicative Conserve because it is connected to the HPP
47 1.54 - Low Priority Indicative Conserve because it is connected to the HPP
48 2.05 - Low Priority Indicative Conserve because it is connected to the HCV
49 1.34 - Low Priority Indicative Conserve because it is connected to the HPP
50 0.24 - Low Priority Indicative Conserve because it is connected to the HCV
51 1.27 - Low Priority Indicative Conserve because it is connected to the HPP
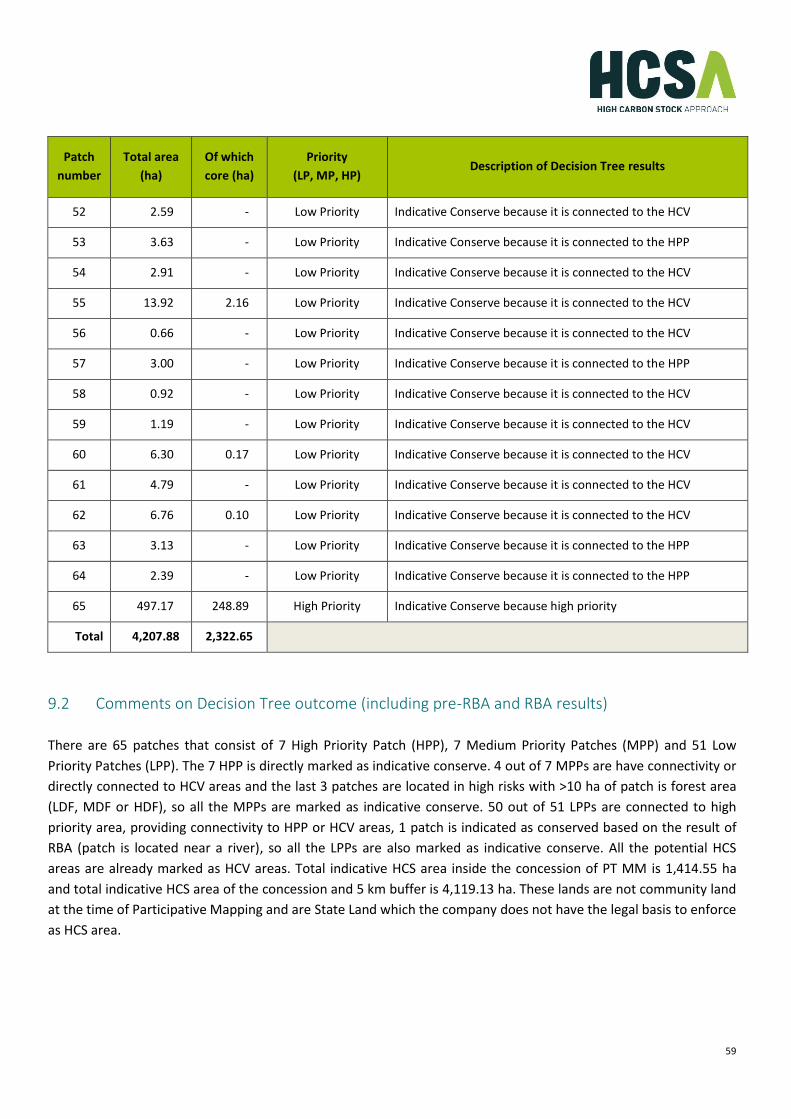
59
Patch
number
Total area
(ha)
Of which
core (ha)
Priority
(LP, MP, HP) Description of Decision Tree results
52 2.59 - Low Priority Indicative Conserve because it is connected to the HCV
53 3.63 - Low Priority Indicative Conserve because it is connected to the HPP
54 2.91 - Low Priority Indicative Conserve because it is connected to the HCV
55 13.92 2.16 Low Priority Indicative Conserve because it is connected to the HCV
56 0.66 - Low Priority Indicative Conserve because it is connected to the HCV
57 3.00 - Low Priority Indicative Conserve because it is connected to the HPP
58 0.92 - Low Priority Indicative Conserve because it is connected to the HCV
59 1.19 - Low Priority Indicative Conserve because it is connected to the HCV
60 6.30 0.17 Low Priority Indicative Conserve because it is connected to the HCV
61 4.79 - Low Priority Indicative Conserve because it is connected to the HCV
62 6.76 0.10 Low Priority Indicative Conserve because it is connected to the HCV
63 3.13 - Low Priority Indicative Conserve because it is connected to the HPP
64 2.39 - Low Priority Indicative Conserve because it is connected to the HPP
65 497.17 248.89 High Priority Indicative Conserve because high priority
Total 4,207.88 2,322.65
9.2 Comments on Decision Tree outcome (including pre-RBA and RBA results)
There are 65 patches that consist of 7 High Priority Patch (HPP), 7 Medium Priority Patches (MPP) and 51 Low
Priority Patches (LPP). The 7 HPP is directly marked as indicative conserve. 4 out of 7 MPPs are have connectivity or
directly connected to HCV areas and the last 3 patches are located in high risks with >10 ha of patch is forest area
(LDF, MDF or HDF), so all the MPPs are marked as indicative conserve. 50 out of 51 LPPs are connected to high
priority area, providing connectivity to HPP or HCV areas, 1 patch is indicated as conserved based on the result of
RBA (patch is located near a river), so all the LPPs are also marked as indicative conserve. All the potential HCS
areas are already marked as HCV areas. Total indicative HCS area inside the concession of PT MM is 1,414.55 ha
and total indicative HCS area of the concession and 5 km buffer is 4,119.13 ha. These lands are not community land
at the time of Participative Mapping and are State Land which the company does not have the legal basis to enforce
as HCS area.
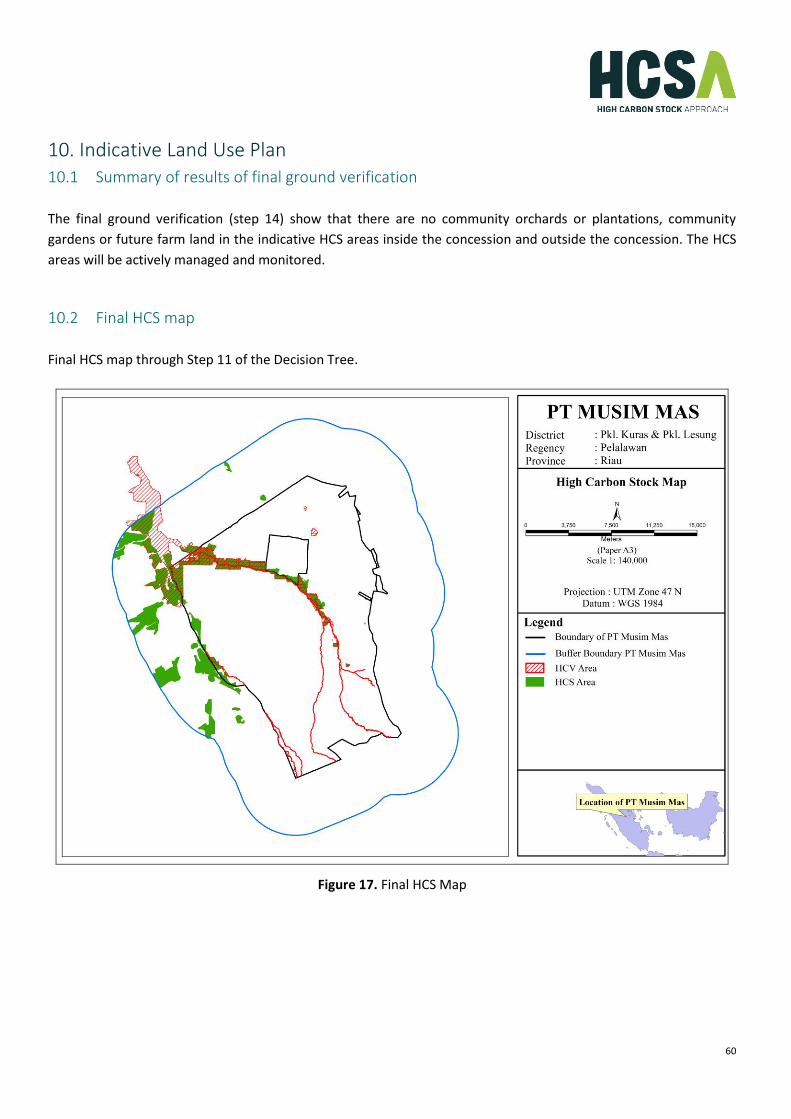
60
10. Indicative Land Use Plan 10.1 Summary of results of final ground verification
The final ground verification (step 14) show that there are no community orchards or plantations, community
gardens or future farm land in the indicative HCS areas inside the concession and outside the concession. The HCS
areas will be actively managed and monitored.
10.2 Final HCS map
Final HCS map through Step 11 of the Decision Tree.
Figure 17. Final HCS Map

61
10.3 Overview of forest conservation management and monitoring activities to be included in
the Conservation and Development (land use) Plan
Management and monitoring activities that will be included in the conservation and development plan including:
a. Identified HCS areas will be excluded from land development plans, set them to No-Go areas and will be
informed to relevant stakeholders.
b. For landscape level, protected area management needs to be strengthened, such as raising awareness
among local communities to stop logging, hunting and burning in conservation areas.
c. Raise awareness with agreements with the local communities. Incentive program will be developed and
consultation with local community. Continuation of the “fire free village programme” – potentially
extending this to include conservation areas within the concession.
d. Socialization and communication with surrounding communities regarding the boundaries of HCV-HCS
areas, HCV-HCS essential functions, and participatory management and monitoring.
e. Development of collaborative efforts and cooperation with relevant stakeholders in order to conserve and
protect Conservation area including HCS-HCV area within concession and on landscape level.
f. Threat monitoring (illegal logging, fire, poaching, logging company etc.) through regular patrol.
g. Species enrichment by trees planting.
10.4 List of activities still to be carried out before Conservation and Development Plan can be
finalised
Socialization of the result of HCS Assessment and its development plan must be done before finalization.