
Summary Report of the Iowa Text Reader … Summary Report of the Iowa Text Reader Longitudinal Study...
24
Iowa Text Reader Longitudinal Study Iowa Text Reader Longitudinal Study Summary Report of the Iowa Text Reader Longitudinal Study 2006–2007
Transcript of Summary Report of the Iowa Text Reader … Summary Report of the Iowa Text Reader Longitudinal Study...
Iowa Text Reader Longitudinal StudyIowa Text Reader
Longitudinal Study
Summary Report of the
Iowa Text Reader Longitudinal Study
2006–2007

�
Table of Contents
Introduction . . . . . . . . . . . . . . . . . . . . . . . . . . . . . . . . . . . . . . . . . . . . . .2
Overview . . . . . . . . . . . . . . . . . . . . . . . . . . . . . . . . . . . . . . . . . . . . . . . . .3
Tier One . . . . . . . . . . . . . . . . . . . . . . . . . . . . . . . . . . . . . . . . . . . . . . . . . .3
Training . . . . . . . . . . . . . . . . . . . . . . . . . . . . . . . . . . . . . . . . . . . . . . . . . .4
Data Collection . . . . . . . . . . . . . . . . . . . . . . . . . . . . . . . . . . . . . . . . . . . .4
Reading Fluency and Comprehension Data . . . . . . . . . . . . . . . . .5
ITBS Scores . . . . . . . . . . . . . . . . . . . . . . . . . . . . . . . . . . . . . . . . . . .5
Levels of Use Interview . . . . . . . . . . . . . . . . . . . . . . . . . . . . . . . . . .6
Student and Teacher Digital Text Matrices . . . . . . . . . . . . . . . . . .6
Student and Teacher Impact Surveys . . . . . . . . . . . . . . . . . . . . . .6
Absences, Number of Times Tardy, and Office Referrals . . . . . . .6
Digital Text Portfolios . . . . . . . . . . . . . . . . . . . . . . . . . . . . . . . . . . .6
Summary of Results . . . . . . . . . . . . . . . . . . . . . . . . . . . . . . . . . . . . . . . .7
Reading Fluency and Comprehension Data . . . . . . . . . . . . . . . . .7
Reading Fluency (words per minute) . . . . . . . . . . . . . . . . . . . . . . .7
Passage Comprehension . . . . . . . . . . . . . . . . . . . . . . . . . . . . . . . . .8
ITBS scores . . . . . . . . . . . . . . . . . . . . . . . . . . . . . . . . . . . . . . . . . . .11
Levels of Use Interview . . . . . . . . . . . . . . . . . . . . . . . . . . . . . . . . .12
Student Digital Text Matrix . . . . . . . . . . . . . . . . . . . . . . . . . . . . .13
Student Impact Survey . . . . . . . . . . . . . . . . . . . . . . . . . . . . . . . . .13
Social Behavioral Data . . . . . . . . . . . . . . . . . . . . . . . . . . . . . . . . .14
Teacher Digital Text Matrix . . . . . . . . . . . . . . . . . . . . . . . . . . . . .15
Teacher Survey . . . . . . . . . . . . . . . . . . . . . . . . . . . . . . . . . . . . . . .16
Digital Text Portfolios . . . . . . . . . . . . . . . . . . . . . . . . . . . . . . . . . .16
Discussion . . . . . . . . . . . . . . . . . . . . . . . . . . . . . . . . . . . . . . . . . . . . . . .17
Summary . . . . . . . . . . . . . . . . . . . . . . . . . . . . . . . . . . . . . . . . . . . . . . . .19

2 Summary Report of the Iowa Text Reader Longitudinal Study 2006-2007
IntroductionAfter the passage of No Child Left Behind, educators were challenged to find effective, research-based interventions that would help close the achievement gap for students with special needs . A review of the literature found little research existed at that time . In response, the Iowa Assistive Technology Text Reader Project, under the auspices of Iowa Department of Education, Bureau of Children, Family, and Community Services studied the impact of the use of text-to-speech (TTS) software like Kurzweil 3000 on student achievement .
The Iowa Text Reader Longitudinal Study 2006-2007 was the work of a collaborative team from across the state of Iowa. A multidisciplinary study committee of five individuals designed and managed the implementation of the Iowa Assistive Technology Text Reader Project . Assistive technology liaisons from across the state were trained, collected data, and supported the implementation with their students and teachers . Classroom teachers then implemented the design in their classroom setting .
This study hypothesized that use of Kurzweil 3000 as an accommodation would improve student access to core content through improved fluency and comprehension . The Time Series Concurrent and Differential (TSCD) Approach (Smith, 2000) was used to study enhanced student performance by comparing comprehension on passages read with and without the TTS software . Twenty middle school special education students and nine teachers participated in the second year of this longitudinal study . Students and teachers received training on the Kurzweil 3000 software to implement with core content . Biweekly progress monitoring data were collected for 27 weeks using curriculum-based measures of fluency and comprehension . Periodically, subjective measures of implementation, participant satisfaction, and proficiency were also gathered. The results documented that students accessed information twice as fast and performed significantly better on passage comprehension measures when accommodated with the Kurzweil 3000 than when not accommodated . The use of the TTS software also allowed students to demonstrate significantly improved comprehension scores on factual and inferential comprehension questions . Participants reported strong positive feelings on staying on task, reading the text, understanding passages and working independently. Overall, use of the TTS software provided significant impact on fluency, passage comprehension on both recall and inferential questions, and improved school behaviors .
While software, training and support were provided through the Iowa Department of Education, Bureau of Children, Family, and Community Services; Iowa Program for Assistive Technology (IPAT), Area Education Agencies (AEAs), Local Education Agencies (LEAs), and Cambium Learning Technologies (Kurzweil Educational Systems), this study was the independent work of Iowa Assistive Technology Liaisons .

�
OverviewFor the last three years the Iowa Assistive Technology Text Reader Project has examined the impact of the use of text reader software on student achievement in an ongoing attempt to find effective interventions to close the achievement gap between students with disabilities and their non-disabled peers . During the 2006-2007 school year, the study was divided into three tiers .
Tier One studied the impact of text reader use for the second consecutive year with the students from the 2005-2006 study . Tier Two studied the impact of the 2004-2005 study over time through student and teacher interviews as well as record reviews of student files. Tier Three studied the impact of 2005-2006 study through student and teacher interviews as well as record reviews of student files.
A collaborative committee developed tools, professional development materials, and data collection analysis used in the study . Software, training and support were provided through the Iowa Department of Education, Bureau of Children, Family, and Community Services; Iowa Program for Assistive Technology (IPAT), Area Education Agencies (AEAs), Local Education Agencies (LEAs), and Cambium, Inc . During the 2006-2007 school year, training was provided to Assistive Technology contacts in the following areas:
Use of Kurzweil 3000 with embedded study skills
Curriculum-based measurement strategies
Levels of Use interviews
Stages of Concern implementation surveys (on-line)
Teacher impact surveys
Student impact surveys
Tier OneThe Iowa Assistive Technology Text Reader Tier One Study (2006-2007) was a longitudinal study that followed a voluntary subset of the 2005-2006 project participants . For the second year, the study compared student reading performance (fluency and comprehension). Students read controlled vocabulary passages with and without the use of text reader software . Other outcome measures such as ITBS scores, social behavioral indices, and system change measures were also monitored and examined . The research design included descriptive and empirical measures .
•
•
•
•
•
•

� Summary Report of the Iowa Text Reader Longitudinal Study 2006-2007
Twenty students attending rural or urban schools across the state of Iowa were selected for this study . The selection criteria were as follows:
students in grade seven or grade eight
students with Individual Education Programs (IEP), demonstrating mild to moderate disabilities (Levels 1 or 2)
evidence of reading goals in the area of passage comprehension, reading fluency, or vocabulary
students scoring in the non-proficient range on the reading subtests of the Iowa Test of Basic Skills
Data were gathered on 20 students meeting the above criteria over three academic quarters . Due to missing data on various other measures of the study, the total number included in various analysis was often less than the 20 students meeting the basic criteria for inclusion in the study . Ten students were seventh graders (50%) . Ten students were eighth graders (50%) .
TrainingFor the Tier One project, a six-hour refresher training session was provided to the assistive technology contacts in the use of Kurzweil 3000 with embedded study skills, curriculum-based measurement strategies, Levels of Use interviews, Stages of Concern implementation surveys, teacher impact surveys, and student impact surveys . The assistive technology contacts then provided local training for the teachers and students who participated in the study .
Data CollectionThe Time Series Concurrent and Differential (TSCD) Approach (Smith, 2000) was used to study the enhanced performance of students using a text reader by comparing student comprehension on passages read with and without the text reader . The order of presentation was randomly varied . These repeated measures over time with and without assistive technology should provide evidence of the impact and outcome of assistive technology use . The expectation would be that enhanced performance would be evident and the achievement gap would narrow .
•
•
•
•

�
For 27 weeks students used Kurzweil 3000, a text reader with embedded study skills, to access reading in content curriculum such as social studies, science, language arts or other selected curricula .
Every other week, student reading performance (fluency and comprehension) was measured . Students read controlled vocabulary passages with and without the use of text reader software .
Six times during the study the teachers completed a measure of user comfort (Levels of Use Survey) .
Two times the teachers and administrators completed a measure of system implementation (Stages of Implementation) .
Throughout the year, teachers submitted four portfolios demonstrating use of the embedded study skills .
Six times during the study, students and teachers rated themselves on a measure of student/teacher implementation (Digital Text Matrices) .
At the conclusion both students and teachers responded to impact surveys .
The following data were collected .
Reading Fluency and Comprehension Data
Reading data were collected on student reading fluency and passage comprehension on carefully matched Jamestown controlled vocabulary reading probes . The paper and scanned probes were matched for reading difficulty as measured by the Flesch-Kincaid Readability Measures. The reading difficulty of the seventh grade reading passages varied . The probes were sequenced from the 6 .9 grade level to the 8 .9 grade level on the print and scanned passages . The data were collected every other week by the assistive technology contacts .
ITBS Scores
The Iowa Test of Basic Skills (ITBS) scores from the 2004-2005 school year were used as baseline data in the domains of reading comprehension, vocabulary, science, and social studies . These outcome measures were collected for the 2005-2006, and 2006-2007 school years . This process provided longitudinal data regarding the impact on academic performance .
•
•
•
•
•
•

6 Summary Report of the Iowa Text Reader Longitudinal Study 2006-2007
Levels of Use Interview
The Concerns Based Adoption Model (CBAM) tool, Level of Use Interview, was used to monitor the implementation of the study during 2006-2007 . The Levels of Use Interview was adapted to a survey format . It was completed online six times by local study implementers and their assistive technology contacts . This generated data on positive information and barriers of concern for implementing the text reader software. When this information was identified, the assistive technology contact coached the implementer to problem solve issues of concern for using the text reader .
Student and Teacher Digital Text Matrices
The Student and Teacher Digital Text Matrices record student or teacher progress across a variety of domains . The Student Digital Text Matrix measures facilitated or independent student use of the text reader . The Teacher Digital Text Matrix measures knowledge and implementation of the software, accessibility, technology issues, and school-wide use . The matrices were designed to be able to monitor individual change as well as system change . The matrices were completed six times to include their reflected use and competency level for access and integration of text reader software with print learning tasks . Students worked with an implementer or an assistive technology contact to complete a Student Digital Matrix . They ranked their individual level of performance with independent navigation, frequency of access, and use of the text reader software with embedded study skills .
Student and Teacher Impact Surveys
Students and teachers completed impact surveys at the conclusion of the study . These surveys were completed using an online survey tool . They reported their subjective impressions of the implementation, satisfaction, and effectiveness of the text reader with embedded study skills .
Absences, Number of Times Tardy, and Office Referrals
Data were collected on student attendance, tardies, and the number of times they were referred to the office for disciplinary action.
Digital Text Portfolios
The digital text portfolios submitted by teachers four times a year demonstrated use of the embedded study skills as part of teacher instruction and implementation .
7
Summary of Results
Reading Fluency and Comprehension Data
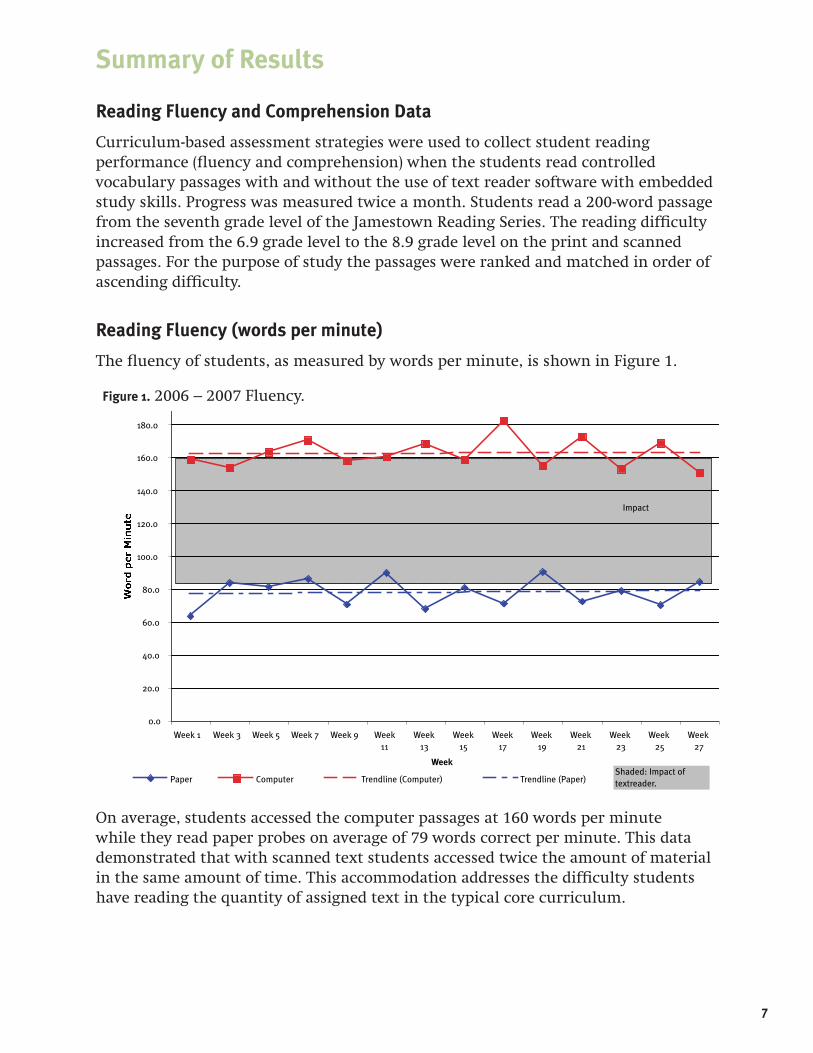
Curriculum-based assessment strategies were used to collect student reading performance (fluency and comprehension) when the students read controlled vocabulary passages with and without the use of text reader software with embedded study skills . Progress was measured twice a month . Students read a 200-word passage from the seventh grade level of the Jamestown Reading Series. The reading difficulty increased from the 6 .9 grade level to the 8 .9 grade level on the print and scanned passages . For the purpose of study the passages were ranked and matched in order of ascending difficulty.
Reading Fluency (words per minute)
The fluency of students, as measured by words per minute, is shown in Figure 1.
On average, students accessed the computer passages at 160 words per minute while they read paper probes on average of 79 words correct per minute . This data demonstrated that with scanned text students accessed twice the amount of material in the same amount of time. This accommodation addresses the difficulty students have reading the quantity of assigned text in the typical core curriculum .
Figure �. 2006 – 2007 Fluency .
� Summary Report of the Iowa Text Reader Longitudinal Study 2006-2007
Fuchs, Fuchs, Hamlett, Walz, & Germann (1993) report that the realistic weekly improvement rate in reading fluency for seventh grade special education students is .3 words per week . This would predict an 8 .1 word per minute increase in oral reading rate in the twenty-seven weeks of this study. As the figure above shows, students maintained their reading fluency on paper passages despite increased passage difficulty. By controlling increased reading passage difficulty the design confounded the reading fluency results. This result was very consistent with the results of the 2005-2006 study .
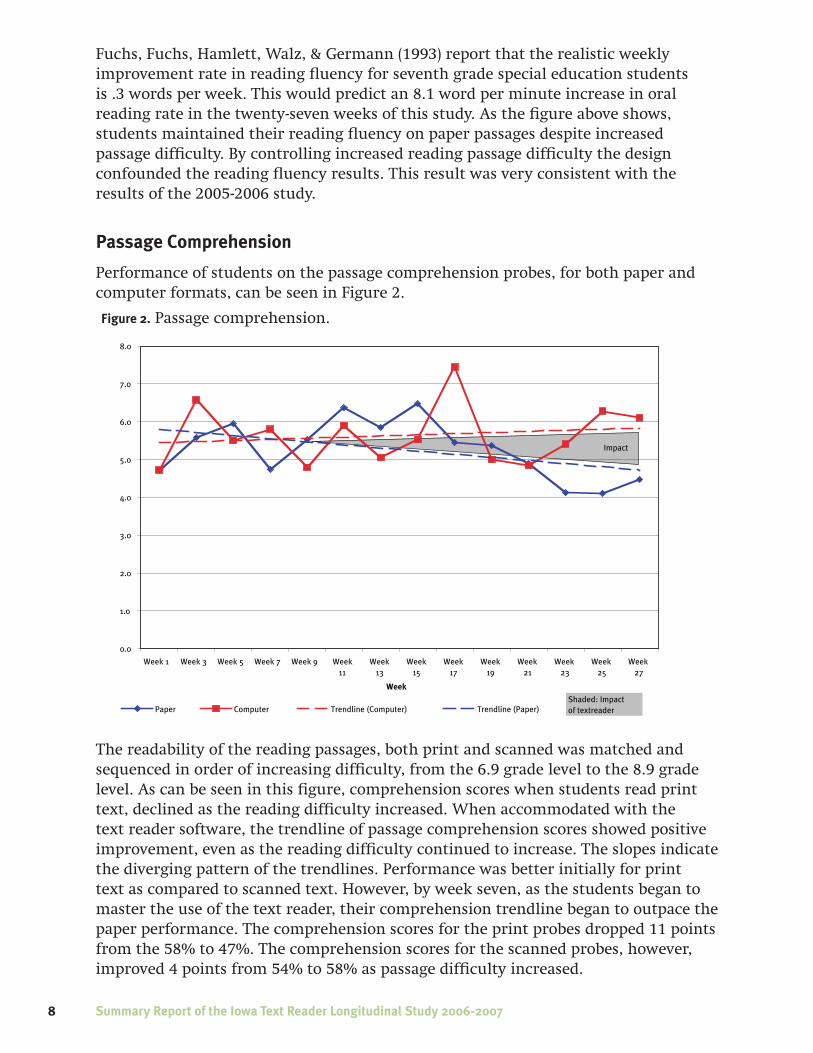
Passage Comprehension
Performance of students on the passage comprehension probes, for both paper and computer formats, can be seen in Figure 2 .
The readability of the reading passages, both print and scanned was matched and sequenced in order of increasing difficulty, from the 6.9 grade level to the 8.9 grade level. As can be seen in this figure, comprehension scores when students read print text, declined as the reading difficulty increased. When accommodated with the text reader software, the trendline of passage comprehension scores showed positive improvement, even as the reading difficulty continued to increase. The slopes indicate the diverging pattern of the trendlines . Performance was better initially for print text as compared to scanned text . However, by week seven, as the students began to master the use of the text reader, their comprehension trendline began to outpace the paper performance . The comprehension scores for the print probes dropped 11 points from the 58% to 47% . The comprehension scores for the scanned probes, however, improved 4 points from 54% to 58% as passage difficulty increased.
Figure 2. Passage comprehension .

�
The significance of these diverging trendlines was evaluated. For each student, for each week, the difference between his or her score on computer and paper probes was calculated . An analysis of variance revealed that these difference scores changed over time, and the result was highly significant, F(4.712, p<.001), showing that the differences between paper and computer comprehension scores over time was significant.
In the first year of the study, students did not reach the tipping point (point at which student performance trendlines crossed and continued to diverge) until after thirteen weeks of experience . Regression over the summer would have been expected . Possible factors could include regression and recoupment, new instructional staff, and increasingly demanding curriculum . However, the second year data shows earlier crossover of trendlines . During their second year of use, crossover occurred at week seven where comprehension on computer assisted reading exceeded comprehension on paper probes .
To examine the difference in performance on fact recall versus inference comprehension questions, the data was further analyzed as displayed on Figure 3 .
Figure �. Interaction of question type with presentation format .

�0 Summary Report of the Iowa Text Reader Longitudinal Study 2006-2007
In looking at the interaction of question type with presentation format, several interesting findings were apparent.
Paper and computer fact questions…
Performance on fact comprehension questions was consistently stronger than inferential comprehension on both paper and computer probes .
As the passages increased in difficulty
Accuracy on paper probes fact questions dropped .
Accuracy on computer probe fact questions remained stable .
Comprehension scores for fact questions on the paper probes dropped 17 points from 70% to 53% .
Comprehension scores for fact questions on the computer probes remained steady at 62%. This is in contrast to the first year of the study where accuracy with fact questions on computer probes dropped 4 points .
Paper and computer inferential questions…
On computer and paper inferential questions, the trendlines diverged as passage difficulty increased.
Performance on the inferential comprehension questions started out the same for paper and computer probes. As passage difficulty increased the inferential trendlines diverged with performance on computer probes improving while paper probes decreased .
Comprehension scores on inferential questions on the paper probes dropped 6 points (from 47% to 41%) .
Comprehension scores on inferential questions on computer probes increased 6 points (from 47% to 53%) .
This is in contrast to the first year of the study where accuracy with inferential questions on computer probes dropped one point . That indicates a change of trendline direction and a 7-point improvement in comprehension scores when comparing the two years .
Student performance on inferential questions (higher level thinking) improved during the second year of text reader use .
The significance of these diverging trendlines for the interaction of question type and mode of presentation was evaluated . For each student, for each week, the difference between his or her score on computer versus paper probes and fact versus inference was calculated . An analysis of variance revealed that these difference scores changed over time, and the result was highly significant, F(7.215, p<.0001), showing that the differences between paper and computer comprehension scores over time were significant. This is evidence of the empirical significance, as well as the educational significance of the effectiveness of this accommodation.
1 .
2 .
•
•
3 .
4 .
1 .
2 .
3 .
4 .
5 .
6 .

��
ITBS scores
Looking at group performance on the ITBS, median ITBS scores are displayed in Figure 4 .
The chart shows that the median scores increased for vocabulary, reading comprehension, science, and social studies over the three-year period with movement toward proficiency.
Measuring whether or not student growth occurred in ITBS scores over the three-year period requires an analysis of standard scores . Since most Iowa schools only report standard scores, National Percentile Rank Scores (NPR rank scores) were requested because those are the scores used for NCLB accountability purposes . Nevertheless, we can look at whether individual students improved in their rank from one year to the next . The next four charts show the percentage of students who improved in rank from 2004-2005 to 2005-2006 (a one year period), from 2005-2006 to 2006-2007 (a one year period), and from 2004-2005 to 2006-2007 (a two year period) . Figures 5 through 8 display the scores for vocabulary, reading comprehension, science, and social studies .
Figure �. Median ITBS NPR scores by test and year .
�2 Summary Report of the Iowa Text Reader Longitudinal Study 2006-2007
Levels of Use Interview
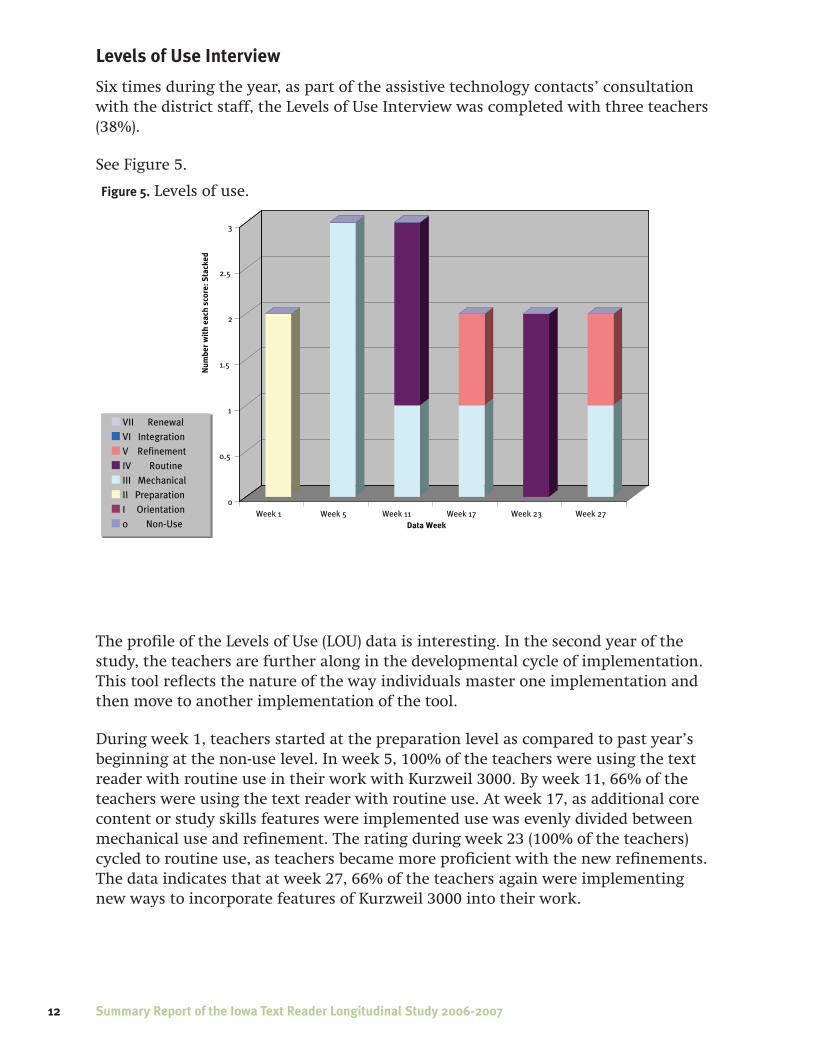
Six times during the year, as part of the assistive technology contacts’ consultation with the district staff, the Levels of Use Interview was completed with three teachers (38%) .
See Figure 5 .
The profile of the Levels of Use (LOU) data is interesting. In the second year of the study, the teachers are further along in the developmental cycle of implementation . This tool reflects the nature of the way individuals master one implementation and then move to another implementation of the tool .
During week 1, teachers started at the preparation level as compared to past year’s beginning at the non-use level . In week 5, 100% of the teachers were using the text reader with routine use in their work with Kurzweil 3000 . By week 11, 66% of the teachers were using the text reader with routine use . At week 17, as additional core content or study skills features were implemented use was evenly divided between mechanical use and refinement. The rating during week 23 (100% of the teachers) cycled to routine use, as teachers became more proficient with the new refinements. The data indicates that at week 27, 66% of the teachers again were implementing new ways to incorporate features of Kurzweil 3000 into their work .
Figure �. Levels of use .

��
Student Digital Text Matrix
The Student Digital Text Matrix measures the proficiency of facilitated or independent student use of the text reader. Student scores reflect individual use and can be rated on a continuum from Beginning Facilitated user (0 to 4), Emerging Facilitated user (5 to 6), Proficient Facilitated user (7 to 12), Proficient Independent user (13 to 18), Skilled Independent user (19 to 24) . See Figure 6 for student scores .
Over the course of the study, the average scores moved from the Beginning Facilitated user level to the Proficient Facilitated user level. Two students scored in the Proficient Independent user range . Middle school students typically score no higher than the Proficient Facilitated user level range due to limited opportunities to access technology, teacher changes, teacher proficiency with the technology, and other systemic barriers .
Student Impact Survey
At the end of their intervention cohort, 20 students (100%) completed an online survey assessing their impressions of the project and the impact of the text reader software on their access to the general education curriculum . The survey of the results shows a generally positive view of the text reader .
Figure 6. Student digital text matrix .

�� Summary Report of the Iowa Text Reader Longitudinal Study 2006-2007
0�-06 06-07 Item91% 65% liked the software . 91% 90% thought it was pretty easy or very easy to learn . 91% 85% reported it helped them with their schoolwork . 100% 95% thought it helped them with their reading . 85% 75% reported it helped them stay on task . 97% 80% reported it helped them work better independently . 84% 50% reported it helped them earn better grades on tests . 52% 30% reported it helped them have better attendance at school . 87% 55% reported it helped them feel better about themselves . 94% 60% reported it helped interest them in what they were learning . 94% 95% reported it helped them understand what was written in their books . 87% 55% reported it helped them get their work done . 71% 30% reported it improved how well they wrote .
The differences from years 2005-2006 to years 2006-2007 may be due to the acclimation to a new program or the difference in group size (from 32 (52%) to 20 (100%)) . When asked, “How else has the Kurzweil text reader software helped you?” students commented that it helped them answer questions, learn new words, and read from their science and social studies books . It is interesting to note that the essential impact elements continue to receive the highest ratings . Students thought the text reader was easy to learn and continue to report strong positive impact on reading, comprehension, and the ability to work independently .
Social Behavioral Data
The students attribute many positive outcomes to the use of the text reader software . The median number of absences, tardies, and office referrals for Tier 1 students over a three-year period is shown in the following chart . Figure 7 shows that overall there has been a drop in the number over that period of time .
Figure 7. School behavior data: Median number of absences, tardies, and office referrals by year .
��
The improvements in absences and tardies are consistent with the student report on the student impact survey . The decrease in absences means students will have more access to core instruction and the curriculum .
Teacher Digital Text Matrix
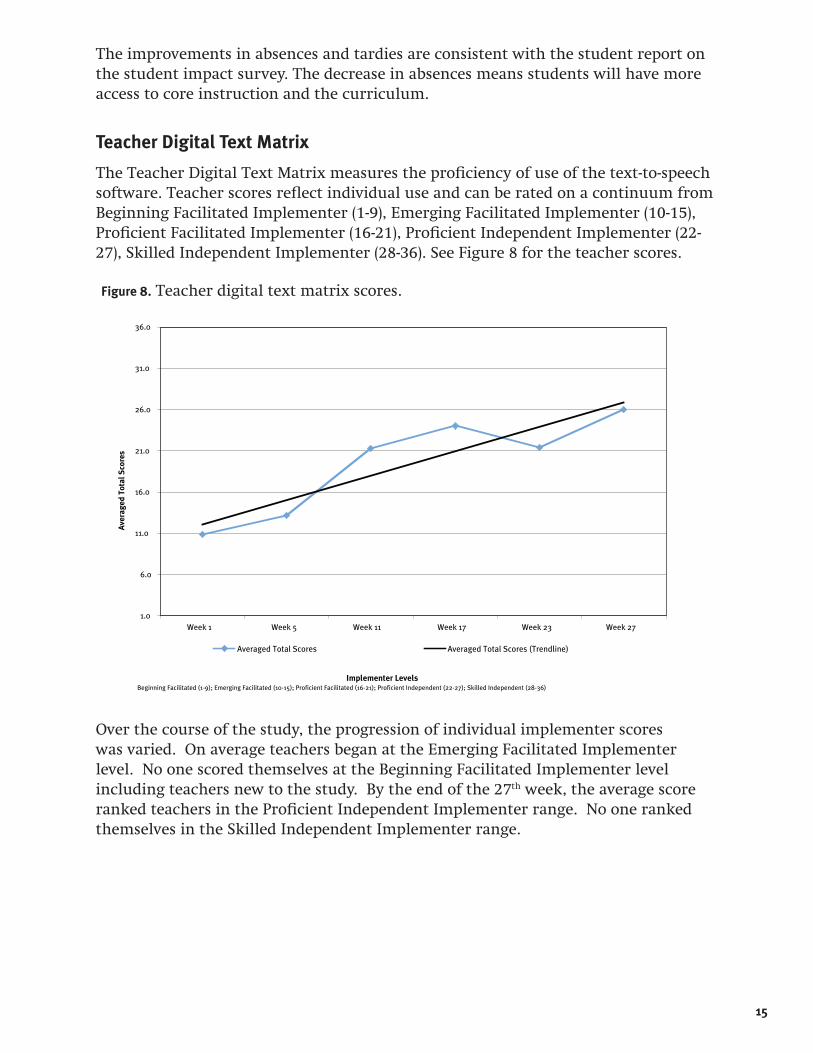
The Teacher Digital Text Matrix measures the proficiency of use of the text-to-speech software. Teacher scores reflect individual use and can be rated on a continuum from Beginning Facilitated Implementer (1-9), Emerging Facilitated Implementer (10-15), Proficient Facilitated Implementer (16-21), Proficient Independent Implementer (22- 27), Skilled Independent Implementer (28-36) . See Figure 8 for the teacher scores .
Over the course of the study, the progression of individual implementer scores was varied . On average teachers began at the Emerging Facilitated Implementer level . No one scored themselves at the Beginning Facilitated Implementer level including teachers new to the study . By the end of the 27th week, the average score ranked teachers in the Proficient Independent Implementer range. No one ranked themselves in the Skilled Independent Implementer range .
Figure �. Teacher digital text matrix scores .

�6 Summary Report of the Iowa Text Reader Longitudinal Study 2006-2007
Teacher Survey
Eight (89%) completed the online survey assessing their impressions of the Study and the impact of the text reader software .
06-07 Item87 .5% liked using the Kurzweil text reader . 75% said it was easy to implement with their student37 .5% thought it was easy to learn while 62.5% said it was a little difficult to learn100% reported it helped their students read . 75% reported it helped their students stay on task .100% reported it helped their students work independently . 75% reported it helped their students get better grades on tests . 12 .5% reported it increased attendance at school . 37 .5% reported it helped students feel better about themselves .75% reported it improved students’ interest in what they are learning . 87 .5% reported it helped students understand what is written in their books . 75% reported it helped students complete their work . 25% reported it helped students improve how well they wrote .
When asked advantages of participating in this study, they commented positively on receiving the software, learning new technology, and getting the students excited about using technology . For disadvantages of participating in the study, they listed difficulty implementing due to technology difficulties with computers in building, time for scanning, and trouble with access and scheduling .
Comparison to last year’s teacher ratings cannot be made since the groups have changed . It is interesting to note, however, that the essential impact elements continue to receive the highest ratings . Teachers continue to attribute strong positive impact on student reading, comprehension, and students’ ability to work independently .
Digital Text Portfolios
The digital text portfolios submitted by teachers demonstrated use of the embedded study skills as part of teacher instruction and implementation . Portfolios from the first reporting period demonstrated limited use of highlighting. These portfolios showed evidence of an organized system of highlighting . Portfolios from the second reporting period contained examples of bubble notes with text directions and study guides. Portfolios from the final reporting period demonstrated examples of web-based documents that were student generated . It was appears that the development and use of the embedded study skills was correlated with teacher level of use of the software .
�7
DiscussionThe results of the Iowa Text reader Project Tier One closely replicated the results of the 2005-2006 study. This longitudinal study demonstrated a notable finding in that students can access twice the amount of scanned text as print text in the same amount of time when using text reader software . This accommodation supports the students’ need to access core general education curriculum as well as the need to handle the pace and quantity of content material to be mastered .
Another significant finding was replicated from the 2005-2006 study. While the comprehension scores for print text declined as the reading difficulty increased, comprehension scores for scanned text improved slightly, even though the reading difficulty continued to increase. The diverging pattern of the comprehension scores was highly statistically significant. Performance was better initially for print text as compared to scanned text . However, by week seven, their computer comprehension rates surpassed the paper scores . The comprehension scores for the print probes dropped 11 points from 58% to 47% . The comprehension scores for the scanned probes improved 4 points from 54% to 58% as passage difficulty increased. In other words, even as the students used the text reader to access the curriculum materials at twice the rate, they were able to improve their comprehension levels on increasingly difficult material.
For the first time the study demonstrates the statistically significant impact of use of a text reader on student passage comprehension . An analysis of variance revealed that these difference scores changed over time, and the result was highly significant, F(4.712, p<.001), showing that the differences between paper and computer comprehension scores over time was significant.
Another significant new finding was the impact of the text reader on student comprehension scores for both factual and inferential questions . With the text reader, factual comprehension scores were maintained while scores on the inferential comprehension tests improved even as the level of instruction increased . Without the accommodation, both comprehension scores on print text decreased . Here is dramatic evidence of an effective strategy to improve higher-level thinking .
New evidence of the empirical and educational significance of the effectiveness accommodation was documented . For each student, for each week, the difference between his or her score on computer versus paper probes and fact versus inference was calculated . An analysis of variance revealed that these difference scores changed over time, and the result was highly significant, F(7.215, p<.0001), showing that the differences between paper and computer comprehension scores over time were significant. The use of the text reader with embedded study skills significantly improved comprehension on fact and inference questions .
In addition to the fluency and passage comprehension results being statistically highly significant, they are also educationally significant. The results demonstrate

�� Summary Report of the Iowa Text Reader Longitudinal Study 2006-2007
that students can access the core materials at twice the rate, with understanding, at levels of higher thinking, allowing them to work competitively in an inclusion setting . From a teacher perspective, the students would be more likely to be able to access and understand the same material as his peers while working independently .
As teachers move into more sophisticated use of the text reader new skills are assimilated into the teaching repertoire and routine use is demonstrated . The Level of Use Interview data indicated that the teachers in the study began at a more advanced level of use . By week 5 all teachers achieved the Mechanical level of use of the software . Teachers reported that they were less focused on preparation and concerns with mechanical issues in the environment and were able to increase to the Routine use of the software in their teaching repertoire . In conjunction with the teacher performance at week 5, at week 7 there is also a positive change in student performance .
Impact surveys reported generally positive subjective responses from the students . On critical elements like it “helped them with their reading,” students were highly supportive . Over the course of the two years, there was a general decline in their ratings . On the teacher impact surveys, teachers were highly positive on the three critical elements of whether it helped students read, increased student independence, and helped students understand their textbooks . Both groups agreed on these three key points . The survey results replicated other positive outcomes teachers associated with the use of the text reader software including improved academic performance, better on task behavior and more engagement in the instructional materials .
The text reader provides students improved access to the core curriculum . The text reader fits into the Iowa Decision Making Model (IDM). It is proven to be effective as an accommodation, specific intervention, or a component of supplemental or intensive levels of instruction . It increases the students’ ability to compete with their non-disabled peers . As a result the text reader effectively reduces the gap in learning proficiency.
Even with a smaller research group, the experience of the Iowa Text Reader Study highlighted the successes and difficulties of conducting statewide action-based research. The training demands, the technological difficulties, and level of coaching needed to maintain the study’s integrity proved challenging . There were still difficulties with scheduling and managing the work in addition to teacher workload. Frustrations still remained over the difficulty in conducting research with human subjects and the inability to identify a control group, however, denial of an appropriate instructional accommodation to eligible students was not an option .
��
SummaryTwenty students from across the state of Iowa participated for a second year in a 27-week longitudinal study of the impact of the use of a text reader software program with embedded study skills on multiple measures of academic performance . The Time Series Concurrent and Differential (TSCD) Approach (Smith, 2000) was used to study the enhanced performance of students using a text reader by comparing student comprehension on passages read with and without the text reader . The order of the reading format (print vs . scanned) of the probes was randomly varied . The repeated measures over time with and without assistive technology were used to provide evidence of the impact and outcome of assistive technology use . Enhanced performance was observed in the following areas:
Students demonstrated the ability to access twice as much information with improved comprehension levels .
With two years of use, students demonstrated improved comprehension even as the reading difficulty increased.
Without appropriate accommodations the comprehension scores declined, while with the accommodation comprehension scores improved .
Students performed statistically significantly better on passage comprehension measures when accommodated by the text reader than when not accommodated .
The use of the text reader allowed students to demonstrate improved comprehension scores on factual and inferential (higher level thinking) comprehension questions . When not accommodated their scores on the same tasks declined as the difficulty increased.
Greater gains were seen after the cumulative effect of two years of experience with the text reader than in the first year.
In the second year of use, the students moved to more fluid use sooner than they did in the first year (Week seven compared to week eleven).
In the second year of use, the teachers engaged more quickly and at higher implementation levels than in the first year.
Both the students and teachers participating reported strong positive feelings on feedback surveys linking the use of the text reader to a variety of positive school behaviors, such as staying on task . In addition, students and teachers alike reported strong support for essential impact items such as reading and comprehending text and working independently .
In addition to the results being statistically highly significant, they are also educationally significant. The results demonstrate that students can access the core materials at twice the rate, with understanding at levels of higher thinking, allowing them to work competitively in an inclusion setting . From a teacher perspective, the
•
•
•
•
•
•
•

20 Summary Report of the Iowa Text Reader Longitudinal Study 2006-2007
students using the text reader accommodation would be better able to independently access and understand the same material as his/her peers at an increased rate .
Special recognition goes to Carol Hagen, Eric Peterson, Diane Crouch, Denise Young, Kristi Minnick, Kathy Achenbach, and Steve Blake from NWAEA, AEA 13, AEA 14, and AEA 15 for all their hard work throughout the school year with the participating students and teachers . Without their efforts this project would not have been possible .
For additional information contact
Steven A . Maurer Iowa Department of Education Bureau of Children, Family and Community Services Grimes State Office Building Des Moines, Iowa 50319-0146 Phone: 515-281-3576 FAX: 515-242-6019 E-Mail: steve .maurer@iowa .gov
We wish to pay our respects to Roger Rachow (AEA 13) . Roger was a pioneer in the field of Assistive Technology in Iowa and the primary motivator for this Study. Without his insights and experience with text readers, the Study would not have moved forward at the pace it did nor garnered the results it did. Roger was first and foremost and an advocate for children with disabilities . We will miss him . He passed away in June of 2005 .
For additional information regarding this study contact
Joan Hodapp, Sector Coordinator AEA 267 jhodapp@mac .com
Cinda Rachow, Learning Supports Coordinator AEA 13 crachow@aea13 .org
Clair Judas, Special Education Technology Specialist AEA 267 cjudas@aea267 .k12 .ia .us
Cindy Munn, Regional Facilitator Supervisor Northwest AEA cmunn@nwaea .k12 .ia .us
Sandi Dimmitt, Assistive Technology Specialist Midwest Assistive Technology sandidimmitt@mac .com

Disclaimer
While software, training and support were provided through the Iowa Department of Education, Bureau of Children, Family, and Community Services; Iowa Program for Assistive Technology (IPAT), Area Education Agencies (AEAs), Local Education Agencies (LEAs), and Cambium Learning Technologies (Kurzweil Educational Systems), this study was the independent work of Iowa Assistive Technology Liaisons .

For more information regarding this study or to learn more about Kurzweil �000 contact:
Cambium Learning Technologies
100 Crosby Drive
Bedford, MA 01730
cambiumlearningtechnologies .com
1-800-894-5374


![Foucault, Michel - Order of Discourse [Untying the Text. a Post-Structuralist Reader]](https://static.fdocuments.in/doc/165x107/55cf9957550346d0339ce244/foucault-michel-order-of-discourse-untying-the-text-a-post-structuralist.jpg)

