SUMMARY OF SAFETY AND EFFECTIVENESS … DNA copy template. ... concentrations are reported in IU/mL...
34
PMA P160023: FDA Summary of Safety and Effectiveness Data Page 1 SUMMARY OF SAFETY AND EFFECTIVENESS DATA (SSED) I. GENERAL INFORMATION Device Generic Name: HCV RNA quantitative test Device Trade Name: Aptima ® HCV Quant Dx Assay Device Procode: MZP Applicant’s Name and Address: Hologic, Inc. 10210 Genetic Center Drive San Diego, CA 92121 Date(s) of Panel Recommendation: None Premarket Approval Application (PMA) Number: P160023 Date of FDA Notice of Approval: February 13, 2017 II. INDICATIONS FOR USE The Aptima HCV Quant Dx assay is a real-time transcription-mediated amplification (TMA) test used for both detection and quantitation of hepatitis C virus (HCV) RNA in fresh and frozen human serum and plasma from HCV-infected individuals. Plasma may be prepared in ethylenediaminetetraacetic acid (EDTA), anticoagulant citrate dextrose (ACD) solution, and plasma preparation tubes (PPT). Serum may be prepared in serum tubes and serum separator tubes (SST). Specimens are tested using the Panther system for automated specimen processing, amplification, detection, and quantitation. Specimens containing HCV genotypes 1 to 6 are validated for detection and quantitation in the assay. The Aptima HCV Quant Dx assay is indicated for use as an aid in the diagnosis of active HCV infection in the following populations: individuals with antibody evidence of HCV infection with evidence of liver disease, individuals suspected to be actively infected with HCV antibody evidence, and individuals at risk for HCV infection with antibodies to HCV. Detection of HCV RNA indicates that the virus is replicating and, therefore, is evidence of active infection. Detection of HCV RNA does not discriminate between acute and chronic states of infection. The Aptima HCV Quant Dx assay is also indicated for use as an aid in the management of HCV infected patients undergoing HCV antiviral drug therapy. The assay can be used to measure HCV RNA levels periodically prior to, during, and after treatment to determine sustained virological response (SVR) or nonsustained virological response (NSVR). Assay performance characteristics have been established for individuals
Transcript of SUMMARY OF SAFETY AND EFFECTIVENESS … DNA copy template. ... concentrations are reported in IU/mL...

PMA P160023: FDA Summary of Safety and Effectiveness Data Page 1
SUMMARY OF SAFETY AND EFFECTIVENESS DATA (SSED) I. GENERAL INFORMATION
Device Generic Name: HCV RNA quantitative test
Device Trade Name: Aptima® HCV Quant Dx Assay
Device Procode: MZP
Applicant’s Name and Address: Hologic, Inc. 10210 Genetic Center Drive San Diego, CA 92121
Date(s) of Panel Recommendation: None
Premarket Approval Application (PMA) Number: P160023
Date of FDA Notice of Approval: February 13, 2017
II. INDICATIONS FOR USE
The Aptima HCV Quant Dx assay is a real-time transcription-mediated amplification (TMA) test used for both detection and quantitation of hepatitis C virus (HCV) RNA in fresh and frozen human serum and plasma from HCV-infected individuals.
Plasma may be prepared in ethylenediaminetetraacetic acid (EDTA), anticoagulant citrate dextrose (ACD) solution, and plasma preparation tubes (PPT). Serum may be prepared in serum tubes and serum separator tubes (SST). Specimens are tested using the Panther system for automated specimen processing, amplification, detection, and quantitation. Specimens containing HCV genotypes 1 to 6 are validated for detection and quantitation in the assay.
The Aptima HCV Quant Dx assay is indicated for use as an aid in the diagnosis of active HCV infection in the following populations: individuals with antibody evidence of HCV infection with evidence of liver disease, individuals suspected to be actively infected with HCV antibody evidence, and individuals at risk for HCV infection with antibodies to HCV. Detection of HCV RNA indicates that the virus is replicating and, therefore, is evidence of active infection. Detection of HCV RNA does not discriminate between acute and chronic states of infection.
The Aptima HCV Quant Dx assay is also indicated for use as an aid in the management of HCV infected patients undergoing HCV antiviral drug therapy. The assay can be used to measure HCV RNA levels periodically prior to, during, and after treatment to determine sustained virological response (SVR) or nonsustained virological response (NSVR). Assay performance characteristics have been established for individuals

PMA P160023: FDA Summary of Safety and Effectiveness Data Page 2
infected with HCV and treated with certain direct-acting antiviral agents (DAA) regimens. No information is available on the assay’s predictive value when other therapies are used. The results from the Aptima HCV Quant Dx assay must be interpreted within the context of all relevant clinical and laboratory findings.
The Aptima HCV Quant Dx assay is not approved for use as a screening test for the presence of HCV RNA in blood or blood products.
III. CONTRAINDICATIONS
There are no known contraindications. IV. WARNINGS AND PRECAUTIONS
The warnings and precautions can be found in the Aptima® HCV Quant Dx Assay labeling. V. DEVICE DESCRIPTION
The Aptima HCV Quant Dx Assay involves three main steps, which all take place in a single tube on the Panther system: target capture, target amplification by transcription-mediated amplification (TMA), and detection of the amplification products (amplicon) by the fluorescent labeled probes (torches).
During target capture, viral RNA is isolated from specimens. The specimen is treated with a detergent to solubilize the viral envelope, denature proteins, and release viral genomic RNA. Capture oligonucleotides hybridize to highly conserved regions of the HCV genome, if present, in the test specimen. The hybridized target is then captured onto magnetic microparticles that are separated from the specimen in a magnetic field. Wash steps remove extraneous components from the reaction tube.
Target amplification occurs via TMA, which is a transcription-based nucleic acid amplification method that utilizes two enzymes, MMLV (Moloney murine leukemia virus) reverse transcriptase and T7 RNA polymerase. The reverse transcriptase is used to generate a DNA copy (containing a promoter sequence for T7 RNA polymerase) of the target sequence. T7 RNA polymerase produces multiple copies of RNA amplicons from the DNA copy template. The Aptima HCV Quant Dx Assay utilizes the TMA method to amplify the 5’ UTR of the HCV genome. Amplification of this region is achieved using specific primers which are designed to amplify HCV genotypes 1, 2, 3, 4, 5, and 6.
Detection is achieved using single-stranded nucleic acid torches that are present during the amplification of the target and that hybridize specifically to the amplicon in real-time. Each torch has a fluorophore and a quencher. When the torch is not hybridized to the amplicon, the quencher is in close proximity of the fluorophore and suppresses the fluorescence. When the torch binds to the amplicon, the quencher is moved away from the fluorophore and it will emit a signal at a specific wavelength when excited by a light source. As more torches hybridize to amplicons, a higher fluorescent signal is generated.

PMA P160023: FDA Summary of Safety and Effectiveness Data Page 3
The time taken for the fluorescent signal to reach a specified threshold is inversely proportional to the starting HCV concentration. Each reaction has an internal calibrator/internal control (IC) that controls for variations in specimen processing, amplification, and detection. The level of HCV RNA in a sample is determined by the Panther system software using the HCV and IC signals for each reaction and comparing them to calibration information. Components of the Aptima HCV Quant Dx Assay Kit The Aptima HCV Quant Dx Assay kit (100 tests) for the Panther system consists of 3 reagent kits:
Box 1: Aptima HCV Quant Dx Assay kit which contains the following reagents: • Amplification Reagent • Enzyme Reagent • Promoter Reagent • Amplification Reconstitution Reagent • Enzyme Reconstitution Reagent • Promoter Reconstitution Reagent • Target Capture Reagent
Box 2: Aptima HCV Quant Dx Controls kit which contains the following reagents:
• Negative Control • Low Positive Control • High Positive Control
Box 3: Aptima HCV Quant Dx Calibrator kit which contains the following reagent:
• Positive Calibrator
There is one ancillary kit required to perform the assay but available separately: Panther Run Kit for Real Time Assays which contains the following components:
• Aptima Assay Fluids kit (also known as Universal Fluids Kit) which contains Aptima Wash Solution, Aptima Buffer for Deactivation Fluid, and Aptima Oil Reagent
• Multi-tube units (MTUs) • Panther Waste Bag Kit • Panther Waste Bin Cover
There is one optional ancillary kit which can be procured separately, the Aptima Specimen Diluent Kit. The Aptima Specimen Diluent reagent provided in this kit

PMA P160023: FDA Summary of Safety and Effectiveness Data Page 4
is used to dilute plasma specimens that are tested with the Aptima HCV Quant Dx Assay on the Panther system.
Interpretation of Results The Panther system automatically determines the concentration of HCV RNA for specimens and controls by comparing the results to a calibration curve. HCV RNA concentrations are reported in IU/mL and log10 IU/mL. The interpretation of results is provided in the table below. If a 1:3 or 1:100 dilution is used for diluted specimens, the Panther system automatically calculates the HCV concentration for the neat specimen by multiplying the diluted concentration by the dilution factor and diluted specimens are flagged as diluted. Note: For diluted specimens, results listed as “Not Detected” or “< 10 Detected” may be generated by diluting a specimen with a concentration above, but close to the LoD (limit of detection) or LLoQ (lower limit of quantitation. It is recommended to collect and test another neat specimen if a quantitative result is not obtained with the diluted specimen.
The Panther system does not directly provide a qualitative result (i.e., “Detected” or “Not Detected”) for diagnostic use. The operator must interpret the reported HCV RNA concentration into a qualitative result as provided in Table 1.
Table 1: Results Interpretation
Reported Aptima HCV Quant Dx
HCV RNA Concentration Interpretation Clinical Interpretation
IU/mL Log10 Valueb
Not Detected
Not Detected
HCV RNA not detecteda.
Report results as “HCV not detected”
No Current HCV Infection Follow-up testing is recommended as per national HCV guidelines for viral load assessment, and no further testing is
d
<10 Detected <1.00
HCV RNA is detected but at a level below the Lower Limit of Quantification
(LLoQ) of the assay. Report results as “HCV
Follow-up testing is recommended as per national HCV guidelines for viral load assessment, and results must be interpreted within context of all relevant clinical and laboratory findingsd for diagnosis of HCV.
10 to 25 1.00 to 1.40
HCV RNA concentration is within linear range of the assay ≥10 IU/mL and <25
IU/mL
Provide guidance for treatment and care based on current national HCV treatment guidelines for diagnosis of HCV and viral load assessment.
25 to 100,000,00
0
1.40 to 8.00
HCV RNA concentration is within the linear range of 25
to 100,000,000 IU/mL.
Current HCV Infection Provide guidance for treatment and care based on current national HCV treatment guidelines for diagnosis and viral load assessment of HCV.

PMA P160023: FDA Summary of Safety and Effectiveness Data Page 5
>100,000,000 >8.00
HCV RNA is detected above the Upper Limit of
Quantification (ULoQ).
Current HCV Infection Provide guidance for treatment and care based on current national HCV treatment guidelines for diagnosis of HCV and viral load
Invalidc Invalidc
Error indicated in generation of the result. Specimens
should be retested.
N/A
a A diagnostic interpretation may not be made from a “Not Detected” result for serum or plasma specimens that have been diluted. Obtain a new undiluted specimen and retest. b Value is truncated two decimal places. c Invalid results are displayed in blue-colored font. dAs per CDC HCV treatment guidelines, repeat HCV RNA testing is recommended after three months for patients recently exposed to HCV infection (within 6 months) or patients with clinical evidence of HCV infection. eSerum and plasma specimens intended for viral load assessment with value above the ULoQ may be diluted and retested to determine a quantitative result within the linear range.
VI. ALTERNATIVE PRACTICES AND PROCEDURES
There are currently several FDA approved in vitro diagnostic tests for the quantitation of HCV RNA. The patient’s medical history and thorough clinical examination, in addition to serology, PCR or nucleic acid testing (NAT), determination of liver enzyme levels, and biopsy of the liver, will provide further information on the status of an HCV infection. Each alternative has its own advantages and disadvantages. A patient should fully discuss these alternatives with his/her physician to select the method that best meets expectations and lifestyle.
VII. MARKETING HISTORY
The Aptima HCV Quant Dx Assay, accessory kits, and Aptima Specimen Diluent are marketed in multiple countries. The device has not been withdrawn from marketing for any reasons related to its safety or effectiveness. The following is list of countries where the product is distributed: • Austria • France • Malta • Norway
• Belgium • Germany • The Netherlands • Spain
• Bulgaria • Greece • Poland • Switzerland
• Croatia • Hungary • Portugal
• Cyprus • Ireland • Romania
• Czech Republic • Italy • Slovakia
• Denmark • Latvia • Slovenia
• Estonia • Lithuania • Sweden
• Finland • Luxembourg • United Kingdom

PMA P160023: FDA Summary of Safety and Effectiveness Data Page 6
VIII. POTENTIAL ADVERSE EFFECTS OF THE DEVICE ON HEALTH
When used according to the instructions in the package insert, there are no known direct potential direct adverse effects to health. Failure of the test to perform as indicated or human error during performance of the test may lead to improper diagnosis of patient HCV infection status or improper patient management. The diagnosis of HCV infection requires the evaluation of the patient’s blood for anti-HCV antibodies where a positive result is followed up with nucleic acid testing for HCV RNA.
An erroneous “Not Detected” (false negative) result may lead to an HCV infected patient not being identified and not admitted into care. A false negative result is considered a public health concern because of the increased likelihood of HCV transmission from an unidentified HCV infected patient. According to current testing guidelines, HCV RNA testing is repeated within a certain timeframe for patients with symptoms indicative of an HCV infection and patients at high risk of HCV infection. For HCV infected patients undergoing direct acting antiviral (DAA) therapy, a false negative result is not significant because the treatment regimens are currently of fixed duration. An erroneous “HCV Detected” (false positive) result is not considered to be a public health concern because HCV RNA testing is used to confirm serology positive results. In addition, repeat HCV RNA testing and consideration of other clinical evidence of an active HCV infection is recommended prior to initiating HCV DAA therapy.
IX. SUMMARY OF NONCLINICAL STUDIES
A. Laboratory Studies Limit of Detection (LoD): WHO International Standard: The LoD of the Aptima HCV Quant Dx Assay was determined by testing dilutions of the WHO 2nd
International Standard for Hepatitis C Virus RNA (NIBSC 96/798, genotype 1a) in HCV negative human plasma and serum. A total of 10 panel members were tested over 3 days on 3 Panther systems with 3 reagent lots. Probit analysis was used to determine the LoD. The LoD for the Aptima HCV Quant Dx Assay using the WHO 2nd standard was 3.9 IU/mL for plasma and 3.4 IU/mL for serum. LoD by HCV Genotype: The LoD across genotypes was determined by testing dilutions of HCV positive clinical specimens for genotypes 1, 2, 3, 4, 5 and 6 in HCV negative human plasma and serum. Each panel was tested on multiple Panther systems over multiple days with multiple reagent lots. Probit analysis was used to determine the LoD. The LoD for each genotype is shown in Table 2.
PMA P160023: FDA Summary of Safety and Effectiveness Data Page 7
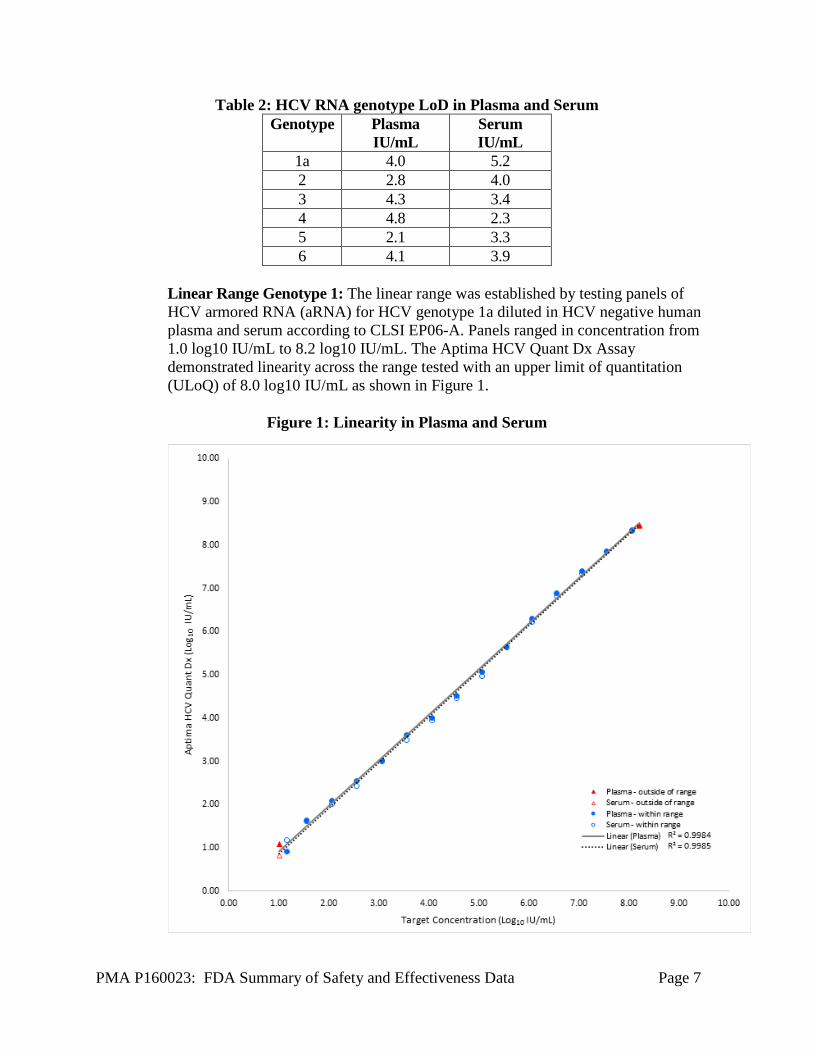
Table 2: HCV RNA genotype LoD in Plasma and Serum Genotype Plasma
IU/mL Serum IU/mL
1a 4.0 5.2 2 2.8 4.0 3 4.3 3.4 4 4.8 2.3 5 2.1 3.3 6 4.1 3.9
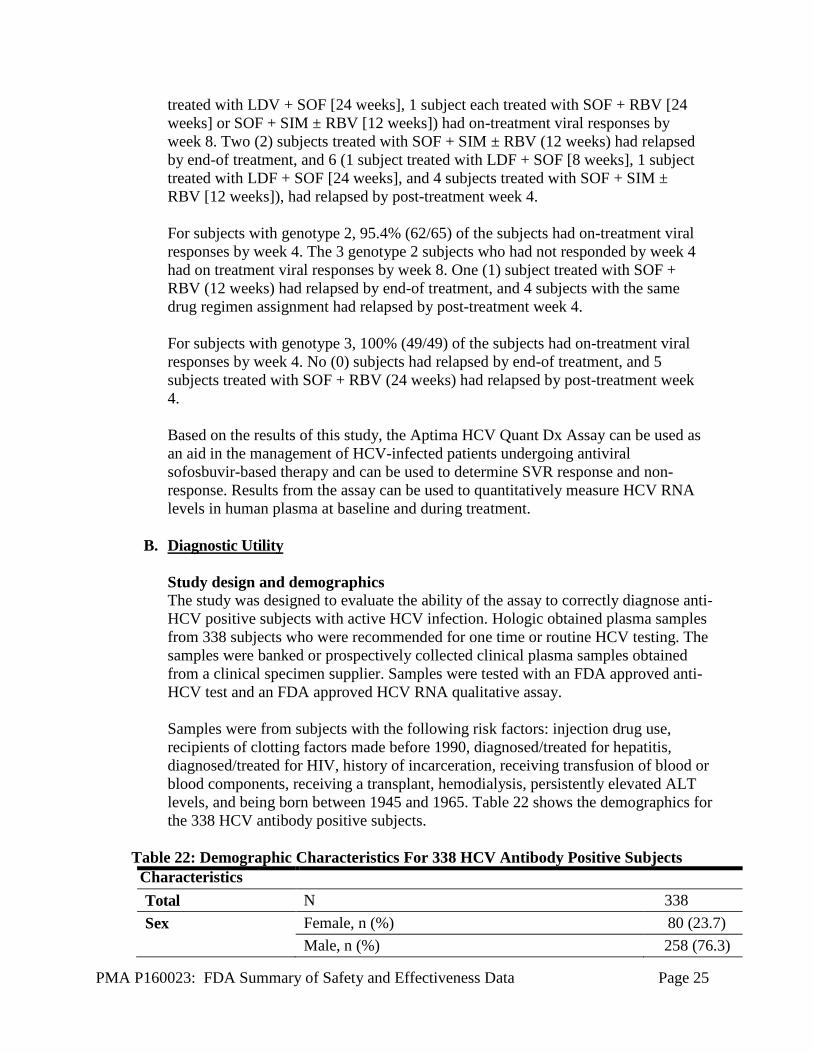
Linear Range Genotype 1: The linear range was established by testing panels of HCV armored RNA (aRNA) for HCV genotype 1a diluted in HCV negative human plasma and serum according to CLSI EP06-A. Panels ranged in concentration from 1.0 log10 IU/mL to 8.2 log10 IU/mL. The Aptima HCV Quant Dx Assay demonstrated linearity across the range tested with an upper limit of quantitation (ULoQ) of 8.0 log10 IU/mL as shown in Figure 1.
Figure 1: Linearity in Plasma and Serum

PMA P160023: FDA Summary of Safety and Effectiveness Data Page 8
The conversion factor between Aptima HCV Quant Dx Assay results in RNA copies/mL and the WHO 2nd
HCV International Units/mL (IU/mL) was determined using dilutions of the WHO standard in negative plasma. The conversion factor between HCV RNA copies/mL and HCV International Units/mL (IU/mL) is 4.4 copies/IU. Linearity Across HCV Genotypes: The linearity and linear range of HCV genotypes 1 (1a for Plasma and 1b for Serum) through 6 was established by testing diluted individual clinical positives, one for each HCV genotype for the lower range of the assay combined with aRNA for the higher range of the assay (above 100,000 IU/mL). Dilutions in both negative human plasma and serum were tested for all genotypes. Linearity was demonstrated for all six genotypes across the range tested as shown in Figure 2 for plasma and
Figure 3 for serum. The Aptima HCV Quant Dx Assay on the Panther system demonstrated linearity across genotypes and serum and plasma with a dynamic range of 1.0 log IU/mL to 8.0 log IU/mL.
Figure 2: Linearity Across HCV Genotypes (Plasma)
0
1
2
3
4
5
6
7
8
9
0 1 2 3 4 5 6 7 8 9
Aptim
a (L
og10
IU/m
L)
Target Concentration (Log10 IU/mL)
Plasma GT 1
Plasma GT 2
Plasma GT 3
Plasma GT 4
Plasma GT 5
Plasma GT 6

PMA P160023: FDA Summary of Safety and Effectiveness Data Page 9
Figure 3: Linearity Across HCV Genotypes (Serum)
Table 3: Linear Fit Equations Across Genotypes (Plasma and Serum) Genotype Plasma Serum
Linear Equation
Maximum Non-linearity (log IU/mL)
Linear Equation
Maximum Non-linearity (log IU/mL)
1 y=1.05x - 0.04 0.06 y=1.05x + 0 -0.12 2 y=0.99x + 0.17 0.07 y=1.06x = 0.12 -0.13 3 y=1.02x - 0.02 0.03 y=1.02x + 0.05 0.05 4 y=1.04x - 0.07 0.16 y=0.99x + 0.09 0.15 5 y=1.01x - 0.04 0.15 y=1.00x + 0.04 0.26 6 y=1.03x - 0.02 0.08 y=1.05x – 0.11 -0.08
Lower Limit of Quantitation (LLoQ) Using WHO 2nd International Standard: The LLoQ is defined as the lowest concentration at which HCV RNA is reliably quantitated within a total error, according to CLSI EP17-A2. Total error was estimated by two methods: Total Analytical Error (TAE) = |bias| + 2SD, and Total Error (TE) = SQRT(2) x 2SD. To ensure accuracy and precision of measurements,
0
1
2
3
4
5
6
7
8
9
0 1 2 3 4 5 6 7 8 9
Aptim
a (L
og10
IU/m
L)
Target Concentration (Log10 IU/mL)
Serum GT 1
Serum GT 2
Serum GT 3
Serum GT 4
Serum GT 5
Serum GT 6

PMA P160023: FDA Summary of Safety and Effectiveness Data Page 10
the total error of the Aptima HCV Quant Dx Assay was set at 1 log10 IU/mL (i.e., at the LLoQ, the difference between two measurements of more than 1 log10 IU/mL is statistically significant). The LLoQ was determined by testing panels of the WHO 2nd International Standard for Hepatitis C Virus RNA (NIBSC 96/798, genotype 1a) diluted in HCV negative human plasma and serum. A total of 36 replicates of each dilution were tested with each of three reagent lots for a minimum of 108 replicates per dilution. The results from the reagent lot with the highest concentration equal to or greater than the LoD and meeting the TE and TAE requirements was chosen as the LLoQ. The LLoQ for the WHO 2nd International Standard is 7 IU/mL (0.82 log10 IU/mL) for plasma and 8 IU/mL (0.93 log10 IU/mL) for serum. The LLoQ was established across genotypes (see next section "Determination of the Lower Limit of Quantitation (LLoQ) Across HCV Genotypes"). These genotype data establishes the overall LLoQ for the assay as 10 IU/mL. Determination of LLoQ Across HCV Genotypes: The LLoQ across genotypes was determined by testing dilutions of HCV positive clinical specimens for genotypes 1, 2, 3, 4, 5 and 6 in HCV negative human plasma and serum. Assignment of the concentration for clinical specimens was determined using an FDA approved assay. A total of 36 replicates of each panel member was tested with each of three reagent lots for a minimum of 108 replicates per panel member. The results from the reagent lot with the highest concentration equal to or greater than the LoD and meeting the TE and TAE, calculated according to CLSI EP 17-A2, requirements was chosen as the LLoQ. The LLoQ for genotypes 1 to 6 in plasma and serum are summarized in Table 4. Genotype 6 had the highest LLoQ for serum at 10 IU/mL. This established the overall LLoQ for the assay as 10 IU/mL. The LLoQ for the WHO 2nd Standard and for each genotype was also evaluated in the linearity studies described in previous sections.
Table 4: Summary of LLoQ Across Genotypes (Plasma and Serum) Plasma Serum
GT IU/mL Log10 IU/mL
IU/mL Log10 IU/mL
1 8 0.88 8 0.88 2 6 0.76 6 0.80 3 6 0.80 5 0.67 4 7 0.82 4 0.65 5 7 0.87 5 0.72 6 6 0.79 10 0.99
Traceability to the WHO 2nd International Standard:A series of secondary standards with known concentrations were used throughout product development and product manufacturing to establish traceability to the WHO 2nd International Standard for HCV RNA. The concentrations tested for the WHO Standard were between 4.00 and 2.30 log10 IU/mL, the secondary standards ranged in concentration from 1.50 to

PMA P160023: FDA Summary of Safety and Effectiveness Data Page 11
8.46 log10 IU/. The Aptima HCV Quant Dx Assay controls and calibrators were also tested along with the secondary standards and the WHO Standard. All of the panels had similar results, and they were distributed linearly across the assay’s linear range, as presented in Figure 4.
Figure 4: Traceability Between WHO 2nd International Standard Target Concentrations and Observed Concentration From the Aptima Quant Dx Assay
Precision-Within Laboratory: The Aptima HCV Quant Dx precision panel was built by diluting HCV-positive clinical plasma and HCV genotype 1a armored RNA (aRNA) into HCV-negative clinical plasma (the two highest panel members were aRNA). Eight positive panel members spanned the range of the assay (1.20 log10 IU/mL to 7.68 log10 IU/mL), and were tested in three replicates per run by one operator, using one pilot lot of reagents on one Panther system over 21 test days and two runs a day. Table 5 presents the precision of assay results (in log10 IU/mL) between instruments, between runs, within runs, and overall. Total variability was ≤

PMA P160023: FDA Summary of Safety and Effectiveness Data Page 12
0.14 across all panel members, primarily due to intra-run variability and is shown in Table 5.
Table 5: Precision (Plasma) Between
Day Between
Run Within
Run Total
N Mean Concentration (Log IU/mL)
SD CV (%)
SD CV (%)
SD CV (%)
SD CV (%)
126 1.86 0.02 4.92 0.06 14.45 0.12 27.95 0.14 32.14 126 2.26 0.00 0.00 0.07 15.72 0.07 15.90 0.10 22.49 126 2.79 0.00 0.00 0.06 12.79 0.08 17.89 0.10 22.11 126 3.29 0.00 0.00 0.07 15.89 0.05 10.35 0.08 19.04 126 3.91 0.00 0.00 0.06 14.27 0.07 17.11 0.10 22.41 126 5.79 0.03 7.93 0.04 8.74 0.06 13.29 0.08 17.86 125a 7.68 0.05 10.93 0.05 11.15 0.06 13.00 0.09 20.45
ᵃNumber of valid results within linear range of the assay Note: Variability from some factors may be numerically negative, which can occur if the variability, due to those factors, is very small. When this occurs, SD and CV are shown as 0 Performance with HCV Negative Specimens: The performance of the Aptima HCV Quant Dx was determined by analyzing 198 fresh and 538 frozen HCV negative clinical specimens. A total of 370 plasma and 366 serum specimens were confirmed to be HCV negative using FDA approved assays. Specificity was calculated as the percentage of HCV negative samples with results of “Not Detected.” HCV RNA was not detected in any of the 736 samples. Specificity was 100% (736/736, 95% CI: 99.6-100%) Analytical Specificity - Interfering Substances: The susceptibility of the Aptima HCV Quant Dx Assay to interference by elevated levels of endogenous substances or by drugs commonly prescribed to HCV infected individuals was evaluated. HCV negative plasma samples and samples spiked with HCV to a concentration of approximately 15 IU/mL (1.2 log10 IU/mL) or 1995 IU/mL (3.3 log10 IU/mL) of HCV RNA were tested. No interference in the performance of the assay was observed in the presence of albumin (90 mg/mL), hemoglobin (5 mg/mL), triglycerides (30 mg/mL), or unconjugated bilirubin (0.2 mg/mL).

PMA P160023: FDA Summary of Safety and Effectiveness Data Page 13
No interference in the performance of the assay was observed in the presence of the exogenous substances listed in Table 6.
Table 6: Drug Compounds Tested for Interference Exogenous
Substance Pool Exogenous Substances Tested
1 Telaprevir, Clarithromycin, Interferon alpha -2a, Dolutegravir, Azithromycin
2 Simeprevir, Sofosbuvir 3 Efavirenz, Boceprevir, PegInterferon
alpha -2b, Emtricitabine, Raltegravir, Amoxicillin
4 Abacavir sulfate, Ribavirin, Dasabuvir, Rilpivirine, Rifampin/Rifampicin
5 Lopinavir, Tenofovir , Lamivudine, Valganciclovir
6 Heparin, EDTA, Sodium citrate HCV negative clinical plasma specimens from patients with elevated levels of defined substances or from patients with the indicated disease (10 samples for each substance) listed in Table 7 were tested. No interference in the performance of the assay was observed.
Table 7: Clinical Specimens Tested for Interference Rheumatoid factor (RF) Elevated aspartate aminotransferase (AST) Antinuclear antibody (ANA) Alcoholic cirrhosis (AC) Anti-Jo-1 antibody (JO-1) Multiple myeloma (MM) Systemic lupus erythematosus (SLE) Lipemic (elevated lipid) Rheumatoid arthritis (RA) Icteric (elevated bilirubin) Multiple sclerosis (MS) Hemolyzed (elevated hemoglobin) Hyperglobulinemia Elevated protein albumin Elevated alanine aminotransferase (ALT)
Analytical Specificity - Cross Reactivity: Potential cross-reactivity to high levels of the pathogens shown in Table 8 was evaluated in the Aptima HCV Quant Dx Assay in the presence or absence of HCV RNA in HCV negative plasma. The quantitation of HCV RNA in the presence of non-specific pathogen was evaluated by spiking HCV negative plasma with HCV genotype 1a virus at concentrations of 15 IU/mL (1.2 log10 IU/mL) or 1995 IU/mL (3.3 log10 IU/mL) IU/mL, respectively. The presence of these pathogens does not affect the analytical specificity and sensitivity of the assay.

PMA P160023: FDA Summary of Safety and Effectiveness Data Page 14
Table 8: Microorganisms Tested for Cross-Reactivity Pathogen Concentration Pathogen Concentration
Hepatitis A virus 100,000 copies/mL Corynebacterium diptheriae 1,000,000 CFU/mL Hepatitis B virus (HBV) 100,000 IU/mL Streptococcus pneumoniae 1,000,000 CFU/mL
Hepatitis G virus 1,470 genome/mL Staphylococcus aureus 1,000,000 CFU/mL HIV-1 100,000 copies/mL Propionibacterium acnes 1,000,000 CFU/mL HIV-2 100,000 PFU/mL Staphylococcus epidermis 1,000,000 CFU/mL
Herpes simplex virus 1 (HSV-1) 100,000 PFU/mL Candida albicans 1,000,000 CFU/mL Herpes simplex virus 2 (HSV-2) 100,000 PFU/mL Neisseria gonorrhoea 1,000,000 CFU/mL
Human herpes virus 6B 100,000 copies/mL Chlamydia trachomatis 1,000,000 IFU/mL Human herpes virus 8 2,667 TCID50 U/mL Trichomonas vaginalis 1,000,000 cells/mL
Human T-cell lymphotropic virus – type 1 (HTLV-1)
100,000 vp/mL
Human T-cell lymphotropic virus – type 2 (HTLV-2)
100,000 vp/mL
Parvovirus B19 100,000 IU/mL West Nile virus 100,000 PFU/mL Dengue virus 1 100,000 PFU/mL Dengue virus 2 100,000 PFU/mL Dengue virus 3 100,000 PFU/mL Dengue virus 4 100,000 PFU/mL
Cytomegalovirus 100,000 PFU/mL Epstein-Barr virus 100,000 copies/mL
Rubella virus 100,000 PFU/mL Human papillomavirus 100,000 cells/mL
Adenovirus type 5 100,000 TCID50 U/mL
Influenza A virus 100,000 TCID50 U/mL
Japanese encephalitis virus NA

PMA P160023: FDA Summary of Safety and Effectiveness Data Page 15
St. Louis encephalitis virus NA Murray Valley encephalitis
virus 2643 LD50/mL
Yellow fever virus 1,000,000 cells/mL IU/mL=International units per mL PFU/mL=Plaque forming units per mL TCID50 U/mL= Tissue culture infective dose units per mL vp/mL=Viral particles per mL LD50/mL=Lethal dose per mL CFU/mL=Colony forming units per mL IFU/mL=Inclusion forming units per mL Clinical Specimens Containing Viruses Other than HCV: The pathogens listed in Table 9 were evaluated by obtaining individual naturally infected clinical specimens with high levels of the indicated microorganism. These specimens were tested in the presence or absence of HCV genotype 1a virus at approximately 15 IU/mL (1.2 log10 IU/mL) or 1995 IU/ml (3.3 log10 IU/mL). No cross-reactivity was observed. No interference was observed.
Table 9: Clinical Samples Tested for Cross-Reactivity Microorganism Matrix N (donors)
HBV serum 5 HBV plasma 5
Dengue virus plasma 10 Hepatitis A virus plasma 10
HTLV-1 plasma 10 HTLV-2 plasma 10 HIV-1 plasma 10
West Nile virus plasma 10
Matrix Equivalency: To demonstrate equivalent performance between serum and plasma collection tube types, matched sets of HCV- negative and positive samples were obtained in 6 different types of primary collection tubes; plasma preparation tubes (PPT), K2 EDTA, K3 EDTA, ACD, serum tubes, and serum separation tubes (SST) and tested using the Aptima HCV Quant Dx Assay. A total of 176 sets of matched blood collection tubes were tested of which 68 were naturally infected HCV-positive, 108 were HCV negative sets, and 26 of the 68 positives were further diluted with 13 negative samples of matched blood collection tubes to concentrations across the assay’s dynamic range. 100% positive and negative agreement was demonstrated between serum (serum and SST) and plasma collection tubes (K2 EDTA, K3 EDTA, ACD and PPT). Deming regression analysis between serum and each of the collection tubes (SST, K2 EDTA, K3 EDTA, ACD and PPT) demonstrated that the Aptima HCV Quant Dx Assay has equivalent performance in reporting quantitative results with the 6 different collection tube types as shown in Table 10.
Table 10: Matrix Equivalency
95 % CI of Slope 95% CI of Intercept
Blood Deming Lower Upper Lower Upper R2 Mean

PMA P160023: FDA Summary of Safety and Effectiveness Data Page 16
Collection Tube
Regression Limit Limit Limit Limit Difference (log10)
SST y=1.00x - 0.01 0.99 1.01 -0.05 0.07 0.998 0 K2EDTA y=1.01x - 0.03 0.99 1.02 -0.12 -0.07 0.995 0 K3EDTA y=1.00x - 0.01 0.99 1.01 -.10 0.07 0.996 -0.02
ACD y=1.00x - 0.14 0.99 1.01 -0.20 -0.08 0.997 -0.13 PPT y=1.00x - 0.01 0.98 1.01 -0.10 0.08 0.996 -0.01
Sample Dilution Using Aptima Specimen Diluent (1:3): To assess the recovery of HCV RNA in specimens diluted with Aptima Specimen Diluent, specimens containing 1.67 log10 IU/mL to 6.34 log10 IU/mL of HCV RNA were diluted 1:3 with Aptima Specimen Diluent (240µL of specimen combined with 480µL of Aptima Specimen Diluent). Each specimen was tested neat and diluted (1:3) in triplicate. Testing was performed using one lot of assay reagents on one Panther system with two Aptima Specimen Diluent lots. The difference between the neat and diluted test results was calculated for each sample set as shown in Table 11 for plasma and Table 12 for serum.
Table 11: Plasma Specimen 1:3 Dilution Matrix Comparison Summary (log10 IU/mL) Plasma Matrix Average
Reported Diluent
Average Reported Diluent - Plasma Matrix
1.74a 1.57b -0.18 4.56 4.36 -0.20 5.62 5.46 -0.17 3.69 3.56 -0.13 2.65 2.60 -0.05 4.18 4.09 -0.09 3.25 3.28 0.03 4.12 4.06 -0.07 3.54 3.48 -0.06 6.20 5.91 -0.30
aResult from two replicates. One result “Detected” but not quantified bResult from four replicates. Two results “Detected” but not quantified.
Table 12: Serum Specimen 1:3 Dilution Matrix Comparison Summary (log10 IU/mL) Serum Matrix Average
Reported Diluent
Average Reported Diluent - Serum Matrix
1.5a 1.80 0.30 5.32 5.14 -0.18 3.65 3.59 -0.06 4.91 4.71 -0.20 3.66 3.72 0.06 3.81 3.74 -0.07 2.42 2.60 0.18 2.65 2.88 0.23 4.90 4.70 -0.21

PMA P160023: FDA Summary of Safety and Effectiveness Data Page 17
6.17 6.00 -0.17 aResult from two replicates. One result “Detected” but not quantified
Sample Dilution Using Aptima Specimen Diluent (1:100): To assess the recovery of HCV RNA in samples diluted with Aptima Specimen Diluent, five naturally infected plasma specimens and five naturally infected serum specimens, along with ten specimens each of HCV negative plasma and serum spiked with HCV aRNA targeting above the ULoQ, 8 log10 IU/mL at 8.30 log10 IU/mL were tested in triplicate. A 1:100 dilution was performed with one part sample and 99 parts Aptima Specimen Diluent just prior to testing. Testing was performed using one lot of assay reagents on one Panther system with two Aptima Specimen Diluent lots. The difference between the neat and diluted test results was calculated for each sample set as shown in Table 13 for plasma and Table 14 for serum.
Table 13: Plasma Specimen 1:100 Dilution Matrix Comparison (log10 IU/mL) Plasma Matrix Average
Reported Diluent
Average Reported Diluent – Plasma Matrix
8.03a 7.95 -0.08 8.07a 7.93 -0.15 8.14a 7.97 -0.17 8.16a 7.94 -0.22 8.09a 7.96 -0.13 8.38a 7.96 -0.42 7.98a 7.89 -0.09 8.08a 7.89 -0.19 8.14a 7.92 -0.22 8.08a 7.97 -0.11 6.41 6.22 -0.19 6.73 6.58 -0.15 6.88 6.75 -0.14 6.54 6.51 -0.03 6.55 6.29 -0.27
aSpiked specimen
Table 14: Serum Specimen 1:100 Dilution Matrix Comparison (log10 IU/mL) Serum Matrix minus
Average Reported n=3 Diluent minus
Average Reported n=6 Diluent - Serum Matrix
8.04a 7.94 -0.09 8.07a 7.91 -0.16 7.99a 7.91 -0.08 8.03a 7.92 -0.11 7.99a 7.89 -0.09 8.05a 7.85 -0.20 8.16a 7.93 -0.23 8.16a 7.90 -0.26 8.06a 7.89 -0.17

PMA P160023: FDA Summary of Safety and Effectiveness Data Page 18
8.26a 7.92 -0.34 7.34 7.09 -0.25 7.07 6.83 -0.24 7.18 6.80 -0.38 7.35b 7.12 -0.23 7.07 6.68 -0.39
aSpiked specimen
Confirmation of LLoQ in Clinical Specimens Diluted in Specimen Diluent: The LLoQ of the Aptima HCV Quant Assay was confirmed with HCV genotype 1 (genotype 1a for plasma and genotype 1b for serum) clinical specimens diluted into Aptima Specimen Diluent. Specimens were prepared in HCV negative human plasma and serum at 21, 30, and 45 IU/mL. Each panel was diluted 1:3 into Aptima Specimen Diluent just prior to testing to give final concentrations of approximately 7, 10, and 15 IU/mL. A total of 36 replicates of each panel member was tested with one reagent lot across three days. According to CLSI EP17-A2, total error was estimated by two methods: Total Analytical Error (TAE) = |bias| + 2SD, and Total Error (TE) = SQRT(2) x 2SD. An LLoQ ≤ 10 IU/mL for HCV plasma and serum diluted into Aptima Specimen Diluent was confirmed as shown in Table 15.
Table 15: Confirmation of LLoQ - Clinical Samples in Aptima Specimen Diluent
Matrix Target Concentration
% Detected
Measured Concentration SD Bias Calculated
TE Calculated
TAE IU/mL Log10
IU/mL Log10 IU/mL
Plasma 7 0.85 100% 0.94 0.25 0.10 0.71 0.60 Serum 7 0.85 100% 0.96 0.21 0.12 0.60 0.54
Precision of Diluted Samples The Aptima HCV Quant Dx precision panel was built by diluting HCV-positive clinical plasma and HCV aRNA into HCV-negative clinical plasma. These were further diluted in Aptima Specimen Diluent. Positive panels were diluted into Aptima Specimen Diluent. These were tested in three replicates per run by one operator, using one pilot lot of reagents on one Panther system over 21 test days, two runs a day. Table 16 shows the precision of assay results (in log10 IU/mL) between instruments, between operators, between lots, between runs, within runs, and overall. Total variability was ≤ 0.15 across all panel members, primarily due to intra-run variability.
Table 16: Precision of Panels Diluted in Aptima Specimen Diluent Mean
Concentration Standard Deviation
Dilution N Log10 IU/mL Inter-day Inter-Run Intra-Run Total 1:3 126 2.24 0 0.05 0.13 0.14 1:00 126 3.86 0.06 0.05 0.12 0.15

PMA P160023: FDA Summary of Safety and Effectiveness Data Page 19
1:00 126 7.31 0.03 0.10 0.05 0.12 Note: Variability from some factors may be numerically negative, which can occur if the variability, due to those factors, is very small. When this occurs, SD and CV are shown as 0.
Carryover: The rate of false positive results was determined when samples containing high titer levels of HCV RNA were interspersed throughout specimen processing racks containing HCV negative samples. Carryover contamination risk in the presence of high titer specimens on the Panther System in this study was <1% (1/704, or 0.14%), demonstrating that the Panther system minimizes the risk of false positive results arising from carryover contamination when tested with the Aptima HCV Quant Dx Assay.
Specimen Stability: Specimen stability studies demonstrated that, for the Aptima HCV Quant Dx Assay, specimens should be stored as follows:
Whole blood can be stored at 2oC to 30oC and must be centrifuged within 6 hours of specimen collection. Plasma or serum may then be stored under one of the following conditions:
• In the primary collection tube or specimen aliquot tube (SAT) at 2oC to 25oC for up to 24 hours.
• In the primary collection tube or SAT at 2oC to 8oC for up to 5 days, or • In the SAT at -20oC for up to 60 days.
Real-Time Reagent (including Controls) Stability: Expiration dating for the Aptima HCV Quant Dx Assay has been established and approved at 15 months when stored at 2-8oC. Antimicrobial Effectiveness (AET): Testing was performed and approved for the Aptima HIV-1 Quant Dx Assay. The Aptima HCV Quant Dx Assay uses similar base formulations with minor differences in concentrations. Because the formulations are so similar and the preservatives used are identical, the AET established for the Aptima HIV-1 Quant assay verifies the preservative effectiveness for the Aptima HCV Quant Dx Assay. Results of the study were compared to the requirements of USP51. All reagents met the USP requirements for AET.
X. SUMMARY OF PRIMARY CLINICAL STUDY(IES)
Clinical studies included the evaluation of
• the ability of the assay to predict clinical outcome in patients undergoing treatment (Section A, below) and
• the ability of the assay to correctly diagnose anti-HCV positive subjects with active HCV infection (Section B, below)
A. Clinical Performance (Prediction of Clinical Outcome)
Study Design and Demographics

PMA P160023: FDA Summary of Safety and Effectiveness Data Page 20
The study was designed to demonstrate clinical utility by estimating the performance characteristics for achieving sustained virologic response (SVR) at established clinically relevant time points during 8-, 12-, or 24-week antiviral treatment. The study enrolled 352 subjects from 35 U.S. clinical sites. Of the total enrolled subjects, 274 subjects had a conclusive SVR status and were evaluable for analysis, 56 subjects had non-conclusive SVR status and were not evaluable for analysis, 22 subjects had conclusive SVR status, but were not evaluable due to either missing pre-treatment/baseline result, all on-treatment results were <LLoQ or not detected, or genotypes were not established with an FDA approved assay. Table 17 shows the demographics for the 274 evaluable subjects. The highest baseline viral load was 7.58 log10 IU/mL, as determined by the Aptima HCV Quant Dx Assay. All evaluable subjects completed therapy, with no on-treatment failures (e.g., nonresponse). A total of 2449 samples collected at different time points from each subject were tested at three U.S. testing sites.
Table 17: Demographics and Clinical Characteristics for the 274 Evaluable Subjects
Characteristics
Total N 274 Sex Female, n (%) 112 (40.9)
Male, n (%) 162 (59.1) Age (years) n 274
Mean 55.1 Median 56.0 SD 10.40 Minimum 23 Maximum 83 21-49, n (%) 61 (22.3) 50-70, n (%) 203 (74.1) >70, n (%) 10 ( 3.6)
Ethnicity n 274 Hispanic or Latino, n (%) 65 (23.7) Not Hispanic or Latino, n (%) 202 (73.7) Unknown, n (%) 6 ( 2.2) Refused, n (%) 1 ( 0.4)
Racea n 274 White, n (%) 223 (81.4) Black or African American, n (%) 43 (15.7) Asian, n (%) 1 ( 0.4) American Indian/Alaska Native, n
3 ( 1.1)
Native Hawaiian/Pacific Islander,
0 ( 0.0) Other, n (%) 3 ( 1.1) Unknown, n (%) 1 ( 0.4) Refused, n (%) 0 ( 0.0)

PMA P160023: FDA Summary of Safety and Effectiveness Data Page 21
Genotype n 274 Genotype 1, n (%) 158 (57.7) Genotype 2, n (%) 66 (24.1) Genotype 3, n (%) 50 (18.2)
HCV treatment
n 274 Naive, n (%) 232 (84.7) Experienced, n (%) 42 (15.3) Relapsed, n (%) 32 (76.2) Null responder, n (%) 1 ( 2.4) Non-responder, n (%) 2 ( 4.8) Partial responder, n (%) 3 ( 7.1) Breakthrough, n (%) 1 ( 2.4) Rebound, n (%) 0 ( 0.0) Treatment response unknown, n
3 ( 7.1)
Missing, n (%) 0 ( 0.0) Cirrhotic status n 274
Cirrhotic, n (%) 98 (35.8) Non-cirrhotic, n (%) 176 (64.2) aSubjects may report multiple races
Specimens were prospectively collected from subjects chronically infected with genotype 1, 2, or 3 HCV who were initiating therapy with 8-, 12-, or 24-week sofosbuvir-based treatments using FDA-approved drugs prescribed in accordance with FDA-approved labeling and/or AASLD/IDSA HCV treatment guidelines. HCV treatment-naive or treatment- experienced subjects, and subjects without cirrhosis or with compensated cirrhosis were eligible, as applicable for each treatment regimen. Determination of HCV RNA viral load was performed at baseline, week 1, week 2, week 4, week 8, week 12, and week 24 using the Aptima HCV Quant Dx Assay. End of treatment (EOT) and post-treatment week 4 and week 12 follow-up results were determined using the Aptima HCV Quant Dx Assay and two FDA-approved quantitative HCV RNA assays. SVR was defined as an HCV RNA level <LLoQ as determined by an FDA-approved quantitative assay for the post-treatment week 12 sample. Table 18 shows the final drug regimen assignments for the 274 evaluable subjects.
Table 18: Final Drug Regimen Assignments by Genotype HCV Genotype n (%)
Regimen 1 2 3 SOF+PEG-IFN+Ribavirin 12 weeks 25 (15.8) 3 (6.0)
SOF+SIM+RBV 12 weeks 63 (39.9) SOF+SIM+RBV 24 weeks 4 (2.5) SOF+RBV 12 weeks 66 (100) SOF+RBV 24 weeks 6 (3.8) 47 (94.0)

PMA P160023: FDA Summary of Safety and Effectiveness Data Page 22
LED+SOF 8 weeks 14 (8.9) LED+SOF 12 weeks 39 (24.7) LED+SOF 24 weeks 7 (4.4) Total eligible subjects 158 66 50
SOF=sofosbuvir PEG-IFN=pefinterferon RBV=ribavirin SIM=simeprevir LED=ledipasvir
Response to Antiviral Therapy Assay performance characteristics have been established for individuals treated with certain DAA regimens. No information is available on the assay’s predictive value when other DAA combination therapies are used.
Definitions: Week 1 viral load (VL) = HCV RNA <LLoQ = 10 IU/mL at Week 1 of antiviral therapy Week 2 VL = HCV RNA <LLoQ = 10 IU/mL at week 2 of antiviral therapy Week 4 VL = HCV RNA <LLoQ = 10 IU/mL at week 4 of antiviral therapy Week 8 VL = HCV RNA <LLoQ = 10 IU/mL at week 8 of antiviral therapy Week 8 VL [End of Treatment (EOT)]: HCV RNA < LLoQ = 10 IU/mL at Week 8 of antiviral therapy Week 12 VL = HCV RNA <LLoQ = 10 IU/mL at week 12 of antiviral therapy Week 12 VL [EOT]: HCV RNA < LLoQ = 10 IU/mL at Week 12 of antiviral therapy Week 24 VL (EOT): HCV RNA < LLoQ = 10 IU/mL at Week 24 of antiviral therapy Sustained Virologic Response (SVR)12: HCV RNA < LLoQ = 10 IU/mL at Week 12 after completion of antiviral therapy, measured with an independent HCV RNA test. Table 19 and Table 20 show the frequency of SVR and SVR non-response, respectively, by genotype and drug regimen overall and for cirrhotic, non-cirrhotic, treatment-naïve, and treatment experienced subjects. Most subjects achieved SVR across genotypes. Across genotypes, SVR rates generally were higher in non-cirrhotic subjects than in cirrhotic subjects, and similar between treatment-naïve and treatment-experienced subjects. Table 19: Frequency of SVR Response by Genotype and Drug Regimen
SVR Response Subjects n (%)
GT Regimen Overall Cirrhotic Non-cirrhotic
Treatment-naïve
Treatment-experienced
1
LED+SOF 8 weeks 13/14 (92.9) - 13/14
(92.9) 13/14 (92.9) -
LED+SOF 12 weeks 39/39 (100)
9/9 (100)
30/30 (100)
34/34 (100)
5/5 (100)
LED+SOF 24 weeks 6/7 6/7 - - 6/7

PMA P160023: FDA Summary of Safety and Effectiveness Data Page 23
(85.7) (85.7) (85.7) SOF+PEG-IFN+RBV 12 weeks
24/25 (96.0)
7/7 (100)
17/18 (94.4)
22/23 (95.7)
2/2 (100)
SOF+RBV 24 weeks 6/6 (100)
1/1 (100)
5/5 (100)
5/5 (100)
1/1 (100)
SOF+SIM+RBV 12 weeks
54/63 (85.7)
21/29 (72.4)
33/34 (97.1)
45/54 (83.3)
9/9 (100)
SOF+SIM+RBV 24 weeks
4/4 (100)
4/4 (100) - 2/2
(100) 2/2
(100)
2 SOF+RBV 12 weeks 58/66 (87.9)
16/22 (72.7)
42/44 (95.5)
53/60 (88.3)
5/6 (83.3)
3
SOF+PEG-IFN+RBV 12 weeks
3/3 (100)
3/3 (100) - 1/1
(100) 2/2
(100)
SOF+RBV 24 weeks 41/47 (87.7)
12/16 (75.0)
29/31 (93.5)
35/39 (89.7)
6/8 (75.0)
SOF=sofosbuvir PEG-IFN=pefinterferon RBV=ribavirin SIM=simeprevir LED=ledipasvir GT=genotype
Table 20: Frequency of SVR Non-Response by Genotype and Drug Regimen SVR Non-Responsive Subjects n (%)
GT Regimen Overall Cirrhotic Non-cirrhotic
Treatment-naïve
Treatment-experienced
1
LED+SOF 8 weeks 1/14 (7.1) - 1/14
(7.1) 1/14 (7.1) -
LED+SOF 12 weeks 0/39 (0)
0/9 (0)
0/30 (0)
0/34 (0)
0/5 (0)
LED+SOF 24 weeks 1/7 (14.3)
1/7 (14.3) - - 1/7
(14.3) SOF+PEG-IFN+RBV 12 weeks
1/25 (4.0)
0/7 (0)
1/18 (5.6)
1/23 (4.3)
0/2 (0)
SOF+RBV 24 weeks 0/6 (0)
0/1 (0)
0/5 (0)
0/5 (0)
0/1 (0)
SOF+SIM+RBV 12 weeks
9/63 (14.3)
8/29 (27.6)
1/34 (2.9)
9/54 (16.7)
0/9 (0)
SOF+SIM+RBV 24 weeks
0/4 (0)
0/4 (0) - 0/2
(0) 0/2 (0)
2 SOF+RBV 12 weeks 8/66 (12.1)
6/22 (27.3)
2/44 (4.5)
7/60 (11.7)
1/6 (16.7)
3
SOF+PEG-IFN+RBV 12 weeks
0/3 (0)
0/3 (0) - 0/1
(0) 0/2 (0)
SOF+RBV 24 weeks 6/47 (12.8)
4/16 (25.0)
2/31 (6.5)
4/39 (10.3)
2/8 (25.0)
SOF=sofosbuvir PEG-IFN=pefinterferon RBV=ribavirin SIM=simeprevir LED=ledipasvir GT=genotype Table 21 shows the percent of subjects with virologic response (VR defined as Aptima HCV Quant Dx Assay results < LLoQ) by on-treatment and post-treatment

PMA P160023: FDA Summary of Safety and Effectiveness Data Page 24
week visits for each genotype by drug regimen assignment. Most subjects achieved a VR by week 4 across the genotypes, and all subjects achieved VR by week 8.
Table 21: Probability of Achieving SVR Across On-Treatment and Post-Treatment Weeks
GT Regimen N
SVR Response
% (n)
SVR Non
Response % (n)
Percent of Subjects With Virologic Response By Visita % (n)
Week 1
Week 2
Week 4
Week 8
Week 12 EOT PT04
1
LDV + SOF (8 weeks) 14 92.9
(13/14) 7.1
(1/14) 42.9
(6/14) 76.9
(10/13) 100
(14/14) N/A N/A 100 (14/14)
90 (9/10)
LDV+SOF (12 weeks) 39 100
(39/39) 0
(0/39) 11.1
(4/36) 52.6% (20/38)
92.1 (35/38)
100 (36/36) N/A 100
(39/39) 100
(33/33) LDV + SOF
(24 weeks) 7 85.7 (6/7)
14.3 (1/7)
0 (0/6)
42.9 (3/7)
76.4 (5/7)
100 (7/7)
100 (7/7)
100 (6/6)
80 (4/5)
SOF+PEG+RBV (12 weeks) 25 96
(24/25) 4
(1/25) 40
(10/25) 80
(20/25) 100
(25/25) 100
(25/25) N/A 100 (25/25)
100 (25/25)
SOF+RBV (24 weeks) 6 100
(6/6) 0
(0/0) 16.7 (1/6)
66.7 (4/6)
83.3 (5/6)
100 (5/5)
100 (6/6)
100 (5/5)
100 (6/6)
SOF+SIM+RBV (12 weeks) 63 85.7
(54/63) 14.3
(9/63) 20.7
(12/58) 67.9
(38/56) 98.4
(62/63) 100
(57/57) N/A 96.6 (57/59)
90.0 (54/60)
SOF+SIM+RBV (24 weeks) 4 100
(4/4) 0
(0/0) 66.7 (2/3)
66.7 (2/3)
100 (4/4)
100 (3/3)
100 (3/3)
100 (4/4)
100 (4/4)
2 SOF+RBV (12 weeks) 66 87.9
(58/66) 12.1
(8/66) 22.2
(12/54) 69.4
(43/62) 95.4
(62/65) 100
(64/64) N/A 98.5 (64/65)
93.5 (58/62)
3
SOF+PEG+RBV (12 weeks) 3 100
(3/3) 0
(0/0) 33.3 (1/3)
100 (2/2)
100 (3/3)
100 (2/2) N/A 100
(3/3) 100 (3/3)
SOF+RBV (24 weeks) 47 87.2
(41/47) 12.8
(6/47) 20.9
(9/43) 70.5
(31/44) 100
(46/46) 100
(46/46) 100
(47/47) 100
(42/42) 89.1
(41/46) SOF=sofosbuvir PEG-IFN=pefinterferon RBV=ribavirin SIM=simeprevir LED=ledipasvir GT=genotype EOT=end of treatment, N/A=not applicable because visit corresponds to EOT for given treatment or is beyond treatment window, PT04=post-treatment week 4 aOn-treatment and post-treatment viral response defined as < 10 IU/mL. Note: EOT is not included in treatment week
For subjects infected with genotype 1, 95.5% (150/157) of the subjects had on-treatment viral responses by week 4. The 7 genotype 1 subjects who had not responded by week 4 (3 subjects treated with LDV + SOF [12 weeks], 2 subjects
PMA P160023: FDA Summary of Safety and Effectiveness Data Page 25
treated with LDV + SOF [24 weeks], 1 subject each treated with SOF + RBV [24 weeks] or SOF + SIM ± RBV [12 weeks]) had on-treatment viral responses by week 8. Two (2) subjects treated with SOF + SIM ± RBV (12 weeks) had relapsed by end-of treatment, and 6 (1 subject treated with LDF + SOF [8 weeks], 1 subject treated with LDF + SOF [24 weeks], and 4 subjects treated with SOF + SIM ± RBV [12 weeks]), had relapsed by post-treatment week 4. For subjects with genotype 2, 95.4% (62/65) of the subjects had on-treatment viral responses by week 4. The 3 genotype 2 subjects who had not responded by week 4 had on treatment viral responses by week 8. One (1) subject treated with SOF + RBV (12 weeks) had relapsed by end-of treatment, and 4 subjects with the same drug regimen assignment had relapsed by post-treatment week 4. For subjects with genotype 3, 100% (49/49) of the subjects had on-treatment viral responses by week 4. No (0) subjects had relapsed by end-of treatment, and 5 subjects treated with SOF + RBV (24 weeks) had relapsed by post-treatment week 4. Based on the results of this study, the Aptima HCV Quant Dx Assay can be used as an aid in the management of HCV-infected patients undergoing antiviral sofosbuvir-based therapy and can be used to determine SVR response and non-response. Results from the assay can be used to quantitatively measure HCV RNA levels in human plasma at baseline and during treatment.
B. Diagnostic Utility Study design and demographics The study was designed to evaluate the ability of the assay to correctly diagnose anti-HCV positive subjects with active HCV infection. Hologic obtained plasma samples from 338 subjects who were recommended for one time or routine HCV testing. The samples were banked or prospectively collected clinical plasma samples obtained from a clinical specimen supplier. Samples were tested with an FDA approved anti-HCV test and an FDA approved HCV RNA qualitative assay. Samples were from subjects with the following risk factors: injection drug use, recipients of clotting factors made before 1990, diagnosed/treated for hepatitis, diagnosed/treated for HIV, history of incarceration, receiving transfusion of blood or blood components, receiving a transplant, hemodialysis, persistently elevated ALT levels, and being born between 1945 and 1965. Table 22 shows the demographics for the 338 HCV antibody positive subjects.
Table 22: Demographic Characteristics For 338 HCV Antibody Positive Subjects Characteristics Total N 338 Sex Female, n (%) 80 (23.7)
Male, n (%) 258 (76.3)

PMA P160023: FDA Summary of Safety and Effectiveness Data Page 26
Age (years) Mean 48.2 Median 51.0 SD 11.01 <21, n (%) 2 ( 0.6) 21-49, n (%) 152 (45.0) 50-70, n (%) 182 (53.8) >70, n (%) 2 ( 0.6) Race/Ethnicitya White, n (%) 86 (25.4)
Black, n (%) 118 (34.9) Asian, n (%) 1 ( 0.3) Hispanic, n (%) 123 (36.4) Mixed ethnicities, n (%) 4 ( 1.2) Other, n (%) 10 ( 3.0) Unknown, n (%) 0 ( 0.0) Risk Factorsb Injection drug use, n (%) 294 (87.0)
Recipients of clotting factors made before 1990, n
0 ( 0.0) Diagnosed/treated for hepatitis, n (%) 172 (50.9) Diagnosed/treated for HIV, n (%) 13 ( 3.8) History of incarceration, n (%) 311 (92.0) Receiving a transfusion of blood or blood
39 (11.5)
Receiving a transplant, n (%) 0 ( 0.0) Hemodialysis, n (%) 3 ( 0.9) Persistently elevated ALT levels, n (%) 2 ( 0.6) Born between 1945 and 1965, n (%) 192 (56.8) HCV Infection Status HCV RNA positive, n (%) 259 (76.6)
HCV RNA negative, n (%) 79 (23.4) ALT=alanine aminotransferase HIV=human immunodeficiency virus aMay report multiple races bMay report multiple risk factors.
According to current AASLD guidelines, an FDA-approved NAAT with a detection level of 25 IU/mL or lower should be used to confirm a positive HCV infection status following a reactive HCV antibody test result. Agreement between the patient infected status and the Aptima HCV Quant Dx Assay result was determined using a 25 IU/mL cut-off, specimens <25 IU/mL were considered “Not Detected” and specimens with results > 25 IU/mL were considered “Detected”. Aptima HCV Quant Dx Assay results were compared to a patient infected status based on results from an FDA-approved HCV antibody test and an FDA-approved qualitative RNA test. The patient infected status was considered HCV positive if

PMA P160023: FDA Summary of Safety and Effectiveness Data Page 27
both the FDA-approved HCV antibody test and FDA-approved qualitative RNA test results gave reactive results. Of the 338 evaluable subjects, 259 had an HCV positive patient infected status and 256 were detected by Aptima HCV Quant Dx Assay (percent positive agreement = 98.8%). The results are shown in Table 23. Of the 3 subjects that had HCV RNA quantified below 25 IU/mL or not detected by the Aptima HCV Quant Dx Assay, 2 subjects had a detected but not quantified result (HCV RNA < 10 IU/mL) and 1 subject had a quantitative HCV RNA result of 12 IU/mL.
Table 23: Agreement Between Aptima HCV Quant Dx Assay Results with the Patient Infected Status Using a Cutoff of 25 IU/mL
Patient Infected Status Aptima HCV Quant Dx
Assay Result HCV Positive HCV Negative Total
HCV RNA Quantitated at or above 25 IU/mL 256 0 256
HCV RNA Quantitated or Detected Below 25 IU/mL
or Not Detected 3a 79 82
Total 259 79 338 % Positive Agreement
(95% Score CI) 98.8
(96.7-99.6) N/A N/A
% Negative Agreement (95% Score CI) N/A 100
(95.4-100) N/A CI = confidence interval N/A = not applicable a The Aptima HCV Quant Dx Assay detected but did not quantitate HCV RNA (<10IU/mL) for two subjects, and the third subject had HCV RNA quantitated at 12 IU/mL. This study demonstrates the clinical utility of the Aptima Quant Dx assay to correctly diagnose subjects with ongoing active HCV RNA infections and to distinguish them from subjects with inactive infections in a population with prior exposure to HCV (HCV antibody-positive serology). Cross-reactivity in Subjects with Non-HCV Related Liver Disease Serum and plasma samples from 214 individuals with other non-HCV related liver diseases were tested with an FDA-approved anti-HCV test and FDA approved qualitative HCV RNA test. Seventeen (17) HCV-positive samples (with anti-HCV positive results and/or reactive qualitative HCV RNA results) and 3 ineligible samples were excluded. Table 24 summarizes the subject demographics.

PMA P160023: FDA Summary of Safety and Effectiveness Data Page 28
Table 24: Demographic Characteristics and Liver Disease Status for 194 Evaluable Subjects
Characteristics All Total N 194 Sex N 193
Female, n (%) 116 (60.1) Male, n (%) 77 (39.9)
Age (years) N 194 Mean 55.2 Median 56.0 SD 12.19 Minimum 25 Maximum 82 21-49, n (%) 60 (30.9) 50-70, n (%) 114 (58.8) >70, n (%) 20 (10.3)
Ethnicity N 194 Hispanic or Latino, n (%) 9 ( 4.6) Not Hispanic or Latino, n (%) 147 (75.8) Unknown, n (%) 38 (19.6) Refused, n (%) 0 ( 0.0)
Racea N 194 White, n (%) 122 (62.9) Black or African American, n (%) 20 (10.3) Asian, n (%) 17 ( 8.8) American Indian/Alaska Native, n (%) 0 ( 0.0) Native Hawaiian/Pacific Islander, n (%) 1 ( 0.5) Other, n (%) 34 (17.5) Unknown, n (%) 2 ( 1.0) Refused, n (%) 0 ( 0.0)
Liver Diseaseb N 194 Autoimmune hepatitis, n (%) 31 (16.0) Alcoholic liver disease, n (%) 51 (26.3) Chronic HBV, n (%) 34 (17.5) Primary biliary cirrhosis, n (%) 37 (19.1) NASH, n (%) 39 (20.1)

PMA P160023: FDA Summary of Safety and Effectiveness Data Page 29
Multiple Liver Diseases Reported, n (%) 2 ( 1.0) HBV=hepatitis B virus NASH=non-alcoholic steatohepatitis aSubjects could report multiple races bSubjects with multiple liver disease reported both autoimmune hepatitis and primary biliary cirrhosis
Table 25 shows Aptima HCV Quant Dx Assay specificity by liver disease and the distribution of Aptima HCV Quant Dx Assay results across viral load categories. The specificity was 100% in subjects with chronic hepatitis B virus (HBV), primary biliary cirrhosis, nonalcoholic steatohepatitis (NASH), and multiple liver diseases reported. HCV RNA was detected at very low levels in 1 subject with autoimmune hepatitis (<10 IU/mL) and 4 subjects with alcoholic liver disease (<10 IU/mL for 3 subjects and 16 IU/mL for 1 subject). One of the 5 subjects had HCV RNA detected by an FDA-approved HCV quantitative assay.
Table 25: Distribution of Results in Subjects with Non-HCV Related Liver Diseases
Liver Disease
Specificity (%) 95% CIa
Not Detecte
d
<10 IU/mL
10 to <25
IU/mL
25 to 100,000,000
IU/mL
>100,000,000
IU/mL Total
Autoimmune hepatitis
96.8 (83.8-99.4)
30 (96.8)
1 (3.2)
0 (0.0)
0 (0.0)
0 (0.0) 31
Alcoholic liver disease
92.2 (81.5-96.9)
47 (92.2)
3 (5.9)b
1 (2.0)
0 (0.0)
0 (0.0) 51
Chronic HBV
100 (89.8-100)
34 (100)
0 (0.0)
0 (0.0)
0 (0.0)
0 (0.0) 34
Primary biliary
cirrhosis
100 (90.6-100)
37 (100)
0 (0.0)
0 (0.0)
0 (0.0)
0 (0.0) 37
NASH 100 (91.0-100)
39 (100)
0 (0.0)
0 (0.0)
0 (0.0)
0 (0.0) 39
Multiple Liver
Diseasesc
100 (34.2-100)
2 (100)
0 (0.0)
0 (0.0)
0 (0.0)
0 (0.0) 2
Total 97.4 (94.1-98.9)
189 (97.4)
4 (2.1)
1 (0.5)
0 (0.0)
0 (0.0) 194
aScore CI bOne subject had HCV RNA detected by an FDA-approved HCV quantitative assay. cSubjects had both autoimmune hepatitis and primary biliary cirrhosis.
The results of the study demonstrate that the Aptima HCV Quant Dx Assay can determine the absence of active HCV infection in subjects with a range of liver diseases due to causes other than HCV. When real-time PCR assays such as the Aptima HCV Quant Dx Assay are used to aid in the diagnosis of HCV infection, a cut-off of 25 IU/mL should be applied to distinguish between non-active and active HCV infection. The HCV RNa concentration, together with other markers of active liver disease, need to be evaluated if antiviral treatment is being considered.

PMA P160023: FDA Summary of Safety and Effectiveness Data Page 30
C. Reproducibility (3 sites)
Reproducibility was evaluated on the Panther system at three external U.S. sites. Two operators performed testing at each site. Each operator performed two runs per day over three days, using 3 reagent lots over the course of testing. Each run had 3 replicates of each panel member made by diluting HCV positive plasma with HCV-negative plasma. The positive panel members were positive for HCV genotypes 1, 2, or 3. HCV RNA concentrations spanned the linear range of the assay. Table 26 shows the reproducibility and precision of assay results for each positive panel member between sites, between operators, between lots, between days, between runs, within runs, and overall. The coefficient of variation was calculated using the following equation where σ2 is the sample variance of the data after log10 transformation:
Table 26: Reproducibility Between
Sites Between
Lots
Between Operators/
Daysa
Between Runs
Within Runs Total
GT N IU/mL Log10 IU/mL
SD (%CV)
SD (%CV) SD (%CV) SD
(%CV) SD
(%CV) SD
(%CV)
1
108 10.6 1.0 0.070 (16.22)
0.048 (10.98)
0 (0) 0.040 (9.20)
0.258 (64.93)
0.274 (69.94)
107 19.5 1.3b 0.034 (7.77)
0.035 (7.97)
0.009 (2.10)
0.064 (14.91)
0.169 (40.31)
0.187 (45.12)
108 43.6 1.6 0 (0) 0.070 (16.11)
0 (0) 0.061 (14.13)
0.155 (36.82)
0.180 (43.39)
108 602.7 2.8 0.042 (9.58)
0.035 (8.02)
0.022 (5.05)
0.023 (5.30)
0.075 (17.40)
0.098 (22.81)
108 22710.9 4.3 0.075 (17.42)
0.045 (10.49)
0.044 (10.08)
0.058 (13.46)
0.071 (16.57)
0.135 (31.74)
108 4195539.0 6.6 0.007 (1.65)
0.026 (6.08)
0.045 (10.43)
0 (0) 0.131 (30.97)
0.142 (33.50)
108 58549271.2 7.8 0.010 (2.26)
0.000 (0.00)
0.022 (5.10)
0.035 (8.08)
0.105 (24.42)
0.113 (26.43)
2
108 11.3 1.0 0.062 (14.29)
0.075 (17.28)
0.112 (26.28)
0 (0) 0.290 (75.02)
0.326 (86.94)
108 13.9 1.1 0 (0) 0.125 (29.36)
0.128 (30.18)
0.068 (15.83)
0.211 (51.69)
0.285 (73.45)
108 62.6 1.8 0 (0) 0.044 (10.18)
0.101 (23.48)
0.069 (16.00)
0.124 (29.25)
0.180 (43.24)
108 351.0 2.5 0.022 (5.18)
0.062 (14.38)
0.004 (1.01)
0.045 (10.31)
0.081 (18.70)
0.113 (26.56)
108 14519.2 4.1 0 (0) 0.051 (11.78)
0.048 (11.01)
0.011 (2.42)
0.092 (21.50)
0.116 (27.25)

PMA P160023: FDA Summary of Safety and Effectiveness Data Page 31
Between Sites
Between Lots
Between Operators/
Daysa
Between Runs
Within Runs Total
GT N IU/mL Log10 IU/mL
SD (%CV)
SD (%CV) SD (%CV) SD
(%CV) SD
(%CV) SD
(%CV) 108 5810012.3 6.8 0 (0) 0.017
(4.00) 0.041 (9.54)
0.015 (3.53)
0.104 (24.25)
0.114 (26.73)
108 77499195.7 7.9 0 (0) 0.018 (4.24)
0.028 (6.56)
0 (0) 0.077 (17.77)
0.084 (19.46)
3
107 8.6 0.9b 0.049 (11.32)
0.103 (24.05)
0.056 (12.95)
0 (0) 0.225 (55.47)
0.258 (65.16)
108 14.3 1.1 0.157 (37.31)
0 (0) 0.090 (21.04)
0 (0) 0.178 (42.88)
0.254 (63.90)
107 49.9 1.7b 0.119 (27.96)
0.065 (15.08)
0.047 (10.80)
0.034 (7.81)
0.109 (25.42)
0.183 (44.15)
108 218.3 2.2 0.324 (86.23)
0.043 (10.01)
0.139 (32.83)
0.063 (14.64)
0.082 (19.09)
0.370 (103.21)
107 8541.1 3.9b 0.248 (61.97)
0.056 (12.90)
0.151 (35.77)
0.048 (10.99)
0.078 (18.19)
0.309 (81.20)
107 4128761.4 6.6b 0.044 (10.17)
0 (0) 0 (0) 0.042 (9.61)
0.126 (29.65)
0.140 (33.06)
108 63813728.0 7.8 0.012 (2.84)
0 (0) 0 (0) 0.059 (13.76)
0.092 (21.32)
0.110 (25.71)
%CV=log-normal coefficient of variation, GT=genotype, SD=standard deviation (log10 IU/mL) Note: Variability from some factors may be numerically negative. This can occur if the variability due to those factors is very small. In these cases, SD and CV are shown as 0. aBetween Operators may be confounded with Between Days; therefore, Between Operators and
Between Days estimates are combined in Between Operators / Days. bN=107 for these panel members. One replicate had an invalid result.
D. Safety and Effectiveness Results
1. Safety Results
There were no adverse effects of the device reported while the study was conducted.
2. Effectiveness Results
The analysis of effectiveness of the Aptima HCV Quant Dx Assay was assessed for two purposes: 1) ability of the test to measure RNA levels at baseline, during, and after treatment (clinical performance). 2) ability to detect RNA in anti-HCV positive individuals (diagnostic utility). See results in Section X. A and B, above.
Overall, the clinical studies demonstrate the effectiveness of the Aptima HCV Quant Dx assay in accurately detecting the presence of HCV RNA in samples from anti-HCV positive individuals and in accurately measuring HCV RNA levels in patients undergoing treatment.

PMA P160023: FDA Summary of Safety and Effectiveness Data Page 32
3. Subgroup Analyses Not Applicable.
4. Pediatric Extrapolation
In this premarket application, existing clinical data was not leveraged to support approval of a pediatric patient population.
E. Financial Disclosure
The Financial Disclosure by Clinical Investigators regulation (21 CFR 54) requires applicants who submit a marketing application to include certain information concerning the compensation to, and financial interests and arrangement of, any clinical investigator conducting clinical studies covered by the regulation. The pivotal clinical study included 38 investigators. None of the clinical investigators had disclosable financial interests/arrangements as defined in sections 54.2(a), (b), (c), and (f). The information provided does not raise any questions about the reliability of the data.
XI. PANEL MEETING RECOMMENDATION AND FDA’S POST-PANEL ACTION
In accordance with the provisions of section 515(c)(3) of the act as amended by the Safe Medical Devices Act of 1990, this PMA was not referred to the FDA Microbiology Devices Advisory Panel, an FDA advisory committee, for review and recommendation because the information in the PMA substantially duplicates information previously reviewed by this panel.
XII. CONCLUSIONS DRAWN FROM PRECLINICAL AND CLINICAL STUDIES
A. Effectiveness Conclusions
• The effectiveness of the Aptima HCV Quant Dx Assay has been demonstrated when used for the quantitation of HCV RNA in human plasma [EDTA, ACD, plasma preparation tubes (PPT)] and serum and serum separation tubes (SST) for diagnosis in patients who are anti-HCV positive and for the management of patients undergoing treatment.
• There are no issues with endogenous interferents at physiological levels or with commonly administered medications.
• Whole blood can be stored at 2oC to 30oC and must be centrifuged within 6 hours of specimen collection. Plasma or serum may then be stored under one of the following conditions: o In the primary collection tube or specimen aliquot tube (SAT) at 2oC to 25oC
for up to 24 hours. o In the primary collection tube or SAT at 2oC to 8oC for up to 5 days, or o In the SAT at -20oC for up to 60 days.

PMA P160023: FDA Summary of Safety and Effectiveness Data Page 33
• The preservatives that the Aptima HCV Quant Dx Assay reagents and controls contain have been shown to meet USP Chapter 51 criteria.
• The Aptima Quant Dx assay reagents can be stored at 2-8oC for 15 months. • The clinical performance was evaluated in an ethnically diverse population
representative of the intended use population: anti-HCV positive individuals (see diagnostic utility studies, above) and patients undergoing HCV therapy (see clinical performance studies, above). Overall, the clinical studies demonstrate the effectiveness of the Aptima HCV Quant Dx assay in accurately detecting the presence of HCV RNA in samples from anti-HCV positive individuals and in accurately measuring HCV RNA levels in patients undergoing treatment.
B. Safety Conclusions
Based on the results of the analytical and clinical laboratory studies, the Aptima HCV Quant Dx Assay, when used according to the provided directions and in conjunction with other laboratory results and clinical information, should be safe and pose minimal risk to the patient due to false test results.
C. Benefit-Risk Determination
The benefits outweigh the risks at the level of performance observed in the pivotal clinical study. Complementary analytical studies strengthen this conclusion. Accurate detection and quantitation of HCV RNA is an essential component of the diagnosis of active HCV infection and the treatment of HCV. In an era of highly effective treatment for active HCV infection, the identification of patients with active infection as candidates for treatment and ascertainment of sustained virological response has substantial individual benefit (i.e., reduction of the risk of progressive liver disease and the incidence of hepatocellular carcinoma) and public health benefit (i.e., interruption of transmission). Risks include false positive/false negative test results and inaccurant quantification. These are substantially mitigated by device design (i.e., use of controls), and the likelihood of additional testing for false positive or false negative results. Errors of quantification in the current era of highly active antiviral therapy are unlikely to be significant outside of unique circumstances.
Patient Perspectives This submission did not include specific information on patient perspectives for this device.
D. Overall Conclusions
The data in this application support the reasonable assurance of safety and effectiveness of this device when used in accordance with the indications for use. The rate of false positive and false negative results is within acceptable limits compared with previously approved tests. Therefore, this device should benefit the physician in

PMA P160023: FDA Summary of Safety and Effectiveness Data Page 34
the diagnosis and management of HCV infected patients when used according to the directions for use in the labeling.
XIII. CDRH DECISION
CDRH issued an approval order on February 13, 2017.
The applicant’s manufacturing facilities have been inspected and found to be in compliance with the device Quality System (QS) regulation (21 CFR 820).
XIV. APPROVAL SPECIFICATIONS
Directions for use: See device labeling. Hazards to Health from Use of the Device: See Indications, Contraindications, Warnings, Precautions, and Adverse Events in the device labeling. Post-approval Requirements and Restrictions: See approval order.