SUMMARY OF EXPERIMENTAL CORE TURBULENCE CHARACTERISTICS IN OH AND ECRH T-10 TOKAMAK PLASMAS V....
14
SUMMARY OF EXPERIMENTAL CORE TURBULENCE CHARACTERISTICS IN OH AND ECRH T-10 TOKAMAK PLASMAS V. Vershkov, L.G. Eliseev, S.A. Grashin. A.V. Melnikov, D.A. Shelukhin, S.V. Soldatov, A.O. Urazbaev and T-10 team 20 th IAEA Fusion Energy Conference, Vilamoura, Portugal, 1 – 6 November, 2004 RUSSIAN RESEARCH CENTRE “KURCHATOV INSTITUTE”
-
date post
22-Dec-2015 -
Category
Documents
-
view
221 -
download
2
Transcript of SUMMARY OF EXPERIMENTAL CORE TURBULENCE CHARACTERISTICS IN OH AND ECRH T-10 TOKAMAK PLASMAS V....
SUMMARY OF EXPERIMENTAL CORE TURBULENCE CHARACTERISTICS IN OH
AND ECRH T-10 TOKAMAK PLASMAS
V. Vershkov, L.G. Eliseev, S.A. Grashin. A.V. Melnikov, D.A. Shelukhin, S.V. Soldatov, A.O. Urazbaev and T-10 team
20th IAEA Fusion Energy Conference, Vilamoura, Portugal, 1 – 6 November, 2004
RUSSIAN RESEARCH CENTRE “KURCHATOV INSTITUTE”

GOAL OF INVESTIGATIONS – TO UNDERSTAND THE PHYSICAL MECHANISMS OF PLASMA TURBULENCE. WITH THIS AIM :
1. None-linear turbulence greatly complicates the identification of the physical mechanisms as it distort the spectra. In order to evaluate non-linear properties the investigations were conducted in the wide range of discharge types from the highest Ohmic confinement with peaked density up to the degraded high power heated discharges.
2. Diagnostics capable of obtaining spatial structure, propagation properties of turbulence (correlation reflectometry, multipine Langmuir probes and HIBP) were used
3. Radial, poloidal and absolute sensitivity of reflectometry to the local density fluctuations were especially checked with full wave 2D electromagnetic code.
4. Direct comparison of all three diagnostics were carried out in order to increase reliability of the results.
RUSSIAN RESEARCH CENTRE “KURCHATOV INSTITUTE”

The Schematics of T-10 diagnostics.
RUSSIAN RESEARCH CENTRE “KURCHATOV INSTITUTE”
Heavy Ion Beam Probe (HIBP)- Plasma potential and secondary ion
beam current fluctuations - sample volume ~1cm,bandwidth
100kHz
Scheme of poloidalcorrelations
Antennaarray
10 poloidally and radiallyseparated Langmuir probes
RailLimiter
Circularlimiter
• O-mode correlation reflectometer, poloidal, radial and toroidal correlations in ncr range from 0.8 to 7.8·1019 m-3
•Movable multipin Langmuir probes.
poloidal and radial correlations of density and floating potential fluctuations
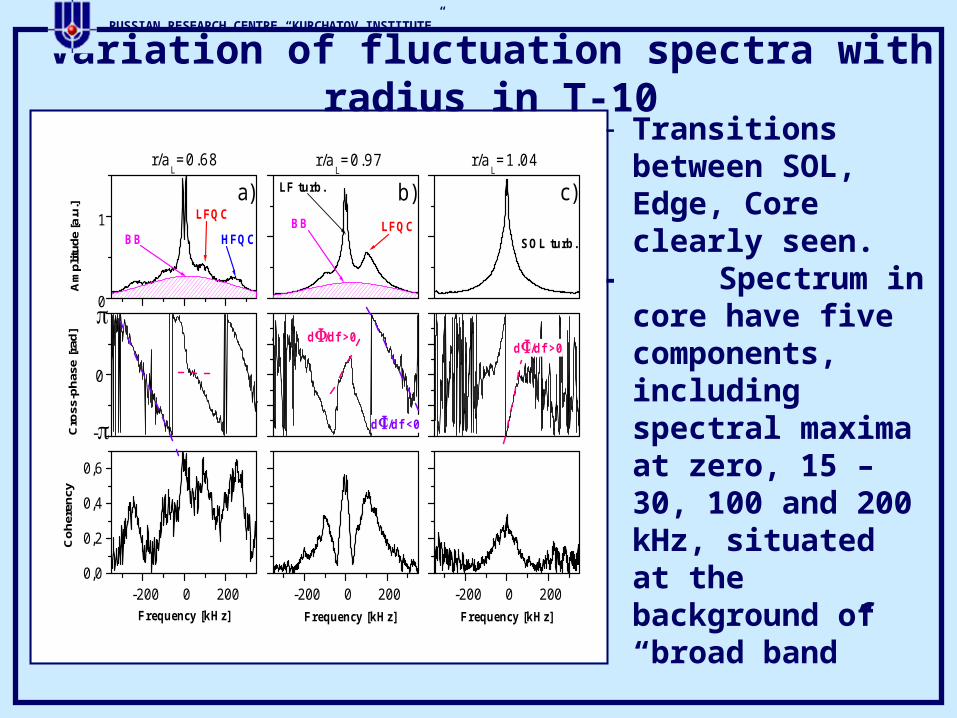
Variation of fluctuation spectra with radius in T-10- Transitions
between SOL, Edge, Core clearly seen.
- Spectrum in core have five components, including spectral maxima at zero, 15 – 30, 100 and 200 kHz, situated at the background of “broad band”
0
1
-200 0 2000,0
0,2
0,4
0,6
-200 0 200 -200 0 200
r/aL=0.97
BB HFQC
LFQCa)
r/aL=0.68
Am
plitu
de [a
.u.]
LF turb.
r/aL=1.04
BB LFQC
b)
SOL turb.
c)
-
C
ross
-pha
se [r
ad]
d/df <0
d/df >0
d/df >0
Coh
eren
cy
Frequency [kHz] Frequency [kHz]
0
Frequency [kHz]
RUSSIAN RESEARCH CENTRE “KURCHATOV INSTITUTE”

Turbulence types characterization by radial correlations
- Three turbulence types have different radial correlation length and phase shift
-Zero radial phase shift in LF and long radial length makes LF similar to “STREAMERS”?
Radial phase shift of QC may be explained by rotation of helical “fingers”, obtained in 3D gyrokinetic simulations due to the toroidal mode coupling of several modes
Broad Band (BB) has the lowest correlation length, corresponding to exitation of a single high m number modes. Reality of BB supported by Langmuir probes spectra
RUSSIAN RESEARCH CENTRE “KURCHATOV INSTITUTE”
0 2 40,0
0,2
0,4
0,6
0 2 40,0
0,2
0,4
0,6
0,8
1,0
0 2 40,0
0,2
0,4
0 2 4
-4,0
-2,0
0,0
2,0
0 2 4
-4,0
-2,0
0,0
2,0
0 2 4
-4
-2
0
2
R=0.5cm
R [cm]R [cm]
R=1.5cm
Phase Amplitude
R [cm]
R=4.0 cm
Cro
sscoerlation
Polo
idal S
hift [c
m]
pol
=1.6cm =54o
Low Frequency QuasiCoherent Broad Band

RUSSIAN RESEARCH CENTRE “KURCHATOV INSTITUTE”
Oscillations in frequency range 15 – 30 кHz ( I )
Set of strong oscillations are observed in 15 – 30 kHz range by reflectometry, Langmuir probes and HIBP Potential fluctuations are much higher then density Localized near m/n=2/1 island, shifts with q=2 position Several frequencies observed inside the m=2 island MODE are also observed near other rational surfaces
0,0 0,2 0,4 0,6 0,8 1,00
2
4
6
80,0 0,2 0,4 0,6 0,8 1,00
2
4
6m/n=2/1"25 kHz"
Iplasma
=300 kA
r/aL
Iplasma
=200 kA
Am
pli
tud
e [
a.u
.]
0 10 20 30 40 500.0
0.2
0.4
0.00.51.01.52.0
Frequency [kHz]
HIBP plasma potential
Fou
rier
am
plit
ude
[a.u
.]
= 0.93, = 0.07 HIBP Ion beam current
20 22 24 26 28 300
25
50
0
25
50
0
25
50
m=2, n=1MHD island
26 kHz
Radius [cm]
23 kHz
A m
p l
i t u
d e
[a.
u.]
20 kHz
MODE has no poloidal phase shift, m=0, verified by poloidal correlation at 50 and 550
MODE exists only at densities lower then ne = 2·1019 m-3
All properties (m=0, strong Er, frequency Cs/2R –rising as Te1/2) similar to the
Geodesic Acoustic Mode, which is the branch of Zonal Flows, predicted by Theory• Theories predict uniform distribution of zonal flows – experiment shows localization of modes near the rational surfaces!!! At zero frequencies modes have not found yet!!

RUSSIAN RESEARCH CENTRE “KURCHATOV INSTITUTE”
Oscillations in frequency range 15 – 30 кHz ( II )
0 20 40 60 80 1000,0
0,2
0,4
0,6
0,80,0
0,5
1,0
1,5
0,0
0,2
0,4
0,6
Coh
eren
cy
Frequency [kHz]
Cro
ssph
ase
[]
Envelope of quasi-coherent oscillations Phase of reflectometer signal
Amp.
[a.u
.]
0 1 20,0
0,1
0,2
0,3
0,4
0,5
0,6 k=r/
r=0.78 rad/cm
r [ r
ad]
r [cm]
Radial phase shift
Modulation of the total level of density fluctuations with f>50 kHz
1. Radial width of the mode from amplitude and phase measurements in the range 4 – 8 cm
1. 10% modulation of the total fluctuation level in 50< f <400
kHz at mode frequency2. 90% coherency 3. Coherency rises to zero frequency

The physics of two types of quasi-coherent fluctuations• HF and LF QC not correlated and differs in
space - both are seen at LFS, but only HF at HFS
• k·ρi value for LF QC in core close to 0.3,
predicted for ITG instability • k·ρi value for HF QC oscillations in core
close to 1, predicted for DTEM instability • Radial dependences of growth rates clearly
show three regions of DTEM, ITG and BRI instabilities localization
• HF QC oscillations maximal in gradient region in agreement with DTEM growth rate
• LF QC oscillations minimal near a/2 in zone of minimum ηi typical for ITG
• LF QC is stabilized from 12 to 17.5 cm at peaked density, where ηi decreases lower
then some critical value, although 0?• Strong gas influx broadens density profile,
increases ηi and destabilizes LF QC
0
2
4
6
8
0.4 0.81
10
0.4 0.8
ne broad
ITG
DTEM [104 c
-1]
ne peaked
ITG
DTEM
0
LFQC
HFQC
0
n/n
[a.u
.]
LFQC
HFQC
0.0
0.2
0.4
0.6
0.4 0.6 0.8 1.00
1
2 DTEM BRI ITG
= r / a
[105 s
-1]
Velo
cit
y s
hear
zo
ne
HFQC LFQC
k i
0 100 200 300 400
0,2
0,4 HF QCLF QC LFS HFS
Frequency [kHz]
Am
plit
ude
[a.u
.]
RUSSIAN RESEARCH CENTRE “KURCHATOV INSTITUTE”

Turbulence dependence on density in discharge LF QC (ITG) oscillations dominate at low
density. HF QC (DTEM) oscillations dominate at high density. This tendency is similar for OH and ECRH.
LF QC (ITG) instability at low density may be connected with high neutral particle penetration to the plasma center.
Neutrals do not penetrate in plasma core at higher densities, and DTEM instability dominates in this case
Relative fluctuation level for ρ=0.5 seems not depend on density
Turbulence increases in a factor of two in ECRH in accordance with confinement degradation
• Quasi-Coherent input in spectrum drastically decreases with increase of heating power and turbulence level. This is consistent with destruction of toroidal coupling by zonal flows
0.0 0.2 0.4 0.6 0.8 1.00.0
0.5
1.0
ne/n e
[%]
ne/n
Gr
OH ECRH
RUSSIAN RESEARCH CENTRE “KURCHATOV INSTITUTE”
0.0
0.2
0.4
0.6
-400 -200 0 2000.0
0.5
1.0
-400 -200 0 200 -400 -200 0 200
LFQC
ne/n
Gr=0.17
Am
plitu
de [a
.u.]
HFQCLFQC
ne/n
Gr=0.35
HFQC
ne/n
Gr=0.44
ne/n
Gr=0.25
Frequency [kHz]
ne/n
Gr=0.32 n
e/n
Gr=0.53

Turbulence rotation
• Angular rotation and poloidal m number of LF and HF QC fluctuations are constant along radius in core OH plasma (rigid body rotation) in OH T-10 plasma. (Strong long distance toroidal coupling??)
• Turbulence velocity closely related with m/n=2/1 MHD island velocity in stationary conditions (Coupling with MHD??).
• Rigid body rotation easily breaks under strong edge cooling either by gas puff or pellet injection
RUSSIAN RESEARCH CENTRE “KURCHATOV INSTITUTE”
q(a)=2.5 (OH) q(a)=3.9 OH +ECRH
0,4 0,6 0,8 1,00,0
0,2
0,4
0,6
0
20
40
60
0123
HF QCLF QC
k po
l·i
Vel
oci
ty s
hea
r zo
ne
HF QCLF QC
Po
loid
al
nu
mb
er
q=2 position
m=2
[1
04 rad
/s]
0,2 0,4 0,6 0,80,0
0,2
0,4
0
20
40
600
1
2
k po
l·i
LF QC Ohmic LF QC ERCH HF QC Ohmic
Pol
oid
al
nu
mb
er
m=2
q=2 position Ohmic ECRH
[104 r
ad/s
]

• Relative density fluctuation amplitude during ECRH are higher in 2-3 times then in OH phase, in spite of low R/Lt=4 temperature gradient, connected with high particles influx.
• Strong electron temperature gradient R/Lt=16 and local minimum of turbulence amplitude and coherency are observed at ρ ~ 0.3 15 ms after ECRH switch of . This proves e-ITB
• Velocity shear is NOT observed.
• Possible mechanism of ITB – decrease of a number of rational surfaces near q=1 surface at low magnetic shear.
0,1 0,2 0,3 0,4 0,50,4
0,6
0,8
1,0
1,2
1,4
R/LT
e
=4
R/LT
e
=16
ECRH 5-10 ms after ECRH Ohmic
Te [
keV
]
Radius [cm]
0.1 0.2 0.3 0.4 0.50.0
0.2
0.4
0.6
0.8
1.0
1.2
<n
2 >1/2 /n
[a. u
.]
= r/a
0.1 0.2 0.3 0.4 0.50.0
0.1
0.2
0.3
0.4
Coh
eren
cy
= r/a
0,2 0,4 0,6 0,80,0
0,5
1,0
1,5
2,0
2,5ECRH position
po
l [10
4 rad
·c-1 ]
=r/a
RUSSIAN RESEARCH CENTRE “KURCHATOV INSTITUTE”
Turbulence behavior in off axis ECRH

Fast plasma edge cooling in OH plasmaEdge cooling with Ne puff at 400 ms leads to:
· Strong decrease of edge Dα light; Drop within 1 ms of HF QC turbulence at ρ=0.4; Increase within 2 ms of the core SXR radiation; Density peaking.
Possible explanation:
· Strong decrease of the edge rotation, causing temporal velocity shear between edge and core and suppression of QC turbulence due to velocity shear.
Turbulence at the beginning stage of ECRH Ohmic confinement may maintains up to 20 ms after
ECRH start. “Delay of Confinement Deterioration” in ASDEX with NBI, in T-10 with ECRH.
· HF QC fluctuations dominant at the first 5–15 ms at increased electron temperature gradient and low particles influx. LF QC substitute them after particle influx rise and density profile broadening.
· Excitation of TEM with transition to ITG after density profile broadening is consistent with theory.
490 500 510 5200
1
2
3
0
5
10
0
10
20
30
0,0
0,2
0,40
1
2
Time [ms]
e
ECRH
R/L
(Ne) R
/LT
e
Co
here
ncy
Shot 32942
Am
plitu
de
[a.u
.]
LF peak HF peak
RUSSIAN RESEARCH CENTRE “KURCHATOV INSTITUTE”
380 390 400 410 420 430 4400,0
0,5
1,0
0
10
20
30
3
4
5
6
Time [ms]
D
180-300 kHz
Tu
rbu
len
ce le
vel
0
10
20
3050-180 kHz
ECRH switch on
Fast edge cooling
Ne gas puff
d=5cm d=16.2cm
I SX
R
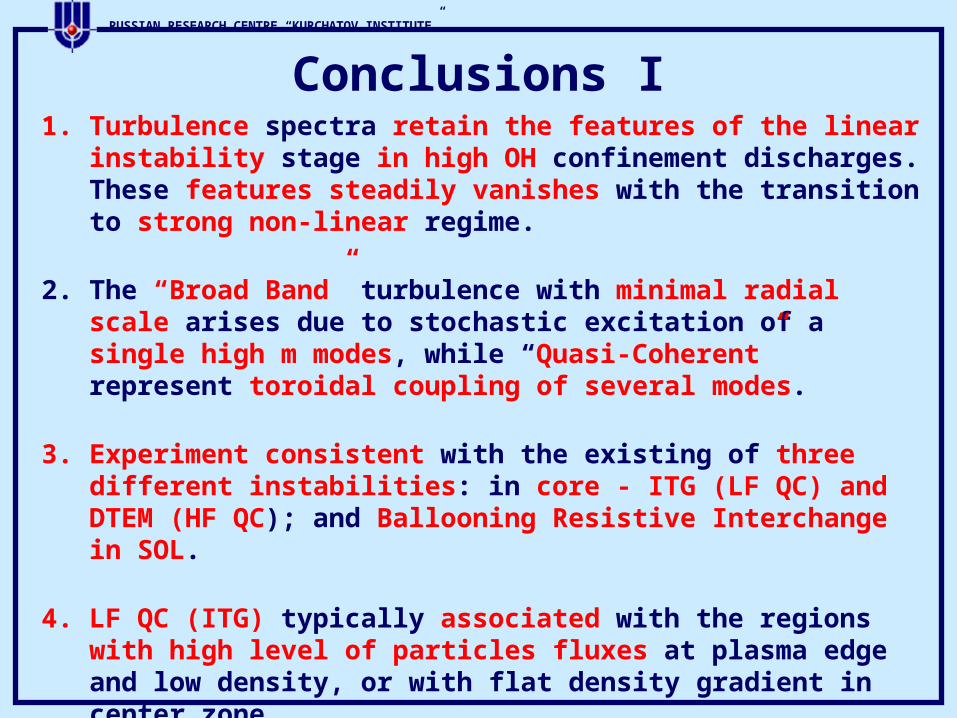
Conclusions I1. Turbulence spectra retain the features of the linear instability
stage in high OH confinement discharges. These features steadily vanishes with the transition to strong non-linear regime.
2. The “Broad Band” turbulence with minimal radial scale arises due to stochastic excitation of a single high m modes, while “Quasi-Coherent” represent toroidal coupling of several modes.
3. Experiment consistent with the existing of three different instabilities: in core - ITG (LF QC) and DTEM (HF QC); and Ballooning Resistive Interchange in SOL.
4. LF QC (ITG) typically associated with the regions with high level of particles fluxes at plasma edge and low density, or with flat density gradient in center zone.
5. HF QC (DTEM), in difference, typical for low particles fluxes region and high electron temperature gradients.
RUSSIAN RESEARCH CENTRE “KURCHATOV INSTITUTE”

Conclusions II6. OH and ECRH discharges showed the transition from LF to HF QC
with increase of density from low up to critical. The integrate turbulence level not depends on ne, despite change of the mode type. Turbulence level at half radius increases with total power
7.Special modes near 15 – 30 kHz were observed with properties
of Geodesic Acoustic Mode, which is a the branch of “zonal flows”. But its localization at rational surfaces contradict to existing theories. The predicted “zonal flows” near zero frequency haven’t seen yet.
8. QC oscillations tends to rotate as a rigid body with velocity of MHD m/n=2/1 island that suppose mechanism of long distance interaction between fluctuations at different radii and global MHD modes. This interaction could be destroyed by the relatively weak velocity shear (SOC-IOC, cold puff)
9. Significant progress were achieved both in experimental turbulence characterization and in theory, but, unfortunately, only a few works devoted to their direct comparison.
RUSSIAN RESEARCH CENTRE “KURCHATOV INSTITUTE”