Summary of District’s LCAP 2015-2018 Elem./Middle/High School Parent Forums Quarterly ......
21
SUMMARY OF LONG BEACH UNIFIED SCHOOL DISTRICT’S 2015-2018 LCAP AUGUST 2015 DISTRICT PROFILE: Students: LBUSD serves 79,709 students including approximately 70% high need students. The district has high percentages of socio-economically disadvantaged students (68%) and English language learners (23%) – SEE APPENDIX Student Achievement: LBUSD has an 80% graduation rate. Just 57% of 9th graders and 39% of 3rd graders meet grade level standards in English Language Arts. LCAP REVIEW SECTIONS: A. Stakeholder Engagement: The district maintains several committees of stakeholders. It is not clear if most of those are involved with the LCAP. An LCAP Advisory Committee, a parent committee, a student committee and an English Learner committee provided feedback on the LCAP. Almost no data is provided on how many people gave LCAP input or on their demographic characteristics. – SEE PAGES 2-3 B. 2014-15 Annual Update: LBUSD spent close to what it had planned overall but underspent on high need students by $1.2 million. The district summarily asserts that actions “were largely implemented as planned”, but several significant expenditure deviations ($500,000 to $4 million) are unexplained. Most measures lack data for judging if progress was made this year. The district plans to continue with current plans, reasoning it is too soon to change. – SEE PAGES 3-9 C. Goals and Measurable Outcomes: The district identifies 37 specific and measurable outcomes as its goals, grouping them under Conditions of Learning (8), Pupil Outcomes (18), and student and parent Engagement (11). All required state priority areas and progress metrics are included. – SEE PAGES 9-12 D. Actions and Expenditures: LBUSD lumps together many separate actions into very general descriptions and rolled up groups of expenditures, preventing an understanding of specific actions taken to meet goals and their specific cost. Though required, the district also fails to separately identify the $85.8 million in districtwide and schoolwide actions paid for with supplemental and concentration funds and to justify those actions as properly focused on high need pupils. Some $14 million of these same funds are for basic services and operations—such as pensions, maintenance, campus security and administration—that do not appear to provide any enhanced benefit for high-need students. Finally, the district does not describe how it will ensure that $13.6 million in supplemental and concentration funds sent directly to school-sites will be properly focused on high need pupils. – SEE PAGES 12-20 PREPARED BY FOR
-
Upload
duongtuong -
Category
Documents
-
view
214 -
download
0
Transcript of Summary of District’s LCAP 2015-2018 Elem./Middle/High School Parent Forums Quarterly ......

SUMMARY OF LONG BEACH UNIFIED SCHOOL DISTRICT’S 2015-2018 LCAP
AUGUST 2015 DISTRICT PROFILE:
Students: LBUSD serves 79,709 students including approximately 70% high need students. The district has high percentages of socio-economically disadvantaged students (68%) and English language learners (23%) – SEE APPENDIX
Student Achievement: LBUSD has an 80% graduation rate. Just 57% of 9th graders and 39% of 3rd graders meet grade level standards in English Language Arts.
LCAP REVIEW SECTIONS:
A. Stakeholder Engagement: The district maintains several committees of stakeholders. It is not clear if most of those are involved with the LCAP. An LCAP Advisory Committee, a parent committee, a student committee and an English Learner committee provided feedback on the LCAP. Almost no data is provided on how many people gave LCAP input or on their demographic characteristics. – SEE PAGES 2-3
B. 2014-15 Annual Update: LBUSD spent close to what it had planned overall but underspent on high need students by $1.2 million. The district summarily asserts that actions “were largely implemented as planned”, but several significant expenditure deviations ($500,000 to $4 million) are unexplained. Most measures lack data for judging if progress was made this year. The district plans to continue with current plans, reasoning it is too soon to change. – SEE PAGES 3-9
C. Goals and Measurable Outcomes: The district identifies 37 specific and measurable outcomes as its goals, grouping them under Conditions of Learning (8), Pupil Outcomes (18), and student and parent Engagement (11). All required state priority areas and progress metrics are included. – SEE PAGES 9-12
D. Actions and Expenditures: LBUSD lumps together many separate actions into very general descriptions and rolled up groups of expenditures, preventing an understanding of specific actions taken to meet goals and their specific cost. Though required, the district also fails to separately identify the $85.8 million in districtwide and schoolwide actions paid for with supplemental and concentration funds and to justify those actions as properly focused on high need pupils. Some $14 million of these same funds are for basic services and operations—such as pensions, maintenance, campus security and administration—that do not appear to provide any enhanced benefit for high-need students. Finally, the district does not describe how it will ensure that $13.6 million in supplemental and concentration funds sent directly to school-sites will be properly focused on high need pupils. – SEE PAGES 12-20
PREPARED BY FOR

2
LBUSD’s LCAP SUMMARY 2015-2018 Prepared by Public Advocates for Californians for Justice
LCAP Section 1: Stakeholder Engagement
The district’s summary of Stakeholder Engagement starts on page 4 of the LCAP. The district’s stakeholder-consultation strategy is to:
1. Focus on building the capacity of stakeholders so that they own the work. 2. Align related initiatives into a cohesive message so that stakeholders understand the big picture. 3. Use existing communication structures so that the initiatives become a natural part of the
stakeholders’ ongoing work.
The district has several standing committees of stakeholders, and it meets with those committees regularly. The most relevant committees are summarized in the following table (see LCAP p. 4-5). It has formed a new student advisory committee.
Group Stakeholder Frequency
Community LCAP Advisory Committee (over 60 students, staff, community partners & others)
Quarterly
Parents District Community Advisory Committee Monthly
Parents District English Learner Advisory Committee Monthly
Parents Concerned African American Parents Monthly
Parents Superintendent Parents Forum Quarterly
Parents Elem./Middle/High School Parent Forums Quarterly
Students Superintendent’s Student Advisory Committee New
August 2014 – January 2015 In the first semester of last year, the district took three steps to incorporate stakeholder input:
1. Trained administrators and teachers on LCAP implementation; 2. Engaged stakeholders in data analyses, including on student attendance and AP course enrollment, and
used analysis to set the stage for the LCAP Data Dashboard; and 3. Reviewed progress reports on LCAP metrics.
As a result of this engagement, LBUSD took various actions:
1. Published “Continuous Improvement Expenditure” Plans, requiring School Site Councils to identify school-site actions that aligned with LCAP priorities.
2. Created the LCAP Data Dashboard to monitor LCAP implementation progress at the district and school level.
February 2015 – June 2015 In the second semester, LBUSD took four steps to incorporate stakeholder input:
1. Provided formal updates on LCAP implementation; 2. Connected the LCAP, NCLB waiver, and other initiatives to align metrics that were common across the
plans; 3. Reported progress to the LCAP Advisory Committee and shared that report with stake holders groups;
and 4. Solicited feedback from stakeholders along with a survey.

3
LBUSD’s LCAP SUMMARY 2015-2018 Prepared by Public Advocates for Californians for Justice
Beyond listing the regular meetings above, the district does not attempt to quantify the extent of its LCAP stakeholder engagement, the number of people providing input or their demographic characteristics. The LCAP does not attempt to identify all the ways in which its engagement impacted the LCAP as required. Instead, it lists a few examples of impact, including:
1. Established a districtwide newsletter (which reaches 35,000 stakeholders) called “Engagement, Performance, and Well-Being” which links the LCAP to other accountability mechanisms;
2. Incorporated these ideas into the LCAP (see LCAP p. 6), including: a. Retain the general format of the LCAP and enhance where necessary b. Establish AP Coordinators c. Add new courses d. Pay for AP exams e. Fund schools for summer bridge programs and interventions f. Enhance supports for English Learners and Foster Youth
LCAP Section 2: 2014-15 Annual Update
The district’s Annual Update for 2014-15 starts on page 62 of the LCAP. 4a) According to the Annual Update, how much supplemental and concentration funding did the district spend last year? Does it match what the district said it planned to spend?
Planned S&C Expenditure Actual S&C Expenditure Under-spending
$37,550,000.00 $36,347,007.00 $1,202,993.00
The district came close to spending all its supplemental and concentration funding last year; however, its failure to reflect on its planned actions means it is not clear why the district spent less than planned.
Although it spent most of its supplemental and concentration money, however, LBUSD did not spend the money as planned. The table below in (4c) summarizes several actions where the district spent much less or much more than planned on a single action.
The district did not explain why its spending varied so substantially from its planned budget anywhere in the LCAP, making it difficult to tell whether district staff reflected about how to improve implementation in the coming year.
District Reflection and Analysis:
The district failed to report on the actions it took last year. Instead, it writes throughout that “the actions/services were implemented largely as planned.” This statement does not clarify what the district actually did—for example, hiring more staff or purchasing new materials—to achieve its goals.
While LBUSD briefly sketched out next steps for many actions, these next steps do not clarify variances in spending or show a commitment to using the LCAP as a comprehensive planning tool. These vague explanations additionally make it hard for parents and students to make sure that the district’s reflection takes their priorities into account moving forward.
The district’s limited reporting also obscures the reasons it spent more or less than budgeted (see table below listing the most over- and under-budget expenditures below).

4
LBUSD’s LCAP SUMMARY 2015-2018 Prepared by Public Advocates for Californians for Justice
Even where the district spent much more or much less than originally planned, it did not explain the discrepancy, either in describing the action it took or in discussing steps for next year. If the district spent nearly $2 million less than budgeted, it seems unlikely that the actions and services were implemented as planned. Yet LBUSD did not make it clear why it spent less.
o See the table below in 4c for a list of expenditures that spent either much less or much more than anticipated.
4b) How did the district spend its Supplemental & Concentration dollars last year?
4c) Did the district do what it said it would do in the 2014-15 LCAP?
The following table shows each expenditure that varied by more than $500,000 (or .5% of the district’s total budget). Red means the district spent less than anticipated; green means it spent more.
The district spent substantially more on textbooks and instructional materials to implement the Common Core standards—more than $4 million more than it budgeted.
The district spent substantially less than it budgeted on four actions: o Professional development/assistance to beginning teachers o School-site allocations
1.1 Basic Services: Teachers (Credentialed
& Properly Assigned) $1,420,000
1.2 Basic Services: Standards-aligned
instructional materials (Textbooks) $4,128,500
1.3 Basic Services: School Facilities in Good
Repair $0
2. Implementation of State Standards (CCSS &
ELD) $1,315,400
3. Course Access $2,730,000
4. Student Achievement $14,069,500
5. Student Engagement $3,529,000
6. Other Student Outcomes* $2,770,500
7 School Climate: Restorative Justice,
Social Emotional Support,and Campus Security $1,783,107
8. Parental Involvement $479,000
9. School-Site Allocation $5,542,000
How Much Did LBUSD Spent Last Year in Supplemental and Concentration Funds?

5
LBUSD’s LCAP SUMMARY 2015-2018 Prepared by Public Advocates for Californians for Justice
o Targeted behavioral interventions/campus police
The district did not spend any of the money it allocated for restorative justice.
2014-15 Planned Action & Spending 2014-15 Actual Action & Spending Significant Change
Provide assistance to teachers through the Beginning Teacher Support and Assessment (BTSA), National Board Certification, and Teachers on Special Assignment. $2,460,000.00
The actions/services were implemented largely as planned. $1,420,200.00
-$1,039,800.00
Adopt, replace, and/or provide sufficient textbooks and instructional materials aligned with Common Core. $8,000.00
The actions/services were implemented largely as planned. $4,128,500.00
$4,120,500.00
The actions and services in this section include professional and instructional development for: − Teachers on Special Assignments − Trainers − Coaches − Basic Library Services − Principals − Site Staff (Non-Academic) Additional actions and services include: − Professional Development for Certificated and Classified Staff − Leadership Development − Gifted and Talented Education $440,000.00
The actions/services were implemented largely as planned. $976,400.00
$536,400.00
Allocate resources directly to schools so that they can implement the Common Core State Standards and address the unique needs of their students. $7,500,000.00
The actions/services were implemented largely as planned. $5,542,000.00
-$1,958,000.00
Provide strategic and systematic assistance to schools through: − Board of Education Initiatives −
The actions/services were implemented largely as planned.

6
LBUSD’s LCAP SUMMARY 2015-2018 Prepared by Public Advocates for Californians for Justice
Level Office Supports − Early Learning Initiative These allocations are intended to supplement site-based expenditures that advance Common Core implementation. $1,500,000.00
$339,000.00
-$1,161,000.00
LBUSD provides targeted services – in group or individual settings -- that relate to academic, behavioral, social-emotional, health, psychological, and other needs. These services include:
− Community and Ancillary Services (Recreation Aides, etc.);
− − Student Advisory resources; − Teaching Gardens; − Campus security/police support; and − Administrative services and contracts (e.g., Most Inspiring Students, etc.).
$2,660,000.00
The actions/services were implemented largely as planned. $1,783,107.00
-$876,893.00
Expand restorative justice programs that focus on prevention, early intervention, and leadership opportunities for promising students from historic. $100,000
While these resources were made available to schools, a number of interested sites opted to develop the program with their own funds. $0
-$100,000.00
4d) Did the District report on whether it met its expected outcomes and reflect on how progress or lack of progress will impact its approach for the 2015-16 LCAP? Outcomes and Progress Indicators:
Where data and baselines were available, the district did report whether or not it achieved the expected progress (see table below comparing expected outcomes with actual outcomes from the 2014-2015 Annual Update)
o The district fell short of most of its goals where it had data available to evaluate. o The district met or fell just short of its Williams goals to assign fully credentialed teachers
appropriately and provide adequate instructional materials and nearly met its goal to provide schools in good repair.

7
LBUSD’s LCAP SUMMARY 2015-2018 Prepared by Public Advocates for Californians for Justice
The district did not evaluate its progress on most goals since it does not yet have data available for the past school year. Where it does not yet have data, the district gave a timeline for when it expected the data would be available.
The district had one unquantifiable metric, “fully implement the Common Core Standards.” What the district means by full implementation is not apparent from the LCAP—presumably it relates to fully training teachers and adopting and implementing Common Core curriculum and materials.
Table: District Progress Toward its Goals
Green means the district met its goal; yellow means data is unavailable; red means the district fell short of its goal.
Conditions of Learning Goals
Expected Outcome Actual Outcome
100% compliance with teacher credential requirements
99.5% compliance with teacher credential requirements
100% compliance with teacher assignment requirements
100% compliance with teacher assignment requirements
100% compliance with the instructional materials requirements
100% compliance with the instructional materials requirements
100% of schools in “good” or “exemplary” repair 99% of schools in “good” or “exemplary” repair
Fully implement the Common Core Standards Fully implement the Common Core Standards
Establish the baseline for the number of elementary/K-8 schools offering programs that broaden the course of study
Align the establishment of the baseline with the release of other new data in Fall 2015
Establish the baseline for the percentage of middle school students who are enrolled in at least one elective class.
79% of middle school students are enrolled in at least one elective class.
50% of high school graduates complete the “a-g” requirements.
The official data will be reported in the spring of the 2015-2016 school year. The most recent result is 42% from 2013-2014.
Pupil Outcomes Goals
Establish the baseline for the percentage of all
students who are proficient or above in English
Language Arts (ELA).
Official data for the 2014-2015 school year will be
reported in the fall of the 2015-2016 school year.
Establish the baseline for the percentage of students from specific subgroups who are proficient or above in English Language Arts (ELA)
Official data for the 2014-2015 school year will be reported in the fall of the 2015-2016 school year.
Establish the baseline for the percentage of all students who are proficient or above in Math.
Official data for the 2014-2015 school year will be reported in the fall of the 2015-2016 school year.
Establish the baseline for the percentage of students from specific subgroups who are proficient or above in Math.
Official data for the 2014-2015 school year will be reported in the fall of the 2015-2016 school year.
53% of 8th grade students enroll in Algebra. 50% of 8th grade students enroll in Algebra.

8
LBUSD’s LCAP SUMMARY 2015-2018 Prepared by Public Advocates for Californians for Justice
Establish the baseline for the percentage of 8th grade Algebra students who earn a C grade or higher in the 2nd semester.
Official data for the 2014-2015 school year will be reported in the fall of the 2015-2016 school year.
Establish the baseline for the percentage of 9th grade Algebra students who earn a C grade or higher in the 2nd semester.
Official data for the 2014-2015 school year will be reported in the fall of the 2015-2016 school year.
35% of 11th and 12th grade students enroll in at least one Advanced Placement course.
34% of 11th and 12th grade students enrolled in at least one Advanced Placement course.
50% passing rate for 11th and 12th grade Advanced Placement exams.
Official data for the 2014-2015 school year will be reported in the fall of the 2015-2016 school year.
Establish the baseline for the percentage of 11th grade Early Assessment Program English participants who achieve a “Ready for College” score.
Official data for the 2014-2015 school year will be reported in the fall of the 2015-2016 school year.
Establish the baseline for the percentage of 11th grade Early Assessment Program Math participants who achieve a “Ready for College” score.
Official data for the 2014-2015 school year will be reported in the fall of the 2015-2016 school year.
Establish the baseline for the percentage of 12th grade students who meet Long Beach City College’s criteria for college readiness in English.
Official data for the 2014-2015 school year will be reported in the fall of the 2015-2016 school year.
Establish the baseline for the percentage of 12th grade students who meet Long Beach City College’s criteria for college readiness in Math.
Official data for the 2014-2015 school year will be reported in the fall of the 2015-2016 school year.
Establish the baseline for the percentage of 12th grade students who meet the California State University’s criteria for college readiness in English.
Official data for the 2014-2015 school year will be reported in the fall of the 2015-2016 school year.
Establish the baseline for the percentage of 12th grade students who meet the California State University’s criteria for college readiness in Math.
Official data for the 2014-2015 school year will be reported in the fall of the 2015-2016 school year.
Establish the baseline for the percentage of high school graduates who enroll in a two-year or four-year college.
Official data for the 2014-2015 school year will be reported in the fall of the 2015-2016 school year.
Increase the redesignation rate to a level above the state average.
11% redesignation rate for LBUSD; 11% redesignation rate for the state.
30% of high school pathway programs have “Linked Learning” certification.
16% of high school pathway programs have “Linked Learning” certification.
Engagement Goals
Establish the baseline for the percentage of parents who express satisfaction with their opportunities to participate in school decision-making processes and programs.
Official data for the 2014-2015 school year will be reported in the fall of the 2015-2016 school year.
Achieve an average attendance of 97% for elementary, middle, K-8, and K-12 schools, and 96.50% for high schools.
96.23% attendance rate for elementary middle, K-8, and K-12 schools. 96% attendance for high schools.
Establish the baseline for the percentage of schools that meet their attendance goals.
25% of schools meet their attendance goals.
9% chronic absenteeism rate 10% chronic absenteeism rate

9
LBUSD’s LCAP SUMMARY 2015-2018 Prepared by Public Advocates for Californians for Justice
Lower the middle school dropout rate to a level below the state average.
Official data for the 2014-2015 school year will be reported in the spring of the 2015-2016 school year.
Lower the high school dropout rate to a level below the state average.
Official data for the 2014-2015 school year will be reported in the spring of the 2015-2016 school year.
86% high school graduation rate. Official data for the 2014-2015 school year will be reported in the spring of the 2015-2016 school year.
Lower the suspension rate to a level below the state average.
Official data for the 2014-2015 school year will be reported in the spring of the 2015-2016 school year.
Lower the expulsion rate to a level below the state average.
Official data for the 2014-2015 school year will be reported in the spring of the 2015-2016 school year.
Establish the baseline for the student, parent, and staff member results of the School Culture and Climate Survey.
Official data for the 2014-2015 school year will be reported in the spring of the 2015-2016 school year.
4e) Does the district plan to make any significant changes to actions/service this year (2015-16) compared to last year (2014-15)? These include increases/decreases in funding, increases/decreases in actions/services.
2014-15 Planned Action & Spending 2015-16 Planned Action & Spending
By and large, it appears LBUSD is maintaining and continuing its overall goals and actions and not adjusting them based on its annual update review of progress. For the most part, the district responded to the LCAP prompt concerning any changes in actions, services, and expenditures as a result of the annual update review by stating some version of “Next steps include a comprehensive analysis of data and sharing of best practices across schools.”
LCAP Section 2: Goals and Measurable Outcomes
The goals and measurable outcomes for each goal are located on different pages of the LCAP. 5a) What are the district’s goals outlined in Section 2 of the LCAP? Districts are required to create goals in their LCAPs and to create annual outcome measures for those goals to indicate how they plan to progress each year. LBUSD adopts as its specific goals progress on all the various metrics required by the LCFF statute, and it groups those goals in LCFF’s three broad areas. Below are the 3 goal groups, the specific goals under them and their measures of progress. GOAL 1: Conditions of Learning Goals (Page 10 of the LCAP.)
Attain 100% compliance with the teacher credential requirements of the Williams case each year.
Attain 100% compliance with the teacher assignment requirements of the Williams case each year.
Attain 100% compliance with the instructional materials requirements of the Williams case each year.
Attain overall facility ratings of “good” or “exemplary” repair for 100% of schools each year.

10
LBUSD’s LCAP SUMMARY 2015-2018 Prepared by Public Advocates for Californians for Justice
Fully implement the Common Core State standards by the 2014-2015 school year (note that this sets a goal for a prior year, not a goal for the coming year).
On an annual basis, increase by 3% the number of elementary/K-8 schools offering programs that broaden the course of study.
On an annual basis, increase by 3% the number of middle school students who are enrolled in at least one elective class.
Increase the percentage of high school graduates who complete the “a-g” requirements to at least 60% by 2016-2017.
GOAL 2: Pupil Outcomes Goals (Page 25 of the LCAP.)
Increase the percentage of all students who are proficient or above in English Language Arts (ELA) by 3% annually.
Increase the percentage of students from specific subgroups who are proficient or above in English Language Arts (ELA) by 5% annually.
Increase the percentage of all students who are proficient or above in Math by 3% annually.
Increase the percentage of students from specific subgroups who are proficient or above in Math by 5% annually.
Increase the percentage of 8th grade students who enroll in Algebra by 3% annually.
Increase the percentage of 8th grade students who earn a C or higher in Algebra in the second semester by at least 1% annually.
Increase the percentage of 9th grade students who earn a C or higher in Algebra in the second semester by at least 2% annually.
Increase the percentage of 11th and 12th grade students who enroll in at least one Advanced Placement course by 2% annually.
Increase the passing rate for 11th and 12th grade Advanced Placement exams by 2% annually.
Increase the percentage of 11th grade Early Assessment Program English participants who achieve a “Ready for College” score by 3% annually.
Increase the percentage of 11th grade Early Assessment Program Math participants who achieve a “Ready for College” score by 3% annually.
Increase the percentage of 12th grade students who meet Long Beach City College’s criteria for college readiness in English by 3% annually.
Increase the percentage of 12th grade students who meet Long Beach City College’s criteria for college readiness in Math by 3% annually.
Increase the percentage of 12th grade students who meet the California State University’s criteria for college readiness in English by 3% annually.
Increase the percentage of 12th grade students who meet the California State University’s criteria for college readiness in Math by 3% annually.
Increase the percentage of high school graduates who enroll in a two-year or four-year college by 2% annually.
Each year, increase the English Learner redesignation rate to a level above the state average. Increase the percentage of ELs making annual progress in English to 62%. Increase the percentage of English Learners attaining English Proficient Level to 25.5% for those with fewer than 5 years and 52.8% for those with 5 or more years.

11
LBUSD’s LCAP SUMMARY 2015-2018 Prepared by Public Advocates for Californians for Justice
Increase the percentage of high school pathway programs that have “Linked Learning” certification to at least 90% by 2016-2017.
GOAL 3: Engagement Goals (Page 53 of the LCAP.)
Increase the percentage of parents who express satisfaction with their opportunities to participate in school decision-making processes and programs by at least 1% annually.
Achieve an average attendance of 97% for elementary, middle, K-8 and K-12 schools.
Achieve an average attendance of 96.50% for high schools.
Increase the percentage of schools that meet their attendance goals by 5% annually.
Decrease the chronic absenteeism rate by at least 2% annually.
Each year, lower the middle school dropout rate to a level below the state average.
Each year, lower the high school dropout rate to a level below the state average.
Increase the high school graduation rate to at least 90% by 2016-2017.
Each year, lower the suspension rate to a level below the state average.
Each year, lower the expulsion rate to a level below the state average.
Increase the student, parent, and staff member results of the School Culture and Climate Survey by at least 1% annually.
5b) How is the district measuring its annual progress?
As noted by the bullets in the response to 5a) immediately above, LBUSD’s LCAP covers all the required metrics for measuring progress in the state priority areas as noted in the table below. In terms of an overall observation, the metrics are concrete and appear achievable, though at times, some of them appear rather modest (“lower the suspension rate to a level below the state average”; “increase…parents…satisfaction with their opportunities to participate in school decision-making processes and programs by at least 1% annually”). The metric for measuring student, parent and staff engagement, in particular, is vague and unhelpful without knowing what specific survey results the district hopes to increase (“Increase…results of the School Culture and Climate Survey by at least 1%”).
State Priority Areas What are the metrics LCFF requires the district to use to measure progress?
* = required metric
CONDITIONS OF LEARNING
Basic Services: Degree to which…
Teachers are appropriately assigned and fully credentialed
*
Students have access to standards aligned instructional materials
*
School facilities are in good repair *
Implementation of State Standards
Implementation of Common Core State Standards (CCSS) and Next Generation Science Standards (NGSS) for all students, and English language development (ELD) standards for English learners
*
Course Access Student enrollment in a broad course of study *
STUDENT OUTCOMES
Student Achievement: Performance on standardized tests *

12
LBUSD’s LCAP SUMMARY 2015-2018 Prepared by Public Advocates for Californians for Justice
EL reclassification rate *
Share of ELs that become English proficient (CELDT scores)
*
Share of students college and career ready * for HS
Share of students that pass Advanced Placement exams with 3 or higher
* for HS
Share of students determined prepared for college by the Early Assessment Program
* for HS
Other indicators of student performance in required areas of study
Other Student Outcomes
ENGAGEMENT
Student Engagement School attendance rates *
Chronic absenteeism rates *
Middle school dropout rates *
High school dropout rates *
High school graduation rates *
Student suspension rates *
Student expulsion rates *
School Climate Student suspension rates *
Other local measures including school surveys *
Efforts to seek parent input in district and schoolsite decision making
*
Parent Involvement Promotion of parental participation in high need pupil programs
*
Promotion of parental involvement in decision-making *
LCAP Sections 2 & 3: Actions and Expenditures
3a) How much LCFF money will LBUSD receive in 2015-2016 and how much will specifically be for high-
needs students?
In 2015-2016, LBUSD will receive a total of $666,432,759 million in LCFF funding. $580,932,759 million
will be for the base grant (money generated by all students). The district is obligated to commit $85.5
million for use as supplemental/concentration grant funds (money generated by low-income, English
learners and foster youth that should be used to support these students’ needs). Last year, LBUSD
received $556.9 million in base funding and was obligated to spend $30 million in Supplemental &
Concentration funds.
77,353 students attend LBUSD, and 69.54% of these students are low-income, English learners or
foster youth.
If total number of students and the rate of high-need students remain the same, at full LCFF
implementation, LBUSD will receive $607,350,893 in base grant funding and $128,624,773 in
Supplemental & Concentration dollars when LCFF is fully funded.
The district shows 68% of its total budget in its LCAP, including most LCFF dollars.

13
LBUSD’s LCAP SUMMARY 2015-2018 Prepared by Public Advocates for Californians for Justice
Base $585,392,000 58%
Supplemental & Concentration $97,299,050
10%
Amount Not Included in LCAP
$321,652,985 32%
Total General Fund Reflected in LCAP 2015-2016

14
LBUSD’s LCAP SUMMARY 2015-2018 Prepared by Public Advocates for Californians for Justice
Does LBUSD clearly justify districtwide and schoolwide expenditures of supplemental and concentration
dollars as required by the regulations in Section 3A?
No. LBUSD justifies only the effectiveness of district-wide spending as a general matter, but it does not:
(1) separately identify each schoolwide and districtwide action paid for with supplemental and
concentration funds as required nor (2) as required, separately justify the appropriateness of each
districtwide or schoolwide use by showing how the expenditure is both “principally directed” toward
high need student goals and “effective” in meeting those goals. Without this separate identification
and justification for each schoolwide/districtwide expenditure of supplemental and concentration
funds, the district has not shown that it is permissibly spending the funds generated by high need
students on the 30% of non-high need students in LBUSD. This separate identification and justification
for each schoolwide/districtwide use is needed to overcome the presumption that these funds should
directly be spent on only the high-need students who generated them.
As noted above, LBUSD’s LCAP typically lumps several actions and their related expenditures together
in Section 2 when first explaining the actions the district will take to meet its goals. This failure is
repeated and multiplied in section 3A in that district initiatives are discussed in only very summary,
high-level terms leading to the inability of the LCAP to comply with the LCFF regulations on
supplemental/concentration spending as described in the bullet above.
By failing to separately identify the specific districtwide and schoolwide uses of supplemental and
concentration funds, one is also not able to ascertain if each given use of funds results in an “increase
or improvement” in services to high-need students. The regulations define an “increase or
$501,404,589 $580,932,760 $607,350,893
$30,000,000
$85,500,000 $128,624,773
$0
$100,000,000
$200,000,000
$300,000,000
$400,000,000
$500,000,000
$600,000,000
$700,000,000
$800,000,000
Last Year (2014-2015) This Year (2015-2016) Target LCFF Implementation
How Much Will LBUSD Receive in Base and Supplemental and Concentration Funding?
Base Supplemental and Concentration

15
LBUSD’s LCAP SUMMARY 2015-2018 Prepared by Public Advocates for Californians for Justice
improvement” in services as a “growth in quantity” or “quality” of the service. In particular, the $9
million of supplemental and concentration funds being spent to pay for higher cost teacher pension
benefits (as indicated by a May 11, 2015 district document not included in the LCAP but received from
the district) does not seem to meet this threshold requirement. The underlying services provided from
the teachers do not grow in any way. They are the same, just more costly.
The same May 11, 2015 document from the district also indicates another $5 million of “general
support to schools” for campus security, maintenance, and administration that appear to be core
programing for all students, not services particularized to serve high-need student goals in any way.
LBUSD has also identified 52 schools that are greater than 60% high-need students (LCAP pg. 107), and
it will direct more money to these 52 schools. The district explains that most high-need students are
concentrated in the same schools and make up a large percentage of these schools’ student
populations. Therefore, targeting those schools will ensure that supplemental and concentration
funding reaches high-need students.
o As a general matter, sending supplemental and concentration funds directly to school sites can
be an effective way to serve high need pupils if proper attention is paid to ensure the high-need
students are well-served by those funds at the school site.
o The district does not explain how much additional funding each of these schools will receive,
only that the total amount is $13.6 million.
o Most importantly, the district does not articulate how it will make sure those schools spend the
funds on high-need students in accordance with the LCFF regulations. The failure to identify the
amount of funds going to each school and to have a system for identifying and ensuring the
proper use of those funds will make it impossible to determine in next year’s Annual Update if
the funds sent to school sites were spent legally and effectively.
The district continues explaining its use of supplemental and concentration funds in Section 3.B (pg. 108-110).
LBUSD identifies the following three major “systemic” plans:
Common Core Instruction for English Learners (ELs)
o Oral language instruction aligned with new English Language Development (ELD) standards
o Incorporate content scaffolds for content literacy in science, history, and social studies
o Establish English Learner liaisons at all sites
o Professional development for ELD teachers
o Extended instructional time for English Learners by EL specialists
o Intervention support and small group instruction by EL specialists
o Additional counselor time for ELs not making progress
Enhance Tools to Monitor Student Success
o Analyze data on social-emotional learning, attendance, suspension, and expulsion
o Evaluate school climate survey
o Enhance academic monitoring tool for foster youth
o Train School Site Council, ELAC, and district-level committees
o Provide more info to the public

16
LBUSD’s LCAP SUMMARY 2015-2018 Prepared by Public Advocates for Californians for Justice
Partnerships to Promote College and Career Readiness
o Linked Learning in partnership with Long Beach City College and the California State University
to support career and technical education
o Funding for internships and work-based learning opportunities, focusing on health
sciences/medical technology and advanced manufacturing
o Partner with the University of Southern California to place near-peer college advisors in
underserved schools
It is difficult to determine, but it appears that these “systemic” initiatives are not principally directed to high-
need pupil goals but are general districtwide initiatives that are reaching all students. Though the district may
believe they will particularly benefit high-need pupils, these initiatives appear to be part of the district’s
general program and not appropriately counted as part of the meeting the 15.82% proportionality percentage.
This percentage is supposed to reflect the extra effort the district is making for high-need students over and
above what is provided to all pupils. As such, one is left to look to the programs described in Section 3A to
determine if LBUSD is meeting its 15.82 proportionality percentage, that it, the required amount of extra
effort on behalf of high-need students. For the reasons noted, it is not possible to tell from the district’s LCAP
if it is doing so.
It is important to note, however, that for both last year and this year LBUSD maintains it is spending more in
supplemental and concentration funds than it is required to. Last year it needed to spend $30 million and the
annual update asserts it spent over $36 million; this year, the district’s minimum supplemental and
concentration spending obligation is $85.5 million, but it has planned for over $97 million for 2015-16.
Whether all those expenditures are properly classified as supplemental and concentration spending is not
possible to determine for the reasons noted above.
Does LBUSD properly explain how supplemental and concentration dollars pushed down to school sites will be
spent according to the regulations?
No. The district will allocate $13.6 million for school-site spending, but it does not describe how the
school sites will spend the money.
Does LBUSD properly and clearly calculate the proportion by which the district must increase or improve
services for high need students above what it does for all students?
Unclear. A Public Records Act request (PRA) has been submitted to LBUSD and a final response is in
process.
What is that minimum proportionality percentage?
The district must increase or improve services for high-need students by 15.82% above the services it
provides to all students

17
LBUSD’s LCAP SUMMARY 2015-2018 Prepared by Public Advocates for Californians for Justice
3b) How will the supplemental and concentration funds be used to better support the priority areas that
local stakeholders care about?
1.1 Basic Services: Teachers (Credentialed
& Properly Assigned) $1,906,000
17%
1.2 Basic Services: Standards-aligned
instructional materials (Textbooks) $14,143,000
14% 1.3 Basic Services: School Facilities in Good
Repair 0%
2. Implementation of State Standards (CCSS &
ELD) $20,597,000 6%
3. Course Access $3,234,000
3%
4. Student Achievement $27,148,000
28%
5. Student Engagement $4,773,250
5%
6. Other Student Outcomes* $3,493,000
4%
7 School Climate:
Restorative Justice, Social
Emotional Support,and
Campus Security
$3,516,000 4%
8. Parental Involvement $911,800
1%
9. School-Site Allocation $17,577,000
18%
How is Long Beach USD Spending Its S&C Funds by Each State Priority?
Actions/Services for Restorative Justice/Student Advisory Committee
2014-2015 2015-2016
LBUSD provides targeted services – in group or
individual settings -- that relate to academic,
behavioral, social-emotional, health, psychological, and
other needs. These services include:
− Community and Ancillary Services (Recreation
Aides, etc.);
− Student Advisory resources;
− Teaching Gardens;
− Campus security/police support; and
18
LBUSD’s LCAP SUMMARY 2015-2018 Prepared by Public Advocates for Californians for Justice
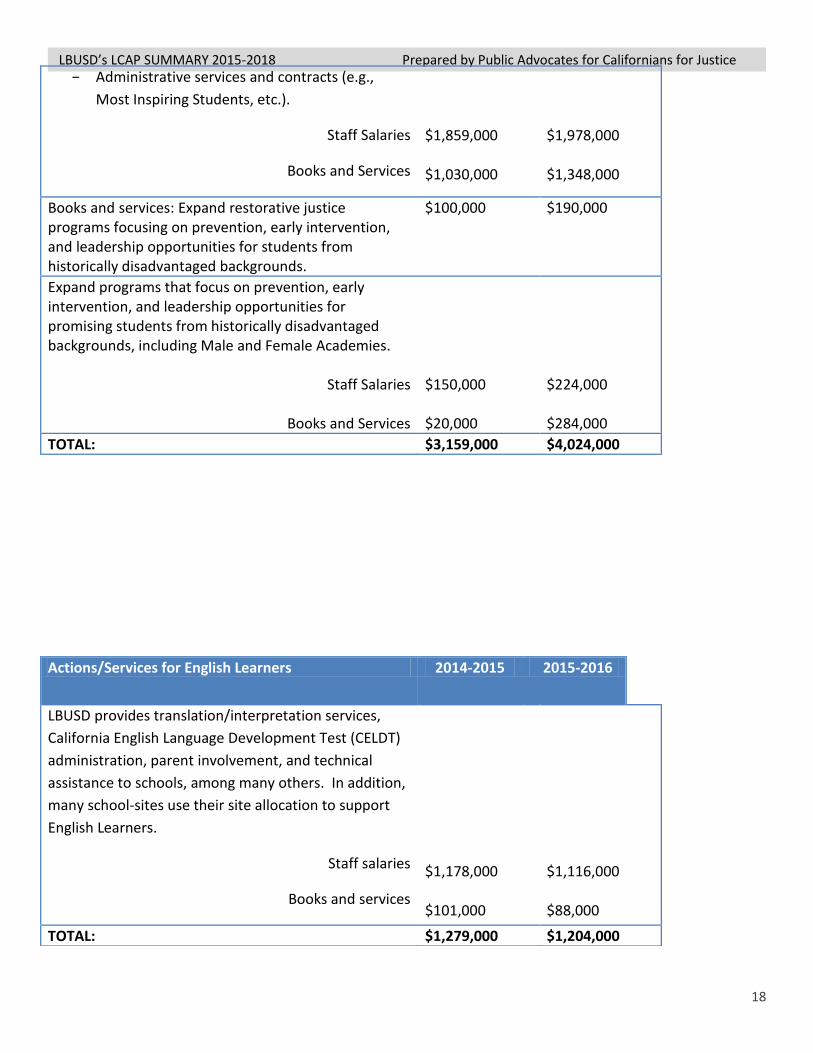
− Administrative services and contracts (e.g.,
Most Inspiring Students, etc.).
Staff Salaries
Books and Services
$1,859,000 $1,030,000
$1,978,000 $1,348,000
Books and services: Expand restorative justice programs focusing on prevention, early intervention, and leadership opportunities for students from historically disadvantaged backgrounds.
$100,000 $190,000
Expand programs that focus on prevention, early intervention, and leadership opportunities for promising students from historically disadvantaged backgrounds, including Male and Female Academies.
Staff Salaries
Books and Services
$150,000 $20,000
$224,000 $284,000
TOTAL: $3,159,000 $4,024,000
Actions/Services for English Learners 2014-2015 2015-2016
LBUSD provides translation/interpretation services,
California English Language Development Test (CELDT)
administration, parent involvement, and technical
assistance to schools, among many others. In addition,
many school-sites use their site allocation to support
English Learners.
Staff salaries
Books and services
$1,178,000 $101,000
$1,116,000 $88,000
TOTAL: $1,279,000 $1,204,000

19
LBUSD’s LCAP SUMMARY 2015-2018 Prepared by Public Advocates for Californians for Justice
Actions/Services for Foster Youth 2014-2015 2015-2016
Staff Salaries: LBUSD recently approved a policy for
foster youth:
− Ensure that placement decisions for foster
youth are based on the students’ best interests,
as defined in law and administrative regulation.
− Designate a staff person as a district liaison for
foster youth.
− Ensure that all appropriate staff members
receive training regarding the enrollment,
placement, and rights of foster youth.
− Develop strategies to build students’ feelings of
connectedness to school.
− Collaborate with local agencies to address the
needs of foster youth.
− Regularly report to the Board on the
educational outcomes of foster youth.
Staff salaries
$0
$125,000
TOTAL: $0 $125,000
Actions/Services for Parent Engagement 2014-2015 2015-2016
Provide additional parent engagement/outreach supports to schools. These services include parent involvement funds for sites to ensure equity throughout the district; traditional and electronic parent communications; and different types of Parent University assistance, most notably those that are technology-based, as suggested by stakeholders.
Staff Salaries
Books and Services
$104,000 $375,000
$80,800 $831,000
TOTAL: $479,000 $911,800

20
LBUSD’s LCAP SUMMARY 2015-2018 Prepared by Public Advocates for Californians for Justice
Actions/Services for Student Engagement 2014-2015 2015-2016
Provide additional support services to cultivate student engagement, including middle school sports.
Staff Salaries
Books and Services
$263,000 $129,000
$300,000 $120,250
Provide summer programs to extend learning in key areas, including Summer School, “bridge” programs, and orientation supports.
Staff Salaries
Books and Services
$1,448,000 $146,000
$1,558,000 $248,000
Provide targeted services, including nursing and psychological services, mentoring, and college and career awareness, to support the personal and intellectual success of each student.
Staff Salaries
Books and Services
$1,305,000 $28,000
$1,916,000 $0
TOTAL: $3,319,000 $4,142,250

21
LBUSD’s LCAP SUMMARY 2015-2018 Prepared by Public Advocates for Californians for Justice
Appendix