Summary of Data from DOE-Subsidized Field Trial #1 of ...
39
Summary of Data from DOE-Subsidized Field Trial #1 of Downhole Oil/Water Separator Technology Texaco Well Bilbrey 30-Federal No.5 Lea County, New Mexico Prepared for: U.S. Department of Energy National Petroleum Technology Office Prepared by: John A. Veil Argonne National Laboratory, under Contract W-31-109-Eng-38 May 2000
Transcript of Summary of Data from DOE-Subsidized Field Trial #1 of ...
Summary of Data from DOE-Subsidized Field Trial #1 of
Downhole Oil/Water Separator Technology
Texaco Well Bilbrey 30-Federal No.5Lea County, New Mexico
Prepared for:U.S. Department of Energy
National Petroleum Technology Office
Prepared by:John A. Veil
Argonne National Laboratory,under Contract W-31-109-Eng-38
May 2000
1
Chapter 1 - Introduction The U.S. Department of Energy’s (DOE’s) National Petroleum Technology Office (NPTO) is interested in new oil and gas technologies that can produce oil and gas at a lower cost or that can provide additional environmental protection at a reasonable cost. Several years ago, DOE became aware of a new technology for produced water management known as a downhole oil/water separator, or DOWS. A DOWS system separates oil from water at the bottom of a well and injects the water directly to a disposal zone without lifting it to the surface. DOWS technology offered three potential advantages over traditional pumping systems. First, DOWS were reported to reduce the volume of produced water brought to the surface. Second, the volume of oil produced often increased. Third, because large volumes of produced water were not being lifted to the surface past drinking water zones and subsequently reinjected downward past the same drinking water zones, there was less opportunity for contamination of those zones. DOE provided funding to Argonne National Laboratory to conduct an independent investigation of the technical feasibility, legality, and economic viability of DOWS technology. Argonne, in conjunction with two other partners (CH2M-Hill and the Nebraska Oil and Gas Conservation Commission), issued a final report in January 1999 (Veil et al. 1999). The report provides a considerable general information about DOWS, but most operators were not willing to share the detailed day-by-day operating data on their systems. To obtain more data to share with other interested operators and to better understand how DOWS work, DOE made additional funding available to Argonne to collect detailed operating data from up to six field trials of new DOWS installations. Argonne has advertised the availability of these funds for several years. This data summary report describes the first field trial conducted under this program.
2
Chapter 2 - Description of DOWS What is a DOWS and How Does It Work? DOWS technology reduces the quantity of produced water that is handled at the surface by separating it from the oil downhole and simultaneously injecting it underground. The two primary components of a DOWS system are an oil/water separation system and at least one pump to lift oil to the surface and inject the water. Two basic types of DOWS have been developed – one type using hydrocyclones to mechanically separate oil and water and one relying on gravity separation that takes place in the well bore. Hydrocyclones use centrifugal force to separate fluids of different specific gravity without any moving parts. A mixture of oil and water enters the hydrocyclone at a high velocity from the side of a conical chamber. The subsequent swirling action causes the heavier water to move to the outside of the chamber and exit through one end, while the lighter oil remains in the interior of the chamber and exits through a second opening. The water fraction is then injected, and the oil fraction is pumped to the surface. Hydrocyclone-type DOWS have been designed with electric submersible pumps, progressing cavity pumps, and rod pumps. Most of the development work on this type of DOWS was done through several joint industry projects by a Canadian organization, CFER-Technologies. Gravity separator-type DOWS are designed to allow the oil droplets that enter a well bore through the perforations to rise and form a discrete oil layer in the well. A gravity separator tool has two intakes, one in the oil layer and the other in the water layer. The gravity separator-type DOWS use rod pumps. As the sucker rods move up and down, the oil is lifted to the surface and the water is injected. The most common gravity separator-type DOWS is the dual-action pumping system (DAPS) developed by Texaco. Over the past year, Texaco developed an improved version that develops greater injection pressure, the triple-action pumping system (TAPS) (Wacker et al. 1999). A diagram of a TAPS is shown as Figure 1. The field trial described in this report is the first installation of a TAPS. The TAPS achieves greater injection pressure than the DAPS by adding a third, bottom injection plunger that has smaller surface area than the middle plunger. This small bottom plunger is connected to the middle plunger with larger surface area. The fluid column exerts pressure on the middle plunger, which in turn exerts pressure on the bottom plunger through the connecting rod. The injection pressure produced by the bottom is increased by the ratio of the surface areas of the middle and bottom plungers. As the pressure produced by the lower plunger increases, the volume of fluid that can be pumped decreases. Why Should Operators Install DOWS? The costs of lifting, treating, and disposing of produced water are important components of operating expenses. DOWS can save operators money by reducing produced water management costs. In all of the 29 DOWS installations examined by Veil et al. (1999) that had both pre- and post-installation data, DOWS reduced the volume of water brought to the surface. The percent reduction ranged from 14% to 97%, with most of those installations exceeding 75% reduction in water brought to the surface. In over half of the North American wells in which DOWS have been installed, the oil production rates increased following the installation. The percent increase in oil production rates ranged from 11% to over 1,100%, although a few wells lost oil production (Veil et al.

3
1999). In some cases where surface processing or disposal capacity is a limiting factor for further production within a field, the use of DOWS to dispose of some of the produced water may allow additional production in that field. DOWS provide a positive but unquantifiable environmental benefit through minimization of the opportunity for contamination of underground sources of drinking water through leaks in tubing and casing during the injection process. Likewise, DOWS minimize spillage of produced water onto the soil at the surface because less produced water is handled at the surface. Economic Considerations Nearly all of the DOWS installations to date have been made as retrofits to existing wells with standard pumps. Conversion of a well from a regular pump to a DOWS is a relatively expensive undertaking. Total costs include the cost of the DOWS tool itself and well workover expenses. Veil et al. (1999) provide some information on costs, but many of the operators polled by the authors did not provide any detailed cost information. Costs for the hydrocyclone-type DOWS are high. For example, the cost of an electric submersible pump-type DOWS system is approximately double to triple the cost of replacing a conventional electrical submersible pump and is often in the range of $90,000 - $250,000. In addition, the associated well workover costs can often exceed $100,000. Costs are somewhat lower for the gravity separator-type DOWS, ranging from $15,000 - $25,000. The cost of one complete gravity separator-type DOWS installation was $140,000 Canadian (Veil et al.1999). Summary Statistics on North American Installations of DOWS As of 1999, fewer than 50 DOWS had been installed in the world. Veil et al. (1999) provide information on the geology and performance of 37 of those installations. Some of the key findings are summarized below: • = More than half of the installations have been hydrocyclone-type DOWS (21 compared with
16 gravity separator-type DOWS). • = Twenty-seven installations have been in Canada and 10 have been in the United States. • = Of the 37 DOWS trials described, 27 have been in four producing areas – southeast
Saskatchewan, east-central Alberta, the central Alberta reef trends, and East Texas. • = Seventeen installations were in 5.5-inch casing, 14 were in 7-inch casing, 1 was in 8.625-
inch casing, and 5 were unspecified. • = Twenty of the DOWS installations have been in wells located in carbonate formations and
16 in wells located in sandstone formations. One trial did not specify the lithology. DOWS appeared to work better in carbonate formations, showing an average increase in oil production of 47% (compared with an average of 17% for sandstone formations) and an average decrease in water brought to the surface of 88% (compared with 78% for sandstone formations).
• = The rate of oil production increased in 19 of the trials, decreased in 12, stayed the same in
2, and was unspecified in 4. The top three performing hydrocyclone-type wells showed oil

4
production increases ranging from 457% to 1,162%, while one well lost all oil production. The top performing well improved from 13 to 164 barrels per day (bbl/d). The top three gravity separator-type wells showed oil production increases ranging from 106% to 233%, while one well lost all oil production. The top performing well in this group improved from 3 to 10 bbl/d.
• = All 29 trials for which both pre-installation and post-installation water production data were
provided showed a decrease in water brought to the surface. The decrease ranged from 14% to 97%, with 22 of 29 trials exceeding 75% reduction.
What Problems Have Been Experienced Although most of the DOWS installed to date have worked well, some of the installations have experienced problems. The problems can be broken down into several major categories, as noted below: • = Some installations were poorly chosen or designed. Some operators didn’t want to risk
damaging good performing wells with a new device and selected less than optimal candidate wells. Particularly in the earliest installations, many of the design flaws had not been worked out. Subsequent models avoided some of these flaws.
• = Some installations did not allow a suitable difference in depth between the producing and
the injection interval. If isolation between the intervals is not sufficient, the injectate can migrate into the producing zone and then short-circuit into the producing perforations. The result will be recycling of the produced water, with oil production rates dropping to nearly zero.
• = Two installations suffered from low injectivity of the receiving zone; in both cases,
incompatible fluids contacted sensitive reservoir sands, which plugged part of the permeability.
• = Several installations suffered from corrosion or scaling. This problem may be a result of
incompatible chemistry between the producing and injection formations. • = Several other installations had problems with excessive sand collection that either clogged or
eroded the DOWS.
5
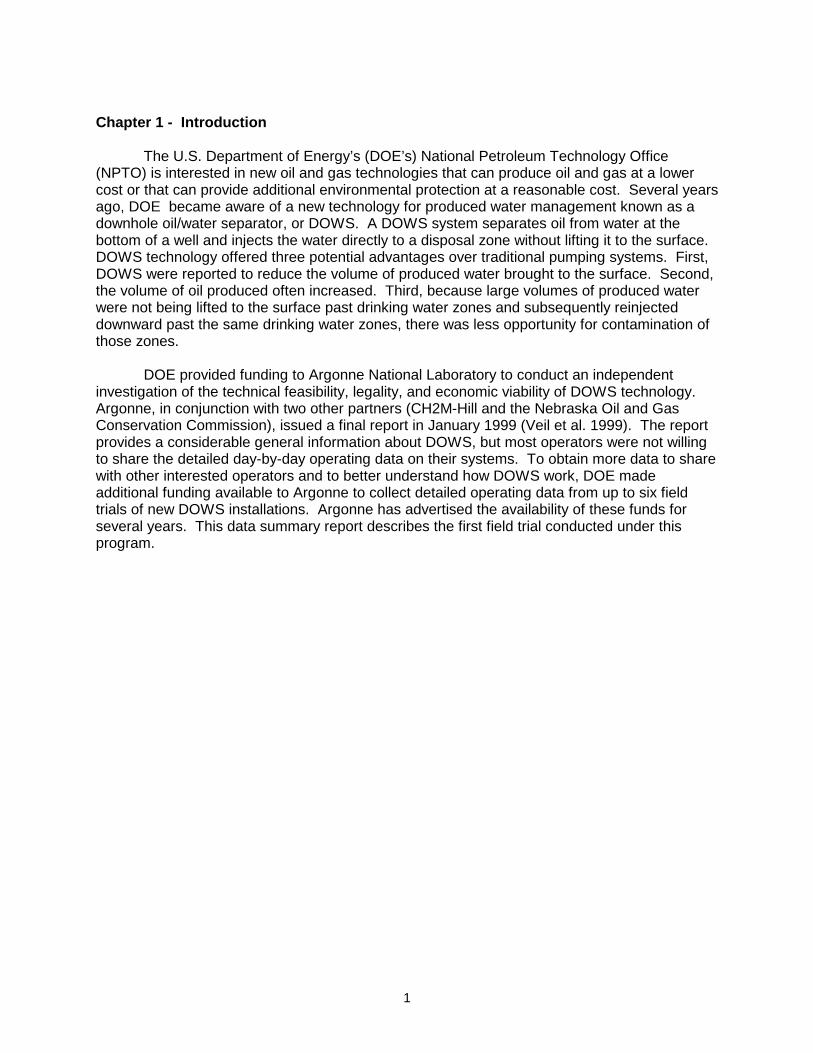
Chapter 3 - Description of Bilbrey 30-Federal No.5 Well Location The Bilbrey 30-Federal No.5 well is located in Section 30, Township 21-S, Range 32-E of Lea County, New Mexico. This location is approximately 32.5 miles west of Eunice in the southeastern corner of New Mexico. This region produces oil and gas from the Lost Tank Delaware field. The API well number is 30-025-33647. The surface elevation at the wellhead is about 3,680 feet above sea level. Well Construction Details The well was spudded on November 30, 1996, and completed on February 20, 1997. The well was plugged back at a depth of 7,250 feet. The well has three strings of casing plus tubing. The casing consists of 11-3/4 inch casing from the surface to a depth of 805 feet, 8-5/8 inch casing from the surface to a depth of 4,380 feet, and 5-1/2 inch casing from the surface to a depth of 8,850 feet. The tubing string of 2-7/8 inch diameter runs from the surface to a depth of 7,015 feet. The well was initially completed with production perforations in several formations: (1) 8,394 to 8,418 feet (Lower Brushy Canyon formation); (2) 7,314 to 7,319 feet (Brushy Canyon formation); and (3) 7,113 to 7,125 feet (Brushy Canyon formation). Production from these formations proved to be uneconomical. In April 1997, additional perforations were made at the following shallower depths: (1) 6,797 to 6,806 feet (Lower Cherry Canyon formation); (2) 6,819 to 6,822 feet (Lower Cherry Canyon formation); (3) 6,855 to 6,863 feet (Lower Cherry Canyon formation); and (4) 4,654 to 4,680 feet (Bell Canyon formation). Production from the second set of perforations also produced excessive water such that the well was not economical to produce. Texaco decided to convert this producing well into a dual completion well, by which the same well would produce oil and gas from one formation and inject most of the produced water into a second formation. Texaco selected this well for its first trial of the TAPS technology. All production perforations except those from 4,654 to 4,680 feet were plugged. New injection perforations were made at depths from 5,160 to 5,210 feet in the Bell Canyon formation. A packer was set at a depth of about 4,870 feet to isolate the production fluids from the injected fluids. The well was recompleted, and the TAPS unit was installed in January 1999. Characteristics of the Production and Injection Formations To ensure that transfer of water from the producing formation to the injection formation did not cause excessive scaling or corrosion, Texaco monitored chemical and physical properties of both formations. Tables 1 and 2 show this information. The New Mexico Oil Control Division authorizes a standardized injection pressure of 0.2 pounds per square inch (psi) per foot of depth. In the case of this well, the maximum injection pressure would be just above 1,000 psi. If an operator wants to inject at higher pressures, the Oil Control Division requires the operators to conduct a step rate injection test to determine the pressure at which the injection formation begins to fracture. Texaco conducted a step rate injection test in January 1999. The test showed that even at a pressure of more than 1,550 psi, the receiving formation did not fracture. The data from the test are shown in Table 3 and Figure 2.
6
Features of the Well That Made It a Good DOWS Candidate
Wacker et al. (1999) offer several reasons why Texaco selected the Bilbrey 30-Federal No.5 well as the candidate for the first TAPS trial. First, the well was relatively new so that the casing could withstand the high injection pressure. Second, the well had already been completed to a greater depth so that no additional drilling was necessary to reach an injection zone. Because the well had been completed to a greater depth, the rods and pumping unit were oversized compared with rods and pumps normally used at shallower depths. Third, the well had its own dedicated tanks and a pump controller. Finally, there were no other partners to convince that a trial was worthwhile.

7
Chapter 4 - Well Performance before TAPS Installation The well operated from February 1997 until December 1998 before being fitted with the TAPS unit in January 1999. As part of the contract between Argonne and Texaco to purchase DOWS operating data, production data were provided for the 6 months prior to installation of the TAPS. Table 4 contains daily measurements on oil production, water production, and gas production to the surface from July 1, 1998, to December 31, 1998. The average daily production for that period was 27 bbl/d oil, 173 bbl/d water, 200 bbl/d total produced fluids, and 2.5 thousand cubic feet/day (mcf/d) gas. This production represents an oil cut of 15.8%. Figure 3 plots the data from Table 4. Linear trend lines are drawn for the water and oil to the surface data. The volume of water brought to the surface increased steadily from about 170 bbl/d to 180 bbl/d, while the volume of oil brought to the surface decreased steadily from about 40 bbl/d to 20 bbl/d during the 6-month period. Neither trend is desirable for sustained economical performance of the well. These trends mirror those that occur naturally throughout the life of most wells. However, the rate of oil decline and water increase are generally much slower than the rates demonstrated in this well. Gas production fluctuated within a narrow range (1-5 mcf/d). Gas production was reported to only one significant figure, thereby making it difficult to see daily variation.
8
Chapter 5 - Well Performance Following TAPS Installation The TAPS unit was placed into service on January 19, 1999. Texaco provided daily information on oil, water, and gas brought to the surface; the amount of water injected; the amount of water returned to the wellbore; and the net water at the surface through August 30, 1999. Texaco also provided a few daily injection pressure measurements. Table 5 contains these data. Oil and Water Production
Long-Term Average Performance: Texaco management allowed installation of the TAPS with a plan of working up to maximum capacity over a period of time rather than immediately moving to full capacity (Wacker et al. 1999). The long-term performance of the well for Case 1 (all days beginning with TAPS installation through August 30) and Case 2 (all days excluding those in which both oil and water production to the surface is zero [assumes that the TAPS was not operating on those days]) is as follows: - The average oil production was 6.7 bbl/d (Case 1) and 7.3 bbl/d (Case 2). - The average water production to the surface was 77 bbl/d (Case 1) and 84 bbl/d (Case 2). - The average injected water volume was 84 bbl/d (Case 1) and 91 bbl/d (Case 2). - The average net water to the surface (water produced to the surface minus the water injected or reintroduced to the well) was 42 bbl/d (Case 1) and 45 bbl/d (Case 2). Oil Production: The oil production, water production, and net water production data are plotted in Figure 4. Oil production declined from 17 bbl/d before TAPS installation to 7 bbl/d (59% decrease) during the trial. Some of the oil decline is a result of Texaco’s decision to operate the pumps at moderate levels to gain familiarity with the new TAPS. The oil produced to the surface, the overall oil cut (the proportion of oil in the total fluid volume), and the oil cut of the surface-produced fluids are plotted in Figure 5. The daily volume of oil produced to the surface was erratic. For the first 3 months of the trial, the daily oil production declined from an average of about 15bbl/d to an average of about 7 bbl/d. Following nearly a month of no oil production, the TAPS performed better for 2 months, producing an average of nearly 10 bbl/d. However, for the last month of the data records in this trial, the oil production declined to an average of about 5 bbl/day.
The two oil cut values followed a similar trend. The overall oil cut was fairly high for the first three months of the trial (5.5% average) but dropped for the last 3 months of the trial to 2.9% average. Likewise the oil cut of the surface-produced fluids dropped from 14.2% average to 6.6% average during the same period. Water Production: The water produced to the surface remained relatively constant throughout most of the trial (about 70 bbl/d average) except during June, when it increased significantly. Net water production to the surface declined from 190 bbl/d before TAPS installation to 42 bbl/d (78% decrease) during the trial. During some periods, particularly from January to mid-February, part of March, and most of June, the volume of water brought to the surface was the same as the net water volume at the surface, indicating that no water was

9
returned to the well on those days. The TAPS was taken out of service for repairs during several periods. These problems are discussed in the next chapter. From mid-February to mid-March, during April and May, and during July and August, however, little or no produced water had to be trucked away from this well because all water was either injected by the TAPS or reintroduced to the well annulus. On some days, the well experienced a net loss of water at the surface as more water was reintroduced from the aboveground water storage tanks than was produced to the surface. The ability to operate without having to haul water offsite is a significant accomplishment. The approach used to achieve zero discharge can be transferred to other wells.
Total Fluid Production: The total fluids produced by the well fluctuated significantly as shown in Figure 6. For the first 3 months of the trial, the average was similar to that of the pre-installation period (about 200 bbl/d). During May, total fluid production rose to an average of about 270 bbl/d, then declined during June to about 200 bbl/d. During the last 2 months of the trial, the total fluid production averaged about 240 bbl/d. Pump Data Texaco provided extensive data on the pumping system. The data from March 2 to August 31 are presented in Table 6. Key features of those data are given below. Pump Load: The daily high pump load ranged from 13,417 to 19,773 pounds. The daily low pump load ranged from 7,261 to 10,069 pounds. The daily high pump load gradually increased over time, while the daily low pump load remained relatively constant. Run Time: On most of the days on which the pump ran at all, it ran for more than 20 hours. On many days, the pump ran for all 24 hours. Load on Standing Valve Check: This test was performed to see if the standing valve was leaking. The load was measured intermittently and varied from 10,100 to 11,829 pounds. All values recorded after June 7 were greater than or equal to 11,382 pounds, whereas all values recorded before that date were lower than or equal to 11,350 pounds. Estimated Injection Pump Volume: From March through April, the injection pump ran between 41% and 63% of its volume. From May through the end of the trial, the injection pump volume was increased to 70% to 75%. Fluid Level Above Pump: The height of fluid accumulated above the pump gives an indication of the pump’s ability to keep up with the volume of fluid entering the well from the formation. The data for the first several months of the trial show that a large amount of fluids accumulated above the pump, suggesting that the pump was not able to pump the full volume of fluids entering the well. The values ranged from 815 to 2,781 feet. Unfortunately, this parameter was not measured consistently during the later months of the trial. The only reported measurement after June 7 was made on August 10. It shows that only 4 feet of fluid had accumulated above the pump, indicating that the pump’s output was nearly equal to the volume of fluids entering the well.

10
Calculated Formation and Surface Pressures: The calculated formation pressure ranged from 2,232 to 1,465 psi. The surface pressure ranged from -295 to - 1,062 psi. Both sets of pressures declined throughout the trial. Pump Intake Pressure: Pump intake pressure data were available only from March to early June. The pressure ranged from 315 to 864 psi. The data follow no obvious trend.

11
Chapter 6 - Discussion Wacker et al. (1999) offer a good discussion of the TAPS trial by the persons who actually did the field work on the trial. Key findings of that article and other observations by the author are described in this chapter. TAPS Technology Texaco had previous experience with a similar gravity separator-type of DOWS, the DAPS, but was concerned that the DAPS could not produce sufficient injection pressure to inject water into tight formations. By adding a third stage to the pumping system, the TAPS solved that problem. The TAPS was able to inject successfully during this trial. Wacker et al. (1999) note that balancing the size of the three pumps in the TAPS is critical to making the system work as planned. Produced Water Management The cost of trucking produced water away from the well for disposal was prohibitive for cost-effective well operation. Even a well-operated DAPS or TAPS produces about one quarter of the water to the surface. Texaco wanted to find a method to dispose of the water produced to the surface downhole to avoid trucking costs. Texaco decided to remove produced water from the surface production tanks and let it siphon down the well annulus. That approach proved successful. On many days, no net produced water accumulated at the surface. On some days, more water than was produced that day was siphoned down the annulus, for a net negative water production. By lengthening the stroke of the pumping unit, Texaco was able to inject the extra volume of produced water reintroduced into the well by the siphon tube. In previous applications, corrosion proved to be a problem. Wacker et al. (1999) report that to control corrosion, Texaco continuously added an oil-dispersible, water-soluble chemical to the water stream going through the siphon tube. This solution provided satisfactory performance. Operational Problems Wacker et al. (1999) report that on two occasions, oil production dropped to zero. Following the first incident, the TAPS unit was removed from the well and inspected. The system had indications of sucker rod wear, and the lower valve assembly had split. The sucker rods (the metal rods leading from the surface pump jack to the DOWS unit) are normally sized to account for stress in the upward direction (elongation). A DOWS unit also applies stress in the downward direction during the injection phase. To avoid buckling of the rods and inducing premature rod failure, Texaco added sinker bars (weights to counteract the buckling stress). The valve assembly was replaced and the TAPS was reinstalled. The system worked satisfactorily for several weeks, but then failed again. Upon inspecting the pump, Texaco noted that the valve assembly had split in the same location. This time, the operator added a stronger valve assembly, and reinstalled the TAPS. It worked fine for the remainder of the trial. A second problem was caused by trapped gas within the injection pump system. Initially, trapped gas prevented the pump from completing its full range of motion. Although Wacker et al.

12
(1999) report that Texaco solved that problem by modifying the TAPS, they provide no description of the actual steps or actions that were followed. Spread of DOWS Technology DOWS technology was introduced to the industry in the early 1990s. Most of the early work was done by individual companies or a consortium of companies that elected not to share the resulting data with groups outside of the consortium. DOE anticipated that there would be great interest in DOWS technology and funded the feasibility evaluation study (Veil et al. 1999). DOE sponsored several workshops on DOWS and encouraged Argonne to make presentations at technical conferences and publish papers on DOWS to transfer the technology to many more potential users. DOE further provided funding to partially pay for up to six field trials of DOWS technology to obtain detailed operating data. The timing of the release of Veil et al. (1999) and the availability of cost-sharing funds for the field trials could not have come at a more inopportune time. In early 1999, the oil and gas industry faced it lowest oil prices in decades. Many independent operators, a prime target audience for DOWS, shut in wells or went out of business. They were not inclined to spend their limited capital on new, somewhat experimental technology. Worldwide DOWS sales were virtually nonexistent for most of 1999. As oil prices have risen in 2000, companies are still somewhat reluctant to expend capital on technologies such as DOWS. The data presented in this report come from the first and, to date, the only DOE-sponsored field trial. Although DOWS technology appears to be sound, it has not yet caught on widely in the oil patch.
13
Chapter 7 – Conclusions
This field trial, with over 8 months of operating history, demonstrated that Texaco’s TAPS operated successfully to reduce the amount of produced water lifted to the surface. The addition of a third pumping stage allowed injection of produced water into a tight formation. The ability to inject at high pressures enhances the potential for DOWS to be used in water flooding situations. By using a separate siphon tube for disposal of the remaining volume of water lifted to the surface, the operators were able to eliminate the need to haul produced water offsite.
The oil production following TAPS installation was not as great as before TAPS
installation and decreased during the period of the trial. To some extent, the reduction in performance was a function of the Texaco engineers’ choice of pumping rates as they experimented with the new TAPS tool.
The TAPS experienced several problems that were subsequently corrected. The design
has applicability for other installations, but due to market considerations, has not yet been tried again.
14
Acknowledgments Argonne National Laboratory wishes to thank DOE’s NPTO for providing the funding for the DOWS feasibility study and the field trial program. Nancy Comstock is the project officer at the NPTO. Argonne also acknowledges the support from Texaco, particularly Lon Stuebinger and Jason Wacker. These individuals provided extensive information that aided the author’s understanding of the TAPS system. Bruce Langhus of Arthur Langhus Layne, LLC – one of the co-authors of the DOWS feasibility study – and Howard McKinzie – a consultant who previously worked for Texaco in their DOWS-development program – both reviewed this report and offered useful suggestions. References Veil, J.A., B.G. Langhus, and S. Belieu, 1999, “Feasibility Evaluation of Downhole Oil/Water Separation (DOWS) Technology,” prepared for U.S. Department of Energy, Office of Fossil Energy, National Petroleum Technology Office, by Argonne National Laboratory, CH2M-Hill, and Nebraska Oil and Gas Conservation Commission, January. Wacker, H.J., R.M. Parker, L. Stuebinger, R. Harding, and B. Watson, 1999, “Test Proves Out Triple-Action Pump in Downhole Separation,” Oil and Gas Journal, October 4, pp. 49-55.

15
Table 1 - Water Analysis of Producing and Injection Formations
Parameter Producing Formation Injection Formation
Specific gravity 1.131 1.094
Total dissolved solids (mg/L) 183,977 131,033
pH 5.75 4.82
Ionic strength 3.557 2.615
Calcium (mg/L) 10,400 9,116
Magnesium (mg/L) 1,944 2,107
Sodium (mg/L) 57,856 38,299
Iron (mg/L) 7.38 78
Barium (mg/L) no value reported 23.93
Strontium (mg/L) no value reported 502
Manganese (mg/L) 2.72 14.03
Bicarbonate (mg/L) 37 61
Hydroxide (mg/L) 0 0
Sulfate (mg/L) 1,750 450
Chloride (mg/L) 112,000 81,000
Carbon dioxide gas (ppm) 185 20
Hydrogen sulfide gas (ppm) 0 0
Table 2 - Scale Index (Note: Positive values indicate a tendency for scale formation)
Temperature (bC)
Producing Formation CaCO3
Index
Producing Formation CaSO4
Index
Injection Formation CaCO3
Index
Injection Formation CaSO4
Index 30 -0.79 12.74 -1.91 -16.23
40 -0.53 12.74 -1.70 -16.23
50 -0.22 12.78 -1.42 -15.76
60 0.14 12.70 -1.13 -15.43
70 0.53 12.67 -0.80 -15.35
80 0.96 12.52 -0.42 -15.52
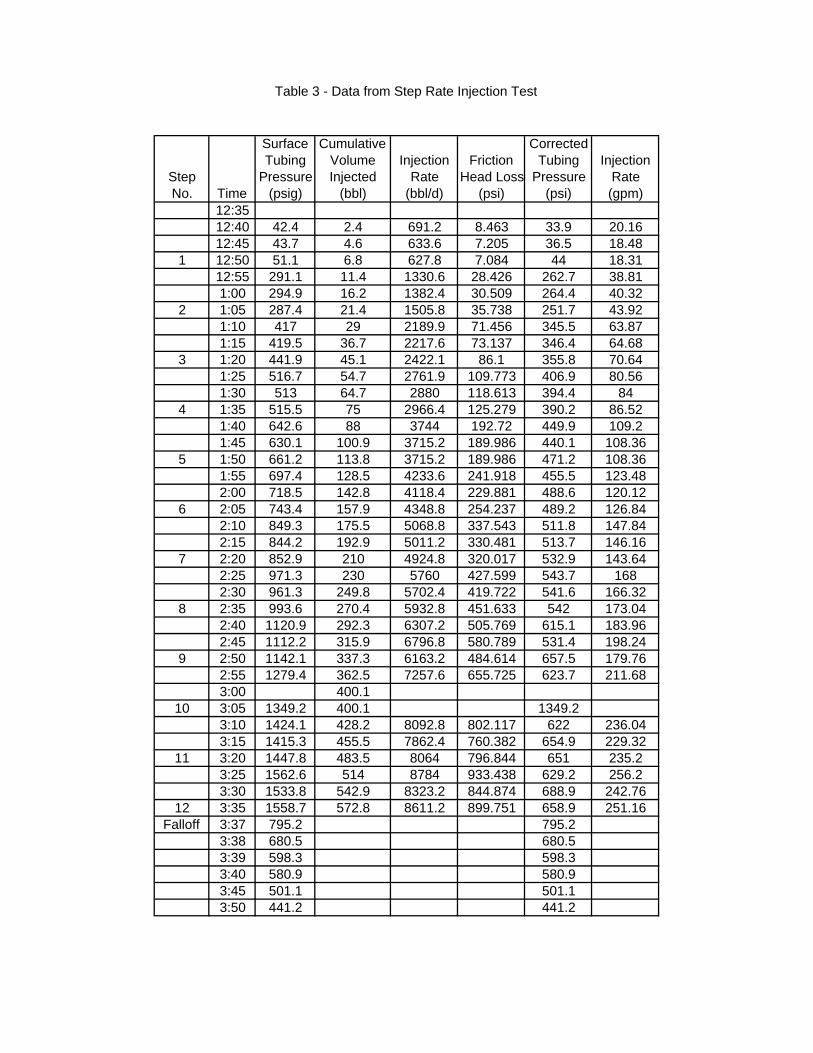
Table 3 - Data from Step Rate Injection Test
Step No. Time
Surface Tubing
Pressure (psig)
Cumulative Volume Injected
(bbl)
Injection Rate
(bbl/d)
Friction Head Loss
(psi)
Corrected Tubing
Pressure (psi)
Injection Rate (gpm)
12:3512:40 42.4 2.4 691.2 8.463 33.9 20.1612:45 43.7 4.6 633.6 7.205 36.5 18.48
1 12:50 51.1 6.8 627.8 7.084 44 18.3112:55 291.1 11.4 1330.6 28.426 262.7 38.811:00 294.9 16.2 1382.4 30.509 264.4 40.32
2 1:05 287.4 21.4 1505.8 35.738 251.7 43.921:10 417 29 2189.9 71.456 345.5 63.871:15 419.5 36.7 2217.6 73.137 346.4 64.68
3 1:20 441.9 45.1 2422.1 86.1 355.8 70.641:25 516.7 54.7 2761.9 109.773 406.9 80.561:30 513 64.7 2880 118.613 394.4 84
4 1:35 515.5 75 2966.4 125.279 390.2 86.521:40 642.6 88 3744 192.72 449.9 109.21:45 630.1 100.9 3715.2 189.986 440.1 108.36
5 1:50 661.2 113.8 3715.2 189.986 471.2 108.361:55 697.4 128.5 4233.6 241.918 455.5 123.482:00 718.5 142.8 4118.4 229.881 488.6 120.12
6 2:05 743.4 157.9 4348.8 254.237 489.2 126.842:10 849.3 175.5 5068.8 337.543 511.8 147.842:15 844.2 192.9 5011.2 330.481 513.7 146.16
7 2:20 852.9 210 4924.8 320.017 532.9 143.642:25 971.3 230 5760 427.599 543.7 1682:30 961.3 249.8 5702.4 419.722 541.6 166.32
8 2:35 993.6 270.4 5932.8 451.633 542 173.042:40 1120.9 292.3 6307.2 505.769 615.1 183.962:45 1112.2 315.9 6796.8 580.789 531.4 198.24
9 2:50 1142.1 337.3 6163.2 484.614 657.5 179.762:55 1279.4 362.5 7257.6 655.725 623.7 211.683:00 400.1
10 3:05 1349.2 400.1 1349.23:10 1424.1 428.2 8092.8 802.117 622 236.043:15 1415.3 455.5 7862.4 760.382 654.9 229.32
11 3:20 1447.8 483.5 8064 796.844 651 235.23:25 1562.6 514 8784 933.438 629.2 256.23:30 1533.8 542.9 8323.2 844.874 688.9 242.76
12 3:35 1558.7 572.8 8611.2 899.751 658.9 251.16Falloff 3:37 795.2 795.2
3:38 680.5 680.53:39 598.3 598.33:40 580.9 580.93:45 501.1 501.13:50 441.2 441.2

Table 4 - Well Performance Data Before TAPS Installation
Date Oil to Surface (bbl) Water to Surface (bbl) Gas to Surface (mcf)Total Fluids
Produced (bbl)7/1/98 37 140 4 1777/2/98 40 170 3 2107/3/98 37 170 3 2077/4/98 40 170 3 2107/5/98 37 170 3 2077/6/98 40 180 3 2207/7/98 33 140 3 1737/8/98 0 50 1 507/9/98 0 0 0 0
7/10/98 0 0 0 07/11/98 37 220 2 2577/12/98 47 250 5 2977/13/98 43 250 5 2937/14/98 47 230 4 2777/15/98 37 190 4 2277/16/98 43 220 4 2637/17/98 40 200 4 2407/18/98 43 180 3 2237/19/98 40 200 4 2407/20/98 37 180 4 2177/21/98 43 200 4 2437/22/98 6 0 2 67/23/98 53 190 2 2437/24/98 40 220 4 2607/25/98 40 210 3 2507/26/98 36 200 3 2367/27/98 40 190 3 2307/28/98 40 190 3 2307/29/98 30 180 3 2107/30/98 40 180 3 2207/31/98 30 170 3 2008/1/98 24 180 3 2048/2/98 40 200 3 2408/3/98 40 180 3 2208/4/98 30 160 3 1908/5/98 37 200 3 2378/6/98 40 170 3 2108/7/98 37 180 3 2178/8/98 33 190 3 2238/9/98 33 130 3 163
8/10/98 37 240 2 2778/11/98 33 152 3 1858/12/98 27 170 3 1978/13/98 40 204 3 2448/14/98 27 170 3 1978/15/98 33 170 3 2038/16/98 33 190 3 2238/17/98 33 180 3 2138/18/98 30 170 3 200
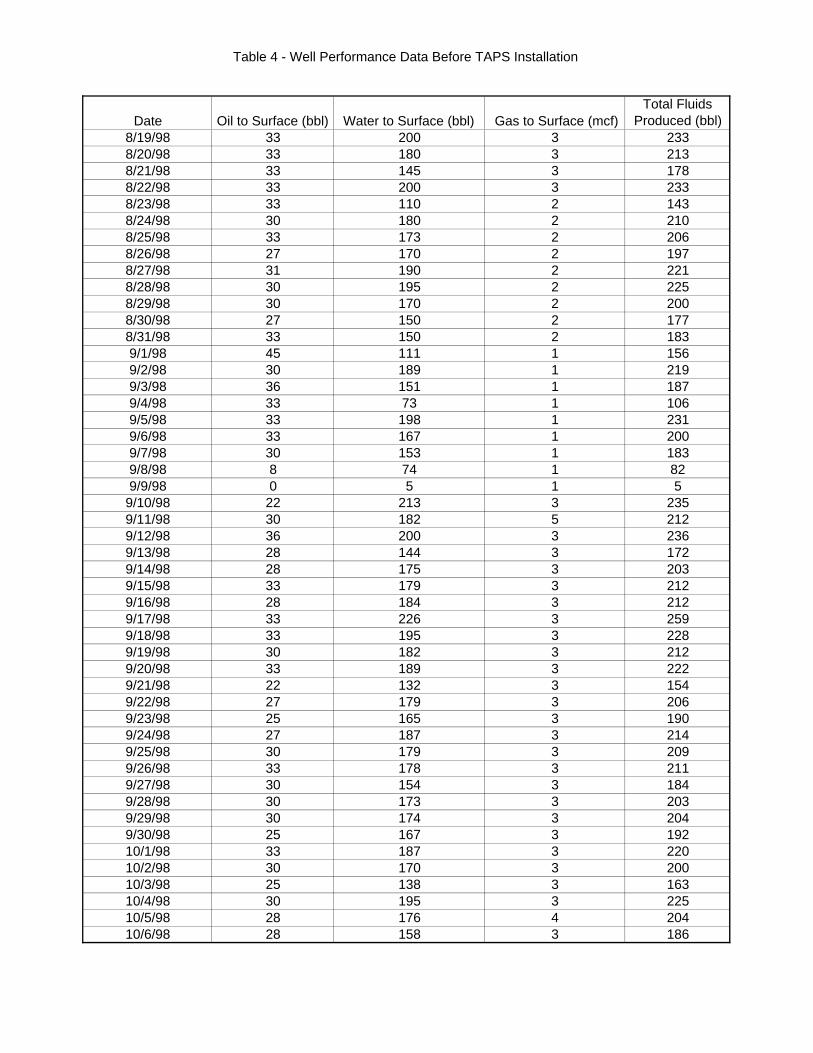
Table 4 - Well Performance Data Before TAPS Installation
Date Oil to Surface (bbl) Water to Surface (bbl) Gas to Surface (mcf)Total Fluids
Produced (bbl)8/19/98 33 200 3 2338/20/98 33 180 3 2138/21/98 33 145 3 1788/22/98 33 200 3 2338/23/98 33 110 2 1438/24/98 30 180 2 2108/25/98 33 173 2 2068/26/98 27 170 2 1978/27/98 31 190 2 2218/28/98 30 195 2 2258/29/98 30 170 2 2008/30/98 27 150 2 1778/31/98 33 150 2 1839/1/98 45 111 1 1569/2/98 30 189 1 2199/3/98 36 151 1 1879/4/98 33 73 1 1069/5/98 33 198 1 2319/6/98 33 167 1 2009/7/98 30 153 1 1839/8/98 8 74 1 829/9/98 0 5 1 5
9/10/98 22 213 3 2359/11/98 30 182 5 2129/12/98 36 200 3 2369/13/98 28 144 3 1729/14/98 28 175 3 2039/15/98 33 179 3 2129/16/98 28 184 3 2129/17/98 33 226 3 2599/18/98 33 195 3 2289/19/98 30 182 3 2129/20/98 33 189 3 2229/21/98 22 132 3 1549/22/98 27 179 3 2069/23/98 25 165 3 1909/24/98 27 187 3 2149/25/98 30 179 3 2099/26/98 33 178 3 2119/27/98 30 154 3 1849/28/98 30 173 3 2039/29/98 30 174 3 2049/30/98 25 167 3 19210/1/98 33 187 3 22010/2/98 30 170 3 20010/3/98 25 138 3 16310/4/98 30 195 3 22510/5/98 28 176 4 20410/6/98 28 158 3 186

Table 4 - Well Performance Data Before TAPS Installation
Date Oil to Surface (bbl) Water to Surface (bbl) Gas to Surface (mcf)Total Fluids
Produced (bbl)10/7/98 22 157 3 17910/8/98 28 186 3 21410/9/98 30 176 3 20610/10/98 28 179 3 20710/11/98 28 165 3 19310/12/98 28 184 3 21210/13/98 25 163 3 18810/14/98 25 158 3 18310/15/98 30 146 3 17610/16/98 25 196 3 22110/17/98 28 183 3 21110/18/98 28 175 2 20310/19/98 25 176 2 20110/20/98 22 178 2 20010/21/98 14 156 2 17010/22/98 28 194 2 22210/23/98 28 185 2 21310/24/98 25 193 2 21810/25/98 25 175 2 20010/26/98 28 201 2 22910/27/98 22 165 2 18710/28/98 25 160 2 18510/29/98 28 193 3 22110/30/98 22 167 2 18910/31/98 25 186 3 21111/1/98 22 180 2 20211/2/98 28 210 2 23811/3/98 22 152 2 17411/4/98 22 228 2 25011/5/98 27 212 2 23911/6/98 30 149 2 17911/7/98 27 187 1 21411/8/98 22 241 3 26311/9/98 25 186 2 21111/10/98 22 174 2 19611/11/98 22 135 2 15711/12/98 25 201 2 22611/13/98 19 154 2 17311/14/98 22 173 2 19511/15/98 25 203 3 22811/16/98 22 173 3 19511/17/98 22 158 2 18011/18/98 22 138 2 16011/19/98 22 247 2 26911/20/98 22 158 2 18011/21/98 22 166 2 18811/22/98 28 183 2 21111/23/98 19 194 2 21311/24/98 19 275 2 294
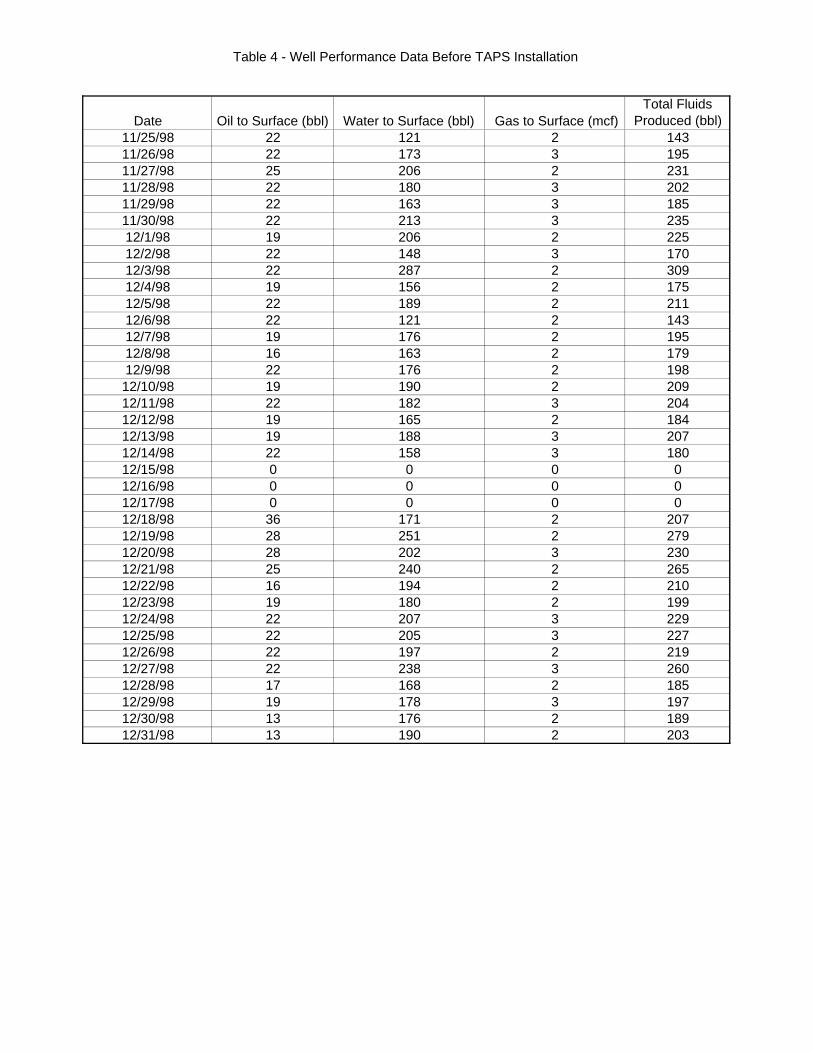
Table 4 - Well Performance Data Before TAPS Installation
Date Oil to Surface (bbl) Water to Surface (bbl) Gas to Surface (mcf)Total Fluids
Produced (bbl)11/25/98 22 121 2 14311/26/98 22 173 3 19511/27/98 25 206 2 23111/28/98 22 180 3 20211/29/98 22 163 3 18511/30/98 22 213 3 23512/1/98 19 206 2 22512/2/98 22 148 3 17012/3/98 22 287 2 30912/4/98 19 156 2 17512/5/98 22 189 2 21112/6/98 22 121 2 14312/7/98 19 176 2 19512/8/98 16 163 2 17912/9/98 22 176 2 19812/10/98 19 190 2 20912/11/98 22 182 3 20412/12/98 19 165 2 18412/13/98 19 188 3 20712/14/98 22 158 3 18012/15/98 0 0 0 012/16/98 0 0 0 012/17/98 0 0 0 012/18/98 36 171 2 20712/19/98 28 251 2 27912/20/98 28 202 3 23012/21/98 25 240 2 26512/22/98 16 194 2 21012/23/98 19 180 2 19912/24/98 22 207 3 22912/25/98 22 205 3 22712/26/98 22 197 2 21912/27/98 22 238 3 26012/28/98 17 168 2 18512/29/98 19 178 3 19712/30/98 13 176 2 18912/31/98 13 190 2 203

Table 5 - Well Performance Data Following TAPS Installation
Date
Oil to Surface
(bbl)Overall Oil
Cut (%)
Oil Cut of Fluids to Surface
(%)
Water to Surface
(bbl)
Injected Water -
Calculated (bbl)
Water Returned to
Wellbore (bbl)
Net Water at Surface
(bbl)
Total Water Produced
(bbl)
Total Fluids Produced
(bbl)
Gas to Surface
(mcf)
Injection Pressure
(psig)1/20/1999 3 1.7 5.2 55 116 55 171 174 01/21/1999 3 1.9 4.7 61 98 61 159 162 01/22/1999 0 0.0 0.0 63 113 63 176 176 01/23/1999 0 0.0 0.0 58 97 58 155 155 01/24/1999 0 0.0 0.0 52 93 52 145 145 01/25/1999 0 0.0 0.0 58 98 58 156 156 01/26/1999 0 0.0 0.0 56 96 56 152 152 01/27/1999 0 0.0 0.0 56 95 56 151 151 01/28/1999 0 0.0 0.0 53 85 53 138 138 01/29/1999 0 0.0 0.0 55 95 55 150 150 01/30/1999 6 4.5 18.2 27 100 27 127 133 01/31/1999 8 6.0 21.1 30 95 30 125 133 02/1/1999 11 7.2 19.0 47 95 47 142 153 02/2/1999 33 18.9 41.3 47 95 47 142 175 02/3/1999 11 8.0 26.2 31 96 31 127 138 02/4/1999 11 7.7 21.2 41 90 41 131 142 02/5/1999 14 9.5 28.0 36 97 36 133 147 02/6/1999 8 5.8 19.5 33 96 33 129 137 02/7/1999 11 19.0 19.0 47 47 47 58 02/8/1999 11 7.5 21.2 41 94 41 135 146 02/9/1999 11 5.2 22.0 39 163 39 202 213 0
2/10/1999 14 6.7 21.2 52 143 52 195 209 02/11/1999 19 9.3 29.2 46 139 46 185 204 02/12/1999 14 6.7 18.2 63 131 63 194 208 02/13/1999 14 16.7 16.7 70 70 70 84 02/14/1999 14 7.6 21.9 50 120 50 170 184 02/15/1999 17 8.7 22.7 58 120 58 178 195 02/16/1999 17 9.0 24.6 52 120 52 172 189 02/17/1999 14 7.6 21.9 50 120 50 170 184 02/18/1999 17 8.6 21.8 61 120 61 181 198 02/19/1999 14 7.7 23.0 47 120 47 167 181 02/20/1999 14 7.3 19.4 58 120 58 178 192 02/21/1999 11 5.7 15.1 62 120 62 182 193 02/22/1999 6 2.9 16.2 31 167 31 198 204 02/23/1999 6 3.0 16.7 30 167 30 197 203 02/24/1999 8 3.3 11.1 64 167 64 231 239 02/25/1999 11 4.5 14.5 65 167 65 232 243 02/26/1999 11 4.5 14.5 65 167 65 232 243 02/27/1999 11 4.5 13.9 68 167 68 235 246 02/28/1999 8 3.4 11.3 63 167 63 230 238 03/1/1999 8 3.8 17.4 38 167 38 205 213 03/2/1999 11 5.0 15.1 62 147 70 -8 209 220 0 NA3/3/1999 11 4.9 13.4 71 142 70 1 213 224 0 NA

Table 5 - Well Performance Data Following TAPS Installation
Date
Oil to Surface
(bbl)Overall Oil
Cut (%)
Oil Cut of Fluids to Surface
(%)
Water to Surface
(bbl)
Injected Water -
Calculated (bbl)
Water Returned to
Wellbore (bbl)
Net Water at Surface
(bbl)
Total Water Produced
(bbl)
Total Fluids Produced
(bbl)
Gas to Surface
(mcf)
Injection Pressure
(psig)3/4/1999 8 3.8 11.8 60 140 70 -10 200 208 0 NA3/5/1999 14 6.1 16.3 72 142 70 2 214 228 0 NA3/6/1999 11 5.0 14.5 65 142 70 -5 207 218 0 NA3/7/1999 11 5.3 14.5 65 132 70 -5 197 208 0 NA3/8/1999 8 3.9 10.8 66 133 70 -4 199 207 0 NA3/9/1999 8 4.1 12.5 56 133 70 -14 189 197 0 -474
3/10/1999 11 5.2 14.1 67 135 70 -3 202 213 0 NA3/11/1999 14 6.3 16.3 72 135 72 0 207 221 0 NA3/12/1999 11 3.5 13.3 72 231 64 8 303 314 0 NA3/13/1999 6 2.1 9.4 58 225 52 6 283 289 0 NA3/14/1999 11 5.3 15.5 60 135 54 6 195 206 0 NA3/15/1999 14 5.9 17.1 68 155 65 3 223 237 0 NA3/16/1999 11 6.5 20.4 43 115 54 -11 158 169 0 -5673/17/1999 5 2.6 6.7 70 119 64 6 189 194 0 NA3/18/1999 6 2.8 7.4 75 135 67 8 210 216 0 NA3/19/1999 6 2.9 8.7 63 135 60 3 198 204 0 -7783/20/1999 5 2.3 6.2 76 135 73 3 211 216 0 NA3/21/1999 8 3.8 10.4 69 135 69 0 204 212 0 NA3/22/1999 11 5.1 13.9 68 135 71 -3 203 214 0 -6183/23/1999 3 1.5 4.2 68 131 71 -3 199 202 0 -2953/24/1999 6 2.9 8.1 68 135 63 5 203 209 0 NA3/25/1999 8 5.0 11.6 61 90 64 -3 151 159 0 NA3/26/1999 6 2.9 8.1 68 135 62 6 203 209 0 NA3/27/1999 6 2.8 7.7 72 135 72 0 207 213 0 NA3/28/1999 3 1.4 4.2 69 135 69 0 204 207 0 NA3/29/1999 5 2.3 6.2 76 135 73 3 211 216 0 NA3/30/1999 6 2.8 7.8 71 135 71 0 206 212 0 NA3/31/1999 6 2.7 7.1 78 135 78 0 213 219 0 NA4/1/1999 8 3.8 10.3 70 135 67 3 205 213 0 -3844/2/1999 0 0.0 0.0 63 120 0 63 183 183 1 NA4/3/1999 11 5.5 14.3 66 123 0 66 189 200 1 NA4/4/1999 14 7.5 21.9 50 123 0 50 173 187 1 -7964/5/1999 11 5.9 17.2 53 123 0 53 176 187 1 -6514/6/1999 11 5.9 16.7 55 120 0 55 175 186 1 NA4/7/1999 6 3.2 8.7 63 118 0 63 181 187 1 NA4/8/1999 8 4.4 11.8 60 115 0 60 175 183 0 NA4/9/1999 8 4.1 10.0 72 115 0 72 187 195 0 NA
4/10/1999 8 4.5 12.1 58 113 0 58 171 179 0 NA4/11/1999 6 3.2 8.3 66 113 0 66 179 185 0 NA4/12/1999 8 4.3 10.8 66 111 0 66 177 185 0 -6094/13/1999 6 3.3 8.3 66 111 0 66 177 183 0 NA4/14/1999 6 3.1 7.2 77 108 0 77 185 191 0 NA4/15/1999 6 3.3 8.3 66 108 0 66 174 180 0 NA

Table 5 - Well Performance Data Following TAPS Installation
Date
Oil to Surface
(bbl)Overall Oil
Cut (%)
Oil Cut of Fluids to Surface
(%)
Water to Surface
(bbl)
Injected Water -
Calculated (bbl)
Water Returned to
Wellbore (bbl)
Net Water at Surface
(bbl)
Total Water Produced
(bbl)
Total Fluids Produced
(bbl)
Gas to Surface
(mcf)
Injection Pressure
(psig)4/16/1999 6 3.2 7.5 74 106 0 74 180 186 0 NA4/17/1999 3 1.7 4.0 72 106 0 72 178 181 0 NA4/18/1999 3 1.7 4.0 72 106 0 72 178 181 0 NA4/19/1999 6 3.3 7.7 72 106 0 72 178 184 0 -7754/20/1999 3 1.7 4.2 69 101 0 69 170 173 0 NA4/21/1999 22 25.9 25.9 63 0 74 -11 63 85 1 NA4/22/1999 3 3.2 3.2 91 0 80 11 91 94 0 NA4/23/1999 8 8.6 8.6 85 0 82 3 85 93 0 NA4/24/1999 0 0.0 0.0 95 0 78 17 95 95 0 NA4/25/1999 0 0.0 0.0 89 0 75 14 89 89 0 NA4/26/1999 0 0.0 0.0 91 0 77 14 91 91 0 NA4/27/1999 0 0.0 0.0 44 0 83 -39 44 44 0 NA4/28/1999 0 0.0 0.0 0 0 0 0 0 0 0 NA4/29/1999 0 0.0 0.0 0 0 0 0 0 0 0 NA4/30/1999 0 0.0 0.0 0 0 0 0 0 0 0 NA5/1/1999 0 0.0 0.0 0 0 0 0 0 0 0 NA5/2/1999 0 0.0 0.0 0 0 0 0 0 0 0 NA5/3/1999 0 0.0 0.0 0 0 0 0 0 0 0 NA5/4/1999 0 0.0 0.0 0 0 0 0 0 0 0 NA5/5/1999 0 0.0 0.0 0 0 0 0 0 0 0 NA5/6/1999 0 0.0 0.0 0 0 0 0 0 0 0 NA5/7/1999 0 0.0 0.0 0 0 0 0 0 0 0 NA5/8/1999 0 0.0 0.0 0 0 0 0 0 0 0 NA5/9/1999 0 0.0 0.0 0 0 0 0 0 0 0 NA
5/10/1999 0 0.0 0.0 0 0 0 0 0 0 0 NA5/11/1999 0 0.0 0.0 8 0 85 -77 8 8 0 NA5/12/1999 0 0.0 0.0 7 0 86 -79 7 7 0 NA5/13/1999 0 0.0 0.0 0 0 0 0 0 0 0 NA5/14/1999 0 0.0 0.0 52 154 0 52 206 206 0 NA5/15/1999 0 0.0 0.0 55 132 0 55 187 187 0 NA5/16/1999 0 0.0 0.0 6 57 0 6 63 63 0 NA5/17/1999 0 0.0 0.0 14 24 14 0 38 38 0 NA5/18/1999 0 0.0 0.0 59 79 87 -28 138 138 0 NA5/19/1999 0 0.0 0.0 85 154 79 6 239 239 0 NA5/20/1999 0 0.0 0.0 83 161 83 0 244 244 0 NA5/21/1999 11 3.8 10.4 95 184 92 3 279 290 0 NA5/22/1999 5 1.9 6.0 78 184 78 0 262 267 0 NA5/23/1999 8 2.9 8.8 83 184 83 0 267 275 0 NA5/24/1999 6 2.2 6.8 82 183 82 0 265 271 0 -5635/25/1999 8 2.9 8.4 87 183 84 3 270 278 0 NA5/26/1999 5 2.0 6.3 75 174 53 22 249 254 0 NA5/27/1999 6 2.3 6.1 93 164 60 33 257 263 0 NA5/28/1999 11 4.2 12.9 74 177 60 14 251 262 1 NA
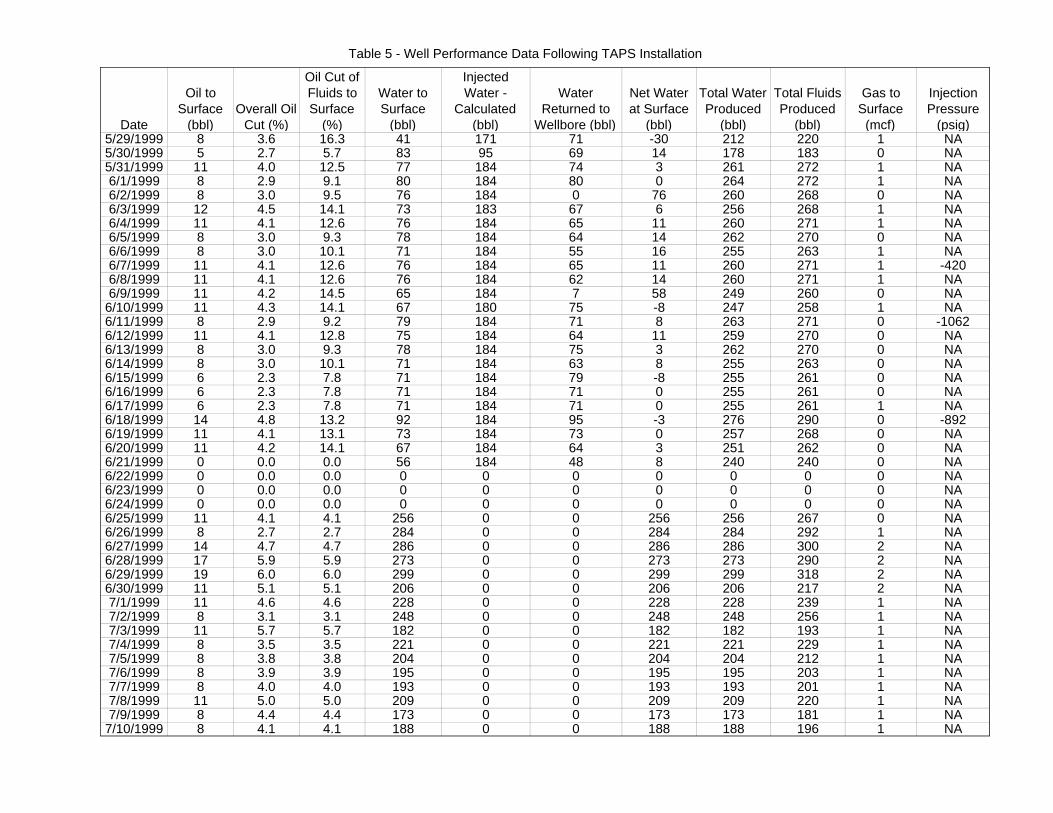
Table 5 - Well Performance Data Following TAPS Installation
Date
Oil to Surface
(bbl)Overall Oil
Cut (%)
Oil Cut of Fluids to Surface
(%)
Water to Surface
(bbl)
Injected Water -
Calculated (bbl)
Water Returned to
Wellbore (bbl)
Net Water at Surface
(bbl)
Total Water Produced
(bbl)
Total Fluids Produced
(bbl)
Gas to Surface
(mcf)
Injection Pressure
(psig)5/29/1999 8 3.6 16.3 41 171 71 -30 212 220 1 NA5/30/1999 5 2.7 5.7 83 95 69 14 178 183 0 NA5/31/1999 11 4.0 12.5 77 184 74 3 261 272 1 NA6/1/1999 8 2.9 9.1 80 184 80 0 264 272 1 NA6/2/1999 8 3.0 9.5 76 184 0 76 260 268 0 NA6/3/1999 12 4.5 14.1 73 183 67 6 256 268 1 NA6/4/1999 11 4.1 12.6 76 184 65 11 260 271 1 NA6/5/1999 8 3.0 9.3 78 184 64 14 262 270 0 NA6/6/1999 8 3.0 10.1 71 184 55 16 255 263 1 NA6/7/1999 11 4.1 12.6 76 184 65 11 260 271 1 -4206/8/1999 11 4.1 12.6 76 184 62 14 260 271 1 NA6/9/1999 11 4.2 14.5 65 184 7 58 249 260 0 NA
6/10/1999 11 4.3 14.1 67 180 75 -8 247 258 1 NA6/11/1999 8 2.9 9.2 79 184 71 8 263 271 0 -10626/12/1999 11 4.1 12.8 75 184 64 11 259 270 0 NA6/13/1999 8 3.0 9.3 78 184 75 3 262 270 0 NA6/14/1999 8 3.0 10.1 71 184 63 8 255 263 0 NA6/15/1999 6 2.3 7.8 71 184 79 -8 255 261 0 NA6/16/1999 6 2.3 7.8 71 184 71 0 255 261 0 NA6/17/1999 6 2.3 7.8 71 184 71 0 255 261 1 NA6/18/1999 14 4.8 13.2 92 184 95 -3 276 290 0 -8926/19/1999 11 4.1 13.1 73 184 73 0 257 268 0 NA6/20/1999 11 4.2 14.1 67 184 64 3 251 262 0 NA6/21/1999 0 0.0 0.0 56 184 48 8 240 240 0 NA6/22/1999 0 0.0 0.0 0 0 0 0 0 0 0 NA6/23/1999 0 0.0 0.0 0 0 0 0 0 0 0 NA6/24/1999 0 0.0 0.0 0 0 0 0 0 0 0 NA6/25/1999 11 4.1 4.1 256 0 0 256 256 267 0 NA6/26/1999 8 2.7 2.7 284 0 0 284 284 292 1 NA6/27/1999 14 4.7 4.7 286 0 0 286 286 300 2 NA6/28/1999 17 5.9 5.9 273 0 0 273 273 290 2 NA6/29/1999 19 6.0 6.0 299 0 0 299 299 318 2 NA6/30/1999 11 5.1 5.1 206 0 0 206 206 217 2 NA7/1/1999 11 4.6 4.6 228 0 0 228 228 239 1 NA7/2/1999 8 3.1 3.1 248 0 0 248 248 256 1 NA7/3/1999 11 5.7 5.7 182 0 0 182 182 193 1 NA7/4/1999 8 3.5 3.5 221 0 0 221 221 229 1 NA7/5/1999 8 3.8 3.8 204 0 0 204 204 212 1 NA7/6/1999 8 3.9 3.9 195 0 0 195 195 203 1 NA7/7/1999 8 4.0 4.0 193 0 0 193 193 201 1 NA7/8/1999 11 5.0 5.0 209 0 0 209 209 220 1 NA7/9/1999 8 4.4 4.4 173 0 0 173 173 181 1 NA
7/10/1999 8 4.1 4.1 188 0 0 188 188 196 1 NA

Table 5 - Well Performance Data Following TAPS Installation
Date
Oil to Surface
(bbl)Overall Oil
Cut (%)
Oil Cut of Fluids to Surface
(%)
Water to Surface
(bbl)
Injected Water -
Calculated (bbl)
Water Returned to
Wellbore (bbl)
Net Water at Surface
(bbl)
Total Water Produced
(bbl)
Total Fluids Produced
(bbl)
Gas to Surface
(mcf)
Injection Pressure
(psig)7/11/1999 8 4.1 4.1 187 0 0 187 187 195 0 NA7/12/1999 8 4.0 4.0 193 0 0 193 193 201 1 NA7/13/1999 8 4.3 4.3 179 0 0 179 179 187 1 NA7/14/1999 8 4.0 4.0 190 0 0 190 190 198 1 NA7/15/1999 8 3.8 3.8 202 0 0 202 202 210 1 NA7/16/1999 8 4.1 4.1 185 0 0 185 185 193 0 NA7/17/1999 8 4.1 4.1 187 0 0 187 187 195 1 NA7/18/1999 8 4.3 4.3 179 0 0 179 179 187 1 NA7/19/1999 8 3.7 3.7 208 0 0 208 208 216 1 NA7/20/1999 8 4.1 4.1 187 0 0 187 187 195 1 NA7/21/1999 3 4.3 4.3 66 0 0 66 66 69 0 NA7/22/1999 0 0.0 0.0 0 0 0 0 0 0 0 NA7/23/1999 3 2.3 4.5 64 65 86 -22 129 132 0 NA7/24/1999 6 2.5 7.9 70 167 89 -19 237 243 0 -9617/25/1999 8 3.2 10.3 70 172 78 -8 242 250 1 NA7/26/1999 6 2.4 7.8 71 172 74 -3 243 249 0 NA7/27/1999 8 3.3 10.8 66 172 72 -6 238 246 0 -8257/28/1999 0 0.0 0.0 27 153 63 -36 180 180 0 NA7/29/1999 3 1.7 4.2 69 107 36 33 176 179 0 NA7/30/1999 5 2.1 7.0 66 171 74 -8 237 242 1 NA7/31/1999 6 2.4 7.6 73 171 79 -6 244 250 1 NA8/1/1999 3 1.3 4.5 64 171 69 -5 235 238 1 NA8/2/1999 5 2.1 6.7 70 165 70 0 235 240 1 NA8/3/1999 6 2.6 7.3 76 147 54 22 223 229 0 NA8/4/1999 5 1.9 5.6 85 171 58 27 256 261 1 NA8/5/1999 6 2.2 6.1 92 172 59 33 264 270 1 NA8/6/1999 5 1.9 5.4 88 172 77 11 260 265 0 NA8/7/1999 8 3.0 8.2 89 172 67 22 261 269 1 NA8/8/1999 8 3.1 9.0 81 165 59 22 246 254 1 -9478/9/1999 3 1.3 4.0 72 159 64 8 231 234 2 NA
8/10/1999 6 2.5 7.1 78 158 64 14 236 242 2 -10198/11/1999 5 2.0 5.6 85 158 68 17 243 248 1 NA8/12/1999 3 1.3 4.5 63 158 57 6 221 224 1 NA8/13/1999 8 3.3 9.8 74 163 74 0 237 245 0 NA8/14/1999 6 2.4 7.0 80 161 75 5 241 247 1 NA8/15/1999 5 2.1 7.0 66 163 69 -3 229 234 0 NA8/16/1999 3 1.3 4.0 72 158 66 6 230 233 1 NA8/17/1999 3 1.3 4.0 72 158 67 5 230 233 1 NA8/18/1999 3 1.3 4.2 69 154 66 3 223 226 1 NA8/19/1999 3 1.2 3.3 89 168 103 -14 257 260 0 NA8/20/1999 2 0.8 2.4 81 165 78 3 246 248 0 NA8/21/1999 6 2.6 8.0 69 152 66 3 221 227 1 -9728/22/1999 3 1.4 4.5 64 151 64 0 215 218 1 NA

Table 5 - Well Performance Data Following TAPS Installation
Date
Oil to Surface
(bbl)Overall Oil
Cut (%)
Oil Cut of Fluids to Surface
(%)
Water to Surface
(bbl)
Injected Water -
Calculated (bbl)
Water Returned to
Wellbore (bbl)
Net Water at Surface
(bbl)
Total Water Produced
(bbl)
Total Fluids Produced
(bbl)
Gas to Surface
(mcf)
Injection Pressure
(psig)8/23/1999 3 1.4 4.3 67 151 64 3 218 221 0 NA8/24/1999 11 4.5 13.9 68 163 62 6 231 242 1 NA8/25/1999 3 1.4 4.6 62 155 59 3 217 220 0 NA8/26/1999 2 0.9 2.7 72 155 66 6 227 229 1 NA8/27/1999 3 1.4 4.5 63 155 60 3 218 221 1 NA8/28/1999 3 1.3 3.8 76 154 71 5 230 233 0 NA8/29/1999 0 0.0 0.0 76 153 70 6 229 229 1 NA8/30/1999 0 0.0 0.0 76 153 70 6 229 229 0 NA

Table 6 - Pump Data Following TAPS Installation
Date
Daily High Pump Load
(lb)
Daily Low Pump Load
(lb)Run Time
(hours)
Load on Standing
Valve Check (lb)
Estimated Injection Pump
Volume (%)
Fluid Level Above Pump
(feet)
Calculated Formation Injection
Pressure (psi)
Calculated Surface Injection Pressure
(psi)
Pump Intake Pressure
(psi)3/2/99 15,841 8,304 24.0 60% 1,1523/3/99 24.0 58% 1,2253/4/99 24.0 57% 1,0603/5/99 16,026 8,424 24.0 58% 1,2053/6/99 16,008 8,725 24.0 58%3/7/99 15,933 8,716 23.5 55%3/8/99 16,116 8,350 24.0 54%3/9/99 15,919 8,578 24.0 10,100 54% 1,282 2053 -474 4593/10/99 15,877 8,643 24.0 55%3/11/99 15,823 8,862 24.0 55%3/12/99 16,117 8,479 24.0 55%3/13/99 15,825 8,871 24.0 55%3/14/99 15,490 8,962 24.0 55%3/15/99 24.0 63% 1,424 4983/16/99 16,105 9,355 21.1 10,300 53% 967 1960 -567 3313/17/99 16,242 8,982 22.0 53% 1,046 3583/18/99 16,174 9,109 24.0 55%3/19/99 16,411 8,808 24.0 10,150 55% 1749 -778 8643/20/99 16,204 8,862 24.0 55%3/21/99 16,170 9,000 24.0 55%3/22/99 16,202 8,817 24.0 10,960 55% 1909 -6183/23/99 16,294 8,899 23.3 10,100 55% 932 2232 -295 3373/24/99 16,212 8,881 24.0 55%3/25/99 16,008 9,118 16.0 55%3/26/99 16,317 9,256 24.0 55%3/27/99 16,155 9,082 24.0 55%3/28/99 16,336 9,036 24.0 55%3/29/99 16,204 8,899 24.0 55%3/30/99 16,299 8,899 24.0 55%3/31/99 16,237 8,799 24.0 55%4/1/99 24.0 10,100 55% 1,029 2143 -384 3734/2/99 16,642 9,219 23.5 50%

Table 6 - Pump Data Following TAPS Installation
Date
Daily High Pump Load
(lb)
Daily Low Pump Load
(lb)Run Time
(hours)
Load on Standing
Valve Check (lb)
Estimated Injection Pump
Volume (%)
Fluid Level Above Pump
(feet)
Calculated Formation Injection
Pressure (psi)
Calculated Surface Injection Pressure
(psi)
Pump Intake Pressure
(psi)4/3/99 16,828 9,393 24.0 50%4/4/99 16,776 9,595 24.0 11,133 50% 1731 -7964/5/99 16,738 9,757 24.0 10,960 50% 1876 -651 4024/6/99 16,642 9,595 24.0 49%4/7/99 16,734 9,768 24.0 48%4/8/99 16,593 9,764 24.0 47%4/9/99 16,774 9,841 24.0 47%4/10/99 16,828 9,934 24.0 46%4/11/99 16,282 9,283 24.0 46%4/12/99 16,537 9,841 24.0 11,000 45% 1,640 1918 -609 5664/13/99 16,864 9,933 24.0 45%4/14/99 16,920 10,006 24.0 44%4/15/99 16,537 9,841 24.0 44%4/16/99 17,137 10,069 24.0 43% 2,781 6984/17/99 17,103 10,060 24.0 43%4/18/99 17,083 9,969 24.0 43%4/19/99 17,047 9,886 24.0 11,350 43% 1752 -7754/20/99 17,083 9,850 24.0 41% 7164/21/99 16,222 9,319 24.04/22/99 15,909 8,853 24.04/23/99 16,189 8,871 24.04/24/99 15,789 8,817 24.04/25/99 15,697 8,670 24.04/26/99 15,585 8,652 24.04/27/99 15,436 8,514 16.84/28/99 15,436 8,514 0.04/29/99 0.04/30/995/1/995/2/99 0.05/3/99 0.05/4/99 0.0
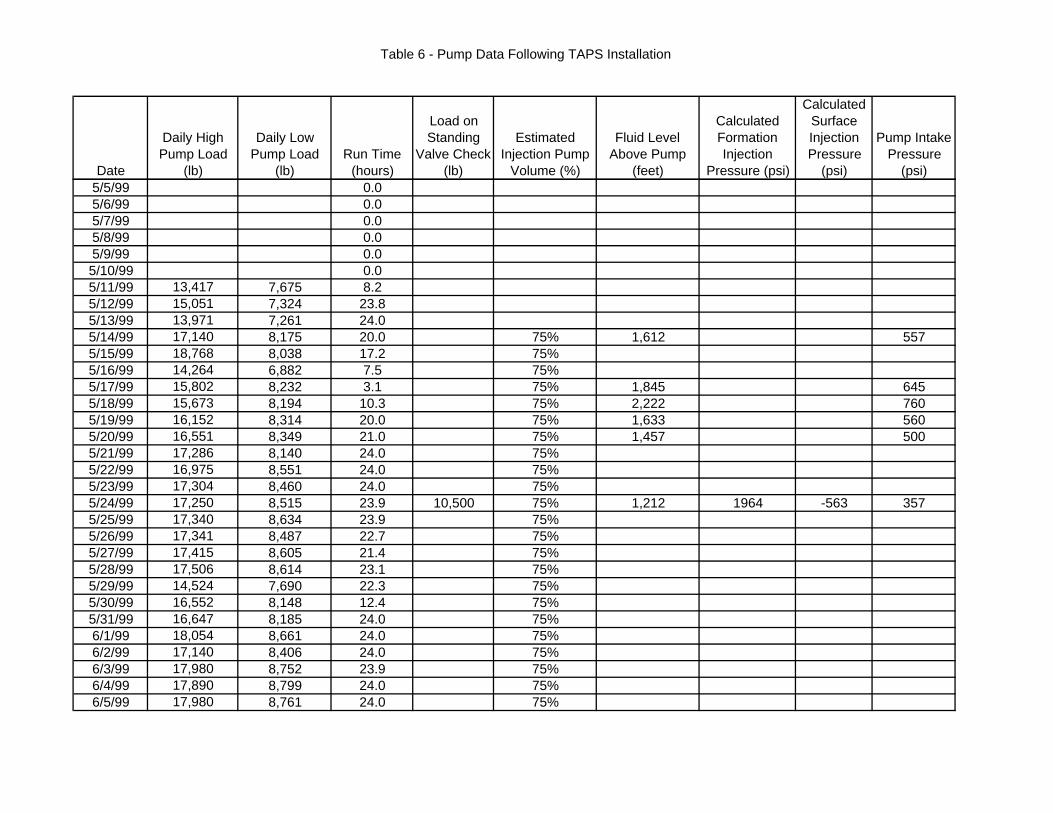
Table 6 - Pump Data Following TAPS Installation
Date
Daily High Pump Load
(lb)
Daily Low Pump Load
(lb)Run Time
(hours)
Load on Standing
Valve Check (lb)
Estimated Injection Pump
Volume (%)
Fluid Level Above Pump
(feet)
Calculated Formation Injection
Pressure (psi)
Calculated Surface Injection Pressure
(psi)
Pump Intake Pressure
(psi)5/5/99 0.05/6/99 0.05/7/99 0.05/8/99 0.05/9/99 0.05/10/99 0.05/11/99 13,417 7,675 8.25/12/99 15,051 7,324 23.85/13/99 13,971 7,261 24.05/14/99 17,140 8,175 20.0 75% 1,612 5575/15/99 18,768 8,038 17.2 75%5/16/99 14,264 6,882 7.5 75%5/17/99 15,802 8,232 3.1 75% 1,845 6455/18/99 15,673 8,194 10.3 75% 2,222 7605/19/99 16,152 8,314 20.0 75% 1,633 5605/20/99 16,551 8,349 21.0 75% 1,457 5005/21/99 17,286 8,140 24.0 75%5/22/99 16,975 8,551 24.0 75%5/23/99 17,304 8,460 24.0 75%5/24/99 17,250 8,515 23.9 10,500 75% 1,212 1964 -563 3575/25/99 17,340 8,634 23.9 75%5/26/99 17,341 8,487 22.7 75%5/27/99 17,415 8,605 21.4 75%5/28/99 17,506 8,614 23.1 75%5/29/99 14,524 7,690 22.3 75%5/30/99 16,552 8,148 12.4 75%5/31/99 16,647 8,185 24.0 75%6/1/99 18,054 8,661 24.0 75%6/2/99 17,140 8,406 24.0 75%6/3/99 17,980 8,752 23.9 75%6/4/99 17,890 8,799 24.0 75%6/5/99 17,980 8,761 24.0 75%

Table 6 - Pump Data Following TAPS Installation
Date
Daily High Pump Load
(lb)
Daily Low Pump Load
(lb)Run Time
(hours)
Load on Standing
Valve Check (lb)
Estimated Injection Pump
Volume (%)
Fluid Level Above Pump
(feet)
Calculated Formation Injection
Pressure (psi)
Calculated Surface Injection Pressure
(psi)
Pump Intake Pressure
(psi)6/6/99 17,451 8,560 24.0 75%6/7/99 17,065 8,460 24.0 10,200 75% 815 2107 -420 3156/8/99 17,890 8,506 24.0 75%6/9/99 17,632 8,661 24.0 75%6/10/99 18,091 8,790 23.5 75%6/11/99 18,019 8,917 24.0 11,829 75% 1465 -10626/12/99 18,073 8,935 24.0 75%6/13/99 17,964 9,036 24.0 75%6/14/99 18,091 9,027 24.0 75%6/15/99 18,037 8,899 24.0 75%6/16/99 18,037 8,899 24.0 75%6/17/99 18,073 8,935 24.0 75%6/18/99 17,964 8,716 24.0 11,458 75% 1635 -8926/19/99 17,826 8,817 24.0 75%6/20/99 17,400 8,023 24.0 75%6/21/99 16,834 7,851 24.0 75%6/22/99 0 0 0.0 0%6/23/99 0 0 0.0 0%6/24/99 0 0.0 0%6/25/99 9.36/26/99 24.06/27/99 24.06/28/99 24.06/29/99 22.36/30/99 19.77/1/99 18.47/2/99 17.97/3/99 17.57/4/99 17.37/5/99 17.07/6/99 16.77/7/99 16.4

Table 6 - Pump Data Following TAPS Installation
Date
Daily High Pump Load
(lb)
Daily Low Pump Load
(lb)Run Time
(hours)
Load on Standing
Valve Check (lb)
Estimated Injection Pump
Volume (%)
Fluid Level Above Pump
(feet)
Calculated Formation Injection
Pressure (psi)
Calculated Surface Injection Pressure
(psi)
Pump Intake Pressure
(psi)7/8/99 16.27/9/99 16.17/10/99 16.17/11/99 15.57/12/99 15.57/13/99 15.27/14/99 16.17/15/99 15.77/16/99 15.57/17/99 15.47/18/99 15.77/19/99 15.77/20/99 15.97/21/99 14.27/22/99 0.07/23/99 17,967 8,664 9.1 70%7/24/99 17,419 8,728 23.3 11,674 70% 1566 -9617/25/99 17,674 8,746 24.0 70%7/26/99 17,820 8,910 24.0 70%7/27/99 17,694 8,983 24.0 11,382 70% 1702 -8257/28/99 17,202 8,947 21.3 70%7/29/99 17,436 8,782 15.0 70%7/30/99 17,500 8,800 23.9 70%7/31/99 17,493 9,046 23.8 70%8/1/99 17,602 9,066 23.8 70%8/2/99 17,875 8,938 23.0 70%8/3/99 18,786 8,491 20.5 70%8/4/99 19,389 8,527 23.9 70%8/5/99 19,333 8,635 24.0 70%8/6/99 19,534 8,719 24.0 70%8/7/99 19,771 8,683 24.0 70%8/8/99 19,534 8,655 23.1 11,630 70% 1580 -947

Table 6 - Pump Data Following TAPS Installation
Date
Daily High Pump Load
(lb)
Daily Low Pump Load
(lb)Run Time
(hours)
Load on Standing
Valve Check (lb)
Estimated Injection Pump
Volume (%)
Fluid Level Above Pump
(feet)
Calculated Formation Injection
Pressure (psi)
Calculated Surface Injection Pressure
(psi)
Pump Intake Pressure
(psi)8/9/99 19,588 8,856 22.2 70%8/10/99 19,461 8,773 22.1 11,790 70% 4 1508 -10198/11/99 19,843 8,610 22.1 70%8/12/99 19,773 8,365 22.1 70%8/13/99 19,588 8,710 22.7 70%8/14/99 19,500 8,856 22.5 70%8/15/99 19,350 8,784 22.7 70%8/16/99 19,168 9,084 22.1 70%8/17/99 19,315 8,920 22.0 70%8/18/99 19,278 8,920 21.5 70%8/19/99 19,279 9,030 23.4 70%8/20/99 19,278 9,019 23.0 70%8/21/99 19,315 8,920 21.2 11,692 70% 1555 -9728/22/99 19,332 8,865 21.1 70%8/23/99 19,315 8,875 21.1 70%8/24/99 19,371 8,802 21.3 70%8/25/99 19,186 8,974 21.7 70%8/26/99 19,098 9,093 21.6 70%8/27/99 19,134 9,098 21.6 70%8/28/99 19,098 9,093 21.5 70%8/29/99 18,897 9,102 21.3 70%8/30/99 18,897 9,102 21.3 70%

Figure 1 - Diagram of TAPS

Figure 2 - Step Rate Injection Test
0
200
400
600
800
1000
1200
1400
1600
1800
0 1000 2000 3000 4000 5000 6000 7000 8000 9000 10000
Injection Rate (bbl/day)
Surf
ace
Tubi
ng P
ress
ure
(psi
g)
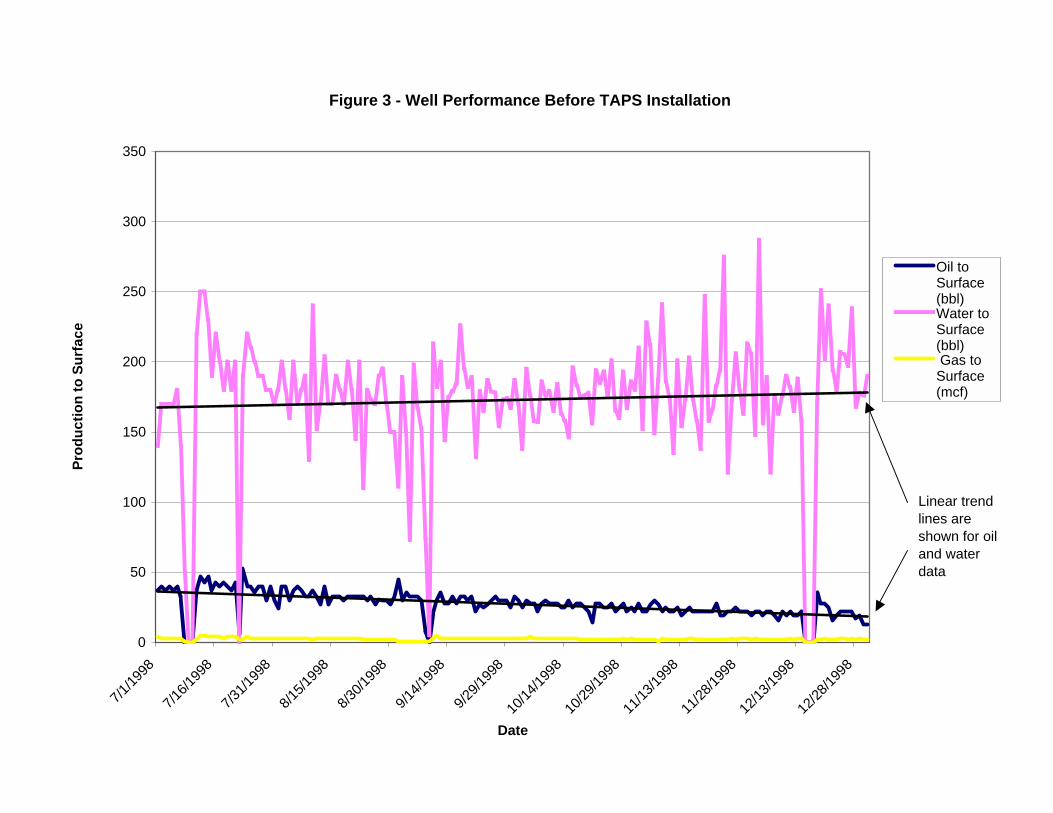
Figure 3 - Well Performance Before TAPS Installation
0
50
100
150
200
250
300
350
7/1/19
987/1
6/199
87/3
1/199
88/1
5/199
88/3
0/199
89/1
4/199
89/2
9/199
810
/14/19
9810
/29/19
9811
/13/19
9811
/28/19
9812
/13/19
9812
/28/19
98
Date
Prod
uctio
n to
Sur
face
Oil toSurface(bbl)Water toSurface(bbl) Gas toSurface(mcf)
Linear trend lines are shown for oil and water data

Figure 4 - Well Performance Following TAPS Installation
-100
-50
0
50
100
150
200
250
300
350
1/1
1/15
1/29
2/12
2/26
3/11
3/25 4/8
4/22 5/6
5/20 6/3
6/17 7/1
7/15
7/29
8/12
Date
Prod
uctio
n (b
bl)
Oil to Surface(bbl)
Water toSurface (bbl)
Net Water atSurface (bbl)

Figure 5 - Oil Production Follow
ing TAPS Installation
0 5 10 15 20 25 301/1/1900
1/15/1900
1/29/1900
2/12/1900
2/26/1900
3/11/1900
3/25/1900
4/8/1900
4/22/1900
5/6/1900
5/20/1900
6/3/1900
6/17/1900
7/1/1900
7/15/1900
7/29/1900
8/12/1900
Date
Production
Oil to Surface (bbl)
Overall O
il Cut (%
)
Oil C
ut of Fluids toSurface (%
)

Figure 6 - Total Fluid Production Following TA
PS Installation
0 50
100
150
200
250
300
350
1/1
1/8
1/15
1/22
1/29
2/5
2/12
2/19
2/26
3/4
3/11
3/18
3/25
4/1
4/8
4/15
4/22
4/29
5/6
5/13
5/20
5/27
6/3
6/10
6/17
6/24
7/1
7/8
7/15
7/22
7/29
8/5
Date
Production (bbl)