Summary of Consolidated Financial Statements for the ... 1. Analysis of management performance and...
28
Date: February 10, 2017 Summary of Consolidated Financial Statements for the Fiscal Year 2016 ended December 31, 2016 (IFRS basis) (All financial information has been prepared based on the original Japanese-language document, Summary of Consolidated Financial Statements for the Fiscal Year 2016 announced on February 10, 2017) Listed company name: DMG MORI CO., LTD. Stock exchange listing: First Section of Tokyo Stock Exchange Code Number: 6141 URL http://www.dmgmori.co.jp Company Representative: Masahiko Mori, President Contact Person Hirotake Kobayashi, Senior Managing Director, Accounting / Finance HQ, Executive Officer Phone: +81-52-587-1811 Expected date of the ordinary general shareholders’ meeting: March 22, 2017 Estimated starting date of dividend paying: March 23, 2017 Filing date of financial statements: March 22, 2017 Preparation of supplementary explanatory materials: Yes Holding of financial statements release conference: Yes (for investment analysts and institional investors) (Note: All amounts less than one million yen are disregarded) 1.Consolidated business results of the fiscal year 2016 ended December 31, 2016 (January 1, 2016 to December 31, 2016) (1) Consolidated business results (% of change from same period in the previous year) Sales revenues Operating result Earnings or losses before Taxes Net income or loss Income or loss attributable to owners of the parent company Total comprehensive income Million yen % Million yen % Million yen % Million yen % Million yen % Million yen % Fiscal year ended December 31, 2016 376,631 - 1,961 - △1,064 - △5,749 - △7,826 - △27,771 - Comparable period (Jan.-Dec. 2015) 374,290 - 39,968 - 39,019 - 35,200 - 32,985 - 23,387 - Basic earnings or l osses per share Diluted earnings per share Ratio of net income to equity, attributable to owners of the parent company Ratio of income before income tax to total assets Ratio of operating income to net sales Yen Yen % % % Fiscal year ended December 31, 2016 △67.80 △67.80 △6.1 △0.2 0.5 Comparable period (Jan.-Dec. 2015) 264.99 264.99 20.8 8.5 10.7 (Note) ・The company changed the fiscal year-end from March 31 to December 31. Following this change, the comparable period of the fiscal year ended December 31, 2016 is from January 1 through December 31, 2015.
Transcript of Summary of Consolidated Financial Statements for the ... 1. Analysis of management performance and...

Date: February 10, 2017
Summary of Consolidated Financial Statements for the Fiscal Year 2016 ended December 31, 2016 (IFRS basis)
(All financial information has been prepared based on the original Japanese-language document, Summary of Consolidated Financial
Statements for the Fiscal Year 2016 announced on February 10, 2017)
Listed company name: DMG MORI CO., LTD.
Stock exchange listing: First Section of Tokyo Stock Exchange
Code Number: 6141 URL http://www.dmgmori.co.jp
Company Representative: Masahiko Mori, President
Contact Person Hirotake Kobayashi, Senior Managing Director, Accounting / Finance HQ, Executive Officer
Phone: +81-52-587-1811
Expected date of the ordinary general shareholders’ meeting: March 22, 2017
Estimated starting date of dividend paying: March 23, 2017
Filing date of financial statements: March 22, 2017
Preparation of supplementary explanatory materials: Yes
Holding of financial statements release conference: Yes (for investment analysts and institional investors)
(Note: All amounts less than one million yen are disregarded)
1.Consolidated business results of the fiscal year 2016 ended December 31, 2016 (January 1, 2016 to December 31, 2016)
(1) Consolidated business results (% of change from same period in the previous year)
Sales revenues Operating result Earnings or losses
before Taxes Net income or loss
Income or loss
attributable to owners
of the parent company
Total comprehensive
income
Million
yen %
Million
yen %
Million
yen %
Million
yen %
Million
yen %
Million
yen %
Fiscal year ended
December 31, 2016 376,631 - 1,961 - △1,064 - △5,749 - △7,826 - △27,771 -
Comparable period
(Jan.-Dec. 2015) 374,290 - 39,968 - 39,019 - 35,200 - 32,985 - 23,387 -
Basic earnings or l
osses per share
Diluted earnings
per share
Ratio of net income
to equity, attributable
to owners of the
parent company
Ratio of income
before income tax to
total assets
Ratio of operating
income to net sales
Yen Yen % % %
Fiscal year ended
December 31, 2016
△67.80 △67.80 △6.1 △0.2 0.5
Comparable period
(Jan.-Dec. 2015) 264.99 264.99 20.8 8.5 10.7
(Note)
・The company changed the fiscal year-end from March 31 to December 31. Following this change, the comparable period of the fiscal year ended December 31, 2016 is
from January 1 through December 31, 2015.
・The Company consolidated DMG MORI AKTIENGESELLSCHAFT (hereinafter “AG”) from April, 2015, a part of consolidated business results of the comparable period
(January 1, 2015 through March 31, 2015) does not include business results of AG. Thus, there is no “% of change from same period in the previous year” written in this
report. The result of the comparable period includes appraisal gains on AG shares (gains on step acquisition) of 37,296 million yen following the consolidation with AG.
・In the results of fiscal year ended December 31, 2016, approximately 110 million yen of loss is included, which arose from liquidating overlapping assets, one-off expense
from withdrawing from non-core business and gain on sales of investment securities.
・Basic earnings or losses per share of fiscal year ended December 31, 2016 is based on the loss amount which excludes earnings or losses attributable to owner of hybrid
capital.
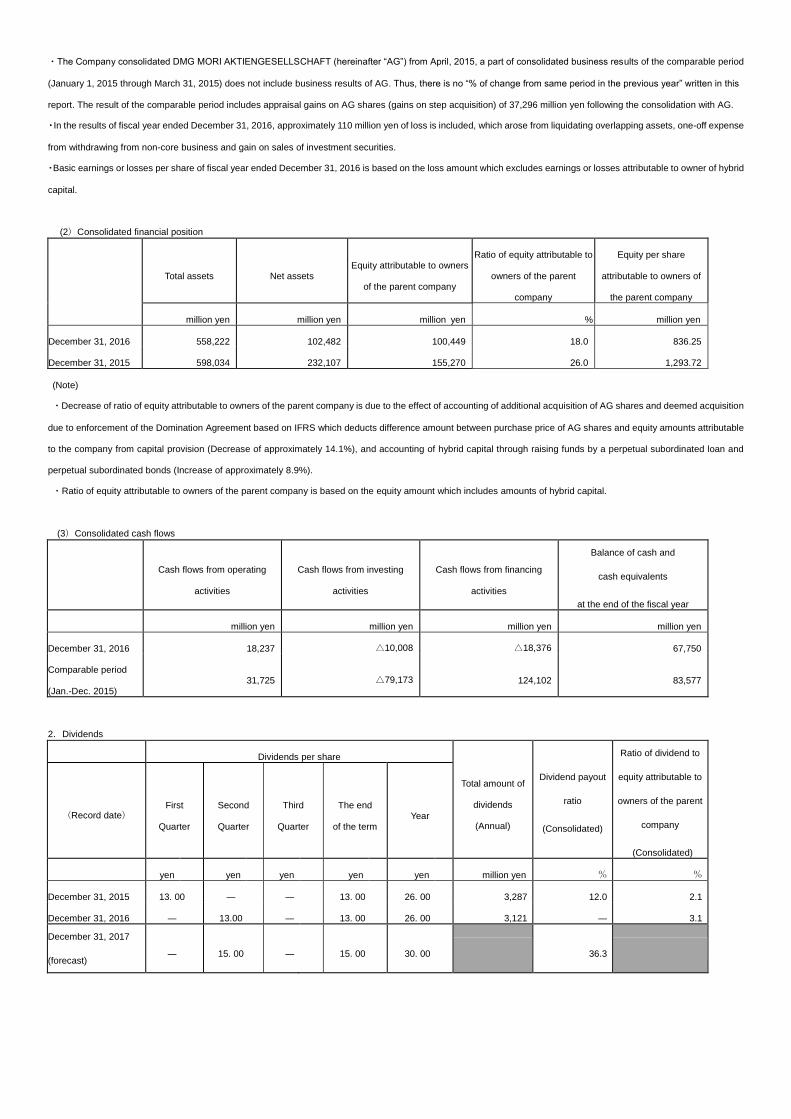
(2)Consolidated financial position
Total assets Net assets Equity attributable to owners
of the parent company
Ratio of equity attributable to
owners of the parent
company
Equity per share
attributable to owners of
the parent company
million yen million yen million yen % million yen
December 31, 2016 558,222 102,482 100,449 18.0 836.25
December 31, 2015 598,034 232,107 155,270 26.0 1,293.72
(Note)
・Decrease of ratio of equity attributable to owners of the parent company is due to the effect of accounting of additional acquisition of AG shares and deemed acquisition
due to enforcement of the Domination Agreement based on IFRS which deducts difference amount between purchase price of AG shares and equity amounts attributable
to the company from capital provision (Decrease of approximately 14.1%), and accounting of hybrid capital through raising funds by a perpetual subordinated loan and
perpetual subordinated bonds (Increase of approximately 8.9%).
・Ratio of equity attributable to owners of the parent company is based on the equity amount which includes amounts of hybrid capital.
(3)Consolidated cash flows
Cash flows from operating
activities
Cash flows from investing
activities
Cash flows from financing
activities
Balance of cash and
cash equivalents
at the end of the fiscal year
million yen million yen million yen million yen
December 31, 2016 18,237 △10,008 △18,376 67,750
Comparable period
(Jan.-Dec. 2015) 31,725 △79,173 124,102 83,577
2.Dividends
Dividends per share
Total amount of
dividends
(Annual)
Dividend payout
ratio
(Consolidated)
Ratio of dividend to
equity attributable to
owners of the parent
company
(Consolidated)
(Record date) First
Quarter
Second
Quarter
Third
Quarter
The end
of the term Year
yen yen yen yen yen million yen % %
December 31, 2015 13. 00 ― ― 13. 00 26. 00 3,287 12.0 2.1
December 31, 2016 ― 13.00 ― 13. 00 26. 00 3,121 ― 3.1
December 31, 2017
(forecast) ― 15. 00 ― 15. 00 30. 00 36.3

3.Consolidated earnings forecast for Fiscal Year 2017 (January 1, 2017 to December 31, 2017)
(% of change from same period in the previous year)
Sales Revenue Operating result Income attributable to owners of the
parent company Basic earnings per share
million yen % million yen % million yen % yen
Full Year 2017 380,000 0.9 22,000 1,021.9 11,000 - 82.67
(Note) Exchange rate used for consolidated earnings forecast for FY2017: JPY 110/USD, JPY 100/EUR (FY2016: JPY 108.8/USD, JPY 120.3/EUR)
※Notes
(1) Changes in significant subsidiaries during the fiscal year 2016: No
(2) Changes in accounting policies applied and changes in accounting estimates
1. Changes in accounting policies required by IFRS: Yes
2. Changes in accounting policies other than the above: No
3. Changes in accounting estimates: No
(3) Number of shares outstanding (Common stock)
1. Number of shares outstanding at the end of the period (including treasury stock)
December 31, 2016: 132,943,683 December 31, 2015: 132,943,683
2. Number of treasury stock at the end of the period
December 31, 2016: 12,924,920 December 31, 2015: 12,924,543
3. Average number of outstanding shares during the period (cumulative from the beginning of the period)
January - December 2016: 120,019,093 April - December 2015: 124,479,251
- Information regarding implementation of review procedures
The financial results are not subject to yearly audit review procedures based on the Financial Instruments and Exchange Act. Thus, at the time of disclosure of the
financial results, the yearly financial statement review procedures based on the Financial Instruments and Exchange Law has not been completed.
Also, the Group disclosed the figures of comparable period as same period of last year (January 1 through December 31, 2015), but they are different period from
last fiscal year (April 1 through December 31, 2015) and are not subject to annual audit review procedures based on the Financial Instruments and Exchange Act.
- Explanations for adequate utilization of the forecast and other special matters
From the fiscal year ended December 31, 2015, the company introduced the International Financial Reporting Standards (IFRS) to prepare its consolidated financial
statements accordingly.
- Proper use of the earnings forecasts and other notes
The above forecast is based on information available as of the release of this report and assumptions of several uncertain factors which may affect the company’s
results. Actual results might be different from the above estimates due to subsequent changes in the circumstances. Regarding the assumption of forecast of fiscal
year 2016 and disclaimer for the use of forecast, please see “1. Analysis of management performance and consolidated financial status (2) Forecast for fiscal year
2017”.
We will upload additional explanation documents to DMG MORI Website on February 10, 2017.

1
(Attached Documents) Index
1. Analysis of management performance and consolidated financial status・・・・・・・・・・・・・・・・・・・・・・・・・・・・・・・・・・・・・・・・・・・・・・・・・・・・・・・ 2
(1) Explanation of operating results・・・・・・・・・・・・・・・・・・・・・・・・・・・・・・・・・・・・・・・・・・・・・・・・・・・・・・・・・・・・・・・・・・・・・・・・・・・・・・・・・・・・・・・ 2
(2) Forecast for fiscal year 2017 ・・・・・・・・・・・・・・・・・・・・・・・・・・・・・・・・・・・・・・・・・・・・・・・・・・・・・・・・・・・・・・・・・・・・・・・・・・・・・・・・・・・・・・・・・ 5
(3) Explanation of financial position・・・・・・・・・・・・・・・・・・・・・・・・・・・・・・・・・・・・・・・・・・・・・・・・・・・・・・・・・・・・・・・・・・・・・・・・・・・・・・・・・・・・・・・・ 5
(4) Basic policy concerning profit appropriation and dividend payment ・・・・・・・・・・・・・・・・・・・・・・・・・・・・・・・・・・・・・・・・・・・・・・・・・・・・・・・・ 7
2. Management Policy・・・・・・・・・・・・・・・・・・・・・・・・・・・・・・・・・・・・・・・・・・・・・・・・・・・・・・・・・・・・・・・・・・・・・・・・・・・・・・・・・・・・・・・・・・・・・・・・・・・・・ 8
(1) Basic management policy・・・・・・・・・・・・・・・・・・・・・・・・・・・・・・・・・・・・・・・・・・・・・・・・・・・・・・・・・・・・・・・・・・・・・・・・・・・・・・・・・・・・・・・・・・・・・ 8
(2) Management targets・・・・・・・・・・・・・・・・・・・・・・・・・・・・・・・・・・・・・・・・・・・・・・・・・・・・・・・・・・・・・・・・・・・・・・・・・・・・・・・・・・・・・・・・・・・・・・・・・ 8
(3) Company’s medium to long-term management strategies・・・・・・・・・・・・・・・・・・・・・・・・・・・・・・・・・・・・・・・・・・・・・・・・・・・・・・・・・・・・・・・・・ 8
(4) Challenges facing the company・・・・・・・・・・・・・・・・・・・・・・・・・・・・・・・・・・・・・・・・・・・・・・・・・・・・・・・・・・・・・・・・・・・・・・・・・・・・・・・・・・・・・・・・ 9
3. Basic policy for selection of accounting standards・・・・・・・・・・・・・・・・・・・・・・・・・・・・・・・・・・・・・・・・・・・・・・・・・・・・・・・・・・・・・・・・・・・・・・・・・・・ 9
4. Consolidated Financial Statements ・・・・・・・・・・・・・・・・・・・・・・・・・・・・・・・・・・・・・・・・・・・・・・・・・・・・・・・・・・・・・・・・・・・・・・・・・・・・・・・・・・・・・・
(1) Consolidated statements of financial position・・・・・・・・・・・・・・・・・・・・・・・・・・・・・・・・・・・・・・・・・・・・・・・・・・・・・・・・・・・・・・・・・・・・・・・・・・・・
(2) Consolidated statements of income・・・・・・・・・・・・・・・・・・・・・・・・・・・・・・・・・・・・・・・・・・・・・・・・・・・・・・・・・・・・・・・・・・・・・・・・・・・・・・・・・・・・
(3) Consolidated statements of comprehensive income・・・・・・・・・・・・・・・・・・・・・・・・・・・・・・・・・・・・・・・・・・・・・・・・・・・・・・・・・・・・・・・・・・・・・・
(4) Consolidated statements of changes in equity・・・・・・・・・・・・・・・・・・・・・・・・・・・・・・・・・・・・・・・・・・・・・・・・・・・・・・・・・・・・・・・・・・・・・・・・・・・
(5) Consolidated statements of cash flows・・・・・・・・・・・・・・・・・・・・・・・・・・・・・・・・・・・・・・・・・・・・・・・・・・・・・・・・・・・・・・・・・・・・・・・・・・・・・・・・・・
(6) Notes on going concern assumption・・・・・・・・・・・・・・・・・・・・・・・・・・・・・・・・・・・・・・・・・・・・・・・・・・・・・・・・・・・・・・・・・・・・・・・・・・・・・・・・・・・・
(7) Notes on consolidated financial statements・・・・・・・・・・・・・・・・・・・・・・・・・・・・・・・・・・・・・・・・・・・・・・・・・・・・・・・・・・・・・・・・・・・・・・・・・・・・・・
5. Other・・・・・・・・・・・・・・・・・・・・・・・・・・・・・・・・・・・・・・・・・・・・・・・・・・・・・・・・・・・・・・・・・・・・・・・・・・・・・・・・・・・・・・・・・・・・・・・・・・・・・・・・・・・・・・・・・
10
10
12
13
14
16
18
18
24
2
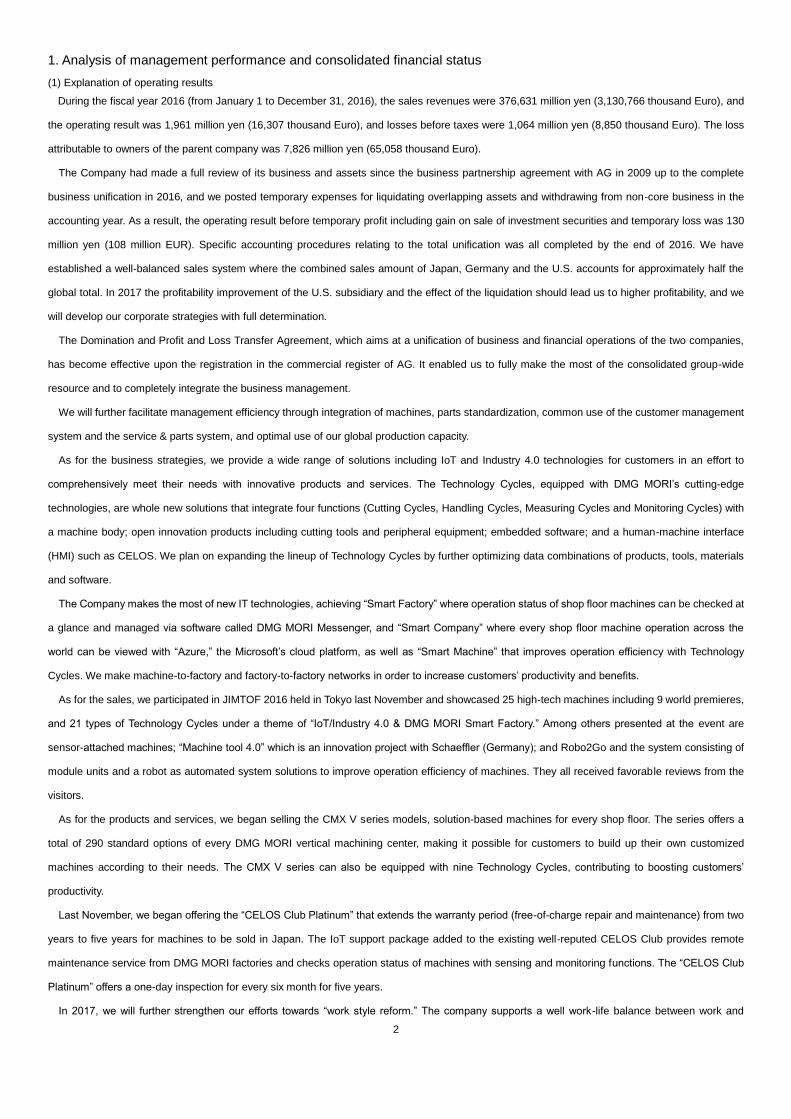
1. Analysis of management performance and consolidated financial status
(1) Explanation of operating results
During the fiscal year 2016 (from January 1 to December 31, 2016), the sales revenues were 376,631 million yen (3,130,766 thousand Euro), and
the operating result was 1,961 million yen (16,307 thousand Euro), and losses before taxes were 1,064 million yen (8,850 thousand Euro). The loss
attributable to owners of the parent company was 7,826 million yen (65,058 thousand Euro).
The Company had made a full review of its business and assets since the business partnership agreement with AG in 2009 up to the complete
business unification in 2016, and we posted temporary expenses for liquidating overlapping assets and withdrawing from non-core business in the
accounting year. As a result, the operating result before temporary profit including gain on sale of investment securities and temporary loss was 130
million yen (108 million EUR). Specific accounting procedures relating to the total unification was all completed by the end of 2016. We have
established a well-balanced sales system where the combined sales amount of Japan, Germany and the U.S. accounts for approximately half the
global total. In 2017 the profitability improvement of the U.S. subsidiary and the effect of the liquidation should lead us to higher profitability, and we
will develop our corporate strategies with full determination.
The Domination and Profit and Loss Transfer Agreement, which aims at a unification of business and financial operations of the two companies,
has become effective upon the registration in the commercial register of AG. It enabled us to fully make the most of the consolidated group-wide
resource and to completely integrate the business management.
We will further facilitate management efficiency through integration of machines, parts standardization, common use of the customer management
system and the service & parts system, and optimal use of our global production capacity.
As for the business strategies, we provide a wide range of solutions including IoT and Industry 4.0 technologies for customers in an effort to
comprehensively meet their needs with innovative products and services. The Technology Cycles, equipped with DMG MORI’s cutting-edge
technologies, are whole new solutions that integrate four functions (Cutting Cycles, Handling Cycles, Measuring Cycles and Monitoring Cycles) with
a machine body; open innovation products including cutting tools and peripheral equipment; embedded software; and a human-machine interface
(HMI) such as CELOS. We plan on expanding the lineup of Technology Cycles by further optimizing data combinations of products, tools, materials
and software.
The Company makes the most of new IT technologies, achieving “Smart Factory” where operation status of shop floor machines can be checked at
a glance and managed via software called DMG MORI Messenger, and “Smart Company” where every shop floor machine operation across the
world can be viewed with “Azure,” the Microsoft’s cloud platform, as well as “Smart Machine” that improves operation efficiency with Technology
Cycles. We make machine-to-factory and factory-to-factory networks in order to increase customers’ productivity and benefits.
As for the sales, we participated in JIMTOF 2016 held in Tokyo last November and showcased 25 high-tech machines including 9 world premieres,
and 21 types of Technology Cycles under a theme of “IoT/Industry 4.0 & DMG MORI Smart Factory.” Among others presented at the event are
sensor-attached machines; “Machine tool 4.0” which is an innovation project with Schaeffler (Germany); and Robo2Go and the system consisting of
module units and a robot as automated system solutions to improve operation efficiency of machines. They all received favorable reviews from the
visitors.
As for the products and services, we began selling the CMX V series models, solution-based machines for every shop floor. The series offers a
total of 290 standard options of every DMG MORI vertical machining center, making it possible for customers to build up their own customized
machines according to their needs. The CMX V series can also be equipped with nine Technology Cycles, contributing to boosting customers’
productivity.
Last November, we began offering the “CELOS Club Platinum” that extends the warranty period (free-of-charge repair and maintenance) from two
years to five years for machines to be sold in Japan. The IoT support package added to the existing well-reputed CELOS Club provides remote
maintenance service from DMG MORI factories and checks operation status of machines with sensing and monitoring functions. The “CELOS Club
Platinum” offers a one-day inspection for every six month for five years.
In 2017, we will further strengthen our efforts towards “work style reform.” The company supports a well work-life balance between work and
3
private time for employees by promoting work from home, adopting flexible working hours with a core time, and making mindset changing efforts to
eliminate overtime work with an aim to proactively improve productivity and efficiency.
The Company is determined to enhance its product and service quality and to provide high value-added solutions for customers. We also go ahead
with the Open Innovation strategy by collaborating with our partner companies in pursuit of co-existence and co-prosperity with them and maximize
our corporate value.
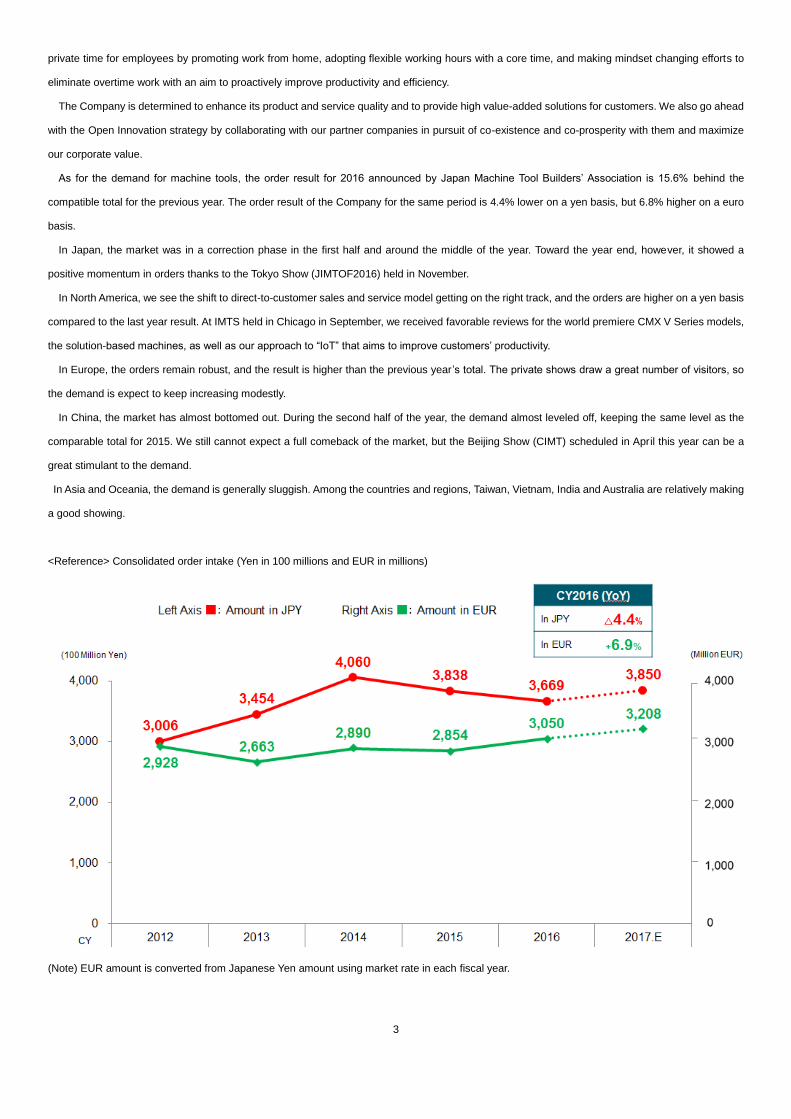
As for the demand for machine tools, the order result for 2016 announced by Japan Machine Tool Builders’ Association is 15.6% behind the
compatible total for the previous year. The order result of the Company for the same period is 4.4% lower on a yen basis, but 6.8% higher on a euro
basis.
In Japan, the market was in a correction phase in the first half and around the middle of the year. Toward the year end, however, it showed a
positive momentum in orders thanks to the Tokyo Show (JIMTOF2016) held in November.
In North America, we see the shift to direct-to-customer sales and service model getting on the right track, and the orders are higher on a yen basis
compared to the last year result. At IMTS held in Chicago in September, we received favorable reviews for the world premiere CMX V Series models,
the solution-based machines, as well as our approach to “IoT” that aims to improve customers’ productivity.
In Europe, the orders remain robust, and the result is higher than the previous year ’s total. The private shows draw a great number of visitors, so
the demand is expect to keep increasing modestly.
In China, the market has almost bottomed out. During the second half of the year, the demand almost leveled off, keeping the same level as the
comparable total for 2015. We still cannot expect a full comeback of the market, but the Beijing Show (CIMT) scheduled in April this year can be a
great stimulant to the demand.
In Asia and Oceania, the demand is generally sluggish. Among the countries and regions, Taiwan, Vietnam, India and Australia are relatively making
a good showing.
<Reference> Consolidated order intake (Yen in 100 millions and EUR in millions)
(Note) EUR amount is converted from Japanese Yen amount using market rate in each fiscal year.

4
<Consolidated results>
Consolidated results of fiscal year ended December 31, 2016 is as follows:
<For reference>
Unit : 100 Million yen
(Million Euro)
January through
December, 2015
January through
December, 2016 Difference
Sales revenues 4,284
(3,190)
3,766
(3,131)
△518
(△59)
Operating result (excluding temporary income and loss)
Operating result / Sales revenue
360
(268)
8.4%
130
(108)
3.4%
△230
(△160)
△5.0%pts
Temporary income and loss 51
(38)
△110
(△91)
-
-
Operating result
Operating result / Sales revenue
411
(306)
9.6%
20
(16)
0.5%
△391
(△290)
△9.1%pts
Income or loss attributable to owners of the parent company 324
(241)
△78
(△65)
△402
(△306)
* For reference, the figures for January through December, 2015 are consolidated business result where 100% of AG’s financial result is
incorporated.
・Euro amount is converted to yen at 134.3 yen for the figures of 2015 and 120.3 yen for the figures of 2016, the average exchange rate of fiscal year,
respectively.
・Inside temporary income and loss, following items are included; appraisal gains on AG shares (gains on step acquisition) etc. for 2015, expenses for
liquidating overlapping assets and withdrawing from non-core business in the accounting year and gain on sale of investment securities etc. for 2016.
・Income attributable to owners of the parent company from AG’s results is based on shareholding ratio (Jan.-Jun. 2015: 52.54%, Jul.-Sep. 2015:
58.93%, Oct. 2015.-Mar. 2016: 60.67%, Apr.-Sep. 2016: 76.03%, After Oct. 2016: 100%, as a result of coming into force of Domination, Profit and
Loss Transfer Agreement)
5
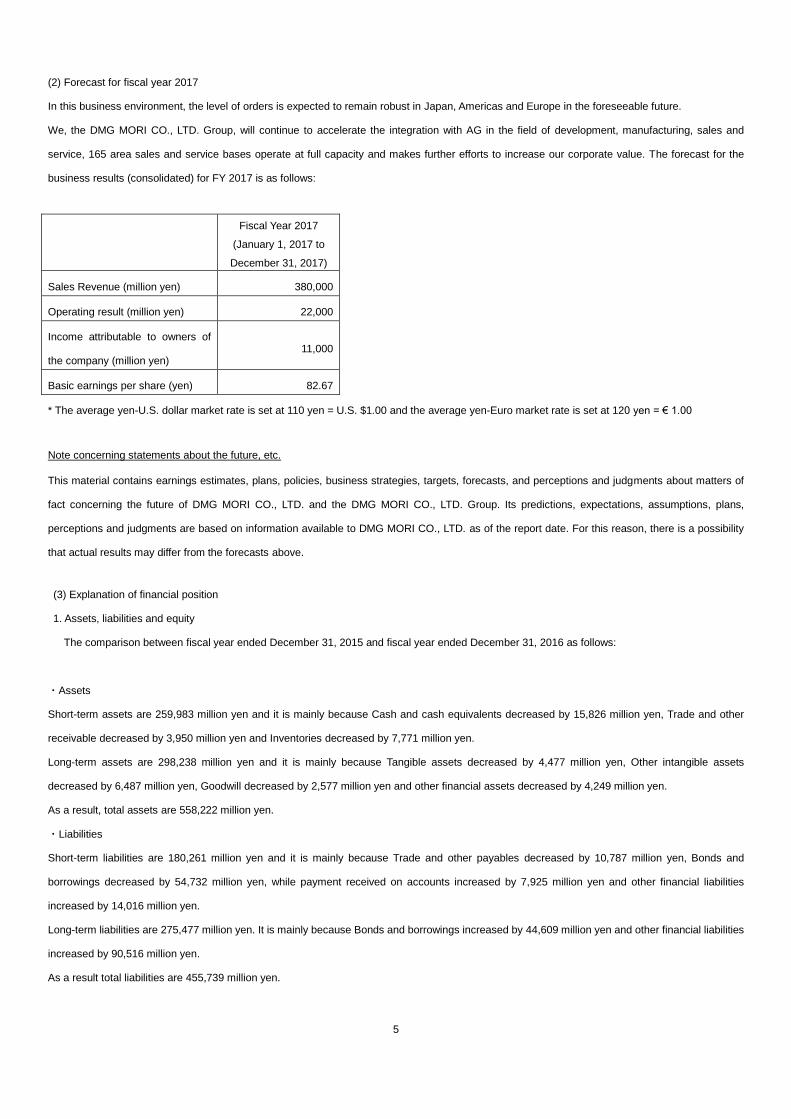
(2) Forecast for fiscal year 2017
In this business environment, the level of orders is expected to remain robust in Japan, Americas and Europe in the foreseeable future.
We, the DMG MORI CO., LTD. Group, will continue to accelerate the integration with AG in the field of development, manufacturing, sales and
service, 165 area sales and service bases operate at full capacity and makes further efforts to increase our corporate value. The forecast for the
business results (consolidated) for FY 2017 is as follows:
Fiscal Year 2017
(January 1, 2017 to
December 31, 2017)
Sales Revenue (million yen) 380,000
Operating result (million yen) 22,000
Income attributable to owners of
the company (million yen) 11,000
Basic earnings per share (yen) 82.67
* The average yen-U.S. dollar market rate is set at 110 yen = U.S. $1.00 and the average yen-Euro market rate is set at 120 yen = € 1.00
Note concerning statements about the future, etc.
This material contains earnings estimates, plans, policies, business strategies, targets, forecasts, and perceptions and judgments about matters of
fact concerning the future of DMG MORI CO., LTD. and the DMG MORI CO., LTD. Group. Its predictions, expectations, assumptions, plans,
perceptions and judgments are based on information available to DMG MORI CO., LTD. as of the report date. For this reason, there is a possibility
that actual results may differ from the forecasts above.
(3) Explanation of financial position
1. Assets, liabilities and equity
The comparison between fiscal year ended December 31, 2015 and fiscal year ended December 31, 2016 as follows:
・Assets
Short-term assets are 259,983 million yen and it is mainly because Cash and cash equivalents decreased by 15,826 million yen, Trade and other
receivable decreased by 3,950 million yen and Inventories decreased by 7,771 million yen.
Long-term assets are 298,238 million yen and it is mainly because Tangible assets decreased by 4,477 million yen, Other intangible assets
decreased by 6,487 million yen, Goodwill decreased by 2,577 million yen and other financial assets decreased by 4,249 million yen.
As a result, total assets are 558,222 million yen.
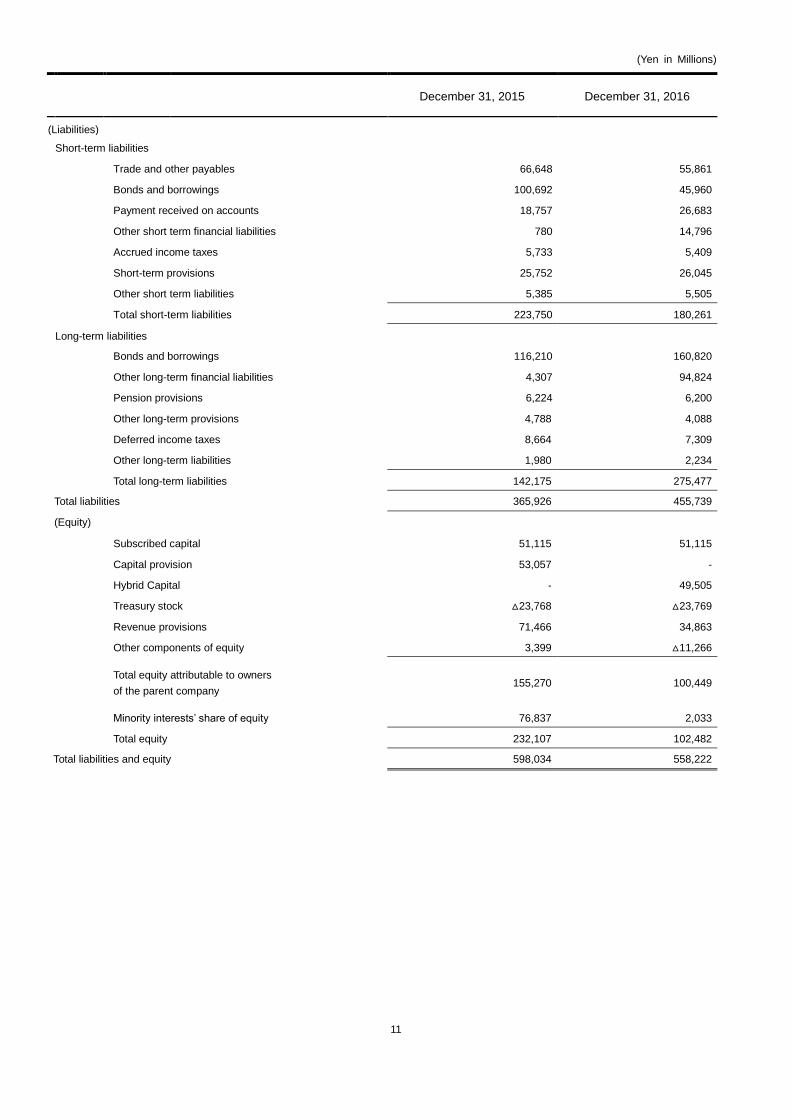
・Liabilities
Short-term liabilities are 180,261 million yen and it is mainly because Trade and other payables decreased by 10,787 million yen, Bonds and
borrowings decreased by 54,732 million yen, while payment received on accounts increased by 7,925 million yen and other financial liabilities
increased by 14,016 million yen.
Long-term liabilities are 275,477 million yen. It is mainly because Bonds and borrowings increased by 44,609 million yen and other financial liabilities
increased by 90,516 million yen.
As a result total liabilities are 455,739 million yen.

6
・Equity
Equity is 102,482 million yen. It is mainly because Capital provision decreased by 53,057 million yen, revenue provision decreased by 36,602 million
yen, other components of equity decreased by 14,666 million yen, Minority interests’ share of equity decreased by 74,803 million yen, while hybrid
capital increased by 49,505 million yen.
(Reference)
(Million Yen) December 31, 2015 December 31, 2016 Change
Short-term assets 284,561 259,983 △24,578
Long-term assets 313,473 298,238 △15,234
Short-term liabilities 223,750 180,261 △43,489
Long-term liabilities 142,175 275,477 133,301
Equity 232,107 102,482 △129,625
2. Cash flows during fiscal year 2016
(Million yen)
January 2015 to
December 2015 (*)
Fiscal Year 2016
(January 2016 to
December 2016)
Operating activities 14,816 18,237
Investing activities △83,581 △10,008
Financing activities 119,771 △18,376
Cash and cash equivalents at the end of the year 83,577 67,750
(※) For reference, the figures are cash flows where 100% of AG’s financial result are taken.
Status of cash flows and its fluctuation factors for the fiscal year ended December 31, 2016 are as follows:
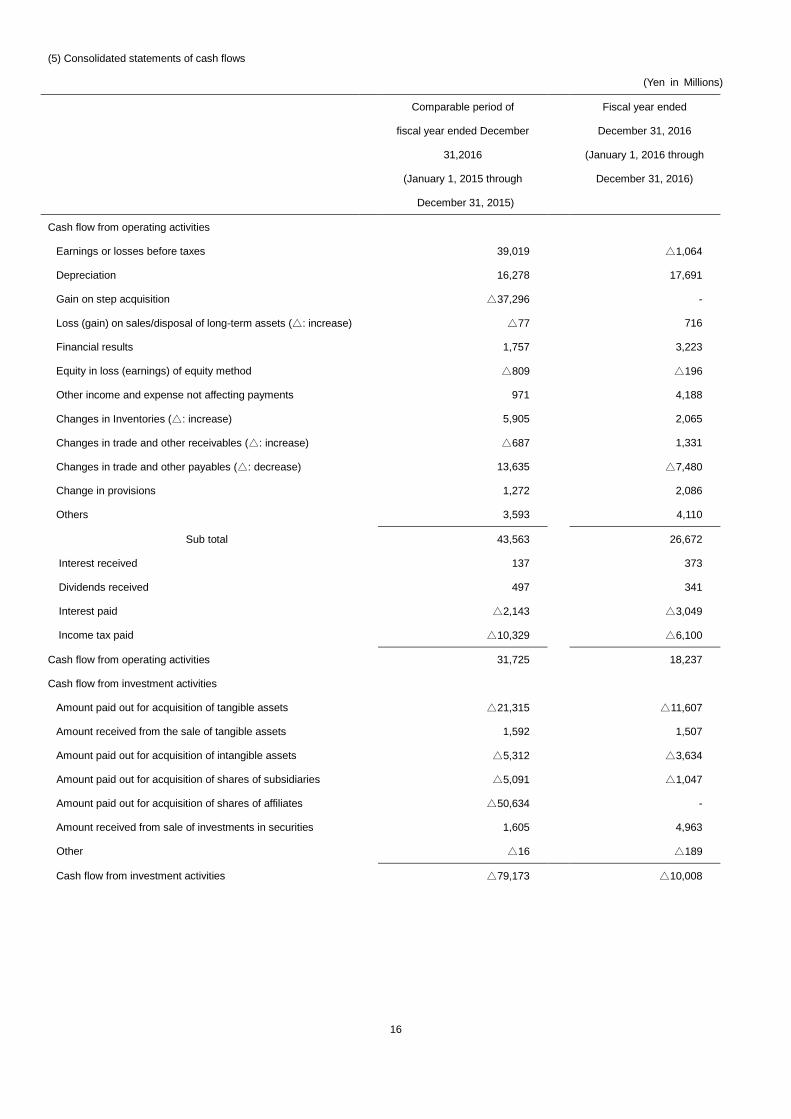
・Cash flows from operating activities
Net cash provided in operating activities was 18,237 million yen. The main factors for the increase are 17,691 million yen of Depreciation and
amortization, 2,065 million yen of decrease in inventories and 1,331 million yen of decrease in Trade and other receivables. The main factor for
the decrease is 7,480 million yen of decrease in trade and other payables and 6,100 million yen of payment of income taxes.
・Cash flows from investing activities
Net cash paid out in investing activities was 10,008 million yen. The main factors for the increase are 4,963 million yen of amount received from
the sale of securities and main factors for the decrease are acquisition of tangible assets of 11,607 million yen, acquisition of intangible assets of
3,634 million yen.
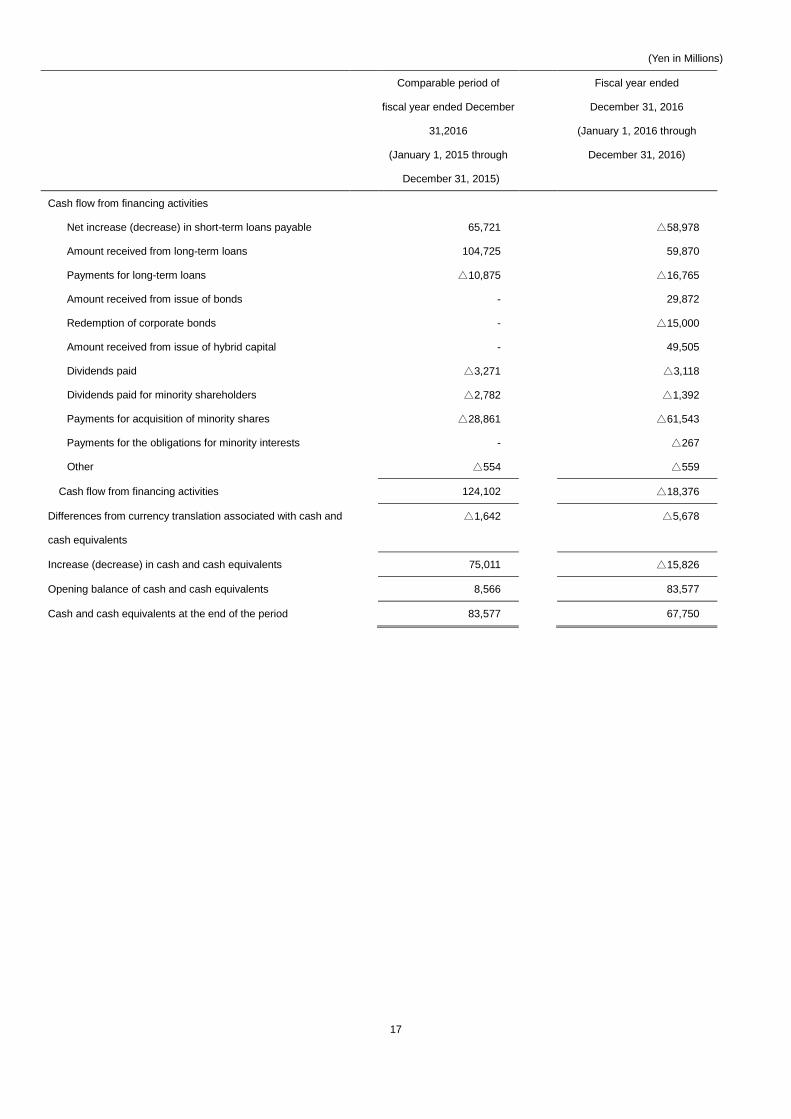
・Cash flows from financing activities
Net cash paid out in financing activities was 18,376 million yen. The main factors for the increase are 59,870 million yen of net increase in
long-term bank loans, 29,872 million yen of amount received from issue of bonds and 49,505 million yen of amount received from issue of hybrid
capital. The main factors for the decrease are 58,978 million yen of net decrease in short-term loans, 16,765 million yen of payments for
long-term loans, 15,000 million yen of payments for redemption of bonds and 61,543 million yen of payments for acquisition of minority shares.
As a result, cash and cash equivalents as of December 31, 2016 are 67,750 million yen (decreased by 15,826 million yen from Dec. 31, 2015).
7
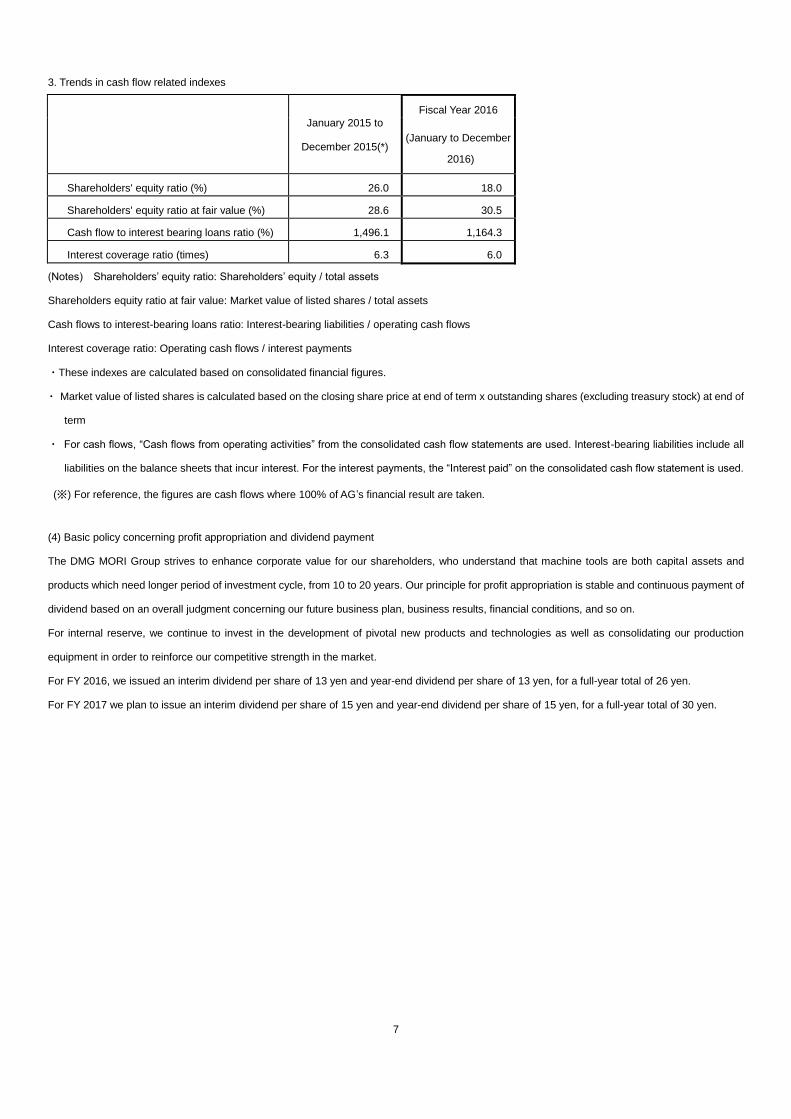
3. Trends in cash flow related indexes
January 2015 to
December 2015(*)
Fiscal Year 2016
(January to December
2016)
Shareholders' equity ratio (%) 26.0 18.0
Shareholders' equity ratio at fair value (%) 28.6 30.5
Cash flow to interest bearing loans ratio (%) 1,496.1 1,164.3
Interest coverage ratio (times) 6.3 6.0
(Notes) Shareholders’ equity ratio: Shareholders’ equity / total assets
Shareholders equity ratio at fair value: Market value of listed shares / total assets
Cash flows to interest-bearing loans ratio: Interest-bearing liabilities / operating cash flows
Interest coverage ratio: Operating cash flows / interest payments
・These indexes are calculated based on consolidated financial figures.
・ Market value of listed shares is calculated based on the closing share price at end of term x outstanding shares (excluding treasury stock) at end of
term
・ For cash flows, “Cash flows from operating activities” from the consolidated cash flow statements are used. Interest-bearing liabilities include all
liabilities on the balance sheets that incur interest. For the interest payments, the “Interest paid” on the consolidated cash flow statement is used.
(※) For reference, the figures are cash flows where 100% of AG’s financial result are taken.
(4) Basic policy concerning profit appropriation and dividend payment
The DMG MORI Group strives to enhance corporate value for our shareholders, who understand that machine tools are both capital assets and
products which need longer period of investment cycle, from 10 to 20 years. Our principle for profit appropriation is stable and continuous payment of
dividend based on an overall judgment concerning our future business plan, business results, financial conditions, and so on.
For internal reserve, we continue to invest in the development of pivotal new products and technologies as well as consolidating our production
equipment in order to reinforce our competitive strength in the market.
For FY 2016, we issued an interim dividend per share of 13 yen and year-end dividend per share of 13 yen, for a full-year total of 26 yen.
For FY 2017 we plan to issue an interim dividend per share of 15 yen and year-end dividend per share of 15 yen, for a full-year total of 30 yen.

8
2.Management policy
(1) Basic management policy
Our basic management policy as a machine tool manufacturer is: “we provide customers with innovative, accurate and trouble-free machines at
competitive prices.” Along with the rise of IoT and Industry 4.0, we aim to become an essential total solution provider in the fields of turning centers,
machining centers, multi-axis machines and grinding machines as well as systematization, automation and intelligence of engineering-fused
machines.
(2) Management targets
The DMG MORI CO., LTD. Group seeks to maintain and continue the status of Global One in the machine tool industry by responding quickly to rapid
changes in the business environment and market trends. We believe that improving our profit margin and capital profitability and strengthening our
financial strength are essential in achieving our pursuit. The Group continues its untiring efforts to create customer value and further improve its
corporate value.
(3) Company's medium to long-term management strategies
With differences in economic development levels, financial problems, fluctuations in exchange rates, natural disasters and geopolitical risks arising in
the global markets, manufactures are now entering a new phase in production innovation and relocation of management resources. At the same time,
machine tool manufacturers are required to meet customers’ ever-diversifying requirements that include not only the provision of high-precision,
high-performance machines, but also expansion of operation and engineering support, education and after-sales services. We, at the DMG MORI
CO., LTD. Group, respond flexibly to changes in the business environment and customer needs by fully utilizing our robust sales and service
networks and technical expertise we have cultivated for years.
DMG MORI CO (hereafter CO) and DMG MORI AG (hereafter AG) target to strengthen the development of cutting-edge technologies, to create new
customer value that combines our own products and IT, to provide more intelligent products faster and efficiently, to provide best solutions and
service for each customer and to keep on evolving.
CO and AG have been promoting collaboration in fields including sales, development, purchasing and production since March 2009, and having
reached the conclusion that it would be best for the two companies to be operated in an integrated manner in terms of capital too in order to create
further corporate value, and as a result of coming into force of domination agreement, we realized complete business integration of the two
companies, which enables us to fully make the most of the integrated group-wide resources.
For product development, the Group will enhance solution products around IoT and Industry 4.0. By utilizing these solutions and state-of-the-art IT
technologies, we will contribute to our customers’ improvement of productivity and profitability. Also, the collaboration with AG has enabled us to
include their machines in our product lineup and with a joint development, we improve an ability of making proposals to existing customers while
attracting new and potential customers. While CO and AG also concentrate on standardization of machine components and consolidation of machine
models, we will strive to improve profitability by providing solution with the most use of application.
As for production, through integration with AG, we established manufacturing bases in four strategic locations around the world: Japan, North
America, Europe and China, and make every effort to quickly respond to needs at location of demand and reduce exchange rate impact on operating
results. We will continue to strive to deliver the best products and services more quickly to our customers by implementing production at location of
demand and reduction of delivery time.
In sales development, through integration of sales with AG, the two companies are building a stronger sales and service system while continuing to
consolidate a dominant position in the industry in terms of the number of clients, the provision of solutions and services, and so on. We are also
utilizing the sales system of AG, which has strengths in marketing and direct sales, to roll out efficient and effective sales activities and forge more
robust relations with the customers.
Under this management policy, the DMG MORI Group remains committed to creating customer value and building a competitive advantage in terms

9
of business scale, profitability and financial base in the machine tool industry, aiming to further improve its corporate value.
(4) Challenges facing the company
① Product development
We implement efficient product development by making the most of the technologies and technical expertise we have accumulated both in Japan
and Germany. We also work on the consolidation of machine models between CO and AG, along with the unification of the machine exterior design,
aiming to increase productivity and to offer even better service. In an effort to provide customers with a wider range of solutions, we are now
concentrating on the development of embedded software and Technology Cycles that facilitates measurements, gear cutting and high-precision
machining, while promoting production automation and systemization. Other areas on which we place importance include predictive maintenance
and the provision of optimal machining conditions, and we work on these issues by taking advantage of the sensing technology and IoT.
② Quality
We regard all of our activities that make us relate with customers through our products, from product planning and sales to service, as “quality,” and
each and every staff makes a daily effort to further improve it. With the motto of “giving customers a great excitement and impression through
incomparable quality,” we will manufacture products in such a manner that close attention is always paid to every inch of each product. Also, we are
committed to consolidating development, production, service and sales processes, and performing various activities for improvement so that
customers will be able to feel the same high-quality in the products manufactured in any of our factories located in Japan, Europe, USA and China.
③ Trade controls for security
As there has been mounting uncertainty surrounding the world’s national security environment, especially in Asia, Middle East and Eastern Europe
regions in recent years, the non-proliferation of weapons of mass destruction and the prevention of excessive stockpiling of conventional weapons
became one of the growing international interests. To address the issue, the DMG MORI CO., LTD. Group has stipulated internal regulations
(Compliance Program) to ensure compliance with export control laws and applies them strictly. In addition, we have our machines equipped with the
device to detect and disable a machine if the machine is relocated from the site where it was originally installed, aiming to prevent the illegal export of
our products. We will continue to tackle the security trade control as our priority.
④ Compliance with the Law
Our board members give explicit instructions to the employees on implementation of the corporate activities in thorough compliance with the law and
corporate ethics. We create a plan for various educational training and implement the training on a continuing basis in an attempt to increase
awareness of law in all of our employees including the board members. For greater globalization of our business, we strive to establish a solid law
compliance system in our global bases as well as domestic ones. With the Internal Auditing Department in the key role, we already have established
the system to regularly monitor our law compliance activities, so we will continuously work on consolidation of our internal control.
⑤ Cooperation with DMG MORI AG
We established a business and capital partnership with AG, a largest machine tool manufacturer in Europe, in March 2009 with the aim to take a
greater leap in the global market. Since then both companies have been promoting consolidation of sales and service bases and strengthening the
collaboration in the area of parts supply, joint development and financing services for customers. In August, 2016, as a result of registration of
domination agreement under German Company law, we realized the legal business integration of the two companies. We will continue integrated
management of the two companies and keep up our efforts to enhance the corporate value, through utilizing worldwide resources CO and AG have.
3. Basic policy for selection of accounting standards
We voluntarily introduced the International Financial Reporting Standards (“IFRS”) in place of Japanese GAAP to improve international comparability
of financial information starting from the FY2015.
10
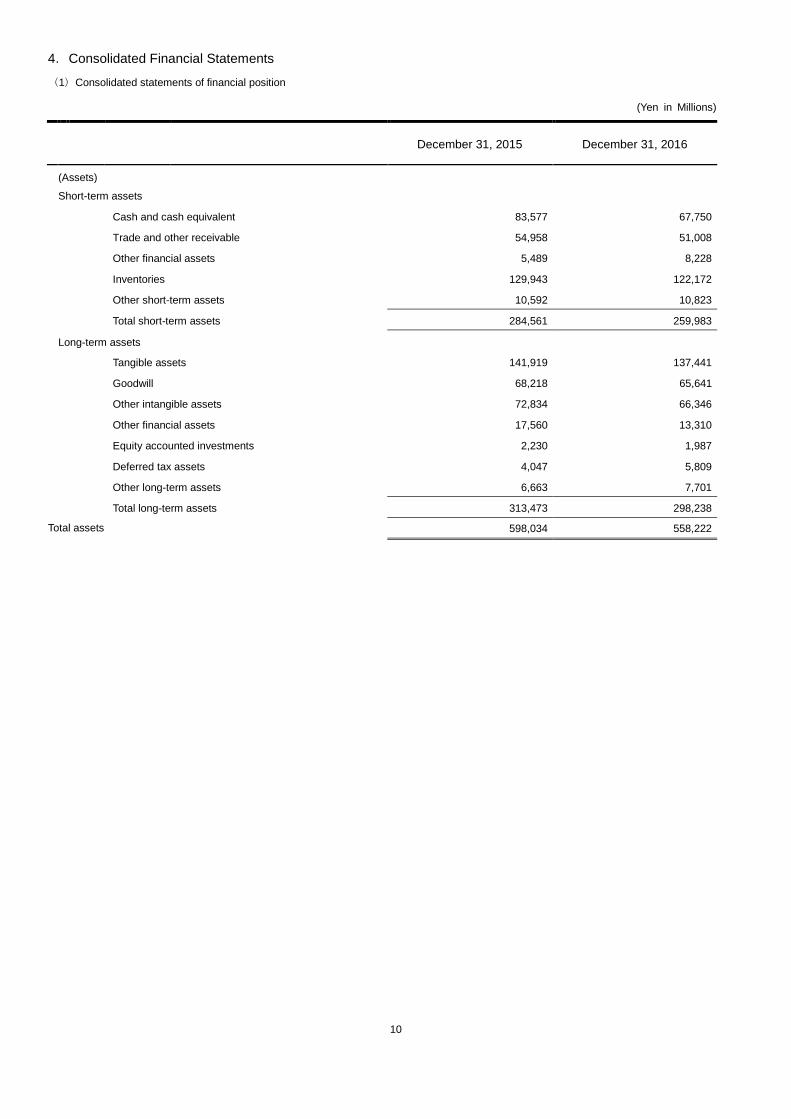
4.Consolidated Financial Statements
(1)Consolidated statements of financial position
(Yen in Millions)
December 31, 2015 December 31, 2016
(Assets)
Short-term assets
Cash and cash equivalent 83,577 67,750
Trade and other receivable 54,958 51,008
Other financial assets 5,489 8,228
Inventories 129,943 122,172
Other short-term assets 10,592 10,823
Total short-term assets 284,561 259,983
Long-term assets
2ee
72
Tangible assets 141,919 137,441
Goodwill 68,218
65,641
Other intangible assets 72,834 66,346
Other financial assets
Inn
17,560 13,310
Equity accounted investments 2,230 1,987
Deferred tax assets 4,047 5,809
Other long-term assets 6,663 7,701
Total long-term assets 313,473 298,238
Total assets 598,034 558,222
11
(Yen in Millions)
December 31, 2015 December 31, 2016
(Liabilities)
Short-term liabilities
Trade and other payables 66,648 55,861
Bonds and borrowings 100,692 45,960
Payment received on accounts 18,757 26,683
Other short term financial liabilities 780 14,796
Accrued income taxes 5,733 5,409
Short-term provisions 25,752 26,045
Other short term liabilities 5,385 5,505
Total short-term liabilities 223,750 180,261
Long-term liabilities
Bonds and borrowings 116,210 160,820
Other long-term financial liabilities 4,307 94,824
Pension provisions 6,224 6,200
Other long-term provisions
K
4,788 4,088
Deferred income taxes 8,664 7,309
Other long-term liabilities 1,980 2,234
Total long-term liabilities 142,175 275,477
Total liabilities 365,926 455,739
(Equity)
Subscribed capital 51,115 51,115
Capital provision 53,057 -
Hybrid Capital - 49,505
Treasury stock △23,768 △23,769
Revenue provisions 71,466 34,863
Other components of equity 3,399 △11,266
Total equity attributable to owners
of the parent company 155,270 100,449
Minority interests’ share of equity 76,837 2,033
Total equity 232,107 102,482
Total liabilities and equity 598,034 558,222

12
(2)Consolidated statements of income
(Yen in Millions)
Comparable period of
fiscal year ended December
31,2016
(January 1, 2015 through
December 31, 2015)
Fiscal Year 2016
(January 1, 2016 through
December 31, 2016)
Revenue
Sales revenues 374,290 376,631
Gains on step acquisition 37,296 -
Other operating revenues 6,312 9,175
Operating performance 417,898 385,806
Cost
Changes in finished goods and work in progress (*) 7,293 5,604
Cost of raw materials, consumables and goods resale (*) 168,185 165,662
Personnel costs (*) 102,326 114,121
Depreciation (*) 16,278 17,691
Other operating expenses (*) 83,846 80,765
Total cost 377,930 383,845
Operating result 39,968 1,961
Financial income 477 711
Financial expense 2,235 3,935
Share of profits of at equity-accounted investments 809 196
Earnings or losses before taxes 39,019 △1,064
Income taxes 3,818 4,684
Net income or loss 35,200 △5,749
Income attributable to:
Owners of the parent company 32,985 △7,826
Minority interests 2,215 2,077
Net income or loss 35,200 △5,749
Income per share
Basic earnings or losses per share (yen) 264.99 △67.80
Diluted earnings or losses per share (yen) 264.99 △67.80
(*) Since AG is consolidated from April 1st, 2015, a part of consolidated business results of comparable period (January 1, 2015 through March 31,
2015) does not include business results of AG. If operating results of AG is fully incorporated in this accounting period, costs will be displayed as
follows: Changes in finished goods and work in progress 3,620 million yen, Cost of raw materials, consumables and goods for resale 194,844 million
yen, Personnel costs 119,982 million yen, Depreciation and amortization 17,887 million yen, and Other operating expenses 95,700 million yen.
(Note) The figures of comparable period (January 1 through December 31, 2015) are not subject to annual audit review procedures based on the
Financial Instruments and Exchange Act.

13
(3)Consolidated statements of comprehensive income
(Yen in Millions)
Comparable period of
fiscal year ended
December 31,2016
(January 1, 2015 through
December 31, 2015)
Fiscal year ended
December 31, 2016
(January 1, 2016 through
December 31, 2016)
Net income or loss 35,200 △5,749
Other comprehensive income
Items never reclassified to income statement
New calculation of benefit-oriented pension plans
△553 △120
Sum of items never reclassified to income statement △553 △120
Items that will be reclassified to profit or loss
Differences from currency translation △5,801 △20,099
Changes in market value of hedging instruments 347 △67
Change in the fair value measurement of available-for-sale assets 575 △1,734
Share of other comprehensive income of associates accounted △6,380 △0
for using equity method
Sum of items which are reclassified to the income statement △11,259 △21,901
Total other comprehensive income △11,813 △22,022
Total comprehensive income 23,387 △27,771
Total comprehensive income attributable to:
Owners of the parent company 21,412 △22,412
Minority interests 1,974 △5,359
Total 23,387 △27,771
14
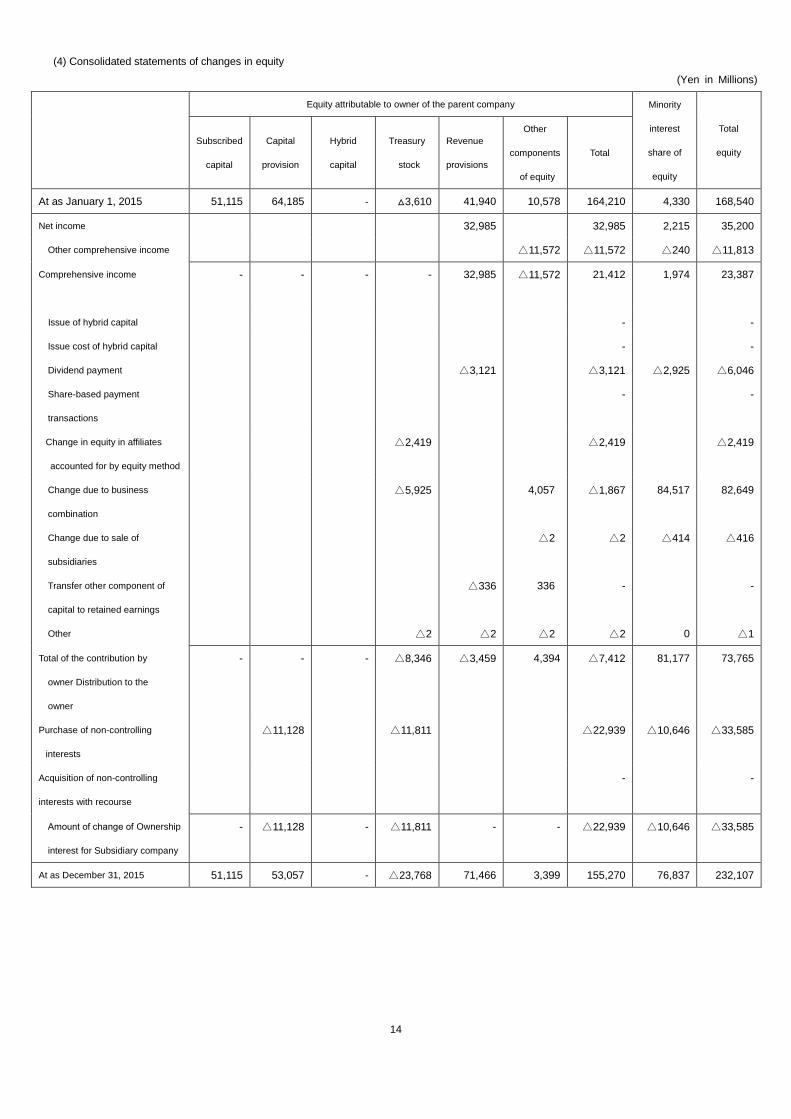
(4) Consolidated statements of changes in equity
(Yen in Millions)
Equity attributable to owner of the parent company Minority
interest
share of
equity
Total
equity
Subscribed
capital
Capital
provision
Hybrid
capital
Treasury
stock
Revenue
provisions
Other
components
of equity
Total
At as January 1, 2015 51,115 64,185 - △3,610 41,940 10,578 164,210 4,330 168,540
Net income 32,985 32,985 2,215 35,200
Other comprehensive income △11,572 △11,572 △240 △11,813
Comprehensive income
- - - - 32,985 △11,572 21,412 1,974 23,387
Issue of hybrid capital - -
Issue cost of hybrid capital - -
Dividend payment
Share-based payment
transactions
△3,121 △3,121
-
△2,925
△6,046
-
Change in equity in affiliates
accounted for by equity method
△2,419 △2,419 △2,419
Change due to business
combination
Change due to sale of
subsidiaries
Transfer other component of
capital to retained earnings
Other
△5,925
△2
△336
△2
4,057
△2
336
△2
△1,867
△2
-
△2
84,517
△414
0
82,649
△416
-
△1
Total of the contribution by
owner Distribution to the
owner
- - - △8,346 △3,459 4,394 △7,412 81,177 73,765
Purchase of non-controlling
interests
△11,128 △11,811 △22,939 △10,646 △33,585
Acquisition of non-controlling
interests with recourse
- -
Amount of change of Ownership
interest for Subsidiary company
- △11,128 - △11,811 - - △22,939 △10,646 △33,585
At as December 31, 2015 51,115 53,057 - △23,768 71,466 3,399 155,270 76,837 232,107
15
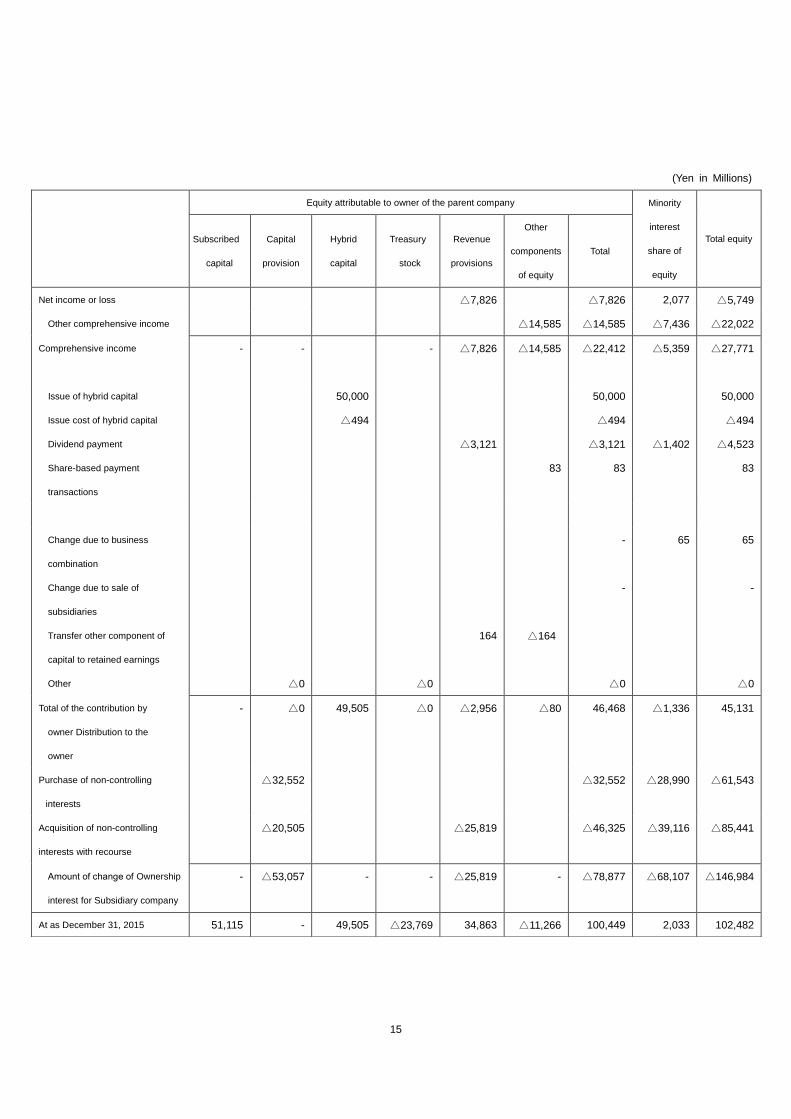
(Yen in Millions)
Equity attributable to owner of the parent company Minority
interest
share of
equity
Total equity Subscribed
capital
Capital
provision
Hybrid
capital
Treasury
stock
Revenue
provisions
Other
components
of equity
Total
Net income or loss △7,826 △7,826 2,077 △5,749
Other comprehensive income △14,585 △14,585 △7,436 △22,022
Comprehensive income
- - - △7,826 △14,585 △22,412 △5,359 △27,771
Issue of hybrid capital 50,000 50,000 50,000
Issue cost of hybrid capital △494 △494 △494
Dividend payment
Share-based payment
transactions
△3,121
83
△3,121
83
△1,402
△4,523
83
Change due to business
combination
Change due to sale of
subsidiaries
Transfer other component of
capital to retained earnings
Other
△0
△0
164
△164
-
-
△0
65
65
-
△0
Total of the contribution by
owner Distribution to the
owner
- △0 49,505 △0 △2,956 △80 46,468 △1,336 45,131
Purchase of non-controlling
interests
△32,552 △32,552 △28,990 △61,543
Acquisition of non-controlling
interests with recourse
△20,505 △25,819 △46,325 △39,116 △85,441
Amount of change of Ownership
interest for Subsidiary company
- △53,057 - - △25,819 - △78,877 △68,107 △146,984
At as December 31, 2015 51,115 - 49,505 △23,769 34,863 △11,266 100,449 2,033 102,482
16
(5) Consolidated statements of cash flows
(Yen in Millions)
Comparable period of
fiscal year ended December
31,2016
(January 1, 2015 through
December 31, 2015)
Fiscal year ended
December 31, 2016
(January 1, 2016 through
December 31, 2016)
Cash flow from operating activities
Earnings or losses before taxes
Depreciation
Gain on step acquisition
Loss (gain) on sales/disposal of long-term assets (△: increase)
Financial results
Equity in loss (earnings) of equity method
Other income and expense not affecting payments
Changes in Inventories (△: increase)
Changes in trade and other receivables (△: increase)
Changes in trade and other payables (△: decrease)
Change in provisions
Others
39,019
16,278
△37,296
△77
1,757
△809
971
5,905
△687
13,635
1,272
3,593
△1,064
17,691
-
716
3,223
△196
4,188
2,065
1,331
△7,480
2,086
4,110
Sub total 43,563 26,672
Interest received
Dividends received
Interest paid
Income tax paid
137
497
△2,143
△10,329
373
341
△3,049
△6,100
Cash flow from operating activities 31,725 18,237
Cash flow from investment activities
Amount paid out for acquisition of tangible assets
Amount received from the sale of tangible assets
Amount paid out for acquisition of intangible assets
Amount paid out for acquisition of shares of subsidiaries
Amount paid out for acquisition of shares of affiliates
Amount received from sale of investments in securities
Other
△21,315
1,592
△5,312
△5,091
△50,634
1,605
△16
△11,607
1,507
△3,634
△1,047
-
4,963
△189
Cash flow from investment activities △79,173 △10,008
17
(Yen in Millions)
Comparable period of
fiscal year ended December
31,2016
(January 1, 2015 through
December 31, 2015)
Fiscal year ended
December 31, 2016
(January 1, 2016 through
December 31, 2016)
Cash flow from financing activities
Net increase (decrease) in short-term loans payable
Amount received from long-term loans
Payments for long-term loans
Amount received from issue of bonds
Redemption of corporate bonds
Amount received from issue of hybrid capital
Dividends paid
Dividends paid for minority shareholders
Payments for acquisition of minority shares
Payments for the obligations for minority interests
Other
65,721
104,725
△10,875
-
-
-
△3,271
△2,782
△28,861
-
△554
△58,978
59,870
△16,765
29,872
△15,000
49,505
△3,118
△1,392
△61,543
△267
△559
Cash flow from financing activities 124,102 △18,376
Differences from currency translation associated with cash and
cash equivalents
△1,642 △5,678
Increase (decrease) in cash and cash equivalents 75,011 △15,826
Opening balance of cash and cash equivalents 8,566 83,577
Cash and cash equivalents at the end of the period 83,577 67,750
18
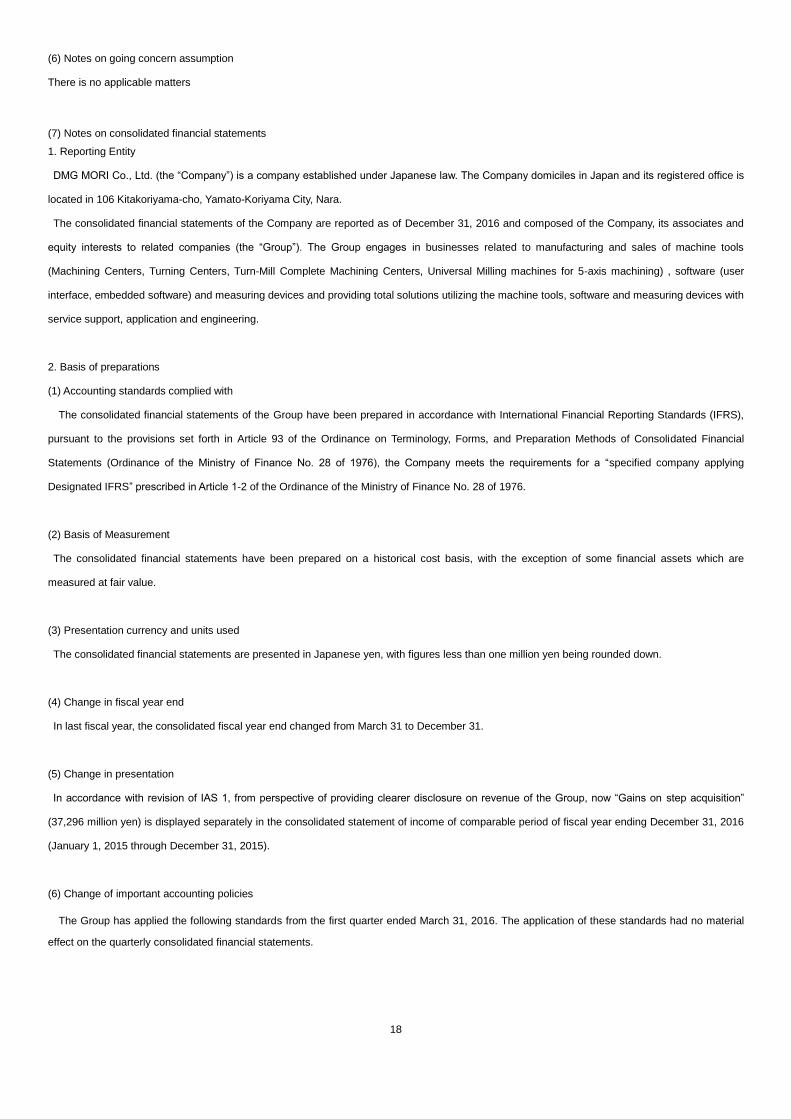
(6) Notes on going concern assumption
There is no applicable matters
(7) Notes on consolidated financial statements
1. Reporting Entity
DMG MORI Co., Ltd. (the “Company”) is a company established under Japanese law. The Company domiciles in Japan and its registered office is
located in 106 Kitakoriyama-cho, Yamato-Koriyama City, Nara.
The consolidated financial statements of the Company are reported as of December 31, 2016 and composed of the Company, its associates and
equity interests to related companies (the “Group”). The Group engages in businesses related to manufacturing and sales of machine tools
(Machining Centers, Turning Centers, Turn-Mill Complete Machining Centers, Universal Milling machines for 5-axis machining) , software (user
interface, embedded software) and measuring devices and providing total solutions utilizing the machine tools, software and measuring devices with
service support, application and engineering.
2. Basis of preparations
(1) Accounting standards complied with
The consolidated financial statements of the Group have been prepared in accordance with International Financial Reporting Standards (IFRS),
pursuant to the provisions set forth in Article 93 of the Ordinance on Terminology, Forms, and Preparation Methods of Consolidated Financial
Statements (Ordinance of the Ministry of Finance No. 28 of 1976), the Company meets the requirements for a “specified company applying
Designated IFRS” prescribed in Article 1-2 of the Ordinance of the Ministry of Finance No. 28 of 1976.
(2) Basis of Measurement
The consolidated financial statements have been prepared on a historical cost basis, with the exception of some financial assets which are
measured at fair value.
(3) Presentation currency and units used
The consolidated financial statements are presented in Japanese yen, with figures less than one million yen being rounded down.
(4) Change in fiscal year end
In last fiscal year, the consolidated fiscal year end changed from March 31 to December 31.
(5) Change in presentation
In accordance with revision of IAS 1, from perspective of providing clearer disclosure on revenue of the Group, now “Gains on step acquisition”
(37,296 million yen) is displayed separately in the consolidated statement of income of comparable period of fiscal year ending December 31, 2016
(January 1, 2015 through December 31, 2015).
(6) Change of important accounting policies
The Group has applied the following standards from the first quarter ended March 31, 2016. The application of these standards had no material
effect on the quarterly consolidated financial statements.
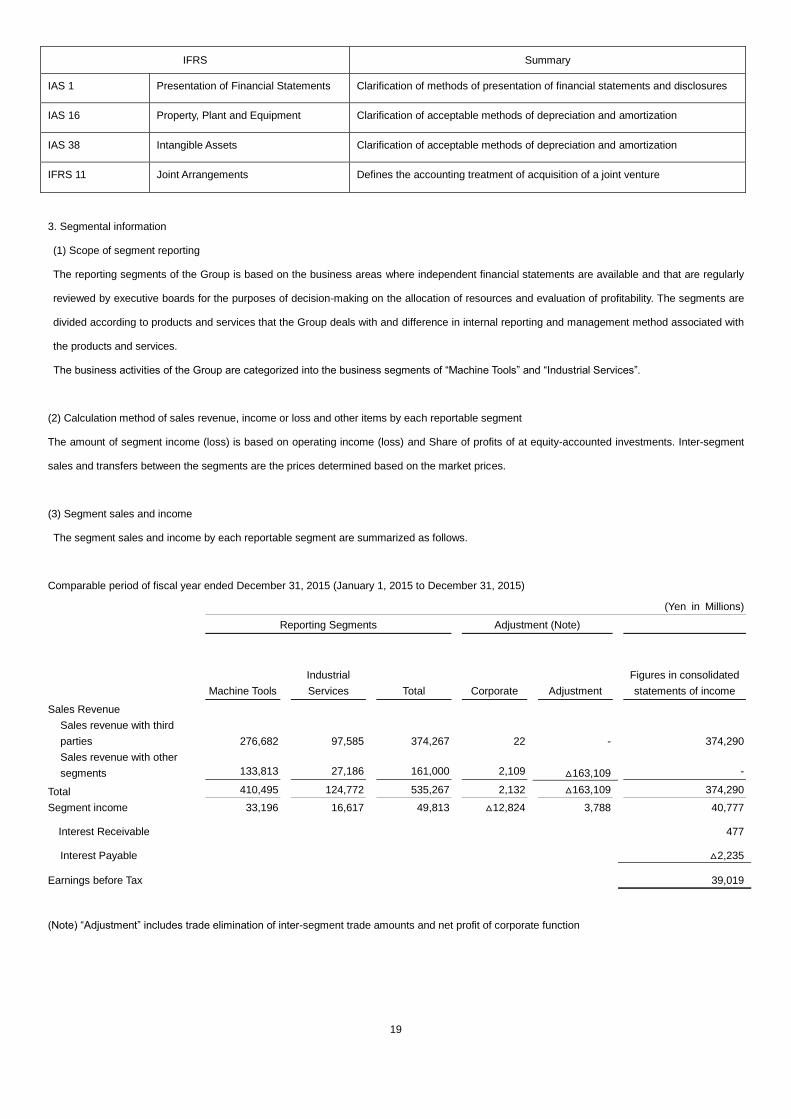
19
IFRS Summary
IAS 1 Presentation of Financial Statements Clarification of methods of presentation of financial statements and disclosures
IAS 16 Property, Plant and Equipment Clarification of acceptable methods of depreciation and amortization
IAS 38 Intangible Assets Clarification of acceptable methods of depreciation and amortization
IFRS 11 Joint Arrangements Defines the accounting treatment of acquisition of a joint venture
3. Segmental information
(1) Scope of segment reporting
The reporting segments of the Group is based on the business areas where independent financial statements are available and that are regularly
reviewed by executive boards for the purposes of decision-making on the allocation of resources and evaluation of profitability. The segments are
divided according to products and services that the Group deals with and difference in internal reporting and management method associated with
the products and services.
The business activities of the Group are categorized into the business segments of “Machine Tools” and “Industrial Services”.
(2) Calculation method of sales revenue, income or loss and other items by each reportable segment
The amount of segment income (loss) is based on operating income (loss) and Share of profits of at equity-accounted investments. Inter-segment
sales and transfers between the segments are the prices determined based on the market prices.
(3) Segment sales and income
The segment sales and income by each reportable segment are summarized as follows.
Comparable period of fiscal year ended December 31, 2015 (January 1, 2015 to December 31, 2015)
(Yen in Millions)
Reporting Segments Adjustment (Note)
Machine Tools
Industrial
Services Total Corporate
Adjustment
Figures in consolidated
statements of income
Sales Revenue
Sales revenue with third
parties 276,682 97,585 374,267 22
- 374,290
Sales revenue with other
segments 133,813 27,186 161,000 2,109
△163,109 -
Total 410,495 124,772 535,267 2,132 △163,109 374,290
Segment income 33,196 16,617 49,813 △12,824 3,788 40,777
Interest Receivable 477
Interest Payable △2,235
Earnings before Tax 39,019
(Note) “Adjustment” includes trade elimination of inter-segment trade amounts and net profit of corporate function

20
Cumulative fiscal year ended December 31, 2016 (January 1, 2016 to December 31, 2016)
(Yen in Millions)
Reporting Segments Adjustment (Note)
Machine Tools
Industrial
Services Total Corporate
Adjustment
Figures in consolidated
statements of income
Sales Revenue
Sales revenue with third
parties 267,873 108,731 376,604 26
- 376,631
Sales revenue with other
segments 120,711 24,628 145,340 2,629
△147,969 -
Total 388,585 133,359 521,945 2,655 △147,969 377,449
Segment income 11,669 1,777 13,446 △11,678 390 2,158
Interest Receivable 711
Interest Payable △3,935
Earnings before Tax △1,064
(Note) “Adjustment” includes trade elimination of inter-segment trade amounts and net profit of corporate function
4. Net income per share
Basis of calculation for basic net income per share and diluted net income per share is as follows:
Items
Comparable period of
fiscal year ended December 31,2016
(January 1, 2015 through
December 31, 2015)
Fiscal year ended
December 31, 2016
(January 1, 2016 to
December 31, 2016)
Net income or loss attributable to owners of the
parent company (million yen)
Income not attributable to owners of the parent
company
32,985
-
△7,826
311
Net income or loss attributable to owners of the
parent company using for calculation for basic net
income per share (million yen)
Net income adjustments based on which diluted
net income per share is calculated (million yen)
Diluted net income or loss (million yen)
32,985
-
32,985
△8,137
-
△8,137
Average number of common stocks in the fiscal year
(thousand stocks)
Increase in common stocks based on which diluted
net income per share is calculated (thousand
stocks)
Increase by stock option (thousand stocks)
Average number of common stocks based on which
diluted net income per share is calculated (thousand
stocks)
124,479
-
124,479
120,019
-
120,019

21
Items
Comparable period of
fiscal year ended December 31,2016
(January 1, 2015 through
December 31, 2015)
Fiscal year ended
December 31, 2016
(January 1, 2016 to
December 31, 2016)
Basic net income or loss per share (yen)
Diluted net income or loss per share (yen)
264.99
264.99
△67.80
△67.80
(Note)
・Diluted net income per share for the comparable period of fiscal year ended December 31, 2016 is same as basic net income per share, because
there is no dilutive share. Also, diluted net income per share for the fiscal year ended December 31, 2016 is same as basic net income per share,
because there is no dilutive share.
・The figures of comparable period (January 1 through December 31, 2015) are not subject to annual audit review procedures based on the Financial
Instruments and Exchange Act.
5. Domination, Profit and Loss Transfer Agreement
(1) Entry into force of Domination, Profit and Loss Transfer Agreement comes into effect
On August 24, 2016, the Domination, Profit and Loss Transfer Agreement (hereinafter “DPLTA”) between DMG MORI GmbH (hereinafter “GmbH”),
one of our consolidated subsidiary, and AG came into effect.
DPLTA is contract in German Company Law, which enables an entity to give a direct instruction to decision-making body, normally board meeting, of
other entity. Also, under DPLTA all profit or loss will be transferred to GmbH.
Shareholders of AG except for GmbH (hereinafter “external shareholders”) have two options; to claim purchase of their own shares of AG or receive
compensation payment continuously. For claim of purchasing shares of AG to GmbH, GmbH has obligation to purchase them for the price of 37.35
Euro per share. Also GmbH has obligation to pay compensation of 1.17 Euro per share annually to external shareholders who don’t claim repurchase
to GmbH.
At first, GmbH had had to accept purchase claims of AG stocks for 2 months from the date of entry into force of DPLTA. But some external
shareholders filed the allegation of re-evaluation of purchase price and annual compensation payment amount to the court, so re-purchase period of
AG stocks is extended to the date after 2 months from notification of ending of trial, based on German law. The Group considers the re-purchase
price of AG stocks and annual compensation amount as an appropriate price which is evaluated as fair value price by the external auditors appointed
by German court.
(2) Outline of accounting
Due to entry into force of DPLTA, the Group recognizes present value of future payment as other financial liabilities.
As a result, following fluctuations in liabilities, minority interests, capital provision and revenue provisions are recognized;
Increase of liabilities : 85,441 million yen
Decrease of minority interests : 39,116 million yen
Decrease of capital provision : 20,505 million yen
Decrease of revenue provisions : 25,819 million yen
Also, as a result of revaluation of discounted present value of future obligation of payment to external shareholders at the end of fiscal year ended
December 31, 2016, the Group recognized 2,687 million yen of other financial liabilities (short-term), 90,114 million yen of other financial liabilities
(long-term) in consolidated statements of financial position and 700 million yen of financial expenses in consolidated statements of income,
respectively.
6. Hybrid Capital
The Company raised funds by 40 billion yen of a perpetual subordinated loan (hereinafter “the subordinated loan”) and 10 billion yen of a perpetual
subordinated bonds (hereinafter “the subordinated bonds”) in August, 2016.
The subordinated loan and the subordinated bonds are classified as an equity instrument as no specific date is specified for repayment of the

22
principal and optional deferral of interest payments is possible. The amount financed from the subordinated loan and the subordinated bonds after
deducting issue costs are recorded as "Hybrid capital" under “Equity” in the consolidated financial statements.
1. Overview of Subordinated Loan
(1). Amount 40 billion yen
(2). Lender Mizuho Bank, Ltd., Sumitomo Mitsui Banking Corporation
(3) Execution date September 20, 2016
(4). Repayment date No repayment date specified.
Provided, however, that on each interest payment date from September 20, 2021 onward, optional repayment
of all or part of the principal is possible.
(5) Interest rate From September 20, 2016 to September 20, 2026: Variable interest based on 6-month Japanese yen TIBOR
From September 21, 2026 onward: Variable interest stepped up by 1.00%.
(6) Clauses relating to payment of interest
Optional deferral of interest payment is possible.
(7) Subordinated
loan clause
Creditors of the subordinated loan have right to claim payment that is subordinate to all senior creditors in case
of subordinate events subject to loan contract (liquidation, etc.)
2. Overview of Subordinated Bonds
(1). Amount 10 billion yen
(2) Execution date September 2, 2016
(3). Repayment date No repayment date specified.
Provided, however, that on each interest payment date from September 2, 2021 onward, optional repayment of
all principal is possible.
(4) Interest rate From September 2, 2016 to September 2, 2021: Fixed interest
From September 3, 2021 onward: Variable interest based on 6-month Japanese yen LIBOR
(5) Clauses relating to payment of interest
Optional deferral of interest payment is possible.
(6) Subordinated
clause
Creditors of the subordinated loan have right to claim payment that is subordinate to all senior creditors in case
of subordinate events subject to loan contract (liquidation, etc.)
(7) Replacement
restrictions
When making optional repayment of the subordinated bonds, it is assumed that the subordinated bonds are
being replaced with an equity instrument that has received an equity credit evaluation from the ratings agency
that is the same as or higher than that of the subordinated bonds.
Provided, however, that if, after five years elapse, both of the following items are satisfied, it is possible to
cancel the replacement of the bonds with an instrument that has received equivalent equity credit evaluation.
(a) The consolidated shareholders’ equity after the adjustment is a higher amount than 151.2 billion yen.
(b) The consolidated equity capital ratio after the adjustment is higher than 26.8%.
The values stated above shall be calculated according to the following method.
(a) Consolidated shareholders’ equity after the adjustment = Total equity attributable to owners of parent -
Other components of equity - Hybrid capital

23
(b) Consolidated equity capital ratio after the adjustment = Consolidated shareholders’ equity after the
adjustment as calculated above ÷ Total assets
7. Significant subsequent events
Disposal, Repurchase and Cancellation of Treasury Stock
Following discussion and approval of a basic policy at a Board of Directors meeting on January 10, 2017, the Board of Directors of the Company
has passed a resolution in a meeting on January 13, 2017, pursuant to Article 370 of the Companies Act of Japan (resolutions based on documents
in lieu of resolutions by the Board of Directors) to dispose of the treasury stock by way of third-party allotment, to repurchase our stock pursuant to
Article 156 of the same act, as applied pursuant to paragraph 3, Article 165 of the same act, and to cancel our treasury stock pursuant to Article 178
of the same act by which the Company supports social contributions of Mori Manufacturing Research and Technology.
The disposition of our treasury stock is subject to the approval at the Company’s 69th annual shareholders meeting to be held in March 2017, and
the repurchase of our stock and cancellation of our treasury stock is subject to the approval of the disposition of our treasury stock at the
shareholders meeting.
1. About disposition of treasury shares
(1). Disposal quantity 3,500,000 common shares
(2). Disposal value 1 JPY per share
(3) Amount of funds
raised
3,500,000 JPY
(4). Subscription or
disposal method
Disposition by way of third-party allotment
(5) Trustee (planned) Japan Trustee Services Bank, Ltd.
(sub-trustee, with Sumitomo Mitsui Trust Bank, Limited as trustee)
(6) Disposal date March 31st, 2017.
(7) Subordinated
loan clause
The disposition of the treasury shares is conditional on the special resolution regarding advantageous
placement at the Company’s 69th annual meeting of shareholders.
2. Repurchase of stock
(1) Reason for repurchasing stock
To avoid dilution of share triggered by the disposition of treasury stock described in above, and to effect capital efficiency and agile capital policy in
view of the management environment.
(2) Details of matters relating to repurchase
a. Kind of stock to be repurchased Common stock of the Company
b. Total number of shares to be
repurchased
3,500,000 shares (maximum)
(Represents 2.92% of the total number of issued shares (excluding treasury stock))
c. Total purchase price for
repurchase of shares
5,250,000,000 JPY (maximum)
d.. Period of repurchase From the end of the Company’s 69th annual shareholders meeting to be held in March 2017 to
December 31, 2017
24
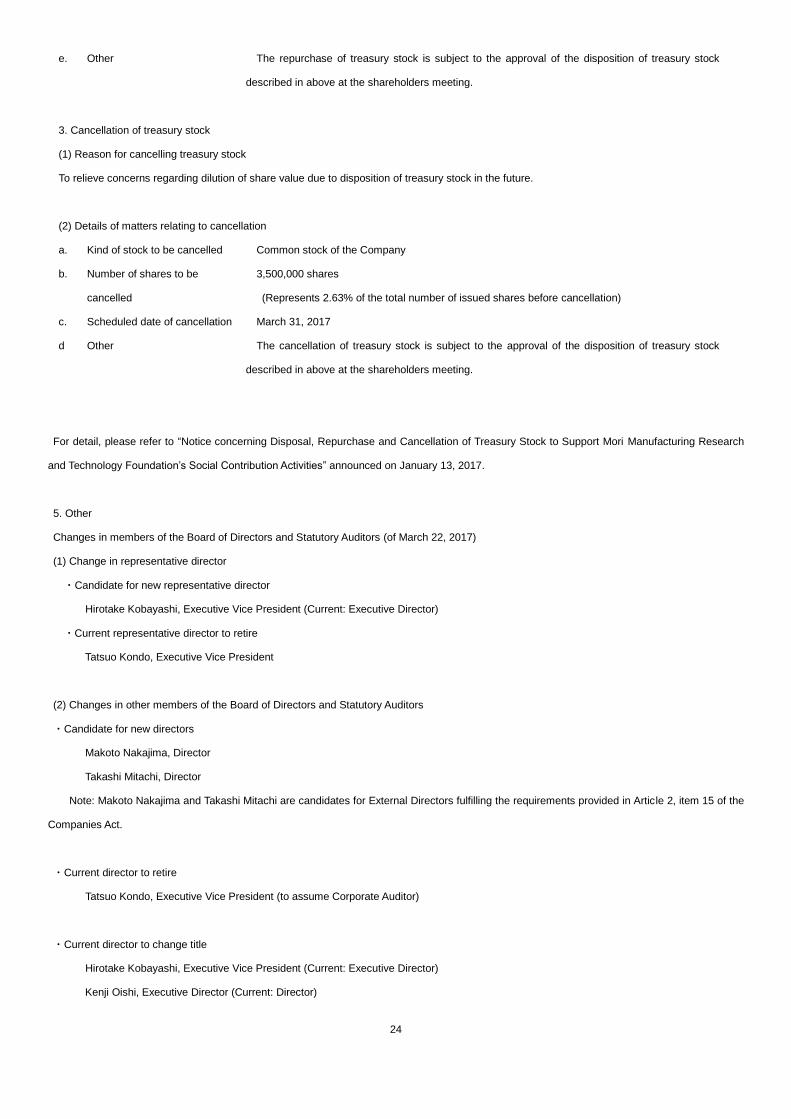
e. Other The repurchase of treasury stock is subject to the approval of the disposition of treasury stock
described in above at the shareholders meeting.
3. Cancellation of treasury stock
(1) Reason for cancelling treasury stock
To relieve concerns regarding dilution of share value due to disposition of treasury stock in the future.
(2) Details of matters relating to cancellation
a. Kind of stock to be cancelled Common stock of the Company
b. Number of shares to be
cancelled
3,500,000 shares
(Represents 2.63% of the total number of issued shares before cancellation)
c. Scheduled date of cancellation March 31, 2017
d
Other The cancellation of treasury stock is subject to the approval of the disposition of treasury stock
described in above at the shareholders meeting.
For detail, please refer to “Notice concerning Disposal, Repurchase and Cancellation of Treasury Stock to Support Mori Manufacturing Research
and Technology Foundation’s Social Contribution Activities” announced on January 13, 2017.
5. Other
Changes in members of the Board of Directors and Statutory Auditors (of March 22, 2017)
(1) Change in representative director
・Candidate for new representative director
Hirotake Kobayashi, Executive Vice President (Current: Executive Director)
・Current representative director to retire
Tatsuo Kondo, Executive Vice President
(2) Changes in other members of the Board of Directors and Statutory Auditors
・Candidate for new directors
Makoto Nakajima, Director
Takashi Mitachi, Director
Note: Makoto Nakajima and Takashi Mitachi are candidates for External Directors fulfilling the requirements provided in Article 2, item 15 of the
Companies Act.
・Current director to retire
Tatsuo Kondo, Executive Vice President (to assume Corporate Auditor)
・Current director to change title
Hirotake Kobayashi, Executive Vice President (Current: Executive Director)
Kenji Oishi, Executive Director (Current: Director)
25
・Candidate for new auditors
Tatsuo Kondo, Corporate Auditor (Current: Executive Vice President)
Sojiro Tsuchiya, Auditor
Note: Sojiro Tsuchiya is a candidate for External Auditor fulfilling the requirements provided in Article 2, item 16 of the Companies Act.