SUMMARY N 2012 Living Planet Report 2012 -...
40
1 • LIVING PLANET REPORT 2012 – ON THE ROAD TO RIO+20 Living Planet Report 2012 – SPECIAL EDITION – On the road to RIO+20 N IT 2012 SUMMARY
-
Upload
phungkhanh -
Category
Documents
-
view
218 -
download
1
Transcript of SUMMARY N 2012 Living Planet Report 2012 -...

1
• LIVING PLANET REPORT 2012 – ON THE ROAD TO RIO+20
Living Planet Report 2012– SPECIAL EDITION –
On the road to
RIO+20
NI T
2012
SUMMARY

2
© S
imon de Trey-W
hite / WW
F-UK
x
Women cutting grass, Khata, Nepal.

1
KEEPING THIS A LIVING PLANETThe 2012 edition of the Living Planet Report highlights the cumu-lative pressure we’re putting on the planet, and the consequent decline in the health of the forests, rivers and oceans that make our lives possible.
We are living as if we have an extra planet at our disposal. We are using 50 per cent more resources than the Earth can provide, and un-less we change course that number will grow very fast – by 2030, even two planets will not be enough. We do have the capacity to create a prosperous future that provides food, water and energy for the 9-10 billion people who are expected to share the planet in 2050, but only if all of us – governments, companies, communities, citizens – step up to this challenge.
In June 2012, the nations of the world, businesses and a broad sweep of civil society representa-tives will gather in Rio de Janeiro for the UN Conference on Sustain-able Development.
Twenty years after the mo-mentous Earth Summit, this meet-ing can and must be the moment for governments to set a new course toward sustainability. It is also a unique opportunity for coalitions of the committed to step up – govern-ments in regions like the Congo Ba-sin and the Arctic, joining together to manage the resources they share; companies which are competitors in the marketplace nonetheless joining forces to drive sustainability into their supply chains and offering products that help customers use less resources; and pension funds and sovereign wealth funds invest-ing in green jobs.
This supplement to the Living Planet Report looks at the environ-mental landscape 20 years after Rio, and highlights the need for us all to play a role in keeping this a living planet, by protecting the vibrant ecosystems that sustain life on Earth and provide food, water and energy for all.
Jim LeapeDirector General WWF International
2
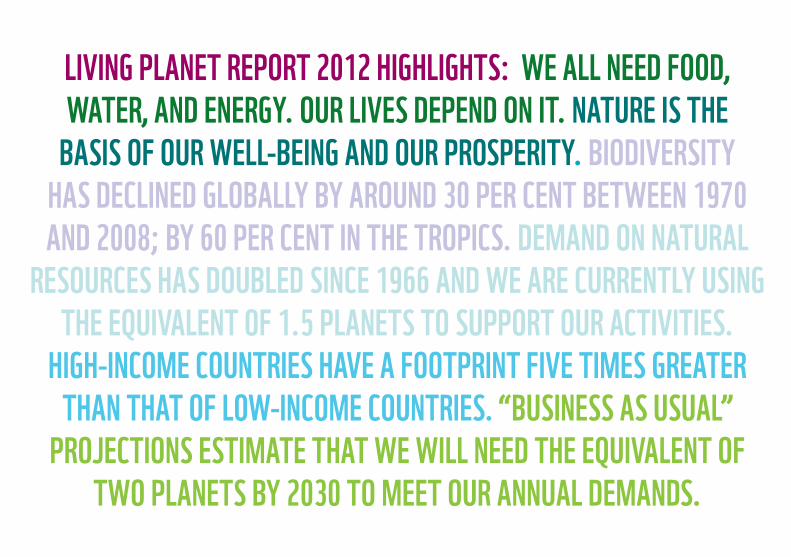
LIVING PLANET REPORT 2012 HIGHLIGHTS: WE ALL NEED FOOD, WATER, AND ENERGY. OUR LIVES DEPEND ON IT. NATURE IS THE
BASIS OF OUR WELL-BEING AND OUR PROSPERITY. BIODIVERSITY HAS DECLINED GLOBALLY BY AROUND 30 PER CENT BETWEEN 1970 AND 2008; BY 60 PER CENT IN THE TROPICS. DEMAND ON NATURAL
RESOURCES HAS DOUBLED SINCE 1966 AND WE ARE CURRENTLY USING THE EQUIVALENT OF 1.5 PLANETS TO SUPPORT OUR ACTIVITIES.
HIGH-INCOME COUNTRIES HAVE A FOOTPRINT FIVE TIMES GREATER THAN THAT OF LOW-INCOME COUNTRIES. “BUSINESS AS USUAL”
PROJECTIONS ESTIMATE THAT WE WILL NEED THE EQUIVALENT OF TWO PLANETS BY 2030 TO MEET OUR ANNUAL DEMANDS.

3
Twenty years ago, the Earth Summit in Rio brought more than 100 heads of state and government to the table. Over two weeks, they sought to refashion the world’s economic development to be green, fair and sustainable.
But what, ultimately, did it achieve? How has its agenda of sustainable development played out over the past 20 years? And will Rio+20, the conference taking place in the same city this June, be building upon its successes? Will leaders rise to the challenge at Rio+20, creating an updated vision of sustainable development, based on the lessons learned since Rio ’92, or will they pass the problem on to future generations, leaving them to atone for our present failures?
WWF believes that Rio+20 is a key opportunity for global lead-ers to reconfirm their commitment to creating a sustainable future for
all. This summary sets out the key findings of the Living Planet Report 2012, looks at the environmental developments since the 1992 sum-mit and outlines the need for a sig-nificant shift in global consumption patterns.
THE ROAD TO RIO+20
Rio 1992 created the Rio Declaration – 27 principles that define how the issues of environment and development should be dealt with. The Sustainable Development Goals (SDGs) proposed for agreement at Rio+20 provide a unique opportunity to align these agendas. They suggest a global, over-arching development framework to address some of the most pressing challenges of our time. WWF supports ambitious commitments that accelerate change and address struc-tural inequalities, enabling open and inclusive participation of stake-holders, and creating clear and measurable indicators that allow monitoring of progress. One strong message is that the SDG discus-sions must not detract from attainment of the Millennium Develop-ment Goals (MDGs) upon which many lives and livelihoods depend.
The r
oad t
o RIO+
20RIO+20 IS A KEY OPPORTUNITY FOR GLOBAL LEADERS TO CREATE A SUSTAINABLE FUTURE FOR ALL

4
Millions of diverse species thrive on Earth, forming the ecosystems and habitats upon which people and all life on our planet depend.
However humanity’s ever-growing demand for resources is putting tremendous pressures on the world’s biodiversity. At our cur-rent rate of consumption, the Earth needs 1.5 years to produce and re-plenish the natural resources that we consume in a single year.
The Living Planet Report 2012, produced by WWF in con-junction with ZSL and the Global Footprint Network, highlights an alarming rate of biodiversity loss – in total a 28 per cent global reduc-tion between 1970 and 2008.
This summary provides a special Rio+20 supplement of the ninth edition of WWF’s Living Planet Report (LPR) – a biennial publica-tion that documents the “state of the planet”. It highlights the chang-ing state of biodiversity, ecosystems and humanity’s demand on natural resources; and explores the implica-tions of these changes for biodiver-sity and humanity.
THE LIVING PLANET REPORT 2012 The Living Planet Report’s findings are based on two key indicators:•TheLivingPlanetIndex– this measures changes in the health of the planet’s ecosystems by tracking post-1970 trends of more than 9,000 populations of 2,688 vertebrate species.•TheEcologicalFootprint– an accounting framework that tracks humanity’s competing demands on the biosphere by comparing human demand against the regenerative capacity of the planet. The human demand is translated into global hectares (gha) – hectares that represent average global production and CO2 sequestration.
Linking the total Ecological Footprint to biocapac-ity – the Earth’s regenerative capacity – clearly indicates the extent to which we are exceeding our planet’s natural limits. The latest LPR shows that it takes 1.5 years for the Earth to regenerate the renewable resources that people use, and absorb the CO2 waste they produce, each year.The report also highlights that current trends can still be reversed, by making better choices that place the natural world at the centre of economies, business models and lifestyles.
The full report, and an executive summary, can be downloaded from wwf.panda.org/lpr
LIVING PLANET REPORT 2012
NI T
2012
REPORT
Living PlanetReport 2012Biodiversity, biocapacity and better choices
living planet cover+inside cover .indd 3 23-04-12 16:01
5
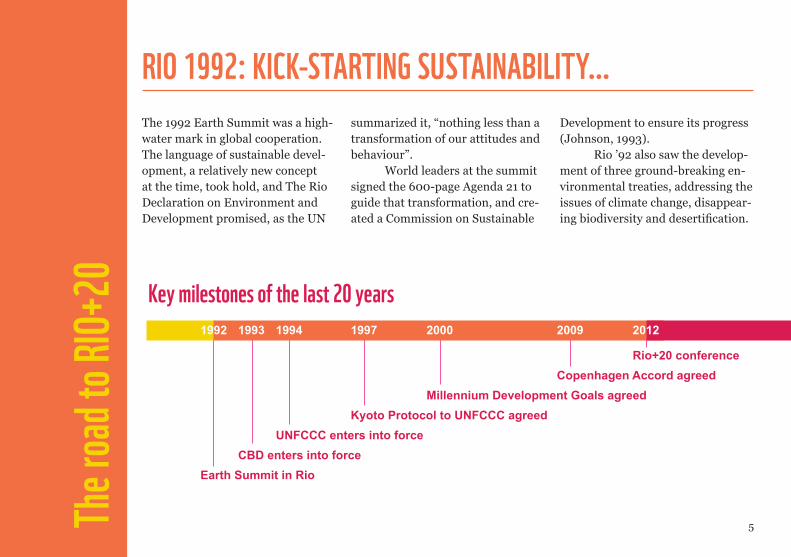
The 1992 Earth Summit was a high-water mark in global cooperation. The language of sustainable devel-opment, a relatively new concept at the time, took hold, and The Rio Declaration on Environment and Development promised, as the UN
summarized it, “nothing less than a transformation of our attitudes and behaviour”.
World leaders at the summit signed the 600-page Agenda 21 to guide that transformation, and cre-ated a Commission on Sustainable
Development to ensure its progress (Johnson, 1993).
Rio ’92 also saw the develop-ment of three ground-breaking en-vironmental treaties, addressing the issues of climate change, disappear-ing biodiversity and desertification.
RIO 1992: KICK-STARTING SUSTAINABILITY…
1992 1993 1994 1997 2000 2009 2012
Rio+20 conference Copenhagen Accord agreed Millennium Development Goals agreed Kyoto Protocol to UNFCCC agreed UNFCCC enters into force CBD enters into forceEarth Summit in Rio
Key milestones of the last 20 years
The r
oad t
o RIO+
20

6
© S
taffan Widstrand / W
WF
Polar Bears on sea ice, Canada.

7
The UN Framework Convention on Climate Change, pledged to prevent “dangerous climate change”. Five years later, it spawned the Kyoto Protocol, which set legally binding targets for most rich nations to cut emissions of the planet-warming gas carbon dioxide, and came into force despite the US subsequently pulling out.
For the 20 years since Rio, climate change has retained its place at the top of the global en-vironment agenda, with regular scientific reports from the Intergov-ernmental Panel on Climate Change seizing world attention. But, de-spite the Protocol and the headlines, CO2 emissions have kept on rising. Today, they are up 40 per cent on 1992 (UNEP, 2011). Perhaps most alarming is the fact that two-thirds of that increase happened in the second decade (UNEP, 2011).
As a result, CO2 levels in the atmos-phere have risen 9 per cent since Rio, and average temperatures are up about 0.4ºC (UNEP, 2011). The amount of sea ice in the Arctic at the end of each summer is down 35 per cent, with standout minima in 2007 and 2011 (UNEP, 2011).
For some, the Kyoto tar-gets were not enough and various countries have since enacted their own unilateral laws on emissions. Britain’s 2008 Climate Change Act, which requires an 80 per cent cut in carbon emissions by 2050, was the first to do so. Other countries, including Mexico, are now following suit with their own national climate legislation to guide the path to a low-carbon economy.
In 2009, 17 years after the Rio pledge to prevent dangerous climate change, the world’s govern-ments agreed in the Copenhagen
Accord that the goal should be to prevent average temperatures from rising by more than two degrees above pre-industrial levels.
To meet the two degrees goal, the UN Environment Programme has confirmed global emissions need to peak and start to fall well before 2020 to have a credible pros-pect of achieving the two degrees goal. UNEP also found that exist-ing emission reduction pledges for 2020 fall far short of what is neces-sary, and would probably lead to warming of 2.5-5ºC by the end of the century – which would be dev-astating for both nature and people (UNEP, 2011a). Following talks in Durban in late 2011, it now seems that a global deal to cap the major-ity of the world’s emissions may not come into force until 2020 at the earliest.
UN FRAMEWORK CONVENTION ON CLIMATE CHANGETh
e roa
d to R
IO+20
8
THE LIVING PLANET INDEX
0
1.0
2.0
Inde
x V
alue
(19
70 =
1)
1970 1975 1980 1985 1990 1995 2000 2005 2008Year
Key
Global Living Planet Index
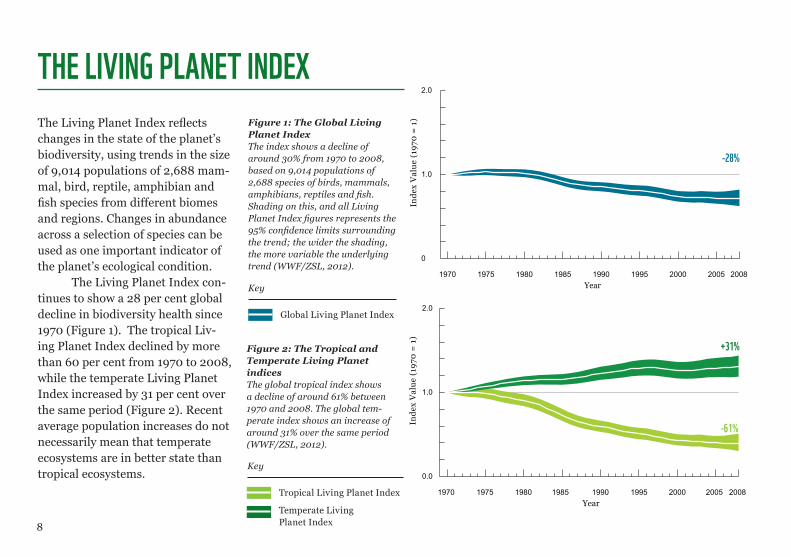
Figure 1: The Global Living Planet IndexThe index shows a decline of around 30% from 1970 to 2008, based on 9,014 populations of 2,688 species of birds, mammals, amphibians, reptiles and fish. Shading on this, and all Living Planet Index figures represents the 95% confidence limits surrounding the trend; the wider the shading, the more variable the underlying trend (WWF/ZSL, 2012).
0.0
1.0
2.0
1980 1985 1990 1995 2000 2005 2008Year
1970 1975
Inde
x V
alue
(19
70 =
1)
Key
Tropical Living Planet Index
Temperate Living Planet Index
The Living Planet Index reflects changes in the state of the planet’s biodiversity, using trends in the size of 9,014 populations of 2,688 mam-mal, bird, reptile, amphibian and fish species from different biomes and regions. Changes in abundance across a selection of species can be used as one important indicator of the planet’s ecological condition.
The Living Planet Index con-tinues to show a 28 per cent global decline in biodiversity health since 1970 (Figure 1). The tropical Liv-ing Planet Index declined by more than 60 per cent from 1970 to 2008, while the temperate Living Planet Index increased by 31 per cent over the same period (Figure 2). Recent average population increases do not necessarily mean that temperate ecosystems are in better state than tropical ecosystems.
Figure 2: The Tropical and Temperate Living Planet indicesThe global tropical index shows a decline of around 61% between 1970 and 2008. The global tem-perate index shows an increase of around 31% over the same period (WWF/ZSL, 2012).
Key
Global Living Planet Index
-28%
+31%
-61%

9
The second Rio treaty, the Convention on Biological Diversity, aimed to stem the escalating loss of species and ecosystems, while ensuring a fairer share-out of the benefits reaped from harvesting the Earth’s biological resources.
The 2010 Nagoya Protocol provides a transparent legal framework for the effective implementation of one of the three objectives of the CBD: the fair and equitable sharing of benefits arising out of the utilization of genetic resources. But halting species and ecosystem loss has proved harder, even after the 2000 Millennium Development Goals agreed that the first specific goal should be to get a “significant reduction in the rate of loss” of biodiversity by 2010 (UNEP, 2011).
The failure to curb extinctions is reflected in the Living Planet Index, which has declined
by 12 per cent since 1992, and by 30 per cent in the tropics (UNEP, 2011).
The Convention to Combat DesertificationThe UN Convention to Combat Desertification is the third convention to come out of the Rio Earth Summit. Along with climate change and the loss of biodiversity, desertification was identified as one of the greatest challenges to sustainable development. Established in 1994, UNCCD links environment and development to sustainable land management. The Convention addresses arid, semi-arid and dry sub-humid areas, known as the drylands, where some of the most vulnerable ecosystems and peoples can be found.
THE CONVENTION ON BIOLOGICAL DIVERSITYTh
e roa
d to R
IO+20
THE TROPICAL LIVING PLANET INDEX HAS DECLINED BY 30 PER CENT SINCE 1992

10
© R
oger Leguen / WW
F-Canon
Matécho forest. French Guiana
11
PROTECTING OR NEGLECTING OUR FORESTS? Without a global treaty to protect the world’s forests, and despite concerted efforts from some individual countries, in the 20 years since Rio, global forest cover has decreased by three million square kilometres, an area the size of India (UNEP, 2011). The good news is that the loss in the second decade after Rio was less than that recorded in the first, suggesting deforestation rates may be slowing.
Several countries have started growing their forests, including the US, parts of Europe, Costa Rica, China and India (WWF, 2012). And, after a decade of heavy losses, rates of deforestation in the Brazilian Amazon have fallen by 70 per cent since 2004. Efforts to stem forest loss through certification of sustainable management systems now cover about 10 per cent of forests, though few productive
tropical rainforests are yet to be adequately covered by these schemes (UNEP, 2011).
About a third of the natural forest lost in the past two decades has been replaced by forest plantations, which have grown by 54 per cent (UNEP, 2011). Meanwhile, a global deal on forests could finally emerge from the current round of climate negotiations. Deforestation is a major source of CO2 emissions, so the idea to compensate countries and communities for protecting their forests under the system known as REDD+ (Reducing Emissions from Deforestation and Forest Degradation), could provide a clear stream of finance that could make a major contribution to cutting global emissions and also protecting the world’s forests (UNEP, 2011).
The environmental agenda set by the 1992 Earth Summit has helped sustain other measures to protect the planet. For instance, the area of the planet’s land surface inside national parks and other protection regimes has increased from 9 per cent to 13 per cent since Rio (UNEP, 2011).
The r
oad t
o RIO+
20 SINCE RIO 1992, GLOBAL FOREST COVER HAS DECREASED BY THREE MILLION SQUARE KILOMETRES

12
INDIRECT DRIVERSAgriculture and forestry
Habitat loss, alteration and fragmentation
Invasive species
Pollution
Fishing and hunting Urban and industry Energy and transport
DIRECT PRESSURES ON BIODIVERSITY AND ECOSYSTEMS
ECOSYSTEM SERVICES
STATE OF GLOBAL BIODIVERSITY
Over exploitation
Terrestrial Freshwater Marine
The benefits that people obtain from ecosystems
CAUSAL FACTORSPopulation Consumption Resource efficiency
Provisioning services Supporting
services
Regulating services Cultural
services• food• medicine• timber• fibre • bioenergy
• nutrient cycling • photosynthesis • soil formation
• water filtration• waste decomposition • climate regulation • crop pollination • regulation of some
human diseases
• enriching • recreational • aesthetic • spiritual
Water use
Climate change

13
mands for food, water, energy and materials, as well as the need for space for infrastructure. These de-mands are largely met by a few key sectors: agriculture, forestry, fish-eries, mining, industry, water and energy. Ensuring these sectors un-derstand the importance of making sustainability a core pillar of their business is vital, if we hope to set the world back on a trajectory that allows consumption to fall within our planetary boundaries.
THE AGENDA FOR RIO 2012 ADDRESSES ALL OF THE MAIN FACTORS CONTRIBUTING TO BIODIVERSITY LOSS AND THE CURRENT DETERIORATION OF MOST OF THE WORLD’S ECOSYSTEMS.
LINKING BIODIVERSITY, ECOSYSTEM SERVICES AND PEOPLE Biodiversity is vital for human health and livelihoods. Living organisms – plants, animals and microorganisms – interact to form complex, interconnected webs of ecosystems and habitats, which in turn supply a myriad of ecosys-tem services upon which all life depends. Although technology can replace some ecosystem services and buffer against their degrada-tion, many cannot be replaced.
Understanding the inter-actions between biodiversity, ecosystem services and people is fundamental to reversing the trends outlined in the previous pages and so safeguarding the future security, health and well-being of human societies.
All human activities make use of ecosystem services – but can also put pressure on the biodiversity that supports these systems. In large part, threats stem from human de-
The five greatest direct pressures are:• Theloss,alteration,andfragmentationofhabitats– mainly through conversion of natural land for agricultural, aquacultural, industrial or urban use; damming and other changes to river systems for irrigation or flow regulation. • Overexploitationofwildspecies’popula-tions – harvesting of animals and plants for food, materials or medicine at a rate higher than they can reproduce.• Pollution – mainly from excessive pesticide use in agriculture and aquaculture, urban and indus-trial effluents, mining waste and excessive fertilizer use.• Climatechange – due to rising levels of green-house gases in the atmosphere, caused mainly by the burning of fossil fuels, forest clearing and indus-trial processes.• Invasivespecies – introduced deliberately or inadvertently to one part of the world from another, they then become competitors, predators or para-sites of native species.
14
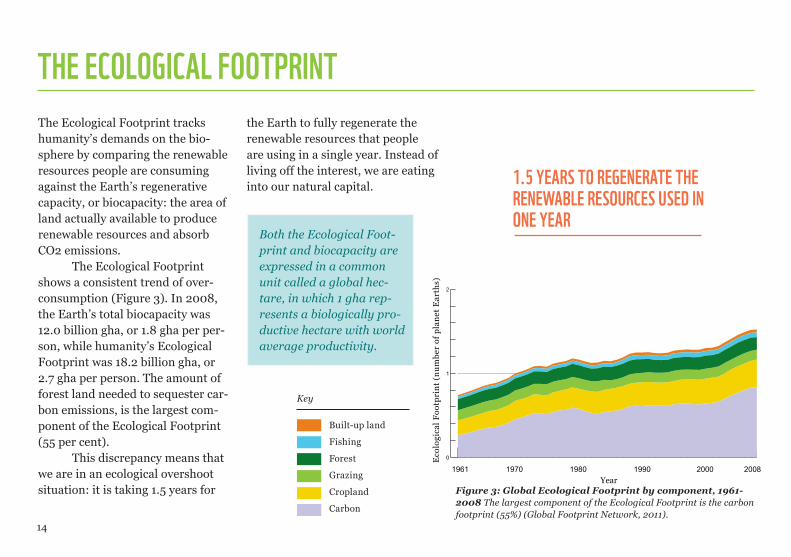
The Ecological Footprint tracks humanity’s demands on the bio-sphere by comparing the renewable resources people are consuming against the Earth’s regenerative capacity, or biocapacity: the area of land actually available to produce renewable resources and absorb CO2 emissions.
The Ecological Footprint shows a consistent trend of over-consumption (Figure 3). In 2008, the Earth’s total biocapacity was 12.0 billion gha, or 1.8 gha per per-son, while humanity’s Ecological Footprint was 18.2 billion gha, or 2.7 gha per person. The amount of forest land needed to sequester car-bon emissions, is the largest com-ponent of the Ecological Footprint (55 per cent).
This discrepancy means that we are in an ecological overshoot situation: it is taking 1.5 years for
the Earth to fully regenerate the renewable resources that people are using in a single year. Instead of living off the interest, we are eating into our natural capital.
0
1
2
1961 1970 1980 1990 2000 2008
Eco
logi
cal F
ootp
rint
(nu
mbe
r of
pla
net
Ear
ths)
Year
THE ECOLOGICAL FOOTPRINT
Figure3:GlobalEcologicalFootprintbycomponent,1961-2008 The largest component of the Ecological Footprint is the carbon footprint (55%) (Global Footprint Network, 2011).
Both the Ecological Foot-print and biocapacity are expressed in a common unit called a global hec-tare, in which 1 gha rep-resents a biologically pro-ductive hectare with world average productivity.
1.5 YEARS TO REGENERATE THE RENEWABLE RESOURCES USED IN ONE YEAR
Key
Built-up land
Fishing
Forest
Grazing
Cropland
Carbon

15
THE HUMAN IMPACT ON THE PLANET IS EXCEEDING SUPPLYThe UN Environment Programme, one of the agencies behind many of the agreements reached in Rio 1992, concludes that environmental target setting works best when it addresses well-defined issues for which tech-nological solutions exist or can be developed, and where progress is measurable (UNEP, 2011).
For this to happen, on the global scale required to ensure that world is on a clear path to a sus-tainable future, there needs to be a significant shift in our attitudes to the environment and in our under-standing of our reliance on natural capital. In the last two decades, despite some progress, business has continued “as usual” and the human impact on the planet has continued to grow, destroying nature and the natural resources upon which we ultimately depend for our survival.
The human impact on the planet has three components: population numbers, how much each of us con-sumes, and the resource intensity to produce our goods and services.
Throughout the 20th century, the expanding human footprint on the planet was due primarily to a growing world population, which quadrupled during the century. But this is changing. Since 1992, world population has grown by 26 per cent, reaching 7 billion in late 2011 (UNEP, 2011). But family sizes are falling – the average is now 2.5 children per woman – and the rate of growth has declined from 1.65 per cent a year to 1.2 per cent (UNEP, 2011). Some believe we will see “peak population” later this century.
The r
oad t
o RIO+
20SINCE 1992, WORLD POPULATION HAS GROWN BY 26 PER CENT, REACHING 7 BILLION IN LATE 2011
THROUGHOUT THE 20TH CENTURY, THE EXPANDING HUMAN FOOTPRINT ON THE PLANET WAS DUE PRIMARILY TO A GROWING WORLD POPULATION

16
0
2
4
6
8
10
12E
colo
gica
l Foo
tpri
nt
– t
he
nu
mb
er o
f gl
obal
hec
tare
s d
eman
ded
per
per
son
Occ
upie
d P
ales
tinia
n Te
rrito
ryT
imor
-Les
teA
fgha
nist
anH
aiti
Erit
rea
Ban
glad
esh
Rw
anda
Pak
ista
nC
ongo
, Dem
ocra
tic R
epub
lic o
fN
epal
Mal
awi
Moz
ambi
que
Zam
bia
Bur
undi
Indi
aY
emen
Ang
ola
Tajik
ista
nK
enya
Phi
lippi
nes
Togo
Leso
tho
Con
goC
amer
oon
Gui
nea-
Bis
sau
Indo
nesi
aS
ierr
a Le
one
Eth
iopi
aM
adag
asca
rZ
imba
bwe
Tanz
ania
, Uni
ted
Rep
ublic
of
Cam
bodi
aS
ri La
nka
Libe
riaK
yrgy
zsta
nLa
o, P
eopl
e's
Dem
ocra
tic R
epub
licK
orea
, Dem
ocra
tic P
eopl
e's
Rep
ublic
of
Mor
occo
Ben
inC
entr
al A
fric
an R
epub
licV
ietn
amG
ambi
aIr
aqD
omin
ican
Rep
ublic
Geo
rgia
Nig
eria
Som
alia
Sw
azila
ndS
yria
n A
rab
Rep
ublic
Bur
kina
Fas
oS
eneg
alN
icar
agua
Uga
nda
Sud
anA
lger
iaG
uine
aJa
mai
caH
ondu
ras
Arm
enia
Gha
naT
unis
iaG
uate
mal
aC
olom
bia
Alb
ania
Gab
onU
zbek
ista
nM
ali
Cha
dC
uba
Mya
nmar
Aze
rbai
jan
El S
alva
dor
Per
uN
amib
iaE
gypt
Mol
dova
Chi
naJo
rdan
Ecu
ador
Tha
iland
Cos
ta R
ica
Tur
key
Ser
bia
Sou
th A
fric
aB
oliv
iaIr
an, I
slam
ic R
epub
lic o
fP
apua
New
Gui
nea
Arg
entin
aB
osni
a an
d H
erze
govi
naR
oman
iaB
otsw
ana
Leba
non
Mau
ritan
iaB
razi
lP
anam
aP
arag
uay
Ven
ezue
la, B
oliv
aria
n R
epub
lic o
fLi
byan
Ara
b Ja
mah
iriya
Ukr
aine
Chi
leM
exic
oB
ulga
riaH
unga
ryM
alay
sia
Pol
and
Latv
iaIs
rael
Tur
kmen
ista
nB
elar
usS
audi
Ara
bia
Por
tuga
lK
azak
hsta
nJa
pan
Cro
atia
New
Zea
land
Lith
uani
aR
ussi
an F
eder
atio
nIta
lyM
aurit
ius
Ger
man
yK
orea
, Rep
ublic
of
Slo
vaki
aU
nite
d K
ingd
omE
ston
iaS
pain
Nor
way
Fra
nce
Gre
ece
Sw
itzer
land
Uru
guay
Slo
veni
aC
zech
Rep
ublic
Aus
tria
Mac
edon
ia T
FY
RM
ongo
liaO
man
Sw
eden
Sin
gapo
reF
inla
ndIr
elan
dN
ethe
rland
sC
anad
aA
ustr
alia
Bel
gium
Uni
ted
Sta
tes
of A
mer
ica
Den
mar
kU
nite
d A
rab
Em
irate
sK
uwai
tQ
atar
Figure4:EcologicalFootprintpercountryperpersonThis comparison includes all coun-tries with populations greater than 1 million for which complete data are available (Global Footprint Network, 2011).
IF EVERYONE LIVED LIKE AN AVERAGE RESIDENT OF THE USA, A TOTAL OF FOUR EARTHS WOULD BE REQUIRED TO REGENERATE HUMANITY’S ANNUAL DEMAND ON NATURE
DIFFERENT COUNTRIES HAVE DIFFERENT FOOTPRINTS
IF ALL OF HUMANITY LIVED LIKE AN AVERAGE RESIDENT OF INDONESIA, ONLY TWO-THIRDS OF THE PLANET’S BIOCAPACITY WOULD BE USED;
16
World average Ecological Footprint per person was 2.7 gha in 2008

17
0
2
4
6
8
10
12
Eco
logi
cal F
ootp
rin
t –
th
e n
um
ber
of
glob
al h
ecta
res
dem
and
ed p
er p
erso
n
Occ
upie
d P
ales
tinia
n Te
rrito
ryT
imor
-Les
teA
fgha
nist
anH
aiti
Erit
rea
Ban
glad
esh
Rw
anda
Pak
ista
nC
ongo
, Dem
ocra
tic R
epub
lic o
fN
epal
Mal
awi
Moz
ambi
que
Zam
bia
Bur
undi
Indi
aY
emen
Ang
ola
Tajik
ista
nK
enya
Phi
lippi
nes
Togo
Leso
tho
Con
goC
amer
oon
Gui
nea-
Bis
sau
Indo
nesi
aS
ierr
a Le
one
Eth
iopi
aM
adag
asca
rZ
imba
bwe
Tanz
ania
, Uni
ted
Rep
ublic
of
Cam
bodi
aS
ri La
nka
Libe
riaK
yrgy
zsta
nLa
o, P
eopl
e's
Dem
ocra
tic R
epub
licK
orea
, Dem
ocra
tic P
eopl
e's
Rep
ublic
of
Mor
occo
Ben
inC
entr
al A
fric
an R
epub
licV
ietn
amG
ambi
aIr
aqD
omin
ican
Rep
ublic
Geo
rgia
Nig
eria
Som
alia
Sw
azila
ndS
yria
n A
rab
Rep
ublic
Bur
kina
Fas
oS
eneg
alN
icar
agua
Uga
nda
Sud
anA
lger
iaG
uine
aJa
mai
caH
ondu
ras
Arm
enia
Gha
naT
unis
iaG
uate
mal
aC
olom
bia
Alb
ania
Gab
onU
zbek
ista
nM
ali
Cha
dC
uba
Mya
nmar
Aze
rbai
jan
El S
alva
dor
Per
uN
amib
iaE
gypt
Mol
dova
Chi
naJo
rdan
Ecu
ador
Tha
iland
Cos
ta R
ica
Tur
key
Ser
bia
Sou
th A
fric
aB
oliv
iaIr
an, I
slam
ic R
epub
lic o
fP
apua
New
Gui
nea
Arg
entin
aB
osni
a an
d H
erze
govi
naR
oman
iaB
otsw
ana
Leba
non
Mau
ritan
iaB
razi
lP
anam
aP
arag
uay
Ven
ezue
la, B
oliv
aria
n R
epub
lic o
fLi
byan
Ara
b Ja
mah
iriya
Ukr
aine
Chi
leM
exic
oB
ulga
riaH
unga
ryM
alay
sia
Pol
and
Latv
iaIs
rael
Tur
kmen
ista
nB
elar
usS
audi
Ara
bia
Por
tuga
lK
azak
hsta
nJa
pan
Cro
atia
New
Zea
land
Lith
uani
aR
ussi
an F
eder
atio
nIta
lyM
aurit
ius
Ger
man
yK
orea
, Rep
ublic
of
Slo
vaki
aU
nite
d K
ingd
omE
ston
iaS
pain
Nor
way
Fra
nce
Gre
ece
Sw
itzer
land
Uru
guay
Slo
veni
aC
zech
Rep
ublic
Aus
tria
Mac
edon
ia T
FY
RM
ongo
liaO
man
Sw
eden
Sin
gapo
reF
inla
ndIr
elan
dN
ethe
rland
sC
anad
aA
ustr
alia
Bel
gium
Uni
ted
Sta
tes
of A
mer
ica
Den
mar
kU
nite
d A
rab
Em
irate
sK
uwai
tQ
atar
Cropland Represents the amount of cropland used to grow crops for food and fibre for human consumption as well as for animal feed, oil crops and rubber.
Cropland Represents the amount of cropland used to grow crops for food and fibre for human consumption as well as for animal feed, oil crops and rubber.
Carbon Represents the amount of forest land that could sequester CO2 emissions from the burning of fossil fuels, excluding the fraction absorbed by the oceans which leads to acidification.
Grazing Land Represents the amount of grazing land used to raise livestock for meat, dairy, hide and wool products.
Built-up Land Represents the amount of land covered by human infrastructure, including transportation, housing, industrial structures and reservoirs for hydropower.
Forest Represents the amount of forest required to supply timber products, pulp and fuel wood.
Fishing Grounds Calculated from the estimated primary production required to support the fish and seafood caught, based on catch data for marine and freshwater species.
THE COMPONENTS OF THE ECOLOGICAL FOOTPRINT

18
0
7
6
5
4
3
2
1
1961 1970 1980 1990 2000 2008
Eco
logi
cal
Fo
otp
rin
t (g
ha
per
cap
ita)
Year
The per capita Ecological Footprint of high-income nations dwarfs that of low- and middle-income coun-tries (Figure 5).
The Living Planet Index for high-income countries shows an increase of 7 per cent between 1970 and 2008 (Figure 6). This is likely to be due to a combination of fac-tors, not least of which being that these nations are able to purchase and import resources from lower-income countries, thereby simulta-neously degrading the biodiversity in those countries while maintain-ing the remaining biodiversity and ecosystems in their own “back yard”.
In stark contrast, the index for low-income countries has de-clined by 60 per cent. This trend is potentially catastrophic, not just for biodiversity but also for the people living in those countries. While eve-ryone depends ultimately on eco-
HIGH INCOME COUNTRIES MAKE DISPROPORTIONATE DEMANDS
Figure6:LivingPlanetIndexbycountryincomegroupThe index shows a 7% increase in high-in-come countries, a 31% decline in middle-income countries and a 60% decline in low- income countries between 1970 and 2008 (WWF/ ZSL, 2012).
Figure5:ChangesintheEcologi-calFootprintperpersoninhigh-,middle-andlow-incomecountriesbetween1961and2008The black line represents world average biocapacity in 2008 (Global Footprint Network, 2011).
0
1
2
1980 1985 1990 1995 2000 2005 2008
Year 1970 1975
Ind
ex V
alu
e (1
970
= 1
)
system services and natural assets, the world’s poorest people feel the impact of environmental degrada-tion most directly. Without access to land, clean water, adequate food, fuel and materials, vulnerable peo-ple cannot break out of the poverty trap and prosper.
High Income
Middle Income
Low Income
Key

19
HIGH INCOME COUNTRIES MAKE DISPROPORTIONATE DEMANDS ©
National G
eographic Stock/ Jim
Richardson / W
WF
Chicago city lights, Illinois, USA.
0
1
2
1980 1985 1990 1995 2000 2005 2008
Year 1970 1975
Ind
ex V
alu
e (1
970
= 1
)
20
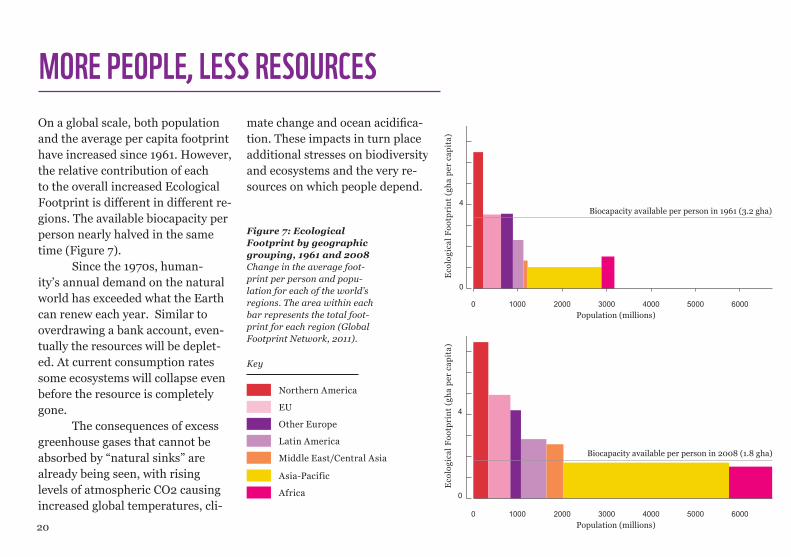
On a global scale, both population and the average per capita footprint have increased since 1961. However, the relative contribution of each to the overall increased Ecological Footprint is different in different re-gions. The available biocapacity per person nearly halved in the same time (Figure 7).
Since the 1970s, human-ity’s annual demand on the natural world has exceeded what the Earth can renew each year. Similar to overdrawing a bank account, even-tually the resources will be deplet-ed. At current consumption rates some ecosystems will collapse even before the resource is completely gone.
The consequences of excess greenhouse gases that cannot be absorbed by “natural sinks” are already being seen, with rising levels of atmospheric CO2 causing increased global temperatures, cli-
mate change and ocean acidifica- tion. These impacts in turn place additional stresses on biodiversity and ecosystems and the very re-sources on which people depend.
MORE PEOPLE, LESS RESOURCES
Figure7:Ecological Footprintbygeographicgrouping,1961and2008Change in the average foot-print per person and popu-lation for each of the world’s regions. The area within each bar represents the total foot-print for each region (Global Footprint Network, 2011).
0
4
8
2000 3000 4000 5000 6000
Population (millions)0 1000
Eco
logi
cal
Fo
otp
rin
t (g
ha
per
cap
ita)
Biocapacity available per person in 1961 (3.2 gha)
0
4
8
2000 3000 4000 5000 6000
Population (millions)0 1000
Eco
logi
cal
Fo
otp
rin
t (g
ha
per
cap
ita)
Biocapacity available per person in 2008 (1.8 gha)
Key
Africa
Middle East/Central Asia
Northern America
EU
Other Europe
Latin America
Asia-Pacific

21
CONSUME MORE WISELY An increasingly important driver of our growing human footprint is our rising personal consumption. We are all consuming more, especially in high-income countries, which are already placing a disproportionately high demand on the planet’s avail-able resources.
Materials extraction over-all is up 41 per cent over the past two decades, while food produc-tion is up by 45 per cent (UNEP, 2011). Both rates are well ahead of population growth. World plas-tics’ production has more than doubled since 1992, about half of it for disposable applications such as packaging (UNEP, 2011). We are also building new infrastructure at an extraordinary rate. Cement production is the biggest and fastest growing industrial source of CO2 emissions. It has risen 230 per cent
in the past 20 years (UNEP, 2011). Globalization, by driving down prices, has amplified the consump-tion boom. International trade has tripled in value in the past 20 years (UNEP, 2011). Airfreight trans-port has increased by 230 per cent (UNEP, 2011).
UrbanizationMore than 50 per cent of the global population now lives in urban areas. The number of people living in cit-ies has shown a 45 per cent increase since 1992 and urbanites generally consume more – for example the ecological footprint of the average citizen of Beijing is three times the Chinese average (WWF, 2012). And globally, cities account for 75 per cent of energy consumption (UNEP, 2011). Globally, urban residents are already responsible for more than
70 per cent of the world’s fossil fuel related CO2 emissions. However, well planned cities can also reduce direct carbon emissions, through good management of collective transport (WWF, 2012).
0
4
8
2000 3000 4000 5000 6000
Population (millions)0 1000
Eco
logi
cal
Fo
otp
rin
t (g
ha
per
cap
ita)
Biocapacity available per person in 1961 (3.2 gha)
0
4
8
2000 3000 4000 5000 6000
Population (millions)0 1000
Eco
logi
cal
Fo
otp
rin
t (g
ha
per
cap
ita)
Biocapacity available per person in 2008 (1.8 gha)
The r
oad t
o RIO+
20
GLOBALLY, CITIES ACCOUNT FOR 75 PER CENT OF ENERGY CONSUMPTION
SINCE 1992 THE NUMBER OF PEOPLE LIVING IN CITIES HAS GROWN BY 45 PER CENT

22
Some countries with high bio-capacity do not have a large national footprint. Bolivia, for example, has a per capita footprint of 2.6 gha and a per capita biocapacity of 18 gha. However it is worth noting that this biocapacity may well be being exported and utilized by other nations. For example, the Ecological Footprint of a citizen of United Arab Emirates (UAE) is 8.4 gha, but within the
country there is only 0.6 gha of biocapacity available per person. The residents of UAE are therefore dependent on the resources of other nations to meet their needs.
As resources are becoming more constrained, competition is growing; the disparity between resource-rich and resource-poor nations is highly likely to have strong geo-political implications in the future.
DIFFERENT COUNTRIES, DIFFERENT BIOCAPACITIES
Scramble for land: Food and fuel Throughout the developing world, external investors are scrambling to secure access to agricultural land for future food production. Since the mid-2000s, it is estimated that an area almost the size of Western Europe has been transferred in land allocation deals. The latest rush for farmland was triggered by the food crisis of 2007-08, but long-term drivers include population growth, increased consumption by a global minority and market demands for food, biofuels, raw materials and timber (Anseeuw et al., 2012).
Figure8:Top10 nationalbiocapacitiesin 2008Ten countries accounted for over 60 per cent of Earth’s total biocapacity in 2008. This includes five of the six BRIICS countries: Brazil, Rus-sia, India, Indonesia and China (Global Footprint Network, 2011).
Rest of the world
Brazil 15.4%
China 9.9%
United States of America 9.8%
Russian Federation 7.9%
India 4.8%
Canada 4.2%
38.8%
Congo, Democratic Republic of 1.6%
Australia 2.6%
Indonesia 2.6%Argentina 2.4%
TEN COUNTRIES ACCOUNTED FOR OVER 60 PER CENT OF EARTH’S TOTAL BIOCAPACITY IN 2008
23
IMPROVING RESOURCE EFFICIENCY As well as needing to reduce our global levels of consumption, anoth-er way of stemming the ecological consequences of modern life would be via improved resource efficiency, the third component of the human footprint. Already, we can see some progress on this front and as many materials rise in price or become in short supply, we are using them more efficiently (UNEP, 2011).
The amount of materials needed to generate US$1 of GDP has diminished by about 15 per cent in the past two decades (UNEP, 2011). Similarly, the carbon ef-ficiency of the global economy has improved by 23 per cent since 1992 (UNEP, 2011). At the time of the 1992 Earth Summit, it required more than 600 grams of CO2 to produce US$1 of GDP. In 2007 that figure was around 460 grams. This is a good start and reflects a shift to-wards more efficient energy use, but
it has not yet come close to revers-ing the rising tide of CO2 emissions. A key contributor to this is our con-tinuing reliance on fossil fuels.
We are slowly switching to low-carbon energy sources. Since 2004, there has been a 540 per cent increase in investment in renewable energy such as solar and wind pow-er (UNEP, 2011). As a result, solar energy output is 300 times what it was 20 years ago, and wind 60 times greater (UNEP, 2011). This sounds like a huge increase and it’s certainly a good start, but these two energy sources still only account for 0.3 per cent of global energy supply (UNEP, 2011).
The drive to sustainable energy production cannot be sepa-rated from the imperative to ensure access to modern energy sources for the 1.3 billion people who do not yet have it, and the 2.7 billion people who still get most of their energy for
cooking and heating from burning biomass such as dung, wood and charcoal – a major health hazard as well as an environmental threat (WWF, 2011).
The UN Secretary General has proposed that there should be universal access to modern energy services such as electricity by 2030. Particularly in rural areas, only renewable energy can secure that goal. For rural development, re-newables are not a luxury; they are a necessity.Th
e roa
d to R
IO+20
WWF’s recent Energy Report sets out an ambitious vision showing that by 2050 the world’s energy needs could be met almost entirely through a combination of much greater energy efficiency and sustain-able renewable energy sources (WWF, 2011).

24
© A
driano Gam
barini / WW
F-Brazil
Soy monoculture and cloudy sky, Roda Velha, Brazil.
25
USING OUR LAND MORE EFFECTIVELYConcern about climate change has ensured that energy policy takes centre stage in many environmental debates. But there are other vital issues to consider surrounding sustainability.
One of the most pervasive human impacts on the planet’s ecosystems is agriculture. To some extent, food production is a human success story – it has increased by 45 per cent in the past 20 years, compared to population growth of 26 per cent (UNEP, 2011). This was done largely by intensifying farm production, rather than taking more land from nature and many threatened ecosystems have survived as a result (UNEP, 2011). However the ecological impact of this intensification has been considerable.
One reason that the strain on the food supply system has increased is because of
unsustainable overconsumption of meat, particularly in wealthier countries. Average meat consumption worldwide had risen from 34 kilograms per year in 1992 to 43 kilograms today (UNEP, 2011). Meat production requires much more resources to produce than grains or pulses (UNEP, 2011). Livestock are responsible for 18 per cent of the world’s greenhouse gas emissions (FAO, 2006).
Much of this agricultural productivity has been achieved by using huge amounts of agrochemicals, such as artificial nitrogen fertilizer. Production of these chemicals requires lots of energy and as a consequence, it now takes between 7 and 10 calories of energy to produce one calorie of food (UNEP, 2011).
The r
oad t
o RIO+
20
FOOD PRODUCTION HAS INCREASED 45 PER CENT IN THE LAST 20 YEARS
AVERAGE MEAT CONSUMPTION WORLDWIDE HAD RISEN FROM 34 KILOGRAMS PER YEAR IN 1992 TO 43 KILOGRAMS TODAY

26
At least 2.7 billion people live in river basins that experience severe water scarcity during at least one month of the year. To provide a more refined insight into water availability and demand than is generally considered, a recent study (Hoekstra et al., 2012) has analysed the monthly Blue Water Footprint of 405 major river basins, in which 65 per cent of the global popula-tion reside. A precautionary ap-
proach was taken based on natural flows (the estimated flow through the river basin before any water is taken out), and the presumed en-vironmental flow requirement (the amount of water needed to main-tain the integrity of freshwater eco-systems), assumed to be 80 per cent of monthly natural run-off (Richter et al., 2011).
If more than 20 per cent of the natural flow is being used by
people, then the Blue Water Foot-print is greater than the amount of blue water available and water stress will occur. Figure 9 shows the number of months during the year in which blue water scarcity exceeded 100 per cent in the world’s major river basins between 1996 and 2005; meaning that, during these months, more than 20 per cent of the natural flow is being used by people.
WATER: SOURCE OF LIFENumber of months in which water scarcity > 100%
0
1
2 - 3
4 - 5
8 - 9
10 - 11
12
6 - 7
Months in which water
scarcity > 100%
Figure9:Bluewaterscarcityin405riverbasinsbetween1996and2005The darkest blue shading indicates river basins where more than 20% of water available in the basin is being used throughout the year. Some of these areas are in the most arid areas in the world (such as inland Australia) however other areas (such as western USA) have many months of water scarcity because significant amounts of water within these basins are being channelled into agri-culture (Hoekstra et al., 2012).

27
MANAGE WATER SUSTAINABLYGlobal water use for agriculture has also increased substantially. The land area under formal irrigation has increased 21 per cent in 20 years (UNEP, 2011). Irrigation now accounts for 70 per cent of the water abstracted from rivers and underground reserves; and if rainfall is taken into account, crops are responsible for 92 per cent of the human water footprint (WWF, 2012).
With many rivers running dry because of over-abstraction, 2.7 billion people now live in catchments that experience severe water shortages for at least one month a year (WWF, 2012).
Additionally, the tropical freshwater Living Planet Index is deteriorating faster than any other, with 70 per cent biodiversity loss between 1970 and 2008.
Water is a rapidly emerging global crisis that was barely discussed in Rio 20 years ago.
Globally, we are hugely wasteful in our use of both water and fertilizers. Most fertilizer never gets into the crops and instead pollutes rivers and marine waters, or is released from soils into the atmosphere as nitrous oxide, a potent greenhouse gas.
The r
oad t
o RIO+
202.7 BILLION PEOPLE EXPERIENCE SEVERE WATER SCARCITY AT LEAST ONE MONTH A YEAR
CROPS ARE RESPONSIBLE FOR 92 PER CENT OF THE HUMAN WATER FOOTPRINT
Water reserves: Securing water resources for people and natureThe Mexican National Water Commission (CONAGUA), with sup-port from WWF and the Fundacion Gonzalo Río Arronte, is working to manage freshwater ecosystems. In 2011, a national environmental flow standard was approved, and 189 basins were identified as po-tential “water reserves”: watersheds with high biological richness and relatively high water availability. These basins are the main targets of the National Water Reserves Program (CONAGUA, 2011) that is creat-ing conditions to safeguard the natural flow regimes that sustain criti-cal ecosystems, secure the services they support and maintain buffer-ing capacity against climate uncertainty and water scarcity risk.

28
The world’s oceans supply fish and other seafood that form a major source of protein for billions of people, and provide seaweed and marine plants used for the manu-facture of food, chemicals, energy and construction materials. Marine habitats such as mangroves, coastal marshes and reefs form critical buff-ers against storms and tsunamis and store significant quantities of car-bon. Some of these habitats, espe-cially coral reefs, support important tourism industries. Ocean waves, winds and currents offer consider-able potential for creating renewable energy supplies. These services have a huge value: for food production; as a source of income; and prevent-ing loss and damage to property, land, human life and economic ac-tivities.
However, the health of oceans is threatened by overexploitation, greenhouse gas emissions and pol-
lution. Over the past 100 years, the use of our oceans and the services they provide has intensified: from fishing and aquaculture to tourism, and from shipping to oil and gas extraction and seabed mining.
The consequences of increased fishing intensity have been dramatic (Figure 10). One-third of the world’s oceans and two-thirds of continental shelves are now exploited by fisher-ies.
OCEANS: MORE THAN A MAJOR SOURCE OF PROTEIN
Figure10:Theexpansionandimpactofworldfishingfleetsin(a)1950and(b)2006The maps show the geographical expansion of world fishing fleets from 1950 to 2006 (the latest available data). Since 1950, the area fished by global fishing fleets has increased ten-fold. By 2006 100 million km2, around 1/3 of the ocean surface, was already heavily impacted by fishing. To measure how inten-sively these areas are fished, Swartz et al., (2010) used the fish landed in each country to calculate the primary production rate (PPR) of each region of the ocean. PPR is a value that describes the total amount of food a fish needs to grow within a certain region. In the areas in blue, the fleet extracted at least 10% of this energy. Orange indicates a minimum of 20% extraction and red shows least 30%, highlighting the most intensively and poten-tially overfished, areas.
1950
2006

29
A FUTURE FOR FISHERIESThe world’s last large-scale sources of “wild” food, the ocean fisheries, have suffered from rampant over-exploitation (UNEP, 2011). Despite putting ever more and ever bigger fishing vessels to sea, with ever big-ger nets, fish catches have been de-clining since the mid-1990s (UNEP, 2011 & WWF, 2012).
Just as natural forests are being replaced with monoculture plantations, so wild fishing is being replaced with aquaculture. The pro-duction of aquaculture has grown more than 260 per cent in 20 years, which equals more than half of the total wild fish catch (UNEP, 2011).
Producing food sustainably is as important to the future of the world as producing energy sustain-ably. It requires better managed inputs to fields, better stewardship of soils and water, more equitable distribution of foodstuffs, a drive to
reduce excessive consumption, and a major effort to eliminate waste everywhere – from fields and ware-houses, to dinner plates. Where wild food still exists – most notably in rivers, wetlands and oceans – its stocks should be rigorously pro-tected.
The r
oad t
o RIO+
20
Northern bluefin tuna (Thunnus thynnus).
PRODUCING FOOD SUSTAINABLY IS AS IMPORTANT AS PRODUCING ENERGY SUSTAINABLY
Fisheries: impact on marine ecosystemsA nearly five-fold increase in global catch, from 19 million tonnes in 1950 to 87 million tonnes in 2005 (Swartz et al., 2010), has left many fisheries overexploited (FAO, 2010b). Catch rates of some species of large predatory fishes – such as marlin, tuna and billfish – have dra-matically declined over the last 50 years, particularly in coastal are-as of the North Atlantic and the North Pacific (Tremblay-Boyer et al., 2011). Targeted fishing of top predators has changed whole ecological communities, with increasing abundance of smaller marine animals at lower trophic levels as a consequence of the larger species being removed. This in turn has an impact on the growth of algae and coral health (WWF, 2012).

30
Low HumanDevelopment
Med
ium
Hum
anD
evel
opm
ent
Hig
h H
uman
Dev
elop
men
t
Very
Hig
hH
uman
Dev
elop
men
t
World average biocapacity per person in 2008
Meets minimum criteria for sustainability
2
4
6
8
10
12
Ecol
ogic
al F
ootp
rint
(glo
bal h
ecta
res p
er p
erso
n)
0.20.0 0.4 0.6 0.8Inequality-Adjusted Human Development Index (IHDI)
01.0
Low HumanDevelopment
Med
ium
Hum
anD
evel
opm
ent
Hig
h H
uman
Dev
elop
men
t
Very
Hig
hH
uman
Dev
elop
men
t
World average biocapacity per person in 2008
Meets minimum criteria for sustainability E
colo
gica
l Foo
tpri
nt (g
loba
l hec
tare
s pe
r pe
rson
)
Human Development Index (HDI)
0
2
4
6
8
10
12
0.20.0 0.4 0.6 0.8 1.0
Currently the most widely used indicator for development is the Human Development Index (HDI). Like all averages, the HDI conceals disparities in human development in individual countries and does not take into account other important variables, such as inequality. A new version of the HDI – the Inequality-adjusted Human Development Index or IHDI – is a measure of human development that takes into account societal inequality.
Under perfect equality, the IHDI is equal to the HDI; but it progressively falls below the HDI as inequality rises. Linking the Ecological Footprint and (I)HDI enforces the conclusion that the majority of countries with high (I)HDI have improved the well-being of their citizens at the expense of a large footprint (Figure 11).
DEVELOPMENT WITHIN PLANETARY BOUNDARIES
Figure11b:TheEcologicalFootprintforeachcountry(in2008)versustheInequality-adjustedHumanDevelop-mentIndex(in2011)The Inequality-adjusted HDI (IHDI) ac-counts for inequality in each of the three dimensions of the HDI – education, life expectancy and income per capita – by “dis-counting” the average value of each one ac-cording to its level of inequality. Therefore, although the general shape of this graph is the same as in Figure 11a, many countries have moved to the left. Countries with less human development tend to have greater inequality in more dimensions – and thus see larger losses in their HDI value. Note: The development thresholds are the same in both this figure and Figure 11a to make it easier to compare the two of them. The IHDI values shown here are from 2011 - for more information see UNDP, 2011 (Global Footprint Network, 2011).
Key
Middle East/Central Asia
Northern America
EU
Other Europe
Latin America
Asia-Pacific
Figure11a:TheEcologicalFootprintforeachcountryversustheHumanDevelopmentIndex,2008The dot representing each country is coloured according to its geographic region and are scaled relative to its population. The shading in the background of this figure and in figure 11b indicates the HDI thresholds for low, medium, high and very high human development and are based on UNDP, 2010 (Global Footprint Network, 2011).
31
© K
ate Holt / W
WF-U
K
Pupil at school, Mugunga, DRC.

32
FOOD, WATER AND ENERGY SECURITY
Equitable Resource GovernanceShare available resources
Make fair and ecologically informed choices
Measure success beyond GDPConsume More Wisely
• Achieve low-footprint lifestyles• Change energy consumption patterns• Promote healthy consumption patterns
Preserve Natural Capital• Restore damaged ecosystems and
ecosystem services• Halt loss of priority habitats• Significantly expand the global
protected areas network
Produce Better• Significantly reduce inputs and waste
in production systems• Manage resources sustainably• Scale-up renewable energy production
BIODIVERSITY CONSERVATION
ECOSYSTEM INTEGRITY
Value nature
Account for environmental
and social costs
Support and reward conservation,
sustainable resource management
and innovation
RedirectFinancial
Flows
BETTER CHOICESFROM A ONE PLANET
PERSPECTIVE
WWF’S ONE PLANET PERSPECTIVE PROPOSES TO MANAGE, GOVERN AND SHARE NATURAL CAPITAL WITHIN THE EARTH’S ECOLOGICAL BOUNDARIES
33
RIO+20: THE ROAD TO RECOVERYIn the 20 years since the 1992 Rio Earth Summit, we can see tentative signs of human development decoupling from unsustainable uses of materials and ecosystems. But this fitful progress has usually been overwhelmed by our increasing demands on the planet. It is now clear that “business as usual” is no longer an option. On current trends, with rising human footprints and declining natural resources, humanity will require 2.9 planets by 2050 (WWF, 2012). “Business as usual” will destroy our natural capital ever faster – creating resource conflicts today and most likely making life increasingly difficult for future generations (WWF, 2012).
We now require a far more fundamental rethink of how the world does business than anything attempted after Rio ’92. We need to better account for the real value
of natural capital and ecosystems. Words must become action and Rio+20 is a key opportunity for world leaders to make that happen.
Feeding the world, ensuring universal access to basic resources such as water, food and energy is essential for us all. But this will be impossible to achieve without protecting the natural capital that we derive from forests, soils, ocean and freshwater ecosystems, and without the backdrop of a stable climate. We have the technology and the knowledge of what is required to fix the current environmental problems we face. What we need now is the unified global will to make it happen.
The r
oad t
o RIO+
20ON CURRENT TRENDS, HUMANITY WILL REQUIRE 2.9 PLANETS BY 2050
WE NEED TO BETTER ACCOUNT FOR THE REAL VALUE OF NATURAL CAPITAL AND ECOSYSTEMS

34
FOOD, WATER AND ENERGY FOR ALLWWF’s Living Planet Report shows that high-income regions use five times the amount of natural resources than the lowest income countries. We are living beyond the Earth’s means and are distributing these unsustainable proceeds inequitably: the poorest countries and communities bear a disproportionate share of the negative effects of the growing global demand for resources while industrialized nations enjoy most of the benefits. Future generations will face resource scarcities and environmental degradation, not of their making, that will increasingly lead to conflict and insecurity.
The growing number of urban poor that will live in tomorrow’s cities adds additional urgency to finding sustainable and equitable development paths.
The UN Conference on Sustainable Development 2012 (Rio+20) presents world leaders with a stark choice: they can tinker around the edges of global development as we know it today, or they can lift our ambitions by delivering a global vision for development, which considers environmental, social and economic factors equally, so that humans can live in harmony with nature for generations to come.
This vision will require deliberate choices and targeted public and private investment not just to decouple development from increased natural resource use, but to actively preserve, enhance, and effectively manage the world’s natural resource base and the ecosystem services on which human well-being depends. It will also require purposeful investment that
enhances the capacity of the poor to move out of poverty and fulfil their rights and needs for access to resources, financial assets, energy, water, food, housing, health, and education.
HIGH-INCOME REGIONS USE FIVE TIMES THE AMOUNT OF NATURAL RESOURCES THAN THE LOWEST INCOME COUNTRIES

35
GREEN ECONOMIES AND SUSTAINABLE DEVELOPMENT• Green economies would seek to effectively manage and govern natural resources; decouple growth from resource depletion; and improve equitable human well-being within the carrying capacity of the planet’s ecosystems.
• Governments must make use of their fiscal, legal and regulatory powers to fully embed human and environmental capital into private sector accounting and valuation. The fair and sustainable management and use of natural assets are also key to ensuring green economies deliver for the poor.
• International cooperation to deliver green economies should be strengthened above and beyond existing Official Development Assistance (ODA), and include technology cooperation, investment support, capacity-
building and experience sharing between developed and developing countries.
• The corporate sector has a crucial role to play, and strengthened corporate reporting standards on sustainability are a key tool in ensuring this.
• The Sustainable Development Goals (SDGs) must seek to address all dimensions of sustainable development (economic, social and environmental considerations) in an integrated way and be universally applicable.
• At Rio+20, world leaders should set in place an immediate and clear process to begin developing these SDGs within the framework of the post-2015 Millennium Development Goals.
WWF calls for strong global political leadership, to recognize and address the challenges of the interconnected environmental, social and economic crises.
WWF supports measures of human progress which go beyond GDP and take into account the true value of both natural and social capital.
WWF supports the proposal for Sustainable Development Goals as a contribution to the post- 2015 development framework. Rio+20 should agree the principles and process for their development.
wwf.panda.org/lpr
The r
oad t
o RIO+
20

36
UNDP. 2011. The Human Development Report: Sustainability and Equity: A Better Future for All. The United Nations Development Programme, New York, USA.
UNEP. 2011. Keeping Track of our Changing Environment: From Rio to Rio+20 (1992-2012). United Nations Environmental Programme, Nairobi, Kenya.
UNEP. 2011a. Bridging the Emissions Gap: A UNEP Synthesis Report. United Nations Environment Programme, Nairobi, Kenya.
WWF. 2011. The Energy Report: 100% Renewable Energy by 2050. WWF, Gland, Switzerland.
WWF/ZSL. 2012. The Living Planet Index database. WWF and the Zoological Society ofLondon. Downloaded on: 22nd February 2012.
WWF. 2012. Living Planet Report 2012. WWF, Gland, Switzerland.
FAO. 2010b. The State of World Fisheries and Aquaculture 2010 (SOFIA). FAO Rome,Italy.
Richter, B.D., Davis, M.M., Apse, C. and Konrad, C. 2011. A presumptive standard for environmental flow protection. River Research and Applications.
Swartz, W., Sala, E., Tracey, S., Watson, R. and Pauly, D. 2010. The spatial expansion and ecological footprint of fisheries (1950 to present). Plos ONE. 5 (12): e15143 (<Go to ISI>://WOS:000284868000026)
Tremblay-Boyer, L., Gascuel, D., Watson, D.R., Christensen, V. and Pauly, D. 2011. Modelling the effects of fishing on the biomass of the world’s oceans from 1950 to 2006. Marine Ecology-Progress Series. 442: 169–185.
UNDP. 2009. The Human Development Report: Human Development Index 2007 and its components - human mobility and development. UNDP, New York, USA.
Anseeuw, W., Alden Wily, L., Cotula, L. and Taylor, M. 2012. Land Rights and the Rush for Land: Findings of the Global Commercial Pressures on Land Research Project. International Land Coalition (ILC), Rome, Italy.
Global Footprint Network. 2011. The National Footprint Accounts. Global Footprint Network, Oakland, USA downloaded on: 20th February 2012.
Hoekstra, A.Y., Mekonnen, M.M., Chapagain, A.K., Mathews, R.E. and Richter, B.D. 2012. Global Monthly Water Scarcity: Blue Water Footprints versus Blue Water Availability. Plos ONE. 7 (2): e32688 (http://dx.plos.org/10.1371/journal. pone.0032688)
Johnson, S. (ed.) 1993. The Earth Summit: The United Nations Conference on Environment and Development (UNCED). London, United Kingdom.
FAO. 2006. Livestock’s Long Shadow: Environmental Issues and Options. FAO, Rome, Italy.
REFERENCES

37
Colophon
Published in May 2012 by WWF – World Wide Fund for Nature, Gland, Switzerland.
Rio+20 text: Fred PearceLiving Planet Report text and data: WWF in cooperation with ZSL and Global Footprint NetworkEditors: Monique Grooten, Richard McLellan, Natasja Oerlemans, Johannah SargentPhoto front page: Rio Negro Forest Reserve, Amazonas, Brazil. © Michel Roggo / WWF-CanonDesign: Coen MulderPrinted by: Lenoirschuring
Text and graphics: 2012 WWFAll rights reserved.
Reproduction of this publication for educational or other non-commercial purposes is authorized without prior written permission from the copyright holder. However, WWF does request advance written notification and appropriate acknowledge-ment. Reproduction of this publication for resale or other commercial purposes is prohibited without prior written permission of the copyright holder.
The designation of geographical entities in this book, and the presentation of the material, do not imply the expression of any opinion whatsoever on the part of WWF concerning the legal status of any country, territory, or area, or of its authorities, or concerning the delimitation of its frontiers or boundaries.
To download the full Living Planet Report 2012, go to:
wwf.panda.org/lpr
© E
SA
Aral lake view from space.
© U
SG
S

38
WW
F.
BIODIVERSITYBiodiversity, ecosystems and ecosystem services – our natural capital – must be preserved as the foundation of well-being for all.
BIOCAPACITYIt takes 1.5 years for the Earth to regenerate the renewable resources that people use, and absorb the CO2 waste they produce, in that same year.
BETTER CHOICES Living within ecological boundaries requires a global consumption and production pattern in balance with the Earth’s biocapacity.
WWF.ORG• LIVING PLANET REPORT 2012– ON THE ROAD TO RIO+20
© n
as
a
100%RECYCLED
© 1986 Panda symbol WWF – World Wide Fund For Nature (Formerly World Wildlife Fund)® “WWF” is a WWF Registered Trademark. WWF, Avenue du Mont-Blanc, 1196 Gland, Switzerland – Tel. +41 22 364 9111; Fax. +41 22 364 0332. For contact details and further information, visit our international website at panda.org
Why we are here
panda.org/lpr
To stop the degradation of the planet’s natural environment andto build a future in which humans live in harmony with nature.
EQUITABLE SHARINGEquitable resource governance is essential to shrink and share our resource use.