Summary - CMU Final Presentation/… · Web viewSpeech Interface for ... audience Barriers to...
117
GM Networks Project Final Report Technical Lead Jim Garretson [email protected] Documentation Lead Whitney Hess [email protected] Design Lead Jordan Kanarek [email protected] Project Manager Mathilde Pignol [email protected] User Research Lead Megan Shia [email protected] In partial fulfillment of the Masters in Human Computer Interaction Carnegie Mellon University, Pittsburgh, PA July 30, 2004
Transcript of Summary - CMU Final Presentation/… · Web viewSpeech Interface for ... audience Barriers to...

GM Networks ProjectFinal Report
Technical LeadJim Garretson
Documentation LeadWhitney Hess
Design LeadJordan Kanarek
Project ManagerMathilde Pignol
User Research LeadMegan Shia
In partial fulfillment of theMasters in Human Computer Interaction
Carnegie Mellon University, Pittsburgh, PAJuly 30, 2004

R o a d c a s t i n g
Table of Contents
1. Executive Summary............................................................................4
2. Project Goal.......................................................................................5
3. Technical aspects of ad-hoc networking..............................................6
4. Background Research.........................................................................74.1. Location Based Services..................................................................................74.2. Sensor Networks.............................................................................................74.3. Entertainment Delivery Trends.......................................................................74.4. Projecting Future Technologies.......................................................................74.5. Explanations of Innovative Services................................................................9
4.5.1. Cell Phones, Services................................................................................94.5.2. Communication Systems.........................................................................114.5.3. Radio Devices, Services..........................................................................114.5.4. Physical Devices......................................................................................134.5.5. Research.................................................................................................13
5. Service and Interface Design Process................................................165.1. User-Centered Design...................................................................................165.2. Concept Generation and Selection................................................................165.3. User Needs Assessment through Participatory Design.................................18
5.3.1 Purpose of Participatory Design Session..................................................185.3.2 Participants..............................................................................................185.3.3 Questionnaire...........................................................................................185.3.4 Activities...................................................................................................215.3.5 Group Discussion......................................................................................28
5.4. State of Radio................................................................................................295.4.1. Expert analysis of XM Radio....................................................................31
5.5. Guiding Principle and Service Overview........................................................325.6. Service design...............................................................................................33
5.6.1. Assumptions about users........................................................................335.6.2. Collaborative Filtering.............................................................................345.6.3. Levels of Interaction and Voting..............................................................355.6.4. Station Flavor..........................................................................................365.6.5. Scalability................................................................................................37
5.7. Prototyping Technology.................................................................................385.7.1. Determining a User’s Musical Preferences..............................................395.7.2. Collaborative Filtering Implementation...................................................405.7.3. Flavor Implementation............................................................................415.7.4 Automatic Station Categorization.............................................................415.7.5. Station Matching.....................................................................................425.7.6. Network Architecture..............................................................................425.7.7. Summary of Java Prototype.....................................................................44
5.8. Prototype I.....................................................................................................455.8.1. Description of design, functions, features...............................................455.8.2. Round 1 User Testing..............................................................................49
5.9. Prototype II....................................................................................................57
30 July 2004 James Garretson, Whitney Hess, Jordan Kanarek, Mathilde Pignol, Megan Shia1

R o a d c a s t i n g
5.9.1. Description of design, functions, features...............................................575.9.2. Round 2 User Testing..............................................................................58
5.10. Prototype III.................................................................................................705.10.1. Description of design, functions, features.............................................705.10.2. Peer Review...........................................................................................725.10.3. Focus Group..........................................................................................77
5.11. Conclusions Across All Test Users...............................................................90
6. Final/Recommended Design..............................................................966.1. Description of design, functions, features.....................................................96
6.1.1. Station Navigation...................................................................................966.1.2. Station Information.................................................................................966.1.3. Station Flavor..........................................................................................986.1.4. Voting......................................................................................................996.1.5. Talking...................................................................................................103
7. Open Issues/Next Steps..................................................................105
8. Implications for the Far Future/Grand Visions..................................1068.1. Implementation Technology........................................................................1068.2. Speech Interface for Navigation..................................................................1068.3. Changing the Face of Radio........................................................................108
9. Team Member Biographies.............................................................109
Appendix...............................................................................................................110
30 July 2004 James Garretson, Whitney Hess, Jordan Kanarek, Mathilde Pignol, Megan Shia2

R o a d c a s t i n g
1. Executive SummaryTo be written last, by Ko and Jay
30 July 2004 James Garretson, Whitney Hess, Jordan Kanarek, Mathilde Pignol, Megan Shia3

R o a d c a s t i n g
2. Project GoalKo Kurokawa and Jay Parikh of the Research & Development division of General Motors gave our project group the task of creating a revolutionary application or service for automobiles in 2010 that would utilize a limited range, high-speed mobile ad-hoc network. We had to forecast the advances in wireless technology that will be made over the next six years as well as the likely interests, attitudes, and aptitudes of the target consumer – drivers over the age of 30. Our clients told us to exclude ideas pertaining to safety and traffic, as GM is already pursuing those categories of use. We were to assume an infinite computing power in the car and that 1/3 of cars on the road would be GM brands. It was also our charge to create a working prototype usable on a standard 802.11b wireless network by the end of the seven-month project.
30 July 2004 James Garretson, Whitney Hess, Jordan Kanarek, Mathilde Pignol, Megan Shia4

R o a d c a s t i n g
3. Technical aspects of ad-hoc networkingTo be written by Jay Parikh
30 July 2004 James Garretson, Whitney Hess, Jordan Kanarek, Mathilde Pignol, Megan Shia5

R o a d c a s t i n g
4. Background ResearchWe began the project by immersing ourselves in the domains that we sought to innovate in. As a group, we conducted extensive market research on services that are being offered around the world on various communications networks. Our research uncovered advances in wireless technology. The swift adoption of such technology has allowed for some exciting service offerings that would not have been possible even a few years ago.
4.1. Location Based ServicesThroughout our research, we witnessed the rapid growth of location-based services. Location-based cell phone games are beginning to crop up. Dodgeball – a service that enables users to both keep tabs on where their friends are and to broadcast messages to people within a certain radius – is being rolled out in cities across America. Match.com and other similar European dating services announced that they would be introducing a location-based matchmaking service that would go so far as to recommend places for strangers to meet up for an impromptu first date.
4.2. Sensor NetworksA project at the MIT Media Lab utilizes smart parking meters that can be located and reserved. Sensors installed in the already-existing meters detect occupancy and can transmit vacancy information to the Web.
We were also interested in identifying services that utilized the strength of ad-hoc networks to replace traditional communications networks. As ad-hoc networking has yet to be fully explored in terms of practical applications, we were unable to find many examples. However, we were encouraged by the adoption of ad-hoc wireless networking by some municipalities as an alternative to centralized police communications. See Municipal Use of MeshNetworks under section 4.5.2.
4.3. Entertainment Delivery TrendsCell phone cameras are gaining popularity, but we also found a surge of media being delivered to cell phones worldwide. Watch TV programs on your cell phone in Sweden and Finland, download audio files and music videos to your cell phone in Hong Kong, and share music files by cell phone in the UK.
4.4. Projecting Future TechnologiesThe project required that we define our assumptions about how the year 2010 will be different from the year 2004. In analyzing historical trends and researching emerging technology, we quickly learned that digital storage will be much cheaper, computers will be much faster, screens will be bigger and more flexible, and network technologies will enable better communication over longer distances. Newly confident that our service would be possible to construct by 2010, we examined technical aspects of
30 July 2004 James Garretson, Whitney Hess, Jordan Kanarek, Mathilde Pignol, Megan Shia6

R o a d c a s t i n g
current and near-future networking technologies in order to create a recommendation regarding implementation technology.
We considered the current-generation wireless networking family, 802.11, as well as the newly emerged Bluetooth standard. Looking into the future, we researched upcoming technologies such as proprietary 802.11 variants, 802.16e, next-generation cell phone networks, and extensions to networks already created by GM.
“802.11” is the IEEE name given to a popular high-speed networking technology family. The family of 802.11 technologies is currently led by 802.11b, a standard defining methods by which a computer can communicate with other nearby computers and networks over the unlicensed radio spectrum. Transfer rates for 802.11b peak at a theoretical 11 Mb/s (megabits per second), and range extends (with declining speed) in an approximately 150-foot radius.
802.11g is a similar standard to b, but can reach a theoretical peak transfer rate of 55 Mb/s – 5 times faster. Range is ultimately similar to b, but peak transfer rates fall off even more quickly. Most new computers support both the b and g protocols.
Neither 802.11b nor g standards normally support network-hopping, whereby a computer can move from one fixed-point 802.11 network to another seamlessly. Between this and the standards’ lack of support for network nodes’ moving at high speed, it became clear that 802.11 technologies are not suitable for ad-hoc networking in vehicles.
Bluetooth is enjoying buzzword status as this is written, but it is in no way suitable to the purposes of a high-speed, long-range network. Bluetooth is a networking standard designed to transfer small amounts of data (0.02 Mb/s) across very small distances (20 feet). It is designed primarily for use in PANs, personal-area networks.
Our clients recommended we investigate the Mesh Networks VMM6300, a “vehicle-mounted modem” which relies on proprietary technology to allow for burst transfer speeds of up to 6 Mb/s between nodes moving at fairly high speeds (100mph) relative to one another. Although this technology would allow for prototype demonstrations in vehicles, it was considered insufficient for eventual deployment due to the relative-speed limitation: vehicles traveling at 65 mph in opposite directions on a highway would be unable to communicate with one another.
A number of exciting cell-phone network technologies have appeared lately, most notably 3G. Unfortunately, these technologies were designed with connection to fixed access points (cell towers) in mind, and are unsuitable in their current state for a mobile-to-mobile networking topography.
GM’s own two-way wireless communications technology, OnStar, is a similar case. OnStar works, from what we can gather from publicly available information, on a cell-phone-style topology whereby vehicles connect to nearby stationary towers. The
30 July 2004 James Garretson, Whitney Hess, Jordan Kanarek, Mathilde Pignol, Megan Shia7

R o a d c a s t i n g
connection works over a longer distance than most standard cell phones do, so giving the appearance of ubiquity. This technology is attractive in that GM already has experience and subsidiaries dedicated to it, but in its current form we do not believe it can interconnect individual vehicles without a stationary tower acting as go-between.
The XM satellite radio network topology is an interesting alternative to most of the technologies discussed so far, in that it uses satellites to make one-to-many communication. The XM signal is broadcast coast-to-coast from two satellites (and a number of ground-based repeaters), but the signal is identical everywhere. Unfortunately for us (but fortunately, we suppose, for them), the XM service has no need for listeners to interact with the broadcasts. The XM model is strictly one-way, one-to-many.
802.16a is, itself, an extension of the 802.11b/g model, but one that allows for hugely increased capabilities: a range radius of up to 30 miles, and a maximum theoretical transfer speed of 70Mb/s. A 30-mile radius would allow vehicles approaching one another from opposite directions at 60mph to maintain a connection for half an hour.
We also attended the 2004 Pittsburgh International Auto Show to better define our assumptions. We were able to experience the latest advances in GPS, radio systems, heads-up displays, and in-car gaming consoles. Seeing firsthand such cutting edge technologies gave us the grounds on which to make educated assumptions about the types of services and interfaces that will be standard on GM cars in just a few years.
4.5. Explanations of Innovative Services4.5.1. Cell Phones, Services
Big Brother (TV Show) on Cell Phones, SwedenSweden launched Big Brother reality TV show live over the 3G network recently. This allows 3’s customers to connect their 3G phones to six different cameras showing the inside of the Big Brother house.
Dodgeball, USAAllows you to use your cell phone to: 1) look up addresses and cross-streets or find the closest pool table or Ms. Pac Man machine, 2) tell us where you are and we’ll broadcast your whereabouts to all your friends, 3) broadcast messages to people within 10 blocks of your current location.
Financial News, Songs, Music Videos on Cell Phones3 Hong Kong has partnered with multiple companies to provide its customers with mobile download and streaming of the latest music videos and original songs in full version. In addition, a partnership with Reuters enables customers with access to updated financial news and investment information all on their cell phone.
Location-Based Cell Phone Games, Europe
30 July 2004 James Garretson, Whitney Hess, Jordan Kanarek, Mathilde Pignol, Megan Shia8

R o a d c a s t i n g
The games rely on a cell phone technology that allows mobile operators to pinpoint users’ positions within "cells" formed by their phones’ locations relative to nearby transmitters. In the United States, that capability is now required for all mobile operators to ensure that rescue workers can locate mobile users who are in trouble. The company’s signature game is BotFighters, with between 7,000 and 8,000 players in Sweden and Finland. Users role-play as robots that they pick from a community website. Once they start firing at each other in the real world, they pay real money – about 20 cents for each move in the game. (The cell phones can "get" missions from the company’s servers, “scan” for nearby enemies and, of course, “fire.”)
Match Mobile, USAMatch Mobile is a new service from Match.com and AT&T wireless that allows you to use your cell phone and match.com to search for your perfect partner while out-and-about. It uses GPS to determine where you are and if any potential mates are close by.
Share Music Via Cell Phones (GPRS Service), UKA new GPRS mobile phone service, by MM02, will let users download high quality digital music files, which can be transferred to a PC and even burned to a compact disc. MM02 expects to have 5000 songs to choose from, with each song costing about 1.50 pounds to download. Users will be billed through their regular cell phone bill. The service will require a new type of digital music player and a compatible cell phone handset. Music files will also be encrypted in a format designed to stop them being played on more than one music player or personal computer.
Smart Cards in Cell Phones, JapanThe embedded smart cards allows customers in Japan to use their phone as a swipe card to pay for purchases, as travel passes, and as concert and movie tickets. Like other “contactless” smartcards, the user simply has to place their phone near a reader to exchange information. This does away with the need to have printed tickets or passes. So, for example, a cinema ticket could be bought using the phone’s online features, with a swipe of the phone giving entry to the screening.
Smart PhonesDecline in the PDA market buyers increasingly turn to the newly emerging category of smart phones, which offer both the organizer functions of PDAs and the calling capabilities of cell phones, among other features.
TagandScan, UKTagandScan is a service for your mobile phone that enables you to mark real physical locations with an electronic tag. Tags automatically contain the time and location where and when the tag was made. They also can contain a title, description, and a photo. You can scan for tags, made by others, by proximity and keyword and can then display them on a map.
TV Via Cell Phones, Finland
30 July 2004 James Garretson, Whitney Hess, Jordan Kanarek, Mathilde Pignol, Megan Shia9

R o a d c a s t i n g
Finnish broadcasters and mobile phone carriers and Nokia Corp. plan to start sending TV programs to cell phones this year. At first, the broadcasts will be a pilot test, with 500 users in the Helsinki area. Programming will come from YLE, the national broadcaster, and two Finnish commercial TV providers, MTV3 and Nelonen.
4.5.2. Communication Systems
Municipal Use of MeshNetworks, USAA new communications system capable of transmitting video surveillance, photographs, and other information to Medford police is in the works. The new system will transmit data over laptop computers in patrol cars more than 37 times faster than existing technology, which bounces signals off cellular phone towers. That translates to instantaneous transmission that also allows police to access the Internet and Driver and Motor Vehicle Services records, including photos. Police, fire, and other city departments will use the new system.
OnStar, North AmericaThe OnStar in-vehicle communications service combines Global Positioning System (GPS) cellular technology and an around-the-clock service center. Originally launched by OnStar in Cadillacs in 1996 as an emergency concierge and road service, some OnStar vehicles have the ability to send and receive calls.
4.5.3. Radio Devices, Services
EchoNo longer in operation, Echo allowed people to create and broadcast their own internet radio stations. As songs appeared on the Echo player applet, you could rate the artist, song, and album. The site responded by refining your station to reflect your ratings. The result was that you ended up hearing a lot of new music that you should like.
Launchcast.comLAUNCHcast is a streaming music service that allows you to create a customized station tailored to your tastes. Rate artists and albums highly to hear them often and ban the ones you hate. You can also listen to an extensive collection of pre-made stations created by the Launchcast editorial staff. A basic station is free for up to 800 songs per month. After that, certain restrictions will apply: no customized radio, no song skipping, and only mono quality audio. Ads are played after every 2 or 3 songs, no matter where the user is in their 800 song allotment. For $3.99 per month, you get higher audio quality, unlimited customized station play, unlimited song skipping, no commercials, and exclusive stations.
Live365Internet radio service provider that allows people to broadcast their own stations over the Internet. Broadcasting includes playing music and talking. Those wanting only to listen to other people’s stations can use Live365’s standalone radio player to browse through hundreds of stations. Broadcasting a personal station starts at $7.95 per
30 July 2004 James Garretson, Whitney Hess, Jordan Kanarek, Mathilde Pignol, Megan Shia10

R o a d c a s t i n g
month, with the possibility to earn money by playing ads. For more money, you can run your station with Live/Relay mode. Live/Relay mode allows you to run your broadcast from your own computer and stream it over Live365’s network using our Studio365-Live software, or other third party broadcasting tools. Also, Live/Relay allows you to do live voice-overs between tracks, broadcast live events, and change your playlist on the fly. Live365 now (April, 2004) offers a bundled package that allows broadcasters to stream stations from their own websites. The bundle covers license fees for ASCAP, BMI, and SESAC, and is either $38 or $48 per month. The bundle is only available to broadcasters who stream exclusively with Live365.
A VIP listener membership starts at $3.65 per month and offers higher quality sound, no pop-ups, no ads, and access to hundreds of VIP-only stations.
Radio@NetscapeRadio@Netscape is an online radio player. Highlights include: access to over 175 originally programmed stations, which include music, news, sports and local radio, the ability to save up to five of your favorite stations, and the ability to rate stations. Only low-quality audio is available, and the player must be downloaded. Unlike other Internet radio stations, you cannot skip ahead to the next song, but a station can be paused.
Radio ParadiseRadio Paradise is an Internet radio station based in Paradise, CA. Their uniqueness, according to them, is the fact that they select music based on user feedback, and also whether each song blends smoothly with the next.
Radio YourWay, USAAM-FM transistor radio with a timer that enables you to record your favorite radio shows. Also has a microphone so that you can record voice notes. It records in Mono at 32 Kbps.
SHOUTCastSHOUTcast is a free-of-charge audio homesteading solution. It permits anyone on the Internet to broadcast audio from their PC to listeners across the Internet or any other IP-based network. The underlying technology for audio delivery is MPEG Layer 3, also known as MP3 technology. The SHOUTcast system can deliver audio in a live situation, or can deliver audio on-demand for archived broadcasts.
Walkman Busting, USA and UKGideon D’Arcangelo approaches people in public spaces who are listening to personal stereos. With their permission, he plugs in his minidisc recorder to record whatever music they are listening to, as well as their conversation about it. He then reports the results in a radio column called “The Next Big Thing” on NPR. “If you listen to what people are listening to, it’s not what you hear on the radio.”
XM Radio
30 July 2004 James Garretson, Whitney Hess, Jordan Kanarek, Mathilde Pignol, Megan Shia11

R o a d c a s t i n g
Originating at the XM broadcast center, XM’s broadcast signal is beamed from two huge earth-station antennas to our broadcast satellites, known affectionately as “Rock” and “Roll”. Positioned more than 22,000 miles above the earth in geostationary orbit, their beams combine to span the entire contiguous U.S. while remaining stationary with respect to the land below. This enables XM’s signal to reach from coast to coast. Ground antennas, or repeaters, keep the signal strong in challenging locales such as urban canyons. XM’s programming lineup features 100 coast-to-coast digital channels: 71 music channels, more than 30 of them commercial-free, from hip hop to opera, classical to country, bluegrass to blues; and 29 channels of sports, talk, children’s and entertainment. XM also brings to the car, for the first time on radio, the same diverse selection of 24-hour news sources available in the home on cable and DIRECTV. XM’s broadcast center in Washington DC includes a performance studio for live recording and broadcast.
4.5.4. Physical Devices
Car Mods (Hobby)People are installing computer components in their car in order to store thousands of mp3’s, create playlists, incorporate GPS navigation units, and to attempt to share music files. Brought together by bulletin boards, people are sharing tips and tricks on how best to incorporate computer technology into vehicles for entertainment purposes. Similarly, many people are “hacking” with their car in order to connect their iPods directly to their stereo, rather than using a cassette adapter.
CarBot, USAWhat do you get when you combine a fanless 12V computer, WiFi, GPS -– and a microphone? You get an unparalleled audioblogging and geospatial annotation tool. What if you bundle it as an MP3 jukebox that also reads back others’ annotations while you drive, creating a community of drivers siphoning data out of the blogosphere? You have the most buzzword-compliant consumer product ever! Includes an audio user interface.
Celldar (Cell Phone Radar), USACelldar works out the position of objects in the area by comparing the signals reflected from them with those it receives directly from a base station, whose positions are known. From the Doppler shift in the signal it can also calculate the target object’s speed. Because Celldar devices do not need their own transmitter, which is what makes conventional radars so expensive, they can be made cheaper, smaller, and more portable.
4.5.5. Research
Ad-Hoc Wireless Communities Via Wearable Computers, USA and UKHoward Rheingold: “The crowds who surround us every day constitute a huge waste of social capital. If you live in a city for instance, there are many who pass within a few
30 July 2004 James Garretson, Whitney Hess, Jordan Kanarek, Mathilde Pignol, Megan Shia12
R o a d c a s t i n g
yards of you each day who could give you a ride home, buy an item you’re trying to sell, or consider you as dating material. Dynamic networking makes it possible to tap those resources through a momentary alliance among transient interest groups.”
Automotive File Sharing, USA (weblog rant)Weblog entry about possibilities for music sharing if all cars had WiFi. Author thinks that streaming songs won’t work because cars go in and out of range too often. His idea involves: 1) Each car sets up a list of recommended music titles, broken down by genre. 2) Each car can also setup a list of wanted music, also by genre. 3) When cars come into WiFi contact, cars can ask each other to send over the recommended music if a genre match is made between the wanted list of one car and the recommended list of the other car. 4) Once new music has been transferred, the user can listen to it right away, or just go on collecting music and then upload it to the home jukebox when the car comes home.
Backseat Gaming, SwedenThe game turns churches, bridges and other roadside objects into a fantasyland filled with virtual creatures, treasures and adventure. By pointing the gaming device towards objects as they pass by, players can defend themselves against attacking creatures, pick up magic artifacts or collaborate with players in meeting traffic. Two different prototypes have been developed on handheld computers. The first uses a digital compass and GPS-receiver to connect the game to the surrounding world, and make it possible for the player to designate real world objects. The second is a multiplayer game for traffic encounters based on ad-hoc peer-to-peer networking, which connects players in each other’s vicinity.
Hocman, SwedenA prototype service designed to spark and further social interaction building on traffic encounters. It is based on handheld computers capable of short-range ad hoc wireless networking. When bikers head out on the road, the software continuously sensessimilar devices nearby. If another Hocman is in the vicinity it makes a sound to alert the biker that a meeting is taking place, and there also is an automatic exchange of web pages between the devices. The personal web pages may contain contact information, for-sale ads, pictures, etc. When the biker gets off his bike he can examine the log and read the pages captured. The pages can be helpful when planning future encounters, or when referring to rides in discussions.
Placememo, SwedenThe PlaceMemo prototype is being developed to facilitate infrastructure management tasks, like identifying, reporting and taking care of malfunctions along the roads. The vast working area of road inspectors makes it hard to remember all the identified defects and organize the work to fix them. This system enables the inspectors to associate memos to geographical locations along the roads. The prototype supports the simultaneous handling of reporting and receiving reminders while driving. Additionally, the memos could be shared among colleagues, for instance to enable job rotation.
30 July 2004 James Garretson, Whitney Hess, Jordan Kanarek, Mathilde Pignol, Megan Shia13

R o a d c a s t i n g
Real-Time Road Condition Info, USAAn experiment by Ford hopes to reduce traffic jams and inform drivers of bad weather conditions in real-time. This will be accomplished by turning cars into mobile traffic-monitoring tools by having them report their location, speed, headlight and windshield use, and anti-lock brake activation. Slow vehicle speeds with frequent stops would signal traffic congestion, for instance. Windshield use along with near-freezing pavement temperatures and ABS activations would point to slick conditions. Information from other sources, such as weather reports will be combined with the data from the vehicles and then posted to highway signs, 511 services, and websites. Eventually, Ford hopes to communicate current conditions to drivers via radio or other in-vehicle systems. Ford intends this to reduce traffic jams and inform drivers of bad weather conditions in real-time.
Smart Parking Meters, USAThe smart meter integrates digital network technologies with existing parking meter infrastructure. Sensors integrated into existing parking meters detect occupancy; parking meters talk with each other in a multi-hop scheme; drivers will be able to “locate” and “reserve” vacant parking spaces; and the parking space can email you or post a vacancy on a Web page, reducing traffic and saving time and fuel.
SoundPryer, SwedenA peer-to-peer application of mobile wireless ad hoc networking for PDAs. It enables music eavesdropping in traffic encounters, by streaming MP3 files. A user can play his or her own music, but also tune into other players and hear what they are playing as long as he or she is within close proximity. The SoundPryer application serves pure entertainment purposes: the fun of listening to music, either one’s own selection or somebody else’s. It draws on the idea that people take an experiential and aesthetic interest in the surrounding traffic, and that they are willing to share music, since people are effectively anonymous to each other in that situation.
TunA, EuropeThe TunA project is investigating a way to use music in order to connect people at a local scale, through the use of handheld devices and the creation of dynamic and ad hoc wireless networks. TunA gives the opportunity to listen to what other people around you are listening to, synchronized to enable the feeling of a shared experience. Also, TunA allows users to share their songs in many situations, while moving around, fostering a sense of awareness of the surrounding physical.
30 July 2004 James Garretson, Whitney Hess, Jordan Kanarek, Mathilde Pignol, Megan Shia14

R o a d c a s t i n g
5. Service and Interface Design Process
5.1. User-Centered DesignHuman Computer Interaction (HCI) is the both study of how people interact with technology, and the design of technology to be desirable, usable, and useful. In the iterative design-build-test cycle that we choose to follow, the final product or service is partly informed by the successes and failures that test users encounter with the design throughout iterations. The observation and recording of how individual users interact with our prototypes gives us insight into how we can improve our product to better meet the users’ needs and expectations.
By identifying our target audience – car buyers who will be at least 30 years old in the year 2010 – we were able to tailor our design to the appropriate group of users. We created personas of typical users who fit our target audience. By fictionalizing a personality, characteristics, interests, age, family, and career for a particular user, we are able to ask ourselves throughout the design process, “Would our user like this?”
The benefits of user-centered design are more productive and efficient product development, lower costs, and more satisfied and productive users.
For more information on the HCI methods employed throughout the course of this project, please see http://en.wikipedia.org/wiki/Usability_testing
5.2. Concept Generation and SelectionWe were presented with an intriguing task from the onset of the project – to design a service that was not only groundbreaking, as the project brief states, but also desirable. From the beginning, we identified commuters and travelers as two large, underserved market segments ripe for innovative services utilizing car-to-car communication.
We held our first brainstorming session in early February. We split into two groups in an effort to generate some initial ideas about services that could make use of ad-hoc networking. Each person started out with a series of blank sheets with sections for concept name, tagline, description, and sketch. After one person filled in a section, the sheet was passed off to another group member to fill in another section. The two groups rapidly generated concepts, building off each other’s ideas, without actually talking about them. At the end of the two-hour session, we had generated nearly 50 concepts.
We reviewed the sheets together, sharing ideas and showing the sketches. Similar ideas were combined into overarching concepts. Once everyone had a basic familiarity with the concepts, we entered their names into an anonymous, online survey and each of us voted on all of the ideas on a 5-point scale (I love it, I like it, I don’t care, I don’t like it, I hate it—Throw it away). If any of the ideas received a single vote of “I hate it—
30 July 2004 James Garretson, Whitney Hess, Jordan Kanarek, Mathilde Pignol, Megan Shia15

R o a d c a s t i n g
Throw it away,” the idea was eliminated. This gave each of us the power to veto an idea entirely, so that we wouldn’t be locked into working on a project we didn’t like.The online poll allowed us to establish that there was solid agreement on eight ideas. There was some disagreement on nine ideas and eleven ideas were thrown out.
Soon after, we met with Ko Kurokawa and received some initial feedback on a few of the ideas we had begun to work with. We split into two groups in an effort to discuss concepts and flesh them out with multiple sketches and descriptions. One group worked on a driver reputation system and the other worked on a concept involving games that could be played between drivers on the road.
We began by generating a list of technologies that have been, are beginning, or will be influencing the culture of people who comprise or will comprise our target market. We listed over forty such technologies and used this list to initiate discussion and thought on how cultural influences like TiVo, ATMs, online dating services, and Ticketmaster might be augmented by ad-hoc networking.
We created a design persona and devised his characteristics and interests to act as a sort of filter for many of the service ideas as we discussed them. “Ron” is a 30-something young executive in advertising who is newly married with no children. This persona helped us determine which of our innovative services could have the greatest positive impact on Ron’s life, enabling us to polish a set of a dozen ideas that, we speculated, would be useful to people like Ron.
With ideas generated from three unique methods, it was time to start pairing down and eliminating. In a group meeting, we listed all of the ideas that we felt had merit and rated them by a show of hands. We then ranked them based on their rating, and all but the top five ideas were eliminated. The remaining five ideas were each assigned to a member of the group to be fleshed out in a more detailed one-sheet write-up. In a second round the write-ups were rotated to other group members, providing a second-level of detail, particularly focusing on implementation and feasibility.
On February 18, in a conference call with Ko and Jay, we decided to eliminate one of the five ideas – billboards from which you could download content into your car – because it did not make use of an ad-hoc network. Then on February 23, we decided to eliminate the decentralized delivery network idea, dubbed EZ Delivery, because it would have been nearly impossible for us to prototype and because it was noted that GM would not be interested in such a service. Each group member rated the remaining three ideas on a 1-5 scale for four characteristics (easy to prototype, not obvious, inherent interest, educational value). Personal radio and car-to-car gaming both rated very highly though concern existed over the feasibility of prototyping a personal radio service. We decided to do research into potential supporting technologies and ultimately decided that the personal radio service would not be as hard to prototype as we had expected.
30 July 2004 James Garretson, Whitney Hess, Jordan Kanarek, Mathilde Pignol, Megan Shia16

R o a d c a s t i n g
5.3. User Needs Assessment through Participatory Design5.3.1 Purpose of Participatory Design SessionThe main purpose of this participatory design session was to better understand what people currently do in their vehicles during commutes. We also hoped to better understand what people might do in their vehicle if their radio were given additional functionality.
Specifically, we hoped to gather data that would help us make design decisions about our concept of an in-vehicle personal radio station. The areas of interest with respect to pending design decisions included:
Community-building or personal? Types of use: music, games, talk shows? Levels of control: what do they want/need? One-way or two-way communication? What is a “station”? Do users need to be told what “station” they are on? Is XM Satellite Radio useful/pleasant/worth the money? How are DJ’s currently perceived? Will people ever warn a station if they don’t like it?
5.3.2 ParticipantsOf the seven participants present at the participatory design session, five were male and two were female. Their average age was 31. All of the participants used their car at least five days a week to drive to work or school, averaging 48 minutes roundtrip. All participants either rarely or never used car pools.
5.3.3 Questionnaire
Name “Questionnaire”
Activities Questionnaire
Primary Objective Determine demographics of participants. Get a general idea of what they do in their car during commutes.
Secondary Objective Get participants thinking about being in their cars.
Materials Questionnaire with 25 multiple-choice and short answer questions, and a pen.
Moderator/Assistant Mathilde, with Jordan assisting
Duration 20 minutes
ProcedureEach participant was given the questionnaire to complete by themselves. They were able to write in additional comments directly on the paper if relevant.
30 July 2004 James Garretson, Whitney Hess, Jordan Kanarek, Mathilde Pignol, Megan Shia17

R o a d c a s t i n g
AnalysisEach questionnaire was analyzed in order to determine general trends within the participants. It should be noted that with only 7 participants, general trends can be noted, but statistical significance cannot be determined. For complete questionnaire results, see the Appendix folder on the Roadcasting CD.
0
1
2
3
4
5
6
7
Number of responses 6 5 0 0 1 3 4
Listen to the radio
Listen to CDs or cassettes Shave Put on
makeupRead a book
or the newspaper
Eat Talk on the cell phone
Answers to the question: What do you do in your car on your way to work or school?
0
1
2
3
4
5
6
7
8
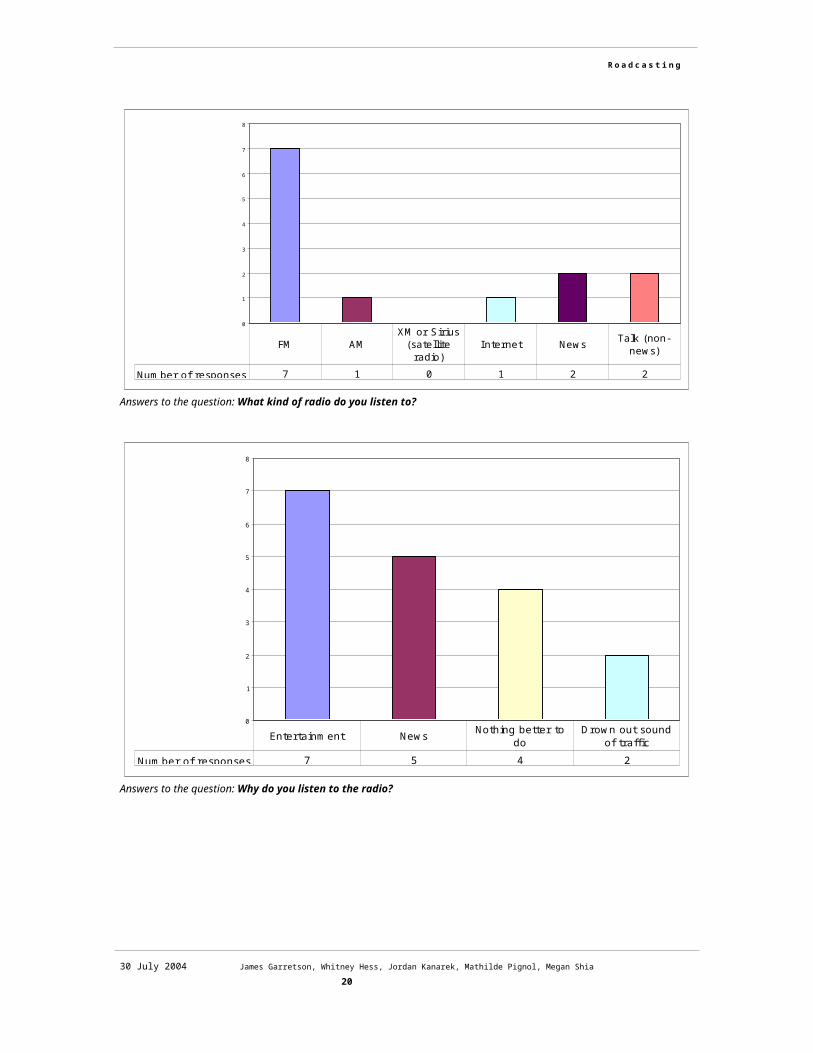
Number of responses 7 1 0 1 2 2
FM AMXM or Sirius
(satellite radio)
Internet News Talk (non-news)
Answers to the question: What kind of radio do you listen to?
30 July 2004 James Garretson, Whitney Hess, Jordan Kanarek, Mathilde Pignol, Megan Shia18

R o a d c a s t i n g
0
1
2
3
4
5
6
7
8
Number of responses 7 5 4 2
Entertainment News Nothing better to do
Drown out sound of traffic
Answers to the question: Why do you listen to the radio?
0
0.5
1
1.5
2
2.5
3
3.5
Number of responses 3 1 1 0 2
After every song or at the commercials Every 15 minutes Every 30 minutes Every hour I usually just leave it
on
Answers to the question: How often do you change radio stations when you are in the car?
30 July 2004 James Garretson, Whitney Hess, Jordan Kanarek, Mathilde Pignol, Megan Shia19
R o a d c a s t i n g
Answers to the question: Average times for ideal radio station in a given hour?
5.3.4 ActivitiesParticipants completed two exercises in addition to the questionnaire. The In My Car collage came first, followed by the Create Your Own Radio exercise. For examples of materials used in each exercise, see the Appendix folder on the Roadcasting CD.
In My Car Activity
Name “In My Car”
Activities Collages
Primary Objective When people think about their car and driving, what is important to them? What happens frequently when they are on the road? What is less import and less frequent?
Secondary Objective Break the ice; let participants ease into more relaxed, creative thinking.
Materials Poster boards with a bulls eye, markers, and stickers with pictures of car-related activities (e.g., listening to the radio, talking on a cell phone, eating, road rage, boredom, traffic etc.), and words (e.g., “messy,” “stressed,” “engine trouble,” “car seat,” “billboards,” etc.).
Moderator/Assistant Mathilde, with Jordan assisting
30 July 2004 James Garretson, Whitney Hess, Jordan Kanarek, Mathilde Pignol, Megan Shia20

R o a d c a s t i n g
Duration 40 minutes
ProcedureParticipants were given an 11x17 sheet with a dark orange circle labeled “frequent/important” and the periphery labeled “infrequent/not important.” They were also given 2 sheets of stickers containing car-related activities and a sheet of words. The moderator asked them to think about their activities/concerns for when they are driving and to place more important and frequent activities/concerns inside the circle and less important/frequent concerns/activities outside the circle. Participants were given 10-15 minutes to create a collage.
AnalysisWe analyzed the collages, looking for patterns. We rated words or images that appeared within the “important/frequent” circle as a “3”, on the periphery of the circle as a “2” and outside the circle as a “1.” Thus, more important activities/concerns have a higher total score than less important activities/concerns. Next, we grouped the concerns into several categories, based on their conceptual similarity. For example, pictures of donuts or coffee, or the words, “eat”, “drink” or “thirsty” are categorized as “eating/drinking.”
30 July 2004 James Garretson, Whitney Hess, Jordan Kanarek, Mathilde Pignol, Megan Shia21

R o a d c a s t i n g
Collages created by some of the participants.
CategoriesRadio Pictures: Old wooden radio, Dashboard car radio, DJs / Talk show, Sports
commentatorsWords: Controversial radio, New Music, Top 40, College Radio, AM, FM, Lots of Stations, Presets, Switch Stations, Public Radio, Commercials, Trivia games, News
Personal Music Pictures: CD, iPodWords: CDs, Mix tapes, Books on tapes, Bass, Loud Music
Safety Pictures: Accident, Drinking and driving (man holding beer at the wheel), Repair man looking under the hood, cell phone ear piece
Words: Safe, Dangerous, Unsafe, Engine trouble, Road Rage, Cut off, Bad driving, Police, Flat Tire, Sleepy
Eating/Drinking Pictures: Donuts, Coffee cup, Woman eating fast food behind the wheel, Fast food window take-outWords: Eat, Hungry, Thirsty
Communicating Pictures: Cell Phone, Woman holding her cell phone and driving, Man with a earpiece and microphone Words: Talk to friends, Cell phone, Email, Instant Messenger
30 July 2004 James Garretson, Whitney Hess, Jordan Kanarek, Mathilde Pignol, Megan Shia22

R o a d c a s t i n g
Distractions Pictures: Man shaving, Woman putting on makeupWords: Shave, Put makeup on, Read, Newspaper, DVDs, Games, Billboards
Isolation/Privacy Words: Crying, Sing to Myself, Quiet, Isolated, Private time
Getting There on Time/Delays
Pictures: Construction, Traffic, No traffic highway, Long trip (filling the trunk)Words: Traffic lights, On Time, Late, Lost, HOV Lane, Slow, Fast, Navigate, Commute
Aggravated/Bored/
Uncomfortable
Pictures: Man yelling, Man looking boredWords: Angry, Cramps, Uncomfortable, Stressed, Boring, Upset, Autopilot
Feel good Words: Laughing, calm, fun
With other people Pictures: Kids, Carpooling (picking up), Carpooling (on the road)Words: Kids, Car seat, Carpooling
Car interior Pictures: Neon interior carWords: Messy, Decorations
Important and Frequent Concerns/ActivitiesWe considered concerns/activities that had an average rating of 2.5 to 3.0 as Important. Everyone mentioned “radio” and “time/delays”. Nearly 90% mentioned “personal music” and “being aggravated/bored or uncomfortable”. Over half considered “safety”, “isolation”
Somewhat Important and Frequent Concerns/ActivitiesWe considered concerns that had an average rating of 1.6 to 2.5 as Somewhat Important. Everyone mentioned “Eating” and “communicating” as somewhat important and frequent. A little over half mentioned “feeling good” and a little less than half mentioned “driving with others” as somewhat frequent and important.
30 July 2004 James Garretson, Whitney Hess, Jordan Kanarek, Mathilde Pignol, Megan Shia23

R o a d c a s t i n g
The average rating of various concerns/activities and the percent of people mentioning them.
Make Your Own Radio
Name “Make Your Own Radio”
Activities Create a radio consisting of six functions
Primary Objective What functionality do people find important in a radio? Are people interested in increased functionality like the ability to send a song to a DJ?
Secondary Objective Get participants thinking about how they use their car radio in order to participate in a guided discussion about car radios, XM Satellite, and DJs.
Materials Paper with an incomplete car radio, markers, and stickers with a list of current and potential radio functionality (e.g., previous/next channel, search by genre, block station, favorites, etc)
Moderator/Assistant Jordan, with Mathilde assisting
Duration 25 minutes
ProcedureParticipants were given an 8.5x11 sheet with an incomplete car radio. The radio included a power button and an up and down arrow for volume control. In the center of the radio were six empty slots (see ). Each participant was also given a sheet of stickers containing labels of potential radio functionality (e.g. “Search by Title” and “Be the DJ). The moderator asked them to create their perfect car radio using the functions on the stickers or by writing in their own. Participants were given 10 minutes to create their radio.
30 July 2004 James Garretson, Whitney Hess, Jordan Kanarek, Mathilde Pignol, Megan Shia24

R o a d c a s t i n g
AnalysisEach participant’s radio was analyzed in order to get a count for the total number of times each functionality option was selected. Also noted was whether the participant had created their own functionality or changed the power or volume controls. Two participants added their own functionality and one changed the volume widget from two arrows to a dial.
It’s interesting to note that Tivo-like functionality was written in by two participants (one using the term “Tivo” and the other using the term “on demand”). Another interesting point is that some participants considered “favorites” and “presets” to mean the same thing while others thought they were referring to separate functionality. Finally, there was some interest in “Be the DJ” but also some confusion as to what it meant. One participant thought that it meant he could create something similar to a mix cd that would be useful on long trips. Two participants really liked the idea of being the DJ because it meant they would be in control of what they were listening to rather than relying on what’s out there. Another participant thought that the idea of being able to play a song on his friend’s car would be really cool.
30 July 2004 James Garretson, Whitney Hess, Jordan Kanarek, Mathilde Pignol, Megan Shia25

R o a d c a s t i n g
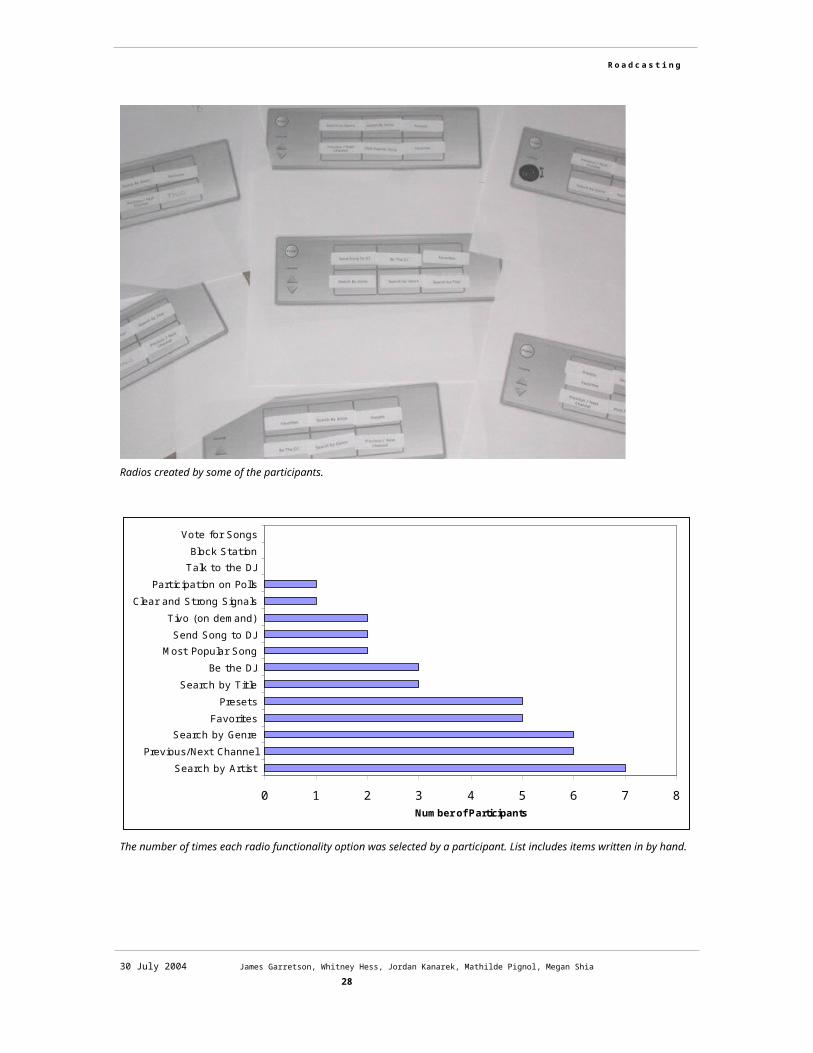
Radios created by some of the participants.
0 1 2 3 4 5 6 7 8
Search by ArtistPrevious/Next Channel
Search by GenreFavorites
PresetsSearch by Title
Be the DJMost Popular Song
Send Song to DJTivo (on demand)
Clear and Strong SignalsParticipation on Polls
Talk to the DJBlock Station
Vote for Songs
Number of Participants
The number of times each radio functionality option was selected by a participant. List includes items written in by hand.
30 July 2004 James Garretson, Whitney Hess, Jordan Kanarek, Mathilde Pignol, Megan Shia26

R o a d c a s t i n g
5.3.5 Group Discussion
Name “Radio Discussion”
Activities Guided Discussion
Primary Objective To determine what the participants thought of the functionality presented in the Create Your Own Car exercise. To ask specific questions not addressed by any previous activity.
Secondary Objective To ask follow up questions to any comments made earlier in the session. To provide a feeling of closure to the participants by letting them freely discuss the night’s topics.
Materials None
Moderator/Assistant Mathilde and Jordan
Duration 30 minutes
ProcedureModerators posed questions to the group. If no one responded to a question, the moderators would address participants individually to hear their opinion. A discussion atmosphere was strived for rather than a question and answer session.
AnalysisNotes from the discussion were analyzed to better understand the benefits of current in-car entertainment systems and also to identify opportunities for improvement. Key ideas brought out in the discussion centered on several themes, including: Radio as Controlled Chaos, Issues with Current Radio, Satellite Radio, and Being the DJ.
Radio as Controlled ChaosOne participant described his ideal music-listening experience to be that of “a balance of controlled chaos.” He didn’t want to know exactly what song was coming up next, because that was too boring. However, he also didn’t want the next song to be too weird. His ideal system would take a set of parameters for what he was feeling like at the time and then create an experience suited to him. This way, he’s entertained without having to do much work. This same participant raved about his iPod because he could select a category of music, such as Baroque classical, and then hit shuffle. He would then have hours of music with very little effort, and he wouldn’t ever know what song was going to be played next.
Issues with Current RadioNearly all of the participants had complaints about the current state of radio. One participant would get very annoyed that he’d hear the same song repeated three times on the same station over the course of a workday. This made the participant feel like certain music was being “marketed to him” and that he stopped thinking of the song as good but rather that it was “being forced down my throat.”
DJs were also an area of frustration for the participants. In nearly all cases, participants found DJs to be pretty annoying. One participant commented that she would change
30 July 2004 James Garretson, Whitney Hess, Jordan Kanarek, Mathilde Pignol, Megan Shia27
R o a d c a s t i n g
the station as soon as a DJ came on. Another said that the DJs on the station he listens to make him feel very old because they are obviously targeting a younger demographic than himself, even though he likes the music they play. No one found the information that DJs provide to be interesting because they almost never say the title and artist of songs, or they say they’ll play a song after the break and then never do. One participant once tried to call in to a DJ but wasn’t able to while driving because she couldn’t remember the phone number, operate her cell phone, and drive at the same time.
There was one exception to the general annoyance at DJs. One participant mentioned a former WRCT (CMU campus station) DJ that was really great. As soon as she said the DJ’s name, several other participants nodded in agreement about how good he was. She described this DJ as “hilarious, had a great record collection, kooky tunes, would broadcast in a fake Russian accent, and was really fun to listen to.” The problem with this DJ was that you never really knew when he was going to be on the air. But when he was, it was a big “treat”.
Satellite RadioOnly one participant had ever used satellite radio before, though several of the other participants seemed interested in the service. This participant had encountered it in a rental car. His first impression of the system was tainted by the large user manual that accompanied it listing all of the stations. He was disappointed with the experience because of the poor encoding of the classical music. He also described the classical music channels as being the “top 40 of classical,” meaning that even with over 100 channels, he still heard the same music over and over again.
Being the DJSeveral participants were intrigued by the general idea of being a DJ. However, most thought of this functionality as imposing their music on people driving near them. One participant really liked the idea of playlist-sharing because some of his friends have “way better musical taste” then him. Another participant thought that this would be ideal for long road trips with multiple vehicles. If everyone could listen to the same music, it would be like they were all “in 1 giant car” together.
5.4. State of RadioFew are optimistic about the state of FM radio these days. The staggering number of commercials and lack of musical diversity present on most FM radio means that listeners are often forced to settle for content that is “good enough.” In our participatory design session we heard firsthand plenty of complaints about the same, common songs played repeatedly and routinely on any given station. While satellite radio services XM and Sirius have delivered on promises of more than 100 CD-quality stations, it appears as if this national scale broadcasting is not without its flaws.We found that there are too many niches, interests, and tastes than even 150 radio stations can satisfy. There is a need for radio to address diverse audiences that it has never been able to before. The rapid growth and success Internet radio is in part proof of this need.
30 July 2004 James Garretson, Whitney Hess, Jordan Kanarek, Mathilde Pignol, Megan Shia28

R o a d c a s t i n g
There are very large communities that go unsupported on both traditional and satellite radio. For example, there are many major cities across the United States with large Spanish-speaking populations in which only one or two Spanish language stations exist. Despite having a greater population of Polish people than Warsaw, Chicago currently has no stations devoted to Polish programming. There is a severe lack of available radio frequency in most metropolitan areas and the financial burdens of running a radio station are too large; there are many obstacles for the average person to operate his or her own station (let alone be a DJ on one, as we discuss later). Satellite radio is not context or location sensitive; it necessarily ignores these regional and local differences. As satellite radio grows and mainstream media ownership becomes increasingly centralized, local content declines and is replaced with remote, syndicated content. The specialized entertainment needs of individuals cannot necessarily be met by such approaches to mass communication.
There are some non-commercial FM radio stations available in cities around the country. Traditionally, college and community public radio serve many niches and do so without commercials. However, these stations are mixed format, comprised of many different types of music, depending on which DJ is currently sitting in the booth. To someone without a schedule of shows, the stations appear random. People who want to make their voice heard and help shape the content of their station must share precious airtime with tens of other people. These people must be trained to operate within the FCC’s strict regulations.
We conducted contextual inquiries with three DJs on WRCT, Carnegie Mellon University’s independent FM radio station. Each of the DJs had one- or two-hour timeslots and performed a variety of activities. We observed them fumbling for CDs, creating a playlist, logging the songs played, periodically announcing the station identification, playing public service announcements, checking Instant Messenger for song requests, taking phone calls, and monitoring the station’s Internet MP3 web cast. The DJs were so busy they barely sat down. We learned that in order to get to the point where someone can DJ their own show, they need to interview with a training director, read a 37-page manual, pass a written test, apprentice with a current DJ, and pass air and log tests. And even after all this training, they have very little latitude as a DJ.
At the same time, interactive media is becoming more prevalent and popular in the mainstream. With the recent widespread release of video on demand services, television has the technology to become an interactive medium. Radio, even satellite and Internet radio, has yet to take on any sort of interactivity aside from the long-established call in shows. It doesn’t appear that there are any ways to make satellite radio any more interactive than traditional radio; two-way satellite communication is not yet available for the average consumer and it may be some time before it is even cost-effective to do so.
30 July 2004 James Garretson, Whitney Hess, Jordan Kanarek, Mathilde Pignol, Megan Shia29

R o a d c a s t i n g
5.4.1. Expert analysis of XM Radio.Satellite radio is gaining popularity with promises of 100-percent commercial-free music programming accessible from anywhere in the continental United States. XM, the leader in satellite radio, broadcasts more than 120 channels to its 2 million subscribers. Since GM is the only manufacturer to offer factory-installed XM head-units in more than 50 of their 2005 model vehicles, we felt it was essential to conduct an expert analysis of XM radio in order to build on its positive aspects and improve upon the negative. The heuristic evaluation that follows was performed on an out-of-car Delphi boombox unit.
Positive Aspects of XM RadioGood aspect Design implication
Stations play rare versions of songs that most listeners have not heard.
Look for alternate versions of popular songs on Broadcaster’s playlist – remixes, covers, live versions, etc…
Stations use celebrities, sound collages, and DJs to strengthen station identity.
Provide opportunities for Broadcaster to automatically or manually play a recording of her station identification.
Negative Aspects of XM RadioBad Aspect Design solution
Each station is identified by both a number of a unique name, forcing the user to memorize which station is associated with which number.
When implementing a browse function, stations can be identified by either name or number, not both. This is more appropriate for non-persistent stations.
Current song title playing is truncated if it is too long instead of using entire display.
Make efficient use of screen real estate. This will give users more detailed information about the stations.
It isn’t clear how to set presets or how to access them.
Eliminate presets. This is possible if the system is already knowledgeable of user’s music tastes.
Visual attention to the display is required while scrolling through stations.
Allow scanning through stations so that users can hear each song being played as they scroll to find a station they like. This will make navigation more natural and spontaneous.
Categories are not organized in a meaningful way
Organize categories according to user preference. This will reduce the amount of scrolling a user will need to do in order to find a category she enjoys.
Stations are organized by channel number, and in no understandable order.
Organize stations according to user preference. This will reduce the amount of scrolling a user will need to do in order to find a station she enjoys.
Stations sometimes play a strange order of songs: Paul McCartney -> Kiss -> Joe Cocker.
System should suggest next song to Broadcaster that has a similar tempo to what
30 July 2004 James Garretson, Whitney Hess, Jordan Kanarek, Mathilde Pignol, Megan Shia30

R o a d c a s t i n g
is being played. This will keep the tone of the station somewhat steady.
Stations play the same artists repeatedly. System should suggest songs and artists that have not recently been played.
5.5. Guiding Principle and Service OverviewIt became increasingly apparent that radio is in need of a major update beyond delivery methods, such as the Internet and satellite. We saw in radio a great opportunity for us to create innovative design in terms of interaction, interface, and service. Throughout the development of our project, which we have dubbed Roadcasting, our “guiding principle” was to combine the good things about listening to FM and XM radio and about being a DJ while eliminating the bad aspects of both.
the participatory design session.
Positive and negative aspects of being a DJ, as identified in our contextual inquiries with radio DJs.
In learning from and integrating the aforementioned desirable aspects of radio, we have designed a system that enables a more desirable radio service than has ever before been available. It exploits the strengths of ad-hoc networking to yield a new type of in-car entertainment experience that can be enjoyed even by the driver with no attention requirements.
One of the most innovative features of the service is its potential for musical diversity. Because of the underlying person-to-person architecture, users will have access to music that is not traditionally played on commercial radio. Users will be able to hear more than just the most popular songs offered by FM and XM radio; instead, they will hear music that has been chosen specifically for them (or with them in mind).
30 July 2004 James Garretson, Whitney Hess, Jordan Kanarek, Mathilde Pignol, Megan Shia31
Positive Aspect Negative Aspect
Plays free music Commercials
Makes commutes less boring Redundancy
Doesn’t need to be attended to Annoying DJs
Positive Aspect Negative Aspect
Sharing music is fun Music selection is tedious
Access to a captive audience Barriers to entry
Recognition FCC regulations

R o a d c a s t i n g
People can DJ from their cars, giving them the ability to broadcast their favorite songs to cars around them. Furthermore, they can listen to the stations broadcast by other cars and influence the songs being played through their own music tastes.
At its core, Roadcasting is a service that matches people to stations, and plays songs that people want to hear.
5.6. Service design5.6.1. Assumptions about usersThe chief assumptions about a user of Roadcasting is that he or she has an extensive digital music collection that is accessible to the system – either stored on a hard drive in the car, or stored on an mp3 player plugged into the device. The other assumptions that we made about our users – age, characteristics, interests, etc – are defined in the three personas below:
Ryan Walsh (primary listener persona)Ryan is a 31-year-old sales representative for an outdoor advertising company. He is recently married with no children. Ryan drives to his workplace in Downtown Pittsburgh from his newly purchased home in Penn Hills. Ryan’s job sometimes requires him to make driving trips to locations as far as Cleveland and Washington D.C., though most of the sites he visits in the region are about a 30-minute drive under optimal conditions. Ryan has a large CD collection, but he has listened to most of CDs so many times that they no longer interest him. He sometimes takes CDs, and his 100GB digital music player with backups of all these CDs, into his SUV, but he generally listens to the radio on the way to work. He wants to hear music that he already likes, but also enjoys being surprised, every now and then, by new music. He increasingly finds that the modern rock FM stations are playing music that he is not interested in. He wants to be entertained on his way to and from work. He notices that some stations play the same song multiple times throughout the day and is generally frustrated with the repetition on the radio. He likes the music that his favorite stations play, but he wants more diversity with fewer commercials. An XM radio head unit came pre-installed in Ryan’s 2008 Saab 93, but during his trial subscriptions he found there were only a couple stations that he was interested in; these stations were both fairly similar to stations that he could get on his FM dial for free. The rest of the stations didn’t seem to pertain to him all that much; he was annoyed by having to scroll through music of the 1940s, uncensored hip hop, and 90 other stations in order to find the type of classic and modern rock music that he likes.
Rolando Guzman (primary broadcaster persona #1) Rolando is a 27-year-old customer support representative for a major computer reseller located in suburban Vernon Hills, Illinois. He commutes about 80 minutes round-trip daily from far more urban Evanston. He listens to his iPod and CDs on his way to work. He subscribes to XM because he likes being able to listen to CNN when traffic gets heavy. Rolando grew up in Logan Square, Chicago a
30 July 2004 James Garretson, Whitney Hess, Jordan Kanarek, Mathilde Pignol, Megan Shia32

R o a d c a s t i n g
predominantly Latino community. He speaks Spanish at home and with friends while speaking English at work. He likes a mix of Latino hip-hop, and traditional Puerto Rican songs. He can’t find any of this music on the FM radio in Chicago (where both stations play predominantly Mexican pop music) or on Caricia or Caliente, the two Latin pop stations on XM. Sometimes he hears something he is interested in on the world music station but it is generally by accident. Because of this, he spends a lot of his free time (and some of his work time) on the web looking for music reviews and places to buy music that he is into. It is hard for him to find a lot of the music that he wants to own, even in Chicago. Every so often, he makes mix tapes for his friends so that he can share his music with them. Rolando wants an easier way to share his music, and his vast musical knowledge, with more people.
Melissa Devers (primary broadcaster persona #2)Melissa is a single, 30-year-old account executive for a major gourmet food distributor located in Walnut Creek, CA. She makes the 25-minute commute from her loft in Oakland four days out the week in her 2009 Chevy Malibu. On these commutes, she listens to the radio very rarely. She recently received a new 300GB iPod as a birthday present from her boyfriend and has recently begun backing up her massive CD collection onto the device. Melissa was a college radio DJ for two years when she was in college at UCLA. She had a good time but was never sure how many, if any, people were listening. Since then, she has not had the opportunity to DJ again. The local community radio stations broadcast from locations far from her loft and would require her to devote too much of her free time to her show. She liked to DJ because it was fun for her and afforded her some credibility in the L.A. music scene. She has listened to Internet radio in the past and had once thought about starting her own station, but she got anxious after learning about its complexity. She wants other people with similar tastes to know about emerging new bands and wants her listeners to know when and where people can see the bands that she plays. She also wants to use her radio station as a means to gain access to promotional copies of new albums and to interview some of her favorite musicians when they come to town.
5.6.2. Collaborative FilteringEach broadcaster will presumably have a personal collection of music, stored on CDs or on some manner of hard drive storage device (such as an iPod). From very basic knowledge of this collection, the Roadcasting backend will create a profile of music tastes for each user.
This profile is not a static snapshot of musical tastes but rather an ever-changing profile that enables the system to make accurate guesses about the music that a listener enjoys hearing. As a listener listens to Roadcasting stations, the system learns about their musical tastes – if she skips over rap music quickly, that will be understood as a current aversion, whereas if she listens to a polka station for an hour, that will be understood as a current fondness.
30 July 2004 James Garretson, Whitney Hess, Jordan Kanarek, Mathilde Pignol, Megan Shia33

R o a d c a s t i n g
Because the system understands what each Listener likes and is looking for, Roadcasting stations can be organized according to a listener’s preference. Stations are organized by the aggregate categories that they fall into. These categories will appear in order of preference, and the stations in each category will appear in order of preference. Additionally, an “All Stations” category lists the Listener’s most liked stations across all categories in order of preference. “All Stations” will always be the first category in the list.
5.6.3. Levels of Interaction and VotingEvery Broadcaster has three levels of involvement:
Managed: Broadcaster determines what is played and when
Guided: The broadcaster determines what is played with input from the audience
Unmanaged: The broadcaster is not involved in song selection. The collective audience chooses what is played either by active voting or passive submission of preferences.
30 July 2004 James Garretson, Whitney Hess, Jordan Kanarek, Mathilde Pignol, Megan Shia34

R o a d c a s t i n g
Every Listener has two levels of involvement:Active: The listener votes from a selection of three songs to be played.Passive: The listener does not vote.
Broadcasters and Listeners move between levels of involvement based on the amount of attention they can give to the service. This allows broadcasters and listeners to tailor their interactions depending on their driving situation. For instance, a driver who is on city streets and is talking on a cell phone probably will interact with Roadcasting less frequently than a commuter stuck in heavy traffic. The seamless shifts between modes will ensure that safety is always the number one priority.
When a Broadcaster is in a tense driving situation and cannot attend to his or her station, the system will automatically go into Unmanaged mode. Listeners can opt-in to vote on three song options and these votes, as well as the music tastes of Passive Listeners, will collectively determine the next song played. When a Broadcaster has more time to attend to the station, he or she can be in Guided mode or Managed mode. In Guided mode, the voting options are available to the Broadcaster and he or she chooses the next song played. In Managed mode, no votes are sent and the Broadcaster chooses the next song played, without consideration of the music tastes of his or her current listeners. In all voting-inclusive modes, the collaborative filtering engine chooses the top three songs to be voted on.
All Roadcasting listeners are automatically broadcasters. This enables a network full of many stations and prevents “leeching” effects like those seen on file-sharing networks like Gnutella.
5.6.4. Station FlavorWe have forecasted that in 2010 the individuals that comprise our target market may carry up to 400 gigabytes of digital music with them. In examining our own digital music collections and those of others, we saw that digital music collections can be incredibly diverse. A large digital music collection does not automatically make much of a cohesive or themed radio station. As a result, we designed a system that enables
30 July 2004 James Garretson, Whitney Hess, Jordan Kanarek, Mathilde Pignol, Megan Shia35

R o a d c a s t i n g
users to quickly set the musical bounds for a station. We call these bounds the “flavor” of the station.
Broadcasters will be able to determine the makeup of their station, as they see fit, using a process of “flavor” selection. This allows a Broadcaster to specify exactly what types of music he or she wants to play, down to the artist level. We have designed this system in a manner that is conducive for fast and simple selection.
By enabling and supporting a set up of station bounds, we are able to gain information that allows for the categorization of stations. Station flavor gives the system the ability to make accurate statements about what type of music will be playing no matter who is listening to the station. This allows listeners to find stations that correspond with what they want to hear; this is one of the challenges we identified from an early stage of the project and one that we wanted to make sure to get right.
5.6.5. ScalabilityIt is crucial that the Roadcasting system work well no matter how few or how many listeners are tuned into an individual station. For that reason we have designed Roadcasting in a way that scales gracefully regardless of the number of people in the network.
When there are no Listeners tuning into a Broadcaster’s station, Roadcasting can choose songs to play to the Broadcaster based on his or her own music tastes. It can also act as a personal jukebox, playing songs that have been selected from a multiple-choice voting system. Additionally it can play songs from a playlist defined elsewhere, such as on a portable digital music player.
When there is one Listener tuning into a Broadcaster’s station, the Listener will have some influence on the station if the Broadcaster is in Guided mode and will have total influence on the station when the Broadcaster is in Unmanaged mode.
When there are 10 Listeners tuning into a Broadcaster’s station, the Listeners will have some collective influence on the station if the Broadcaster is in Guided mode and will have total collective influence on the station when the Broadcaster is in Unmanaged mode.
The same goes for 100 Listeners, 1,000 Listeners, and so on.
30 July 2004 James Garretson, Whitney Hess, Jordan Kanarek, Mathilde Pignol, Megan Shia36

R o a d c a s t i n g
No matter how many or how few Listeners, every station will maintain a stable identity based on the parameters of the Station Flavor determined by the Broadcaster.
5.7. Prototyping TechnologyAs 5.6 explains, our system prototypes contain a few innovative twists on, and combinations of, current and upcoming commercial technologies. These innovations will be explained in detail in this section.
30 July 2004 James Garretson, Whitney Hess, Jordan Kanarek, Mathilde Pignol, Megan Shia37

R o a d c a s t i n g
Over the course of the project, two major prototypes and one interface proof-of-concept were developed – the initial prototype using Flash; the other two, Java. Both prototypes were initially built to support user-testing needs, with additional functionality added later as test results directed. As a result, producing useful, testable systems in the shortest possible time was the priority, so the prototypes do not follow best practices for system architecture or coding patterns.
5.7.1. Determining a User’s Musical PreferencesThe song was chosen as the fundamental building block for preference determination. This decision was made because digital music files were readily accessible to us – over the course of the project, we amassed a 90GB library of mp3 files, tagged across 65 genres.
The preference builder reads song information from either the mp3 files themselves, or from an iTunes-derived XML library file. (Tagging technologies made identifying the mp3 files possible; a demo version of Gracenote’s MusicID audio fingerprinting service was used to tag our test music. All references to artists, genres, albums and titles are based on ID3V1 and V2 tags.) A number of fields were available through these sources:
Genre Artist Album Title Date added (iTunes only) Playcount (iTunes only) Last play
Retrieving this information from all the files a user specifies allows some extrapolations to be made:
Average age of a user’s music collection.o Which songs are new additions.o Which songs are likely old favorites. Percentage that a particular genre comprises of the overall library.o How much a user likes this genre.o How eclectic a user’s tastes are.
Each song is then awarded a score, based on its playcount and age. (The score ranges and importance of individual components were arrived at through simple tweaking, and not through any mathematical or statistical process.) Each song is also assigned a unique key, which is a string of text composed of the song’s genre number (taken from the ID3V2 spec), its artist, album, and title. This key is unique for each song (we also ignore duplicate songs using these keys). Once rough ratings have been assigned, the songs are arranged in a root-less tree (implemented as nested arrays). The tree is arranged based on the songs’ keys, with
30 July 2004 James Garretson, Whitney Hess, Jordan Kanarek, Mathilde Pignol, Megan Shia38

R o a d c a s t i n g
the topmost level of the tree being genre nodes. The child of each genre node is an array of artists. The child of each artist node is an album, and the child of each album is the song (containing, among other things, the assigned score and the path to the file in the file system). In this way, the tree represents a complete hierarchy of known songs.
Song scores are then propagated up the tree, with each node’s score determined by both the average score of its children and its number of siblings. The scores propagate to the top of the tree, and then sum back down to the bottom. In this way final scores are stored at each level of the tree, and every child of a node has at least the score of its parent. (This is useful when combining preferences using collaborative filtering – a user prefers a specific song more than the album from which it came, which is in turn preferable to the artist in general, which is preferable to the genre.)
The finished tree is contained within a Preference object. The tree contains everything we’ve deduced about a user’s musical tastes. Note, also, that as a supplemental access method, each node in the tree is also referred to via a hash map which maps each key directly to its corresponding node. In this way, a Preference object can be tested for the existence of a particular song in O(c) (constant time). This was added to allow for very quick access to a particular song for score retrieval or modification, such as happens inside the collaborative filtering / recommendation system (or might happen if the system adjusted scores based on a user’s interactions with the system).
5.7.2. Collaborative Filtering ImplementationA collaborative filtering algorithm is one that makes predictions about an individual’s tastes based on the known tastes of a large population. What has technically been implemented here is a recommender system, which is a system designed to predict interests based on a particular collaborative filtering algorithm1.
The particular algorithm implemented for this system is the simple Pearson correlation algorithm2. This algorithm was chosen over its competitors (including: clustered Pearson, combined Bayesian and correlation networks, and support-vector method) due to its ease of implementation, execution speed, lack of a training requirement, and tolerance for missing data.
Explanations of the Pearson correlation algorithm are readily available, but the main idea is that a user’s score for a song he or she is unfamiliar with can be predicted based on the scores other users assigned to the song, and the degree to which our user is similar to the other users. In this way we are able to combine Preference objects: we take the union of all songs (albums, artists, genres) known to all users, and calculate the sum of all users’ ratings for each song. Sorting the result yields a playlist which incorporates the tastes of the entire listening audience.
1 See http://en.wikipedia.org/wiki/Recommender_system2 Resnick, Iacovou, Suchak, Bergstrom, Riedl. "GroupLens: an open architecture for collaborative filtering of netnews." 1994.
30 July 2004 James Garretson, Whitney Hess, Jordan Kanarek, Mathilde Pignol, Megan Shia39

R o a d c a s t i n g
The major problem encountered during development was that a song was often unknown to all other users (since a small number of listeners were tuned to a station at any given time). As a result, combined scores were often impossible to predict. The Roadcasting system handles this by falling back to higher nodes in the Preference tree. For example: user X has a song which no other user has a score for. Ordinarily, this song cannot be scored – but the Roadcasting system will look for the other users’ scores for the album the song comes from. If that score exists, it is used. Otherwise, a score for the song’s artist is checked. If that doesn’t exist either, the genre score (if any) is used. (This ties back to the Preference scoring system: child nodes are scored at least as highly as their parents.)
This modification made scoring possible between users with little in common. The recommender system would probably not be possible without it.
Note that the recommender system described here could potentially be applied to current products; if a user’s preferences can be deduced based on interaction with a device, as we assert they can be, then this information could be combined with current radio stations’ playlists in order to recommend stations, artists, and songs to the user. This seems particularly useful in the case of XM radio, where there are perhaps too many choices to constantly seek through.
5.7.3. Flavor ImplementationStation flavor is implemented as a Preference tree that contains only genre and artist nodes, and contains no scores. Also like a Preference, the tree is indexed by a hash map, so artists can be looked up in constant time. This implementation makes the flavor setup screen easy to generate and update, and the key system makes the tree easy to transmit across a network (see Preference Transmission under 5.7.6.Network Architecture).
5.7.4 Automatic Station CategorizationStations are placed into categories by listeners’ tuners based on the announced station flavor. By categorizing in this manner, individual listeners’ tuners can theoretically categorize stations according to each listener’s preference. In the final prototype, however, all tuners categorize in the same simple way: a station is placed into a particular category if any category in the flavor comprises at least 25% of the total artists. Therefore, stations can be placed in multiple categories.
If no category covers at least 25% of the artists, the station is categorized as ‘Eclectic.’ Clearly, there is a lot of room for improvement over this method.
5.7.5. Station MatchingStation matching is implemented in our final prototype very simply: a station’s match is equal to the average rating our user assigns to all the artists in the station flavor.
30 July 2004 James Garretson, Whitney Hess, Jordan Kanarek, Mathilde Pignol, Megan Shia40

R o a d c a s t i n g
The five-stars are then calculated based on quintiles relative to the rating assigned to one’s own station; one’s own station is always rated as four of five.
It is possible for another station to rate higher than one’s own; for example, another station can have a large number of artists unknown to our user inside a genre our user likes. This would cause the rating to be higher than our own.
5.7.6. Network ArchitectureThe Roadcasting service defines an interesting combination of methods for disseminating and transmitting information. In order to broadcast a station efficiently to all nearby listeners, a simple, one-to-many connection is required. This model is similar to that used by CB or broadcast radio: a single antenna broadcasts on a unique frequency, and the data can be received by tuning to that particular frequency. Our service requires alterations to this model in order to support potentially thousands of stations transmitting digital information simultaneously – some method for fitting all the stations into the radio space must be devised – but the topology remains the same.
The second transmission model implied by our service is a large number of individual mobile-to-mobile connections – similar to a LAN or Internet network. Vehicles must be able to connect directly to one another in order to transmit listener-specific information.
The final network is entirely self-contained. Each station looks like this:
Network topology.
The Roadcasting prototype implements this network. It operates over an 802.11 network, and makes use of both the TCP and UDP protocols.
Station AnnouncementFor station announcement and discovery, a random multicast address was chosen. This address is broadcast to every 4-6 seconds (chosen randomly) by a live station, and the address is monitored by every tuner.
30 July 2004 James Garretson, Whitney Hess, Jordan Kanarek, Mathilde Pignol, Megan Shia41
R o a d c a s t i n g
A good amount of information is included in a station announcement:
Protocol version. Station name, message and icon ID. Multicast IP address of audio stream. IP address (and port) of broadcaster; this is where preferences are sent. Station flavor. Current number of listeners. Current song’s artist and title.
To reduce network traffic, the station announcement is compressed before transmission. The announcement is sent as a single multicast UDP packet.
Station DiscoveryWhen a tuner receives a station announcement, it checks to see if the station is already known. (If the station is already known, the cached values are updated.) If the station is new, the tuner connects to the specified multicast audio stream IP and mutes the received sound.
(Important note: the tuner is actually receiving and processing every known station’s audio stream, all of the time. Switching stations simply mutes the old station and un-mutes the new station. This allows for instantaneous station switching, which seems otherwise very difficult to do, at the expense of huge processing and memory overhead.)
Station ExpirationEach station’s audio stream is constantly monitored by a custom “silence detector,” which periodically checks the stream’s bitrate. If the stream is silent for 30 seconds, the station is considered “dead” and removed.
Preference TransmissionAfter 90 seconds of listening to a particular station, a user’s tuner will send the user’s Preference to the station in order to influence the future direction of the station. It will then retransmit the Preference every 90 seconds; the retransmission functions as both a heartbeat and as an opportunity for the Preference to change from minute to minute.
A Preference object is converted to a text string by sending all the songs’ ratings and keys; the keys can be used to reconstitute the Preference tree on the other side, and the ratings can then be matched to the proper locations.
The Preference string is compressed, and then sent to the broadcaster using the IP address and port specified in the station announcement. The actual transmission is direct, point-to-point TCP – fellow audience members do not receive one-another’s preferences.
30 July 2004 James Garretson, Whitney Hess, Jordan Kanarek, Mathilde Pignol, Megan Shia42

R o a d c a s t i n g
Preference ExpirationA broadcast station monitors and updates the retransmitted audience Preferences, and rebuilds the station playlist each time a new Preference arrives. If the Preference object has not been updated after 90 seconds, the listener has assumedly left the station and the Preference is discarded.
Note that a station determines how many listeners it has based on the number of Preference objects it has.
5.7.7. Summary of Java PrototypeDevelopment environment:
Java 1.4.2_04 SDK Eclipse 2.1.3 IDE Windows XP Java Media Framework 2.1.1a
Incorporated libraries: Graphics libraries and fonts from MIT Media Lab’s Proce55ing project.
http://www.proce55ing.net/ GUI elements from Java Swing. MP3 tag reading capabilities from the mp3info project.
http://sourceforge.net/projects/mp3info/ XML parsing capabilities from the SAX project and the Apache Xerces2 Java Parser.
http://www.saxproject.org/http://xml.apache.org/xerces2-j/
Target environment: The prototype runs on Windows 2000 and XP with Java Runtime (JRE) 1.4.2_04. (The
JMF .jar is included with the prototype and loads itself.) Older versions of Windows were not tested.
The prototype does not properly play audio back on Mac OS X with JRE 1.4.2_04. It is suspected that JMF 2.1.1a has thread- or mute-related bugs. Stations can be successfully created on OSX computers and received by Windows computers, however.
Miscellaneous notes: A screen size of 530x300 pixels was used for the final prototype. The 16:9 ratio was
chosen because we knew what sort of information we needed to display, and already had ideas regarding how we wanted to relate screen elements spatially. 16:9 was chosen because it accommodated our initial visual design. The pixel dimensions were chosen because they described both the smallest screen we felt comfortable designing for, and the largest screen we felt we could reasonably recommend be placed in a car. (In terms of manufacturing, this screen is small even in 2004 – we feel it would be quite inexpensive to include in 2010.)
Java Media Framework (JMF) 2.1.1a was used because succeeding versions do not support mp3 decoding. As 2.1.1a was released years ago and is somewhat unstable, many errors and glitches related to audio streaming (in particular, ones rendering the
30 July 2004 James Garretson, Whitney Hess, Jordan Kanarek, Mathilde Pignol, Megan Shia43

R o a d c a s t i n g
prototype unusable on Mac OS X) may have been fixed since it was released. At the time of writing, the current edition is 2.1.1e.
Because the JMF is loaded from its .jar when the prototype starts up (thereby allowing the prototype to run without prior installation of the JMF, which requires an Administrator account on a Windows machine), microphones are not detected. For microphone support, the JMF must be properly installed through Windows.
The JMF was hacked considerably for this prototype in order to allow, among other things, multiple files (and live voice) to be played back seamlessly in a single RTP session. In all, the JMF was not an ideal choice for audio platform, but it worked well enough for our limited purposes.
5.8. Prototype I5.8.1. Description of design, functions, features
This is our initial interface design. The crosshair on the left is how users can navigate among the stations. As labeled, the up and down buttons scroll through the various categories, and the left and right buttons scroll through the stations in a particular category.
The display on the right indicates the artist of the song at the top of the screen with the song title below it, truncated after 25 characters. Beneath it is the name of the category that the station is in, as well as the name of the station (indicated here simply by “1” since it is the first station in the Rap category).
The three buttons beneath the screen – 1, 2, and 3 – are voting buttons. We initially had designed the service to prompt listeners to vote on the next song at a certain amount of time before the end of the current song. When it was time to vote, the
30 July 2004 James Garretson, Whitney Hess, Jordan Kanarek, Mathilde Pignol, Megan Shia44

R o a d c a s t i n g
system would either beep or say “Time to vote” and then the following screen would appear:
The 1, 2, and 3 buttons would map to a particular artist, and the song options would scroll through with the artist and song title. A user would hit the 1, 2, or 3 button to vote for the associated song.
Search Versus BrowsingWe did a literature review in order to decide whether the interface should allow for searching or browsing for stations. The following is a summary and analysis of a paper describing a study that investigated consumer preferences of searching versus browsing for Web-based product information.
Detlor, B., Sproule, S., Gupta C. (2003) Pre-Purchase Online Information Seeking: Search Versus Browse. Journal of Electronic Commerce Research, 4 (2), 72-84.
Method and ParticipantsThirty-one participants, undergraduate business students, performed two online shopping tasks – one searching and one browsing – on five well-known retail sites. The browse task simply instructed the participant to find a gift for a friend. The search task required the participant to find a digital camera as the gift. The order of tasks and websites were counterbalanced. Pre-test and post-test questionnaires were used.
Finding Design ImplicationParticipants cared more about the navigation and organization and the reliability of the
If browsing is implemented, efficient navigation and organization of the categories
30 July 2004 James Garretson, Whitney Hess, Jordan Kanarek, Mathilde Pignol, Megan Shia45

R o a d c a s t i n g
website in the browse task than in the search task. They cared more about detailed product specifications in the search task than in the browse task.
and stations is essential. If searching is implemented, users should be presented with detailed information in order to ensure that correct song/station was found.
In the browse task, the most useful aspects of the website were found to be interface context (52% respondents), advice features like recommendations and reviews (35%), and good product descriptions (26%). In the search task, the most useful aspects were good product descriptions (65%), advice features (58%), and interface context (42%).
While good interface, advice features, and product detail are important whether searching or browsing, good interface is most important when browsing and product detail most important while searching.
More participants used gift recommendations in the browse task (30%) than in the search task (6%) (p<0.05).
Song/station recommendations would be preferable to limitless scrolling when browsing.
More participants used product reviews in search task (80%) than in browse task (52%) (p<0.05).
If search is implemented, users will still want to know general opinion on an individual song/station. Perhaps this can be achieved with # of current listeners, or # of frequent listeners, or some other rating method.
This following is a summary and analysis of a paper describing two studies that examined how users decide between browsing and searching functions on e-commerce websites.
Katz, M., Byrne, M. D. (2003) Effects of Scent and Breadth on Use of Site-Specific Search on E-Commerce Web Sites. ACM Transactions of Computer-Human Interaction, 10 (3), 198-220.
Method and ParticipantsIn Study 1, twenty undergraduate students at Rice University served as participants. Pre-test and post-test questionnaires were used to determine participants’ familiarity with websites used during test and online shopping in general, as well as expected results from browsing and searching on e-commerce sites. Twenty e-commerce sites were used, each with both browsing and searching functions. Participants were asked to locate a unique item on each site, 10 of which were general items and 10 of which were specific (ex: “Softball bat” versus “Air Storm GPT Softball bat”).
30 July 2004 James Garretson, Whitney Hess, Jordan Kanarek, Mathilde Pignol, Megan Shia46

R o a d c a s t i n g
Finding Design ImplicationOverall, search rate for specific items (0.45) was greater than search rate for general items (0.42), but not statistically significant (p<0.30). This countered the prediction.
When a user is looking for a specific song or station, it may not be significantly preferable to use a search function rather than a browse function.
Browse function had higher success rate than search function, though the finding was not statistically significant. Failure rate was even for browse and search functions.
Users may be more likely to find the song/station that they are looking for by using menus.
Searching was not reliably faster than browsing. Instead, successful product locations took more time than unsuccessful attempts overall. When Participants assessed their results as unsuccessful, they would backtrack through menu options or search again.
Success is more difficult to judge than failure. If a user hates a song, she will quickly pass over it and continue to look for something pleasing. But success, a good song or good station, may take a while to find – whether browsing or searching.
Upon realizing that the current method was unsuccessful in finding the desired results, participants would switch methods (from search to browse, or vice versa). The mean number of switches per item was 0.31. “…the decision on how to locate an item is a fluid and dynamic process.”
Users will be comfortable using browse and search functions in conjunction when trying to locate a desired song or station, and the user will more likely be satisfied with the results with the presence of both functions.
5.8.2. Round 1 User TestingPurposeThis first round of user testing focused on two main areas: specific interaction elements of the interface, and desirability of the service.
With respect to the interface, the following aspects were investigated: Navigation Information displayed Voting prompts Vote placement
Data based on each participant’s overall experience using the prototype was sought in order to make conclusions about the desirability of the Roadcasting service model.
30 July 2004 James Garretson, Whitney Hess, Jordan Kanarek, Mathilde Pignol, Megan Shia47

R o a d c a s t i n g
ParticipantsTwelve people, eight men and four women, participated in this round of testing. The participants had an average age of 25 and an average commute of 30 minutes, round trip. Most of the tests were run with one participant at a time. However, two of the tests included married couples who completed the test together. Each participant signed a non-disclosure agreement, in addition to a consent form.
MethodologyThere were 11 sections to each user test:
1. NDA2. Consent form3. Pre-test Questionnaire4. Reading of the participant script5. Driving practice6. Exploration of the prototype interface7. Driving task with the prototype8. Exploration of the XM Satellite9. Driving task with the XM Satellite10. Post-test questionnaire11. Money and Receipt exchange
Steps 6-9 were rotated in order to counter-balance the participants. So, half of the participants completed each section in the order listed above, while the other half sections 6-9 in the following order:
6. Exploration of the XM Satellite12. Driving task with the XM Satellite13. Exploration of the prototype interface14. Driving task with the prototype
See the Appendix folder on the Roadcasting CD for the NDA, consent form, participant script, pre-test questionnaire, and post-test questionnaire materials.
Throughout sections 6-9, participants were encouraged to think aloud. Thinking aloud is simply the act of speaking exactly what you are thinking and why. This enables the note taker to more-accurately record why the participant is making particular choices and actions.
Pre-Test Questionnaire
Name “Pre-Test Questionnaire”
Activities Questionnaire
Primary Objective Determine demographics of participants. Get a general idea of what they do
30 July 2004 James Garretson, Whitney Hess, Jordan Kanarek, Mathilde Pignol, Megan Shia48

R o a d c a s t i n g
in their car during commutes.
Secondary Objective Get participants thinking about being in their cars.
Materials Questionnaire with 25 multiple-choice and short answer questions, and a pen.
Moderator/Assistant Moderator: Rotated between Megan, Mathilde, and Jordan
Assistant: Rotated between Megan, Mathilde, Jordan, and Jim
Duration 10 minutes
ProcedureThe pre-test questionnaire was given to each participant upon their signing of the NDA and consent form. Participants had as much time as they needed to complete the questionnaire.
AnalysisEach questionnaire was analyzed in order to determine general trends across the participants.
Radio Use (Frequency
0
2
4
6
8
Number of Responses 6 5 0 1
Every time I'm in the car Sometimes Rarely Never
Answers to the question: How often do you listen to the radio in your car?
30 July 2004 James Garretson, Whitney Hess, Jordan Kanarek, Mathilde Pignol, Megan Shia49

R o a d c a s t i n g
Why Listen to the Radio
02468
10
Number of Responses 8 3 4 3
Entertainment News Nothing better to do Other
Answers to the question: Why do you listen to the radio (check all that apply)
Driving Simulator Tasks
Name “Driving Simulator Tasks”
Activities Use of different radios while using a driving simulator
Primary Objective What do people think each aspect of a radio’s interface does? Are people able to use the radio while driving? (XM Satellite Radio and Roadcasting prototype)
Secondary Objective Do people enjoy using each radio?
Materials Driving simulator, Roadcasting prototype, XM Satellite Radio
Moderator/Assistant Moderator: Rotated between Megan, Mathilde, and Jordan
Assistant: Rotated between Megan, Mathilde, Jordan, and Jim
Duration 30 minutes
ProcedureAs stated previously, the participants were counter-balanced so that half used the Roadcasting prototype first and half used the XM Satellite radio first. No matter which radio was used first, each participant explored the interface before they were asked to use it while driving. Participants were asked to verbally describe what they thought each button on the interface did, without actually touching it. After they’d described the entire interface, they were able to play around with it and see if their initial assumptions were correct.
Once familiar with the interface, participants were asked to use the radio while driving. Their only task was to “find something you’d like to listen to.” If a participant wasn’t
30 July 2004 James Garretson, Whitney Hess, Jordan Kanarek, Mathilde Pignol, Megan Shia50

R o a d c a s t i n g
thinking aloud, the moderator would prompt them by saying “Can you talk to me about what you’re thinking?” or “Is this something you’d like to listen to?”
For the two tests that included couples rather than a single participant, the procedure for the test was exactly the same except that one participant was the “driver” and the other was the “passenger.” No additional instructions were given to couples.
Driving Simulator Setup
30 July 2004 James Garretson, Whitney Hess, Jordan Kanarek, Mathilde Pignol, Megan Shia51

R o a d c a s t i n g
Sony PlayStation with Gran Turismo 2
Force-feedback steering wheel
Projector
Touch Screen for the interface
Digital Camera recording the participants
Web cam recording the participants' driving performance
Camtasia capturing the participants' use of the prototype
AnalysisDuring each test, detailed notes were taken that included participant’s actions as well as thoughts. Once all 12 tests were finished, these notes were reviewed in order to capture trends.
30 July 2004 James Garretson, Whitney Hess, Jordan Kanarek, Mathilde Pignol, Megan Shia52

R o a d c a s t i n g
Roadcasting TrendsDisplay
Text is hard to read (font too small) Album names would be nice to know Important to have peripheral info Want to see time info for songs Customizing would be nice Counter is helpful Physical buttons are desired Station names are evident (only one test to support)
Categories/Stations Stations/categories have unpredictable order, wrapping around Stations/categories navigation good Categories are broad “Wrong” categories Stations disappearing are confusing Large category text is good
Voting Most didn’t remember what they voted for Voting not noticed right away Voting too often is annoying Desire for ability to turn voting off (1/3 of people) Mixed feelings about when vote will play Voting seen as rating What prompts voting? Song name not clear when voting How others voted could be interesting Voting time not adequate when listening to clips Mixed feelings about the idea of voting Voting only on highway/long trip/at stop light
Voting Prompts: Beep vs. Voice Mixed feelings about beep/voice, one isn’t any better than the other
30 July 2004 James Garretson, Whitney Hess, Jordan Kanarek, Mathilde Pignol, Megan Shia53

R o a d c a s t i n g
Audio Clips Very few people discovered holding down button for clips Confusion about listening and placing a vote Liked clips if not familiar with song or if lacked other info (ie song title) Song clip too short
Miscellaneous Song/Artist/Category control and feedback might be desired Need for robust buttons are needed Our music selection is not sufficient
XM Satellite ResultsDisplay and Buttons
Buttons are unlabeled, too small, and similar in size and appearance Button labels are ambiguous Song title and artist name are necessary Station numbers are helpful Station names are obscure Scrolling display distracts from driving Volume dial is awkward
Navigation Categories are strangely ordered Unintentional category switching was common Mixed reaction to dial Confusion about dial button
Miscellaneous Customization is desired
Attention Required While Driving Mixed results on required visual attention
Post-Test Questionnaire
Name “Post-Test Questionnaire”
Activities Questionnaire
Primary Objective Understand how people interpret the radio’s interface elements. Gather overall experience data for the prototype. (Roadcasting prototype only)
Secondary Objective Determine if the driving simulator is a proper way in which to investigate radio.
Materials Questionnaire with 29 multiple choice and short answer questions, pen.
Moderator/Assistant Moderator: Rotated between Megan, Mathilde, and Jordan
30 July 2004 James Garretson, Whitney Hess, Jordan Kanarek, Mathilde Pignol, Megan Shia54

R o a d c a s t i n g
Assistant: Rotated between Megan, Mathilde, and Jordan
Duration 15 minutes
ProcedureEach participant was given the post-test questionnaire in paper form and a pen. Although as much time as necessary was given, most participants completed the questionnaire within 15 minutes.
AnalysisSimilarly to the pre-test questionnaire, the post-test questionnaires of all the participants were analyzed for trends about the Roadcasting prototype. The post-test did not include questions about the XM Satellite Radio.
Overall Reaction to the System - Roadcasting
1
2
3
4
5
6
7
8
9
terrible/wonderful frustrating/satisfying dull/stimulating difficult/easy
Answers to the question: Why do you listen to the radio (check all that apply)
30 July 2004 James Garretson, Whitney Hess, Jordan Kanarek, Mathilde Pignol, Megan Shia55

R o a d c a s t i n g
Appearance and Navigation
1
2
3
4
5
6
7
8
9
ease r
eading
text
amou
nt of
info
arran
gement
info
navig
ating
categ
ories
predic
table c
atego
ries
navig
ating
stati
on
predic
table s
tation
Answers to questions asking about the prototype’s appearance and navigation. Each question used a 9-point likert scale with 1 being negative and 9 being positive.
30 July 2004 James Garretson, Whitney Hess, Jordan Kanarek, Mathilde Pignol, Megan Shia56
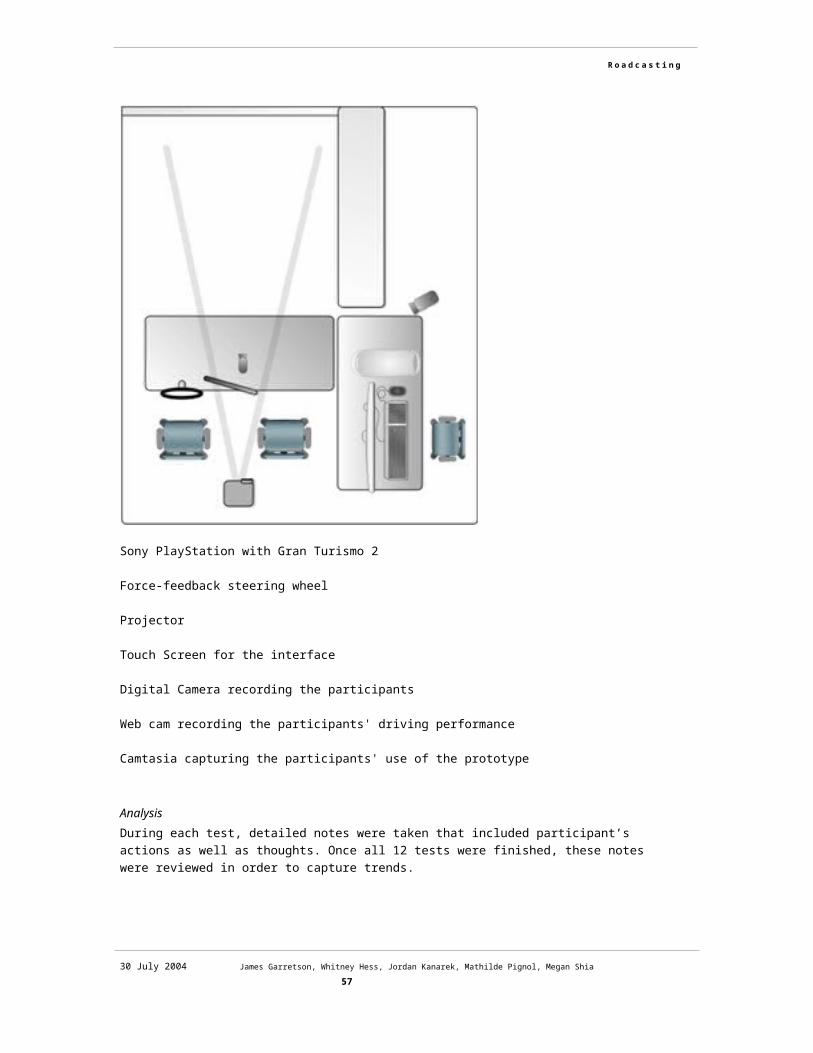
R o a d c a s t i n g
Voting
1
2
3
4
5
6
7
8
9
overall beepprompt
voiceprompt
middle ofsong
time tovote
(short)
time tovote
(long)
timebetween(short)
timebetween(long)
Answers to questions involving voting. Each question used a 9-point likert scale with 1 being negative and 9 being positive.
5.9. Prototype II5.9.1. Description of design, functions, features
30 July 2004 James Garretson, Whitney Hess, Jordan Kanarek, Mathilde Pignol, Megan Shia57

R o a d c a s t i n g
After Round 1 of user testing, we found that voting it its current form was not successfully received by our users, so we decided to put the feature aside for now. Instead, we chose to concentrate on improving station navigation. We enhanced the design of the crosshair buttons and added a center select button. We also increased the size of the display significantly, removed the three voting buttons, and added a status bar to the bottom of the screen. Having removed the voting buttons, we decided that the crosshair buttons could be generalized across many functions. Because of this, we chose to remove the original labels stating their function.
At the top of the screen is the artist and song title, and beneath that is the station name and station message (entered by the broadcaster). The five dots on the left side of the status bar are meant to indicate how much a station matches the user’s musical preferences. The station’s category is indicated in the center, and the number of listeners is abstracted in a “little man” icon on the right.
Relevance of station to listener Number of listeners
Poor match Logarithmic sizing of “little man” icon
Excellent match
If the system believes that a particular station will be greatly liked by a listener, the listener will see five green dots on the status bar for that station. Similarly, if the music played on that station is music that the listener does not like at all, one red dot will appear.
We wanted to indicate number of listeners with an abstract visual in order to avoid offending broadcasters who only have one or two people listening to their station, and also to prevent from having to indicate to the broadcaster every time a person switches onto or away from the station (which might distract the broadcaster unnecessarily).
5.9.2. Round 2 User TestingPurposeSimilarly to the first round of user testing, the second round focused again on specific interaction elements of the interface as well as the overall experience and desirability
30 July 2004 James Garretson, Whitney Hess, Jordan Kanarek, Mathilde Pignol, Megan Shia58

R o a d c a s t i n g
of the service design. Data to either support or refute design changes that were made after the first round of testing was a primary goal of this round. In addition, data on new service and interface elements was sought in order to inform future design issues.
Specifically, the following questions were of particular interest:
Tunero Is browsing among stations easy, logical?o Can broadcasters locate their “own” station?o Is browsing among categories easy, logical?o Are all of the display elements understood?o Are people able to find something they’d actually like to listen to?
Flavoro Can people set-up their station’s flavor?o Does this flavor actually match with what people want to hear on the radio?
Own stationo Does the broadcaster understand the concept of broadcasting their own
station?
Set-up screeno Will people want to set the name of their station?o Will people want to create a station blurb?o Will people understand the concept of setting flavor? What will they think
the name “flavor” means? The overall experience of using the Roadcasting prototype was also a focus of this round, though it should be noted that this information is difficult to accurately gather in a laboratory setting.
ParticipantsThe second round of user testing included 3 men and 4 women, for a total of 7 participants, the majority of whom were between the ages 25 and 30. More than 50% of the participants currently drive their vehicle at least 5 days a week. The average commute time for the participants was 48 minutes, round-trip.
MethodologyEach test included 14 sections, with the first 7 and last 2 being the same for all participants. The first 7 sections included:
1. NDA2. Consent form3. Pre-test questionnaire4. Music preference selection
30 July 2004 James Garretson, Whitney Hess, Jordan Kanarek, Mathilde Pignol, Megan Shia59

R o a d c a s t i n g
5. Reading of participant script6. Service Information7. Driving practice
The next 5 sections were alternated so as to present half of the participants with the White interface first and half with the Black interface first. The White interface simply referred to the participant’s station being built based on the music they selected during section #4 (music preference selection). The Black interface referred to the participant’s station being built based on music that they didn’t like. The four sections included:
8. Exploration of the interface (abbreviated: Interface Exp.)9. Radio use while driving – White Interface10. Overall Experience Questionnaire – White11. Radio use while driving – Black Interface12. Overall Experience Questionnaire – Black
Because of the different order in which these sections occurred, there were two different versions of the test. Half the participants experienced version 1 and half experienced version 2. The two versions are shown in the following table.
Version 1 Version 28 Interface Exploration Interface Exploration9 Radio use while driving - White Radio use while driving - Black
10 Overall Experience questionnaire Overall Experience Questionnaire11 Radio use while driving - Black Radio use while driving - White12 Overall Experience Questionnaire Overall Experience Questionnaire
The final two sections of the test were the same for all participants and included:
13. Listening and Broadcasting questionnaires14. Money and receipt exchange
See the Appendix folder on the Roadcasting CD for the NDA, consent form, participant script, pre-test questionnaire, overall experience questionnaire, and post-test questionnaire materials.
Throughout sections 8-12, participants were encouraged to think aloud. Thinking aloud is simply the act of speaking exactly what you are thinking and why. This enables the note taker to more-accurately record why the participant is making particular choices and actions.
Pre-Test Questionnaire
Name “Pre-Test Questionnaire”
Activities Questionnaire
Primary Objective Determine demographics of participants. Get a general idea of what they do
30 July 2004 James Garretson, Whitney Hess, Jordan Kanarek, Mathilde Pignol, Megan Shia60

R o a d c a s t i n g
in their car during commutes.
Secondary Objective Get participants thinking about being in their cars.
Materials Questionnaire with multiple-choice and short answer questions, computer with internet access.
Moderator/Assistant Moderator: Rotated between Megan, Mathilde, and Jordan
Assistant: Rotated between Megan, Mathilde, Jordan, and Whitney
Duration 10 minutes
ProcedureThe pre-test questionnaire was given to each participant upon their signing of the NDA and consent form. Participants had as much time as they needed to complete the questionnaire.
AnalysisEach questionnaire was analyzed in order to determine general trends within the participants.
Answers to the question: What do you do in your car? (Select all that apply)
30 July 2004 James Garretson, Whitney Hess, Jordan Kanarek, Mathilde Pignol, Megan Shia61
In-car Activities
0
1
2
3
4
5
6
7
Radio CDs orcassettes
Shave Read Eat Use cellphone
Blackberry

R o a d c a s t i n g
Answers to the question: What kind of radio do you listen to?
Answers to the question: How often do you listen to the radio in your car?
30 July 2004 James Garretson, Whitney Hess, Jordan Kanarek, Mathilde Pignol, Megan Shia62
Types of Radio Listened to Most
01234567
FM AM Satelliteradio
Internet News Talk MP3 Playerwith FM
Broadcast
Radio Use (Frequency)
0
1
2
3
4
5
6
7
Every time I’m inthe car
Sometimes Rarely Never

R o a d c a s t i n g
Answers to the question: Why do you listen to the radio? (Check all that apply)
One participant was a professional DJ for 7 years in a club setting, as well as for several private events.
Driving Simulator Tasks
Name “Driving Simulator Tasks”
Activities Use of two versions of the Roadcasting prototype while using a driving simulator
Primary Objective What do people think each aspect of a radio’s interface does? Are people able to use the radio while driving?
Secondary Objective Do people enjoy using each radio? Does the music that is played on a participant’s station effect their overall experience with the prototype?
Materials Driving simulator (see Section x for a detailed explanation of the simulator), Roadcasting prototype, digital music collection
Moderator/Assistant Moderator: Rotated between Megan, Mathilde, and Jordan
Assistant: Rotated between Megan, Mathilde, Jordan, and Whitney
Duration 30 minutes
ProcedureAs stated previously, the participants were counter-balanced so that half used the White interface first and half used the Black interface first. Once again, the White interface simply referred to the participant’s station being built based on the music they selected during the music selection portion of the test (section #4). The Black interface referred to the participant’s station being built based on music that they
30 July 2004 James Garretson, Whitney Hess, Jordan Kanarek, Mathilde Pignol, Megan Shia63
Reasons for Radio Use
0
1
2
3
4
5
6
7
Entertainment News Nothing better todo
Other
R o a d c a s t i n g
didn’t like. No matter which version was used first, each participant explored the Roadcasting interface before they were asked to use it while driving. Participants were asked to verbally describe what they thought each button on the interface did, without actually touching it. After they’d described the entire interface, they were able to play around with it and see if their initial assumptions were correct.
Once familiar with the interface, participants were asked to use the radio while driving. Their only task was to “find something you’d like to listen to.” If a participant wasn’t thinking aloud, the moderator would prompt them by saying “Can you talk to me about what you’re thinking?” or “Is this something you’d like to listen to?”
AnalysisDuring each test, detailed notes were taken that included participant’s actions as well as thoughts. Once all 7 tests were finished, these notes were reviewed in order to capture trends.
Roadcasting Service People enjoyed using the prototype once they had figured it out. But, the process of
figuring it out was lengthy and frustrating. The idea of listening to other people’s music was intriguing to some and weird to
others. Prototype has the potential to be a distraction from driving.
Talk Button Toggle nature of the Talk button is intuitive People worried that they might accidentally hit the button and be unintentionally
broadcasting their voice.
Flavor Icon (Users 18, 19 only) The picture was random, but people hypothesized that it should represent the station’s
genre.
Station Message Concept of station blurb was understood
Person IconThree sizes: small, medium, large (Users 14, 15, 16 only)
“Person” icon was confusing. Many thought it indicated signal strength. Those that did get its intended meaning thought that “all black” meant that only one person was listening and “yellow and white” were lots of people listening.
Filling up with liquid (Users 17, 18, 19 only) “Person” icon was still confusing, though 2 out of 3 people in this iteration did think
that it referred to the number of people currently listening to the station. However, they weren’t positive, and they also thought that “all black” meant that only one person was listening and “yellow and white” were lots of people listening.
30 July 2004 James Garretson, Whitney Hess, Jordan Kanarek, Mathilde Pignol, Megan Shia64

R o a d c a s t i n g
Circles or Diamonds (named changed to Match soon after round ended)Circles (Users 14, 15 only)
Circles were ambiguous. No one correctly identified them.
Diamonds (Users 16, 17, 18, 19 only) Diamonds were ambiguous. No one correctly identified them.
NavigationWithout category animation (Users 14, 15, 16, 17 only)
Navigation was confusing. Many participants never fully understood the intended navigation scheme.
With category animation (Users 18, 19 only) Although still somewhat confused, U18 and U19 got the general idea of up and
down changing the genre and left and right changing the station (or “song”). No one commented on the animation.
Up and Down Arrows People expected the up and down button to control volume
Background color Only one user noticed the change in background color and correctly identified that it
indicated that the stations that were red were one type of genre. (U17)
Locating Own Station If they found their station, they often had a hard time getting back to it.
Issues of Control More control was desired. Most people wanted to browse through a list of songs from
each broadcaster, rather than seeing the prototype as a kind of radio. Two participants thought that they were flipping through other people’s tracks, or list
of songs.
Overall Experience Questionnaire
Name “Overall Experience Questionnaire”
Activities Questionnaire
Primary Objective Gather overall experience data for both versions of the prototype (White and Black)
Secondary Objective Determine if the music that a participant listens to effects their overall experience with the prototype
Materials Questionnaire with 4 multiple choice questions and one short answer questions, computer with internet access.
30 July 2004 James Garretson, Whitney Hess, Jordan Kanarek, Mathilde Pignol, Megan Shia65

R o a d c a s t i n g
Moderator/Assistant Moderator: Rotated between Megan, Mathilde, and Jordan
Assistant: Rotated between Megan, Mathilde, Jordan and Whitney
Duration 5 minutes per instance (10 minutes total)
ProcedureThe Overall Experience Questionnaire was completed twice by each participant, once after the use of each interface. The questionnaire was exactly the same for each interface. The participant was asked to complete the questionnaire based on their experience with the prototype they’d most recently used.
AnalysisBy asking the same questions after use of the White interface (with music the participant should like) and the Black interface (with music they shouldn’t like), the relative effect of music on the prototype use could be determined. Consequently, after all of the tests were complete, the questionnaires were analyzed to determine the extent, if any, the music participants listened to had on their enjoyment of the prototype.
Analysis showed that there was no significant difference between the White and Black prototypes with respect to overall system reaction. Participants rated their overall experience with each prototype on a scale of 1-9, in 4 different areas: terrible to wonderful, frustrating to satisfying, dull to stimulating, and difficult to easy.
White vs Black: Overall Experience
0123456789
Terrible toWonderful
Frustratingto Satisfying
Dull toStimulating
Difficult toEasy
Rat
ing White
Black
Average across all participants in this round.
Across all four areas, participants rated their experience with the White prototype very similarly to their experience with the Black prototype, on average.
30 July 2004 James Garretson, Whitney Hess, Jordan Kanarek, Mathilde Pignol, Megan Shia66

R o a d c a s t i n g
Overall Reacton Across All Areas
4.62 4.46
0
1
2
3
4
5
6
7
8
9
White Black
Ave
rage
Rat
ing
Average rating across all four scales for the Black and White interfaces.
Therefore, it can be concluded that the music each participant listened to did not negatively or positively influence their overall impression of the prototype.
Post-test Questionnaires
Name “Broadcasting Post-test Questionnaires” “Listening Post-Test Questionnaire”
Activities Questionnaire
Primary Objective Gather specific data on the act of broadcasting a station, in addition to data on the overall experience of broadcasting.
Gather specific data on the act of listening to music with the Roadcasting prototype, in addition to data on the overall experience of being a listener.
Secondary Objective Provide a place to collect any miscellaneous comments from participants.
Materials 2 questionnaires with multiple choice short answer questions, computer with internet access.
Moderator/Assistant Moderator: Rotated between Megan, Mathilde, and Jordan
Assistant: Rotated between Megan, Mathilde, Jordan and Whitney
Duration 15 minutes
ProcedureAfter all driving simulator tasks were completed, the two post-test questionnaires were given to the participant. The two questionnaires cover broadcasting and listening respectively. The Listening questionnaire was given to participants first, followed by the Broadcasting questionnaire.
30 July 2004 James Garretson, Whitney Hess, Jordan Kanarek, Mathilde Pignol, Megan Shia67

R o a d c a s t i n g
AnalysisBoth the Broadcasting and Listening post-test questionnaires were analyzed to determine trends in the prototype.
Broadcasting ResultsThe same 9-point likert scales used in the Overall Experience Questionnaire were again used in the Broadcasting questionnaire, but were asked in reference to the participant’s overall experience broadcasting their own station. The four scales included: terrible to wonderful, frustrating to satisfying, dull to stimulating, and difficult to easy. In general, the averages for each scale were between 4.8 and 5.6. These show that people were neither really impressed nor disgusted by the prototype. It should be noted that the prototype had several technical issues that might have brought the overall experience scores down somewhat.
Overall Broadcasting Experience
5.005.67
4.835.00
0123456789
Terrible toWonderful
Frustrating toSatisfying
Dull toStimulating
Difficult toEasy
Ratin
g
Average experience scores for Broadcasting.
Specific questions about the service concept of broadcasting revealed some mixed opinions. The general idea of being able to broadcast a station was well liked, but the details of actually finding your station and knowing if you were actually broadcasting scored fairly poorly. Another area the scored poorly was broadcaster control. This mimics comments heard during testing that supported participants’ desire for more control over their own stations.
30 July 2004 James Garretson, Whitney Hess, Jordan Kanarek, Mathilde Pignol, Megan Shia68

R o a d c a s t i n g
Broadcasting Service Details
4.67
3.00 2.83
7.50
5.173.33
0123456789
Locating ownstation
Knowingwhen
broadcasting
Songsautomatically
selected
No controlover station
Broadcastingwhile driving
Idea ofbroadcasting
Ratin
g
Average ratings for Broadcasting service and interface elements.
Listening ResultsSimilar to the Broadcasting questionnaire, participants were asked to comment on the overall experience of using the prototype to listen to music. Participants scored their overall experience as a listener as average – not great but not terrible.
Overall Listening Experience
0123456789
Terrible toWonderful
Frustrating toSatisfying
Dull toStimulating
Difficult toEasy
Ratin
g
Average experience scores for Listening.
The scores for specific interface elements of the prototype were mixed. The text on the screen was well received, as was showing the artist name and song title. Category names scored positively. Results for station names were mixed, while station messages scored poorly. It should be noted that this prototype only contained a placeholder (“Station blurb”) for a station’s message. Later prototypes allowed participants to enter their own station name and message.
30 July 2004 James Garretson, Whitney Hess, Jordan Kanarek, Mathilde Pignol, Megan Shia69

R o a d c a s t i n g
Results for navigating between categories and between stations were mixed with most participants scoring each either very highly or very poorly. Finally, scores for the diamonds (called Match in later prototypes) and the “little man” icon scored very poorly.
See the Appendix on the Roadcasting CD for graphs of each of the above results.
5.10. Prototype III5.10.1. Description of design, functions, features
Our users in Round 2 of user testing had a hard time understanding the meaning of the status bar icons. As a result, we chose to label them as shown above.
Many users thought that the Rating dots (called Match in later prototypes) were actually buttons, so we changed them to diamonds and removed the red-orange-green color scheme. Instead, we altered the saturation of orange depending on how much the station matches the user’s music tastes. Five diamonds has a bright orange color, while one diamond is faded.
30 July 2004 James Garretson, Whitney Hess, Jordan Kanarek, Mathilde Pignol, Megan Shia70

R o a d c a s t i n g
Poor match
Excellent match
Number of ListenersThroughout Round 2 of user testing, we went through many iterations of the “little man” icon. The logarithmic sizing was not apparent to our users. Instead, we tried to indicate number of listeners by filling up the icon as more listeners tuned to the station, as shown below. Users confused this for signal strength, and some thought it represented the inverse of its intended meaning – they thought that the fewer people listening, the more “filled up” or black the icon would become.
We also thought about showing three icons and filling them up as more people tuned into the station.
30 July 2004 James Garretson, Whitney Hess, Jordan Kanarek, Mathilde Pignol, Megan Shia71

R o a d c a s t i n g
5.10.2. Peer ReviewPurposeThe main purpose of the peer review was to gather data on the experience of using the Roadcasting prototype for an extended period of time in a non-laboratory setting. The more time people are able to spend with the prototype and the more natural the setting, the more accurate the data. A secondary objective of the peer review was to get feedback on the prototype’s interface from interface experts.
ParticipantsFive Masters of Human Computer Interaction students participated in the peer review. Because the five students worked together in the same room, they were able to see each other’s stations.
Prototype Use
Name “Prototype Use”
Activities Use of the Roadcasting prototype while working.
Primary Objective What is the experience of using the prototype for an extended period of time?
Secondary Objective How can the prototype’s interface be improved?
Materials Roadcasting prototype, computer, digital music collection, headphones
Moderator/Assistant Megan, Jordan, and Jim
Duration 2 hours
ProcedureEach participant downloaded the prototype onto their computer and then ran the Windows.bat file. After pointing the program to their digital music collection and entering their station’s name and message, each participant used the prototype for about 2 hours. During this time, they completed work for other projects, using the prototype as a way to listen to music while they worked. The participants were not given any instructions other than to use the prototype to listen to music.
AnalysisUnlike the user tests, these participants were not asked to think aloud while they used the prototype. Therefore, the only applicable information to analyze for this activity is the log files.
Interestingly, an analysis of the log files shows that participants overwhelmingly used the right button more than any other button on the interface. Whether this is because people are most familiar with the right button (like the seek button on a radio) or because the participants just stayed in the “All Stations” category the whole time is unknown. With only 4 other stations to choose from, it is possible that everyone stayed in the All Stations category during the whole 2 hours.
30 July 2004 James Garretson, Whitney Hess, Jordan Kanarek, Mathilde Pignol, Megan Shia72

R o a d c a s t i n g
Average Button Use (in % )
0102030405060708090
Up Down Left Right
Aver
age
%
Average button use (in %) of peer review participants.
Overall Experience Questionnaire
Name “Overall Experience Questionnaire”
Activities Questionnaire
Primary Objective Gather overall experience data for the prototype
Secondary Objective None
Materials Questionnaire with 4 multiple choice questions and one short answer questions, computer with internet access.
Moderator/Assistant Megan
Duration 5 minutes
ProcedureAfter using the prototype for two hours, each participant was asked to complete the overall experience questionnaire.
AnalysisQuestionnaires from all five participants were analyzed in order to discover general trends about the prototype. It should be noted that this questionnaire was the same questionnaire completed by participants in both rounds of user testing.
On average, the overall experience scores for the five peer review participants were slightly higher than for the two rounds of user testing. In particular, the scores for the difficult to easy scale were very high. The lowest score was for the frustrating to
30 July 2004 James Garretson, Whitney Hess, Jordan Kanarek, Mathilde Pignol, Megan Shia73

R o a d c a s t i n g
satisfying scale. This might have been caused by the fact that the prototype had a couple minor technical issues for part of the peer review session.
Peer Review:Overall Experience
0123456789
Terrible toWonderful
Frustrating toSatisfying
Dull toStimulating
Difficult toEasy
Ratin
g
Average across all participants in this round.
Post-test Questionnaires
Name “Broadcasting Post-test Questionnaires” “Listening Post-Test Questionnaire”
Activities Questionnaire
Primary Objective Gather specific data on the act of broadcasting a station, in addition to data on the overall experience of broadcasting.
Gather specific data on the act of listening to music with the Roadcasting prototype, in addition to data on the overall experience of being a listener.
Secondary Objective Provide a place to collect any miscellaneous comments from participants.
Materials 2 questionnaires with multiple choice and short answer questions, computer with internet access.
Moderator/Assistant Moderator: Rotated between Megan, Mathilde, and Jordan
Assistant: Rotated between Megan, Mathilde, Jordan and Whitney
Duration 15 minutes
ProcedureAfter completing the overall experience questionnaire, each participant completed both the Broadcasting and Listening questionnaires. The Listening questionnaire was given to participants first, followed by the Broadcasting questionnaire. These questionnaires were the same questionnaires given to participants in both rounds of user testing, with minor updates to interface terminology.
30 July 2004 James Garretson, Whitney Hess, Jordan Kanarek, Mathilde Pignol, Megan Shia74

R o a d c a s t i n g
AnalysisBoth the Broadcasting and Listening post-test questionnaires were analyzed to determine trends in the prototype.
Broadcasting ResultsThe same 9-point likert scales used in the Overall Experience Questionnaire were again used in the Broadcasting questionnaire, but were asked in reference to the participant’s overall experience broadcasting their own station. The four scales included: terrible to wonderful, frustrating to satisfying, dull to stimulating, and difficult to easy. Similar to the results for the overall experience questionnaire, the results of the overall broadcasting experience were higher for the peer review than for the second round of user testing.
Peer Review: Overall Broadcasting Experience
0123456789
Terrible toWonderful
Frustrating toSatisfying
Dull toStimulating
Difficult to Easy
Ratin
g
Average experience scores for Broadcasting.
Listening ResultsSimilar to the Broadcasting questionnaire, participants were asked to comment on the overall experience of using the prototype to listen to music. Participants scored their overall experience as a listener as above average, with the scale of dull to stimulating and difficult to easy scoring very high.
30 July 2004 James Garretson, Whitney Hess, Jordan Kanarek, Mathilde Pignol, Megan Shia75

R o a d c a s t i n g
Peer Review: Overall Listening Experience
0123456789
Terrible toWonderful
Frustrating toSatisfying
Dull toStimulating
Difficult to Easy
Ratin
g
Average experience scores for Listening.
Written commentsParticipants for the peer review had similar comments to those in both rounds of user testing. For example, participants desired more control over their own station. We also found that the participants were particularly interested in seeing what other people had in their music collection. Below is a summary of the participants’ written comments. For a more detailed review, see the Appendix folder on the Roadcasting CD.
Positive Aspects: Participants liked to see what music other people had Is easy to use
Negative Aspects: Certain artists were played more often than others Wanted the station name and message to be remembered by prototype for future use More control is desired Buttons were unpredictable and confusing at times “Person” icon was ambiguous Wanted own station to appear first
Interesting Issues: One person was very protective of their image as a broadcaster.
30 July 2004 James Garretson, Whitney Hess, Jordan Kanarek, Mathilde Pignol, Megan Shia76

R o a d c a s t i n g
5.10.3. Focus GroupPurposeThere were two main reasons for running the focus group:
Refine the interface Gather feedback on the experience of creating and running a station, and of listening to other people’s stations
Previous user testing helped to confirm design decisions, but further refinement was desired. Additionally, the experience of using the prototype was affected by the fact that participants were asked to think aloud as they were listening to music. The focus group enabled us to gather more accurate experience data, while also gathering information about the interface.
ParticipantsFour women and two men attended the focus group. The average age of the six participants was between 25 and 30. The average commute time was 56 minutes, round trip. All participants also had their own digital music collection, though they did not bring their collection to the focus group.
MethodologyThere were 10 sections to the focus group, with a short break after section 7.
1. Non-disclosure and consent form2. Pre-test questionnaire3. Participant script and instructions4. Station set-up5. Use of prototype for 25 minutes 6. Post-test questionnaires (Broadcasting and Listening)7. “How do I Feel” activity8. Presentation of “How do I Feel” activity to group9. Group discussion10. Money and receipt exchange
Pre-test Questionnaire
Name “Pre-Test Questionnaire”
Activities Questionnaire
Primary Objective Determine demographics of participants. Get a general idea of what they do in their car during commutes.
Secondary Objective Get participants thinking about being in their cars.
Materials Questionnaire with multiple-choice and short answer questions, computer with internet access.
Moderator/Assistant Mathilde
30 July 2004 James Garretson, Whitney Hess, Jordan Kanarek, Mathilde Pignol, Megan Shia77

R o a d c a s t i n g
Duration 10 minutes
ProcedureAfter all participants had arrived and signed both the NDA and consent form, they were instructed to open the “Pre-test” icon on their computer. This icon took them to the online pre-test questionnaire. Participants were given as much time as they needed to complete the questionnaire.
AnalysisEach questionnaire was analyzed in order to determine general trends across the participants.
In-Car Activities
0123456
Listen tothe radio
Listen toCDs or
cassettes
Shave Read abook or thenewspaper
Eat Talk on thecell phone
Other(pleasespecify)
Num
ber o
f Par
ticip
ants
Answers to the question: What do you do in your car? (Select all that apply)
Types of Radio Listened to Most
01234567
FM AM XM orSirius
(satelliteradio)
Internet News Talk (non-news)
None ofthe above
Other(pleasespecify)
Num
ber o
f Par
ticip
ants
Answers to the question: What kind of radio do you listen to?
30 July 2004 James Garretson, Whitney Hess, Jordan Kanarek, Mathilde Pignol, Megan Shia78

R o a d c a s t i n g
Radio Use (Frequency)
0123456
Every time I’min the car
Sometimes Rarely Never
Num
ber o
f Par
ticip
ants
Answers to the question: How often do you listen to the radio in your car?
Prototype Use
Name “Prototype Use”
Activities Use of the Roadcasting prototype to listen to music
Primary Objective What is the experience of using the prototype for an extended period of time?
Secondary Objective How can the prototype’s interface be improved?
Materials Roadcasting prototype, computer, digital music collection, headphones
Moderator/Assistant Mathilde, with Jim assisting
Duration 25 minutes
ProcedurePrior to the date of the focus group, each participant completed an online questionnaire about their musical preferences. The results of these questionnaires were used to create a digital music collection for each participant. This collection was then transferred to the actual PC that the participant would use during the focus group. During the actual focus group, participants simply double-clicked the prototype icon, named their station, and then entered their station’s message. Directions for how to do this were included on a written sheet of instructions and were also read aloud by the moderator. Once their station was running, participants were told they could use the Internet while using the prototype. The participants were not given any instructions other than to use the prototype to listen to music.
AnalysisUnlike the user tests, these participants were not asked to think aloud while they used the prototype. Therefore, the only applicable information to analyze for this activity is
30 July 2004 James Garretson, Whitney Hess, Jordan Kanarek, Mathilde Pignol, Megan Shia79

R o a d c a s t i n g
the log files. The group discussion, which occurred later in the focus group, enabled participants to reflect on their use of the prototype. That analysis is included in the Group Discussion section.
Participants used the right button much more often than they used any other button on the interface, similar to the log file analysis from the Peer Review.
Average Button Use (in % )
0102030405060708090
100
Up Down Left Right
Aver
age
%
Average button use (in %) focus group participants.
Another interesting result of log file analysis showed that participants did not spend the majority of their time on their own station. A continuing question throughout this project was why people would want to listen to other people’s stations if they had their own digital music collection with them. This data shows that people do enjoy listening to what other people are playing, even when their own station plays music they like.
% time on own station
0102030405060708090
100
u3 u4 u5 u6 u7 u8
% T
ime
30 July 2004 James Garretson, Whitney Hess, Jordan Kanarek, Mathilde Pignol, Megan Shia80

R o a d c a s t i n g
Log file analysis of percentage of time spent on participant’s own station.
Overall Experience Questionnaire
Name “Overall Experience Questionnaire”
Activities Questionnaire
Primary Objective Gather overall experience data for the prototype
Secondary Objective None
Materials Questionnaire with 4 multiple choice questions and one short answer questions, computer with internet access.
Moderator/Assistant Mathilde
Duration 5 minutes
ProcedureAfter using the prototype for 25 minutes, each participant was asked to complete the overall experience questionnaire.
AnalysisQuestionnaires from all six participants were analyzed in order to discover general trends about the prototype. It should be noted that this questionnaire was the same questionnaire completed by participants in both rounds of user testing as well as the peer review.
Results for the overall experience of using the prototype were about average on a rating scale and slightly lower than the peer review results.
Overall Experience (Frustrating to Satisfying)
0
1
2
3
1-Frus
tratin
g 2 3 4 5 6 7 8
9-Sati
sfying
Num
ber o
f Par
ticip
ants
Participant ratings for overall experience, from frustrating to satisfying.
30 July 2004 James Garretson, Whitney Hess, Jordan Kanarek, Mathilde Pignol, Megan Shia81

R o a d c a s t i n g
Overall Experience (Difficult to Easy)
0
1
2
3
1-Diffi
cult 2 3 4 5 6 7 8
9-Easy
Num
ber o
f Par
ticip
ants
Participant ratings for overall experience, from difficult to easy.
Overall Experience (Terrible to Wonderful)
0
1
2
3
4
1-Terr
ible 2 3 4 5 6 7 8
9-Won
derfu
lNum
ber o
f Par
ticip
ants
Participant ratings for overall experience, from terrible to wonderful.
Post-test Questionnaires
Name “Broadcasting Post-test Questionnaires” “Listening Post-Test Questionnaire”
Activities Questionnaire
Primary Objective Gather specific data on the act of broadcasting a station, in addition to data on the overall experience of broadcasting.
Gather specific data on the act of listening to music with the Roadcasting prototype, in addition to data on the overall experience of being a listener.
Secondary Objective Provide a place to collect any miscellaneous comments from
30 July 2004 James Garretson, Whitney Hess, Jordan Kanarek, Mathilde Pignol, Megan Shia82

R o a d c a s t i n g
participants.
Materials 2 questionnaires with multiple choice and short answer questions, computer with internet access.
Moderator/Assistant Mathilde
Duration 15 minutes
ProcedureAfter completing the overall experience questionnaire, each participant completed both the Broadcasting and Listening questionnaires. Participants were instructed to complete the Listening questionnaire first. These questionnaires were the same questionnaires given to participants in both rounds of user testing and the peer review, with minor updates to interface terminology.
AnalysisBoth the Broadcasting and Listening post-test questionnaires were analyzed to determine trends.
Broadcasting ResultsThe same 9-point likert scales used in the Overall Experience Questionnaire were again used in the Broadcasting questionnaire, but were asked in reference to the participants’ overall experience broadcasting their own stations. The four scales included: terrible to wonderful, frustrating to satisfying, dull to stimulating, and difficult to easy.
Focus Group: Overall Experience
0123456789
Terrible toWonderful
Frustrating toSatisfying
Dull toStimulating
Difficult toEasy
Ratin
g
Average experience scores for Broadcasting.
The participants liked the idea of broadcasting. The total lack of control over one’s playlist was unanimously disliked, but some people found the idea of having songs
30 July 2004 James Garretson, Whitney Hess, Jordan Kanarek, Mathilde Pignol, Megan Shia83

R o a d c a s t i n g
selected automatically “satisfying” nonetheless. Broadcasting was generally seen as “easy.”
Overall Idea of Broadcasting
0
1
2
3
1-Terr
ible 2 3 4 5 6 7 8
9-Won
derfu
lNum
ber o
f Par
ticip
ants
Answers to the question: The idea of broadcasting your own station was?
Lack of Control Over Station
0
1
2
3
1-Terr
ible 2 3 4 5 6 7 8
9-Won
derfu
lNum
ber o
f Par
ticip
ants
Answers to the question: Not having complete control over your station was?
30 July 2004 James Garretson, Whitney Hess, Jordan Kanarek, Mathilde Pignol, Megan Shia84

R o a d c a s t i n g
Having Songs Selected for You
0
1
2
3
1-Frus
tratin
g 2 3 4 5 6 7 8
9-Sati
sfying
Num
ber o
f Par
ticip
ants
Answers to the question: Having songs selected for you was?
Listening ResultsSimilar to the Broadcasting questionnaire, participants were asked to comment on the overall experience of using the prototype to listen to music. Averages for most of the scores were similar to both rounds of user tests. The average rating for difficult to easy was rather high, showing that the prototype was easy to use, but not necessarily satisfying, stimulating, or wonderful.
Focus Group: Overall Broadcasting Experience
0123456789
Terrible toWonderful
Frustrating toSatisfying
Dull toStimulating
Difficult toEasy
Aver
age
Ratin
g
Average experience scores for Listening.
With respect to individual interface elements, station name scored fairly well, while station message got a mixed rating. The Match icon scored all across the scale, with participants rating it poorly, in the middle, and well. The “little man” icon scored rather negatively while the signal icon had mixed results. Participants had difficultly navigating between categories, but rated navigating between stations as about average.
30 July 2004 James Garretson, Whitney Hess, Jordan Kanarek, Mathilde Pignol, Megan Shia85

R o a d c a s t i n g
Station Names
0
1
2
3
1-Unn
ecessa
ry 2 3 4 5 6 7 8
9-Usef
ulNum
ber o
f Par
ticip
ants
Answers to the question: Station names were?
Station Messages
0
1
2
3
1-Unn
ecessa
ry 2 3 4 5 6 7 8
9-Usef
ulNum
ber o
f Par
ticip
ants
Answers to the question: Station messages were?
30 July 2004 James Garretson, Whitney Hess, Jordan Kanarek, Mathilde Pignol, Megan Shia86

R o a d c a s t i n g
Match Icons
0
1
1-Con
fusing 2 3 4 5 6 7 8
9-Clea
rNum
ber o
f Par
ticip
ants
Answers to the question: The five diamonds were?
"Person" Icon
0
1
2
3
1-Con
fusing 2 3 4 5 6 7 8
9-Clea
rNum
ber o
f Par
ticip
ants
Answers to the question: The “person” icon was?
30 July 2004 James Garretson, Whitney Hess, Jordan Kanarek, Mathilde Pignol, Megan Shia87

R o a d c a s t i n g
Signal Icon
0
1
2
3
1-Con
fusing 2 3 4 5 6 7 8
9-Clea
rNum
ber o
f Par
ticip
ants
Answers to the question: The signal icon was?
Navigating Between Categories
0
1
2
3
1-Con
fusing 2 3 4 5 6 7 8
9-Clea
rN/A
Num
ber o
f Par
ticip
ants
Answers to the question: Navigating between categories was?
30 July 2004 James Garretson, Whitney Hess, Jordan Kanarek, Mathilde Pignol, Megan Shia88

R o a d c a s t i n g
Navigating Between Radio Stations
0
1
2
3
1-Con
fusing 2 3 4 5 6 7 8
9-Clea
rNum
ber o
f Par
ticip
ants
Answers to the question: Navigating between stations was?
Group Discussion
Name “Group Discussion”
Activities Discussion
Primary Objective Better understand how participants felt about using the prototype to listen to music
Secondary Objective Better understand how the service model of Roadcasting could be improved.
Materials none
Moderator/Assistant Mathilde and Jordan
Duration 40 minutes
ProcedureAfter the “How do I feel” exercise, participants were asked to comment on their experience using the prototype. Participants were encouraged to respond on what other participants said. If the conversation quieted down, the moderators asked more probing questions about the prototype.
AnalysisTranscripts from the group discussion were analyzed to determine the major themes of the participants’ experience with the prototype.
Technological Issues Some music was tagged incorrectly Certain artists were played more often then others Sound quality of music was low
30 July 2004 James Garretson, Whitney Hess, Jordan Kanarek, Mathilde Pignol, Megan Shia89

R o a d c a s t i n g
People wanted more stations to choose from
Findings Navigation was confusing at first, but eventually understandable. Unlabeled buttons
made the navigation scheme even more difficult Desire to see what was on other stations without actually changing stations Desire for a “more like this” function People enjoyed using the prototype to listen to music Prototype allowed opportunities to listen to new music Users didn’t realize they were actually broadcasting Desire for more control with own station Disinterest in broadcasting to others Prototype is easy to use Prototype is simple Collaborative filtering would be nice, but was not possible with only 6 stations Icons (diamonds, audience, signal) were confusing Users didn’t know if Match referred to the song or to the station Understood signal, but didn’t understand how it was calculated Arrangement of information on screen was appropriate Station names and messages were interesting, but not essential Album name would be nice to know Song time might be useful Label of “Eclectic” category might be problematic
5.11. Conclusions Across All Test UsersBased on data gathered from 29 participants, we can confidently say that Roadcasting effectively matches people to stations and plays music they want to hear. One of the major concerns the group had when designing Roadcasting was that people might not want to listen to other people’s music if they had their own digital collection with them in the car. Analysis of the log files from the focus group showed that people did in fact listen to other people’s stations even when their own station played music they like. Data from the second round of user testing also showed that people spent most of their time on other people’s stations, not their own. We can confidently conclude that Roadcasting provides a compelling service that exceeds the experience in simply listening to your own music collection.
30 July 2004 James Garretson, Whitney Hess, Jordan Kanarek, Mathilde Pignol, Megan Shia90
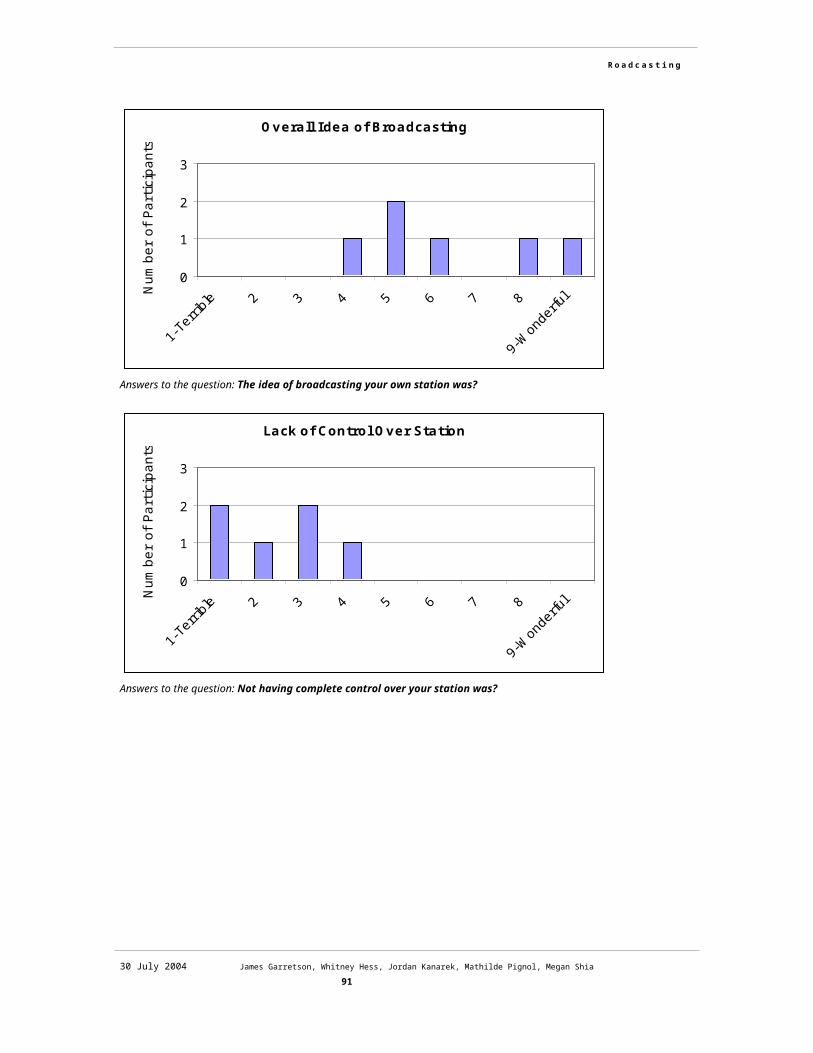
R o a d c a s t i n g
Log file analysis of the percentage of time participants spent on their own station.
“It was interesting to kind of see into the music that people had in their libraries. Music taste can be a private thing for some people and this is like a window into their mind.” (U22)
Data gathered on the overall experience of using the prototype, across all rounds of user testing, showed that Roadcasting is a very easy system to use. Additionally, scores for terrible to wonderful, frustrating to satisfying, and dull to stimulating were either average or above average. It should be noted that these scores are positive even though the prototype had some technical issues that at times made using the prototype a little frustrating.
30 July 2004 James Garretson, Whitney Hess, Jordan Kanarek, Mathilde Pignol, Megan Shia91

R o a d c a s t i n g
Overall experience results for the scale of difficult to easy.
Terrible to Wonderful
0 1 2 3 4 5 6 7 8 9
123456789
Rat
ing
Number of Participants
30 July 2004 James Garretson, Whitney Hess, Jordan Kanarek, Mathilde Pignol, Megan Shia92

R o a d c a s t i n g
Overall experience results for the scale of terrible to wonderful.
Frustrating to Satisfying
0 1 2 3 4 5 6 7 8 9
123456789
Rat
ing
Number of Participants
Overall experience results for the scale of frustrating to satisfying.
Dull to Stimulating
0 1 2 3 4 5 6 7 8 9
123456789
Rat
ing
Number of Participants
30 July 2004 James Garretson, Whitney Hess, Jordan Kanarek, Mathilde Pignol, Megan Shia93

R o a d c a s t i n g
Overall experience results for the scale of dull to stimulating.
From our user research data, and from our own use of the system, we can conclude that Roadcasting is a compelling alternative to radio that changes the way people listen to radio and builds community. It effectively maintains the positive aspects of listening to the radio while minimizing or eliminating the negative aspects. Likewise, it enhances the positive aspects of being a DJ while reducing the negative.
the participatory design session.
Positive and negative aspects of being a DJ, as identified in our contextual inquiries with radio DJs.
It is difficult to gather data on completely new paradigms, like those introduced by the concept of Roadcasting. We need more testing to refine our designs with respect to the representation of novel concepts. Additionally, the main issues participants had with the prototype were lack of control of their own station and lack of feedback on how other listeners’ voted. The complete Roadcasting model addresses these issues. Testing of the whole model is now necessary to determine if our solutions are appropriate.
Additionally, there were technical aspects of the Roadcasting model that were not incorporated in the prototype due to time constraints. The biggest concept that was missing was Roadcasting’s ability to learn from a person’s use of the system and adjust their preferences accordingly. This aspect of Roadcasting is very important because it refines the initial assumptions made about a person’s musical taste based on their own music collection. With this ability to learn and refine, we feel that Roadcasting would be even more effective in matching people to stations that play exactly what they want to hear.
30 July 2004 James Garretson, Whitney Hess, Jordan Kanarek, Mathilde Pignol, Megan Shia94
Positive Aspect Negative Aspect
√ Plays free music Commercials
√ Makes commutes less boring Redundancy
√ Doesn’t need to be attended to Annoying DJs
Positive Aspect Negative Aspect
√ Sharing music is fun Music selection is tedious
√ Access to a captive audience Barriers to entry
√ Recognition FCC regulations

R o a d c a s t i n g
6. Final/Recommended Design6.1. Description of design, functions, featuresLightweight interactions are at the core of the system and as such, Roadcasting can be used with only minimal attention. We wanted to create a system that achieved “walk up and use” usability – requiring no education to use. Our iterative design-test-build cycle helped us make the system very easy to use.
Our final interface design
6.1.1. Station NavigationWe knew that navigation would be critical from the start. Since Roadcasting is based on ad-hoc networking, there is no fixity of stations as there is on FM or satellite radio. The system needs to work well no matter how many stations there are, and easy navigation helps to facilitate our goal of matching people to music.
After some informal testing with searching and browsing we decided on a crosshair navigation system. From our first round of testing this crosshair system, we found that category and station navigation were received well and usable to an acceptable degree. The big problems were in predictability: people did not know what station or categories would come next after pressing a button.
Once we realized that we would be using the crosshair buttons for more than station navigation, we decided to remove the labels. This ended up confusing our users. We also added a center “select” button to the button layout. When this button is pressed, a voting interaction is initiated.
6.1.2. Station InformationRelevance of Station to ListenerMatching is at the core of the Roadcasting system. The match system shows how well a station matches a user’s musical preferences. In a way, these icons provide
30 July 2004 James Garretson, Whitney Hess, Jordan Kanarek, Mathilde Pignol, Megan Shia95

R o a d c a s t i n g
explanation for why the music is good or bad. These icons are meant to help guide people to the stations that they will like. In the current prototype, a user’s own station matches 4 of 5 diamonds, based on the statistical backend. It is possible for another station to be a better match.
Number of ListenersThe audience icon shows listeners and broadcasters how many people are listening to a station. We recognized need to abstract this audience information early; we did not want the exact number of listeners indicated to discourage those with no listeners or to provide too much information. We also wanted to convey this information to users, like other system information, without education on the meaning. The challenge was in fitting this information into a small screen space, abstracting it, and getting it to a point where it made sense to users.
We tested out some logarithmic sizing of our audience icon in our second round of testing to indicate audience size but these were not generally successfully identified. One user thought that the sizing of the icon was signal strength. We also noted that it was difficult to measure relative sizing of the icons, especially at a glance.
We then tried an icon scheme in which the “little guy” icon fills up with vertical bars as more listeners tune in. Some users understood this iconography, but in the inverse.
Lastly, we went with a perspective approach that enables the abstraction of the information by making it difficult to count exactly how many “little guys” are lit up. This audience indication still needs some work on the walk up and use usability side, but it has gotten to the point where it conveys the number of listeners appropriately.
Signal StrengthOne interesting thing that we noted during testing was that users assumed our other iconography was signal strength. Many users expected it to be there. Because of this, and because wireless technology is still in its infancy, we decided it was important to include signal strength. We went with a well-defined standard and our test users understood the iconography.
30 July 2004 James Garretson, Whitney Hess, Jordan Kanarek, Mathilde Pignol, Megan Shia96

R o a d c a s t i n g
Station PersonalizationStation icon, station name, and station message are ways to allow for station branding and personal expression. They help to define stations and they open up opportunities for off-radio community building. Originally included as more of a fun feature, these components took on more of a functional role in navigation than expected. They helped users to find their own stations, and encouraged users to associate their most liked station with a particular broadcaster.
CategoriesStations are categorized by the type of music they play. If a station has more than 25% of its content in a category then that station will appear in that category. Currently there are up to 128 categories available, as defined by the MP3 genre-tagging standard. We have, however, done much of the legwork into organizing these stations into grouped categories, reducing the number of categories to 17. If stations do not have 25% of songs in any category then that station is considered Eclectic. Stations are also put into an "All Stations" category. In this category, all stations are available, again, sorted by how well they match the listener's preferences.
Category InformationCategory information is displayed in the status tab on the bottom of the Roadcasting screen. This shows the listener the current category that they are in.
Category BackgroundsEach category is assigned a unique color background. This helps to provide quick visual cues to users that remind of the current category.
Category Change AnimationAnimations that occur between category switches provide strong visual feedback for navigation.
Song InformationSome users found that larger, darker text drew their eyes to the screen more often than they were comfortable. We chose a smaller font size and light color than we originally tested with and found users to be satisfied with the visual display of this information.
6.1.3. Station FlavorWe have forecasted that Roadcasters will have as many as 400GB of music in their car in 2010. Even people with far smaller music collections recognize the need for control
30 July 2004 James Garretson, Whitney Hess, Jordan Kanarek, Mathilde Pignol, Megan Shia97

R o a d c a s t i n g
over the music that is played on their stations. One user noted, “I would want to be able to control my music, so that people don't listen to what I don't even want to listen to.” Roadcasting needed a way to keep music organized and put broadcasters in control with simple interactions.
First the broadcaster will pick his or her desired icon to represent the flavor of the station. Then they will select which genres they want to play on their station. And lastly, they will choose which artists within those genres they want to play.
6.1.4. Voting
30 July 2004 James Garretson, Whitney Hess, Jordan Kanarek, Mathilde Pignol, Megan Shia98

R o a d c a s t i n g
Voting interaction flow diagram
The results of Round 1 of user testing found that voting in its first form would be intrusive and annoying to users. We have redesigned it as an opt-in feature; listeners can hit the select button on the crosshair when they have the time to vote. When the select button is pressed, the voting options appear, and a vote is placed by hitting the left, right or up buttons (if the station is in Managed mode, a screen will appear telling that user that voting is not allowed). The songs are mapped to each button as shown below eliminating the need for three distinct buttons whose sole purpose is for voting. In Round 1 of user testing, many users thought the 1, 2, and 3 buttons were presets. Here, we are proposing to use the crosshair buttons instead.
30 July 2004 James Garretson, Whitney Hess, Jordan Kanarek, Mathilde Pignol, Megan Shia99

R o a d c a s t i n g
Once a listener has voted on the next song, they will be brought back to the current song, but will be able to see on the display what they voted for and whether it is winning or losing, as indicated by an up or down arrow, respectively.
If a listener hits the select button once they have already voted for the next song, they will see the screen below: a histogram indicating how each song is doing with the audience, with their vote in pink.
30 July 2004 James Garretson, Whitney Hess, Jordan Kanarek, Mathilde Pignol, Megan Shia100

R o a d c a s t i n g
Below is the proposed means for a broadcaster in Guided mode to vote for the next song that will be played on his or her station. When broadcasters have the time and are tuned to their own stations, they can hit the select button to bring them to this voting screen. They may hit the left, right, or up buttons to choose the next song, or if they are not interested in any of those songs, they can hit the down button for a new batch of three songs to choose from.
30 July 2004 James Garretson, Whitney Hess, Jordan Kanarek, Mathilde Pignol, Megan Shia101

R o a d c a s t i n g
6.1.5. Talking
On-air talking is a way to encourage community, add personality to radio stations, and to open up possibility for non-music content. We, and some of our test users, also saw talking as a possibility to introduce the world to even more annoying DJs. To prevent this, we decided to use the contextual awareness built in to the system to learn about who the talking person is and what listeners think of them. Based on this we can filter the order of stations that Roadcasting presents to the listener to avoid the DJs that the listener does not like.
A broadcaster can hit the Talk button to broadcast her voice over her station. The button is press-and-lock and will light up red when the broadcaster is “on air.” She will hit the button again when she is done talking.
30 July 2004 James Garretson, Whitney Hess, Jordan Kanarek, Mathilde Pignol, Megan Shia102

R o a d c a s t i n g
30 July 2004 James Garretson, Whitney Hess, Jordan Kanarek, Mathilde Pignol, Megan Shia103

R o a d c a s t i n g
7. Open Issues/Next StepsWe would like to explore several outstanding issues given more time to work on this project. Our immediate steps would be to continue desirability testing for the service overall. Are drivers truly interested in sharing their music on their daily commute and managing their own station? Do drivers notice the benefits of being able to hear the music owned by other drivers on the road? Desirability testing would help us to focus the development of the service on the areas most appealing to our target users. It is also important to perform extensive user testing on our refined voting interface as well as the station flavor setup interface. We would also aim to improve station navigation and refine the icons on the status bar.
Other issues that have come to mind, but which we have not explored, are as follows:
How will listeners distinguish between FM and Roadcasting radio stations? Will the car have multiple head-units installed in the dashboard, or can AM, FM, XM, and Roadcasting all be accessed from the same unit?
Can multiple people in the car each have their own user profile that Roadcasting combines to maximize the listening pleasure of all people in the car?
Can profiles be stored elsewhere – a portable mp3 player, a USB keychain, a PDA – to be accessed from multiple cars?
Can Roadcasting learn what kind of music a listener wants to hear at a particular time of day or day of the week and adjust the music it recommends accordingly?
30 July 2004 James Garretson, Whitney Hess, Jordan Kanarek, Mathilde Pignol, Megan Shia104

R o a d c a s t i n g
8. Implications for the Far Future/Grand Visions8.1. Implementation TechnologyThere does not currently exist an adequate standard to support the Roadcasting service’s required blend of one-to-many and one-to-one communications, but we feel that 802.16e would make a good starting point. 802.16e is a new IEEE standard (there exists no hardware for it yet) which is an extension to 802.16a allowing mobile connections between nodes.
We feel 802.16e is a standard that validates the Roadcasting model. It enables ad-hoc wireless networking on a scale suitable to persistent connections between vehicles, and we find its technical limitations an acceptable starting point.
8.2. Speech Interface for NavigationFor technical reasons, voice interfaces were not considered for the Roadcasting prototype. However, a few notes and recommendations can be made regarding starting points for developing a successful interaction with the system using speech.
In order to realize navigational gains using voice, new spoken commands will need to be defined – supporting only verbal commands such as “next category,” “previous station,” etc. are no improvement over physical interaction. However, it is also important to realize that allowing commands like “go back to the last station I was on” may result in inconsistent results, if the last station no longer exists. Developing voice commands that produce consistent and predictable results will be imperative; we have already collected data that illustrates the importance of a consistent navigation system.
We also recommend that if-and-when a voice command cannot be executed, the feedback should be returned in aural form. Since successful execution of a station navigation command will result in different sound coming from the system, an error should be reported using the same mode of communication. Some sort of audio cue should be used in addition to a visual one; a visual cue alone, in response to an audio command, would be confusing.
With consistency and predictability in mind, the ideal voice commands to support will be ones with a high probability of success no matter the number and type of stations currently being received. A list of potential commands follows.
“Go to my station.”This command results in the system switching to the user’s own station. This command should be a natural one, and will likely not require explicit memorization. Additionally, this command should never fail.
“Go to the best station.”
30 July 2004 James Garretson, Whitney Hess, Jordan Kanarek, Mathilde Pignol, Megan Shia105

R o a d c a s t i n g
This command results in the system switching to the user’s highest-ranked station overall, and switching to the ‘All Stations’ category if that category was not already selected. This wording was chosen over “go to my favorite station” because the use of the word “favorite” will probably be frustrating to more users than the use of the word “best.” “Best” implies the system takes responsibility for the choice, which should be less frustrating if the new station is not a good match to the user.
This command should also never fail, since the user’s own station appears in All Stations. The worst-case scenario is that the user’s own station is the “best” station for the user.
“Go to category <category>.” This command defines a specific action to take (switching to a particular category), but does not define a specific station as the target. This command will likely prove extremely valuable as a navigational aid since it allows for a direct-access function and eliminates button presses.
This command will switch to the highest-ranked station in the target category. This command should work well most of the time – it will only fail if the desired category does not exist (i.e., there are currently no stations within the named category).
Note that this command may be difficult to use for novices because it requires knowledge of the system-defined categories. This command may require some memorization (so it is suboptimal).
“Go to station <station name>.”Between this command and the preceding one, the direct-access interface is pretty well covered. Stations can be located and retrieved regardless of their classification using this command, and users have indicated to us already that station names are useful ways to recognize stations.
This command will only fail if the target station cannot be found.
Finally, once the major functions are defined, it may then prove useful to support basic, monosyllabic commands to better accommodate a pure-voice interaction. For example, take the case of a user looking for a jazz station. The command, “Go to the best jazz station” results in a station the user usually likes, but happens to be playing a song he just heard at work. By supporting the verbal commands “next” and “back,” the user can maintain the “interaction conversation” already begun and quickly jump to the next-most-preferred jazz station. Such helper commands would greatly streamline the interaction.
30 July 2004 James Garretson, Whitney Hess, Jordan Kanarek, Mathilde Pignol, Megan Shia106

R o a d c a s t i n g
8.3. Changing the Face of RadioRoadcasting raises the bar for radio programming. Currently, media conglomerates decide what radio listeners hear from coast to coast. A small number of lucky, marketable artists get nationwide hype. A hit single is played every hour on the hour, until it is deemed “overplayed,” and is then never heard again. In between these singles are five-minute blocks of commercials, usually of no interest to listeners and causing them to seek aimlessly through available stations until the music comes back on.
Roadcasting will play music that people actually want to hear. It can give much-needed exposure to local up-and-coming artists through custom stations, and let them promote themselves and one another on-air. Upcoming gigs can be plugged.
The Roadcasting system won’t bother its listeners with commercials and DJs they don’t want to hear, because listeners’ preferences dictate what is played. Stations will tailor themselves to their audience, allowing listeners to remain on a single station for the duration of their drive (provided they are in range of the broadcaster).
Roadcasting is a safer way to listen to music in the car; fumbling with CDs can cause accidents, and continually switching stations requires attention that drivers cannot always afford to give. Roadcasting listeners won’t want or need to switch stations.
Clear Channel Communications, Inc. and satellites in space do not know or care what you want to hear. But Roadcasting does. Roadcasting knows what you want to hear, and when you want to hear it. It’s easy. It’s better. It’s the future of radio.
30 July 2004 James Garretson, Whitney Hess, Jordan Kanarek, Mathilde Pignol, Megan Shia107

R o a d c a s t i n g
9. Team Member BiographiesJim Garretson will be completing his HCI Masters in August 2004. Originally from Massachusetts, Jim came to CMU by way of Rensselaer Polytechnic Institute in Troy, NY, where he earned a double Computer Science and Psychology degree with an Economics minor. His HCI research interests are focused on two-dimensional interface and widget design for mobile computing devices in particular, and he spent the summer of 2003 working on a Linux-based visualization application for Bose Corporation. When not buried in documentation, Jim enjoys going outside.
Whitney Hess recently received her Bachelor of Arts in Professional Writing and Human Computer Interaction from Carnegie Mellon. She will complete an accelerated Masters in HCI in December 2004. Her HCI experience lies mostly in developing educational software and web-based course material. Whitney hopes to focus her career on intelligent devices. She believes that the usefulness of technology is limitless, but without the proper guidance, what is meant to be a help becomes a hindrance. A native of New York City, Whitney is an avid reader, traveler, theatergoer, and knitter.
Jordan Kanarek understands that good products require excellent interactions. Before coming to Carnegie Mellon, Jordan completed an undergraduate education in Product Design and Development with an emphasis on Interaction Design at Hampshire College. He interned in the product design group at a major toy manufacturer and worked in web applications programming and design at the Center For Educational Technology. Jordan looks forward to working on groundbreaking products and services that enable people to do things better.
Mathilde Pignol likes to master new things. Trained as a computer scientist, she is now studying design to enhance her skills in creating usable technology. Mathilde received her undergraduate degree in Computer Science and Psychology from Carnegie Mellon in 2002. She is now in her second year of the Human-Computer Interaction Master’s program. Besides taking classes, she works part-time for Maya Design, a design consultancy and technology research lab. Mathilde was born in France and grew up in Paris before moving to Houston, Texas where she went to high school. She speaks English and French fluently. In her free time, she enjoys playing ultimate frisbee, swimming, ballet dancing, reading literature and science fiction as well as watching foreign films. She tries not to obsess about butterflies too much.
Megan Shia believes that focusing on the needs, characteristics and experiences of people rather than on product features will result in more useful, enjoyable, and worthwhile technology experiences. This belief was shaped in part from her studies at the University of Washington, which resulted in a BS in Technical Communication. A study abroad at the University of Twente in the Netherlands introduced Megan to the impact of life experience on technology use. In addition, multiple internships at Intel allowed her to experience technology from the point of view of a user, a technician, and a business analyst. Upon graduation, she worked as both a technical writer and an information architect. A desire to gain a greater understanding of how the mind perceives, interprets, and facilitates interactions with technology has brought Megan to Carnegie Mellon where she expects to complete her Masters degree in August 2004.
30 July 2004 James Garretson, Whitney Hess, Jordan Kanarek, Mathilde Pignol, Megan Shia108