SUMMARY FATIG PONSE PHALT MIXTURES TM …onlinepubs.trb.org/onlinepubs/shrp/SHRP-A-312.pdfSUMMARY...
158
SUMMARY REPORT ON FATIGUE RESPONSE OF ASPHALT MIXTURES TM-UCB-A-003A-89-3 Prepared for Strategic Highway Research Program Project A-003-A by S. C. S. Rao Tangella, Assistant Research Engineer J. Craus, Professor of Civil Engineering J. A. Deacon, Professor of Civil Engineering C. L. Monismith, Professor of Civil Engineering Institute of Transportation Studies University of California Berkeley, California February 1990
Transcript of SUMMARY FATIG PONSE PHALT MIXTURES TM …onlinepubs.trb.org/onlinepubs/shrp/SHRP-A-312.pdfSUMMARY...

SUMMARY REPORT ONFATIGUE RESPONSE OF ASPHALT MIXTURES
TM-UCB-A-003A-89-3
Prepared for Strategic Highway Research ProgramProject A-003-A
by
S. C. S. Rao Tangella, Assistant Research EngineerJ. Craus, Professor of Civil Engineering
J. A. Deacon, Professor of Civil EngineeringC. L. Monismith, Professor of Civil Engineering
Institute of Transportation StudiesUniversity of California
Berkeley, California
February 1990

ABSTRACT
The purpose of this summary report is to evaluate test procedures for measuring the
fatigue response of asphalt paving mixtures and to summarize what is known about the
factors that influence fatigue response.
Available test methods are conveniently classified into the following categories:
simple flexure, supported flexure, direct axial, diametral, triaxial, fracture mechanics, and
wheel-track testing. Criteria used to evaluate each method for its potential use as a
laboratory standard included: (1) ability to simulate field conditions, (2) applicability of test
results for use in modelling pavement performance, (3) simplicity, and (4) correlation of
results with performance of in-service pavements. The three most promising methods are
considered to be simple flexure, diametral fatigue, and tests based on fracture mechanics
principles. Although not a fatigue test in itself, direct tension testing offers considerable
potential as a simple surrogate for more complex fatigue tests: French researchers have
achieved quite good correlations between direct tension and fatigue test results.
Factors affecting fatigue response include specimen fabrication, mode of loading,
mixture variables, and loading and environmental variables. Among the various fabrication
or compaction methods, rolling-wheel, kneading, and gyratory methods seem to best
duplicate field compaction. Although fatigue response is not expected to differ among
specimens compacted by these three methods, an evaluation of the possible effects of
compaction method on fatigue response is in order since prior compaction research has
focused on other engineering properties.
Mode of loading, typically either controlled-stress or controlled-strain for laboratory

testing, is one of the primary factors affecting fatigue response. Controlled-stress tests
essentially measure the loading necessary for crack initiation: longer fatigue lives are
recorded in controlled-strain tests because crack propagation is included as well.
Air void content and temperature--both affecting mixture stiffness--may have more
significant influence on fatigue response than any other variable(s). However, many mixture,
load, and environmental factors also influence fatigue response and must be considered both
in the development of test protocols and in the determination of asphalt and mixture
properties that are essential for fatigue-resistant pavements.
Finally, in most prior work, the maximum principal tensile strain has been used as
the cause or determinant of fatigue damage, and the linear summation of cycle ratios
hypothesis has been used to accumulate this damage under mixed traffic loading. Other
damage determinants, such as work strain as well as cumulative failure laws, such as
constancy of dissipated energy, offer possible alternatives.
ii

ACKNOWLEDGEMENTS
The work reported herein has been conducted as a part of project A-003A of the
Strategic Highway Research Program (SHRP). SHRP is a unit of the National Research
Council that was authorized by section 128 of the Surface Transportation and Uniform
Relocation Assistance Act of 1987. This project is entitled, "Performance Related Testing
and Measuring of Asphalt-Aggregate Interactions and Mixtures," and is being conducted by
the Institute of Transportation Studies, University of California, Berkeley, with Carl L.
Monismsith as Principal Investigator. The support and encouragement of Dr. Ian Jamieson,
SHRP Contract Manager, is gratefully acknowledged.
The draft of this report was reviewed by an Expert Task Group (ETG) which
includes the following members:
Ernest Bastian Eric E. Harm
Federal Highway Administration Illinois Department of Transportation
Campbell Crawford Charles S. HughesNational Asphalt PavingAssocation Virginia Highway and Transportation
Research Council
William Dearasaugh Dallas N. LittleTransportation Research Board Texas A&M University
Francis Fee Kevin Stuart
ELF Asphalt Federal Highway Administration
Douglas I. Hanson Roger L. YarbroughNew Mexico State Highway Department University Asphalt Company
Other reviewers included: Dr. R.G. Hicks, Dr. S.F. Brown, and Dr. P.S. Pell. Ms.
Joanne Birdsall prepared the final manuscript.
oo.
111

DISCLAIMER
The contents of this report reflect the views of the authors, who are solely responsible
for the facts and accuracy of the data presented. The contents do not necessarily reflect the
official view or policies of the Strategic Highway Research Program (SHRP) or SHRP's
sponsors. The results reported here are not necessarily in agreement with the results of
other SHRP research activities. They are reported to stimulate review and discussion within
the research community. This report does not constitute a standard, specification, or
regulation.
iv

TABLE OF CONTENTS
ABSTRACT ....................................................... i
ACKNOWLEDGEMENTS ............................................ iii
DISCLAIMER ..................................................... iv
TABLE OF CONTENTS .............................................. v
LIST OF TABLES .................................................. vii
LIST OF FIGURES ................................................. viii
1.0 INTRODUCTION .............................................. 1
1.1. Problem Definition ......................................... 1
1.2. Purpose ................................................. 11.3. Objectives ................................................ 1
2.0 BACKGROUND ............................................... 5
2.1. Factors Affecting Fatigue Response ............................. 52.1.1. Specimen Fabrication .................................. 52.1.2. Moad of Loading .................................... 142.1.3. Mixture Variables .................................... 15
2.1.4. Loading and Environmental Variables .................... 202.2. Limitations of Available Information ........................... 24
2.3. Overview of Test Methods and Their Development ................ 24
3.0 FATIGUE TEST METHODS .................................... 37
3.1. Simple Flexure ........................................... 383.1.1. Center-Point and Third Point Loading .................... 393.1.2. Cantilever Loading ................................... 393.1.3. Evaluation ......................................... 40
3.2. Supported Flexure ......................................... 473.3. Direct Axial ............................................. 49
3.3.1. Tension ........................................... 49
3.3.2. Tension/Compression ................................. 513.4. Diametral Test ........................................... 553.5. Triaxial ................................................. 603.6. Fracture Mechanics ........................................ 61
3.7. Wheel-Track Testing ....................................... 69
V

3.7.1. Laboratory Tests .................................... 693.7.2. Full-Scale Tests ..................................... 70
3.8. Evaluation of Test Methods ................................. 73
4.0 FAILURE CONCEPTS ................................. ........ 85
4.1. Unique Strain ............................................ 864.2. Deviator Stress ........................................... 874.3. Work Strain ............................................. 91
4.4. Constancy of Dissipated Energy ............................... 924.5. Work Strain and Dissipated Energy ........................... 100
5.0 CORRELATIONS AND SIMPLIFICATIONS ....................... 104
5.1. Direct Tension Test ...................................... 1045.2. Failure Envelope ......................................... 108
6.0 RELATIONSHIP BETWEEN TEST RESULTS AND FIELDPERFORMANCE ............................................ 115
6.1. Shift Factor ............................................. 1166.2. Fundamental Mixture Properties in Pavement Analysis ............ 1176.3. Further Challenges ....................................... 1226.4. Summary .............................................. 126
7.0 CONCLUSIONS AND RECOMMENDATIONS ..................... 128
7.1. Specimen Fabrication ..................................... 1287.2. Factors Affecting Fatigue Response ........................... 1287.3. Test Methods ........................................... 1297.4. Recommendations ........................................ 129
8.0 REFERENCES .............................................. 132
APPENDIX A ............................................... 140
A.1. Hypotheses ............................................ 140A.2. Test Program ........................................... 144
vi

LIST OF TABLES
2.1 Comparative Evaluation of Controlled-Stress andControlled-Strain Loading ....................................... 17
2.2 Factors Affecting the Stiffness and Fatigue Response ofAsphalt Paving Mixtures ......................................... 18
2.3 Effect of Shape of Waveform on Fatigue Life(Raithby and Sterling, 1972) ...................................... 22
2.4 Summary of Fatigue Test Characteristics ............................ 25
2.5 Chronology of Fatigue Testing and Evaluation ........................ 29
3.1 Comparison of Test Methods ..................................... 82
A.1 Significant Mixture and Test Variables for Fatigue Study ............... 146
A.2 Number of Samples for Fatigue Factorial Design ..................... 147
vii

LIST OF FIGURES
2.1 Influence of Compaction Method on Relative Mixture Stability(Vallerga, 1951) ................................................ 9
2.2 Principle of Compaction with the Gyratory Shear Compacting Press (Bonnot,1986) ....................................................... 10
2.3 Example of Compactive Effort Curves for Different Mixes Usingthe Mobile Steel Wheel Simulator (yon Quintus et al., 1988) ............. 13
2.4 Comparison of Laboratory Controlled-Strain and Controlled-StressFatigue Data (Monismith et al., 1977) .............................. 16
2.5 Types of Loading Patterns (Said, 1988) .............................. 21
2.6 Equivalent 'rime of Loading-Depth Relationship for Horizontal Stress(McLean, 1974) ............................................... 23
3.1 Third-Point Flexure Apparatus (Monismith et al., 1971) ................. 41
3.2 Center-Point Flexure Apparatus (van Dijk, 1972) ...................... 42
3.3 Load vs. Time and Deflection vs. Time Relationships forControlled-Stress Test Equipment (Monismith et al., 1971) ............... 43
3.4 Flexure Apparatus Used by Pell (1965) ............................. 44
3.5 Controlled-Strain Torsional Fatigue Machine (Pell, 1965) ................ 45
3.6 Bending Fatigue Test Machine (Bonnot, 1986) ........................ 46
3.7 Fatigue Test Apparatus (Barksdale, 1977) ............................ 50
3.8 Schematic Representation of Direct Axial Fatigue Test(Raithby and Sterling, 1972) ...................................... 53
3.9 Effect of Strain Reversal on Fatigue Life(Raithby arid Sterling, 1972) ...................................... 54
3.10 Loading Configuration and Failure in Diametral Test(Kennedy, 1977) ............................................... 58
oo°
VIII

3.11 Relative Stress Distributions and Element Showing Biaxial State of Stress for theDiametral Test (Kennedy, 1977) ................................... 59
3.12 Triaxial Load Fatigue Rig (Pell and Cooper, 1975) ..................... 63
3.13 Triaxial Apparatus Permitting Independent Control of Axial andRadial Loads (McLean, 1974) .................................... 64
3.14 Crack Tip Displacement Modes ................................... 67
3.15 Diagram for Fatigue Life Computations from FractureProperties (Salam, 1971) ........................................ 68
3.16 Schematic Representation of Wheel Tracking Machine(van Dijk, 1975) ............................................... 71
3.17 Details of Circular Test Track (Terrel and Kumar, 1970) ................ 74
3.18 Canterbury Test Track Showing Arrangement of Sections(Paterson, 1972) ............................................... 75
3.19 Linear Test Track - Nottingham University (Brown et al., 1977) ........... 76
3.20 TRRL Road Machine (Grainger, 1964) ............................. 77
3.21 Operational Layout of the ALF (Metcalf et al., 1985) ................... 78
3.22 Circular Track Facility for Fatigue Testing (LCPC) ..................... 79
4.1 Results of Fatigue Tests at Various Temperatures and Speeds(Saal and Pell, 1960) ........................................... 88
4.2 Strain-Life Fatigue Results for a Range of Mixes(Pell and Taylor, 1969) .......................................... 89
4.3 Typical Stress Difference-Fatigue Life Relationships for VariousTest Methods (Porter and Kennedy, 1975) ........................... 90
4.4 Relation of Energy Ratio and Mix Stiffness for an AsphalticConcrete (van Dijk, 1975) ....................................... 97
ix

4.5 Phase Angle, Energy Ratio, and Dissipated Energy Charts Showingthe Limits for the Base Course and Wearing Course and WearingCourse Mixes Tested (van Dijk et al., 1977) .......................... 98
4.6 Distortion Energy (Garretsen et al., 1987) .......................... 103
5.1 Direct Tension Testing Apparatus (Epps, 1969) ...................... 106
5.2 Typical Window Formed by Boundary Curves (Little and Richey, 1983) .... 111
6.1 Asphalt-Concrete Thickness vs. Tensile Stress for a TypicalFull-Depth Pavement .......................................... 120
6.2 Asphalt-Concrete Thickness vs. Tensile Stress for a TypicalPavement with Granular Base ................................... 121
6.3 Distortion Energy (Related to Work Strain) and Horizontal StrainDue to a Ve.rtical Load (Kunst, 1989) .............................. 127
A.1 Stress vs. Applications to Failure ................................. 142
A.2 Strain vs. Applications to Failure ................................. 142
X

1.0 INTRODUCTION
This summary report, focussing on the fatigue response of asphalt mixtures, is one
of a series prepared as a part of SHRP Project A-003A, "Performance Related Testing and
Measuring of Asphalt-Aggregate Interactions and Mixtures," to evaluate available
information on the fatigue, permanent deformation, thermal cracking, aging, and water
sensitivity characteristics of asphalt mixtures.
1.1 Problem Definition
Pavement distress resulting from repeated bending or fatigue of asphalt-concrete
pavements has been a well-recognized problem in the United States since 1948 (Hveem and
Carmany, 1948). In order to address fatigue distress in mixture and pavement design
procedures, it is necessary to describe the behavior of asphalt-concrete mixtures under
repeated stressing of the type encountered in situ. To this end, it is useful to evaluate
various laboratory fatigue tests with the objective of recommending a relatively simple test
(or tests) which can best simulate field conditions.
1.2 Purpose
The primary purpose of this research report is to review various fatigue test methods
and to recommend the most appropriate method for defining the fatigue response of
asphalt-concrete mixtures and for ultimate incorporation into an asphalt-aggregate mixture
analysis system.
1.3 Obiective_
This report includes an evaluation of factors affecting the fatigue characteristics of
dense-graded asphalt concrete together with an assessment of test methodologies used to

measure these characteristics.
Fatigue, as considered herein, is a form of cracking resulting from repeated traffic
loading. Cracking resulting from thermal stresses (non traffic associated) is described in
another summary report in this series.
From an evaluation of available information, it is evident that there are many
procedures, including both laboratory and field testing, to define the fatigue response of
asphalt-concrete mixtures. These procedures involve a variety of test techniques, equipment
types, specimen configurations, types and modes of loading, test conditions (for example,
frequency of loading, temperature, etc.), and analysis procedures.
Thus, the objectives of this study are to:
1. Review the factors affecting the fatigue performance of dense-graded
asphalt-concrete mixtures,
2. Summarize the steps necessary to measure fatigue lives and related
parameters which are useful in the structural analysis and design of
asphalt-concrete pavements,
3. Provide a listing of both the advantages and disadvantages of each test
method, and
4. Evaluate and list, in order of preference, the methods used to measure fatigue
response for mixture evaluation and design as well as for prediction of
pavement life in situ.
The methods which have been analyzed in this summary report include:
1. Simple flexure testing,
2

2. Supported flexure testing,
3. Direct axial testing,
4. Diametral testing,
5. Triaxial testing,
6. Fracture mechanics testing, and
7. Wheel-track testing.
Two additional considerations relative to fatigue are included. One is associated with
an indirect determination of an appropriate asphalt content for reasonable fatigue response
based on failure envelope defined for thermal cracking and permanent deformation. The
other is concerned with the phenomenon of load associated cracking which originates at or
near the surface of asphalt-concrete pavements.
This summary report is organized into seven sections. Section 1 contains the
introduction. Factors affecting the fatigue response of asphalt concrete, based on a review
of available information, are summarized in Section 2. Section 3 includes a summary of the
various methods to define fatigue, including a listing of their advantages and disadvantages.
It also provides the basis for evaluating alternate test methods in order to arrive at an initial
ranking for the laboratory studies to be conducted as a part of this project. Section 4
examines several fundamental concepts that may prove useful in developing a better
understanding of fatigue response of both laboratory specimens and in-situ materials.
Section 5 discusses alternate procedures having the potential for easing the burden of
laboratory fatigue testing and simplifying the analysis of pavement structures. Section 6
presents a discussion of the relationship(s) of test results to field performance. Finally,
3

Section 7 provides conclusions based on this detailed evaluation, a ranking of the existing
test methods, and an identification of some areas which may require additional investigation.
Appended to the report is the recommended laboratory study plan to evaluate the
various tests methodologies which have evolved as the candidate procedures.
4

2.0 BACKGROUND
The purpose of this section is to provide background information regarding the
fatigue response of asphalt mixtures. First, a summary is presented of the various factors
affecting fatigue response including the method of specimen fabrication (compaction), the
mode of loading, mixture variables, and, finally, traffic and environmental variables. Next,
the limitations of available information are briefly highlighted. The section concludes with
an overview of fatigue test methods and their development.
2.1 Factors Affecting Fatigue Response
Included herein is a brief summary of available information on factors affecting the
fatigue response of those types of asphalt paving mixtures that are comprised of asphalt
cements and of aggregates which produce dense mixtures when properly compacted.
Included are discussions of (1) methods of specimen fabrication, (2) mode of loading
considerations, (3) the influence of mixture variables on fatigue performance, and (4) the
influence of loading and environmental variables on fatigue response.
2.1.1 Specimen Fabrication
The primary objective of specimen fabrication or compaction is to produce "realistic"
test specimens, that is, specimens that reasonably duplicate the corresponding in-situ asphalt
paving in all major respects including composition, density, and engineering properties. The
effect of method of testing is examined more thoroughly in the following section.
Compaction methods presently being utilized to fabricate test specimens include the
following: (1) static compaction, (2) impact compaction, (3) kneading compaction, (4)
gyratory compaction, and (5) rolling-wheel compaction. The compaction temperature is
5

typically selected such that the asphalt viscosity is 500 +_. 50 cSt (ASTM D-3202). To
maintain this temperature during compaction, the mold, compaction foot, tamping rod, and
asphalt-concrete mix must be preheated. The NCHRP/AAMAS (Asphalt-Aggregate
Mixture Analysis System) study provides a recent evaluation of selected laboratory
compaction procedures (von Quintus et al., 1988).
Static t_ompaction. This procedure involves placing the loose asphalt mixture in a
mold of the desired shape and size and compressing the mixture under the gradual
application of a static load. To promote homogeneity, the mixture is generally "rodded" or
"spaded" prior to compaction, and the mold is made "free floating" by using a "double
plunger" arrangement. ASTM Test Method D-1074 describes such a double-plunger
compaction procedure. The primary advantage of this method, compared to kneading,
gyratory, and rolling-wheel compaction methods, is its simplicity. The major disadvantage
is that the orientation of aggregate particles is different from that obtained in the field and,
hence, in-situ conditions are not accurately simulated.
Impact Compaction. In this methodology, the mixture is compacted in a mold by
repetitive applications of impact loads, using a hammer of specified weight which is allowed
to free-fall a fixed distance. The number of blows is selected to reproduce densities
achieved in situ under roller and traffic compaction. The "Marshall" method (ASTM D-
1559-82) employs this procedure.
The advantage of impact compaction is that high energy can be applied with a rather
simple and low-cost, hand-operated unit that is portable, thus making it convenient to
fabricate specimens in the field as well as in the laboratory.

The primary disadvantage is that the high energy transfer on impact may cause (1)
the asphalt film to rupture and the aggregate particles to bear directly upon each other
which in turn leads to structural properties (for example, resistance to permanent
deformation) different from those of mixtures compacted in situ and/or (2) undue fracture
and degradation of the aggregate. Also, it is doubtful that the impact procedure can be used
to fabricate specimens which duplicate asphalt paving in the field after it has been subjected
to the compaction effects of rubber-tired traffic over a period of years (ARE, 1986).
Another potential disadvantage is the difficulty in preparing uniform and homogeneous
specimens of sizes and shapes other than short cylinders. No data or information exists on
this point.
Kneading Compaction. The kneading compactor was developed jointly by the
California Division of Highways and the University of California, Berkeley, under the
auspices of the Triaxial Institute.
Compaction is achieved by repetitive loading through a tamping foot, considerably
smaller in size than the specimen being compacted. During each application of the tamping
foot, the load is gradually increased, maintained for a short time interval, and then released.
Each subsequent loading is applied to a "fresh" portion of the exposed surface. This pattern
of loading induces deformations and particle orientation similar to those which take place
in situ. Kneading compaction is employed in the preparation of beam specimens for fatigue
testing (ASTM D-3202) and in preparing specimens for the stabilometer test (CALTRANS
Test 366).
Existing kneading compactors vary in size from small hand-operated units, through
7

portable hydraulic table models, to very elaborate mechanical-hydraulic models with the
capability of compacting beam specimens up to 30 in. in length as well as cylindrical
specimens with diameters up to 6 in. and heights to 12 in. Correlation studies have been
carried out indicating that laboratory-fabricated specimens have both physical and
mechanical properties equivalent to those of field cores (ARE Inc., 1986).
Results of Hveem Stabilometer tests on specimens prepared by impact, static and
kneading compaction, shown in Figure 2.1, illustrate that kneading compaction produces
mixes with a reasonable sensitivity of stability to changes in asphalt content.
Gyrator3' Compaction. Using gyratory shear, asphalt concrete is compacted by
subjecting a cylindrical specimen to gyratory motion of a compaction mold while pressure
is maintained at each end of the specimen by means of steel plungers with parallel faces
(Figure 2.2).
The main disadvantage of the gyratory compactor is its inability to fabricate test
specimens in other than cylindrical shapes. The NCHRP/AAMAS Study (von Quintus et
al., 1988) concluded that gyratory compaction produces specimens which are representative
of materials compacted in situ. This conclusion is based on a comparison of various stiffness
and strain parameters measured on cores obtained immediately after construction with the
same parameters obtained on specimens prepared in the laboratory to the same unit weights
as the field cores. According to the AAMAS analysis, kneading and rolling-wheel
compactors also adequately simulated field compaction. The specific ranking of compaction
devices in terms of their abilities to consistently simulate the engineering properties of field
cores is as follows:
8

6O
40 '.,
I,._3o I -_'-_--C-- o---_-_- _ _ _.
_ 20 1
•_ Legend,"=. _ Double plunger (2000psi)
/0 -- --°--D°ubleplunger(15OOps))......... Marshal/ /mpact '%-___'_ i
QC _ --Calif. Research Carp, _''. l---_Colif D/'v/s/on of Hwys.... Univ. of Calif. ( Triaxiol /nsDtute )
0 E I
3 4 5 6 7 8 9/_sphol/ Content - _o
Figure 2.1 - Influence of Compaction Method on Relative Mixture Stability (Vallerga, 1951)
9

Figure 2.2 - Principle of Compaction with the Gyratory Shear Compacting Press (Bonnot,
1986)
10

1. Gyratory-shear compactor
2. California kneading compactor
Mobile steel wheel simulator
3. Arizona vibratory\kneading compactor
4. Marshall hammer
Rolling-Wheel Compaction. Rolling-wheel compaction can closely simulate field
compaction conditions (von Quintus et al., 1988; Bonnot, 1986; and van Dijk, 1975). The
major advantage of this technique is that the orientation of the aggregate particles and
density of the mixture can be made to closely correspond to field compaction. This can be
accomplished by compacting the mixture in a large area using a roller that can impart com-
pacting pressures similar to those which occur in the field, and then extracting the required
specimens by sawing or coring from the large slabs. For such a large operation, a full scale
mixing machine must be employed. The disadvantage is that this is a costly procedure
requiring specialized equipment.
Alternatively, other small-scale compaction methods using a steel roller (Brown and
Cooper, 1984; von Quintus et al., 1988) or a pneumatic tire (Bonnot, 1986) are also
available. As an example, the procedure developed by the Laboratoire Central des Ponts
et Chauss6es (LCPC) of France utilizes a small wheel track to compact a slab-size sample
measuring 500 mm by 180 mm and having a thickness of 100 mm. The track is placed on
a metal frame and rests on a steel base plate. The wheels are fitted with rubber tires (400
mm by 8 mm) inflated and loaded appropriately to simulate field compaction pressures.
After compaction, specimens are sawed or cored from this slab.
11

An example of the steel-wheel rolling process is that used in the NCHRP/AAMAS
study. With such equipment, the rolling wheel applies a force to a portion of the free face
of an otherwise confined asphalt-concrete mix. Compactive forces are applied over the
entire specimen using a curved foot simulating the rolling pattern of a steel-wheel roller in
the field. The coarse aggregate particles move relative to one another in the partial free
surface, allowing the particles to orient themselves similar to that in the field.
Data from ttle NCHRP/AAMAS Study are shown in Figure 2.3. In this instance the
laboratory specimens were compacted using a steel-wheel compactor, controlling the number
of revolutions of th,e steel foot to determine the compactive effort required to produce the
average air void contents of field cores.
Evaluation. Based on the evaluation of compaction procedures, it would seem
reasonable to conclude the following:
1. While,. comparing various methods of laboratory compaction, rolling-wheel,
kneading, and gyratory methods produce test specimens more like the in-situ
pavement than either static or impact compaction.
2. Of the methods of compaction compared in Figure 2.1, kneading compaction
using the Triaxial Institute Kneading Compactor provides maximum sensitivity
of relative stability to asphalt content. Results of this type are not available
for comparable specimens prepared by the mechanized gyratory or rolling-
wheel compaction methods.
3. Possible effects of compaction method on the fatigue response of asphalt
mixtures have not been investigated. Accordingly, a fatigue testing program
12

MOBILE STEEL WHEEL SIMULATOR
250 i _ '_ I i
• C0-0009
O MI-0021
- k _ TX-0021 -
• VA-0621
® WY-0080
200
Coloradoz iS0
i Wyo
o
Virginia100
Z
50
0 I I I I I
0 2 4 6 8 i0 12
AIR VOIDS, %
Figure 2.3 - Example of Compactive Effort Curves for Different Mixes Using the Mobile
Steel Wheel Simulator (von Quintus et al., 1988)
13

should be carried out to define the relative effect of compaction method on
fatigue performance, using specimens compacted by
rolling-wheel, kneading, and gyratory methods. Orientation of the test
specimens relative to the compaction direction should be such as to insure
that the in-situ situation is correctly modelled; e.g., if a cylindrical core is to
be used from a rolled slab for direct tension fatigue testing, it should be
drilled horizontally from the slab.
2.1.2 Mode of Loading
In laboratory tests, fatigue response has been shown to be a function of mode of
loading, that is, the :method by which stress and strain are permitted to vary during repetitive
loading. Limits to the loading conditions range from the controlled-stress mode, where the
load or stress amplitude remains constant during testing, to the controlled-strain mode,
where the deformation or strain amplitude is maintained constant. Depending on
temperature (and hence mixture stiffness), the results of these tests may be quite different
(Figure 2.4). Test results may also lead to different mixture designs: accordingly, attempts
have been made to determine what mode of loading best simulates actual pavement
conditions (Monisrnith and Deacon, 1969, and Monismith et al., 1977).
One approach is to make use of a parameter termed the mode factor and defined
as"
MF _A-BA + B (2.1)
14

where MF is the mode factor, A is the percentage change in stress due to a stiffness
decrement of C percent, B is the percentage change in strain due to a stiffness decrement
of C percent, and C is an arbitrary but fixed reduction in stiffness resulting from the
accumulation of fatigue damage under repetitive loading. The mode factor assumes a value
of-1 for controlled-stress conditions and + 1 for controlled-strain conditions. Researchers
have evaluated several characteristics of the two modes of loading. A brief summary is
presented in Table 2.1.
2.1.3 Mixture Variables
A summary of the influence of selected mixture variables on fatigue response is
contained in Table 2.2. Results summarized in this table have been obtained from research
reported in a number of references (for example, Pell, 1972 and 1973; Monismith et al.,
1971 and 1981; Bazin et al., 1967; Freeme et al., 1973; Kirk, 1967; and Epps et al., 1972).
In general, for continuously graded mixes, the two primary factors affecting fatigue
response are asphalt content and air void content. Aggregate type seems to have less
influence. Thus, from a mix design standpoint, as much asphalt as possible should be
incorporated into the mixture. There is an upper limit to asphalt content because of
stability requirements; however, this upper limit should be approached in order to increase
fatigue resistance. In addition, adequate compaction is required to promote improved
fatigue resistance, that is, the mixture should be compacted to the design density at the time
of construction (for example, the void content in the compacted mixture should be of the
order of four percent).
15

i
lO,t:_O [
/-- Conh'olled Stroin,
_ " .
._/ooc -"-.....,.j__ / r,,,,,p..68",, i__ F_z-.._o-_ i
._ _"__ I • _""--_ /_'_ • '
Con/rolled Strdw_s, --J "___ ___ _'_ _ _ __ _ramp.,68 *C . ..... _'---_ ,' ' _ _ _ ....._
/vf• 4.68xlO"u( I/e')''" "_ _/0(7 I "_'-
{ I -_"
l
,o I IOz /03 /04 _ _
Number of Slres$ A_Ohcot/ons, N
Figure 2.4 - Comparison ofLaboratory Controlled-Strainand Controlled-StressFatigue Data
(Monismith et al., 1977)
16

Table 2.1 Comparative Evaluation of Controlled-Stress and
Controlled-Strain Loading
VARIABLES CONTROLLED-STRESS (LOAD) CONTROLLED-STRAIN (DEFLECTION)
Thickness of asphalt Comparatively thick asphalt bound layers Thin asphalt-bound layer; < 3 inchesconcrete layer
Definition of failure; Well-defined since specimen fractures Arbitrary in the sense that the test isnumber of cycles discontinued when the load level has been
reduced to some proportion of its initial
value; for example, to 50 percent of theinitial level
Scatter in fatigue test data Less scatter More scatter
Required number of Smaller Largerspecimens
Simulation of long-term Long-term influences such as aging lead to Long-term influences leading to stiffness
influences increased stiffness and presumably increased increase will lead to reduced fatigue lifefatigue life
Magnitude of fatigue life, Generally shorter life Generally longer lifeN
Effect of mixture variables More sensitive Less sensitive
Rate of energy dissipation Faster Slower
Rate of crack propagation Faster than occurs in situ More representative of in-situ conditions
Beneficial effects of rest Greater beneficial effect Lesser beneficial effect
periods
17

Table 2.2 Factors Affecting the Stiffness and Fatigue Response
of Asphalt Paving Mixtures a
Effect of Change in Factor
Factor Change in Factor On Stiffness On Fatigue Life in On Fatigue Life inControlled-Stress Mode Controlled-Stress Mode
of Testing of Testing
Asphalt Viscosity Increase Increase Increase Decrease(Stiffness)
Asphalt Content Increase Increase 2 Increase 2 Increase 3
Aggregate Open to Dense Increase Increase Decrease 4Gradation
Air Void Content Decrease Increase Increase Increase 4
Temperature Decrease Increase 5 Increase Decrease
aFor continuously graded mixtures.
2Reaches optimum at level above that required for stability.
3No significant data. Conflicting conditions of increase in stiffness and reduction inasphalt strain make this speculative.
4No significant data.
5Approaches limit at below-freezing temperatures.
18

For heavy-duty pavements (with thick asphalt-bound layers), a mix of high stiffness
should be utilized by incorporating a stiff asphalt--it may be necessary to temper this
requirement where thermal stresses can lead to cracking--and a dense gradation of
aggregate.
For light-duty pavements (with thin asphalt-bound layers), the mixture should be
made as flexible as possible, with lower stiffness asphalts and more open gradations (that
is, fewer fines). Alternatively, mixes containing a gap grading appear to produce better
fatigue response than the continuously graded mixes normally used in the United States
(Freeme et al., 1973).
Quantitatively, the effect of asphalt content and void content on the fatigue life of
asphalt mixtures can be ascertained by a correction factor proportional to (Pell et al., 1975):
Vm (2.2)(VB+ Vv)
where Vv is the air void volume (percent) and V B is the asphalt volume (percent) and
lib = [Past, "G, eg "(1 - Vv)] (2.3)[lOO + • ogg]
where Pasp is the percent by weight of asphalt (aggregate basis), Gas p is the specific gravity
of asphalt, and Gagg is the specific gravity of the aggregate. Santucci (1977) has analyzed
the data of Pell and Cooper (1975) and has noted that their relationship fits laboratory data
(Epps, 1969) for California mixes "reasonably" well.
19

2.1.4 Loading and Environmental Variabl¢_
Loading and environmental variables have both direct and indirect implications.
Direct implications include the shape and duration of the load pulse used in the laboratory
and the test temperature. Figure 2.5 and Table 2.3 show loading patterns generally used
in the laboratory. The relationship between loading time and thickness of the bituminous
layer for various vehicle speeds is given in Figure 2.6. From this figure, it appears that a
loading time in the range of 0.04 to 0.1 second is appropriate for fatigue testing.
For heavy-duty pavements, an increase in mixture stiffness increases the fatigue life,
provided other variables remain constant. Epps (1969) compared the fatigue performance
of specimens obtained from pavements subjected to actual traffic loading to that of
laboratory specimens of similar composition. He concluded that aging-induced stiffening
of the field mix increases its fatigue life to the extent that it offsets the effect of higher in-
situ air void contents and damage due to traffic. However, it should be pointed out that
stiffening of the asphalt due to aging would likely reduce its ability to resist cracking
(because of increased brittleness) in cold temperatures. The field projects of Epps' study
(Gonzales By-pass and Morro Bay) were not located in cold environments.
Densification of a paving mixture by traffic in service is also likely to affect its fatigue
response. Raithby and Ramshaw (1972) found, for example, that traffic compaction in a
large test slab increased fatigue life for a given stress level by a factor of three and increased
the dynamic stiffness by 60 percent. The effect on fatigue life is due both to the increase
in stiffness and the decrease in air voids.
20

0
time
time(a) sinusoidal
time
time8 (b) haversine
time
time(c) cyclic (oading
°_ F7 n F-I timeE
time(d) cyclic ,toeding
Figure 2.5 - Types of Loading Patterns (Said, 1988)
21

Table 2.3 Effect of Shape of Waveform on Fatigue Life
(Raithby and Sterling, 1972)
i
Geometric
Waveform Temp, *C Stress Amp Initial Mean Relative
MN/m 2 Strain Amp' Fatigue Lives
Life, Cycles
25 1.7 x 10"4 24,690 0.42
-+0.33
(48 psi)
25 1.2 x 10⁴ 58,950 1.0
/AN 25 0.67 x 10⁴ 85,570 1.45
'These represent values after approximately 200 cycles.
22

IO
Bocksdole- _t rio_TulorI
..... .._- "'30 mph
o.I - :---- _ _ _m-p_-.......... 30
00/ .----__ _ .-,_---E: ;-4,.-
1 Ror,#e of doto
ooo,....................II0 2 4 6 8 I0 12 14 /6 18 20
Depth -m.
Figure 2.6 - Equivalent Time of Loading-Depth Relationship for
Horizontal Stress (McLean, 1974)
23

2.2 Limitations of Available Informatign
Various researchers do not necessarily consider the same parameters--and even when
they do, the magnitudes are often different--in the investigations reported herein:
accordingly, it is difficult to compare the results of the various fatigue investigations and to
prepare a comprehensive summary of available information. For this reason, a limited
number of the available laboratory methods which are representative of the existing systems
have been selected for detailed evaluation herein.
2.3 Overview of Test Methods and Their Development
Table 2.4 provides a summary of the basic characteristics of the fatigue test methods
for the cases of third-point flexural, center-point flexural, cantilever flexural, rotating
cantilever, uniaxial, diametral, and supported flexure. These characteristics involve loading
configuration, stress distribution, loading wave form, loading frequencies, occurrence of
permanent deformation, state of stress, and presence of a zone of uniform stress. From this
table, it is apparent that the repeated-load diametral test is considerably different from the
others. Flexural, rotating cantilever, and axial tests have a uniaxial state of stress while the
diametral test has a biaxial stress state.
The rotating cantilever test has a continuous sinusoidal loading form. Flexural tests
typically employ pulsating loads of a variety of shapes (triangular, square, etc.), with or
without load reversal to eliminate permanent deformation. Axial tests use a sinusoidal or
a haversine pulse with or without a rest period. Rotating cantilever tests and axial tests
have used relatively higher frequencies than flexural and diametral tests. In a pavement a
rest period occurs after the application of each load pulse. A continuous loading pattern,
24

gl I.
iiNo_i __ _ .o .o _i
IO L. *p
o )))-,-I
_'j ee_ o o o oa._ Z Z Z Z
14 "7 "- w_, ..>
> I
_)_ _) E _ ,-., {'o ;; o \_ _ ° ,.-o- )
0 . ..... o.- (...-
o
_ .- t
• _ •
._ -o _,_ _o _ _,--'1 _ (n _..I ...,..,_.
'<'. _o _ • I-- i--V (/I
ill,-.,t
_ Li/
"o_ _ _*' = "" _'7-,._ 0 -,,* II 0 mI,- I_ t_ U Q. t/,. U e_' (.3

.-... _ o¢,- 0 *_ t'-,_ ¢/)
o _'E _,-,0 "-J .'_ X i.- 0,')
(/) ,p ,_
ca')(/) .._ nn
C0
U :1 o,-'- z =,_ _.-,,-I_ -Coo
0
0
A .__ _, ,- •['_ oL 0..
r,j
b_ _ _ ,(1)
0 m C
.,, > _
c :_ I---C'=.i
0 _)
_4 _ c
_ .o
r_ 0 '-.
• 1_-
-,-I,'-I
•0
(.3
0..I
"- _c ._.T. _-.-/,.-

such as that used in rotating cantilever tests, usually yields a smaller fatigue life:
consequently, laboratory tests are completed more quickly.
A major consideration in fatigue testing is the extent to which the specimen should
be allowed to deform inelastically under repetitive loading. Under traffic loading in service,
paving mixtures may inelastically deform as a result of densification, shear forces, and a
permanently yielding foundation. Nevertheless, in a properly designed and constructed
pavement, permanent deformations--particularly those associated with a yielding
foundation--will be small and eventually non-progressive.
Some forms of laboratory testing incorporate stress reversal to eliminate or reduce
cumulative deformation and to better simulate the stress patterns imposed by traffic loads
in situ. Others, particularly the diametral test and some types of axial and supported-flexure
tests, do not.
Three continuous loading pulses are applied by a moving wheel load over a pavement
rather than the single pulse so often applied in the laboratory fatigue test. At a critical
location on the bottom of the asphalt-concrete layer, the material is first subjected to a
compressive stress as the wheel approaches; then a tensile stress as the wheel moves over
the point; and, finally, a compressive stress again as the wheel moves away. The magnitude
of the initial compressive strain pulse on the bottom of the layer is approximately one-
seventh that of the tensile strain pulse (Raithby and Sterling, 1972). Without this smaller
initial compressive stress pulse, the decrease in fatigue life should be at most on the order
of only 10 to 15 percent (Barksdale, 1977).
27

As a result of the detailed literature review, chronological developments relative to
fatigue testing have. been shown in Table 2.5.
28

Table 2.5 Chronology of Fatigue Testing and Evaluation
YEAR _GATOR(S) TEST METHODS EVALUATION
AND CONDITIONS METHOD
1989 Rao Third-point flexure Controlled stressDr. Engg.,UC
Berkeley
1989 Scholz, Hicks, and Scholl Diametral Controlled stressOSU and
OregonDOT
1988 Gerritsen and Jongeneel Cantilever (trapezoidal) Controlled strainAAPT flexure
1987 Button, Little, Kim, and Flexure Controlled stress,AAPT Ahmed controlled strain, and
fracture mechanics
1986 Bonnot Direct tension and cantilever Controlled stressTRR 1096 (trapezoidal) flexure
1985 Monismith, Epps, and Finn Third-point flexure Controlled stress andAAPT controlled strain
Same Hugo and Kennedy Supported discs (elastic Intermediate mode offoundation) loading
Same Bjorklund Supported beams (rectangular, Intermediate mode ofelastic foundation) loading
1984 Molenaar Dynamic tensile Controlled stress andAAPT fracture mechanics
29

YEAR iNVF__TIGATOR(S) TEST METHODS EVALUATION
AND CONDITIONS METHOD
1983 Little. and Richey Diametral Controlled stress andfailure envelopeconcept
1982 Bonnaure, Gravois, and Center-point flexure Controlled strainUdron
1982 Mahoney and Terrel Suppported beam Intermediate mode of5th Intl (rectangular, rubber) with loadingConf on Str roiling-wheel loadingDes of AsphPavements
1981 Whitcomb, Hicks, and Diametral Controlled stressAAPT Boonders
1981 Monismith Third-point flexureAAPT
1980 Bonnaure, Gravois, and Statistical regression for 146 Controlled stress andUdron fatigue lines covering several controlled strain
major test methods andmixture variables of variousauthors
1979 Ulidtz Controlled stress,AAPT fracture mechanics,
and empiricalcorrelation factors
1978 Barksdale Supported beams (rectangular, Intermediate mode ofAAPT rubber) loading
1977 Classen, Edwards, Sommer, Dissipated energy method Limiting tensile strain4th Intl and Uge which is independent of test criteriaConf on Str conditions
Des of AsphPavements
30

YEAR INVESTIGATOR(S) TEST METHODS EVALUATION
AND CONDITIONS METHOD
Same Shell method Dissipated energy method Limiting tensile strainwhich is independent of test criteriaconditions
Same Finn, Sara, Kulkarni, Nair, AASHO Road Test results Limiting tensile strainSmith, and Abduilah and computer programs criteria
1977 Van Dijk Cantilever (trapezoidal) and Controlled stress,AAPT centerpoint (rectangular) controlled strain, and
flexure dissipated energytheory
Same Ruth, Gary, and Oslan Flexure (77* F, 41" F, and Controlled stress and23* F) and diametral (41" F) controlled strain
Same Kennedy Diametral Controlled stress
GIT-7305 Barksdale Supported beams (rectangular, Intermediate mode ofrubber) (same as 1978 AAPT) loading
1976 Majidzadeh Supported beams (elastic Fracture mechanicsFHWA-RD- foundation)76-91 and 92
1976 FinnAAPT
1975 Pell and Cooper Rotating flexure and axial Controlled stressAAPT fatigue
1973 Monismith Third-point flexure Controlled stress andHRB controlled strain
SpecialReport 140
31

YEAR INVESTIGATOR(S) TEST METHODS EVALUATION
AND CONDITIONS METHOD
Same Barksdale and Hicks Repeated load plate tests Numericalcharacterization
(layered theory andfinite elementapproaches)
Same Pell Rotating flexure Controlled stress withcomparison tocontrolled strain
Same Deacon State-of-the-art survey Suggested controlledstress, controlledstrain, and numericalmethods
Same Finn Serviceability index Numerical correlationbetween degree ofcracking and presentserviceability index
Same Terrel Examples of work from Controlled stress andMonismith, King,ham, and controlled strainKallas
Same Witczak Analysis of AASHO Road Allowable strainTest data criteria for a given
number of load
repetitions
Same The Asphalt Institute Same Same
Same Majidzadeh and Ramsamooj Supported beams (elastic Intermediate mode offoundation) loading and fracture
mechanics
Same Freeme and Marais Cantilever (rectangular and Controlled straintrapezoidal) flexure, 5 Hz, halfsinewave pulses
32

YEAR INVESTIGATOR(S) TEST METHODS EVALUATION
AND CONDITIONS METHOD
1972 Moore and Kennedy Diametral Controlled stress3rd IntlConf on Str
Des of AsphPavements
Same Pell and Brown Uniaxial tension-compression Controlled strainfatigue
Same Bennot Cantilever flexure Controlled stress andcontrolled strain
Same Kirk Third-point flexure Controlled strain
1972 Witczak Kingham's results of strain vs Allowable tensile3rd Intl fatigue life relationships for strain criteriaConf on Str full-depth asphalt concreteDes of Asph pavements of the AASHOPavements Road Test
Same Kingham and Kallas Center-point flexure Controlled stress andcontrolled strain
Same Van Dijk and Moreaud, Cantilever and center-point Controlled stress andQuedeville and Uge flexure controlled strain
Same Verstraeten Cantilever (trapezoidal) Controlled stressflexure
1972 Raithby and Sterling Cyclic axial tensile tests Controlled stress
RRL LR496 (prismatic samples)
1972 Monismith and Salam Third-point flexure Controlled stressAAPT
33

YEAR INVESTIGATOR(S) TE_T METHODS EVALUATION
AND CONDITIONS METHOD
1971 Salana Third-point flexure Controlled stress and
Ph.D., UC fracture mechanicsBerkeley
1971 Majidzadeh, Kauffman, and Center-point flexure Fracture mechanicsAAPT Ramsamooj
1971 Freeme Cantilever (trapezoidal) Controlled stress and
Ph.D., Univ flexure controlled strainof Natal
1969 Pell and Taylor Rotating cantilever flexure Controlled stressAAPT
1969 Epps Third-point flexure Controlled stress andPh.D., UC controlled strain
Berkeley
1969 Epps and Monismith Same Controlled stressAAPT
Same Santucci and Schmidt Third-point flexure Controlled strain
1968 Kennedy and Hudson Diametral Controlled stressHRR 235
1967 Bazin and Saunier Cantilever (rectangular and Controlled stress
2nd Intl trapezoidal) flexureConf on Str
Des of AsphPavements
Same Kirk Third-point flexure Controlled strain
Same Pell Rotating cantilever flexure Controlled stress
Same Vallcrga, Finn, and Hicks Third-point flexure Controlled stress
34

YEAR INVESTIGATOR(S) TEST ME-"I'HODS EVALUATION
AND CONDITIONS METHOD
Same Kallas and Riley Third-point flexure Controlled stress
1967 Deacon and Monismith Third-point flexure Controlled stressHRR 158
1965 Deacon Third-point flexure Controlled stress and
D. Engg., controlled strainUC
Berkeley
1964 Monismith Third-point flexure Controlled stress andTE-64-2, controlled strainITTE, UCBerkeley
1963 Monismith Third-point flexure Controlled strainTE-63-2,ITTE, UC
Berkeley
1962 Pell Flexure and torsion Controlled stress andlntl Conf on controlled strainStr Des of
AsphPavements
Same Jimenez and Gallaway Supported beams (oil Intermediate mode ofchamber) loading
1961 Monismith, Secor, and Supported beams (springs) Intermediate mode ofAAPT Blackmer loading
1959 Papazian and Baker Supported center-point flexure Intermediate mode ofAAPT loading
1958 Monismith Supported center-point flexure Intermediate mode ofAAPT (rubber) loading
35

YEAR INVESTIGATOR(S) TEST METHODS EVALUATION
AND CONDITIONS METHOD
1955 HveemHRBBulletin 114
1953 Nijboer and van der Poel Road vibration equipmentAAPT (recognition in Europe of
pavement distress from
repeated bending)
1948 Hveem and Carmany Recognition in U.S. ofHRB pavement distress from
repeated bending
36

3.0 FATIGUE TEST METHODS
In this section selected methodologies for measuring the fatigue behavior of asphalt
concrete are discussed. Included are brief descriptions of the test methodologies together
with a listing of the advantages and disadvantages of each. The general categories include:
1. Simple flexure with a direct relationship between fatigue life and stress/strain
developed by subjecting beams to pulsating or sinusoidal loads in either a third-
or center-point configuration; rotating cantilever beams; and trapezoidal
cantilever beams subjected to sinusoidal loading.
2. Supported flexure with a direct relationship between fatigue life and
stress/strain developed by loading beams or slabs that are supported in various
ways to directly simulate in-situ modes of loading and sometimes to simulate
a more representative stress state.
3. Direct axial with a direct relationship between fatigue life and stress/strain
developed by applying pulsating or sinusoidal loads, uniaxially, with or without
stress reversal.
4. Diametral with a direct relationship between fatigue life and stress/strain
developed by applying pulsating loads to cylindrical specimens in the diametral
direction.
5. Triaxial with a direct relationship between fatigue life and stress/strain
developed by testing similar to direct axial testing but with confinement.
6. Fracture tests and the use of fracture mechanics principles to predict fatigue
life.
37

7. Wheel-tracking tests, including both laboratory and full-scale arrangements,
with a direct relationship between the amount of cracking, the number of load
applications, and the measured and/or computed stress/strain. For full-scale
tests, both linear and circular track configurations have been used.
3.1 Simple Flexure
The majority of fatigue test data have been developed by simple flexure tests in which
the stress or strain "wasrepeatedly applied until the specimen failed or exhibited changes in
characteristics which rendered the mixture unsuitable.
Results of these tests have been expressed in the form of the following equations
(e.g., Pell, 1967; Monismith et al., 1966, 1981; and Pell et al., 1975).
iV/=a (1)b (3.1)e t
or
Iv:=c(!)d (3.2)flt
where e t and e t are, the magnitudes of tensile strain and stress repeatedly applied; a, b, c,
and d are material coefficients associated with the laboratory test methodology; and Nf is
the number of load applications to failure.
A number of' different types of flexural equipment have been developed to study the
fatigue characteristics of asphalt-concrete mixtures including (but not limited to):
38

1. Flexure tests in which the loads are applied repeatedly or sinusoidally under
center-point or third-point loading,
2. Rotating cantilever beams subjected to sinusoidal loads, and
3. Trapezoidal cantilever beams subjected to sinusoidal loads or deformations.
3.1.1 Center-P0int and Third-Point Loading
A simply supported asphalt-concrete beam specimen is subjected to a controlled load
or deflection under either third-point (Figure 3.1) or center-point (Figure 3.2) loading.
Examples of the equipment include that used by the University of California at
Berkeley and The Asphalt Institute (Figure 3.1). For the University of California
equipment, the specimens are 1.5 in. x 1.5 in. x 15 in. The Asphalt Institute uses larger
specimens, 3 in. x 3 in. x 15 in. Loads are applied at two locations as shown in Figure 3.1
to insure a uniform bending moment through the mid span of the beam. With this
equipment, pulsating loads, having a time of loading of 0.1 sec and a frequency of loading
of 100 repetitions per minute, are applied. Typical load and deflection traces are shown in
Figure 3.3. Both controlled-load (stress) and controlled-deflection (strain) tests have been
performed.
The Shell Laboratory at Amsterdam has used the center-point loading equipment .'
shown in Figure 3.2. Specimen dimensions are 30 mm (1.2 in.) x 40 mm (1.6 in.) x 230 mm
(9.2 in.), and specimens are tested in the controlled-deflection (strain) mode.
3.1.2 Cantilever Loading
Rotating Loads. At the University of Nottingham, U. K. (Pell et al., 1975 and 1973),
a rotating cantilever machine (Figure 3.4a) was used in which the specimen is mounted
39

vertically on a rotating cantilever shaft, a load is applied at the top, and the bending stress
of constant amplitude induced through the specimen. The majority of the tests were
conducted at a temperature of 10°C and a speed of 1,000 rpm. Dynamic stiffness was
measured using another machine (Figure 3.4b) by applying constant sinusoidal amplitude
deformations. Pell also used a controlled-strain torsional fatigue machine as shown in
Figure 3.5 for some fatigue tests on bituminous materials.
Trapezoidal Beams Loaded Sinusoidally. Tests on trapezoidal specimens have been
conducted by the Shell researchers (van Dijk, 1975), Belgium researchers (Verstraeten, 1972,
and Verstraeten et al., 1961), and by the LCPC (Bonnot, 1986). Figure 3.6 illustrates the
LCPC equipment.
The larger dimension of the trapezoidal specimen is fixed and the smaller end is
subjected to either a sinusoidally applied strain (Bonnot, 1986; van Dijk, 1975; and
Verstraeten, 1972) or stress (Kunst, 1989). By properly selecting the dimensions of the
trapezoid, the spec.imens will fail at about mid height where the bending stress is largest
rather than at the base where boundary conditions might adversely affect interpretation of
test results. Specimens tested by van Dijk, for example, had a base cross section of 55 mm
by 20 mm, a top cross section of 20 mm by 20 mm, and a height of 250 mm.
3.1.3 Evaluation
Advantages. The following are considered to be the primary advantages of simple
flexure tests:
1. This test method is well known, widespread in use, and readily understood.
2. The basic technique measures a fundamental properly that can be used for
40

/. ":i _m o,k _ _ "3
:.._ _ : -i, "04: __:. :,.
I
_ -%0
0
Key:
I. Reaction clamp .5. Bose plate 9. Double-acting. Bellofrom cylinder
2. Load clamp 6. Loading rod 10, Rubber washer
3, Restrainer 7'. Stop nut I I. Load bar
4. Specimen 8. Piston rod I 2. Thomson boll bushing
Figure 3.1 - Third-Point Flexure Apparatus (Monismith, et al., 1971)
41

9
11
8 _7
1. Specimen in steel clamps (see inset)
2. Thermostat
3. Fixed clamps
4. Vibrator sp/nd/e
5. E/ectrodynamic vibrator
6. Current meter and control for a.c.
7. E/ectrodynamic transducer
8. Phase angle meter 9. Voltmeter 10. Soft spring carrying 11
1I. Counter weight for 4, 5, 7 and middle clamp
Figure 3.2 - Center-Point Flexure Apparatus (van Dijk, 1972)
42

Time intervol between successive
/ood opp/icot/'ons
_Lood
--,,. _ durotiontr_Up stroka
[ I
(a) Idealized Load-Time Curve
Time
(b) Idealized Deflection-Time Curve
Figure 3.3 - Load vs. Time and Deflection vs. Time Relationships for Controlled-Stress Test
Equipment (Monismith et al., 1971)
43

pu#eys I
beot'ing
load,,ng
head
(a) Controlled-Stress Rotating Flexure (not to scale)
I[--."-v--_ ;_-: II _ I I
(b) Stiffness Machine
Figure 3.4 - Flexure Apparatus Used by Pell (1965)
44

! I
0 0 00 0
Figure 3.5 - Controlled-Strain Torsional Fatigue Machine (Pell, 1965)
45

C__=:_ _ __ _o__"_
Figure 3.6 - Bending Fatigue Test Machine (Bonnot, 1986)
46

both mixture evaluation and design.
3. The results can be used directly (with an appropriate shift factor) in the
structural design of pavements to estimate the propensity for cracking.
4. Results of controlled-stress testing can be used for the design of thick asphalt
pavements whereas results of controlled-strain testing can be used for the
design of thin asphalt pavements.
5. In third-point loading, failure of the specimen is initiated in the a region of
relatively uniform stress. This feature helps reduce the coefficient of variation
in the test results, requiring fewer samples.
Limitations. The major limitations of this methodology are:
1. Validation of laboratory results by comparison with in-situ pavement
performance is difficult due to the requirement for a shift factor as noted
above.
2. The method is costly, time consuming, and requires specialized equipment.
3. In center-point loading, initiation of failure in a relatively uniform tensile stress
region is not possible.
4. Unlike that within the pavement structure, the state of stress is essentially
uniaxial.
5. Elastic theory is usually assumed to compute the tensile strain or stress.
3.2 Supported Flexure
To more nearly duplicate in-situ stress and mode-of-loading conditions, several
researchers have used circular slab specimens supported either on a rubber mat (Majidzadeh
47

et al., 1971) or a cushion of air (Jimenez et al., 1962). A circular shaped repeated load is
applied to the center of the slab resulting in a stress state in the slab which is very similar
to that occurring in the pavement structure.
Additionally, beam fatigue tests were used by Barksdale (1977) to evaluate the fatigue
characteristics of asphalt-concrete bases. In his methodology, asphalt-concrete beams were
placed on a rubber mat to simulate the field support conditions (Figure 3.7). The fatigue
test equipment consisted of a loading frame, a 4 in. (102 mm) thick rubber mat (with a
modulus of subgrade reaction of 284 pci or 7,861 gm/cc) supporting the beam, and a
pneumatic loading system. The fatigue specimen and rubber support were enclosed in a
temperature control chamber maintained at 80*F + 1 °F (27°C). The beam specimens
were not subjected to stress reversals during testing. The load pulse had a duration of 0.06
second with an approximately haversine shape: one frequency, 45 cpm, was utilized.
Advantages. Advantages of this methodology include:
1. Better simulation of field conditions is possible.
2. The test offers a convenient means for examining modes of loading between
the extremes of controlled stress and controlled strain.
3. At higher temperatures, the problem of sagging due to specimen weight is
overcome.
4. Support of the specimen is expected to reduce the effects of minor
imperfections in the specimens and, hence, reduce the scatter of test results.
Disadvantages. Disadvantages of the methodology include:
1. For beam specimens, the state of stress is predominantly uniaxial, and,
48

depending on how the specimen is "clamped" in the test apparatus, it may not
be subjected to stress reversals (Barksdale, 1977).
2. The test is more time consuming than many other fatigue tests.
3. Compared to simple flexure, test equipment is more costly and more complex.
3.3 Direct Axial
3.3.1 Tension
The Transport and Road Research Laboratory (TRRL) of the United Kingdom has
performed uniaxial tensile tests without stress reversal using a loading frequency of 25 Hz;
a duration of 40 milliseconds; and rest periods varying from 0 to 1 sec. According to
Raithby (1972), starting from very short rest periods, fatigue life increases rapidly with an
increase in rest period before reaching a limiting value at about 0.4 second, beyond which
increasing the duration of the rest period had very little further effect. These tests were
conducted in the controlled-stress mode.
More recently, uniaxial tensile tests have been performed in the Netherlands (Kunst,
1989) at frequencies of 1 and 0.1 Hz using haversine loading in the controlled-strain mode.
Unfortunately, details of the Dutch tests are unavailable at this time.
Advantages. Advantages of direct axial tests include:
1. Specimens may be circular as well as rectangular in cross section.
2. In principle, results of axial tensile tests can be used both to evaluate mixtures
and to design the pavement for fatigue adequacy when proper shift factors
representing the field conditions are available.
3. When compared to flexural tests, these are simpler and less costly. Testing
49

LOAD
LOAD CELL
CELL LEADS
CUT-OFF LVDT LEADSM ICROSWITCH
LVDT
STRAIN GAUGELEADS
ASPHALT BLOCK WITHDUMMY STRAIN GAUGEFOR TEMPERATURECOMPENSATION
SR-4 TYPEC.;TRAIN GAUGE
/_/ RIGIDSTEE",'LATE--RUBBERPAD CONTROLLEDTEMPERATUREC,-,AM"E,__/_PHALT BEAM
SPECIMEN
Figure 3.7 - Fatigue Test Apparatus (Barksdale, 1977)
5O

time is shorter because fewer loading cycles can be sustained before failure.
4. Tensile stress and strain can be easily determined and in the case of strain,
measured directly.
Disadvantages. The primary disadvantage is that:
1. The loading condition does not necessarily represent the field conditions.
3.3.2 Tension/Compression
In this form of fatigue testing, developed at the TRRL (Raithby, 1972), axial tensile
and compressive loading was applied using in a servo-controlled electro-hydraulic machine.
Specimens were prismoidal, with 75 mm square cross sections and 225 mm lengths (Figure
3.8). Loading frequencies were 16.7 and 25 Hz, and the effects of rest periods, shape of
wave form, and the sequence of load application (compression/tension,
tension/compression, compression only, and tension only) were evaluated.
Raithby concluded that:
1. Short rest periods, such as occur in practice between successive axle load
applications, have an important effect on the fatigue life.
2. Compared with continuous cyclic loading at 25 Hz, the life to failure with one-
second rest periods was up to 25 times longer, the increase in life depending
largely on the test temperature. Above 25 °C, there appears to be a decrease
in the impact of short rest periods on fatigue life.
3. The effect of load form (for example, sinusoidal, trapezoidal, and triangular)
is not very great. Thus, for practical laboratory tests of asphalt concrete, a
sinusoidal load pulse would appear to be a reasonable representation.
51

4. Of the four loading sequences, pure compressive cyclic loading gives the largest
fatigue life followed by tensile/compressive cyclic loading, tensile cyclic loading,
and compressive/tensile cyclic loading. Between tensile/compressive cyclic
loading and compressive/tensile cyclic loading, the difference in fatigue life
attributable to the reversal of loading order is about 30 percent (Figure 3.9).
Advantages. Advantages include the following:
1. It is possible to simulate the loading pulse observed in the field
(compression/tension/compression).
2. The results can be used to evaluate mixture effects and, with field correlation
factors, to design pavements to control fatigue cracking.
Disadvantages. Disadvantages include the following:
1. The test does not well represent field conditions except the form of the loading
pulse.
2. When compared to direct tensile tests, reversed-stress tests require more time,
are more costly, and require more specialized equipment.
52

Temperature chamber
C.R.O.
LVDT IIIII
umming ICommand junction u._ Jsignal Load cell
Hydraulicactuator
Servo -valve
Hydraulicpowersupply
Figure 3.8 - Schematic Representation of Direct Axial Fatigue Test
(Raithby and Sterling, 1972)
53

WAVEFORM GEOMETRIC MEAN FATIGUE
LIFE CYCLES
TI ,-,/,_'N I /Stress
C 0 '_" " _"SI rainF
F I
i_'N /--\
--. _ 8,748
Peak stress 0.76/MN/m 2 in each case. Temperature 25* C.
Figure 3.9 - Effect of Strain Reversal on Fatigue Life (Raithby and Sterling, 1972)
54

3.4 Diametral Test "
The diametral fatigue test is an indirect tensile test conducted by repetitively loading
a cylindrical specimen with a compressive load which acts parallel to and along the vertical
diametral plane. This loading configuration develops a reasonably uniform tensile stress in
the specimen perpendicular to the direction of the applied load and along the vertical
diametral plane.
The test is simple to conduct and is considered by some to be an effective method
for characterizing materials in terms of "fundamental" properties. A number of investigators
have utilized this test for materials evaluations and pavement analyses (Kennedy et al., 1983
and 1968; Scholz, Hicks et al., 1989; Khosla and Omer, 1985; Schmidt, 1971; etc.).
Equipment and Pr0ccdur¢_. The loading configuration, illustrated in Figure 3.10, is
relatively simple, and loads can be applied with various devices including electro-hydraulic
and pneumatic systems. Usually a haversine load pulse is employed. Kennedy and Anagnos
(1983) used a loading time of 0.4 second and a rest interval of 0.6 second (60 repetitions per
minute). Khosla and Omer (1985) used a loading time of 0.05 second and a frequency of
20 repetitions per minute.
Test specimens are usually 4 in. in diameter and 2.5 in. high. Load is transmitted to
the sides of the right circular cylinder through a 0.5 in. wide loading strip (Figure 3.10).
Computed Stresses. According to Kennedy and Hudson (1968), under a line load of
sufficient magnitude, the diametral specimen would fail near the load line due to
compression. The compressive stresses are greatly reduced by distributing the load through
a loading strip, however, and a sufficiently large load will actually induce a tensile failure
55

along the vertical diameter.
Stresses at the center of the specimen under a strip load (Figures 3.10 and 3.11) are
as follows:
(2 _aP) a (3.3)o, = [(_ .--- h) ] • [sin 2a (_)1
(-6 • P))I " [sin 2.a - ---q--a•l (3.4)o, = a (2R)
where P is the applied load, a is the width of loading strip, h is the height of specimen, R
is the radius of specimen, 20, is the angle at the origin subtended by the width of loading
strip, e t is the indirect tensile stress (horizontal) at the center of the specimen, and ac is the
indirect compressive stress (vertical) at the center of the specimen. At the center of the
specimen, the vertical compressive stress is three times the horizontal tensile stress.
In addition to the biaxial state of stress, two more differences exist between the
flexural beam and diametral tests. These are: (1) permanent deformation which is usually
prohibited in flexural tests but permitted in diametral tests and (2) stress reversal which is
impractical in diametral tests. The likely effect of these differences is a smaller fatigue life
under diametral te,iting than under flexural testing.
Advantages. The diametral test offers a number of advantages:
1. The test is simple in nature.
56

2. Design of mixtures and pavements for fatigue adequacy is possible in principle
using the fatigue response measured by the test together with field correlation.
3. The equipment is applicable for other tests, for example, resilient modulus and
tensile strength.
4. Failure is initiated in a region of relatively uniform tensile stress. It should be
noted, however, that, according to Porter and Kennedy (1975), the governing
variable is (a t - ac); the uniform region for this variable is much smaller than
the uniform region for a t .
5. A biaxial state of stress exists, possibly of a type better representing field
conditions.
6. Tests can be performed not only on laboratory specimens but on field cores as
well.
Disadvantage_. Included among its disadvantages are:
1. Although a biaxial stress state exists at the center of the specimen, it is
impossible to vary the ratio of the vertical and horizontal components and,
hence, to replicate the stress state at critical locations within an in-situ
pavement.
2. This method significantly underestimates fatigue life if the principal tensile
stress is used as the damage determinant. Even when the stress difference, at -
ac, is used to predict fatigue life, the method still underestimates life relative
to other laboratory methods.
57

Figure 3.10 - I_x)adingConfiguration and Failure in Diametral Test (Kennedy, 1977)
58

Y
- 1.0 -
i
-.8 -
-,6 - fStress,
_ -.4 -b
u -.2 - / Vertical Stress_
0 .... X
',7,
I,- .4 -
.6 -
1.0 -
I I | I I l I / I I
1,0 .8 .6 ,4 2 0 ".2 -.4 -6 -.8 -_.0
Tltnilon _ Compreillon
Figure 3.11 - Relative Stress Distributions and Element Showing Biaxial State of
Stress for the Diametral Test (Kennedy, 1977)
59

3. There is possible concern about the absence of stress reversal and the
accumulation of permanent deformation.
3.5 Triaxial
An example of this form of fatigue testing equipment was developed at the University
of Nottingham (Pell and Brown, 1972, and Pell and Cooper, 1975) and is illustrated in
Figure 3.12. For this particular equipment, specimens are cylirtdrical in shape with a
diameter of 4 in. and a height of 8 in. Specimens are subjected to a sinusoidally varying
axial stress. This equipment has also been used for tension-compression testing with and
without confining stress. To accommodate tension, end caps are bonded to the specimen
providing an effective length for the measurement of vertical deformation of 6 in.
Another form of triaxial equipment in which the axial and radial stresses were
independently applied could be used for triaxial repeated tensile tests. McLean (1974)
developed such equipment (Figure 3.13) at the University of California, Berkeley to study
the rutting behavior of asphalt mixtures under combinations of normal tensile and
compressive stresses.
Also at the University of California, Sousa (1987) developed equipment which is
capable of applying shear strains by torsion (repeated or constant) together with radial
tensile stress using specimens fabricated as hollow cylinders. To date, only shear fatigue
(torsional) tests have been conducted. This equipment can be further developed to apply
repeated radial tensile stresses through the pulsating fluid within the hollow cylinder, thus
simulating the necessary conditions including shear stresses (through torsion) and vertical
stresses.
60

Advantages. Among the advantages of triaxial testing are the following:
1. It is possible to simulate the field loading condition in which compression is
followed by tension.
2. The results can be used for mixture design and, with field correlation factors,
for structural design.
3. The test better represents the state of stress in situ than most other laboratory
tests.
Disadvantages. Disadvantages include the following:
1. Shear strains must be controlled; otherwise, the predicted fatigue lives could
be considerably different than the field results.
2. These tests are costly, require specialized equipment, and are time consuming.
3.6 Fracture Mechanics
Another approach for characterizing the fatigue response of asphalt concrete makes
use of the principles of fracture mechanics (Majidzadeh et al., 1971; Salam, 1971; and
Monismith et al., 1973). In this method, fatigue is considered to develop in three phases:
(1) crack initiation, (2) stable crack growth, and (3) unstable crack propagation. It is
assumed that the second phase consumes most of the fatigue life and, consequently, it is for
this phase that quantitative models based on fracture mechanics have been proposed.
One of the basic relations used for this phase is
da- A(r_)_ (3.5)dN
61

where a is the crack length, K 1 is the stress intensity factor in mode 16 (stress x lengthl/2),
N is the number of load applications, and A and n are experimental coefficients.
This relation assumes that stable crack growth takes place between some initial crack
length, ao, and a critical length, ac, which terminates the fatigue life and is determined by
Klc, the critical value of K 1.
Equipment. Various equipment has been used to de.fine response by this
methodology. As an example, simple-flexure equipment like that shown in Figures 3.1 and
3.2 has been used 1:oassess the efficacy of this approach.
Test Methodology. The methodology using the above equipment has included both
fracture and fatigue; tests. For example, the fracture tests reported by Monismith and Salam
(1973) and Salam and Monismith (1971) were of two types:
1. Single-edge-notched flexure tests (1.5 x 2.0 x 15 inches)
2. Single-edge-notched tension tests (1.5 x 1.5 x 4.5 inches)
Notch-to-beam-depth ratios ranged from 0 to 0.4 in both types of fracture tests. In principle,
the methodology to predict the fatigue response uses the incremental technique shown in
Figure 3.15.
According to Majidzadeh (1971), the size of the plastic zone around a crack tip is
critical in the analysis of fatigue life during the crack propagation phase. If the plastic zone
is small compared to the crack size, linear elastic fracture mechanics (LEFM) can be used
to approximate conditions of failure: if the size of the plastic zone is several orders of
6Three crack tip displacement modes which are considered include the opening mode(I), the shear mode (II), and the tear mode (III) (Figure 3.14).
62

HydrauficLocal ram
ram t control
Couphng unit
Oil flow
return
Servo cutout
Servo vatve input
L_ _}_yio_utLoadcel I
Perspex cell _Jppk /Output
Water trap
Cei I
Figure 3.12 - Triaxial Load Fatigue Rig (Pell and Cooper, 1975)
63

Air pressure toI opp/y radio/ stress
Air- oil l _
pressure converter "_ --_ "_-----_ _- I-- Sample copwith Bertram diaphragm III /baited to ceil cap
I
/ _ Cellcap
LSample cop
-- Steelceil
4in. diametersample
-= Siliconefluid
4indiameter
Belofromsea/.
\_ Samplebose
.___ -_----Combined cell
Air pressure to base and loadingapply axial stress , cylinder
Double actingpiston wDn8e/ofrom seals
Figure 3.13 - Triaxial Apparatus Permitting Independent Control of
Axial and Radial Loads (McLean, 1974)
64

magnitude larger than the crack size, a nonlinear fracture mechanics approach is more
appropriate. In the first case, when brittle fatigue is assumed, the critical stress intensity
factor, Klc, defines the fracture characteristics of the material. In the second case, where
the nonelastic zone is large, either the J-integral or the C° line integral may be requested
to define crack propagation.
For the second case, one form that the crack propagation model (notched sample)
can take is as follows:
dc = A [._3__.] (3.6)dN (2U,)
where J is the path-independent mode contour J-integral, c is the crack length, Ue is the
total strain energy, A is a material constant, and N is the number of cycles at crack
length "c".
The steps are:
1. To establish experimentally a J-c curve, where Ue can also be found.
2. To establish a c-N relationship by performing fatigue tests on notched
specimens.
3. To differentiate this relationship in order to obtain the (dc/dN) vs. N
relationship.
4. For a given N, to obtain c and dc/dN.
5. For a given c, to obtain J = 2 Ue c.
6. To establish the relationship dc/dN, the slope of this relationship should be
A/2U e.
65

Experimental data necessary to calibrate this crack-growth model is considerable.
Advantages. Advantages include:
1. In principle the need for conducting fatigue testing is eliminated.
2. Strong theory explains crack propagation under low temperatures, for example,
below 40*F.
Disadvantages. Among the disadvantages are:
1. At high temperatures, due to the size of the plastic zone, the values determined
for Klc are affected by the plane-stress condition and Klc is not a material
constant.
2. The stable crack propagation stage may not explain a suitable range of the
entire fatigue spectrum. The exact contributions of crack initiation and
unstable crack propagation stages are not known.
3. Quantification of this method requires a considerable amount of currently
unavailable experimental data including:
a. Fracture toughness (Klc values).
b. Initial sizes of pavement cracks.
c. A calibration function which relates the stress intensity factor, K1, to
the applied loads. This function depends upon geometrical aspects of
the pavement layer and the loading parameter.
d. Bending moments or applied loads are needed to de/ermine the stress
intensity factor for any given crack size. The effects of variations of
loading patterns and the sequence of these variations on fatigue life
66

/ /z -/
-" [I
, f"
1Mode I Mode II Mode III
Figure 3.14 - Crack Tip Displacement Modes
67

r
ANALYSES ! -- o.< ,< fI"XPERIMENTS o < < n
_ i,.<r
i,r 1
CALIBRATIOH t /_ KI dii dN
FUNCTION, f(a/h) -- _-" _i
J I
Figure 3.15 - Diagram for Fatigue Life Computations
from Fracture Properties (Salam, 1971)
68

are yet to be established.
e. A fatigue crack growth law must be established for each material, thus
requiring experimental data to define the constants of the theoretical
model under consideration.
f. To represent field conditions accurately, a study of fracture in the
shear mode also needs to be conducted and an analytical procedure to
use these results in conjunction with those of opening mode needs to
be developed (Figure 3.15).
3.7 Wheel-Track T¢_ting
3.7.1 Laboratory Test_
In order to better simulate the effects of a rolling wheel on the pavement and to
better understand the pattern of crack initiation and propagation, a wheel tracking machine
has been developed to study fatigue characteristics of asphalt slabs (van Dijk, 1975) (Figure
3.16). In this device; a loaded wheel with a pneumatic tire is rolled back and forth over a
slab of asphalt concrete. The wheel has a diameter of 0.25 m and its path is 0.60 m long
with a width in the range of 0.05 to 0.07 m. The slab is supported by a rubber mat. The
tire contact area can be varied by changing either the inflation pressure or the load.
Suitable equipment ensures the measurement of the main characteristic, strains at the
bottom of slabs, and the detection of crack initiation and propagation.
Results can be expressed in terms of three fatigue stages associated with the
development of hairline cracks (N1), real cracks (N2), and failure of the slab (N3).
69

Fatigue data. obtained from a wheel tracking test7 have been presented by van Dijk
(1975). His results suggest that controlled-strain data may be more appropriate to define
pavement cracking than controlled-stress data since the former include the influence of
crack propagation on the number of load repetitions associated with unserviceability.
According to van Dijk, laboratory controlled-stress tests appear to provide conservative
results. He also noted that the difference between the development of hairline cracks, N1,
and the development of real cracks, N2, is related fairly well to the difference between
fatigue results measured under controlled-stress and controlled-strain conditions.
Wheel tracking devices like that at Nottingham University could also be used.
Advantages. Advantages include:
1. Better simulation of field conditions.
2. Both crack initiation and growth can be monitored.
Disadvantages. Among the disadvantages are:
1. The main limitation of the test is the speed of the rolling wheel.
2. For mixes of low stiffness, rutting becomes significant and may affect fatigue
measurements.
3. The test is time consuming, and special equipment is needed.
4. The test does not measure a fundamental mixture property.
3.7.2 Full-Scale Tests
In order to obtain full-scale field simulation, circular and longitudinal test tracks have
7The asphalt-concrete layer was 40 mm in thickness. The contact area of the tire loadwas approximately 25 cm2.
70

ROLLING WHEEL
.... .. ,.,i . i.'. ."- ;- "_ _." Mix
II
STRAIN GAUGES STEEL PLATE
Figure 3.16 - Schematic Representation of Wheel Tracking Machine (van Dijk, 1975)
71

been designed and constructed in a number of different countries. Well-known examples
include the circular tracks located at Nantes, France, and at Pullman, near the Washington
State University campus, and the Federal Highway Administration's ALF (Accelerated
Loading Facility). The tracks are often divided into sections, each with a different pavement
structure, and loads are applied by several sets of dual truck tires.
In the circular track, an eccentric mechanism ensures a lateral movement of the dual
tires in order to load the pavement surface in a manner more like real conditions. Other
examples of full-scale tracks include those in Australia (ARRB), United Kingdom (TRRL),
New Zealand (Canterbury), and Denmark, with the details as shown in Figures 3.17 through
3.22. The publication edited by Sparks (1980) provides a summary of a number of these
facilities.
Advantages. Advantages of full-scale testing include the following:
1. Excellent simulation of field conditions (actual pavement structure, full-scale
traffic loading incorporating lateral wander, use of different speeds, etc.).
2. Possibility of examining the effect of changes in the pavement structural section
on pavement performance.
3. One test track allows study of other forms of pavement distress in addition to
fatigue (for example, permanent deformation etc.).
Disadvantages. Disadvantages include the following:
1. The initial investment cost and annual operation and maintenance costs are
very high.
2. A parallel, supplementary laboratory testing program is still needed, since the
72
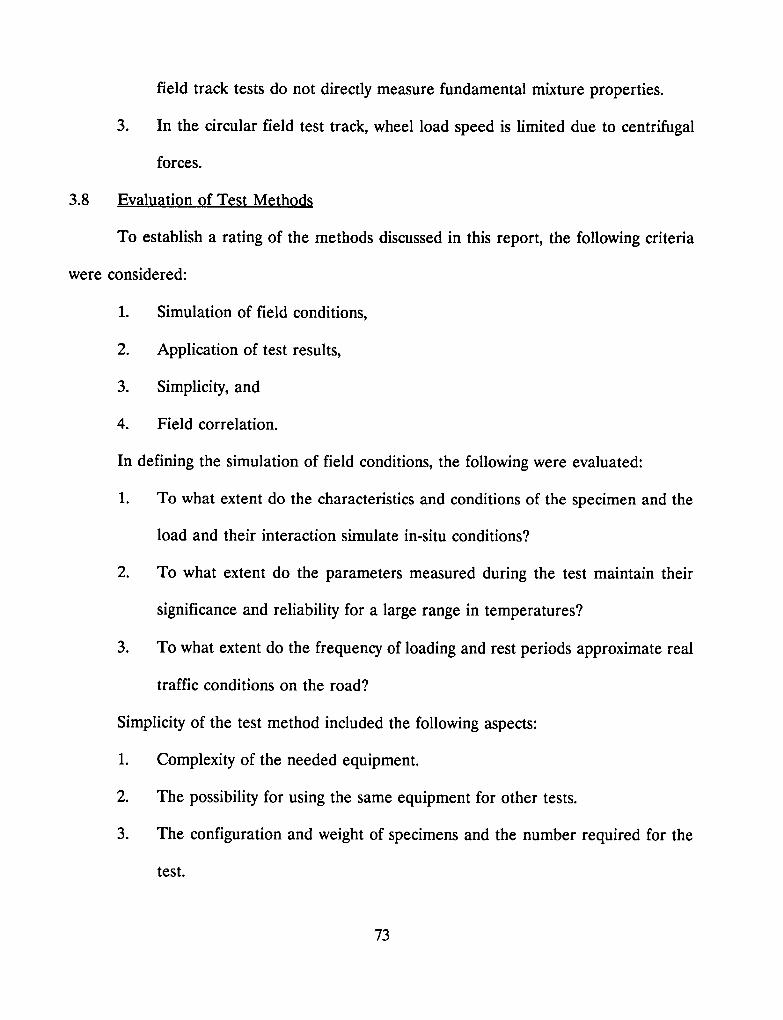
field track tests do not directly measure fundamental mixture properties.
3. In the circular field test track, wheel load speed is limited due to centrifugal
forces.
3.8 Evaluation of Test Mcth0d8
To establish a rating of the methods discussed in this report, the following criteria
were considered:
1. Simulation of field conditions,
2. Application of test results,
3. Simplicity, and
4. Field correlation.
In defining the simulation of field conditions, the following were evaluated:
1. To what extent do the characteristics and conditions of the specimen and the
load and their interaction simulate in-situ conditions?
2. To what extent do the parameters measured during the test maintain their
significance and reliability for a large range in temperatures?
3. To what extent do the frequency of loading and rest periods approximate real
traffic conditions on the road?
Simplicity of the test method included the following aspects:
1. Complexity of the needed equipment.
2. The possibility for using the same equipment for other tests.
3. The configuration and weight of specimens and the number required for the
test.
73

(a) Lateral wheel distribution showing coverages (b) Arrangement of Ring No. 2within traveled wheel path showing twelve pavement
sections
Figure 3.17 - Details of Circular Test Track (Terrel and Kumar, 1970)
74

• ' k,
Figure 3.18 - Canterbury Test Track Showing Arrangement of Sections (Paterson, 1972)
75

hydraulic molor
wire rope /
[ __-s 1 slrain?auge$_j [ I _ ) ----
• II 3,,,y/ '
7.3 _I,_ _ m pavemenl
SIDE VIEW OF PAVEMENT TESTING FACILITY
Figure 3.19 - Linear Test Track - Nottingham University (Brown et al., 1977)
76

Transition
o
uot _,!suoJJ.
PLAN
!= 3m _ i
38ramhot-rol led aspha It wearl ng course(B.s.sg4)-Iow stone content63.Smmhot-roJled asphalt basecourse ( I_ s.5g4)
FrT/'n _, -Five different materials-see plan
-Gravel -sand -clay
1.2m-Silty clay Subgrade
Concrete pit
' 150ram Clean gravel• _ _(_.. _._
CROSS-SECTION
Figure 3.20 - TRRL Road Machine (Grainger, 1964)
77

78

,'nt,',,,bl_ fournanl brat rand. bras carte., chariol_ barriOre do s4curit6
, _ _ _I]_r._o.,,_..---,_.,,_:<.,., ,..........7-_'% '-'-.... '" -
L- rernorque de / inlermediair_ principolmolorilollon e-.a nncau e.
b_lon
Figure 3.22 - Circular Track Facility for Fatigue Testing (LCPC)
79

4. The number of parameters to be measured for further application in mixture
and structural design.
5. If the needed parameters could be measured by the same equipment or by
different equipment.
Application of test results refers to the possibility of using the test results to design
a mixture or a pavement structure with fatigue as the major concern.
The summary table (Table 3.1) lists the advantages, disadvantages, and limitations
of each method considered in this report. These methods are evaluated based on simplicity,
ability to simulate the field conditions, and applicability of the test results to design the
pavement for fatigue adequacy. Necessary data on field correlations are not available;
hence, it was not possible to take this factor into consideration in the evaluation.
No attempt has been made to apply a weighting to the individual criteria listed
above. Rather, they were collectively considered and evaluated against the overall
objectives of the task to develop a test method to define fatigue response. Simply stated,
these objectives are to develop a test which properly reflects the influence on the asphalt
binder on the fatigue performance of in-service pavements and which can be used ih an
asphalt aggregate mixture analysis system (AAMAS). The final ratings shown in Table 3.1
represent the combined judgment of the authors of the report.
In arriving at the final rankings, it should be noted that some consideration was given
to the following as well. It is possible in the ranking process that a method which had not
been placed near the top of the ranking might utilize equipment and methodology
associated with a test method already highly ranked. For example, the dissipated energy
80

method includes similar methodology to that used to define fatigue response in flexural
fatigue which was considered to have good potential. Thus once the flexural fatigue test had
been ranked, it would seem reasonable to consider the dissipated energy as a candidate
procedure at a level near the flexural fatigue test methodology. Similarly, while the flexural
fatigue tests provide a better simulation of field conditions than the direct tension test, this
test is simpler, less costly, and requires less time than a flexure test. It is possible, as the
LCPC has demonstrated, to use the direct tension test results to predict fatigue response.
Hence, the two tests might be ranked together as shown in Table 3.1.
81

Table 3.1 - Comparison of Test Methods
Method Applicationo( Advanta_z Disadvantages ,_mulatioa ,_mplkiWTest Results and d lr_cld P.mfldng
I Jmltatiol_ ColldliilioQII
Repeated Yes 1.Well known, Costly, time 4 4 Iflexure test widespread, consuming,
ab or eb,Smix 2. Basic technique specializedcan be used for equipment needed.different concepts.3. Results can beused directly indesign.4. Options ofcontrolled stress orstrain.
Direct tension Yes (through 1. Need for In the LCPC 9 1 Itest correlation) conducting fatigue methodology:
e b or eb, Smix tests is eliminated, a. The correlations2. Correlations exist based on one million
with fatigue test repetitionsresults, b. Temperature only
at 10*C.c. Use of EQI(thickness ofbituminous layer) forone millionrepetitions only.
Diametral Yes 1.Simple in nature. 1. Biaxial stress state. 6 2 IIrepeated load 4ab and Smix 2. Same equipment 2. Underestimatestest can be used for other fatigue life.
tests.
3. Tool to predictcracking.
Dissipated O, *, Sraixand 1. Based on a 1.Accurate 5 5 IIIenergy method ob or _t, physical prediction requires
phenomenon, extensive fatigue test2. Unique relation data.between dissipated 2. Simplifiedenergy and N. procedures provides
only a generalindication of the
magnitude of thefatigue life.
82

Method Applicationof Advantages Disadvantages S_ation S_p_ty Ovc_Test _lt_ and o_ Field lhnlrin .u
llmilaliOIS Conditions
Fracture Yes 1. Strong theory for 1. At high temp., Kt 7 8 IVmechanics tests Kn, Sm_ curve low temperature, is not a material
(a/h - N); 2. In principle the constant.calibration need for conducting 2. Large amount of
function (also fatigue tests experimental dataKn) eliminated, needed.
3. Ku (shear mode)data needed. Link
between K! and KIt
to predict fatigue lifeto be established.
4. Only stable crack
propagation state isaccounted for.
Repeated Yes 1. Need for flexural 1. Comparedto 8 3tension or ob or e b, Smix fatigue tests direct tension test,tension and eliminated, this is time
compression consuming, costly,
test and specialequipment required.
Triaxial Yes 1. Relatively better 1. Costly, time 2 6
repeated O'd,a c, Smix simulation of field consuming, andtension and conditions, special equipmentcompression needed.
test 2. Imposition ofshear strains
required.
Repeated Yes 1. Relatively better 1. Costly, time 3 7
flexure test on ob or e b, Smix simulation of field consuming, and
elastic conditions, special equipmentfoundation 2. Tests can be required.
conducted at higher
temperatures sincespecimens are fullysupported.
Wheel track Yes 1. Good simulation 1. For low Smix 1 9
test o b or Eb of field conditions, fatigue is affected by(laboratory) rutting due to lack of
lateral wanderingeffects.
2. Special equipmentrequired.
Wheel track Yes 1. Direct 1. Expensive, time 1 10
test (field) a b or _b determination of consuming.fatigue response 2. Relatively fewunder actual wheel materials can be
loads, evaluated at onetime.
3. Special equipmentrequired.
83

NOTES:
ob = breaking stress (in fatigue or direct tension)
oa = deviator st:tess
Triaxial testsoc = confining stress
eb = breaking strain (in fatigue or direct tension)
S,._,= mix stiffness
= phase angle
= energy factor
84

4.0 FAILURE CONCEPTS
Fatigue cracking is considered to be a tensile phenomenon. It is the repetitive
application of tensile forces, at levels considerably below that required to induce immediate
fracture, that is responsible for the initiation and propagation of fatigue cracks. Early
fatigue research found that fatigue life was often better correlated with tensile strains than
with tensile stresses, and that the basic failure relationship could be characterized as follows:
N! = a(1) b (4.1)e t
where Nf is the fatigue life, et is the applied tensile strain, and a and b are constants,
determined from laboratory testing.
So that Equation 4.1 might be used in the analysis and design of pavement structures,
Et, the damage determinant, was assumed to be the maximum principal tensile strain, a
quantity identical to the maximum applied strain in uniaxial laboratory tests and determined
from the complex, multidimensional stress state imposed by traffic on pavements in service.
In an attempt to account for differences sometimes observed in the fatigue life-strain
relationship as loading frequency and temperature vary, a mixture stiffness term can be
added to Equation 4.1 as follows:
Nf = a(l) b (Smt_)c (4.2)e t
where Smix is the stiffness modulus of the asphalt mixture and c is a third calibration
constant.
85

Equation 4.2 is applicable for a specific value of the repetitively applied strain level,
Et. For pavements in service, strains induced in the structure vary widely as a result of
variations in the types of axles, their loaded weights, tire pressures, lateral placement, etc.
Accordingly, some means for accumulating the damaging effects of mixed loading is
required. The most common means is the linear summation of cycle ratios, described as
follows:
n 1 II2 nit n m+ + ... + + ... + (4.3)
82:
where i is the ith level of applied strain at a critical point within the pavement structure, ni
is the actual number of applications of strain i that is anticipated, and Nif is the number of
applications of strain i expected to cause fatigue failure if applied in a non-mixed loading
environment. Failure in the pavement under mixed loading is expected when the linear
summation of cycle ratios reaches one.
The primary purpose of this section is to review research developments directed
toward better understanding the cause or determinant of fatigue distress and the
accumulation of damage under mixed loading.
4.1 Unique Strain
Based on results of controlled-stress testing, Saal and Pell (1960) postulated a single,
unique relationship between strain and fatigue life independent of test temperature and
loading frequency (Figure 4.1). Tests to establish this relationship were conducted at low
temperatures within a relatively small range, that is, from -13.5 °C to 7 °C. Pell later showed
86

that unique strain relationships applied for different mixes over a temperature range 0*C
to + 20" C. There was some evidence that longer lives were obtained at higher temperatures
of + 30°C where some crack propagation occurred and non-linear stiffness behavior became
apparent (Figure 4.2).
According to Witczak (1976), all researchers reporting the existence of a unique
strain criterion applied continuous, sinusoidal loading. On the other hand, those who used
pulse loading with rest periods obtained a different fatigue life-strain relationship for each
combination of temperature and loading frequency. When loading conditions were such that
mixture response in the fatigue test was nonlinear, the fatigue relationships were not parallel
if the strains had been either measured directly with gauges or calculated using a stiffness
from deflection measurements. On the other hand, parallel curves were observed if strains
had been calculated using stiffnesses which ignored the actual nonlinearity, such as those
determined from the Shell nomographs or those measured under low stress levels typical of
dynamic-modulus testing.
4.2 Deviator Stress
Fatigue lives measured by diametral tests are smaller than those obtained by other
methods. Porter and Kennedy (1975) have suggested that these differences can be
attributed in part to the fact that specimens in the diametral test are subjected to a biaxial
stress state. Fatigue curves obtained by the diametral test more closely approximate those
obtained by other tests if the applied tensile stress, at, is replaced by a stress difference, a t -
crc (Figure 4.3). Accordingly, a combined stress theory should be used for a better
prediction of fatigue response. Kennedy et al. used a combined stress theory based on
87

/lO• lO_ lOe iOr lOa
CyclestoFailure(n)
Figure 4.1 - Results of Fatigue Tests at Various Temperatures
and Speeds (Saal and Pell, 1960)
88

Cyctcs to failure -Ns
TI_ Series G I Test 5,ri_s
T¢_. ="_" _ .... /rain
[Symbot [Symbot
Figure 4.2 - Strain-Life Fatigue Results for
a Range of Mixes (Pell and Taylor, 1969)
89

IO S1rels 011feren¢/o_N/cm2
ioe ,,I i I i , i , , i I i , 1 .L_..J__L LJ }
_'2 | I_ I_11_ _ N/_ z ) ' (14_*"I _
,o,. ,,. o)OMe,,,s,'-,_h et o0'_ \O _.....--- P_ e_ ae
.,,3._, e\. 8 • "_. k-,,6o -x;,i 55,10" _ ' \ _.;'3.8 ,Io _
,o6- s,....._'_1. \'_ "e..,,b. _-% _'%
• e".oo_,_ ,,."_ :'koO o k ..'_'""'-, N \n _ \ 0_-_II '_ "_ • %t _ ''ll'_"!
_" \ [] _ % -\l , \_- _\.,.---Mo..sm,tn .i el
I_ el oo
K__ OP'n.oloi,ngco_h.._.. \ 0 _ _] -_ i = _)OeF% ,_, e
Mo_,_.m,lh,i el I '%.<_ ....,. \ tO
tO _._Kennedy ef OI
_,,.c, _..,,,o- \ _': l 03 • iO'iJO " tROS4don $1t155 I T : 7_)e F
%-3 eeKI,4 76 • tOeT: 7_oF
I0
_l_ll s O,ffemJ'_ce ,DS,
Figure 4.3 - Typical Stress Difference-Fatigue Life Relationships for
Various Test Methods (Porter and Kennedy, 1975)
9O

Mohr's circle, an application of the maximum shear stress theory. The combined stresses
are given in terms of a deviator stress or stress difference (which is the maximum principal
stress minus the minimum principal stress). For the biaxial state of stress in diametral
testing (tension on one axis and compression on the other), the stress difference is
approximately four times the tensile stress.
It should be noted that other criteria are available to analyze the response of
materials to complex states of stress including, for example, octahedral shear stress. The
octahedral-shear-stress theory yields a smaller difference of stresses (approximately 3.6 times
the tensile stress) than the deviator-stress theory.
Nevertheless, the value of this approach is the fact that it suggests an alternative
damage determinant for biaxial states of stress.
4.3. Work Strain
To define the fatigue response of asphalt mixtures under multiaxial stress states, the
concept of work strain has been introduced by Deen and his co-workers (Deen, et al., 1980).
Use is made of strain energy density at a point and which is defined as follows for an elastic
material:
. 2 2 2. . 2 2 2, (4.4)6W = l/2_.e 2 + G (ex+ey+e z) + l/2G _,y_+yyz+y_z)
where:
6W = strain energy density or work per unit volume
e = Ex + £y "t- £z
ex, etc. = normal strains
91

y,,y,etc. = shear stress
= E.(1 + tt) (1- 2/_)
E,G = elastic and shear moduli, respectively
tt = Poisson's ratio
For a specific pavement structure, this parameter can be calculated at any point
within the system using parameters obtained from computations, assuming the pavement
responds to load elastically (e.g., from the ELSYM computer program).
The work strain, ew, is in turn defined as:
w=[ 2bW (4.5)eE
Deen et al. (1980), have shown that the work strain and tangential strain due to load on the
underside of an asphalt-bound layer are of the same order of magnitude.
This parameter can be related to load repetitions in the same manner as tensile
strain, e.g., as represented by equation (4.1).
4.4 Constancy of Dissipated Energy
An alternative to the accumulation of damage utilizing the linear summation of cycle
ratios concept is that considering the constancy of dissipated energy.
In this method the number of cycles to failure is related to the amount of energy
dissipated during repetitive loading. Available data (Figures 4.4 and 4.5) suggest that
loading mode, temperature, and frequency of loading do not have a significant influence on
the total energy dissipated prior to failure. Accordingly, it is argued that this approach
92

permits prediction of the fatigue response of a mixture over a wide range of conditions
based on a very few simple fatigue tests.
The initial dissipated energy per unit volume per cycle of bending (when loading is
sinusoidal), wL, is given by:
wv = _ • oo • e0 • sin _o (4.6)
where ao is the initial stress amplitude, e o is the initial strain amplitude, and _'ois the initial
phase angle between stress and strain.
During fatigue tests, the phase angle keeps changing and, therefore, the fatigue life
must be divided into fixed intervals, during each of which the phase angle is relatively
constant. For such conditions the dissipated energy for the interval under consideration
is wi and the total dissipated energy is given by
n
l,Vf,n. = __, w," (4.7)if1
The unique relationship between the number of load applications to failure and the
corresponding total dissipated energy per unit volume is given by:
Wtoua= A • N z (4.8)
where A and Z are constants representing mixture characteristics.
It should be noted that for an elastic material the dissipated energy is the same as
the strain energy due to distortion, 6W D. This parameter is determined by subtracting the
93

energy which causes change in volume from the total strain energy or from the strain energy
density, 6W, as represented by equation (4.4). For example, in terms of stress, this can be
determined from the following expression:
1+1_
(4.9)1 2 2 2
2G 0:xy + _z + _yz)
This equation reduces to the following for simple tension (in the x direction as an
example) in terms of stress:
6W ° _ 1 + IX o2 (4.10)3E
or in terms of stress and strain to:
6W ° _ 1 + tt o_ "e. (4.11)3
Equipment and Test Procedures. Tests used to explore the dissipated energy concept
have been flexural in nature. Center-point and third-point flexural tests could be used, with
either controlled-stress or controlled-strain loading modes. For cantilever bending tests,
trapezoidal specimens were used by van Dijk (test temperature up to 50°C) while
rectangular specimens were used in center-point flexure tests (test temperature up to 20 *C).
For these studies sinusoidal loads were applied at frequencies ranging from 0.1 to 100 Hz
and with a maximum ratio of loading period to rest period of 1:100.
Fatigue Life Prediction Using Ener_ Considcrations. The step-wise procedure to
predict fatigue life is as follows:
1. Conduct the flexural fatigue test and obtain the phase angle, 4,, and mixture
94

stiffness, SO.
2. Calculate the energy ratio, n, from the expression:
t_ - wi [_ " °° "e° "sin Cj- (4.12)(W_/_) AN(Z-l)
Then
1 2
N = [(n .S° " sin _,,)](z-l) . e_Z-1) (4.13)(A • t_)
and
(,4 • D) ]ltz . NE(Z-l)12] (4.14)ep = [ (_ .So sin ¢ o)
where % is the permissible strain and SOis the initial stiffness modulus, (a o / %).
Then,
n
W_,_ = _ w," (4.15)i=1
The relationship between fl and mixture stiffness is shown in Figure 4.4.
The total fatigue behavior--expressed by the relation for the permissible strain, ep,
as a function of stiffness modulus--can be fully predicted if the functions _ = f(Smix) and
f2 -- f(Smix) and the parameters A and Z are known.
95

In many cases, however, these data are not available. For these circumstances the
following is suggested:
1. Use the data for another mix which resembles the nfix in question, or
2. Carry out a set of fatigue tests when increased accuracy is required, or
3. Use the following simplified method (Figure 4.5):
a. Obtain # for the given initial Smix from the nomograph.
b. Obtain f_for the given initial Smix from the nomograph.
c. Taking mean values of fl = 1.22, Z = 0.66, and A = 4 x 10⁴ J/m 3,
the relationship between permissible strain and fatigue life can be
obtained for a given set of initial stiffness and initial phase angle
values, as shown below:
NO._ 1.55x10⁴ (4.16)el, . SO .sin _ o • =
This relationship is intended to give a general idea of the fatigue life
and cannot be used for accurate predictions. It should be noted that
the above equation is based on a sinusoidal loading pattern. This
equation would change for other patterns of loading.
Though only flexural fatigue tests have been used with energy considerations to date,
these principles can be applied to other types of fatigue tests, such as supported flexure, as
well. Further work is needed to establish and apply this methodology to pavement design.
Advantages. The following are considered to be advantages of this approach:
1. According to van Dijk (1975), the major advantage of this method is that
96

"W'INITIAL
V'= W_A.rmuE4
• 40/50 pen.BITUMEN5
V 80/100 ,, ,,
A 180/200 ,, ,,m
CONTROLLED STRAIN
• O-o" 8
V_1--
O.S
0.6 •_o •
• • CONTROLLED STRESS0.4
n n [ I I I I [ I I I I
6 8 109 2 4 6 8 101° Z 4 6 8 10It
MIX STIFFNESS MODULUS Smix, N/m 2
Figure 4.4 - Relation of Energy Ratio and Mix Stiffness
for an Asphaltic Concrete (van Dijk, 1975)
97

I_,de9
8C--
4O
20
108 109 1010
Sm_l, N/m2
(a)
1CONTROLLED STRAIN1.6
12 mlrL m_
1.0108 tO9 I010
Stall , Nlm2
(b)
WFAT, Jim 3
j
/ /7 _,h"
, , , I .... i , ,
103 104 105 106
NFAT
(c)
Figure 4.5 - Phase ,Angle, Energy Ratio, and Dissipated Energy Charts Showing the Limits
for the Base Course and Wearing Course and Wearing Course Mixes Tested (van Dijk et
al., 1977)
98

loading mode, temperature, frequency of loading, and occurrence of rest
period do not have a significant influence on the total dissipated energy. The
number of cycles to failure is mainly related to the amount of energy
dissipated during the test. If validated, this could lead to a dramatic reduction
in laboratory testing, and avoidance of the mode-of-loading issue in laboratory
work would be a great advantage.
2. This method is based on a physical phenomenon which explains the fatigue
behavior of viscoelastic materials through the accumulation of the distortion
energy resulting from load repetitions.
3. For both stress- and strain-controlled flexural tests, there exists a unique
relation between the total dissipated energy per unit volume and the number
of load applications to fatigue failure.
4. Prediction of fatigue life is possible as a first approximation if initial stiffness
and phase angle are known.
5. Structural design of an asphalt-concrete layer to consider fatigue effects is
possible as a first approximation.
Disadvantages. The disadvantages include:
1. Accurate prediction of fatigue behavior is not possible without conducting
detailed fatigue tests.
2. The simplified procedure proposed in this method cannot be considered as a
design technique; rather, it serves to indicate the general magnitude of the
fatigue life of a given asphalt mixture.
99

4.5. Work Strain and Dissipated Energy
Since work strain is a function of the strain energy density, there may be merit in
merging the concepts of work strain and dissipated energy into an integrated fatigue
concept.
As noted earlier, in a uniaxial test, the elastic distortion energy under a static load
is given by
5WB = (1/3) "(1 + I_) "o • ¢ (4.17)
where U is Poisson's ratio, a is stress, and e is strain.
The approximate dissipated distortion energy in a viscoelastic material under uniaxial
flexure is given by (Kunst, 1989):
8w_ = 2 • _ • sin • - 8w_
or
8Wz) = (3) • (1 + I_) " n • o .e • sin (I) (4.18)
where _ is the phase angle. 6WB can be computed with the help of multilayer programs
and ¢ can be derived from cyclic flexural tests.
As noted earlier, work strain is an alternative to tensile strain as the determinant of
fatigue response. _["nework-strain parameter has been used in pavement design and is
100

defined as follows (Deen et al., 1980):
ew = [2 8 WB]o.5 (4.19)s.,.
In a uniaxial test with a static load, work strain can be expressed as:
e w = e[(2) • (1 + Ix)]o.s (4.20)
and
e w = 0.95(e) for IX = 0.35 (4.21)
From the above relationships and Equation 4.6, the total dissipated distortion energy can
be expressed as:
N
Wt,,ua= __, 6W ° = (2) -(1 + Ix) " A " N z (4.22)i-I
In the dissipated energy method, using the work-strain concept, the predicted
pavement life is given by
[(3 •s.= .= -sin ,x,• e_)]cz_, (4.23)N(2-(1 + Ix).A-Q)
101

The major difference between this relationship and that given by Equation 4.8 is the
substitution of work strain, _w, for tensile strain, Eo. Based on analyses of various stress
and strain conditions in asphalt-bound layers subjected to traffic loads (Kunst, 1989;
Gerritsen, 1987), there is only a small difference between the work strain and the horizontal
tensile strain on the underside of the bound layer while there is a substantial difference
between these parameters at the pavement surface.
This difference can be explained by the fact that in a linear elastic multilayer system,
the distortion energy at the pavement surface due to a static load is almost the same as that
at the bottom of the asphalt layer as shown in Figure 4.6 (Gerritsen, et al., 1987).
According to this figure, it is apparent that distortion energy is large at both surfaces of the
asphalt layer, though crack growth occurs only under tensile octahedral normal stresses
(Majidzadeh, et al., 1971; and Paris, et al., 1963).
Determining whether work strain or tensile strain is the appropriate fatigue
determinant is not possible at this time. Nevertheless, the possibility of merging strain and
dissipated energy into an integrated measure of fatigue response is worth additional
investigation.
102

DISTORTION ENERGY (Jim 3)
0 50 100 150
o, I I
1;0
_kk._ _jj_25kN
IEt --"--4000 MPI
hl _)1= .35
I
J Eo= 100 MPa
____0 _o = .352,1.0
DEPTH (mm)
Figure 4.6 - Distortion Energy (Garretsen et al., 1987)
103

5.0 CORRELATIONS AND SIMPLIFICATIONS
Considerable effort and cost are required to measure the fatigue response of asphalt
mixtures using conventional laboratory procedures and to use the information so obtained
to design fatigue-resistant mixtures. Considered herein are alternative procedures having
potential for simplifying both testing and analysis procedures.
5.1 Direct Tension Test
The methodology by which direct tension test results have been correlated with
fatigue response was developed by the LCPC (Bonnot, 1986). Figure 5.1 illustrates test
equipment used to measure the necessary tensile properties. Specimens for the uniaxial
tension testing in tlhe LCPC procedure are cylindrical with a diameter of 80 mm and a
height of 200 mm. A range of asphalt-concrete mixtures has been tested using both the
direct tension test and a flexural fatigue test. The best regression on the admissible strain
at one million load cycles, e6, was found with the linearity loss, (1 - r), and modulus, S, as
follows:
e6T = 10-4[a0 + a1(1-1:) + a2 • 10-l° -S] (5.1)
where e6T is an estimate of the admissible tensile strain under flexural fatigue at one
million load repetitions (temperature of 10°C, frequency of 25 Hz); r is a nonlinearity
factor (the ratio of stiffness at a strain of 5 x 10⁻⁴ in./in, to stiffness extrapolated to a strain
of 0); (1 - r) is the linearity loss; and S is the modulus (stiffness) at a strain of 10-4 in.fin.
Both linearity loss and stiffness are measured at a 300-second loading time and 0 °C.
Each specimen in the direct tension tests is tested at four temperatures (from -10°C
104

to 20*C) and a range of loading rates. In order not to induce premature damage, loads are
first applied in minor strain fields, to define the time- and temperature-dependent moduli,
and then in a major strain field to the point of rupture, to deduce the nonlinearity factor.
The French method of mixture evaluation incorporates the following steps:
1. Conduct the direct tension tests, actually a sequence of 26 consecutive tests for
each specimen.
2. Calculate the linearity loss and the stiffness from results of the direct tension
testing.
3. Estimate the admissible strain at one million repetitions, e6T, from the
correlation equation (Equation 5.1).
4. Determine the IQE (Elastic Quality Indicator, the thickness of bituminous
concrete that gives a theoretical life of one million load repetitions of a 130-kN
axle when the subgrade modulus is 100 MPa), using an elastic, two-layer
computer program and assuming an effective temperature of 10°C and a 0.02-
second loading time. The IQE value decreases as the quality of the bituminous
mixture increases.
5. Although a temperature of 10°C has been found to be acceptable for
conditions normally encountered in France, the quality indicator concept can
be extended by defining a second IQE using annual temperature spectra and
adopting the hypothesis of invariability of the product e6 • (S)I/2.
It should be noted that direct tensile tests have been conducted by other investigators
as well (Epps, 1969, and Rao, 1989) using the apparatus shown in Figure 5.1 at a constant
105

|
_- Loading frame
Loadin 9 rod
Universal joint
_ Aluminum end cap
Epoxy
.._---Aluminum end cop
Load cell
Loading frame C_ l.t--- Universal jointandelectro - hydraulic
closed loop i I i _'_---
resting system "--7 Loading rod
Figure 5.1 - Direct Tension Testing Apparatus (Epps, 1969)
106

strain rate. These investigators have also attempted to relate test results (stress and/or
strain at break) to fatigue response.
Advantages. The following appear to be advantages of this approach:
1. In principle, the need for fatigue testing is eliminated, assuming that calibration
constants of Equation 5.1 are invariant for mixtures and asphalts of interest.
2. Based on the French experience, high correlation exists between direct axial
tensile strain and the fatigue tensile strain at one million load cycles.
3. In the direct tension test, failure of the specimen is initiated in a zone of
uniform stress (or strain).
Disadvantages include:
1. The correlation which allows use of the result of tensile tests for predicting
fatigue life is based on the admissible strain for one million load cycles only.
Forecasting the slope of fatigue life curves with acceptable accuracy proved
much more difficult.
2. The method assumes that the equivalent temperature of all bituminous
concretes is close to 10 °C. Therefore, the applicability of this method for
other temperature regimes must be established.
Discussion. Although the LCPC method seems to have been successfully used to
compare different bituminous mixtures, it has not been sufficiently developed to permit its
use as a versatile tool for predicting fatigue life or for designing pavements for fatigue
adequacy. However, the consistently high correlation between fatigue life and parameters
measured in the direct tension test is very important because of its potential for creating a
107

useful tool in predicting fatigue life through a relatively simple test.
In order to transform this principle into a practical method, a parallel laboratory
study will be undertaken to seek consistent correlations between results of flexural fatigue
and direct tension tests. The study will consider a range of parameters including those used
in the LCPC method. More work is needed to show that the effect of binder modifiers on
fatigue life is reflected in their effects on tensile properties.
5.2 Failure Envelope
The basic principle of this method is to draw an envelope through failure points of
stress-strain curves defined by diametral tests (Little and Richey, 1983). The design asphalt
content can be selected from a window of this envelope such that rutting and fatigue
distresses are at minimal levels. Monismith (1965) has shown that the ultimate tensile
properties of asphalt concrete superimpose to form a failure envelope in three dimensions
(compressive stress, tensile stress, and temperature) resulting in a solid enclosing the safe
or working stress region. Little and Richey (1983) developed a procedure to select an
asphalt content to mitigate fatigue distress.
For a range of asphalt contents bracketing the expected design value, a set of
boundary curves representing pavement distress could be superimposed on the plot to
determine the areas of satisfactory performance (Figure 5.2).
1. An initial estimate of the optimum asphalt content is made choosing the
asphalt content having the maximum toughness. To determine this estimate,
diametral tests are performed on specimens varying in approximately one-
percent increments of asphalt content. A range of five to six percent is usually
108

sufficient to bracket the optimum asphalt content. The diametral test is
performed at 77 °F with a loading rate of 2.0 in. per minute. The average
toughness (work to cause failure per unit volume) is plotted against the asphalt
content. The peak in the toughness curve indicates the range of one to two
percent in asphalt content that will be subjected to further analysis and testing.
2. The range of asphalt contents defined by the peak of the toughness curve in
Step I is subjected to an analysis for thermal cracking, permanent deformation,
and fatigue.
3. Boundary curves are selected for thermal cracking and permanent deformation.
The thermal-cracking boundary curve may be selected for the appropriate
binder and rate of cooling. The rate of cooling is determined from local
climatological data. The permanent-deformation boundary curve is selected for
the desired binder, climatic region, and traffic level. The traffic level on the
permanent-deformation design charts indicates the number of equivalent wheel
loads:
--2 x c x w,,,, (5.2)
where C is the ratio of total number of wheels/wheel track to the total number
of axle loads/lane and Wto t is the total number of commercial vehicles.
Failure envelopes generated by the diametral data from Step 2 are
plotted on a design chart with the desired thermal-cracking and permanent-
deformation boundary curves. A failure envelope which falls completely
109

within the window formed by the two boundary curves represents a
satisfactory mix.
4. The fatigue design chart is selected for the desired binder, the expected
subgrade modulus and pavement thickness, and the number of load
applications. Charts have been developed for subgrade moduli of 3,000 and
18,000 psi and for pavement thicknesses of 3 and 6 in. The number of load
applications indicated on the design charts is actually the number of standard
18-kip equivalent axle loads expected during the life of the pavement.
The number of equivalent standard axle loads is commonly obtained
by multiplying the number of axles in each class of axle load by a damage
factor, Fj. The damage factor is calculated as:
Fj-- (5.3)e s
where ej represents the tensile strain induced in the bottom of the pavement
layers by axle j, and es is the strain induced by the standard 18-kip single axle.
The exponent, n, ranges from 3 to 6.
Advantages. Advantages of this procedure include the following:
1. Diametral tests are easy to perform and, therefore, test data required for the
application of this procedure are easily obtained.
2. The method provides an asphalt content which is a compromise between
stability, thermal cracking, and fatigue life.
110

\Thermol Crocking Boundary Curve
103 _-(5" F/hr Coolie 0 Rote)\\
\ _ Tl_ermol Boundary Curve
_. _ _ Permanent' Deformofion
m 10 2
.===- \
3/, 5% I I_" I X 7%
I0 I I I I
I0" 5 I0" 4 I0- 3 I0" 2 I0" I
Failure Strain, In/in
Figure 5.2 - Typical Window Formed by Boundary Curves (Little and Richey, 1983)
111

Disadvantage. The primary disadvantage is as follows:
1. This method cannot determine the asphalt content for optimum fatigue life.
This method only permits an estimation of the fatigue life for the preselected
asphalt content based on the failure envelope which falls completely within
the window formed by the two boundary curves (obtained for permanent
deformation and thermal cracking) representing a satisfactory mix.
Direct tensile strength, compressive strength, and temperature could be used, as
shown by Monismith (1965), to develop a three-dimensional failure envelope as an alternate
to the use of diametral test results.
5.3 Other Simplifications
To predict fatigue performance for pavement design purposes, a number of simplified
procedures have been adopted including those developed by the Nottingham researchers
(Brown et al., 1982), Shell (Shell, 1978), and the Asphalt Institute (The Asphalt Institute,
1981).
The Nottingham researchers have developed a general relationship between tensile
strain, the number of loadings to failure, asphalt content (volume basis), and the ring and
ball softening point of the asphalt in the mix as follows:
14.39 log Vn + 24.2 log 7Rs - 40.7 - log Nlog e, = (5.4)
5.13 log Vn + 8.63 log TRn - 15.8
where:
112

et = allowable tensile stain
N = number of load applications to failure
Va = volume of asphalt binder, percent
TRB = ring and ball softening point temperature, °C
The Shell approach is to estimate the fatigue strain, from the following expression:
e t ---(0.856 x g B + 1.08) S_.°_ x N -°'2 (5.5)
where:
i_t = allowable tensile strain
N = number of load applications to faillure
VB = volume of asphalt binder, percent
Smi x = mix stiffness for particular time of loading and temperature; can
be estimated with the volume concentrations of the aggregate
and asphalt and the stiffness of the asphalt (Sasp) contained in
the mix.
In the Asphalt Institute methodology use is made of the expression:
N-- 18.4C[4.325 x 10⁻³(et) -3"291(Sin/x)-0"a54] (5.6)
The parameters £t, N, and Smi x are the same as above. The term C is a correction obtained
from:
113

C-- 10 u (5.7)
where:
M = 4.84 [. VB 0.69]vv ¬�”�and
V,, -- volume of air voids
In all of these relationships the property of the asphalt is reflected in either the ring
and ball softening point temperature or the asphalt stiffness. It must be emphasized,
however, that these relationships are merely approximations. Thus these should only be
considered for pavement design purposes and not for mix evaluation.
114

6.0 RELATIONSHIP BETWEEN TEST RESULTS AND FIELD PERFORMANCE
A major difficulty with fatigue testing is developing a meaningful relationship
between the results of the laboratory tests and field performance. Generally, fatigue
response determined from laboratory controlled-stress tests underestimates field
performance since such tests include relatively few repetitions for crack propagation. In situ,
on the other hand, it is possible that, after initial cracking, the asphalt-bound layer will
sustain additional repetitions (associated with crack propagation) because of the support
provided by the underlying layers. Allowance should also be made for the transverse
distribution of wheel loads; this factor is estimated to increase service life by a factor of
about 2.5 (Shell, 1978).
A major concern is the use of the laboratory test data to analyze the response of the
mixture in the pavement section. By defining fundamental material properties such as those
described herein, it is possible using analytical procedures to estimate field performance of
mixtures (including the influence of the binder). An example of such a methodology is
included herein for illustrative purposes.
Fatigue cracking is usually related to the magnitude of tensile strain occurring on the
underside of the asphalt-bound layer. In some circumstances, however, fatigue cracking may
be initiated above the underside of the layer, even at the pavement surface. To estimate
the potential for such cracking is a challenge also facing the pavement engineer.
Accordingly, some discussion of this problem is also included.
115

6.1 Shift Factor
To account for differences between laboratory and field response, shift factors are
necessary to translate laboratory fatigue characteristics to those considered to be
representative of in-situ performance. Unfortunately, there is no unique relationship. Shift
factors proposed by various researchers have varied from slightly more than one to 400 +.
The amount of shift appears to be dependent on the test type, test conditions, and the field
conditions to which the laboratory test results are being compared. In addition, it may also
be dependent on the asphalt characteristics. For example, for tests in which specimens have
been flexed at high rates in sinusoidal loading, factors of the order of 100 have been used.
For tests in which there are rest periods between load applications, considerably lower
values, usually less than 20, are used.
The shift factor also varies depending on the test configuration and the mode of
loading. A specimen subjected to repeated flexure has a fatigue life at least 50 percent
greater than the same material tested in direct tension (Bonnot, 1972). For the same
mixture, the shift factor is less for controlled-strain loading than for the controlled-stress
condition.
Temperature of test also has an influence (Rao, 1989). It appears that, at higher
temperatures, the shift factor may be less for laboratory fatigue data than when tests are
conducted at lower temperatures (e.g., 40* vs 20°C). In addition, the shift factor is
dependent on the thickness of the asphalt-bound layer increasing as the thickness of this
layer increases (Shell, 1978).
Little and his coworkers (e.g., Kim et al., 1990) have suggested that chemical healing
116

which is dependent on the asphalt may also contribute to the shift factor. This was also
briefly discussed by Bazin and Saunier (1967).
Brown et al. have attempted to quantify the shift factor (440) which they have used
(Brown et al., 1985) in the following terms:
a. factor of 20 for rest periods;
b. factor of 20 for crack propagation; and
c. factor of 1.1 to account for lateral distribution effects of wheel loads.
Generally, more is known about the fatigue response of asphalt mixtures from
laboratory testing than from field observations. Moreover, as noted above, established
correlations between laboratory data and field response are weak. This is a major area for
concern when attempting to utilize the results of laboratory investigations to define
performance criteria.
6.2 Fundamental Mixture Properties in Pavement Analysis
The fundamental "parameter" determined by fatigue testing is typically the
relationship between fatigue life and some damage determinant, such as the maximum
principal tensile strain. The following steps describe one approach for incorporating such
information into a performance-based design (or analysis) procedure:
1. The engineer first identifies the location of pavement to be constructed and
estimates the mean monthly air temperatures (MMATs) expected for each
month during the design life. If this is not possible, one of the environmental
conditions analyzed by Rao (1989) can be selected to represent the pavement
location.
117

2. Type of Pavement
The type of asphalt pavement must be preselected, that is, full depth or with
untreated (or treated) aggregate base. For many situations, the type of
pavement is dictated by available resources (Croney, 1977). There are,
however, several advantages of full-depth asphalt-concrete pavement as
explained in the MS-1 Manual (Asphalt Institute, 1981).
3. Estimation of Traffic
The engineer is required to estimate the total traffic in terms of equivalent
single axle loads (ESALs) for the design period.
4. First Trial Thickness
Trial thickness of the asphalt layer can be selected, using, for example, charts
shown in the MS-1 Manual (Asphalt Institute, 1981) or some other suitable
design procedure.
5. Calculation of Mean Monthly Pavement Temperatures (MMPTs)
For the trial thickness selected in the above step and the MMATs obtained in
Step 1, MMPTs can be calculated using Witczak's formula as given below:
1 4) ] [ 34 4) ]- + 6 (6.1)
MMPT= MMAT" [1 + (Z + (Z +
where Z is h/3 and h is the thickness of the asphalt layer in inches. MMPT
and MMAT are in *F.
This formula gives the average pavement temperature at one-third depth within
118

the pavement. Usually maximum tensile strain occurs at the bottom of the
asphalt layer. Therefore, results obtained using this formula may slightly
overestimate the design thickness. Alternately, using Barber's equation
(Barber, 1967), MMPTs at the bottom of asphalt-concrete layer could be
calculated.
6. Fatigue Tests
Conduct fatigue tests at a minimum of two temperatures, representative of the
MMPTs calculated above.
7. Shift Factor
Obtain the stress vs. fatigue life (or strain vs. fatigue life) from the laboratory
fatigue test data. Apply a proper shift factor to reflect differences between
field and laboratory conditions.
8. Tensile Stress (or Strain) at the Bottom of Asphalt-Concrete Layer
Determine the tensile stress or strain at the bottom of the asphalt-concrete
layer from the laboratory fatigue life data for the design traffic.
9. Asphalt-Concrete Layer Thickness
Determine the asphalt-concrete thickness for the tensile stress using graphs
such as illustrated in Figures 6.1 and 6.2. A more complete set of graphs is
available in Rao (1989). Similar charts could easily be developed for a tensile-
strain criterion.
10. Cumulative Damage Hypothesis
The ratio of the actual number of cumulative standard axles expected in a
119

_o.oo' _ ,.........................
iliiiii_I I
I l "
40.00 , ....... I............ i...............III I/\\ , t.l:<;,:..
- ']tt\\\ ' z - 40,,.0,,0 ,,._t3o.oo II_\\k'\......i....._-_oo.ooo,,..,.....
,I\\\\\ , 4 - i,,o.,,.,,,.,;i,_ ' I \\\\\ ' 5 - 5o.o,,o ,':;l
_ 20.00 L _ .k,_A_\\',,.,__ _,....................... _ \ \'\\_., _ \ \\_,
10.00 _ _ __._-_':-_ i, ............i G 5 , 4 _ _ l! !
! I
! I
0.00 -, ..... ,,, { .... ..... -m--J-,', b--v--,--v-1--v--v---v-v--v--v-r--v--,--,--r--
-50.00 0.00 50.00 I O0.UO 150.0(1ENSILE SIRESS AI 1lIE I1OIIOM ()F AC IA'¢lll. I':;i
Figure 6.1 - Asphalt-Concrete Thickness vs. Tensile Stress
for a Typical Full-Depth Pavement
120

30.0O m I
II
Q).E
n{20.00 i j L J _ _ _hi I
' >" i LEGEND ,
£) I = 800,000 Psi< 2 = 400,000 Psi
t,. 3 = 200,000 PsL0 4 = I00,000 Psi
in 5 = 50,000 PsiIn 6 = 20,000 Psi,,I 10.00 --- J L J___Z tY.U I.T.I-
6 t,
I t I
{5 4t _ e Z j 1
o.oo .... 1-,,,, I,,, .... ,, I ......... I.,, ....... ,., ....... .,,,,-5o.0o 50.00 150.00 250.00 350.00 450.00
IEHSILE STRESS AT THE BOTTOM OF AC LAYER, Psi
Figure 6.2 - Asphalt-Concrete Thickness vs. Tensile Stress
for a Typical Pavement with Granular Base
121
J..

given month to the possible cumulative number of standard axles for a given
thickness of AC layer gives the fraction of design life consumed in each
particular month.
Calculate the sum of fractions of life for all twelve months and obtain the
design thickness such that sum of fractions of life consumed in the design
period is less than unity.
By the use of such a procedure, it is possible to consider how different mixtures will
respond to traffic loading in a specific environment. In effect, by defining the appropriate
mix characteristics, the suitability of specific mixes with different binders can be determined
in advance, thus providing the potential for improved pavement performance.
6.3 Further Challenges
It must be emphasized that to properly define the effects of mix variables on the
fatigue performance of asphalt-bound layers, the use of a fundamental generalized approach
such as that described in the previous section permits the engineer to treat a wide variety
of materials, strucrares, traffic, and climates. Such an approach permits consideration of
fatigue cracking which, as noted earlier, may start at the bottom of the asphalt-bound layer
and progress to the: pavement surface. In addition, the methodology has the potential to
consider the possibility of surface cracking as well.
This surface cracking may result from tensile strains induced at or near the pavement
surface as a result of one or more of the following:
1. Horizontal shear forces in the contact area between tire and pavement,
2. Thermally induced stresses,
122

3. Dynamic load induced residual stresses, and
4. Relatively stiff underlying layers and relatively thin surface layers.
The combination of tensile stresses at or near the surface and high dissipation distortion
energy may initiate cracks in the upper region of the pavement (Kunst, 1989). Specific
conditions required for the initiation of such cracking as identified by various researchers
are summarized below.
Shell. Based on a series of calculations, Shell researchers have determined that the
depth in the asphalt layer at which the maximum strain occurs depends on the parameter
(Shell, 1978):
c = h I (E2) (6.2)E1
where E 1 is the stiffness of the asphalt-bound layer (Smix) in N/m 2, E2 is the modulus of
the unbound layer in N/m 2, and h 1 is the thickness of the asphalt layer in mm.
When c is greater than 133 mm, the maximum asphalt strain is not at the underside
of the layer. If h 1 is less than about 200 mm, the maximum strain occurs in the lower half
of the asphalt layer; whereas if h 1 is larger than 200 mm, maximum strain occurs in the
upper half of the asphalt layer. These findings are valid for the loading configuration used
by Shell researchers to develop their design charts, for three-layer structures with unbound
bases, and for hot climates (characterized by a weighted mean annual air temperature of
28°C).
123

Wallace. As summarized by Mortisrnith (1981), Wallace has also performed an
extensive analytical investigation of the location of maximum tensile strain in asphalt
pavement layers. The following range in parameters was investigated:
E1/E 2 < 10; hl/a < 1.0; and z/a < 1.5
where a is the radius of loaded area, z is the depth below the surface of pavement, and the
remaining variable.,; are as described above.
Some of the conclusions from this analysis are as follows:
1. Where shallow tensile strain exceeds the magnitude of strain at the underside
of the pavement layer, the maximum value of tensile strain at the load axis
occurs at a depth of about 0.8 to 1.0 times the radius of the contact area (0.8a
to 1.0a).
2. Higher tensile strains occur at shallower depths away from the load axis. At
a depth of 0.2a, beneath the edge of the contact area, the maximum principal
tensile strain is about 50 percent greater than at z = a on the load axis. These
shallower regions of high strain are more localized: thus the tensile strain at
z = a is used for design purposes.
3. Where the shallower strain is critical, its magnitude is given by the following
expression:
(_ -p)e,_ - (6.3)
(2 "En)
where p is the contact pressure and _1 is Poisson's ratio of the asphalt layer.
124

Gerritsen. According to Gerritsen et al. (1987), initiation of surface cracking is
possible under the following conditions:
1. Base layer is an asphaltic layer.
2. Ebase equal to or greater than Esurfac e.
3. Horizontal shear forces in the contact area.
4. Thermally induced stresses.
5. Dynamic load induced residual stresses.
Kunst. According to Kunst (1989) for structures with a bound base whose stiffness
exceeds that of the asphalt-bound surface, computations show that for all combinations of
thickness and asphalt-mixture stiffness used, the maximum tensile strain on the bottom of
the layer is exceeded by the maximum tensile strain at the surface.
Work-Strain Concept. Kunst (1989) and Gerritsen et al. (1987) have suggested that
work strain might be an appropriate failure parameter to predict pavement life reductions
due to surface cracking. Cores from in-service pavements have confirmed the existence of
crack initiation and growth at the upper level of the surface course. The work strain
concept has been described earlier.
Determining whether work strain or tensile strain is the correct fatigue determinant
may not be possible at this stage. Near the surface, while the horizontal strain is
compressive at the center of vertical loads, the work strain (since it directly related to the
distortion energy, equation [4.5]) can be of substantial magnitude as shown in Figure 6.3
(Kunst, 1989).
While there has been some confirmation of the applicability of this concept to explain
125
i...

surface cracking (Gerritsen, et al., 1987), it would seem desirable to further study this area,
particularly in light of the changes in axle loads and tire pressures which are occurring on
heavily trafficked pavements.
In conclusion, it should be noted that this phenomenon is different from that
observed by Anderson (1987). He demonstrated that in thin surfaces of asphalt concrete,
the highest tensile strains occur at the surface. As the thickness of the surfacing is
increased, the largest values shift and occur on the underside of the layer.
6.4. Summary
Thus, while there are a number of challenges facing the pavement engineer relative
to the fatigue problem, it should be apparent that procedures for defining mixture properties
in fundamental terms for use in analysis procedures which reflect the "real" pavement
situation provide an important opportunity for the engineer to design (and construct)
improved pavements using this improved methodology. In particular, such methodologies
have the potential to permit the engineer to realistically assess, in advance, the influence of
binder properties on pavement performance, one of the major goals of this project.
126

. DISTORTIONENERGYU/m ]
STRAIN[l_*/nd
-150 -100 -5C, 0 50 100 150
.............................I20 _.--_ ...._=-o_I[
\
E_ m 4000 UPeh_ _ :z .3S
2_,o . \
08=1'1'1lmml•
Figure 6.3 - Distortion Energy (Related to Work Strain)
and Horizontal Strain Due to a Vertical Load (Kunst, 1989)
127

7.0 CONCLUSIONS AND RECOMMENDATIONS
Conclusions obtained from this evaluation are presented in three parts: (1) specimen
fabrication; (2) factors which influence the fatigue response of asphalt paving mixtures; and
(3) evaluation of test methods.
7.1 Specimen Fabrication
For the SHRP program, it is considered important to examine the influence of
method of compaction on the response characteristics of laboratory prepared specimens.
Accordingly, a fatigue testing program will be conducted on specimens prepared by the three
most promising compaction techniques; kneading, gyratory, and rolling wheel.
7.2 Factors Affecting Fatigue Response
1. The controlled-stress mode of loading appears to represent the response of
thick asphalt pavements to repetitive loading while the controlled-strain
approach is suitable for thin pavements. The controlled-strain mode of testing
results in a greater fatigue life for the same mixture than controlled-stress
testing.
2. Air void content is an important factor which affects fatigue life of an asphalt
mixture and which should be as small as possible (but not less than the
minimum limit of 3.0 percent) to obtain the greatest fatigue life.
3. Another variable that can be controlled by the engineer and which has a
significant effect on the fatigue life is asphalt content. The optimum asphalt
content to obtain a maximum fatigue life is generally higher than the design
required for rutting considerations. Therefore, the asphalt content should be
128

as high as possible with due consideration to stability.
4. Asphalts should be quite stiff for thick asphalt pavements but relatively more
flexible for thin ones. For asphalt pavements of intermediate thickness,
asphalts of about 100 penetration (25 °C, 100 gr, 5 sec) are recommended.
5. Mixes containing dense-graded aggregates are recommended for use in
pavements containing thick asphalt layers while a more-open graded aggregate
(less fines) is recommended for pavements containing thin asphalt layers.
6. Higher temperature lowers fatigue life in the case of thick asphalt pavements
but increases fatigue life for thin pavements.
7.3 Test Methods
The various methods considered herein have been evaluated using the criteria
described earlier. This evaluation is summarized in Table 3.1. It will be noted that the
repeated flexure test received the highest ranking. The direct tension test was also included
in this category because of the possibility of using it to define fatigue response, following the
LCPC approach. The diametral test received a relatively high ranking, in part because of
its simplicity and in spite of the complex stress state which may exist, particularly at higher
temperatures. Also included in the first four categories are considerations of dissipated
energy and fracture mechanics.
7.4 Recommendations
This evaluation of existing information on the fatigue response of asphalt concrete
has suggested a set of competing alternatives which must be developed to establish a
suitable methodology for defining the fatigue response of asphalt-aggregate mixtures. This
129

program will involve the use of the tests and methodologies evaluated in Table 3.1 and rated
I to IV. In addition, as noted earlier, a study will be undertaken to assess the influence of
compaction method on fatigue response. The hypotheses to be tested and the associated
program are included as Appendix A.
This evaluation of existing information has also suggested other areas which require
additional investigation, some of which are beyond the scope of the SHRP research
endeavor. However, it is important to at least briefly describe them herein.
1. It is extremely important that the results of fatigue tests performed on
laboratory specimens be related to the fatigue performance of the same
materials in pavements in service. One approach to this problem is the use of
correlation (shift) factors.
2. The phenomenon of surface cracking should be investigated. This form of
distress may be related to high shear stresses developed near the pavement
surface. Accordingly, it is desirable to investigate the response of asphalt
concrete subjected to repeated shear stresses. While such an investigation will
not be conducted as a part of this program, there are sufficient examples of
pavements in which this distress has manifested itself to warrant further
investigation. Repeated shear tests can also take more effective account of the
types of load to which thin surface courses and interlayers are subjected.
3. According to van Dijk, loading mode, temperature, loading frequency, and
occurrence of rest periods do not have a significant influence on the cumulative
amount of energy dissipated before fatigue failure. As of this date, energy
130

considerations have been applied only to flexural fatigue tests. Further study
is needed (1) to apply energy considerations to other types of fatigue tests, like
diametral, direct axial, and supported flexure; (2) to determine the exact effects
of temperature and rest periods on the relationship between dissipated energy
and fatigue load, and (3) to apply energy considerations to the structural design
of asphalt pavements.
131

8.0 REFERENCES
1. American Society of Testing Materials. (1982). Resistance to Plastic Flow ofBituminous Mixtures Using Marshall Apparatus, ASTM-D 1559-82. Philadelphia.
2. American Society for Testing Materials. (1983). Preparation of Bituminous MixtureBeam Specimens by Means of the California Kneading Compactor, ASTM-D3202-83.Philadelphia.
3. American Society for Testing Materials. (1984). Method of Indirect Tension forResilient Modulus of Bituminous Mixtures, ASTM-D4123-82 (1987). Philadelphia.
4. Anagnos, J. N. and Kennedy, T. W. (1972). Practical Methods of Conducting theIndirect Tensile Test, Research Report 98-10, Center for Highway Research, TheUniversity of Texas at Austin.
5. Anderson, O. (1987). Transition of Critical Fatigue Level from Road Surface to LowerInterface of Asphalt Layer. Department of Highway Engineering, Royal Institute ofTechnology, Bulletin 1987:02, Stockholm, Sweden.
6. ARE, Inc., Engineering Consultants. (1986). Development of Asphalt AggregateMixture Analysis System. Prepared for NCHRP.
7. The Asphalt Institute. (1981). Thickness Design Manual (MS-I), 9th Edition, CollegePark, Maryland.
8. Barber, E. S. (1967). "Calculation of Maximum Pavement Temperature from WeatherReports," Bulletin 168. Highway Research Board, Washington, D. C.
9. Barksdale, R.D. and Miller, J. H., III (1977). Development of Equipment andTechniques for Evaluating Fatigue and Rutting Characteristics of Asphalt ConcreteMixes. Report SCEGIT-77-147. School of Civil Engineering, Georgia Institute ofTechnology, Atlanta.
10. Bazin, P., and Saunier, J. (1967). "Deformability, Fatigue and Healing Propertiesof Asphalt Mixes." Proceedings, Second International Conference on the StructuralDesign of Asphalt Pavements, University of Michigan.
11. Bonnaure, F., Huibbers, A.H.J.J., and Booders, A. (1982) "A Laboratory Investigationof the Influence of Rest Periods on Fatigue Characteristics of Bituminous Mixes."Proceedings, The Association of Asphalt Paving Technologists, Vol. 51, 104.
12. Bonnot, J. (1986) "Asphalt Aggregate Mixtures." Transportation Research Record1096,Transportation Research Board, Washington, D. C., 42-50.
132

13. Bonnot, J. (1972). "Assessing the Properties of Materials for the Structural Designof Pavements." Proceedings, Third International Conference on the Structural Design ofAsphalt Pavements, London, 200-213.
14. Brown, S.F., Bell, C.A., and Brodrick, V.B. (1977). Permanent deformations offlexible pavements. Final Technical Report, University of Nottingham, U.K.
15. Brown, S.F., Brunton, J.M., and Pell, P.S. (1982). "The Development andImplementation of Analytical Pavement Design for British Conditions." Proceedings,Fifth International Conference on the Structural Design of Asphalt Pavements,University of Michigan, Ann Arbor, Michigan, 3-16.
16. Brown, S.F., Brunton, J.M., and Stock, A.F. (1985). "The Analytical Design ofBituminous Pavements." Proceedings, Institution of Civil Engineers, Part 2, Vol. 79, 1-31.
17. CALTRANS. (1978). "Method of Test for Stabilometer Value," California Test 366.Manual of Test, Vol. 2, Sacramento, 1-12.
18. Council of Scientific and Industrial Research. (1985). Accelerated Testing ofPavements. Annual Transportation Convention, Pretoria, South Africa.
19. Deacon, J.A. (1965). Fatigue of Asphalt Concrete. Graduate Report, The Instituteof Transportation and Traffic Engineering, University of California, Berkeley.
20. de Boissoudy, A., le Bechec, J., Lucas, J., and Rouques, G. (1973). Etudes deFaisabilite d'un Manege de Fatigue des Structures Routieres. Laboratoire Central desPonts et Chausees (in French).
21. Deen, R. C., Southgate, H. F., and Mayes, J. G. (1980). "The Effect of Truck Designon Pavement Performance," Proceedings, The Association of Asphalt PavingTechnologists, Vol. 49, 606-632.
22. Epps, J. A. (1969). Influence of Mixture Variables on the Flexural Fatigue and TensileProperties of Asphalt Concrete. Doctor of Engineering Thesis, University ofCalifornia, Berkeley.
23. Epps, J.A., and Monismith, C.L. (1972). Fatigue of Asphalt Concrete Mixtures -Summary of Existing Information, in STP 508, ASTM, 19-45.
24. Freeme, C.R., and Marais, C.P. (1973). Thin Bituminous Surfaces: Their FatigueBehavior and Prediction, Highway Research Board, Special Report No. 140, 158-179.
133

25. Gerritsen, A. H., van Gurp, C.A.P.M., van der Heide, J.P.J., Molenaar, A.A.A., andPronk, A. C. (1987). "Prediction and Prevention of Surface Cracking in AsphaltPavements," Proceedings, 6th International Conference on the Structural Design ofAsphalt Pavements, University of Michigan, Ann Arbor, 378-391.
26. Gonzales, G., Kennedy, T. W., and Anagnos, J. N. (1975). Evaluation of the ResilientElastic Characteristics of Asphalt Mixtures Using the Indirect Tensile Test. ResearchReport 183-6, Center for Highway Research, The University of Texas at Austin.
27. Grainger, G.D. (1964). The Reconstruction of No. 3 Road Machine for PavementDesign Studies. Transport and Road Research Laboratory, Lab Note LN/506/GDG.
28. Hadley, W. O. and Vahida, H. (1983). "Fundamental Comparison of the Flexural andIndirect Tensile Tests," Transportation Research Record 911, Transportation ResearchBoard, Waslhington, D. C., 42.
29. Hicks, R. G. (1970). Factors Influencing the Resilient Properties of Granular Materials.Ph.D. Thesis, University of California, Berkeley.
30. Hicks, R.G. and Monismith, C.L. (1971). "Factors Influencing the ResilientResponse of Granular Materials," Highway Research Record 345, Highway ResearchBoard, Washington, D. C.
31. International Conference on the Structural Design of Pavements, Fourth, Universityof Michigan, Ann Arbor. (1977). Proceedings, Vol. I.
32. Jimenez, R..A., and Gallaway, B.M. (1962). "Behavior of Asphaltic ConcreteDiaphragms to Repetitive Loadings." International Conference on the StructuralDesign of Asphalt Pavements. 339.
33. Kennedy, T. W. (1977). "Characterization of Asphalt Pavement Materials Using theIndirect Tensile Test," Proceedings, The Association of Asphalt Paving Technologists,Vol. 56.
34. Kennedy, T. W. and Anagnos, J. N. (1983). Procedures for the Static and Repeated-Load Indirect Tensile Tests. Research Record 183-14, Center for TransportationResearch, University of Texas at Austin.
35. Kennedy, T. W. and Hudson, W. R. (1968). "Application of the Indirect Tensile Testto Stabilized Materials," Highway Research Record 235, Highway Research Board,Washington, D. C.
134

36. Khosla, N. P. and Omer, M. S. (1985). "Characterization of Asphaltic Mixtures forPrediction of Pavement Performance," Transportation Research Record 1034,Transportation Research Board, Washington, D. C., 47-55.
37. Kim, Y.R., Little, D.N., and Benson, F.C. (1990). "Chemical and MechanicalEvaluation on Healing of Asphalt Concrete." Proceedings, Association of AsphaltPaving Technologists, Vol. 59.
38. Kirk, J.M. (1967). "Results of Fatigue Tests on Different Types of BituminousMixtures." Proceedings, Second International Conference on the Structural Design ofAsphalt Pavements, University of Michigan.
39. Kunst, P.A.J.C. (1989). Surface Cracking on Asphalt Layers, Working Committee B12,Hoevelaken, Holland.
40. Little, N. Dallas and Richey, B. L. (1983). "A Mixture Design Procedures Based onthe Failure Envelope Concept," Proceedings, Association of Asphalt PavingTechnologists, 379-415.
41. Majidzadeh, K., Kauffmann, E. M., and Ramsamooj, D. V. (1971). "Application ofFracture Mechanics in the Analysis of Pavement Fatigue," Proceedings, Associationof Asphalt Paving Technologists, 227-246.
42. Majidzadeh, K., Kauffmann, E. M., and Saraf, C. L. (1972). "Analysis of Fatigue ofPaving Mixtures from Fracture Mechanics View Point," ASTM STP 508, 67-83.
43. Maupin, G. W. (1980). Investigation of Fatigue Failure in Bituminous Base Mixes,Virginia Highway and Transportation Research Council, Charlottesville.
44. McLean, D. B. (1974). Permanent Deformation Characteristics of Asphalt Concrete.Ph.D. Thesis, University of California, Berkeley.
45. Metcalf, J.B., McLean, J.R., and Kadar, P. (1985). "The Development andImplementation of the Australian Accelerated Loading Facility (ALF) Program," inAccelerated Testing of Pavements, Annual Transportation Convention, Pretoria, SouthAfrica, 27 pp.
46. Monismith, C. L. (1981). "Fatigue Characteristics of Asphalt Paving Mixtures andTheir Use in Pavement Design," Proceedings, 18th Paving Conference, University ofNew Mexico, Albuquerque.
47. Monismith, C. L. (1966). Asphalt Mixture Behavior in Repeated Flexure, Report No.TE 66-66, ITIE, to California Division of Highways, University of California.
135

48. Monismith, C. L. and Deacon, J. A., (1969). "Fatigue of Asphalt Paving Mixtures,"ASCE Tramportation Engineering Journal, Vol. 95:2, 317-346.
49. Monismith, C.L., Epps, J. A., and Finn, F.N. (1985). "Improved Asphalt MixDesign," Proceedings, Association of Asphalt Paving Technologists.
50. Monismith, C.L., Epps, J.A., Kasianchuk, and McLean, D.B. (1971). AsphaltMixture Behavior on Repeated Flexure. Report No. TE 70-5, University of California,Berkeley, 303.
51. Monismith, C. L., Finn, F. N., and Vallerga, B. A. (1987). A Comprehens&eAsphaltConcrete Mixture Design System. Paper prepared for presentation at ASTMSymposium on "Development of More Rational Approaches to Asphalt Concrete MixDesign Procedures," Bal Harbor, Florida.
52. Monismith, C. L., Inkabi, K., McLean, D. B., and Freeme, C. R. (1977). DesignConsiderations forAsphalt Pavements, Report No. TE 77-1, University of California,Berkeley, March, 131.
53. Monismith, C. L. and Salam, Y. M. (1973). "Distress Characteristics of AsphaltConcrete Mixes," Proceedings, Association of Asphalt Paving Technologists. 320-350.
54. Monismith, C. L., Seed, H. B., Mitry, F. G., and Chan, C. K. (1967). "Predictions ofPavement Deflections for Laboratory Tests," Proceedings, Second InternationalConference on the Structural Design of Asphalt Pavements, University of Michigan,Ann Arbor.
55. Owen, D. B. (as corrected by Painter, L. J. of Statistics PLUS, San Rafael, CA)(1962). Handbook of Statistical Tables. Addison-Wesley.
56. Paris, P. C. and Erdogan, F. A. (1963). "Critical Analysis of Crack PropagationLaws," Transactions of ASME, Journal of Basic Engineering, Series, D, Vol. 85, No.3.
57. Paterson, W.D.O. (1972). "Deformations in Asphalt Concrete Wearing CoursesCaused by Traffic." Proceedings, Third International Conference on Structural Designof Asphalt Pavements, VoL 1, 317-325.
58. Pell, P.S. (1967). "Fatigue Characteristics of Bitumen and Bituminous Mixes,"Proceedings, International Conference on the Structural Design of Asphalt Pavements,Ann Arbor, University of Michigan, 310.
59. Pell, P.S. (1965). "Fatigue of Bituminous Materials in Flexible Pavements,"Proceedings, Institution of Civil Engineers, Vol. 31.
136

60. Pell, P. S. and Brown, S. F. (1972), "The Characteristics of Materials for the Designof Flexible Pavement Structures," Proceedings, Third International Conference on theStructural Design of Asphalt Pavements, London, 326.
61. Pell, P. S. (1973). "Characterization of Fatigue Behavior," in Structural Design ofAsphalt Concrete Pavements to Prevent Fatigue Cracking. Special Report 140,Highway Research Board, 49-64.
62. Pell, P. S. and Cooper, K. E. (1975). 'q'he Effect of Testing and Mix Variables on theFatigue Performance of Bituminous Materials," Proceedings, The Association ofAsphalt Paving Technologists, Vol. 44.
63. Pell, P. S. and Hanson, J. M. (1973). "Behavior of Bituminous Road Base Materialsunder Repeated Loading," Proceedings, Association of Asphalt Paving Technologists,201, 229.
64. Pell, P. S. and Taylor, I. F. (1969) "Asphaltic Road Materials in Fatigue," Proceedings,The Association of Asphalt Paving Technologists, Vol. 38.
65. Porter, B. P. and Kennedy, T. W. (1975). Comparison of Fatigue Test Methods forAsphaltic Materials. Research Report 183-4, Center for Highway Research, TheUniversity of Texas at Austin.
66. Raithby, K. D. and Ramshaw, J. T. (1972). Effect of Secondary Compaction on theFatigue Performance of a Hot-Rolled Asphalt, TRRL-LR 471, Crowthorne, England.
67. Raithby, K. D. and Sterling, A. B. (1972). Some Effects of Loading History on thePerformance of Rolled Asphalt, TRRL-LR 496, Crowthorne, England.
68. Rao Tangella, S.C.S. (1989). Development of an Asphalt-Aggregate Mixture AnalysisSystem (AAMAS), Doctor of Engineering Dissertation, Department of CivilEngineering, University of California, Berkeley.
69. Ruth, B. E. and Schaub, J. H. (1966). "Gyratory Testing Machine Simulation of FieldCompaction of Asphaltic Concrete," Proceedings, Association of Asphalt PavingTechnologists, 451-484.
70. Saal, R.N.J. and Pell, P. S. (1960). "Fatigue of Bituminous Road Mixes," KolloidZeitschrift (Darmstadt), Vol. 171.
71. Said, S. F. (1988). "Fatigue Characteristics of Asphalt Concrete Mixtures," VT1meddelande 583A, Vag-6ch Trafic Institutet (Swedish).
137

72. Salam, Y. lVI.(1971). Characteristicsof Deformation and Fracture of Asphalt Concrete,Ph.D. Dissertation, University of California, Berkeley.
73. Santucci, L. E. (1977). Thickness Design Procedure for Asphalt and EmulsifiedAsphalt Mixes. Vol. 1 Proceedings, Fourth International Conference on the StructuralDesign of A6phalt Pavements, University of Michigan, Ann Arbor, 424-456.
74. Schmidt, R. J. (1971) "A Practical Method for Measuring the Resilient Modulus ofAsphalt-Treated Mixes," Highway Research Record 404, Highway Research Board,Washington, D. C.
75. Scholz, T., Hicks, R. G., and Scholl, L. (1989). Repeatability of Testing Proceduresfor Resilient Modulus and Fatigue. Report to Materials and Research Section, OregonDOT, Oregon State University.
76. Shell International Petroleum Company, Ltd. (1978). Shell Pavement Design Manual,London.
77. Sousa, J.B. (1986). Dynamic Properties of Pavement Materials, Ph.D. Thesis,University of California, Berkeley.
78. Sparks, G.H. (editor) (1980). Proceedings, NA,4SRA/ARB Seminar on HeavilyTrafficked Flexible Pavements, ARRB, Vermont South.
79. Terrel, R. L. and Krukar, M. (1970). "Evaluation of Test Tracking Pavements,"Proceedings, The Association of Asphalt Paving Technologists, 272.
80. Vallerga, B. A. (1951). "Recent Laboratory Compaction Studies of BituminousPaving Mixttlres." Proceedings, Association of Asphalt Paving Technologists, Vol. 20,117-153.
81. Van Dijk, W. (1975). "Practical Fatigue Characterization of Bituminous Mixes,"Proceedings, 'TheAssociation of Asphalt Paving Technologists, 38.
82. Van Dijk, W., Moreaud, H., Quedeville, A, and Uge, P. (1972). 'q"he Fatigue ofBitumen and Bituminous Mixes," Proceedings, The Association of Asphalt PavingTechnologists, 38.
83. Van Dijk, W. and Visser, W. (1977). "The Energy Approach to Fatigue for PavementDesign," Proceedings, The Association of Asphalt Paving Technologists, Vol. 46, 1.
84. Verstraeten, J. (1972). "Moduli and Critical Strains in Repeated Bending ofBituminous Mixes, Application to Pavement Design," Proceedings, Third InternationalConference on the Structural Design of Asphalt Pavements, l.xmdon, 729.
138

85. Verstraeten, J., Veverka, V., and Franken, L. (1982). "Rational and Practical Designof Asphalt Pavements to Avoid Cracking and Rutting," Proceedings,Fifth InternationalConference on the Structural Design of Asphalt Pavements, 45.
86. Von Quintus, H. L., Scherocman, T. A., Hughes, C. S., and Kennedy, T. W. (1988).Development of Asphalt-Aggregate Mixture Analysis System: AAMAS. Brent RauhutEngineering, Inc., Austin.
87. Wallace, K. and Monismith, C. L. (1980). "Diametral Modulus Testing on NonlinearPavement Materials," Proceedings, The Association of Asphalt Paving Technologists,Vol. 49, 633.
88. Witczak, M. W. (1976). Pavement Performance Models; Repeated Load Fracture ofPavement Systems. Vol. 1, Report No. FAA-RD-75-2771. U. S. Army EngineerWaterways Experiment Station.
139

APPENDIX A
HYPOTHESES AND RECOMMENDED TEST PROGRAM
A.1 Hypotheses
Based on this evaluation of the fatigue response of asphalt-aggregate mixtures, the
following hypotheses have been postulated relative to their fatigue response characteristics:
1. Cracking results from a tensile stress or strain (less than the fracture stress or
strain-at-break under one load application) at a specific number of stress (or
strain) applications, the number of load applications being larger as the
magnitude of the stress or strain is smaller, i.e.:
N = A(1/_t) t_ or N = C(1/at) a
The relationships are dependent on the temperature and mode-of-loading
[coefficients (A and b) and (C and d)] and must be established by some form
of repetitive load testing; or
2. Cracking results from repetitive stress (strain) applications when either the total
ener_ or the strain energy, of di_t0rtion reaches some limiting value regardless
of the mode of loading to which the specimen is subjected; or
3. A direct correlation can be established between the stiffness and fracture
characteristics of a mix and its fatigue response (e.g., similar to that established
by the LCPC of France); or
4. Results of fracture tests on notched specimens can be used to predict the
fatigue: response of asphalt concrete mixtures over a range in temperatures.
140

From experimental evidence such as that illustrated in Figures A1 and A2, the
magnitude of tensile stress or strain repeatedly applied appears to be a reasonable
determinant of the cracking which occurs in asphalt-bound layers subjected to repetitive
trafficking. Since actual pavements are subjected to bending stresses, this model of loading
appears most reasonable to define fatigue response using laboratory test equipment.
While bending stresses are representative of in-situ conditions, other modes of
loading will also be utilized and include diametral and direct tension testing.
At the University of California at Berkeley, the bending fatigue tests will be
conducted at a rate of 100 repetitions per minute, a comparatively slow rate and one in
which the influence of rest periods has been shown to be negligible. Since it may be
desirable, should this method of testing be selected, to conduct a bending test at a faster
rate of loading, controlled-stress fatigue tests on pyramidal shaped specimens will be
conducted at SWK/Nottingham University at a rate approximately ten times as fast.
Since the bending mode of loading requires taht specimens be sawed to prismatic or
pyramid shapes, it was considered desirable to test specimens not requiring sawing; hence
the direct tension tests at SWK/Nottingham performed on cylindrical specimens.
When testing to define fatigue behavior, the mode of loading influences response
with specimens of comparatively low stiffness performing well in the controlled-strain mode
and specimens of high stiffness performing well in the controlled-stress mode. Since both
controlled-stress and controlled-strain tests will be performed at UCB, consideration will be
given to the determination of the total strain energy and the strain energy of distortion in
141

/0,000_ I I f t I i I I I I I i I i I I I i _ I I_
I/000
- l _Nf--/.55x/0_6(i/o_)_T _
- /-_ ___ -
IOC ._- _-_"_---- _ - ..... I_ _"-_ _
_ _-- Nf-3.97, I0,4 _-"'_-__(//__)5.36_ 7 68°F --
! I I I II0 I I I li I I r t i I I I I I I I
I02 i0_ 104 105 I06 I0z
Stress _ppl/cot/ons-Nf
Figure A1. Stress vs. Applications to Failure
#A.v'p,_ _ i i , ! [ i _ i I i I I i i i i
•_ --68"F
103 _ . ]i '"_, _ 4o2£ • I.-"-_,
_',_ - #:e35,,o_','d" "; _..o&_.
a,o, ..
_ _ _
/0 I I II I I I[ I I tl [ I II I I flI02 I03 I0 _ I0 5 I0 6 IC z
Stress ,_pplicotions- Nf
Figure A2. Strain vs. Applications to Failure
142

an attempt to eliminate the mode-of-loading variable. Such analyses will require a measure
of the complex modulus and phase angle for each mixture corresponding to the time of
loading and temperature of the fatigue test together with the stress/strain vs. number of
load applications to failure. While this approach still requires the conduct of fatigue tests,
it may have the potential to sort out mode-of-loading effects.
To reduce the amount of testing required to define fatigue response in the laboratory,
consideration will be given to the correlation developed by the LCPC between the fracture
characteristics of a mix in uniaxial loading and its fatigue response. In the LCPC
methodology, measurement of the stiffness characteristics of the specific mix at different
strain levels and temperatures are also required. An evaluation of the LCPC approach will
be made to determine its efficacy since the use of a direct tension test has the potential to
reduce considerably the time required to define fatigue response of asphalt-aggregate
mixtures as compared to repetitive load testing.
The use of fracture mechani¢_ principles has the potential to shorten the time
required in the laboratory to define fatigue response. Rather than conduct repetitive
loading fatigue tests, direct loading tests on notched specimens permit the determination of
specific material parameters from which the fatigue response can be estimated. Depending
on the size of the non-elastic zone at the crack tip, different interpretations are required.
If the majority of the material behaves elastically, the stress intensity factor, K, governs the
response. On the other hand, if the non-elastic zone is large, either the J-integral or the C'-
line integral may be required to define crack propagation. It is anticipated that the stress
intensity factor will be suitable to define fatigue response at low temperatures (i.e. 32"F).
143

At high temperatures, however, it may be necessary to consider either the J integral or the
C'-line integral; both will be evaluated.
By conducting the conventional fatigue tests together with the additional tests
described herein, sufficient data will have been obtained to permit the evaluation of all of
the above hypotheses permitting the selection of an appropriate methodology for further
development and evaluation.
A.2. Test Program
Tests. As outlined in the work plan (and modified based on the literature review),
the following tests will be evaluated:
AGENCY TEST
University of California Beams - controlled stress and controlledstrain
Direct tension - correlation with fatigue
University of Nottingham (SWK) Trapezoidal specimens - sinusoidalloading (controlled stress)Direct tension - sinusoidal loading(controlled stress)
North Carolina State University Diametral - pulsed loading (controlledstress and controlled strain)
It is now expected that each laboratory will prepare its own test specimens. In
addition, a limited test program will be conducted at Berkeley to evaluate the fracture
mechanics methodology. This program has not been defined at this time to the degree that
the repeated load test program has been and is described in the figllowing section.
144

Variables Considered. Table A-1 summarizes the significant variables for the fatigue
study. A total of ten variables were considered. Of these, four will be fixed (aggregate
gradation, grade of asphalt, aging, and moisture conditioning). Each of the others will be
evaluated at two levels. This results in a total number of combinations of 2 6 (or 64 cells)
for each test method.
Using principles of experimental design, it was determined that a 1/2
fraction of the complete factorial (i.e., 32 cells) would be necessary to estimate both main
effects and all two-factor interactions. To obtain estimates of purely experimental error,
these 32 factorial combinations will be replicated three times, for a total of 96 tests for the
beam testing, and twice (64 tests) for the other fatigue tests. The beam tests require greater
replication because of the larger variation expected as compared to the other tests.
The total number of samples contained in this testing program is 512. This testing
program is expected to be completed by June 1990. A summary of sample requirements is
shown in Table A.2.
Expected Results, The results of this study will provide insight as to which of the
fatigue test systems is most promising for implementation using the criteria stated at the
beginning of this chapter. The selected equipment will be used in the subsequent plans of
the project study.
145

Table A.1. Significant Mixture and Test Variables for Fatigue Study
Level of TreatmentVariable No of
Levels
1 2 3
Aggregate
Stripping potential Low High (2)
Gradation Medium (1)
Asphalt
Temperature susceptibility Low High (2)
Grade Medium (1)
Content Optimum High (2)
Compaction
Air voids 4 +_1/2% 8 + 1/2 % (2)
Test conditions
Temperature 32* F 68* F (2)
Stress Low ttigh (2)
Conditioning
Aging None (1)
Moisture None (1)
2_
146

Table A.2. Number of Samples for Fatigue Factorial Design
Number of SamplesTest Total
1/2 Fractional Repficates
University of California
• Flexural Beam, Controlled Stress 32 64 96
• Flexural Beam, Controlled Strain 32 64 96
• Direct Tension, Static 32 32 64
North Carolina State University
• Diametral, Controlled Stress 32 32 64
• Diametral, Controlled Strain 32 32 64
University of Nottingham (SWK)
• Direct Stress, Controlled Stress 32 32 64
• Trapezoidal Beam, Controlled Stress 32 32 64
Grand Total 512
Complete Factorial 26 = 641/2 Fractional = 32Total Number of Samples = 512Estimated Time for Testing = 6-9 months
147