1 Economics 331b Spring 2011 Economics of Climate Change: Impacts.
description

1
Economics I ‘David Begg and Damian Ward – Economics for business’
Chapter 1: Economics for business
1.1 What is economics?
Economics � how individuals, firms, governments and economies deal with the problem of infinite
wants and finite resources, it is the study of how the society resolve the problems of scarcity.
Microeconomics: addresses the various market influences that impact upon a firm’s revenues and costs.
Macroeconomics: addresses the economy-level issues which similarly affect a firm’s revenues and costs.
Infinite wants: limitless desires to consume goods and services (big house, luxury car, designer shoes).
Finite resources: limited amount of resources that enable the production and purchase of goods and
services (salary, consulting fees, royalties from book, generous friends).
Factors of productions: are resources needed to make goods and services: land (oil, gas, base metals),
labour (China/India or Europe), capital (machinery, computers, office spare, retail shops) and enterprise
(brings land, labour and capital together and organize them into business units that produce goods and
services with the objective of making a profit, like shareholders).
Production possibility frontier
� it shows the maximum number of
products that can be produced by an
economy with a given amount of
resources. This illustrative tool can be
used to highlight crucial economic
concepts:
� Finite resources � with a
fixed quantity of resources an
infinite amount of beer, or
pizzas, cannot be produced.
The frontier shows what it is
possible to produce with a
limited amount of resources.
� Opportunity costs � the benefits forgone from the next best alternative.
If pizza production is reduced in order to make more beer, then the opportunity cost consists of
the benefits that could have been received from the pizzas that have not been made.
Opportunity costs give the production frontier a negative slope (helling/verval).
� Macro- and microeconomics
Macroeconomics = study of how the entire economy works � points X and Z, X: economy is not
operating at its optimal level (unemployment) and Z: economy cannot achieve this point now,
but maybe in the future.
Microeconomics = study of how individuals make economic decisions within an economy.
Y1 » balanced mix of pizza and beer, Y2 » specializes in pizza, Y3 » specializes in beer.
� Planned, market and mixed economies
- Planned (command) economy: government decides how resources are allocated to the
production of particular products, they set an economic plan for five years (China/SU/Cuba).
- Market economy: government plays no role in allocating resources. Instead, markets allocate
resources to the production of various products. Increase profits will lead firms to move
resources into the market.
- Mixed economy: government and the private sector jointly solve economic problems.
GDP: gross domestic product � is a measure of overall economic activity within an economy.

2
1.2 Why study economics for business?
Economists simply assume that the firm is in business to maximize profits.
Markets are important for firms in a number of ways:
1. A marketplace is where a firm will sell its product and, therefore, generate revenue;
2. A firm’s inputs (land, labour, capital, enterprise) are all purchased through markets and,
therefore, markets influence a firm’s level of costs.
Government intervention � in order to manage pollution the government can influence the commercial
activities of firms (by means of taxes or subsidies).
Globalization � firms have begun to operate within an increasingly global environment, therefore firms
need to understand how macroeconomic events and global change will impact on their current and
future operations.
1.3 Appendix: the economist’s approach
Normative and positive economics
Positive economics: studies objective or scientific explanations of how the economy works.
Normative economics: offers recommendations based on personal value judgements.
Diagrams
Positive relationship: exists between two variables if the values for both variables increase and decrease
together � oven: time increase & temperature increase.
Negative relationship: exists between two variables if the values for one variable increase (decrease) as
the value of the other variable decrease (increase) � fridge: time increase & temperature decrease.
Linear relationship � equation of a straight line: Y = a + bX (a = intercept (snijpunt met y-as), b =
gradient of the line).
Non-linear relationship � quadratic: Y = a + bX + cX²
Gradient: is a measure of the slope (helling) of a line.
Gaining a measure of the gradient:
- ΔY/ΔX (Δ means change) or differentiation � Y2 = 2 + 2x � Y2 = 0 + 2 � 2.
Economic data
Time series data: are the measurements of one variable at different points in time.
Cross-sectional data: are the measurements of one variable at the same point in time across different
individuals.
Panel data: combines cross-sectional and time series data.
Using data
Calculating percentages:
(New value – Original value) x 100 (%)
Original value
Index numbers
Index numbers: are used to transform a data series into a series with a base value of 100.
Methods of averaging in economics
Observations Arithmetic mean Geometric mean
2,3 (2+3)/2 = 2,5 (2 x 3)^(1/2) = 2,45
2,3,4 (2+3+4)/3 = 3 (2 x 3 x 4)^(1/3) = 2,88

3
Chapter 2: Consumers in the marketplace
2.1 Business problem: what is the best price?
Possible objectives for a firm:
- maximize the amount of profit made by the firm
- maximize the market share for the firm’s product
- maximize the firm’s total revenues
- recently: corporate social responsibility
� the best price helps the firm meet its chosen objective.
2.2 Introducing demand curve
Demand curve: illustrates the relationship between price and quantity demanded of a particular
product. � Price-demand relationships.
Y-as: price changes to consumer demand
X-as: quantity changes to consumer demand
In this case: the slope is negative, this depicts that,
as prices fall, more of a product will be demanded
by consumers.
2.3 Factors influencing demand
Factors influencing the willingness to buy a product:
1. Price of substitutes and complements
Substitutes: rival products (BMW car is a substitute for a Mercedes, or coffee is a substitute for tea).
Complements: products that are purchased jointly (cars and petrol, coffee and sugar/milk).
� See figure 2.2 on page 32 for the movements in demand.
2. Consumer income
Normal goods: are demanded more when consumer income increases and less when income falls.
Inferior goods: are demanded more when income level falls and demanded less when income levels
rise (cheaper brands; products that we stop purchasing once our income rises and we move to more
normal types of goods, nutella vs eigen merk pasta).
3. Tastes and preferences
Reflect consumers’ attitudes towards particular products. Over time, these tastes and preferences
are likely to change. (Fashion, technological developments like mobile phones and computers).
Advertising plays an important role: informal role & role of trying to change consumers’ tastes and
preferences. Due to advertising, you can build additional differentiation into the product.
� Informing consumers what they can and what they should buy.
4. Price expectations
Price expectations: beliefs about how prices in the future will differ from prices today. (E.g. property
and oil/gas).
If the factors 1, 2 , 3 and 4 do not change, then there must be a negative (-) relationship between price
(P) and the quantity (Q) demanded.
Law of demand: states that, ceteris paribus, as the price of a product falls, more will be demanded.
Ceteris paribus: all other things are equal, they do not have any influence.

4
2.4 Measuring the responsiveness of demand
Elasticity: a measure of the responsiveness of demand to a change in price.
� In figure 2.4a demand is responsive to a change in price, while in figure 2.4b demand is not very
responsive to a change in price.
The elasticity of a product is determined by a number of factors:
1. Number of substitutes
The more substitutes, the more elastic will be demand (e.g. if a product has no substitutes and
the supplier decides to increase its prices, then consumers cannot switch to a cheaper
alternative).
� Large number of substitutes » high price elasticity, thus if the price of the product increases,
consumer will quickly switch to the cheaper alternatives.
2. Time
It is likely to influence the development and introduction of substitutes. New products will only
have a small number of substitutes, only if these products are successful will new entrants come
into the market and begin to compete. Therefore, in the early period of a new market, demand
is likely to be inelastic, but in the long term, demand is likely to become more elastic.
3. Definition of the market
Demand for beer is relatively unresponsive to a change in price, but in contrast, the demand for
a particular brand of beer is likely to be price responsive, because all the separate beer brands
are competitive substitutes. So, if one brand becomes more expensive, it is likely that drinkers
will switch to the cheaper alternatives.
Measuring elasticity:
εεεε = Percentage change in quantity demanded
Percentage change in price
with 0 < e < ∞
Note 1: e is the price elasticity of demand
Note 2: the cause (%ΔP) always below � “oorzaak onderaan”!
Note 3: e is a numerical value (can be – or +)
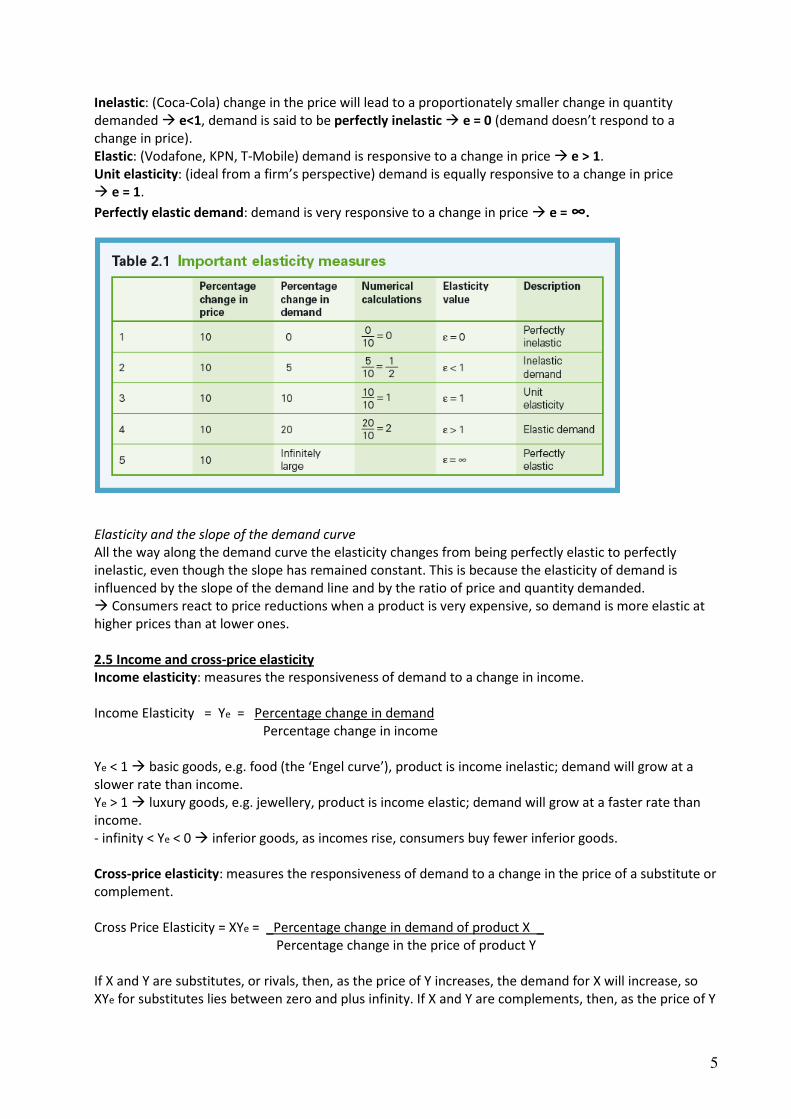
5
Inelastic: (Coca-Cola) change in the price will lead to a proportionately smaller change in quantity
demanded � e<1, demand is said to be perfectly inelastic � e = 0 (demand doesn’t respond to a
change in price).
Elastic: (Vodafone, KPN, T-Mobile) demand is responsive to a change in price � e > 1.
Unit elasticity: (ideal from a firm’s perspective) demand is equally responsive to a change in price
� e = 1.
Perfectly elastic demand: demand is very responsive to a change in price � e = ∞.
Elasticity and the slope of the demand curve
All the way along the demand curve the elasticity changes from being perfectly elastic to perfectly
inelastic, even though the slope has remained constant. This is because the elasticity of demand is
influenced by the slope of the demand line and by the ratio of price and quantity demanded.
� Consumers react to price reductions when a product is very expensive, so demand is more elastic at
higher prices than at lower ones.
2.5 Income and cross-price elasticity
Income elasticity: measures the responsiveness of demand to a change in income.
Income Elasticity = Ye = Percentage change in demand
Percentage change in income
Ye < 1 � basic goods, e.g. food (the ‘Engel curve’), product is income inelastic; demand will grow at a
slower rate than income.
Ye > 1 � luxury goods, e.g. jewellery, product is income elastic; demand will grow at a faster rate than
income.
- infinity < Ye < 0 � inferior goods, as incomes rise, consumers buy fewer inferior goods.
Cross-price elasticity: measures the responsiveness of demand to a change in the price of a substitute or
complement.
Cross Price Elasticity = XYe = _Percentage change in demand of product X _
Percentage change in the price of product Y
If X and Y are substitutes, or rivals, then, as the price of Y increases, the demand for X will increase, so
XYe for substitutes lies between zero and plus infinity. If X and Y are complements, then, as the price of Y

6
becomes more expensive, less X will be purchased, so XYe for complements lies between zero and minus
infinity.
Example: elasticity for bus travel
* price elasticity (-)0.1, * cross-price elasticity (with cars) + 0.3, * income elasticity - 2.4
2.6 Business application: Pricing Strategies I – exploiting elasticities
Cost-plus pricing
� take simply the costs of producing the product and add a mark-up (such as 30 per cent) � simplicity!
But it fails to take account of consumers’ willingness to demand.
Price changes, total revenue and elasticity
a. change in total revenue when demand is elastic
b. change in total revenue when demand is inelastic
a. b.
Total revenue: price x number of units sold
� when demand is price elastic, selling at a lower price will boost total revenues (cell phone contracts).
� when demand is price inelastic, selling at a lower price will leads to drop in total revenues (Coca cola).
The best price occurs when price elasticity is 1, but firms may not always target a price elasticity equal
to, they may not have revenue maximization as their objective.
Product life cycle and pricing
Successful innovation spawns imitation and aggressive competition as the market grows.
• Introduction stage: few competitors, demand will be price inelastic, firm could seek to price high.
• Growth stage: more companies join the market � increase in competition and substitutability �
increase of elasticity of demand.
• Maturity stage: high competition, sales are at a peak, high price elasticity � rationale is sales-
maximization, high price elasticity � little control over pricing.
• Decline stage: consumers will begin to leave the market � competition will fall � degree of price
sensitivity among consumers will decrease � elasticity of demand begin to become more inelastic.

7
2.7 Business application: Pricing Strategies II – extracting consumer surplus
Concept of consumer surplus: the difference between the price you are charged for a product and the
maximum price that you would have been willing to pay.
You are charged £500, but you are
willing to pay £750. Your consumer
surplus is £250.
The entire amount of consumer
surplus in the market is the area
under the demand line down to the
price charged of £500. This area
represents the amount each
consumer would be willing to pay in
excess of the price charged.
Consumer surplus represents a benefit for consumers, but for a firm it represents missed profits.
Price discrimination
� the act of charging different prices to different consumers for an identical good or service.
For price discrimination to be successful, three conditions must exist:
1. Firm must have some control over its prices (cannot face a perfectly elastic demand line) �
having some degree of market power in setting prices;
2. Firm must be capable of identifying different groups of consumers who are willing to pay
different prices;
3. Resale of the good or service must be prohibited (otherwise, a consumer who buys at a low price
can then sell to a consumer who is willing to buy at a high price).
First-degree price discrimination: each consumer is charged exactly what they are willing to pay for the
good or service � e.g. auction (veiling).
Second-degree price discrimination: consumers are charged according to the number of units they buy,
two part tariffs, first part is a fixed element to cover the cost of infrastructure, second part covers the
cost of using additional units of for example electricity gas.
Third-degree price discrimination: each consumer group is charged a different price; firms can identify
different market segments for a similar product or service � e.g. 1st
and 2nd
class in train, different
versions of ipod (nano, classic, etc)
De-bundling of services: basic plus extra.
Chapter 3: Firms in the marketplace
3.1 Business problem: managing fixed and variable costs
Fixed costs: constant, they remain the same whatever the level of output.
Variable costs: change or vary with the amount of production.
3.2 The short run and long run
Short run: period of time where one factor of production is fixed (temporary works; restaurants/farm).
Long run: period of time when all factors of production are variable.
How short is the short run? It depends on the sector.
Production function: q = f (l, c) with l = labour and c = capital.

8
Productivity in the short run
Key definitions:
- total product is the total output produced by a firm’s workers;
- marginal product is the addition to total product after employing one more unit of factor input �
bedrijf neemt 1 werknemer meer aan, wat doet dit met de productie?;
- marginal product of labour is the additional output produced after employing one more worker
We tend to assume that capital is fixed and labour is variable. But the nature of employment can make
labour fixed � e.g. contracts signed by footballers are for a fixed period of time.
3.3 The nature of productivity and costs in the short run
Total product: the total output produced by a firm’s workers.
Marginal product: the addition to total product after employing one more unit of factor input.
� In economics, marginal always mean ‘one more’.
Task specification: occurs when the various activities of a production process are broken down into their
separate components. Each worker then specializes in one particular task, becoming an expert in the
task and raising overall productivity.
Law of diminishing returns: states that as more of a variable factor of production (usually labour) is
added to a fixed factor of production (usually capital) then at some point the returns to the variable
factor will diminish/decrease. “At some point there are many cooks in the kitchen.”
Figure 3.1 & 3.2!!
When we have a fixed factor of production, such as capital, and we add workers to the production
process these workers can exploit an underutilized resource � marginal product rises.
When we begin to over-resource the production process with too much labour, there is no more capital
to utilize � marginal product begins to fall. � Point at which the law of diminishing returns occurs.
Additional workers are able to exploit the vans and become more productive, but once we begin to
employ more workers, and there are not enough vans, the productivity of labour must begin to fall.
Costs in the Short run
- variable costs � associated with the use of variable factors of production; vary with the level of
output.
- fixed costs � associated with the employment of fixed factors of production such as capital; are
constant at all levels of output.
- total costs = fixed costs + variable costs
- NB: in economics costs are always driven by the costs of inputs and the productivity of those
inputs!
Figure 3.3
Average costs
Average total cost = total cost / number of units produced (curve is U-shaped)
Marginal cost = change in total cost / change in output
� is the cost creating one more unit.
Average variable cost = total variable cost / number of units produced (curve is U-shaped)
Average fixed cost = total fixed cost / number of units produced
Marginal cost curve cuts through the minimum points of the average total and average variable cost
curves.

9
Average fixed cost curve is different � always falling as output increases. As fixed costs are spread over
a larger level of output, the fixed costs per unit will fall.
3.4 Output decisions in the short run
Sometimes a company stay producing, although they make a loss because, they want to minimize the
loss as much as possible.
Figure 3.5
3.5 Cost inefficiency
Book assumed so far that firms are operating on the cost curve, but this is troublesome, since some
firms are more cost-effective than their rivals; and in addition some firms are better at raising
productivity over time.
3.6 The nature of productivity and costs in the long run
In the long run, both capital and labour are variable � law of diminishing returns doesn’t determine the
productivity of a firm in the long run (because there is no fixed capital in the long run to constrain
(beperken) productivity growth).
Returns to scale: measure the change in output for a given change in the inputs.
� increasing returns to scale exist when output grows at a faster rate than inputs.
� decreasing returns to scale exist when inputs grows at a faster rate than outputs.
� constant returns to scale exist when inputs and outputs grow at the same rate.
Figure 3.7
quadrant 1: short-run average total cost curve (SATC) � adding more capital and labour to production
process � quadrant 2: curve moves down and to the right (produce same level of output for lower
average cost » increasing of returns to scale)�quadrant 3: move of cost curve. In quadrant 4, increasing
scale leads to the new cost curve SATC₂ shifting upwards and to the right, leading to an increase in costs,
a case of decreasing returns to scale.
Economists tend to find in practice that firms experience increasing, then constant and finally decreasing
returns to scale: firms move through quadrants 2, 3 and 4 in order. Therefore, the family of short-run
cost curves can be put together and the long-run cost curve can be derived, as in figure 3.8.
Figure 3.8
Economies of scale: production techniques
Economies of scale: through this long-run average costs fall as output increases. The increase
in efficiency of production as the number of goods being produced increases. Typically, a company that
achieves economies of scale lowers the average cost per unit through increased production since fixed costs are shared over an increased number of goods.

10
Chapter 4: Markets in action
4.2 Bringing demand and supply together
Figure 4.1: supply curve � depicts a positive relationship between the price of a product and frims’
willingness to supply the product.
If a firm wishes to maximize profits, then it will be willing to supply additional units of output if the price
it receives is greater than, or equal to, the marginal cost. Since the marginal cost increases as output
increases, higher prices are needed in order to induce additional supply. Therefore, the supply curve
shows a positive relationship between price and output.
Factors that will lead to a shift in supply:
• more firms in market � supply shift out to the right, with more industry output begin offered
for sale at any given price;
• costs of inputs increase � profits must fall, supply will shift out to the left;
• more productive (technology) � costs will fall � profits increase � firms are willing to supply
more � supply curve will move out to the right.
Market equilibrium: occurs at the price where customers’ willingness to demand is exactly equal to
firms’ willingness to supply. � Supply and demand meet each other.
- is unique
- ceteris paribus � all other things being equal
Market equilibrium has two characteristics
- market clearance: the interests of all actors in the market are the same
- Pareto efficiency: none of the actors can improve his/her situation without hurting someone else
Disequilibria: in such a situation, the willingness to demand at the current price will differ from the
willingness to supply.

11
4.3 Changes in supply and demand
Price expectations: relate to views on future prices: will prices rise or fall in the future?
Demand shifts to the right: Demand shifts to the left:
- normal good when income increase
- inferior good when income falls
- following an increase in the price of substitute
- following a reduction in the price of a
complement
- when tastes and preferences for this good
improve
- normal goods when income falls
- inferior goods when income rises
- following a decrease in the price of the substitute
- following an increase in the price of a
complement
- when tastes and preferences for this good
deteriorate
Supply shifts to the right: Supply shifts to the left:
- if more firms enter the market
- if the cost of inputs (labour) becomes cheaper
- if technological developments bring about
productivity gains
- if firms exit the market
- if the cost of inputs (labour) become expensive
Elasticity of supply and demand will influence how the equilibrium changes.
Inelastic supply � supply will not react strongly to a change in the price.
Elastic supply � supply will react more strongly to a change in the price.
Elasticity of demand and ∆E

12
4.4 Disequilibrium analysis’
In reality, markets may never be in equilibrium; they may instead always be moving between equilibrium
positions.
Firm too much stock? � Working capital is tied up.
A market surplus � when price is set above the equilibrium, firms are very willing to supply but
consumers are not willing to demand. As a consequence, more is supplied than demanded. Firms are left
with excess stock. In this case, at a market price of £10, firms supply 2000 units but consumers only
demand 1000 units, leaving a surplus of 1000 units. Result: discounting.
A market shortage � when price is set below the equilibrium, firms are less willing to supply but
consumers are very willing to demand. As a consequence, more is demanded than supplied. In this case,
at a market price of £8, firms supply 1000 units but consumers demand 2000 units, leaving in a shortage
of 1000 units. Result: firms raise price or consumers begin to bid up the price in order to gain access to
the product.
4.5 Pooling and separating equilibria
Separating equilibrium: Good and bad products are sold in separate markets.
� You want a good car, you go to a good car seller. Example: used cars of good quality (£5000) and of
bad quality (£2500).
Pooling equilibrium: Good and bad products are sold in the same (pooled) market.
� Customer finds it difficult to differentiate between good and bad products, good and bad cars are
sold together. Example: all used cars sold at a price of £3750 (EV = 0.5 x £5000+ 0.5 x £2500)
Gresham’s Law: states that an increasing supply of bad products will drive out good products from the
market.
4.7 Business application: labour markets
Input markets: are where factor inputs, such as land, labour, capital or enterprise, are traded.
� Rises in input prices, will lead to increases in firms’ costs.
The Cobweb Model
Cyclical fluctuations of supply due to time lags → but
the market follows a cobweb-path to equilibrium

13
Input price changes over time:
Chapter 5: Market structure and firm performance
5.2 Profit maximization
Firms are assumed to be profit maximizers.
Average revenue: the average price charged by the firm and is equal to total revenue / quantity
demanded: (PQ)/Q. � total revenue / output
Marginal revenue: the change in revenue from selling one more unit. � Dtotal revenue / Doutput
Marginal revenue: in
moving from one unit to
two units (selling one more
unit), our revenues have
increased from 12 to 22.
Marginal revenue is
therefore 22-12 = 10.

14
Marginal revenue and total revenue
Marginal revenue line slopes
down, reflecting an increase
in output which requires a
reduction in the price and the
impact of the price reduction
on the price of previous units.
Total revenue is greatest
when marginal revenue is
zero; this is because selling
one more unit neither adds to
nor subtracts from the total
revenue.
Profit maximization: the output level at which the firm generates the highest profit. � MC = MR!!!!
Marginal profits: the profit made on the last unit and is equal to: MR – MC, firms maximizes profits
when the marginal profit = 0!!
Perfectly elastic demand line is horizontal. Firms can sell any amount of output at the current price, but
if they price above the market price they sell nothing, because customers are then extremely price
sensitive.

15
Changes in costs and revenues
• Demand increases � marginal revenue curve shift to the right (thus, also an increase).
See figure 5.4, p. 102!!
• Labour become more productive � more output produced � marginal cost fall (below marginal
revenue and the firm would increase output in order to maximize profits).
See figure 5.5, p. 102!!
Profit is the major incentive for a firm!
5.3 The spectrum of market structures
MARKET STRUCTURES:
Perfect
competition
many suppliers (none controls the market); many customers (cannot individually
influence the market); homogenous product (doesn’t differ from supplier); transparency.
Monopoly one company supplies the entire market (no competition exist).
Imperfect
competition
highly competitive market where firms may use product differentiation (often the case
that one large company has a controlling share of the market and other small companies
follow its lead in setting prices and producing goods). » Monopolistic competition.
Oligopoly small group of large companies control the market between them.
5.4 Perfect competition
- many buyers and sellers
- firms have no market power
- homogenous products
- no barriers to exit or entry (no difficulties)
- perfect information (every buyer and every seller knows everything)
- firm is price taker (firm accepts the market price)
Perfect competition and the firm’s average and marginal revenues.
Buyers and sellers in the marketplace set
the price of £10.
� All firms can reasonably expect to sell
their profit-maximizing level of output at
the market price.
� Because the firm can sell all that it likes
at the current market price, there is no
reason to sell below the market price. So,
the firm faces a perfectly elastic demand
curve, because demand reacts instantly,
fully and perfectly to an increase or
decrease in the firm’s price.

16
Now: add the short-run average cost curves. � We want to know how much profit the firm would make.
Step 1: Firm maximizes profit: MC = MR
Step 2: What does it cost to produce the profit-maximizing output? Simply draw the line up from the
profit-maximizing output until it touches the short-run average total cost curve, SATC. Here: £8 per unit.
Step 3: What revenue will the firm earn by selling the profit-maximizing output? Simply draw the line up
from the profit-maximizing output until it touches the average revenue line, AR. Here: £10.
Step 4: Profit per unit = AR – AC, here: £10 - £8 = £2 per unit.
Step 5: Total profit = profit per unit x number of units produced. Or, the rectangle (rechthoek) defined
by AR – AC and the profit-maximizing output.
� This firm makes profit.
� The firm makes a loss in figure 5.9, loss will be equal to (AR-AC) x loss-minimizing output).
Short-term loss
17
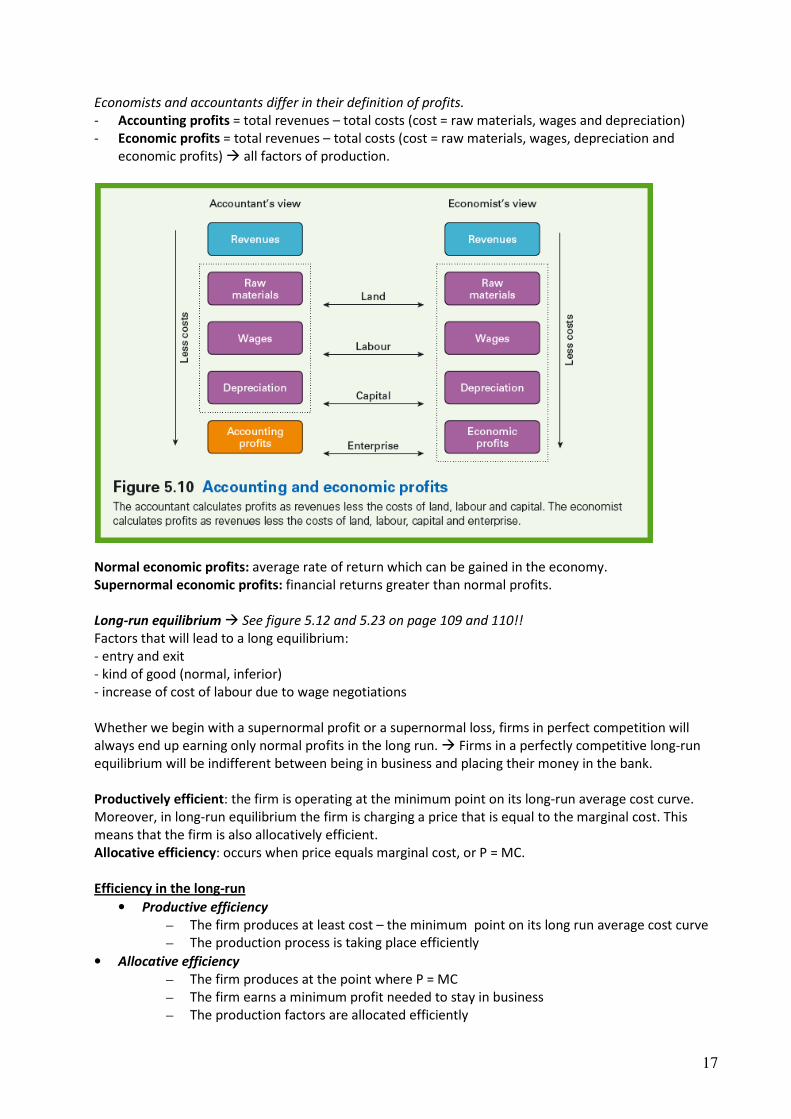
Economists and accountants differ in their definition of profits.
- Accounting profits = total revenues – total costs (cost = raw materials, wages and depreciation)
- Economic profits = total revenues – total costs (cost = raw materials, wages, depreciation and
economic profits) � all factors of production.
Normal economic profits: average rate of return which can be gained in the economy.
Supernormal economic profits: financial returns greater than normal profits.
Long-run equilibrium � See figure 5.12 and 5.23 on page 109 and 110!!
Factors that will lead to a long equilibrium:
- entry and exit
- kind of good (normal, inferior)
- increase of cost of labour due to wage negotiations
Whether we begin with a supernormal profit or a supernormal loss, firms in perfect competition will
always end up earning only normal profits in the long run. � Firms in a perfectly competitive long-run
equilibrium will be indifferent between being in business and placing their money in the bank.
Productively efficient: the firm is operating at the minimum point on its long-run average cost curve.
Moreover, in long-run equilibrium the firm is charging a price that is equal to the marginal cost. This
means that the firm is also allocatively efficient.
Allocative efficiency: occurs when price equals marginal cost, or P = MC.
Efficiency in the long-run
• Productive efficiency
– The firm produces at least cost – the minimum point on its long run average cost curve
– The production process is taking place efficiently
• Allocative efficiency
– The firm produces at the point where P = MC
– The firm earns a minimum profit needed to stay in business
– The production factors are allocated efficiently
18
5.5 Monopoly
- one firm supplies the market (or one firm controls more than 25% of the market)
- few (if there are any) close rivals
- large entry barriers
- firm is a price maker
Entry barriers:
• Licenses � a legal document giving official permission to do something (National Lotery, Railways).
• Patents � set of exclusive rights granted by a state to an inventor or their assignee for a limited
period of time in exchange for a public disclosure of an invention.
• Natural monopoly �scale economies lead to only one firm in the market, there is room for only one
firm (utility markets » water, gas, telecommunications).
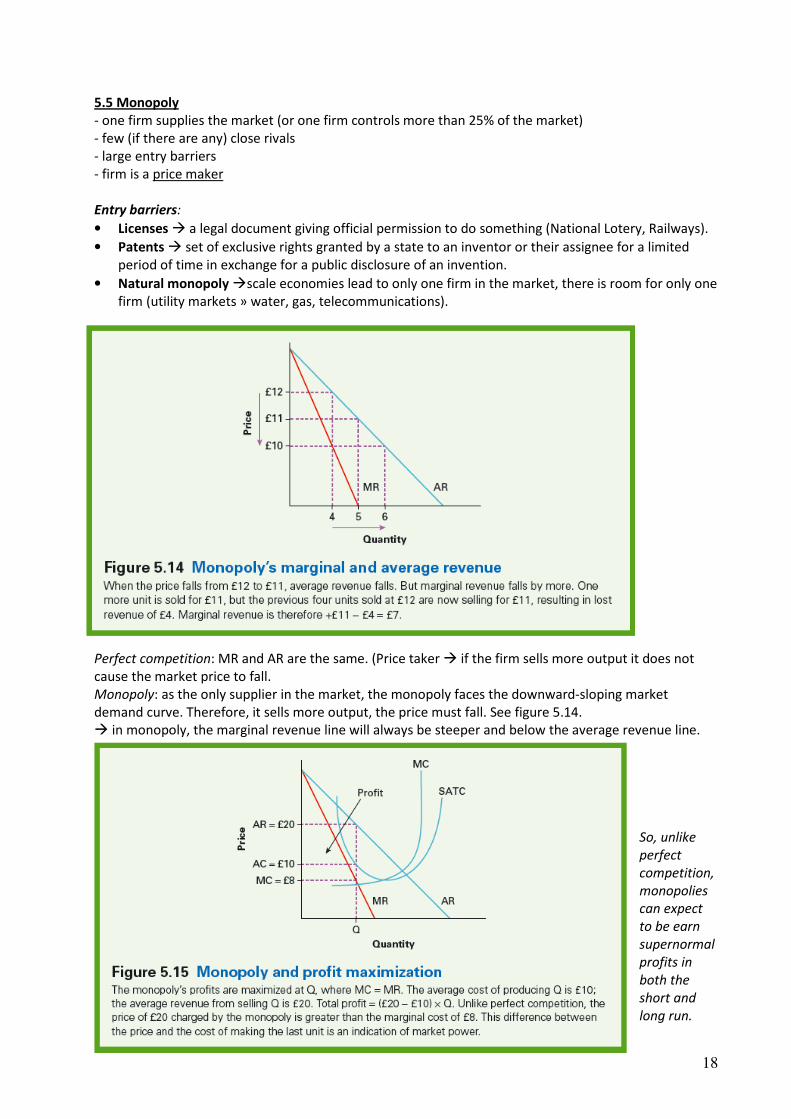
Perfect competition: MR and AR are the same. (Price taker � if the firm sells more output it does not
cause the market price to fall.
Monopoly: as the only supplier in the market, the monopoly faces the downward-sloping market
demand curve. Therefore, it sells more output, the price must fall. See figure 5.14.
� in monopoly, the marginal revenue line will always be steeper and below the average revenue line.
So, unlike
perfect
competition,
monopolies
can expect
to be earn
supernormal
profits in
both the
short and
long run.

19
Perfect competition and monopoly compared
• Customers in the market have not changed, so the demand curves or AR lines faced by the perfectly
competitive industry and the monopoly are identical.
• Marginal revenue lines are different. (Perfect competition: MR = AR, by monopoly not the case)
• Profit-maximizing output is Qpc and the price is sells for is PC. (Perfectly competitive industry)
• Profit-maximizing output is Qmp and the price is sells this output for is MP. (Monopoly industry)
• Move from perfect competition to monopoly � industry output drops and price increases.
• Perfect competition: price equals the industry’s marginal cost.
• Monopoly: price is higher than the industry’s marginal cost.
• � This difference between price and marginal cost in monopoly is known as ‘market power’ » the
ability to price above the cost of the last unit made.
Monopolies and economies of scale
Idea that monopoly would have the same cost curves as a perfectly competitive industry (as mentioned
above) neglects the points made in ch. 3 relating to economies of scale.
� see figure 5.17 on page 115
Creative destruction � occurs when a new entrant outcompetes incumbent (gevestigde) companies by
virtue of being innovative (op grond van innovatie). Benefits: higher profits for firm and society benefits
from the supply of new innovative goods and services.
Schumpeter: economic development is a process of creative destruction (new markets at the cost of old)
Monopolies foster this innovation process, but firms have to undertake expensive rent-seeking
behaviour (pursuit of supernormal profits; an economic rent is a payment in excess of the minimum
price at which a good or service will be supplied. They may not always be successful.
20
5.6 Business application: understanding the forces of competition
From business perspective: monopoly is preferable to perfect competition.
Porter’s five forces model � identifies the five key drivers of competition in an industry.
• Bargaining power of suppliers;
• Bargaining power of customers;
• Threat of entry;
• Threat of substitutes;
• Strategy and rivalry (or: Competition and rivalry).
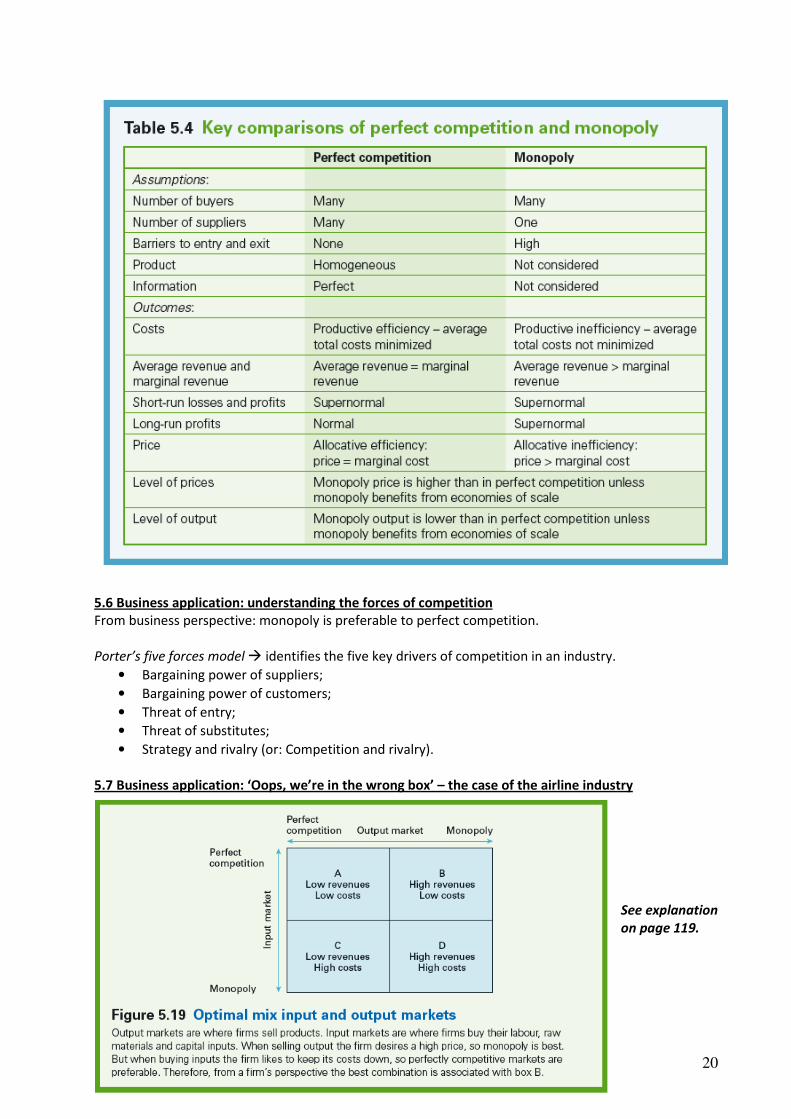
5.7 Business application: ‘Oops, we’re in the wrong box’ – the case of the airline industry
See explanation
on page 119.
21
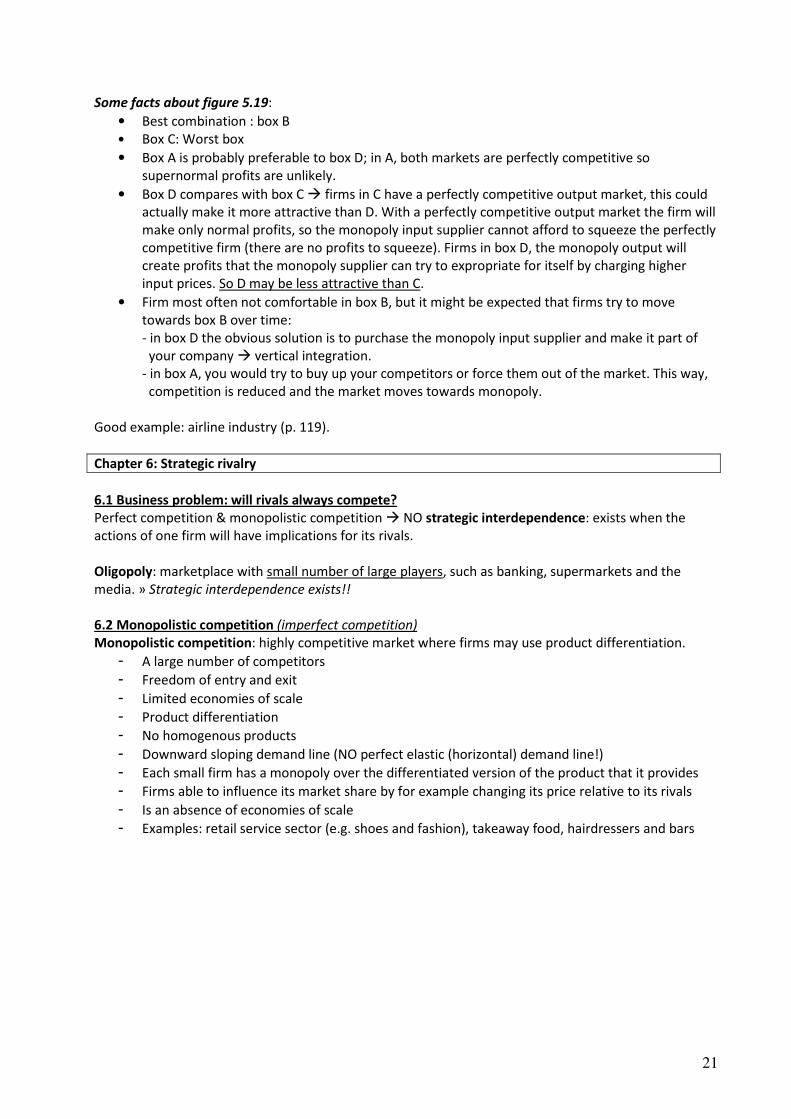
Some facts about figure 5.19:
• Best combination : box B
• Box C: Worst box
• Box A is probably preferable to box D; in A, both markets are perfectly competitive so
supernormal profits are unlikely.
• Box D compares with box C � firms in C have a perfectly competitive output market, this could
actually make it more attractive than D. With a perfectly competitive output market the firm will
make only normal profits, so the monopoly input supplier cannot afford to squeeze the perfectly
competitive firm (there are no profits to squeeze). Firms in box D, the monopoly output will
create profits that the monopoly supplier can try to expropriate for itself by charging higher
input prices. So D may be less attractive than C.
• Firm most often not comfortable in box B, but it might be expected that firms try to move
towards box B over time:
- in box D the obvious solution is to purchase the monopoly input supplier and make it part of
your company � vertical integration.
- in box A, you would try to buy up your competitors or force them out of the market. This way,
competition is reduced and the market moves towards monopoly.
Good example: airline industry (p. 119).
Chapter 6: Strategic rivalry
6.1 Business problem: will rivals always compete?
Perfect competition & monopolistic competition � NO strategic interdependence: exists when the
actions of one firm will have implications for its rivals.
Oligopoly: marketplace with small number of large players, such as banking, supermarkets and the
media. » Strategic interdependence exists!!
6.2 Monopolistic competition (imperfect competition)
Monopolistic competition: highly competitive market where firms may use product differentiation.
- A large number of competitors
- Freedom of entry and exit
- Limited economies of scale
- Product differentiation
- No homogenous products
- Downward sloping demand line (NO perfect elastic (horizontal) demand line!)
- Each small firm has a monopoly over the differentiated version of the product that it provides
- Firms able to influence its market share by for example changing its price relative to its rivals
- Is an absence of economies of scale
- Examples: retail service sector (e.g. shoes and fashion), takeaway food, hairdressers and bars

22
Demand curve depends upon the industry demand.
Supernormal profits (1) attract entry, which leads to a loss of market share and thus new demand (2).
Entry stops when each firm is breaking even (when new demand line, AR2, just touches the average cost
line, AC, at a tangent = raaklijn). Profit = (P1 – AC1) x Q1
Monopolistic long-run equilibrium has some important features:
1. The tangency equilibrium results in average costs being above minimum average costs.
Tangency equilibrium: occurs when the firm’s average revenue line just touches the firm’s
average total line (AR = ATC).
2. Long-run equilibrium in monopolistic competition doesn’t result in firms operating at minimum
average total cost � therefore, monopolistic competition is not productively efficient.
3. Firms in monopolistic competition operate with excess capacity � they could increase output
and reduce cost.
4. Monopolistic competition delivers greater choice for consumers.
» So, in assessing whether monopolistic competition is good or bad for society, it is necessary to consider
the gains from increased choice against the costs of excess capacity and inefficient production.
In long-run equilibrium: firms in monopolistic competition have some monopoly power because price
exceeds marginal cost. (Price > Marginal cost)
Firms in perfect competition: Price = Marginal cost � no market power.
6.3 Oligopoly theory: natural and strategic entry barriers
Oligopoly: marketplace with small number of large players, such as banking, supermarkets and the
media. » Strategic interdependence exists!!
- Each firm has a significant share of the total market
- Each firm faces a downward sloping demand curve
- Firms in oligopoly are price makers as opposed to price takers
- Use of non-price competition
- Large marketing and branding budgets
- Highly concentrated industries � competition is concentrated in a small number of competitors
- Examples: aircrafts manufacture, oil/gas industry, supermarkets, banks.
23
N-firm concentration ratio (CR): a measure of the industry output controlled by the industry’s N largest
firms.
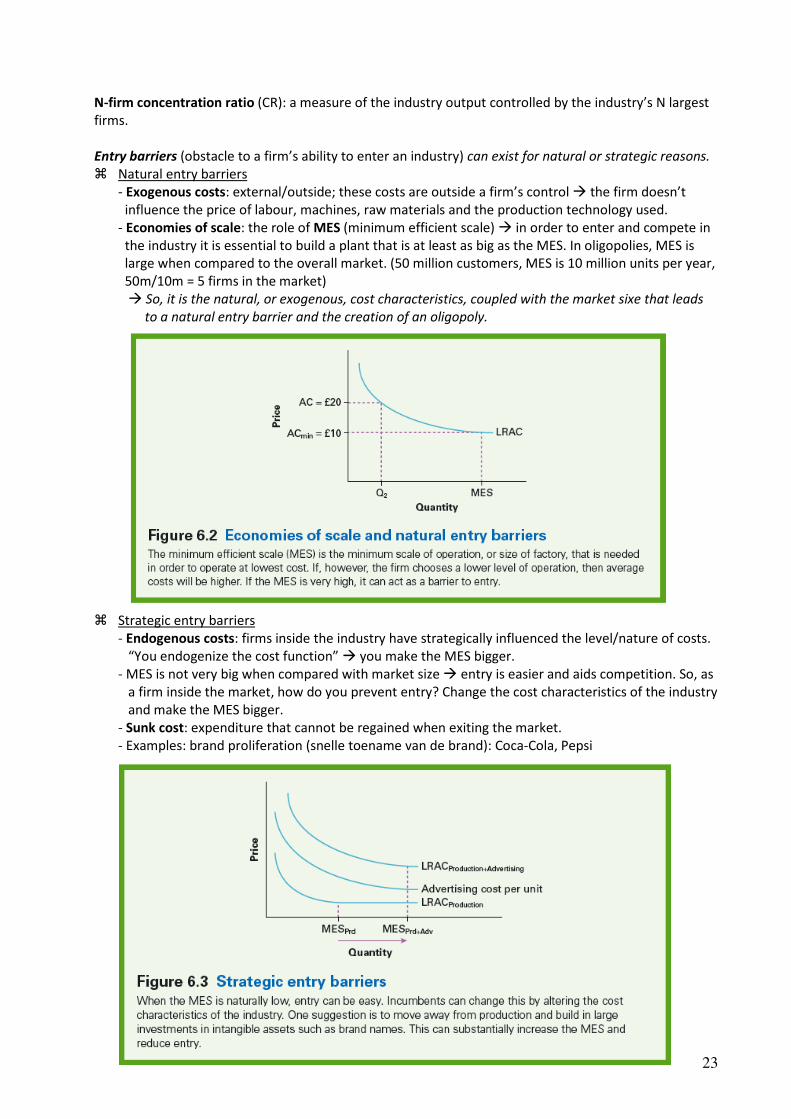
Entry barriers (obstacle to a firm’s ability to enter an industry) can exist for natural or strategic reasons.
� Natural entry barriers
- Exogenous costs: external/outside; these costs are outside a firm’s control � the firm doesn’t
influence the price of labour, machines, raw materials and the production technology used.
- Economies of scale: the role of MES (minimum efficient scale) � in order to enter and compete in
the industry it is essential to build a plant that is at least as big as the MES. In oligopolies, MES is
large when compared to the overall market. (50 million customers, MES is 10 million units per year,
50m/10m = 5 firms in the market)
� So, it is the natural, or exogenous, cost characteristics, coupled with the market sixe that leads
to a natural entry barrier and the creation of an oligopoly.
� Strategic entry barriers
- Endogenous costs: firms inside the industry have strategically influenced the level/nature of costs.
“You endogenize the cost function” � you make the MES bigger.
- MES is not very big when compared with market size � entry is easier and aids competition. So, as
a firm inside the market, how do you prevent entry? Change the cost characteristics of the industry
and make the MES bigger.
- Sunk cost: expenditure that cannot be regained when exiting the market.
- Examples: brand proliferation (snelle toename van de brand): Coca-Cola, Pepsi

24
Contestable: A market where firms can enter and exit a market freely. (Without sunk costs: contestable
markets). These markets, even with oligopolistic structures, only produce normal economic profits.
� Examples: airline industry (airline can quickly and easily move the aircraft to the most profitable
route).
6.4 Oligopoly theory: competition among the big ones
Profit-maximizing monopoly: only operate in the price-elastic region of its demand curve. MC has to be
positive. If profits are maximized when MC = MR , then, because MC is positive, MR must also be
positive. If marginal revenue is positive, reducing the price to sell one more unit has made a positive
contribution to total revenue.
See figure 6.4: “Collusion versus competition” on page 133!!
Collusion (= geheime verstandhouding) is likely to fail when there is:
• a large number of firms;
• product differentiation;
• instability in demand and costs (if the equilibrium (=evenwicht) is changing frequently, then the
cartel has frequently to adjust its agreed prices, it is costly to co-ordinate and the variation in
market conditions provides firms with the cover needed to cheat and not get caught).
Example: OPEC, which meets on a frequent basis to agree oil production levels for all member countries.
6.5 Competition among rivals
Kinked demand curve: price rises will not be matched by rival, but price reductions will be.
The curve is often used to explain the pricing behaviour of competing petrol stations. It is only when the
price of oil changes that all petrol stations move prices together.
Marginal revenue line is vertical at profit-maximizing output � because demand curve changes slope at
this output level. The demand curve has a different shape above and below the current market price:
1. Firm raises its price � rivals keep price constant � firm loses customers � demand above the
current market price is elastic
2. Firm reduces its price � rivals will match the price reduction � firm will not gain more demand
by reducing prices � demand below the current market price is inelastic.
25
Positive features of the kinked demand curve:
• Demand curves are based on potential or expected responses from the firm’s rivals � strategic
interdependence;
• Model predicts stability in pricing.
Negative features of the kinked demand curve:
• It doesn’t explain how the stable price is arrived at in the first place, therefore we need an
approach that understands strategic interdependence more fully (� game theory).
Forms of collusion
• Informal ‘meeting of minds’
• Informal collusive behaviour
– price leadership
– open-price systems and market information
– tacit agreements to divide the market
• Formal collusive behaviour
– written price agreements
– agreements on other dimension (e.g. quantity)
– cooperative and concentrative joint ventures
• Cartels: all collusion that is forbidden by law
Competition policy in general
• Goals of competition policy
– protection of consumers and welfare increase
– redistribution of business income in the market
– protection of SMEs against ‘big business’
• Character of competition policy
– combination of economics, law and ideology
– ‘negative’ policy: prevention of behaviour
• Background: Sherman Act (1890)
– ‘anti-trust’ as starting point for competition policy
European cartel policy
• Every form of cooperation is suspicious
• Basic rule: art. 81 [85] EC Treaty → effect
– every agreement/decision/action forbidden
– adverse influence on trade and competition
• Exemptions and dispensations
– cooperation that is beneficial for EU-market
• Fines by European Commission
– first case: Grundig Consten (1964)
– classic case: Volkswagen (1998)
European market power policy
• Firms are not allowed to abuse market power
• Basic rule: art. 82 [86] EC Treaty → effect
– abuse of power in the market is forbidden
• Commission has to prove two elements
– relevant market: product, place and time in EU
– abuse of market power: disturbance of competition and market structure
• Fines by European Commission
– first case: United Brands (1978) & classic case: Irish Sugar (1997)
26
Example: Dutch competition policy
• From abuse to prohibition system
– for a long time ‘NL = Paradise for Cartels’
– WEM: everything allowed, unless…
– Mededingingswet (’98): nothing allowed, unless…
• Implementation of law by NMA
– inspiration by European case law
– economic interpretation of rules
• NMA as a supervisor of the market
– example: cartels in building sector
6.6 Game theory
Game theory: seeks to understand whether strategic interaction will lead to competition or co-
operation between rivals. In business sense; we could have two firms (players): they could start a price
war and compete against each other or they could try to co-operate with each other (strategic options).
Each combination has different profit outcomes (pay-offs) for the two firms.
Axelrod: The Evolution of Cooperation
- rational behaviour
- action → reac`on
Characteristics of a game
- players
- payoffs
- strategic options
- a number of rounds, single or multi-period
Used by military strategists, economists and biologists to analyze strategic behaviour
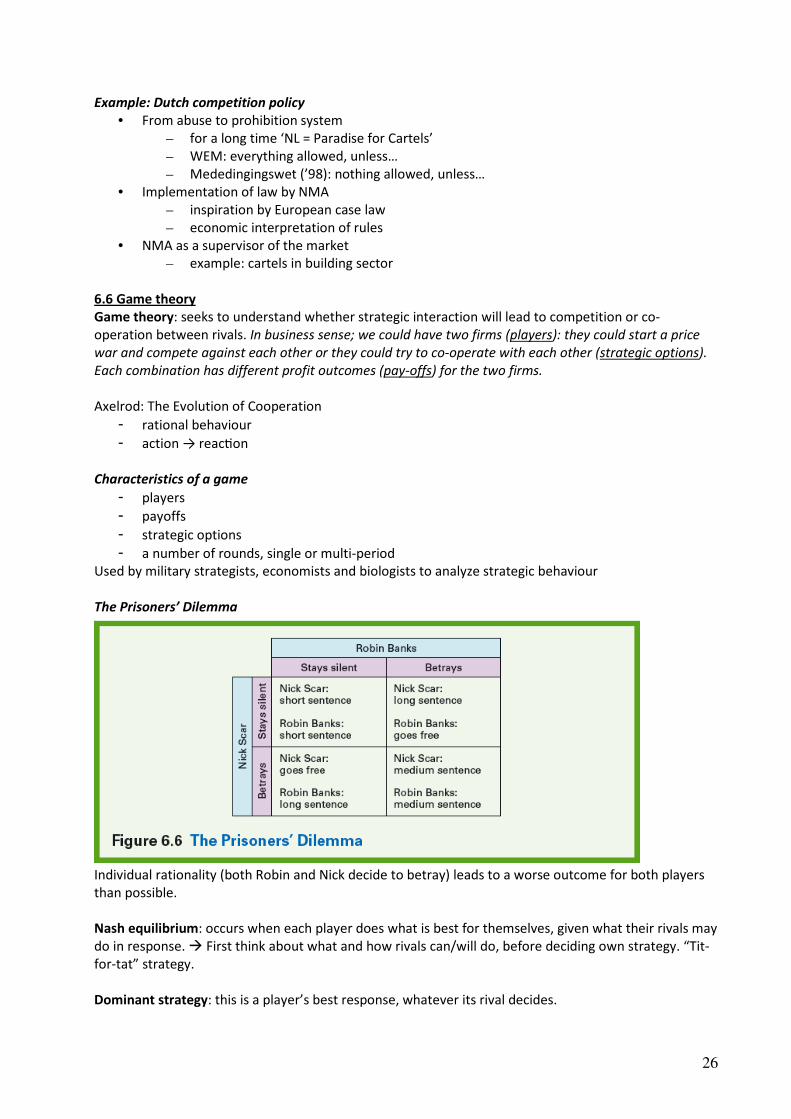
The Prisoners’ Dilemma
Individual rationality (both Robin and Nick decide to betray) leads to a worse outcome for both players
than possible.
Nash equilibrium: occurs when each player does what is best for themselves, given what their rivals may
do in response. � First think about what and how rivals can/will do, before deciding own strategy. “Tit-
for-tat” strategy.
Dominant strategy: this is a player’s best response, whatever its rival decides.

27
Single-period game: game is only played once. In a repeated game, the game is played a number of
rounds. Rule: whenever you play a game once, as our rivals did in figure 6.6, or strategically interact with
someone once, then cheat!
Credible commitment (threat): has to be one that is optimal to carry out.
Thus: Will firms compete or cooperate?
- each firm considers what its rivals can do before deciding on its own strategy
- due to a lack of trust the dominant strategy for both A and B is to start a price war
- the likely result is called a Nash equilibrium
each firm will make an optimal choice given the potential response of its rivals (30:30)
- conclusion: own interests stronger than common interests
Strategic decisions require an understanding of the potential responses. If a firm, or individual, plays a
game once, they should cheat. If they play repeatedly, then they should try to co-operate for as long as
their rivals co-operate.
6.7 Game theory extensions: reaction functions (vanaf deze paragraaf, geen info in slides)
Residual demand = market demand – amount produced by the firm’s rivals
Cournot model: in such a model, each firm treats its rival’s output as a given.
Bertrand model: in such a model, firms treat the prices of rivals as given. The Nash equilibrium for a
Bertrand game has both firms charging a price equal to marginal cost.
Since the Bertrand model predicts a perfectly competitive outcome for a duopoly, economists tend to
prefer the output-based approach on the Cournot model.
Reaction function: shows that a firm’s profit-maximizing output varies with the output decision of its
rival. It illustrates a firm’s best response given the possible responses of its rival.
First mover advantage: ensures that the firm which makes its strategic decision first gains a profitable
advantage over its rivals. It can be examined using a Stackelberg model, which is similar to the output
approach of Cournot, but firms do not make strategic decisions simultaneously (tegelijk).

28
6.8 Auction theory (veiling)
Four auction formats:
1. English auction � bids begin low and are increased incrementally until no other bidder is willing
to raise the bid.
2. Dutch auction � prices start high and are gradually reduced until a bidder accepts the price and
wins the auction (to sell flowers and agricultural produce).
3. Firs-price sealed-bid auction � bidders must submit a single bid, usually in writing. Bidders have
little idea what anyone else has bid; and the highest bidder wins.
4. Second-price sealed-bid auction � bids are submitted in writing, but the highest bidder pays
the price of the second-highest bid.
Private values: each bidder has a private, subjective, value of an item’s worth. Value of an item differs
across the bidders. All four auction formats enable the bidder with the highest willingness to pay to win
the auction. But they only pay the second-highest price � ‘revenue equivalence’ states that under
private values each auction format will generate the same level of revenue for the seller.
Common values: the value of the item is identical for all bidders, but each bidder may form a different
assessment of the item’s worth. Bidders face the problem of the winner’s curse, where the highest
willingness to pay vastly exceeds the intrinsic value of the item.
To avoid conservative bidding under the winner’s curse, an English auction format provides bidders with
clearer information on the item’s true value.
Winner’s curse: is where a winning bid exceeds the true value of the sale item.
See the analysis of bidding behaviour in each auction format under which bidders have private values on
page 143!!
6.9 Business application: compete, co-operate or gain a first-mover advantage?
-
6.10 Business application: managing supply costs – anonymous auctions for supermarket contracts
In the repeated environment of firms bidding for supermarkets’ own-label contracts, it is likely that co-
operation will occur, where rivals agree not to undercut each other on price. In order to prevent this and
generate competition in the auction, supermarkets run blind auctions, where it becomes difficult for
rivals to co-ordinate their bids. It even enables rivals to cheat on each other behind a cloak of secrecy.
Chapter 7: Growth strategies
7.1 Business problem: how should companies grow?
Organic growth: increase in sales from the same or comparable retail space.
- Market with rapidly expanding demand � organic growth can be very sustainable.
- Mature market (supermarkets) � organic growth can be slow and limited to the rate of growth
of consumer spending on food and other grocery items.
Organic growth can be reduced by competition.
Horizontal growth: occurs when a company develops or grows activities at the same stage of the
production process. � Merging two similar companies. (KLM with airFrance)
Diversification: the growth of the business in a related or unrelated market. � Firm moves into another
market, ‘off-growing’. (Tesco operates in grocery, banking, electronics and food)

29
Vertical chain of production: encapsulates the various stages of production from the extraction of a raw
material input, through the production or service, to the final retailing of the product. � Vertical growth
occurs along the value chain. It’s still in the value chain. (Del Monte (apple brand) » bought the producers
of for example pineapples » Sourcing, producing, distributing and retailing)
- Backward/forward integration
Vertically integrated: seeking to gain greater control over its value chain � firm owns consecutive
stages of the vertical chain.
7.2 Reasons for growth
Assumption: Firms are in business to maximize profits.
If a firm is a profit-maximizer, then the pursuit of growth opportunities is arguable linked to either
revenue or cost improvements. As revenue increases and costs are reduced, the profitability at each level
of output is improved.
7.3 Horizontal growth
� expansion at a singular point on the vertical chain.
� Organic (firms growing through internal expansion � supermarket might build more outlets)
� Merger (two companies agreeing by mutual consent to merge their existing operations � KLM
with AirFrance, balances 50/50 basis)
� Acquisition (one firm buy another firm � SABMiller bought Grolsch)
Advantages of growth
- Revenue advantages
Demand elastic: small price change results in huge change in demand.
Demand inelastic: price reduction will not have a significant impact on demand. Total revenues
will decline. Thus: optimal response under price-inelastic demand is to raise prices in order to
boost total revenues.
- Reduced competition enabling price rises
Due to merger of acquisition: number of competitors in the market is reduced by one.
Merger/acquisition � less substitutes � reducing of elasticity of demand � competition is
reduced � price wars are less likely � firms have more scope for increasing prices.
- Market growth, which enables a firm to exploit a growing market
Growing demand � stimulate organic growth � more customers move into a market � firm
can exploit increased revenue opportunities by investing in more productive assets.
Cost advantages of horizontal growth
- Rationalization: cutbacks in excess resources to achieve increased operational efficiency.
E.g.: Grolsch bought by SABMiller, and now after three years, the SABMiller policy is part of
Grolsch company and about 90 people will be fired � increase of cost)
� Two companies need two chief executives; one company needs only one chief executive.
Same goes for: finance, legal, marketing and HRM departments; one company needs only one of
each.
Other example: EasyJet (you have to buy your own paper bin at your office)
30
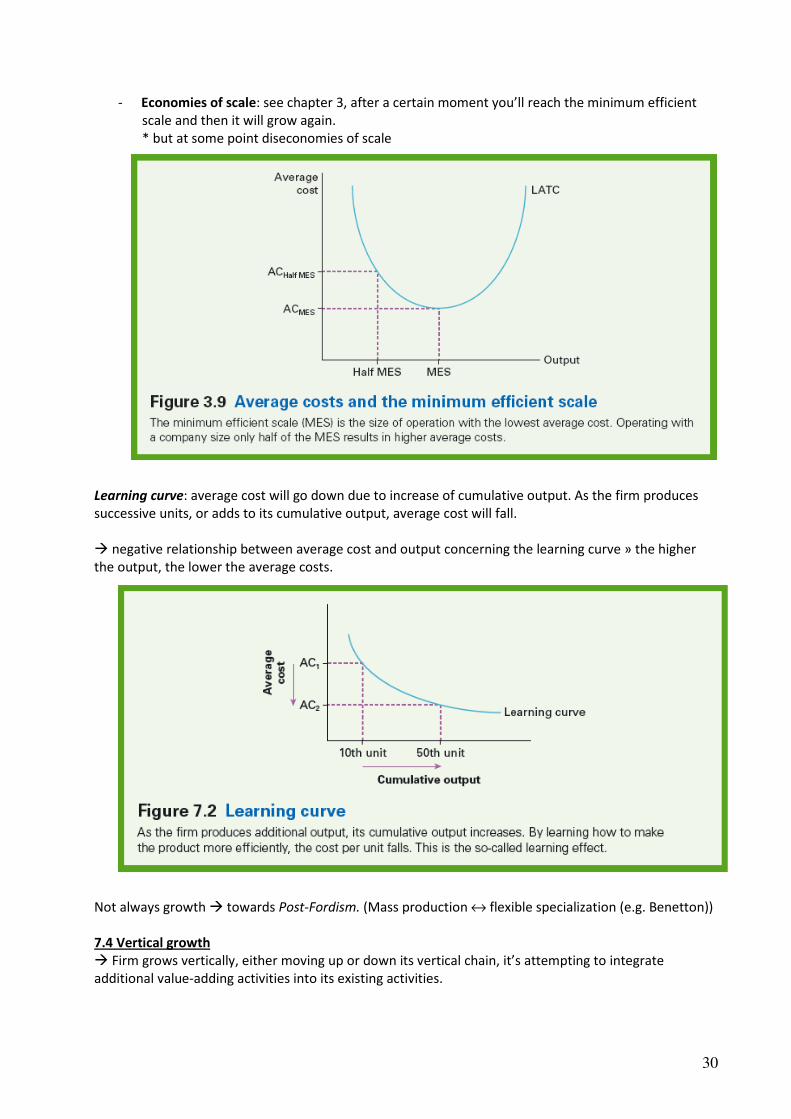
- Economies of scale: see chapter 3, after a certain moment you’ll reach the minimum efficient
scale and then it will grow again.
* but at some point diseconomies of scale
Learning curve: average cost will go down due to increase of cumulative output. As the firm produces
successive units, or adds to its cumulative output, average cost will fall.
� negative relationship between average cost and output concerning the learning curve » the higher
the output, the lower the average costs.
Not always growth � towards Post-Fordism. (Mass production ↔ flexible specialization (e.g. Benetton))
7.4 Vertical growth
� Firm grows vertically, either moving up or down its vertical chain, it’s attempting to integrate
additional value-adding activities into its existing activities.

31
Cost reasons
- Location benefit � can reduce production costs (e.g. in steel production (steel smelting plants
are often located next to steel rolling plants, no transport and heating cost))
- Economies of scale � refers to the cost advantages that a business obtains due to expansion
(schaalvoordelen: schaal neemt toe, voordeel neemt ook toe)
- Escaping problems from monoploy � purchase the monopoly supplier of raw materials and
transfer the raw material between divisons of the same company. Optimal price is marginal cost
of production.
- Guaranteeing constant quality (e.g. Albert Heijn’s ‘house brands’ Delicata and Perla)
Transaction costs: costs associated with organizing the transaction of goods or services, transaction is
the unit of analysis. It has to do with contact, contract and control. (Complete and incomplete contracts)
Production costs: costs of the factor resources – land, labour, capital and enterprise.
Complete contract: all aspects of the contractual arrangement are fully specified.
Transaction costs will increase due to:
- Higher asset specificity (≈ sunk costs � special type of investments, they have no return » you
invest in something, and you don’t need it anymore, then the investment is a sunk cost).
- Higher complexity of the transaction
- Higher uncertainty of the environment
Reduction of transaction costs: Make or Buy?
Nexus of contracts: a collection of interrelated contractual relationships, where the firm represents a
nexus or central point, at which all these interrelated contractual relationships are managed in the
pursuit of profit.
Market in one hand, integration in the other and in
between there are all networks with several
companies, etc. Mechanisms are the price, trust and
hierarchy, these relate to the market, networks and
integration.
Low complexity � transaction
Low uncertainty � environment
Example: outsourcing food or cleaning department
at university or hospital.
Integrate in market � make use of outsourcing.

32
The Hold Up problem � the renegotiation of contracts by the buyer of specific assets
» A kind of ‘economic hostage’.
» Example: ‘Lopez-fever’ at Volkswagen (they putting the supplier under the pressure, and the
supplier can’t do anything else)
It is a situation where two parties (such as a supplier and a manufacturer or the owner of capital and
workers) may be able to work most efficiently by cooperating, but refrain from doing so due to concerns
that they may give the other party increased bargaining power, reduce their own profits.
Asset specificity �asset has a specific use:
- firm specific vs. general assets
- specific assets do have few alternative uses
- example: nails vs. specialized production line
Firms will grow vertically up or down the vertical chain if the transaction costs of operating through the
market are too high. By internalizing, or making the value-adding product or service inside the company,
the firm will attempt to control its transaction costs more effectively.
7.5 Diversified growth
A company expands its operations into related or unrelated markets � growing in all kind of businesses.
Why? Cost reason: Economies of scope: are said to exist if the cost of producing two or more outputs
jointly is less than the cost of producing the outputs separately. Cost (A) + Cost (B) > Cost (A+B)
Example: news gathering services of the BBC � by centralizing news gathering, BBC avoids duplication
and exploits economies of scope.
Related diversification
� building on the firm’s core competences (BMW with his mobile and flexible mission, are the core
competences of BMW)
EasyJet, but also: EasyOffice, EasHyotel, EasyCinema, EasyCruise � cheap and basic (are core
competences of EasyJet)
Unrelated diversification (conglomeration)
� no relationship with the firm’s core competences (CEO loves cookies, thus also invest in a factory for
making cookies, nothing to do with the original company)
Risk reduction:
- diversified portfolio of activities (contains a mix of uncorrelated business operations)
- uncorrelated business activities
- off-setting income streams between BU’s
This is also true for regional economies
- from monostructure towards diversified structure
- e.g. Ruhr Area, Twente and Nord-Pas-de Calais
7.6 Evidence on mergers
How improve mergers of all types firm-level performance? � Economist have used a variety of
techniques:
- stock market studies
- financial ratio analysis
- case studies
Mergers are not always a good idea!

33
7.7 Business application: horizontal growth by merger
Economy grows rapidly: firms see merger as exploiting growth while achieving economies of scale.
Economy in recession: merger and economies of scale offer valuable cost-efficiencies.
By merging, firms can achieve a competitive advantage which other competitors may find difficult to
replicate. Economies of scale provide cost savings and provide the firm with the potential to dominate.
7.8 Business application: vertical growth – moving with the value
Costs fall (or revenues rise) � one part of the chain becomes more valuable. Similarly, as costs rise (or
revenues fall), then another part of the chain becomes less valuable.
Understanding the sources of value and questioning where value will be derived from in the future are
critical aspects of ensuring ongoing profitability.
7.9 Business application: economies of scope
Economies of scope are conceptually similar to economies of scale. Whereas 'economies of scale' for a
firm primarily refers to reductions in average cost (cost per unit) associated with increasing the scale of
production for a single product type, 'economies of scope' refers to lowering average cost for a firm in
producing two or more products.
E.g. Google is everywhere and offering everything. The range of services now offered by Google simply
reflects economies of scope – the ability to provide services jointly at a lower cost than offering each
separately.
Diversification can sometimes be understood as a process of exploiting economies of scope, i.e. where a
firm uses an asset that it has developed in its current operations to exploit opportunities in another
market.
If diversification is pursued in an attempt to create a portfolio of activities, then the firm’s overall
financial risk might be reduced. However, it is questionable whether such strategies add value for
shareholder who may already hold a diversified portfolio of shares in many different companies.
Diversification is more likely to reduce the non-diversified employment risks faced by managers.

34
Extra materials from slides
The Concept of Clustering (Porter, 1990)
Clusters:
- geographical concentrations of business activity (bloemen in NL, voornamelijk in het westen)
- horizontal and vertical cooperation in a sector
- examples: wine making around Bordeaux and machines, metal and automotive in Bavaria
Competitiveness: Porter’s Diamond
The model is a kind of summary of what we’ve done this week, a lot of concepts in this model!
Chapter 8: Governing business
8.1 Business problem: managing managers
‘The principal-agent problem’ � A principal is a person who hires an agent to undertake work on their
behalf. Example: taxi driver; you may wish to be driven between two points using the shortest route. In
contrast, the taxi driver may wish to take you via a much longer route, hoping to generate a higher fare.
Hence, there is a difference in interest between you, as the principal, and the taxi driver, as the agent.
Economists describe the manager as displaying moral hazard-type behaviour � moral hazard occurs
when someone agrees to undertake a certain set of action but then, once a contractual arrangement has
been agreed, behaves in a different manner.
Agency costs: reflect reductions in value to principals from using agents to undertake work on their
behalf. (In case of taxi-driver, agency costs are very low).
Opportunistic Behaviour
• Assumption: information asymmetry
• Adverse selection: hidden characteristics
35
- opportunism before the conclusion of a contract
- e.g. ‘lemons’ in car and insurance market
• Moral hazard: hidden actions
- opportunism after the conclusion of a contract
- e.g. claiming holiday damage that did not occur
8.2 Profit maximization and the separation of ownership from control
Maximize profits: MC = MR.
Background: Berle and Means (1932)
- lack of trust with regard to ‘big business’
- control of firms ≠ ownership of firms
- differences in interest between parties
Separation of ownership from control: exists where the shareholders, who own the company, are a
different set of individuals from the managers that control the business on a day-to-day basis.
� Managers control, but shareholders own!
Dispersed shareholdings lead to free rider behaviour � bad management can stay.
Free riders: are individuals, or firms, who can benefit from the actions of others without contributing to
the effort made by others. They gain benefits from the actions of others for free.
Alternative Managerial Objectives � alternative objectives that managers might pursue.
• Consumption of perquisites
- expense preference behaviour
- e.g. luxury cars, lavish offices, entertainment budgets, etc.
- i.e. ‘consumption on the job’
• Sales maximisation
- sales are a sign of success (‘if sales are increasing, then so are profits’)
• Growth maximisation
- pay of managers is more strongly linked with size of firm than with performance (‘the bigger
the company, the greater the responsibility’)
Behavioural Theories � how do people behave inside firms?
• There is more than profit maximization…
• Consequently: behavioural theories
- Goal setting: the most powerful can set the firm’s goals (Cyert and March)
- Target setting: “satisficing” behaviour rather than maximization (Simon)
Satisficing: the attainment of acceptable levels of performance. Maximizing is the attainment of
maximum levels of performance. For example, 20 per cent annual growth in sales could be the maximum
possible. But a 10 per cent growth in sales would be acceptable, especially if other firms or organizations
were achieving similar results; 10 per cent represents a satisfactory level of performance. If managers
negotiate a 10 per cent target growth rate, rather than a 20 per cent target, they are displaying
satisficing rather than maximizing behaviour.
8.3 Principal-agent theory
A principal hires another person, the agent, to carry out work on their behalf. Shareholders are
principals when they employ managers, the agents, to run their companies.
Assumptions: contractual relationship & both parties strive for maximum utility.
Relationship principal-agent: asymmetric information & contrast of interests
36
Agency costs between managers and shareholders
Small company � owner and manager are most often same person � no misalignment of interests.
Large company (growth due to more shareholders) � original owner will still manage the company, but
the new shareholder will just be an owner, not a manager.
Agency costs
• Principals hire agents
• Agents may either lie (adverse selection) or not work in the interests of principals (moral hazard)
• Result: creation of agency costs
- monitoring costs: principal has to monitor what the agent does
- bonding costs: agent has to bond principal
- residual loss: the costs associated with the underperformance by the agent
Example about agency costs:
� Consider a company with an owner-manager
Profits £100,000
Owner-Manager buys car £30,000
Dividend = £100k-30k = £70,000
Manager, in total, receives £100,000
� Consider a company with two shareholders, one owner-manager
Profits £100,000
Owner-Manager buys car £30,000
½ Dividend=0.5(£70k) £35,000
Owner-Manager receives £65,000
Shareholder2 receives ½ dividend £35,000
Agency cost = £50k-£35k= £15,000
The share in the company’s value is not £50k, but £35k, i.e. the more consumption on the job, the lower
value of the company
Agency costs arises because the interests of the owner-manager are different from those of the other
shareholder; and because the owner-manager is not monitored on a daily basis. It is, therefore, possible
to use the company’s money to fund benefits for the owner-manager at the expense of the remaining
owner.
Agency costs between workers and managers � agency costs can also occur when managers employ
workers to do work for them.
8.4 Business application: stock options and the reduction of agency costs
In order to reduce agency costs, principals have to develop contracts that align agents’ interests with
their own � by making managers shareholders.
Examples: piece rates & stock options
• Piece rates: occur when a worker is paid according to the output produced. Under hourly wage
rates, workers are paid for time at work.
• Stock options: provide individuals with the option to buy shares in the future at a price agreed in
the past. � link of managers’ and shareholders’ interests via the share price.
Performance contracts help to resolve the principal-agent problem. Incentive contracting works best if:
- Workers accept the contracts, receiving greater rewards for higher risks
- There is a link between worker effort and the performance measure
- The performance can be coordinated across a number of objectives
- Workers cannot unduly influence the measure (See page 183/184)
37
Individuals can be risk averse (afkerig), risk neutral or risk seeking.
Managers propose contracts to shareholders. It is then shareholders who reject or accept the proposed
financial terms for the executive(s). � Most often a problem, why?
1. Managers are defining pay and performance � achieved through the company’s
remuneration committee; remuneration committee’s targets will be satisficing, not
maximizing, targets.
2. Due to separation of ownership from control, once the executive(s) package is proposed, the
dispersed nature of the shareholdings may lead to free riding among the shareholders,
making a majority vote against the executive(s) financial terms difficult.
8.5 Regulation of business
Perfectly competitive market: Pareto efficiency � no one can be made better off without making some
other people worse off. Therefore, the wellbeing of society is at a maximum.
Perfect competition firms…
- operate at the minimum point on their long-run cost curves;
- are productively efficient (highest level output/lowest amount of cost);
- price equals marginal cost;
- input resources are allocated efficiently;
� goods that consumers desire are the ones that are made and, they are made at the lowest cost.
Market failure: all circumstances in which the market equilibrium is not efficient, non-Pareto efficient
market outcomes stemming from:
- Externalities � can lead to difference between interests of private individuals and society and an
inefficient production or consumption of goods and services from the perspective of society.
- Monopoly
Public policy to correct market failure, however, sometimes also government failure.
8.6 Externalities
Externalities occur when the production or consumption of a good or service results in costs or benefits
being passed onto individuals not involved in the production or consumption of that good or service .
� Are the effects of consumption or production on third parties.
Negative externalities: costs are passed (afgewenteld) on to society, or benefits are reduced � reduces
well-being of third parties.
Positive externalities: costs to society are reduced or benefits are enhanced (versterkt) � improves
well-being of third parties.
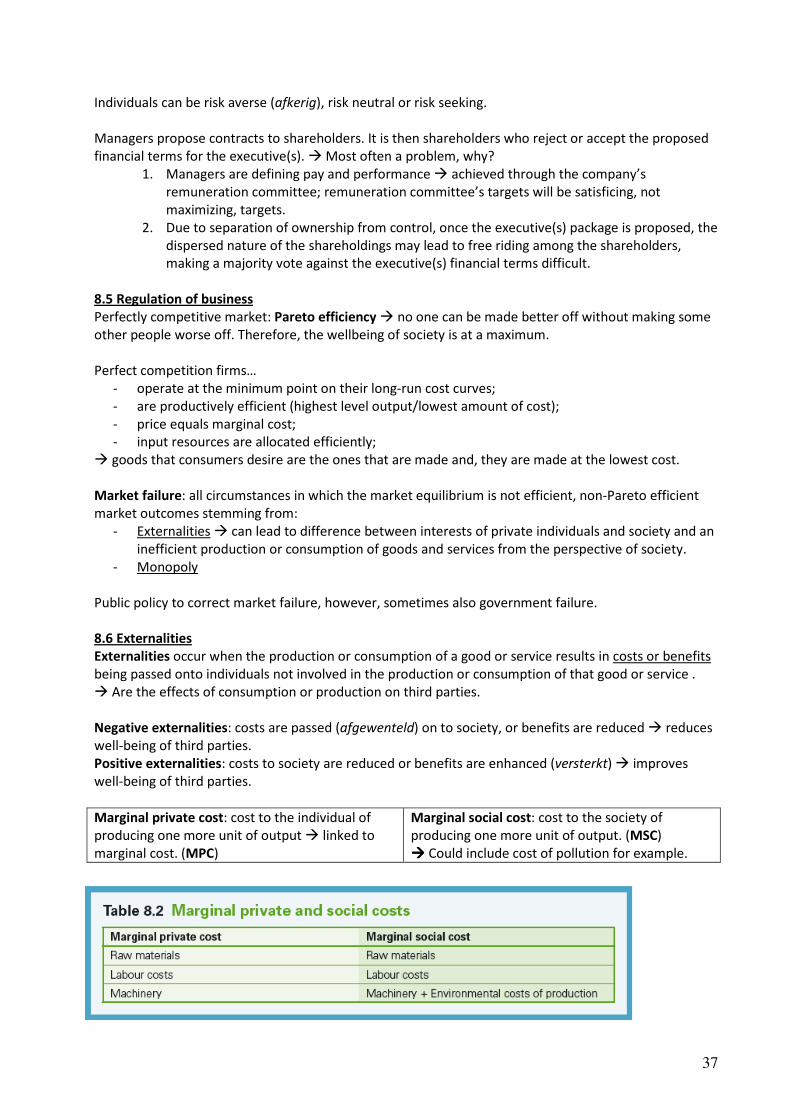
Marginal private cost: cost to the individual of
producing one more unit of output � linked to
marginal cost. (MPC)
Marginal social cost: cost to the society of
producing one more unit of output. (MSC)
���� Could include cost of pollution for example.
38
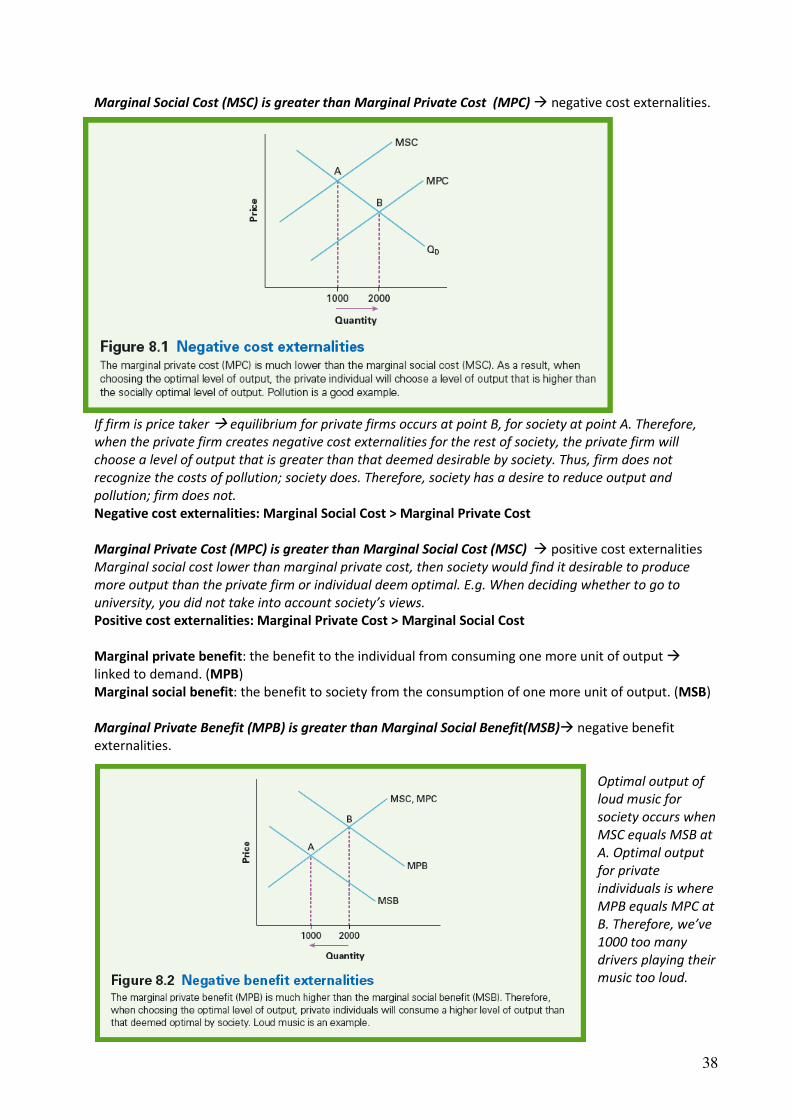
Marginal Social Cost (MSC) is greater than Marginal Private Cost (MPC) � negative cost externalities.
If firm is price taker � equilibrium for private firms occurs at point B, for society at point A. Therefore,
when the private firm creates negative cost externalities for the rest of society, the private firm will
choose a level of output that is greater than that deemed desirable by society. Thus, firm does not
recognize the costs of pollution; society does. Therefore, society has a desire to reduce output and
pollution; firm does not.
Negative cost externalities: Marginal Social Cost > Marginal Private Cost
Marginal Private Cost (MPC) is greater than Marginal Social Cost (MSC) � positive cost externalities
Marginal social cost lower than marginal private cost, then society would find it desirable to produce
more output than the private firm or individual deem optimal. E.g. When deciding whether to go to
university, you did not take into account society’s views.
Positive cost externalities: Marginal Private Cost > Marginal Social Cost
Marginal private benefit: the benefit to the individual from consuming one more unit of output �
linked to demand. (MPB)
Marginal social benefit: the benefit to society from the consumption of one more unit of output. (MSB)
Marginal Private Benefit (MPB) is greater than Marginal Social Benefit(MSB)� negative benefit
externalities.
Optimal output of
loud music for
society occurs when
MSC equals MSB at
A. Optimal output
for private
individuals is where
MPB equals MPC at
B. Therefore, we’ve
1000 too many
drivers playing their
music too loud.

39
Example: If you consider advertising, the private benefits for firms are (they hope) increased sales. The
benefits for consumers in society are improved information about what products are available, where
they can be sourced and at what prices. � MPB > MSB.
Negative benefit externalities: Marginal Private Benefit > Marginal Social Benefit
Marginal Social Benefit (MSB) is greater than Marginal Private Benefit (MPB) � positive benefit
externalities.
In such a case, society gains more than a private individual from consumption. Example: vaccination. An
individual gains health benefits from being vaccinated against a disease. However, society gains more,
because the individual is both likely to be more healthy and less likely to pass on the disease to other
individuals.
Positive Benefit Externalities: Marginal Social Benefit > Marginal Private Benefit
8.7 Dealing with externalities
Problem with an externality: pricing mechanism doesn’t impose the costs, or benefits, on the correct
individuals. (E.g. smokers and non-smokers) � solution: taxes or subsidies.
Taxation
- Raises the marginal private cost
- Should lower output
Here: marginal social cost is greater than marginal private cost, the case of river pollution by a firm.
Society views 1000 units of output as efficient; the firm would rather produce 2000 units of output.
Problem is that marginal private costs are different from marginal social costs. So, the obvious solution is
to make MPC and MPS equal. This is achieved by taxing the firm for polluting the river, or environment.
This adds to the firm’s costs and, optimally, the tax will be equal to the difference between the MPC and
MSC. The imposition of the pollution tax provides firms with an incentive to cut output and move from
point B to point A, thus lowering output to the socially optimum level.
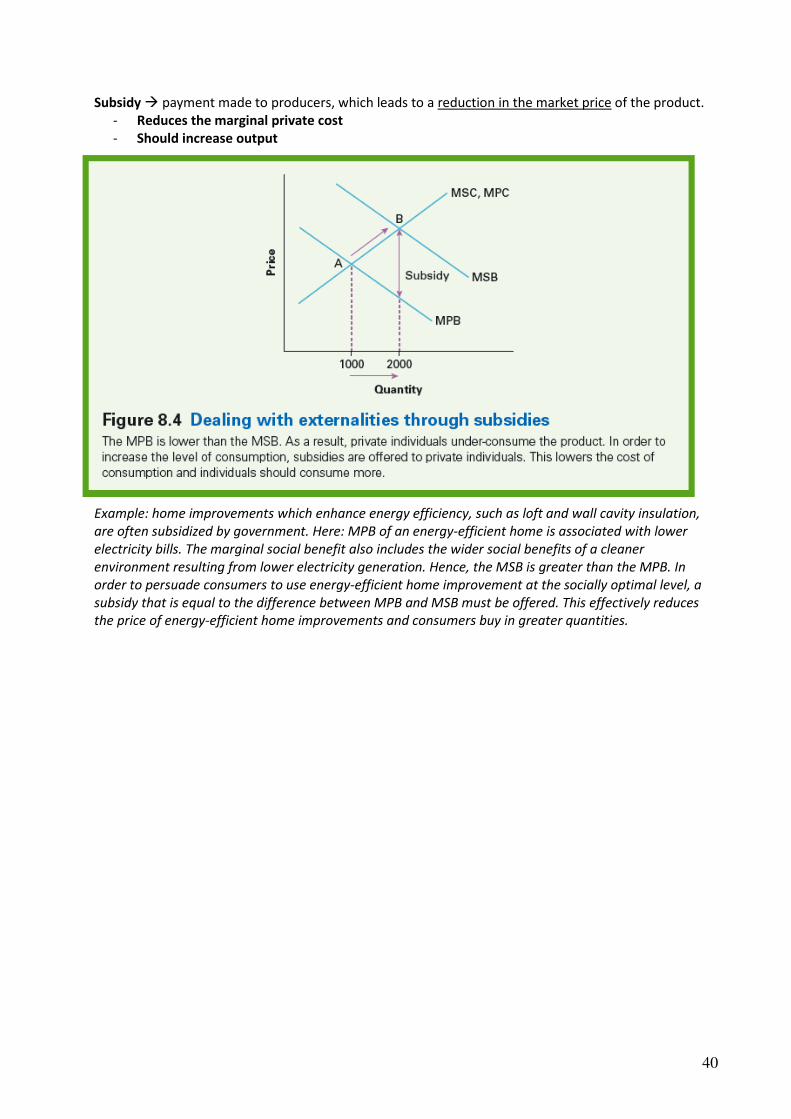
40
Subsidy � payment made to producers, which leads to a reduction in the market price of the product.
- Reduces the marginal private cost
- Should increase output
Example: home improvements which enhance energy efficiency, such as loft and wall cavity insulation,
are often subsidized by government. Here: MPB of an energy-efficient home is associated with lower
electricity bills. The marginal social benefit also includes the wider social benefits of a cleaner
environment resulting from lower electricity generation. Hence, the MSB is greater than the MPB. In
order to persuade consumers to use energy-efficient home improvement at the socially optimal level, a
subsidy that is equal to the difference between MPB and MSB must be offered. This effectively reduces
the price of energy-efficient home improvements and consumers buy in greater quantities.

41
8.8 Market power and competition policy
Compare monopoly with perfect competition: monopoly is price higher & output lower.
Consumer surplus: difference between the price a customer is willing to pay and the price they actually
pay. Consumer surplus under perfect competition is greater than under monopoly, simply because the
price is lower under perfect competition. � See figure 8.5.
Producer surplus: difference between the price that a firm is willing to sell at and the price is does sell
at. A firm is willing to supply one more unit of output if the price offered is greater than or equal to
marginal cost. So, the firm is willing to sell at any price which is greater than marginal cost. The producer
surplus is greater under monopoly than under perfect competition, simply because the price is higher
under monopoly. � See figure 8.5.
Under monopoly, the price increases and the output shrinks. Therefore, the consumer surplus must
reduce and producer surplus must increase.
However, the total of consumer and producer surplus is higher under perfect competition than under
monopoly. This difference is known as the dead-weight loss of monopoly and represents a reduction in
welfare to society. Since everyone can be made better off by moving to perfect competition, monopoly
is not Pareto efficient, because if we change the market into a perfectly competitive one, then the dead-
weight loss will vanish (verdwijnen).
Dead-weight loss of monopoly: loss of welfare to society resulting from the existence of the monopoly.
Many companies will spend resources trying to attain monopoly status � known as undertaking ‘rent-
seeking activities’. That are the allocation of resources to non-socially optimal ends and they also need
to be added on to the dead-weight losses. However, following the ideas of Schumpeter, monopolies
have enjoyed the academic protection of a concept known as ‘creative destruction’.
� Innovation can enable a firm to overcome the entry barriers of an existing monopoly. This is creative
destruction, with the creative innovation destroying the existing monopoly position.
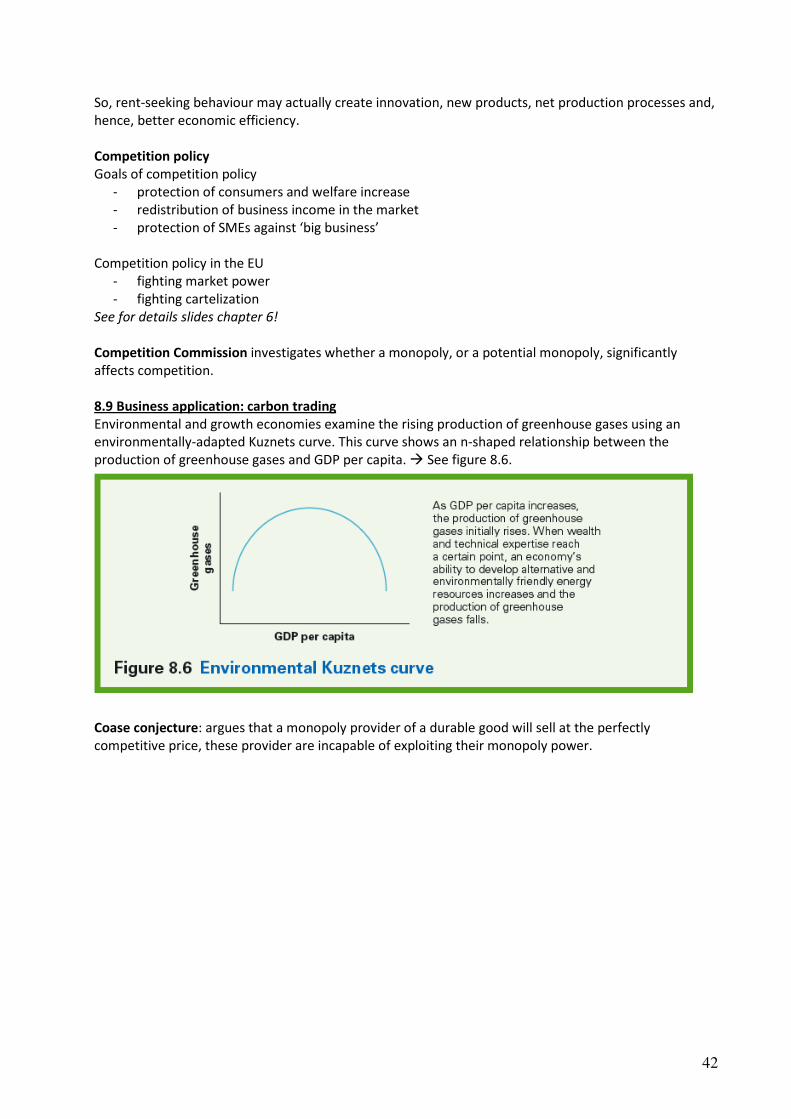
42
So, rent-seeking behaviour may actually create innovation, new products, net production processes and,
hence, better economic efficiency.
Competition policy
Goals of competition policy
- protection of consumers and welfare increase
- redistribution of business income in the market
- protection of SMEs against ‘big business’
Competition policy in the EU
- fighting market power
- fighting cartelization
See for details slides chapter 6!
Competition Commission investigates whether a monopoly, or a potential monopoly, significantly
affects competition.
8.9 Business application: carbon trading
Environmental and growth economies examine the rising production of greenhouse gases using an
environmentally-adapted Kuznets curve. This curve shows an n-shaped relationship between the
production of greenhouse gases and GDP per capita. � See figure 8.6.
Coase conjecture: argues that a monopoly provider of a durable good will sell at the perfectly
competitive price, these provider are incapable of exploiting their monopoly power.