SUMMARISED AUDITED GROUP ANNUAL FINANCIAL … · Boxer provided unbeatable deals on basic commodity...
37
FOR THE 53 WEEKS ENDED 3 MARCH 2019 SUMMARISED AUDITED GROUP ANNUAL FINANCIAL STATEMENTS
Transcript of SUMMARISED AUDITED GROUP ANNUAL FINANCIAL … · Boxer provided unbeatable deals on basic commodity...

FOR THE 53 WEEKS ENDED 3 MARCH 2019
SUMMARISED AUDITED GROUP
ANNUAL FINANCIALSTATEMENTS

SUMMARISED AUDITED GROUP ANNUAL FINANCIAL STATEMENTS
1 Result summary: Pick n Pay delivers in a tough market
11 Dividend declaration
12 Group statement of comprehensive income
13 Group statement of financial position
14 Group statement of changes in equity
15 Group statement of cash flows
16 Notes to the financial information
29 Appendix
33 Number of stores
IBC Corporate information
Turnover
+7.1%* R86.3 billion 2018: R80.5 billion**
HEPS
+18.0%* 326.71 cents 2018: 276.98 cents
Annual dividend per share
+22.4% 231.10 cents2018: 188.80 cents
* Current period figures have been adjusted by removing the impact of week 53. Refer to the appendix on page 29.
** Prior period amounts restated for the adoption of new accounting standards, refer to note 12 on page 25 and 26.
KEY METRICS
CONTENTS

Pick n Pay summarised audited Group annual financial statements for the 53 weeks ended 3 March 2019 1
PICK N PAY DELIVERS IN A TOUGH MARKET
KEY FINANCIAL INDICATORS
53 weeks to3 March
2019
52 weeks to25 February
2018*%
change
Pro forma52 weeks to24 February
2019
Pro forma%
change
Turnover R88.3 billion R80.5 billion 9.6 R86.3 billion 7.1Gross profit margin 19.0 18.9 19.0Trading profit R2 175.6 million R1 819.9 million 19.5 R2 049.0 million 12.6Trading profit margin 2.5 2.3 2.4Profit before tax R2 199.8 million R1 768.1 million 24.4 R2 073.2 million 17.3Profit before tax margin 2.5 2.2 2.4Profit before tax – South Africa R1 945.5 million R1 480.2 million 31.4 R1 831.9 million 23.8Profit for the period, after tax R1 649.5 million R1 296.3 million 27.2 R1 554.6 million 19.9Basic earnings per share 347.17 cents 273.64 cents 26.9 327.20 cents 19.6Diluted earnings per share 342.85 cents 268.33 cents 27.8 323.12 cents 20.4Headline earnings per share 346.69 cents 276.98 cents 25.2 326.71 cents 18.0Diluted headline earnings per share 342.37 cents 271.61 cents 26.1 322.65 cents 18.8Total annual dividend per share 231.10 cents 188.80 cents 22.4* The financial information presented for the prior year is on a restated basis, with the adoption of new accounting standards. Please
refer to note 12 of the summarised financial statements for further information.
The Group follows a 52-week retail financial calendar, which requires the inclusion of an additional week every six years. The 2019 financial year is a 53-week period, and its IFRS results disclosed in the table above are not directly comparable with 2018. Additional pro forma financial information is provided on an equivalent 52-week basis, to assist stakeholders with their assessment of the Group’s comparable performance. Please refer to the appendix provided for the basis of preparation of this pro forma financial information. Unless specifically stated otherwise, the result commentary that follows, including like-for-like information, is on a comparable 52-week basis. For the equivalent 53-week IFRS information refer to the table above and the summarised audited Group annual financial statements.
• Market-leading turnover growth of 7.1% with market share gains throughout the year• Like-for-like turnover growth of 4.8% despite selling price deflation of 0.3% – giving exceptional
value to customers was rewarded with volume growth of 5.1% • Gross profit margin improved to 19.0% – cost-discipline and better buying supported the Group’s
more competitive price position• Greater operating efficiency, with like-for-like trading expense growth contained at 5.3%• Tight working capital management and a measured capital investment programme delivered
a R665.0 million reduction in net funding over the year, and contributed to a 38.5% saving in net interest paid
• Group performance anchored by a strong result from the core South Africa division, with turnover growth of 7.4% (5.2% like-for-like) and profit before tax up 23.8%
• The South Africa performance mitigated some operating challenges experienced outside its borders. Earnings from the Rest of Africa division down 16.2% year-on-year, reflecting difficult economic conditions in Zambia and the once-off impact of currency devaluation in Zimbabwe
• Headline earnings and diluted headline earnings per share up 25.2% and 26.1% respectively for the 53-week period, and up 18.0% and 18.8% on a comparable 52-week basis
• The Board declared a final dividend of 192.00 cents per share. The total annual dividend of 231.10 cents per share is up 22.4% on last year, maintaining a dividend cover of 1.5 times headline earnings per share for the 53-week period
RESULT HIGHLIGHTSFor the pro forma 52 weeks ended 24 February 2019

Pick n Pay summarised audited Group annual financial statements for the 53 weeks ended 3 March 20192
In a challenging trading environment, the Group has maintained its focus on the objectives set out in its long-term plan: building a leaner and more cost-effective business which gives customers exceptional value, quality and innovation in grocery and retail services. Successful execution of this strategy has enabled the Group to report market-leading turnover growth of 7.1%, and like-for-like turnover growth of 4.8%. The core South Africa division – comprising Pick n Pay and Boxer – delivered turnover growth of 7.4%. The Group’s commitment to giving hard-pressed customers even better value was demonstrated through selling price deflation of 0.3% for the year. The Group’s volume growth of 5.1% represented its strongest underlying trading performance for many years.
Over the past six years, a relentless focus on improving cost and operating effectiveness has enabled the Group to invest in a winning customer offer through lower prices, more attractive promotions, better and more innovative products, compelling value-added services, and brighter and more modern stores – without sacrificing earnings growth. The Group delivered 18.0% growth in headline earnings per share over the comparable 52-week period, with solid returns from its capital investment programme, ongoing improvement in operating efficiency and strong working capital management. The growth in headline earnings per share for the 53-week period is 25.2%.
Performance highlights over the period include:
LOWER PRICES, BETTER VALUEThe Group’s leaner cost base – underpinned by its work in recent years to centralise its supply chain, modernise its loyalty programme, streamline its labour force and implement an effective Buy Better programme – supported substantial price investment over the year.
Pick n Pay monitors at least 2 500 prices across the retail sector every week to ensure it remains price competitive. Pick n Pay has improved its relative price position by at least 3% across thousands of products, with many costing no more – and in some cases less – than they did a year ago. In addition, Pick n Pay refined its promotional calendar, significantly reducing the number of products promoted over the year, but with much deeper value on offer.
Fewer, more meaningful promotions are easier for customers to understand, simpler to administer, and provide greater opportunity for effective supplier collaboration. Targeted promotions delivered strong volume growth over the year. Boxer provided unbeatable deals on basic commodity lines, including through bulk offers, cementing its position as the fastest growing limited range discounter in South Africa. Pick n Pay and Boxer are building trust and loyalty by providing greater value at a time when customers need it the most.
The Group continues to build stronger supplier partnerships through its Buy Better programme to provide lower prices and added value for customers. Fact-based negotiation is supported by information from our loyalty and procurement platforms. Pick n Pay is able to provide its suppliers with insight into the sales performance of their products, and can demonstrate how personalised promotions can have a positive impact. Pick n Pay is more efficient in terms of its planning, replenishment and distribution, and is a more effective retail partner in driving product growth. It unlocked more than R500 million of value through its Buy Better programme this year, supporting its more competitive price position, and driving volume growth.
GREATER REWARD FOR LOYALTY CUSTOMERSPick n Pay’s improved price position is augmented by its Smart Shopper loyalty programme. Smart Shopper remains the most engaged and accessible loyalty programme in South Africa. Over seven million active loyalty customers receive a personal message each week, with discounts on the items that are most relevant to them. Pick n Pay offered members R6.6 billion in personalised value this year, and saw redemptions grow by almost 30%. Discounts are partly supplier-funded, with meaningful volume uplift providing returns on investment for the Group and its suppliers.
Pick n Pay leveraged its partnership with BP this year to offer loyalty points on fuel purchased at BP forecourts. Over one million people have earned Smart Shopper points on their fuel purchases since November 2018.
RESULT SUMMARY (continued)

Pick n Pay summarised audited Group annual financial statements for the 53 weeks ended 3 March 2019 3
Convenience and ease of use remain paramount to the success of Smart Shopper. Pick n Pay continues to modernise its programme for customers, including through switch and spend functionality at point of sale, and cardless transactions directly through its mobile app.
OUR FRESH PROMISECustomers judge the quality of a retailer by the quality of its fresh offer. Launched in May 2018, Pick n Pay’s Fresh Promise delivers a substantially improved fresh offer, with better quality, more choice, and longer-lasting freshness across all categories. This has been achieved by building stronger, more focused and more rewarding relationships with fresh suppliers who are committed to long-term growth with the Company. Pick n Pay added new skill and experience to its fresh team, and introduced new produce, meat and bakery suppliers, with greater collaboration on technical specifications, packaging, ordering and waste management. Its stronger focus on fresh delivered a 20% increase in fresh availability, a 5% reduction in waste, and strong sales growth year-on-year.
Boxer complements its limited-range grocery offer with a small but compelling fresh offer. Greater focus on its fresh departments this year delivered strong double-digit turnover growth in butchery and bakery.
OWN BRAND INNOVATIONThe Group’s enhanced fresh offer is supported by a growing range of trusted own brand products. Own brand is an opportunity to develop smaller local suppliers and to drive innovation. It also provides the Group with greater control across the supply chain, and the ability to extract cost and efficiency savings, providing better value for customers. Pick n Pay redesigned and relaunched 700 of its existing own brand products this year, and introduced a further 500 new products, taking its own brand participation to 21% of participating categories. Pick n Pay partnered with more than 100 small businesses this year through its mentorship and business development programmes. Boxer grew its own brand sales by 61.3% year-on-year, with own brand participation now at 15.5% of participating categories.
GREATER RELEVANCEThe Group’s increasingly relevant customer offer is driven by its two formidable Pick n Pay and Boxer brands, which includes support from valuable franchise partners. The strength of the Pick n Pay brand is in its appeal across broad socio-economic demographics. Everyone is welcome in our stores, and this is one of the reasons why Pick n Pay has been recognised as South Africa’s most influential brand. Pick n Pay is committed to an excellent in-store experience across its estate, with optimised ranges which are specifically tailored to meet the needs of the customers served. In many instances range optimisation has led to meaningful range reductions, with simplified administration, higher on-shelf availability, reduced waste and improved trading densities.
Boxer’s limited range of grocery products – alongside its strong fresh meat offer – is a key strength. A limited range, tailored precisely to the needs of its customers, enables Boxer to keep costs low and thereby deliver market-beating prices and promotions to less-affluent communities.
GREATER EFFICIENCY ACROSS THE SUPPLY CHAINGreater levels of centralisation continue to unlock economies of scale and drive cost savings across the Group’s distribution channels.
Pick n Pay’s level of supply chain centralisation now stands at over 75%, up from 65% last year. Pick n Pay centralised over 400 new suppliers this year, including eight small suppliers mentored through its enterprise development programme. Progress includes the centralisation of ice-cream through our partnership with Vector Logistics, and positive steps in centralising liquor and fresh poultry in the Western Cape.
Pick n Pay opened a new distribution centre in KwaZulu-Natal in March 2018, taking centralisation in the region to 76% compared to 45% last year. Goods issued out of Pick n Pay distribution centres are up 13.6% on last year. Boxer continued to make good progress in delivering its plan to centralise more of its supply chain distribution, in particular by opening a new distribution centre in Gauteng in January 2019.

Pick n Pay summarised audited Group annual financial statements for the 53 weeks ended 3 March 20194
Boxer now has three distribution centres, including sites in KwaZulu-Natal and East London, with centralised supply in the business now over 40%.
A MODERN ESTATE, WITH A WIDER REACHThe Group continues to expand its reach, not only into geographic areas where it is under-represented, but through locations that provide greater opportunity for modern convenience. The Group opened 130 stores across all formats this year, including 16 Pick n Pay supermarkets on an owned and franchise basis and 13 Boxer supermarkets. New Pick n Pay supermarkets are smaller in size and all offer a modern, next generation shopping experience,with a greater emphasis on convenience. The Group opened 32 Pick n Pay Express stores this year, its forecourt convenience format in partnership with BP. Pick n Pay’s business development programme with local retail entrepreneurs helps to deliver safe and affordable grocery shopping to communities in townships across Gauteng and the Western Cape, with 20 independently owned Market stores at year end.
Pick n Pay’s hypermarket division delivered an improved contribution to Group performance. Refurbishments undertaken in the previous year continued to pay dividends, with Pick n Pay’s Durban and Northgate hypermarkets each delivering double digit turnover growth. The Group completed a further four hypermarket mini-refurbishments this year, improving trading densities through more effective layouts, modern fixtures and fittings and a sharper focus on fresh, general merchandise, clothing and liquor. Six hypermarkets provided a bulk wholesale offer to over 300 independent traders and 100 franchisees, driving wholesale turnover up more than 20% year-on-year.
The Group’s core grocery offer is complemented by its growing clothing and liquor businesses. The Group opened a net 17 standalone Pick n Pay clothing stores over the year, bringing its footprint to 217 stores on an owned and franchise basis. The clothing division delivered strong like-for-like sales growth over the year, anchored by a fresh look and feel as well as contributions from its womenswear, menswear and sleepwear categories.
The Group opened a net 33 standalone Pick n Pay and Boxer liquor stores during the year, on an owned and franchise basis.
The Group’s liquor division delivered double-digit turnover growth, driven by an increased focus on wine and gin categories. The Pick n Pay wine club now boasts more than 100 000 members.
The Group executed a broad and impactful renewal programme over the 2019 financial year, touching more stores in a single year than ever before. The Group revamped 103 stores this year, 45 Pick n Pay and 31 Boxer company-owned stores across all formats, 20 franchise stores and 7 supermarkets in Zimbabwe. These stores are all lighter and brighter, with improved refrigeration, modern fixtures and fittings and greater innovation in respect of the display of fresh produce, health and beauty products and general merchandise.
Pick n Pay also worked to improve its stores by lowering shelf heights, creating wider aisles and adding stronger signage. This gave customers across the country stores that are easier to navigate and easier to shop.
The Group closed 20 under-performing stores during the year. Refurbishments and closures have an impact on top-line growth, but any disruption to trade has been mitigated by the improved like-for-like volume growth delivered by refurbished stores, which are delivering on the Group’s return on investment requirements.
The Group’s estate numbers 1 795 stores across all formats, including 719 franchise stores. We thank our franchise partners for the energy and effort they put into supporting the Pick n Pay brand. Closer collaboration over the past year has seen a greater alignment of store operating standards and product offer. The commitment of our franchisees to service excellence continues to set a high benchmark for the Group as a whole, and we are a stronger team because of them.
LEADING ONLINE OFFERPick n Pay continues to enhance its online platform, providing greater convenience and innovation for digital customers. Although online remains a relatively small part of the business, the Group recognises that digital retail will be increasingly important in the future. The Group’s new online website drove order volumes up 17%, with turnover growth of 24.3% year-on-year, including through the Group’s Click n Collect option.
RESULT SUMMARY (continued)

Pick n Pay summarised audited Group annual financial statements for the 53 weeks ended 3 March 2019 5
The Group’s dedicated online distribution centres in Johannesburg and Cape Town continue to drive efficiency across the online channel, with solid improvements in stock availability, and the consistent achievement of on-time delivery rates of 98%. The Group has leveraged its online infrastructure, delivering small and single-pick orders from its distribution centres to its smaller format stores in Gauteng and the Western Cape, with issues to Express and Market stores up over 100% year-on-year, supporting growth in our smaller format platform.
STRONGER VALUE-ADDED SERVICESThe Group cemented its meaningful value-addedservices proposition with its industry-first partnership with TymeBank. TymeBank is South Africa’s first digital-only bank, offering a simple, transparent and inexpensive banking proposition for customers, including many previously under-served by the banking sector. Pick n Pay and Boxer supermarkets effectively serve as a convenient and extensive branch network for TymeBank, and it takes less than five minutes to open an account in store. There are no monthly fees, most transactions are free and all purchases with a TymeBank card earn Smart Shopper points, with double points earned at Pick n Pay. Over 250 000 customers have opened a TymeBank account in just three months.
Customers taking advantage of Pick n Pay’s low-cost store account grew by 25% over the year to 125 000. In addition to its low-cost banking partnerships, the Group grew its domestic and cross-border money transfer services, as well as its event and ticketing offer, by over 50%, driving a significant market share gain in value-added services.
GROWTH OUTSIDE SOUTH AFRICAThe Group has followed a measured approach to its investment outside of South Africa, building an additional engine of growth for the business, without placing the core South Africa business under undue strain.
The Group has an established presence in Botswana, Lesotho, Namibia, Eswatini, Zambia and Zimbabwe. Trading conditions in these regions have been challenging at times, particularly in Zambia, and more recently in Zimbabwe.
The Group continues to build a stronger and more resilient business in Zambia, and remains confident of the long-term growth prospects of this business, notwithstanding a currently difficult trading environment. The Group opened two new supermarkets in Zambia this year and one stand-alone liquor store, taking its footprint to 20 stores in the region.
Pick n Pay optimised its range in eight of its supermarkets in Zambia this year. Greater operating efficiency and tighter working capital has delivered a stronger price position and a greater value proposition.
The Group has a 49% interest in its associate TM Supermarkets (TM) in Zimbabwe. TM has 57 stores in the region, with 20 trading under the Pick n Pay banner. The year has seen political and economic challenges, culminating in a currency liquidity crisis, high levels of inflation, social unrest, and a significant consumer demand for basic commodity products.
A determined team ensured that TM and Pick n Pay stores remained open throughout the year, and traded successfully despite external difficulties. Hard work in building customer and supplier loyalty stood the business in good stead, and its in-stock position remained high. The estate was improved with a further seven renovations in the year. TM received a number of retail awards in Zimbabwe, including being recognised as the “Coolest Supermarket Brand” at the Generation Next Awards and the Marketers Association of Zimbabwe’s (MAZ) “Superbrand of the Year” in the retail supermarkets sector.
TM delivered double digit volume and customer growth, with cost discipline and operating efficiency supporting solid earnings growth. However the Group’s share of associate income was down 6.3% year-on-year, with the impact of a R42.1 million foreign exchange loss on TM’s adoption of the newly recognised RTGS dollars as its functional currency, and a revaluation of relevant balance sheet items effective October 2018. Profits earned by TM since that date have been translated by the Group at a rate of 3.3 RTGS dollars to one US dollar.

Pick n Pay summarised audited Group annual financial statements for the 53 weeks ended 3 March 20196
RESULT SUMMARY (continued)
REVIEW OF FINANCIAL PERFORMANCEThe 2019 financial year is a 53-week period, and the 53-week IFRS results are not directly comparable with those of the 52 weeks of 2018. Unless specifically stated otherwise, the result commentary that follows below is on a comparable 52-week basis. Please refer to the appendix provided for the basis of preparation of this pro forma 52-week financial information.
The prior year financial information presented is on a restated basis, with the adoption of new accounting standards: IFRS 15 Revenue from Contracts with Customers and IFRS 9 Financial Instruments. For further information on the adoption of the new accounting standards during the period, refer to note 12 of the summarised audited Group annual financial statements. The restatements had an insignificant impact on the profitability and financial position of the Group.
TURNOVERGroup turnover increased 7.1% to R86.3 billion, with like-for-like turnover growth of 4.8%. The Group delivered real volume growth of 5.1%, with selling price deflation at 0.3% year-on-year.
The Group’s core South Africa division delivered turnover growth of 7.4%, with like-for-like turnover growth of 5.2%, and real volume growth of 5.5%. The Group’s improved performance is anchored by strong performances from its stores serving the growing lower to middle income communities of South Africa, a more competitive price position and a substantively improved fresh offer. The Group is particularly pleased with the improved contribution from its company-owned Pick n Pay and Boxer stores.
The tough trading conditions in Zambia continued over the year, and the weak kwacha weighed on Group turnover growth. On a constant currency basis, Group turnover grew 7.3%. The Group’s investment in TM Supermarkets in Zimbabwe is recognised as an associate, and its sales are not included in Group turnover or revenue.
Refer to the appendix provided for further information on the Group’s constant currency and like-for-like turnover calculations.
GROSS PROFITGross profit increased 7.8% to R16.4 billion, with gross profit margin improving from 18.9% to 19.0%. The Group demonstrated tight gross profit margin management, with cost savings across the procurement and distribution channel allowing for greater investment in lower every day prices. Improved performances and increased participation from company-owned Pick n Pay and Boxer stores was positive for gross profit margin. The Group bought better on behalf of customers, and harnessed the benefits of greater levels of centralisation, optimised ranges and lower stock-holdings.
OTHER INCOMEOther income increased 6.1% to R1.9 billion and, at 2.2% of turnover, is in line with last year.
Franchise fee income – was down 2.5% on last year to R389.9 million. The decrease reflects a strategic change in the terms of our partnership with BP, designed to drive the growth of the Pick n Pay Express convenience format. The reduction in franchise fee income is offset by the benefits of a greater level of volume through the Pick n Pay supply chain. The Group opened 32 Pick n Pay Express stores over the year, against a net 8 stores last year, bringing its total footprint to 151 stores across South Africa. On a comparable basis, excluding the impact of the new agreement, franchise fee income grew 4.5% year-on-year.
Operating lease income – increased 18.3% to R527.8 million. The increase reflects the new head leases secured by the Group to protect the long-term tenancy of its strategic franchise sites. The increase in rental income is matched by a corresponding increase in occupancy costs.
Commissions and other income, including value-added services (VAS) – increased 3.9% to R972.2 million. Commissions and other income now includes all commission and incentive income that is not directly related to the sale of inventory.This broad category includes a relatively small but increasingly important contribution from value-added services. Income from value-added services grew 41.5% year-on-year, driven by sustained growth in commissions received from financial services, third party bill payments and the sale of prepaid electricity.

Pick n Pay summarised audited Group annual financial statements for the 53 weeks ended 3 March 2019 7
Customers are increasingly using our stores to perform financial services transactions, with 113 million transactions taking place in our stores during the year.
TRADING EXPENSESTrading expenses grew 7.0% year-on-year to R16.3 billion, with like-for-like growth contained at 5.3%. The trading expense margin improved from 18.9% to 18.8% of turnover. The Group responded to a difficult trading environment by demonstrating exceptional cost discipline, restricting the growth in trading expenses to below that of turnover.
Employee costs – increased by 6.2% to R7.1 billion, driven by growth across the Group’s store estate. The Group built on the benefits of its voluntary severance programme (VSP) in the prior year, extracting labour efficiencies through greater levels of productivity and improved scheduling. Like-for-like employee costs, excluding the cost of the VSP last year and other non-comparable costs, grew 5.9%, notwithstanding salary and wage increases ahead of CPI. Labour costs improved from 8.3% to 8.2% of turnover.
Occupancy costs – grew 6.9% to R3.3 billion, with a net 51 company owned stores added over the past year, and the addition of a number of head leases in respect of strategic franchise sites. Occupancy costs increased 3.3% on a like-for-like basis, notwithstanding large increases in security and insurance costs. Occupancy costs remain at 3.8% of turnover. The Group is committed to reducing occupancy costs as a percentage of turnover, and is working with landlords to secure fair rental and escalation terms that reasonably reflect the economic environment in which we operate, and seek to sustain mutual growth.
Operations costs – increased by 8.9% to R3.5 billion, with a like-for-like increase of 6.1%. The largest drivers in this category are repairs and maintenance and depreciation. Repairs and maintenance is up 15% year-on-year, with targeted maintenance programmes across Pick n Pay and Boxer ensuring that the benefits of the Group’s broad capital investment programme are sustained. Depreciation and amortisation costs are up 10.5%, reflecting the Group’s capital expansion and improvement plans over a number of years.
Electricity costs have been extremely well managed year-on-year, down 1.8% on a like-for-like basis. Pick n Pay company-owned supermarkets use less energy in absolute terms today than we used ten years ago, notwithstanding the addition of over 100 supermarkets over that time. Pick n Pay installed an additional 4 megawatts of solar energy this year at selected sites, supplying between 20% and 40% of the energy requirements for each site. Pick n Pay and Boxer were well prepared for the recent rolling electricity blackouts in South Africa, referred to locally as “load-shedding”, with all stores, distribution centres and offices benefitting from back-up power. Pick n Pay has had excellent results with its water-saving initiatives in the Western Cape, reducing overall water consumption by 20% in the region. These initiatives are being rolled out across the Group’s South African estate.
Merchandising and administration costs – grew 7.0% to R2.4 billion, with like-for-like growth of 4.9%. Greater levels of advertising spend, related to the Group’s impactful programme of promotions, was mitigated by the Group’s ongoing discipline on professional fees and other administrative costs.
NET INTERESTNet interest paid decreased 38.5% year-on-year, from R147.1 million to R90.5 million. The substantial interest savings of R56.6 million reflects the Group’s lower average borrowings over the year. Increased profitability, improved working capital management and a measured capital investment programme have all contributed to a stronger net funding position. The Group’s cost of borrowing is actively managed through an optimum mix of overnight and capital market funding.
REST OF AFRICA SEGMENTThe Group’s Rest of Africa division contributed R4.7 billion of segmental revenue this year, up 2.2% on last year, with negative like-for-like growth of 1.6%. The performance of the Rest of Africa division reflects difficult trading conditions in operating regions outside of South Africa, particularly the ongoing challenges in Zambia. Removing the impact of currency weakness, segmental revenue is up 5.3% in constant currency terms, and up 1.5% on a like-for-like basis.

Pick n Pay summarised audited Group annual financial statements for the 53 weeks ended 3 March 20198
The Group’s share of its profits of its associate TM Supermarkets in Zimbabwe (TM) was down 6.3% year-on-year, and included a once-off foreign exchange loss of R42.1 million on TM’s adoption of the newly recognised RTGS dollar as its functional currency, and a revaluation of relevant balance sheet items effective from October 2018. Profits earned by TM since that date have been translated at a rate of 3.3 RTGS dollars to 1.0 US dollar (4.3 RTGS dollars to 1.0 ZAR).
Rest of Africa segmental profit before tax is down 16.2% year-on-year, to R241.3 million.
CAPITAL ITEMSThe Group realised capital profits of R5.7 million during the period against capital losses of R21.0 million last year. Capital profits arose on the sale of land and the sale of assets on the conversion of company-owned stores to franchise stores. Capital items are added back in the calculation of headline earnings.
PROFIT BEFORE TAX AND BEFORE CAPITAL ITEMSProfit before tax and before capital items was up 15.6% on last year to R2.1 billion, at a margin of 2.4% of turnover. Profit before tax and before capital items in the Group’s core South Africa division was up 21.6% to R1.8 billion, improving from 2.0% to 2.2% of segmental turnover. Group profit before tax, after capital items, was up 17.3%.
TAX The Group’s tax rate of 25.0% reflects the impact of the timing of its tax deductions in respect of its employee share incentive schemes. The Group tax rate is sustainable over the medium-term, with marginal increases expected as the Group expands into the rest of Africa.
EARNINGS PER SHAREEarnings per share (EPS) – increased by 19.6% to 327.20 cents per share over 52 weeks. EPS increased by 26.9% over the 53-week financial year, to 347.17 cents per share.
Headline earnings per share (HEPS) – increased by 18.0% to 326.71 cents per share over 52 weeks. HEPS increased by 25.2% over the 53-week financial year, to 346.69 cents per share.
Diluted headline earnings per share (DHEPS) – increased by 18.8% to 322.65 cents per share over 52 weeks. Diluted HEPS increased by 26.1% over the 53-week financial year, to 342.37 cents per share.
REVIEW OF FINANCIAL POSITIONThe increase in the Group’s net asset base reflects the success of its long-term strategy in delivering consistent and sustainable earnings growth in a tough market, and the positive impact of the Group’s capital investment plan over the past six years. The Group has grown its store estate, centralised its distribution capacity and solidified its IT infrastructure in a measured and considered manner, delivering sustained returns on investment. The Group’s net asset value for the 53 weeks ended 3 March 2019 increased 9.3% year-on-year impacted by a reduction in the foreign currency translation reserve of R290.2 million as a result of the recognition of our investment in TM Supermarkets in local RTGS dollar currency, and its subsequent translation at a rate of 3.3 RTGS dollars to 1.0 US dollar (4.3 RTGS dollars to 1.0 ZAR). The fair value of the Group’s investment in TM exceeds its carrying value of R184.4 million and no impairment is required.
WORKING CAPITALAs a result of the impact of the 53rd week, the Group’s working capital position at 3 March 2019 is not comparable with that of 25 February 2018. The net working capital outflow reflects the impact of month-end supplier payments in line with the Group’s normal trade terms, annual tax payments and a substantive increase in rental and other prepayments.
Tight working capital management, particularly in respect of inventory, contributed to stronger cash balances over the year, and the 38.5% reduction in net interest paid. On a comparable 52-week basis, excluding the impact of new stores and cost inflation, like-for-like inventory is down 10.5% on last year, notwithstanding the addition of a net 51 Company-owned stores over the year, and greater levels of centralisation across the Group, including the new Pick n Pay distribution centre in KwaZulu-Natal and the new Boxer distribution centre in Gauteng.
RESULT SUMMARY (continued)

Pick n Pay summarised audited Group annual financial statements for the 53 weeks ended 3 March 2019 9
This clearly demonstrates the early benefits of in-store range optimisation and the Group’s success in removing old and slow moving product lines from the business. Trade and other payables have been tightly managed alongside the Group’s good work on inventory.
Trade and other receivables remain well controlled. The comparable 52-week increase year-on-year, excluding significant prepayments at year-end, reflects the addition of 59 net new franchise stores over the year and a growing wholesale debtors book in line with the growth in Pick n Pay’s wholesale offer. The Group is satisfied with the overall quality of its debtors’ book, with an impairment allowance of 2.7%.
The Group’s net funding position at 3 March 2019 reflects the impact of the addition of week 53, with month-end supplier payments in line with the Group’s normal trade terms, and annual tax payments. On a comparable 52-week calendar basis, the Group improved its net funding position by R665.0 million, driven by stronger cash generation, tighter working capital management and proceeds from the sale of land. The Group raised one-to-three month funding to take advantage of lower interest rates available in the capital markets, and optimally manage short-term liquidity. The Group no longer has long-term secured funding, and is efficiently and cost-effectively geared through short-term borrowings. The Group’s liquidity position remains strong, with R4.3 billion of unutilised facilities at 3 March 2019.
CAPITAL INVESTMENTThe Group invested R1.5 billion in capital improvements over the year. The Group commits the majority of its spend on customer-facing initiatives, with R476 million invested in new stores, R620 million on refurbishments, and R377 million on supply chain capability and IT infrastructure.
The Group will invest a further R2.0 billion next year, and is confident of its ability to meet its capital investment requirements through internally generated cash flow. The Group delivered return on capital employed of 39%, against a weighted average cost of capital of 12.4%.
SHARE CAPITALThe Group issued five million shares in August 2018 under current shareholder approvals. These shares will fund the Group’s employee share scheme obligations, which have increased as a result of share price growth over recent years. The shares are currently held as treasury shares.
SHAREHOLDER DISTRIBUTIONThe Board declared a final dividend of 192.00 cents per share. This brings the total annual dividend to 231.10 cents per share, 22.4% up on last year, maintaining the Group’s dividend cover of 1.5 times headline earnings per share over the 53-week financial year.
NET FUNDING
3 March2019
Rm
Unaudited24 February
2019Rm
25 February2018
RmCash balances 1 503.2 1 090.3 1 129.1Cost-effective overnight borrowings (1 800.0) (300.0) (1 800.0)Cash and cash equivalents (296.8) 790.3 (670.9)One- to three-month funding (1 325.0) (1 325.0) (400.0)Secured borrowings – – (128.8)Net funding position (1 621.8) (534.7) (1 199.7)
Pick n Pay summarised audited Group annual financial statements for the 53 weeks ended 3 March 201910
ACCOUNTING STANDARDS NOT YET ADOPTED – IFRS 16 LEASES (IFRS 16)The Group will adopt IFRS 16 from 4 March 2019, the beginning of its 2020 financial year. IFRS 16 largely removes the classification of leases as either operating leases or finance leases as required by IAS 17: Leases, and requires lessees to account for all leases under a single on-balance sheet model.
The Group’s extensive lease portfolio will mostly be capitalised on the statement of financial position – with underlying leases recognised as right-of-use assets, with a corresponding lease liability in respect of future rental obligations.
The application of IFRS 16 will have a material impact on the Group’s statement of financial position, statement of comprehensive income and classifications in the statement of cash flows. Key balance sheet metrics such as gearing ratios and return on capital employed, and income statement metrics, such as earnings before interest, tax, depreciation and amortisation (EBITDA), will be impacted. IFRS 16 will have no impact on the cash generation of the Group.
To ensure the year-on-year comparability of financial information, the Group will adopt IFRS 16 on the full retrospective basis. Please refer to note 13 of the summarised audited Group annual financial statements for further detailed information.
SUSTAINABLE GROWTH IN A TOUGH MARKETOver the past six years, the Group has pursued a clear and consistent long-term plan focused on building a leaner and fitter business which delivers consistent turnover and earnings growth by providing customers with better value-for-money, improved quality, more innovation, and a genuine multi-channel platform with a strong online offer and attractive value-added financial services.
The Group’s FY19 financial result – in which market-leading turnover growth was achieved without sacrificing earnings growth – underlines the effectiveness of the strategy and the team’s ability to implement it.
Pick n Pay and Boxer serve customers across all social and income groups, and the Group is increasingly confident that it has the focus and flexibility to compete and pursue growth in the market. The Group has begun the 2020 financial year with great energy, and is committed to winning more customers in a tough market. We extend our sincere appreciation to our Pick n Pay and Boxer teams who have delivered an outstanding result, and who continue to build a modern and effective business.
Gareth Ackerman Richard BrasherChairman Chief Executive Officer
25 April 2019
RESULT SUMMARY (continued)

Pick n Pay summarised audited Group annual financial statements for the 53 weeks ended 3 March 2019 11
PICK N PAY STORES LIMITED – TAX REFERENCE NUMBER: 9275/141/71/2Number of shares in issue: 493 450 321
Notice is hereby given that the directors have declared a final gross dividend (number 102) of 192.00 cents per share out of income reserves.
The dividend declared is subject to dividend withholding tax at 20%.
The tax payable is 38.40 cents per share, resulting in shareholders who are not exempt from dividends tax with a net dividend of 153.60 cents per share.
DIVIDEND DATESThe last day of trade in order to participate in the dividend (CUM dividend) will be Tuesday, 4 June 2019.
The shares will trade EX dividend from the commencement of business on Wednesday, 5 June 2019 and the record date will be Friday, 7 June 2019. The dividends will be paid on Monday, 10 June 2019.
Share certificates may not be dematerialised or rematerialised between Wednesday, 5 June 2019 and Friday, 7 June 2019, both dates inclusive.
On behalf of the Board of directors
Debra MullerCompany Secretary
25 April 2019
DIVIDEND DECLARATION

Pick n Pay summarised audited Group annual financial statements for the 53 weeks ended 3 March 201912
Note
53 weeks to 3 March
2019 Rm
Restated* 52 weeks to 25 February
2018 Rm
Revenue 2 90 465.0 82 489.6
Turnover 2 88 293.2 80 523.5 Cost of merchandise sold (71 539.3) (65 294.6)
Gross profit 16 753.9 15 228.9 Other income 1 913.0 1 782.0
Franchise fee income 2 399.1 400.1 Operating lease income 2 527.8 446.1 Commissions and other income 2 986.1 935.8
Trading expenses (16 491.3) (15 191.0)
Employee costs (7 238.9) (6 688.7)Occupancy (3 326.8) (3 086.6)Operations (3 515.5) (3 178.8)Merchandising and administration (2 410.1) (2 236.9)
Trading profit 2 175.6 1 819.9 Finance income 2 258.8 184.1 Finance costs (349.3) (331.2)Share of associate’s income 8 109.0 116.3
Profit before tax before capital items 2 194.1 1 789.1 Profit/(loss) on capital items 5.7 (21.0)
Profit/(loss) on sale of property, plant and equipment 11.0 (10.6)Impairment loss on property, plant and equipment – (3.5)Impairment loss on intangible assets (5.3) (6.9)
Profit before tax 2 199.8 1 768.1 Tax (550.3) (471.8)
Profit for the period 1 649.5 1 296.3
Other comprehensive income, net of tax
Items that will not be reclassified to profit or loss (21.4) (0.4)
Remeasurement in retirement scheme assets (29.9) (0.6)Tax on items that will not be reclassified to profit or loss 8.5 0.2
Items that may be reclassified to profit or loss (263.1) (46.2)
Foreign currency translations (281.6) (49.8)Movement in cash flow hedge 3.1 – Tax on items that may be reclassified to profit or loss 15.4 3.6
Total comprehensive income for the period 1 365.0 1 249.7
Earnings per share Cents Cents
Basic earnings per share 4 347.17 273.64 Diluted earnings per share 4 342.85 268.33 Headline earnings per share 4 346.69 276.98 Diluted headline earnings per share 4 342.37 271.61
* Prior period amounts restated for the adoption of new accounting standards, refer to note 12.
GROUP STATEMENT OF COMPREHENSIVE INCOMEfor the period ended
Pick n Pay summarised audited Group annual financial statements for the 53 weeks ended 3 March 2019 13
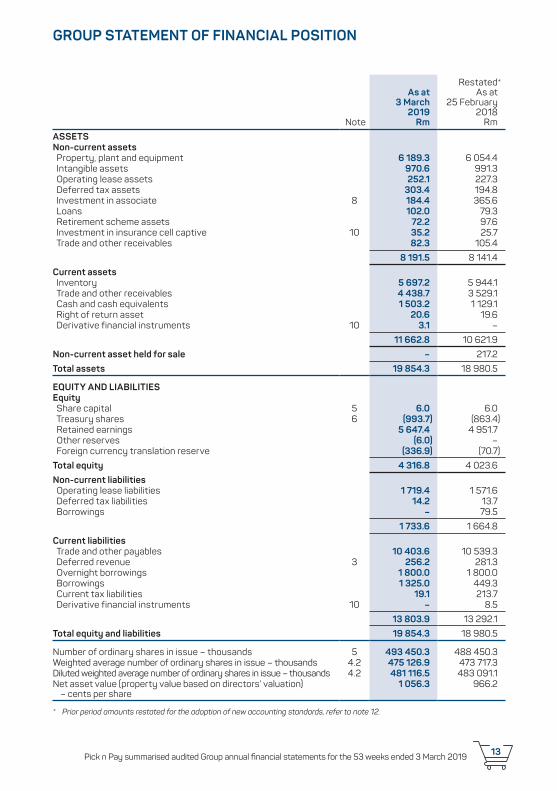
GROUP STATEMENT OF FINANCIAL POSITION
Note
As at 3 March
2019 Rm
Restated* As at
25 February 2018
Rm
ASSETSNon-current assetsProperty, plant and equipment 6 189.3 6 054.4 Intangible assets 970.6 991.3 Operating lease assets 252.1 227.3 Deferred tax assets 303.4 194.8 Investment in associate 8 184.4 365.6 Loans 102.0 79.3 Retirement scheme assets 72.2 97.6 Investment in insurance cell captive 10 35.2 25.7 Trade and other receivables 82.3 105.4
8 191.5 8 141.4
Current assetsInventory 5 697.2 5 944.1 Trade and other receivables 4 438.7 3 529.1 Cash and cash equivalents 1 503.2 1 129.1 Right of return asset 20.6 19.6 Derivative financial instruments 10 3.1 –
11 662.8 10 621.9
Non-current asset held for sale – 217.2
Total assets 19 854.3 18 980.5
EQUITY AND LIABILITIESEquityShare capital 5 6.0 6.0 Treasury shares 6 (993.7) (863.4) Retained earnings 5 647.4 4 951.7 Other reserves (6.0) – Foreign currency translation reserve (336.9) (70.7)
Total equity 4 316.8 4 023.6
Non-current liabilitiesOperating lease liabilities 1 719.4 1 571.6 Deferred tax liabilities 14.2 13.7 Borrowings – 79.5
1 733.6 1 664.8
Current liabilitiesTrade and other payables 10 403.6 10 539.3 Deferred revenue 3 256.2 281.3 Overnight borrowings 1 800.0 1 800.0 Borrowings 1 325.0 449.3 Current tax liabilities 19.1 213.7 Derivative financial instruments 10 – 8.5
13 803.9 13 292.1
Total equity and liabilities 19 854.3 18 980.5
Number of ordinary shares in issue – thousands 5 493 450.3 488 450.3 Weighted average number of ordinary shares in issue – thousands 4.2 475 126.9 473 717.3 Diluted weighted average number of ordinary shares in issue – thousands 4.2 481 116.5 483 091.1 Net asset value (property value based on directors’ valuation)
– cents per share 1 056.3 966.2
* Prior period amounts restated for the adoption of new accounting standards, refer to note 12.

Pick n Pay summarised audited Group annual financial statements for the 53 weeks ended 3 March 201914
Note
Share capital
Rm
Treasury shares
Rm
Retained earnings
Rm
Otherreserves
Rm
Foreign currency
translation reserve
Rm
Totalequity
Rm
At 26 February 2017 6.0 (554.3) 4 428.5 – (24.5) 3 855.7
Total comprehensive income for the period – – 1 295.9 – (46.2) 1 249.7
Profit for the period – – 1 296.3 – – 1 296.3 Foreign currency translations – – – – (46.2) (46.2) Remeasurement in retirement
scheme assets – – (0.4) – – (0.4)
Transactions with owners – (309.1) (772.7) – – (1 081.8)
Dividends paid – – (866.5) – – (866.5) Share purchases – (423.4) – – – (423.4) Net effect of settlement of
employee share options – 114.3 (112.4) – – 1.9 Share-based payments expense – – 206.2 – – 206.2
At 25 February 2018 as published 6.0 (863.4) 4 951.7 – (70.7) 4 023.6
Adoption of IFRS 9 Financial instruments 12 – – (30.2) – – (30.2)
Total comprehensive income for the period – – 1 628.1 3.1 (266.2) 1 365.0
Profit for the period – – 1 649.5 – – 1 649.5 Foreign currency translations – – – – (266.2) (266.2) Movement in cash flow hedge – – – 3.1 – 3.1 Remeasurement in retirement
scheme assets – – (21.4) – – (21.4)
Other reserve movements – – – (9.1) – (9.1)
Transactions with owners – (130.3) (902.2) – – (1 032.5)
Dividends paid – – (938.0) – – (938.0) Share purchases – (311.2) – – – (311.2) Net effect of settlement of
employee share options – 180.9 (180.6) – – 0.3 Share-based payments expense – – 216.4 – – 216.4
At 3 March 2019 6.0 (993.7) 5 647.4 (6.0) (336.9) 4 316.8
GROUP STATEMENT OF CHANGES IN EQUITYfor the period ended

Pick n Pay summarised audited Group annual financial statements for the 53 weeks ended 3 March 2019 15
53 weeks to 3 March
2019 Rm
52 weeks to 25 February
2018 Rm
Cash flows from operating activitiesTrading profit 2 175.6 1 819.9
Adjusted for non-cash items 1 518.4 1 419.7
Amortisation 175.4 174.1 Depreciation 1 026.1 913.5 Share-based payments expense 216.4 206.2 Movement in net operating lease liabilities 123.0 144.0 Movements in retirement scheme assets (4.5) (2.9) Fair value gains (18.0) (15.2)
Cash generated before movements in working capital 3 694.0 3 239.6 Movements in working capital (850.7) (119.4)
Movements in trade and other payables and deferred revenue (160.8) 322.3 Movements in inventory and right of return asset 238.6 (275.7) Movements in trade and other receivables (928.5) (166.0)
Cash generated from trading activities 2 843.3 3 120.2 Interest received 258.8 184.1 Interest paid (349.3) (331.2)
Cash generated from operations 2 752.8 2 973.1 Dividends paid (938.0) (866.5) Tax paid (817.3) (320.3)
Cash generated from operating activities 997.5 1 786.3
Cash flows from investing activitiesInvestment in intangible assets (151.5) (101.4) Investment in property, plant and equipment (1 312.5) (1 445.9) Improvements to non-current asset held for sale – (4.4) Proceeds on sale of non-current asset held for sale 217.2 – Purchase of operations (10.5) (96.2) Proceeds on disposal of intangible assets 0.3 0.6 Proceeds on disposal of property, plant and equipment 168.2 50.7 Loans (advanced)/repaid (22.7) 5.8
Cash utilised in investing activities (1 111.5) (1 590.8)
Cash flows from financing activitiesBorrowings raised 4 700.0 445.3 Repayment of borrowings (3 903.8) (50.6) Share purchases (311.2) (423.4) Proceeds from employees on settlement of share options 0.3 1.9
Cash generated from/(utilised in) financing activities 485.3 (26.8)
Net increase in cash and cash equivalents 371.3 168.7 Net cash and cash equivalents at beginning of period (670.9) (838.1) Foreign currency translations 2.8 (1.5)
Net cash and cash equivalents at end of period (296.8) (670.9)
Consisting of:Cash and cash equivalents 1 503.2 1 129.1 Overnight borrowings (1 800.0) (1 800.0)
GROUP STATEMENT OF CASH FLOWSfor the period ended

Pick n Pay summarised audited Group annual financial statements for the 53 weeks ended 3 March 201916
1. BASIS OF PREPARATION AND ACCOUNTING POLICIESThe summarised Group financial statements for the period ended 3 March 2019 are prepared in accordance with the JSE Listings Requirements for abridged reports, and the requirements of the Companies Act, as applicable to summarised financial statements. The Listings Requirements require abridged reports to be prepared in accordance with the framework concepts and the measurement and recognition requirements of International Financial Reporting Standards (IFRS) and the SAICA Financial Reporting Guides, as issued by the Accounting Practices Committee, and the Financial Pronouncements, as issued by the Financial Reporting Standards Council, and to also, as a minimum, contain the information required by IAS 34 Interim Financial Reporting.
The summarised Group financial statements do not include all the information required by IFRS for full financial statements and should be read in conjunction with the 2019 audited Group annual financial statements. The accounting policies applied in the preparation of the audited Group annual financial statements, from which the summarised Group financial statements were derived, are in terms of IFRS and are consistent with those applied in the financial statements for the 52 weeks ended 25 February 2018, except where the Group has adopted new standards effective for financial year-ends starting on or after 1 January 2018 (refer to note 12). The Group has not early adopted any other standard, interpretation or amendment that has been issued but is not yet effective.
These summarised Group financial statements are themselves not audited, but are extracted from audited information. The audited Group annual financial statements were audited by Ernst & Young Inc., who expressed an unmodified opinion thereon. The audited Group annual financial statements and the auditor’s report thereon are available for inspection at the Company’s (Pick n Pay Stores Limited) registered office.
The directors take full responsibility for the preparation of these summarised Group financial statements and the correct extraction of financial information from the underlying audited Group annual financial statements.
These summarised Group financial statements have been prepared by the Finance Division under the supervision of the Chief Finance Officer, Mr Bakar Jakoet CA(SA).
NOTES TO THE FINANCIAL INFORMATIONfor the period ended 3 March 2019

Pick n Pay summarised audited Group annual financial statements for the 53 weeks ended 3 March 2019 17
53 weeks to 3 March
2019Rm
Restated* 52 weeks to 25 February
2018Rm
2 REVENUERevenue from contracts with customers 89 678.4 81 859.4
Turnover 88 293.2 80 523.5 Franchise fee income 399.1 400.1 Commissions and other income 986.1 935.8
Operating lease income 527.8 446.1
Finance income 258.8 184.1
Bank balances and investments 190.7 131.2 Trade and other receivables 65.5 50.4 Staff loans and other 2.6 2.5
Revenue 90 465.0 82 489.6
Revenue recognised during the period from amounts included in deferred revenue at the beginning of the period amounted to R177.8 million (2018: R164.9 million). Refer to note 3.
Revenue from contracts with customers has been further disaggregated into geographical regions. Refer to note 7.
53 weeks to 3 March
2019Rm
Restated* 52 weeks to 25 February
2018Rm
3 DEFERRED REVENUEPrepaid gift card liability 136.1 138.0Smart Shopper loyalty programme liability 96.9 121.3Refund liability 23.2 22.0
256.2 281.3
Prepaid gift card liabilityGift cards can be redeemed as cash against future purchases, are redeemable on demand and expire 3 years after last date used. The balance outstanding at period end represents the fair value of the revenue received in advance, adjusted for an expected forfeiture rate of 5.4% (2018: 5.4%).
Smart Shopper loyalty programme liabilityCustomers are rewarded with Smart Shopper loyalty points (reward credits) or personal Smart Shopper discounts which are effectively redeemed as cash against future purchases. Smart Shopper loyalty points are redeemable on demand and expire on average 12 months after its award date. The balance outstanding at period end represents the stand-alone selling prices of points and discounts granted and yet to be redeemed, adjusted for an expected forfeiture rate of 17.5% (2018: 12.9%).
Refund liabilityCustomers are entitled to return goods purchased within a specified period of time, for a full or partial refund of the amount paid. The refund liability represents the amount of consideration that the Group does not expect to be entitled to because it will be refunded to customers within the next financial period. In addition, the Group recognised a right of return asset of R20.6 million (2018: R19.6 million) for its right to recover goods returned by the customer.* Prior period amounts restated for the adoption of new accounting standards, refer to note 12.
Pick n Pay summarised audited Group annual financial statements for the 53 weeks ended 3 March 201918
% change
53 weeks to 3 March
2019 Cents per
share
52 weeks to 25 February
2018Cents per
share
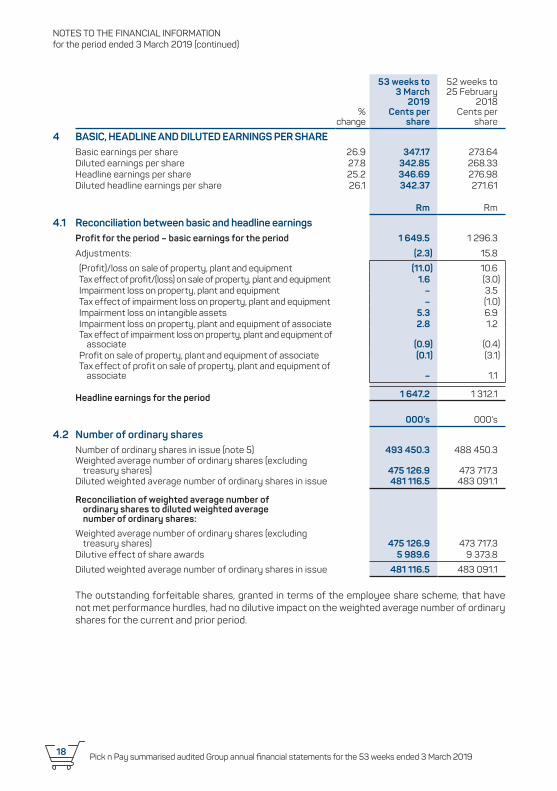
4 BASIC, HEADLINE AND DILUTED EARNINGS PER SHAREBasic earnings per share 26.9 347.17 273.64 Diluted earnings per share 27.8 342.85 268.33 Headline earnings per share 25.2 346.69 276.98 Diluted headline earnings per share 26.1 342.37 271.61
Rm Rm
4.1 Reconciliation between basic and headline earningsProfit for the period – basic earnings for the period 1 649.5 1 296.3
Adjustments: (2.3) 15.8
(Profit)/loss on sale of property, plant and equipment (11.0) 10.6 Tax effect of profit/(loss) on sale of property, plant and equipment 1.6 (3.0) Impairment loss on property, plant and equipment – 3.5 Tax effect of impairment loss on property, plant and equipment – (1.0)Impairment loss on intangible assets 5.3 6.9 Impairment loss on property, plant and equipment of associate 2.8 1.2 Tax effect of impairment loss on property, plant and equipment of
associate (0.9) (0.4) Profit on sale of property, plant and equipment of associate (0.1) (3.1) Tax effect of profit on sale of property, plant and equipment of
associate – 1.1
Headline earnings for the period 1 647.2 1 312.1
000’s 000’s
4.2 Number of ordinary sharesNumber of ordinary shares in issue (note 5) 493 450.3 488 450.3 Weighted average number of ordinary shares (excluding
treasury shares) 475 126.9 473 717.3 Diluted weighted average number of ordinary shares in issue 481 116.5 483 091.1
Reconciliation of weighted average number of ordinary shares to diluted weighted average number of ordinary shares:
Weighted average number of ordinary shares (excluding treasury shares) 475 126.9 473 717.3
Dilutive effect of share awards 5 989.6 9 373.8
Diluted weighted average number of ordinary shares in issue 481 116.5 483 091.1
The outstanding forfeitable shares, granted in terms of the employee share scheme, that have not met performance hurdles, had no dilutive impact on the weighted average number of ordinary shares for the current and prior period.
NOTES TO THE FINANCIAL INFORMATIONfor the period ended 3 March 2019 (continued)

Pick n Pay summarised audited Group annual financial statements for the 53 weeks ended 3 March 2019 19
53 weeks to 3 March
2019Rm
52 weeks to 25 February
2018Rm
5 SHARE CAPITAL5.1 Ordinary share capital
Authorised800 000 000 (2018: 800 000 000) ordinary shares of 1.25 cents each 10.0 10.0
Issued493 450 321 (2018: 488 450 321) ordinary shares of 1.25 cents each 6.0 6.0
000’s 000’s
The number of shares in issue at end of period is made up as follows:
Treasury shares held as hedge against share options granted (note 6) 9 576.5 6 654.9
Treasury shares allocated under the forfeitable share plan (note 6) 8 494.0 6 853.5
Shares held outside the Group 475 379.8 474 941.9
Total shares in issue at end of period 493 450.3 488 450.3
The Company can issue new shares to settle the Group’s obligations under its employee share schemes, but issues in this regard are limited, in aggregate, to 5% of total issued share capital or 24 672 516 (2018: 24 422 516) shares. During the period under review, 5 000 000 shares were issued to subsidiary companies within the Group as hedge against obligations under its employee share schemes. To date 15 743 000 (2018: 10 743 000) shares have been issued, resulting in 8 929 516 (2018: 13 679 516) shares remaining for this purpose.
The holders of ordinary shares are entitled to receive dividends as declared and are entitled to one vote per share at meetings of the Company.
Certain ordinary shares are stapled to B shares and are subject to restrictions upon disposal. Refer to note 5.2.
53 weeks to 3 March
2019Rm
52 weeks to 25 February
2018Rm
5.2 B Share capitalAuthorised1 000 000 000 (2018: 1 000 000 000) unlisted, non-convertible,
non-participating, no par value B shares – –
Issued259 682 869 (2018: 259 682 869) unlisted non-convertible,
non-participating, no par value B shares – –
B shares are stapled to ordinary shares and cannot be traded separately from each other. Stapled ordinary shares, together with B shares, are subject to restrictions upon disposal.
The holders of B shares are entitled to the same voting rights as holders of ordinary shares, but are not entitled to any rights to distributions by the Company or any other economic benefits. Refer to note 5.1.

Pick n Pay summarised audited Group annual financial statements for the 53 weeks ended 3 March 201920
53 weeks to 3 March
2019Rm
52 weeks to 25 February
2018Rm
6 TREASURY SHARESAt beginning of period 863.4 554.3 Shares purchased during the period 311.2 423.4 Take-up of share options by employees (180.9) (114.3)
At end of period 993.7 863.4
000’s 000’s
The movement in the number of treasury shares held is as follows:
At beginning of period 13 508.4 15 868.3 Shares purchased during the period 4 249.6 6 809.4 Shares sold during the period pursuant to the take-up of
share options by employees (3 606.5) (2 784.8) Shares delivered to participants of forfeitable share plan (1 081.0) (6 384.5) Shares issued (note 5) 5 000.0 –
At end of period 18 070.5 13 508.4
Comprises:As hedge against share options granted 9 576.5 6 654.9 Shares allocated under forfeitable share plan 8 494.0 6 853.5
NOTES TO THE FINANCIAL INFORMATIONfor the period ended 3 March 2019 (continued)

Pick n Pay summarised audited Group annual financial statements for the 53 weeks ended 3 March 2019 21
South AfricaRm
Rest of AfricaRm
Total operationsRm
7 OPERATING SEGMENTS53 weeks to 3 March 2019
Total segment revenue 86 541.0 4 838.9 91 379.9 Revenue from contracts with customers (note 2) 85 774.5 3 903.9 89 678.4 Operating lease income (note 2) 518.4 9.4 527.8 Finance income (note 2) 248.1 10.7 258.8 Direct deliveries* – 914.9 914.9
Segment external turnover 84 401.4 3 891.8 88 293.2
Profit before tax before capital items** 1 939.1 255.0 2 194.1 Profit before tax** 1 945.5 254.3 2 199.8
Other informationStatement of comprehensive income
Finance costs 347.8 1.5 349.3 Depreciation and amortisation 1 157.6 43.9 1 201.5 Profit on sale of property, plant and equipment 11.0 – 11.0Impairment loss on intangible assets 4.6 0.7 5.3 Share of associate’s income – 109.0 109.0
Statement of financial positionTotal assets 18 462.8 1 391.5 19 854.3 Total liabilities 14 997.1 540.4 15 537.5 Investment in associate – 184.4 184.4 Additions to non-current assets 1 438.2 34.5 1 472.7
52 weeks to 25 February 2018 restated#
Total segment revenue 78 703.5 4 648.1 83 351.6 Revenue from contracts with customers (note 2) 78 089.7 3 769.7 81 859.4 Operating lease income (note 2) 436.5 9.6 446.1 Finance income (note 2) 177.3 6.8 184.1 Direct deliveries* – 862.0 862.0
Segment external turnover 76 765.6 3 757.9 80 523.5
Profit before tax before capital items** 1 501.2 287.9 1 789.1 Profit before tax** 1 480.2 287.9 1 768.1
Other informationStatement of comprehensive income
Finance costs 331.1 0.1 331.2 Depreciation and amortisation 1 044.2 43.4 1 087.6 Loss on sale of property, plant and equipment (10.6) – (10.6)Impairment loss on intangible assets 6.9 – 6.9 Impairment loss on property, plant and equipment 3.5 – 3.5 Share of associate’s income – 116.3 116.3
Statement of financial positionTotal assets 17 193.2 1 787.3 18 980.5 Total liabilities 14 354.1 602.8 14 956.9 Investment in associate – 365.6 365.6 Additions to non-current assets 1 625.8 22.7 1 648.5
* Included in segmental revenue, as reviewed by the CODM, are direct deliveries by in-country suppliers to foreign franchisees, in countries where the Group does not have a statutory presence. These deliveries do not qualify as revenue in terms of IFRS but are included in segmental revenue for the purposes of the Group’s review of operating segments. In countries where the Group has statutory presence, including South Africa, direct deliveries are included in the Group’s reported revenue.
** Segmental profit before tax and profit before tax before capital items is the reported measure used for evaluating the performance of the Group’s operating segments. On an overall basis, the segmental profit before tax and profit before tax before capital items is equal to the Group’s reported profit before tax and profit before tax before capital items. The Rest of Africa segment’s segmental profit before tax and profit before tax before capital items comprises the segment’s trading result and directly attributable costs only. No allocations are made for indirect or incremental costs incurred by the South Africa segment relating to the Rest of Africa segment.
# Prior period disclosures relating to segmental revenue, have been expanded in line with the adoption of IFRS 15 Revenue from Contracts with Customers. Refer to note 12.

Pick n Pay summarised audited Group annual financial statements for the 53 weeks ended 3 March 201922
8 INVESTMENT IN ASSOCIATE8.1 Accounting for the investment in associate
The Group has a 49% investment in TM Supermarkets (Pvt) Limited (TM Supermarkets), a private company incorporated in Zimbabwe which operates supermarkets throughout Zimbabwe.
Since the adoption of multiple currencies by the Zimbabwean Government in 2009, entities in Zimbabwe have been operating in a multi-currency regime. Historically, the US dollar was designated as the functional and presentation currency for our associate in Zimbabwe.
Ongoing US dollar shortages experienced in Zimbabwe have led to the increased use of electronic tender through the Real Time Gross Settlement (RTGS) system. The increased reliance on RTGS as a settlement mechanism effectively resulted in RTGS becoming a de facto currency.
On 1 October 2018, the Reserve Bank of Zimbabwe (RBZ) directed all banks to ring-fence Nostro foreign currency accounts (FCAs) by separating them into two categories, namely nostro FCAs and RTGS FCAs. Authorities maintained that the US dollar represented in the RTGS system was at a 1:1 exchange ratio, however there was growing consensus among market participants that this did not reflect economic reality. In line with industry consensus on the matter, this event and industry discussion that followed led to a change in functional currency to RTGS dollar for our associate in Zimbabwe, with effect from 1 October 2018.
On 20 February 2019, the RBZ announced that the RTGS would be recognised as an official currency and that an interbank foreign exchange market would be established to formalise trading in RTGS balances with other currencies. The official interbank exchange rate on 3 March 2019 was 2.5 RTGS dollar to the US dollar.
For the period under review, judgements have been applied in the estimation and application of an exchange rate of 3.3 RTGS dollar to the US dollar (RTGS rate). Management has assessed that the official interbank exchange rate of 2.5 RTGS dollar to the US dollar is not available for immediate settlement as shortages of foreign currency results in the official exchange rate not being liquid. The inputs considered in this estimate include the recent announcement to increase the fuel price for those settling in RTGS dollar, and the official inflation rate. In addition, the premium at which Old Mutual and PPC shares trade on the Zimbabwe stock exchange versus the JSE was taken into consideration as an approximate indicator of an appropriate exchange rate.
The application of the change in functional currency has been applied prospectively. For inclusion in our Group statement of comprehensive income and statement of cash flows, results from the Group’s associate have been translated at the average US dollar exchange rate for the period up to 30 September 2018, and at an estimated RTGS dollar rate for the remainder of the financial period. For inclusion in the Group statement of financial position, results from our associate have been translated at the closing RTGS dollar rate as determined by management.
NOTES TO THE FINANCIAL INFORMATIONfor the period ended 3 March 2019 (continued)

Pick n Pay summarised audited Group annual financial statements for the 53 weeks ended 3 March 2019 23
8 INVESTMENT IN ASSOCIATE (continued)8.1 Accounting for the investment in associate (continued)
The table below summarises the exchange rates at which the results of TM Supermarkets have been translated into South African rand.
Functional currency
Average rate
Closing rate
26 February 2018 to 30 September 2018 US dollar 13.08 14.121 October 2018 to 3 March 2019 RTGS dollar 4.29* 4.28**
* Calculated using the average US dollar to rand exchange rate of R14.15 for the period 1 October 2018 to 3 March 2019 divided by the estimated RTGS dollar rate of 3.3 to 1 US dollar.
** Calculated using the closing US dollar to rand exchange rate of R14.12 at 3 March 2019 divided by the estimated RTGS dollar rate of 3.3 to 1 US dollar.
53 weeks to 3 March
2019Rm
52 weeks to 25 February
2018Rm
8.2 Reconciliation of investment in associateAt beginning of period 365.6 309.7 Share of associate’s income 109.0 116.3 Foreign currency translation (290.2) (37.6) Dividend declared by associate – (22.8)
At end of period 184.4 365.6
8.3 Sensitivity analysisThe table below highlights the sensitivity impact of the possible changes in the RTGS dollar exchange rate on the statement of comprehensive income and statement of financial position of the Group. All accounting principles applied by management, as stated in note 8.1, remained consistent in the preparation of this sensitivity analysis, with the exception of the RTGS dollar to US dollar rate applied.
53 weeks to 3 March 2019RTGS:USD
2.5:1
As reportedRTGS:USD
3.3:1RTGS:USD
4.0:1
Investment in associate (Rm) 243.4 184.4 152.1 Share of associate's income (Rm) 137.2 109.0 94.0 Net asset value (cents per share) 1 115.3 1 056.3 1 024.0

Pick n Pay summarised audited Group annual financial statements for the 53 weeks ended 3 March 201924
9 RELATED PARTY TRANSACTIONSDuring the period under review, in the ordinary course of business, certain companies within the Group entered into transactions with each other. These inter-group transactions and related balances are eliminated on consolidation.
Related parties are unchanged from those reported at 25 February 2018. For further information please refer to note 26 of the 2019 audited Group annual financial statements and note 8 of the 2019 audited Company annual financial statements.
10 FINANCIAL INSTRUMENTSAll financial instruments held by the Group are measured at amortised cost, with the exception of financial instruments at fair value through profit or loss and derivatives designated as hedging instruments, as set out below:
53 weeks to 3 March
2019Rm
52 weeks to 25 February
2018Rm
Financial instruments at fair value through profit of lossInvestment in insurance cell captive – level 2 35.2 25.7
Derivatives designated as hedging instrumentsForward exchange contract assets/(liabilities) – level 2 3.1 (8.5)
The fair value of financial instruments that are not traded in active markets are determined by using valuation techniques. If all significant inputs required to fair value an instrument are observable, the instruments are included in level 2.
The carrying value of all other financial instruments approximate their fair value.
There have been no transfers between level 1, level 2 and level 3 of the fair value hierarchy during the period.
In accordance with IFRS 9 Financial Instruments, as a new accounting policy, the Group now applies hedge accounting on its forward exchange contracts. The forward exchange contracts are classified as cash flow hedges, utilised as hedge against imports of goods for resale denominated in currencies other than South African rand.
53 weeks to 3 March
2019Rm
52 weeks to 25 February
2018Rm
11 COMMITMENTSAuthorised capital expenditure
Contracted for 41.4 231.0
Property – 69.8 Furniture, fittings, equipment and vehicles 39.9 67.8 Intangible assets 1.5 93.4
Not contracted for 1 958.6 1 469.0
Property 39.5 20.0 Furniture, fittings, equipment and vehicles 1 829.2 1 417.2 Intangible assets 89.9 31.8
Total commitments 2 000.0 1 700.0
NOTES TO THE FINANCIAL INFORMATIONfor the period ended 3 March 2019 (continued)
Pick n Pay summarised audited Group annual financial statements for the 53 weeks ended 3 March 2019 25
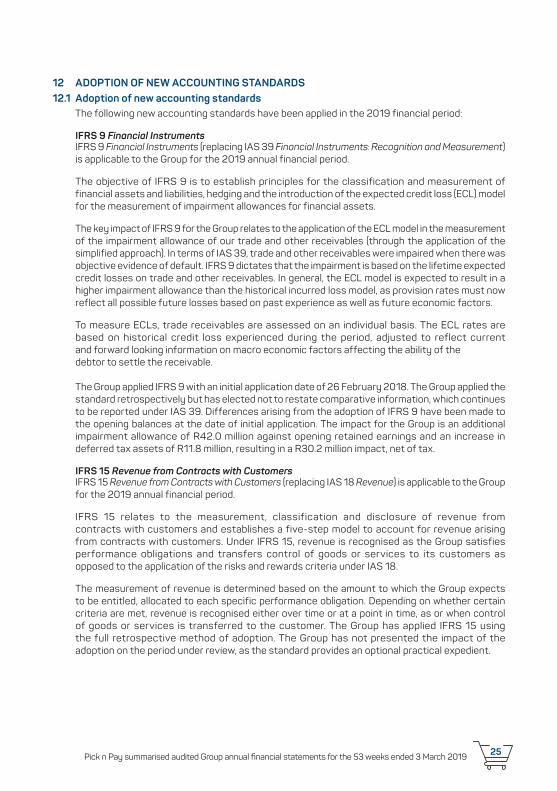
12 ADOPTION OF NEW ACCOUNTING STANDARDS 12.1 Adoption of new accounting standards
The following new accounting standards have been applied in the 2019 financial period:
IFRS 9 Financial InstrumentsIFRS 9 Financial Instruments (replacing IAS 39 Financial Instruments: Recognition and Measurement) is applicable to the Group for the 2019 annual financial period.
The objective of IFRS 9 is to establish principles for the classification and measurement of financial assets and liabilities, hedging and the introduction of the expected credit loss (ECL) model for the measurement of impairment allowances for financial assets.
The key impact of IFRS 9 for the Group relates to the application of the ECL model in the measurement of the impairment allowance of our trade and other receivables (through the application of the simplified approach). In terms of IAS 39, trade and other receivables were impaired when there was objective evidence of default. IFRS 9 dictates that the impairment is based on the lifetime expected credit losses on trade and other receivables. In general, the ECL model is expected to result in a higher impairment allowance than the historical incurred loss model, as provision rates must now reflect all possible future losses based on past experience as well as future economic factors.
To measure ECLs, trade receivables are assessed on an individual basis. The ECL rates are based on historical credit loss experienced during the period, adjusted to reflect current and forward looking information on macro economic factors affecting the ability of the debtor to settle the receivable.
The Group applied IFRS 9 with an initial application date of 26 February 2018. The Group applied the standard retrospectively but has elected not to restate comparative information, which continues to be reported under IAS 39. Differences arising from the adoption of IFRS 9 have been made to the opening balances at the date of initial application. The impact for the Group is an additional impairment allowance of R42.0 million against opening retained earnings and an increase in deferred tax assets of R11.8 million, resulting in a R30.2 million impact, net of tax.
IFRS 15 Revenue from Contracts with CustomersIFRS 15 Revenue from Contracts with Customers (replacing IAS 18 Revenue) is applicable to the Group for the 2019 annual financial period.
IFRS 15 relates to the measurement, classification and disclosure of revenue from contracts with customers and establishes a five-step model to account for revenue arising from contracts with customers. Under IFRS 15, revenue is recognised as the Group satisfies performance obligations and transfers control of goods or services to its customers as opposed to the application of the risks and rewards criteria under IAS 18.
The measurement of revenue is determined based on the amount to which the Group expects to be entitled, allocated to each specific performance obligation. Depending on whether certain criteria are met, revenue is recognised either over time or at a point in time, as or when control of goods or services is transferred to the customer. The Group has applied IFRS 15 using the full retrospective method of adoption. The Group has not presented the impact of the adoption on the period under review, as the standard provides an optional practical expedient.

Pick n Pay summarised audited Group annual financial statements for the 53 weeks ended 3 March 201926
12 ADOPTION OF NEW ACCOUNTING STANDARDS (continued)12.1 Adoption of new accounting standards (continued)
The key impacts of IFRS 15 for the Group relates to the following:
– The IFRS 15 principles dictate that revenue is recognised as and when the control over goods and services are transferred to customers. This impacted the Group’s assessment of whether it is the agent or the principal when recognising revenue from certain value-added services. In certain instances, revenue from these value-added services previously recognised on a gross basis as turnover and cost of merchandise sold is now required to be recognised on a net basis in other income.
– IFRS 15 requires that all discounts, rebates or loyalty payments to customers should be deducted from revenue, unless it is directly funded by suppliers. All Group discounts and the related supplier funding were reviewed and, discounts are now adjusted against revenue only if there is no direct funding from suppliers.
– Right of return assets, previously disclosed as trade and other receivables, have been reclassified and presented separately on the statement of financial position.
– Deferred revenue, previously disclosed as trade and other payables, have been reclassified and presented separately on the statement of financial position.
Relevant prior period financial information has been restated and reclassified, with no impact on the Group’s previously reported earnings and headline earnings. The Group has not disclosed the impact of the adoption on the period preceding the prior period, as the adoption of IFRS 15 had no material impact on previously reported earnings, headline earnings and the statement of financial position.
12.2 Impact of adoption of IFRS 15 on the statement of comprehensive income for the 52 weeks ended 25 February 2018
Restated 52 weeks to 25 February
2018 Rm
Impact of IFRS 15
Rm
As previously published
52 weeks to 25 February
2018 Rm
Revenue 82 489.6 (1 015.2) 83 504.8
Turnover 80 523.5 (1 036.6) 81 560.1 Cost of merchandise sold (65 294.6) 1 015.2 (66 309.8)
Gross profit 15 228.9 (21.4) 15 250.3 Other income 1 782.0 21.4 1 760.6
Commissions and other income 935.8 21.4 914.4
Profit for the period 1 296.3 – 1 296.3
12.3 Impact of adoption of IFRS 15 on the statement of financial position as at 25 February 2018
Restated As at
25 February 2018
Rm
Impact of IFRS 15
Rm
As previously published
As at 25 February
2018 Rm
Inventory 5 944.1 (19.6) 5 963.7 Right of return asset 19.6 19.6 –Trade and other payables 10 539.3 (281.3) 10 820.6 Deferred revenue 281.3 281.3 –
NOTES TO THE FINANCIAL INFORMATIONfor the period ended 3 March 2019 (continued)

Pick n Pay summarised audited Group annual financial statements for the 53 weeks ended 3 March 2019 27
13 ACCOUNTING STANDARDS AND INTERPRETATIONS ISSUED BUT NOT YET ADOPTED
International Financial Reporting Standards (IFRS)There are a number of new standards, amendments to standards and interpretations that are applicable to the Group with an effective date after the date of the 2019 audited Group annual financial statements, and have not been applied in preparing the 2019 audited Group annual financial statements. The standard expected to have a key impact on the Group is IFRS 16 Leases.
IFRS 16 Leases (effective for the Group for the financial period ending February 2020)The Group will adopt IFRS 16 from 4 March 2019, the start of its financial period ending 2 March 2020. IFRS 16 replaces IAS 17 Leases and requires lessees to account for all leases under a single on-balance sheet model, in a similar manner to finance leases under IAS 17. The only exceptions are short-term and low-value leases.
As a result, most of the leases in the Group’s extensive lease portfolio will now be brought onto the statement of financial position. Under IFRS 16, the leases of most retail premises in the Group will be recognised as an asset, representing the right to use the premises, with a corresponding lease liability, representing the obligation to pay rent.
Changes to the statement of comprehensive income will result in the current operating lease payments being replaced by the amortisation of the right-of-use assets and the associated finance costs of the lease liability. The amortisation of the right-of-use assets is recorded on a straight-line basis over the lease term while the associated finance costs of the lease liability is front-loaded. IFRS 16 will therefore result in a higher upfront net charge (amortisation plus finance costs) for new and young leases when compared to the related operating lease expense recorded under IAS 17. The inverse would be true for more mature leases. This will have no impact on the cash flow of the Group, although some classifications in the statement of cash flow line items will be affected. The Group has an extensive portfolio of leases of various maturities. The Group’s lease terms ranges between one and 20 years. Most of its stores are leased with non-cancellable operating lease commitments of R17.3 billion as at the reporting date (refer to note 11 of the 2019 audited Group annual financial statements), representing the approximate undiscounted value of the lease liability under IFRS 16, without including any lease renewal periods. The application of IFRS 16 will have a material impact on the Group’s statement of financial position, statement of comprehensive income and classifications in the statement of cash flows.
The Group also has numerous head lease arrangements where it sublets to its franchisees. In these instances, IFRS 16 requires the recognition of the obligation to pay rent under the head lease as a lease liability, with a corresponding asset representing the rent receivable from the franchisee under the sublease arrangement. In most instances, the accounting for the head lease and the sublease under IFRS 16 has an equal and opposite impact on the statement of comprehensive income, similar to the net impact under IAS 17. Changes on the following line items will however occur: operating lease income, operating lease expenses, finance income and finance costs. More than one third of our franchise stores are subject to sublease arrangements with non-cancellable operating lease receivables of R2.8 billion as at the reporting date (refer note 11 of the 2019 audited Group annual financial statements) representing the approximate undiscounted value of the lease receivable under IFRS 16, without including any lease renewal periods.

Pick n Pay summarised audited Group annual financial statements for the 53 weeks ended 3 March 201928
NOTES TO THE FINANCIAL INFORMATIONfor the period ended 3 March 2019 (continued)
13 ACCOUNTING STANDARDS AND INTERPRETATIONS ISSUED BUT NOT YET ADOPTED (continued)IFRS 16 Leases (effective for the Group for the financial period ending February 2020) (continued)To ensure year-on-year comparability of financial information, the Group will adopt IFRS 16 using the full retrospective approach. Given the complex nature and maturity of the Group’s lease portfolio, an extensive project is in its final stages to determine the current and historical financial implications. First time disclosure of the IFRS 16 impacts will be made ahead of our interim result announcement in October 2019, once the impact has been assessed by our external auditors.
The application of IFRS 16 will result in changes to the statement of financial position, statement of comprehensive income and cash flow statement line items, including, but not limited to, property, plant and equipment, operating lease assets, operating lease liabilities, deferred tax, occupancy costs, operational costs, finance income and finance costs. More specifically, items such as amortisation, operating lease expenses and operating lease income will be impacted. Key balance sheet metrics such as leverage, finance ratios and debt covenants and income statement metrics, such as earnings before interest, taxes, depreciation and amortisation (EBITDA), will be impacted. IFRS 16 will have no impact on the cash generation of the Group.
The following new or amended standards are not expected to have a significant impact on the Group’s financial statements:
– Foreign currency transactions and advance consideration (IFRIC Interpretation 22) – Investments in associates and joint ventures - clarification that measuring investees at fair value
through profit or loss is an investment-by-investment choice (amendments to IAS 28) – Uncertainty over income tax treatments (IFRIC Interpretation 23) – Prepayment features with negative compensation (amendments to IFRS 9) – Long-term interests in associates and joint ventures (amendments to IAS 28) – Plan amendment, curtailment or settlement (amendments to IAS 19) – Accounting for acquisitions of interests in joint operations (amendments to IFRS 3) – Accounting for acquisitions of interests in joint arrangements (amendments to IFRS 11) – Income tax consequences of payments on financial instruments classified as equity
(amendments to IAS 12) – Borrowing costs eligible for capitalisation (amendments to IAS 23) – Definition of a business (amendments to IFRS 3) – Definition of material (amendments to IAS 1 and IAS 8) – Sale of contribution of assets between an investor and its associate or joint venture (amendments
to IFRS 10 and IAS 28)

Pick n Pay summarised audited Group annual financial statements for the 53 weeks ended 3 March 2019 29
APPENDIX
PRO FORMA INFORMATIONCertain financial information presented in these summarised annual financial results constitutes pro forma financial information.
BASIS OF PREPARATION: 52-WEEK FINANCIAL INFORMATION The Group manages its retail operations on a 52-week trading calendar where the reporting period will always end on a Sunday. To ensure calendar alignment, a 53rd week of trading is required approximately every six years and as a result, the current financial year includes a 53rd week.
In order to provide useful and transparent comparative information, a 52-week period result for the current financial period (“52-week financial information”) is presented for comparison against the corresponding 52-week result, as reported in the previous financial year. The 52-week financial information constitutes pro forma financial information.
The 52-week financial information is presented for illustrative purposes only and is the responsibility of the Board of directors of the Group. Due to its nature, the 52-week financial information may not fairly represent the Group’s financial position, changes in equity, results of operations and cash flows.
The Group’s external auditor has issued a reporting accountants’ report on the 52-week financial information as presented in the table on page 30. The 52-week financial information has been extracted from the Group annual financial statements. The reporting accountants’ report on the 52-week financial information included in the Group annual financial statements is available for inspection at the Group’s registered office.
The 52-week financial information for the 52 weeks ended 24 February 2019 as presented, consists of the audited Group results for the 53 weeks to 3 March 2019, less the impact of the week from 25 February 2019 to 3 March 2019 (the 53rd week). The Group’s accounting policies as adopted in the audited Group annual financial statements for the financial period ended 3 March 2019, which have been prepared in accordance with International Financial Reporting Standards, have been used in the preparation of the 52-week financial information. The calculation of earnings per share, headline earnings per share and diluted headline earnings per share for the pro forma 52 weeks is based on the weighted average number of shares in issue over the full 53-week period.
The 53rd week financial impact was calculated as follows:
• Revenue and related cost of sales adjusted for the week of 25 February 2019 to 3 March 2019.
• Other income and expenses related to the week based on an assessment of management information.
• The relevant amounts for the 53rd week have been extracted and recalculated from the Group’s accounting records.
• The tax rate applied is equal to the Group’s effective tax rate for the 53 weeks ended 3 March 2019.
The 53rd week financial impact as calculated, in the opinion of the directors of the Group, fairly reflects the result of the week of 25 February 2019 to 3 March 2019.

Pick n Pay summarised audited Group annual financial statements for the 53 weeks ended 3 March 201930
APPENDIX (continued)
The table below presents the impact of week 53:
As reported53 weeks to
3 March20191
Rm Week 532
Rm
Pro forma 52 weeks to 24 February
20193
Rm
As reported 52 weeks to 25 February
20184 Rm
Revenue 90 465.0 2 045.1 88 419.9 82 489.6
Turnover 88 293.2 2 022.0 86 271.2 80 523.5Cost of merchandise sold (71 539.3) (1 685.2) (69 854.1) (65 294.6)
Gross profit 16 753.9 336.8 16 417.1 15 228.9Other income 1 913.0 23.1 1 889.9 1 782.0
Franchise fee income 399.1 9.2 389.9 400.1Operating lease income 527.8 – 527.8 446.1Commissions and other income 986.1 13.9 972.2 935.8
Trading expenses (16 491.3) (233.3) (16 258.0) (15 191.0)
Employee costs (7 238.9) (136.9) (7 102.0) (6 688.7)Occupancy (3 326.8) (27.3) (3 299.5) (3 086.6)Operations (3 515.5) (52.5) (3 463.0) (3 178.8)Merchandising and administration (2 410.1) (16.6) (2 393.5) (2 236.9)
Trading profit 2 175.6 126.6 2 049.0 1 819.9Net interest paid (90.5) – (90.5) (147.1)Share of associate’s income 109.0 – 109.0 116.3
Profit before tax before capital items 2 194.1 126.6 2 067.5 1 789.1Profit/(loss) on capital items 5.7 – 5.7 (21.0)
Profit before tax 2 199.8 126.6 2 073.2 1 768.1Tax (550.3) (31.7) (518.6) (471.8)
Profit for the period 1 649.5 94.9 1 554.6 1 296.3
Headline earnings 1 647.2 94.9 1 552.3 1 312.1
Earnings per share Cents Cents Cents Cents
Basic earnings per share 347.17 19.97 327.20 273.64Diluted earnings per share 342.85 19.73 323.12 268.33Headline earnings per share 346.69 19.98 326.71 276.98Diluted headline earnings per share 342.37 19.72 322.65 271.61
South Africa operating segment Rm Rm Rm Rm
Total segment revenue 86 541.0 1 972.2 84 568.8 78 703.5Segmental external turnover 84 401.4 1 949.5 82 451.9 76 765.6Profit before tax before capital items 1 939.1 113.6 1 825.5 1 501.2Profit before tax 1 945.5 113.6 1 831.9 1 480.2
Rest of Africa operating segment Rm Rm Rm Rm
Total segment revenue 4 838.9 89.5 4 749.4 4 648.1Segmental external turnover 3 891.8 72.5 3 819.3 3 757.9Profit before tax before capital items 255.0 13.0 242.0 287.9Profit before tax 254.3 13.0 241.3 287.9
1 Presents the audited Group result for the 53 weeks ended 3 March 20192 Presents the financial impact of the week from 25 February 2019 to 3 March 2019 (the 53rd week)3 Presents the 52-week financial information for the 52 weeks ended 24 February 20194 Presents the audited Group result for the 52 weeks ended 25 February 2018

Pick n Pay summarised audited Group annual financial statements for the 53 weeks ended 3 March 2019 31
The table below presents the Group profit for the current and previous period on a comparable basis, after removing the impact of week 53.
Pro forma52 weeks to24 February
2019Rm
% ofturnover % change
As reported52 weeks to25 February
2018Rm
% ofturnover
Revenue 88 419.9 7.2 82 489.6
Turnover 86 271.2 7.1 80 523.5Cost of merchandise sold (69 854.1) 7.0 (65 294.6)
Gross profit 16 417.1 19.0 7.8 15 228.9 18.9Other income 1 889.9 2.2 6.1 1 782.0 2.2
Franchise fee income 389.9 0.5 (2.5) 400.1 0.5Operating lease income 527.8 0.6 18.3 446.1 0.6Commissions and other income 972.2 1.1 3.9 935.8 1.2
Trading expenses (16 258.0) 18.8 7.0 (15 191.0) 18.9
Employee costs (7 102.0) 8.2 6.2 (6 688.7) 8.3Occupancy (3 299.5) 3.8 6.9 (3 086.6) 3.8Operations (3 463.0) 4.0 8.9 (3 178.8) 3.9Merchandising and administration (2 393.5) 2.8 7.0 (2 236.9) 2.8
Trading profit 2 049.0 2.4 12.6 1 819.9 2.3Net interest paid (90.5) 0.1 (38.5) (147.1) 0.2Share of associate’s income 109.0 0.1 (6.3) 116.3 0.1
Profit before tax before capital items 2 067.5 2.4 15.6 1 789.1 2.2Profit/(loss) on capital items 5.7 (21.0)
Profit before tax 2 073.2 2.4 17.3 1 768.1 2.2Tax (518.6) 0.6 (471.8) 0.6
Profit for the period 1 554.6 1.8 19.9 1 296.3 1.6
Earnings per share Cents % change Cents
Basic earnings per share 327.20 19.6 273.64Diluted earnings per share 323.12 20.4 268.33Headline earnings per share 326.71 18.0 276.98Diluted headline earnings per share 322.65 18.8 271.61
South Africa operating segment Rm % change Rm
Total segment revenue 84 568.8 7.5 78 703.5Segmental external turnover 82 451.9 7.4 76 765.6Profit before tax before capital items 1 825.5 21.6 1 501.2Profit before tax 1 831.9 23.8 1 480.2
Rest of Africa operating segment Rm % change Rm
Total segment revenue 4 749.4 2.2 4 648.1Segmental external turnover 3 819.3 1.6 3 757.9Profit before tax before capital items 242.0 (15.9) 287.9Profit before tax 241.3 (16.2) 287.9

Pick n Pay summarised audited Group annual financial statements for the 53 weeks ended 3 March 201932
BASIS OF PREPARATION: CONSTANT CURRENCY PRO FORMA INFORMATIONConstant currency information constitutes pro forma financial information. The Group discloses constant currency information in order to report on the Group’s turnover and the Group’s Rest of Africa segmental revenue results, excluding the impact of foreign currency fluctuations (collectively the “constant currency pro forma information”).
The constant currency pro forma information has been presented to illustrate the impact of changes in the Group’s major foreign currencies, namely the Zambia kwacha and the Botswana pula, and has been presented on a 52-week basis for comparability purposes. The Group’s turnover growth in constant currency is calculated by translating the prior period local currency turnover at the current period average exchange rates on a country-by-country basis and then comparing that against the current period 52-week turnover translated at the 52-week average exchange rates. The segmental revenue growth in constant currency is calculated by translating the prior period local currency segmental revenue at the current period 52-week average exchange rates on a country-by-country basis and then comparing that against the current period 52-week segmental revenue translated at the current period 52-week average exchange rates. The average Zambia kwacha exchange rate to the South African rand is 0.79 (2018: 0.72) and the average Botswana pula exchange rate to the South African rand is 0.76 (2018: 0.79).
The constant currency pro forma information, which is the responsibility of the Group’s directors, has been presented for illustrative purposes and because of its nature may not fairly present the Group’s financial position, changes in equity or results of operations.
The Group’s external auditor has issued a reporting accountants’ report on the constant currency pro forma information. The constant currency pro forma information has been extracted from the Group annual financial statements. The reporting accountants’ report on the constant currency pro forma information included in the Group financial statements is available for inspection at the Group’s registered office.
52 weeks to 24 February 2019
% increasereportedcurrency
% increaseconstant currency
Rest of Africa segmental revenue 2.2 5.3Group turnover 7.1 7.3
ADDITIONAL INFORMATIONLIKE-FOR-LIKE TURNOVER GROWTH COMPARISONSLike-for-like turnover growth is a measure of the Group’s comparable turnover growth, removing the impact of store openings and closures in the current and previous reporting periods.
APPENDIX (continued)

Pick n Pay summarised audited Group annual financial statements for the 53 weeks ended 3 March 2019 33
25 February 2018 Opened Closed
Convertedopenings
Convertedclosures
3 March 2019
COMPANY-OWNEDPick n Pay 722 42 (10) 2 (7) 749 Hypermarkets 20 – – – – 20 Supermarkets 244 9 (2) 1 (4) 248 Local 38 1 (1) – – 38 Clothing 183 22 (5) – – 200 Liquor 235 10 (2) 1 (3) 241 Pharmacy 2 – – – – 2 Boxer 246 26 (3) 1 – 270 Supermarkets 152 13 – 1 – 166 Build 31 1 (1) – – 31 Liquor 43 12 – – – 55 Punch 20 – (2) – – 18
Total company-owned 968 68 (13) 3 (7) 1 019
FRANCHISEPick n PaySupermarkets 299 7 (4) 4 (2) 304
Family 281 7 (3) 3 (1) 287 Mini-markets 17 – (1) 1 – 17 Daily 1 – – – (1) –
Market 14 6 – – – 20 Express 119 32 – – – 151 Clothing 17 1 (1) – – 17 Liquor 211 15 (2) 3 (1) 226 Pharmacy – 1 – – – 1
Total franchise 660 62 (7) 7 (3) 719
Total Group stores 1 628 130 (20) 10 (10) 1 738
TM Supermarkets – associate 57 – – – – 57
Total with TM Supermarkets 1 685 130 (20) 10 (10) 1 795
AFRICAN FOOTPRINT – included in total stores
above 144 6 (2) – – 148
Pick n Pay company-owned 17 3 – – – 20 Boxer company-owned 7 2 – – – 9 Pick n Pay franchise 63 1 (2) – – 62 TM Supermarkets – associate 57 – – – – 57
AFRICAN FOOTPRINT – by country 144 6 (2) – – 148
Botswana 12 – – – – 12 Lesotho 3 – – – – 3 Namibia 38 – (2) – – 36 Eswatini 17 3 – – – 20 Zambia 17 3 – – – 20 Zimbabwe 57 – – – – 57
NUMBER OF STORES

Pick n Pay summarised audited Group annual financial statements for the 53 weeks ended 3 March 201934
PICK N PAY STORES LIMITED Registration number: 1968/008034/06JSE share code: PIK ISIN: ZAE000005443
BOARD OF DIRECTORS ExecutiveRichard Brasher (CEO)Aboubakar (Bakar) Jakoet (CFO)Richard van Rensburg (CIO)Suzanne Ackerman-Berman Jonathan Ackerman
Non-executiveGareth Ackerman (Chairman)David Robins
Independent non-executiveDavid FriedlandHugh HermanAlex MatholeAudrey Mothupi Lorato Phalatse (resigned during August 2018)Jeff van Rooyen
REGISTERED OFFICE Pick n Pay Office Park 101 Rosmead Avenue Kenilworth Cape Town 7708Tel: +27 21 658 1000Fax: +27 21 797 0314
Postal addressPO Box 23087 ClaremontCape Town 7735
REGISTRARComputershare Investor Services Proprietary LimitedRosebank Towers15 Biermann Avenue Rosebank 2196Tel: +27 11 370 5000Fax: +27 11 688 5248
Postal addressPO Box 61051Marshalltown 2107
JSE LIMITED SPONSOR Investec Bank Limited 100 Grayston DriveSandton 2196
AUDITORSErnst & Young Inc.
ATTORNEYSEdward Nathan Sonnenberg
PRINCIPLE TRANSACTIONAL BANKERSAbsa LimitedFirst National Bank
COMPANY SECRETARYDebra MullerEmail address: [email protected]
PROMOTION OF ACCESS TO INFORMATION ACTInformation Officer – Penny GerberEmail address: [email protected]
INVESTOR RELATIONSDavid NorthEmail address: [email protected]
Penny GerberEmail address: [email protected]
WEBSITEPick n Pay: www.pnp.co.zaInvestor relations: www.picknpayinvestor.co.za
CUSTOMER CARELINETel: +27 800 11 22 88Email address: [email protected]
ONLINE SHOPPINGTel: +27 860 30 30 30www.pnp.co.za
ENGAGE WITH US ON
CORPORATE INFORMATION

GREYMATTER & FINCH # 13086