Summarise the information - Ebi Tahasoni · Summarise the information ... Sequence graphs ......
29
Ebrahim Tahasoni Cert. TESOL, Academic IELTS 9.0 www.tahasoni.com
Transcript of Summarise the information - Ebi Tahasoni · Summarise the information ... Sequence graphs ......

Ebrahim Tahasoni
Cert. TESOL, Academic IELTS 9.0
www.tahasoni.com

Summarise the information
Select the main features
Report the main features
Make comparisons where relevant
Write at least 150 words 165-170 words
No maximum word limit
Write in about 20 minutes
Changes and trends
Values
Time periods
Degree of change
Speed of change
Break points
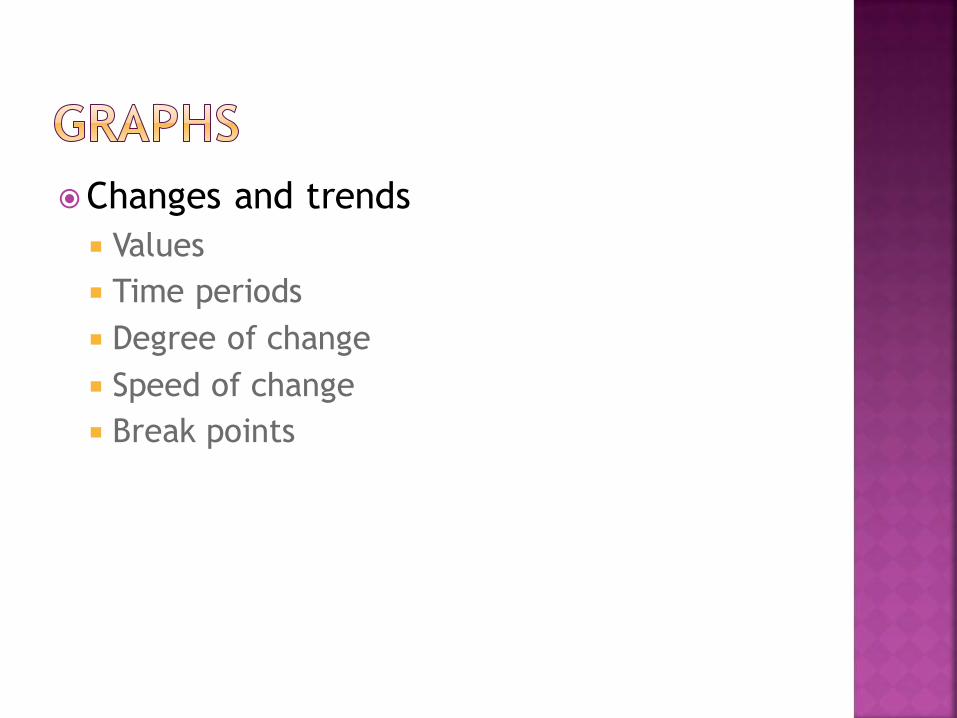
Single-variable line graph
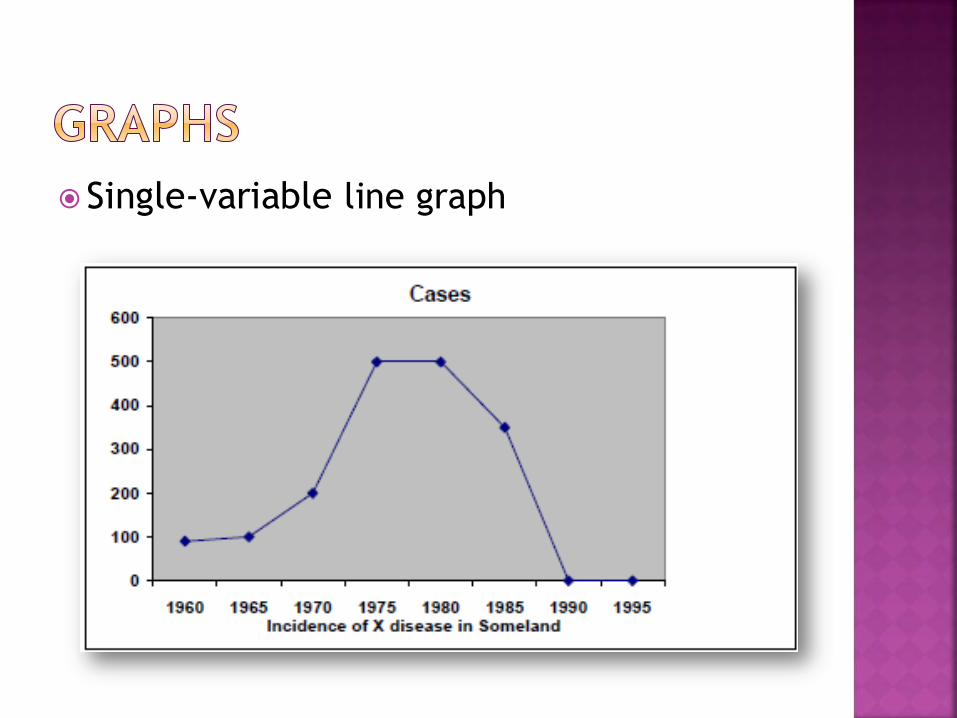
Multiple-variable line graph
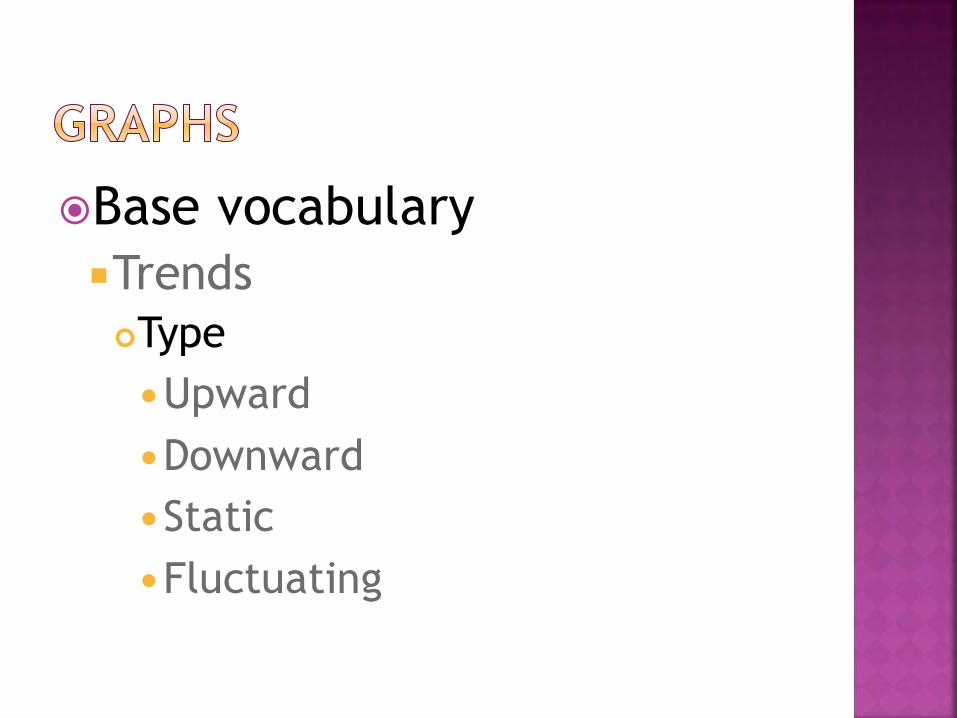
Base vocabulary
Trends
Type
Upward
Downward
Static
Fluctuating
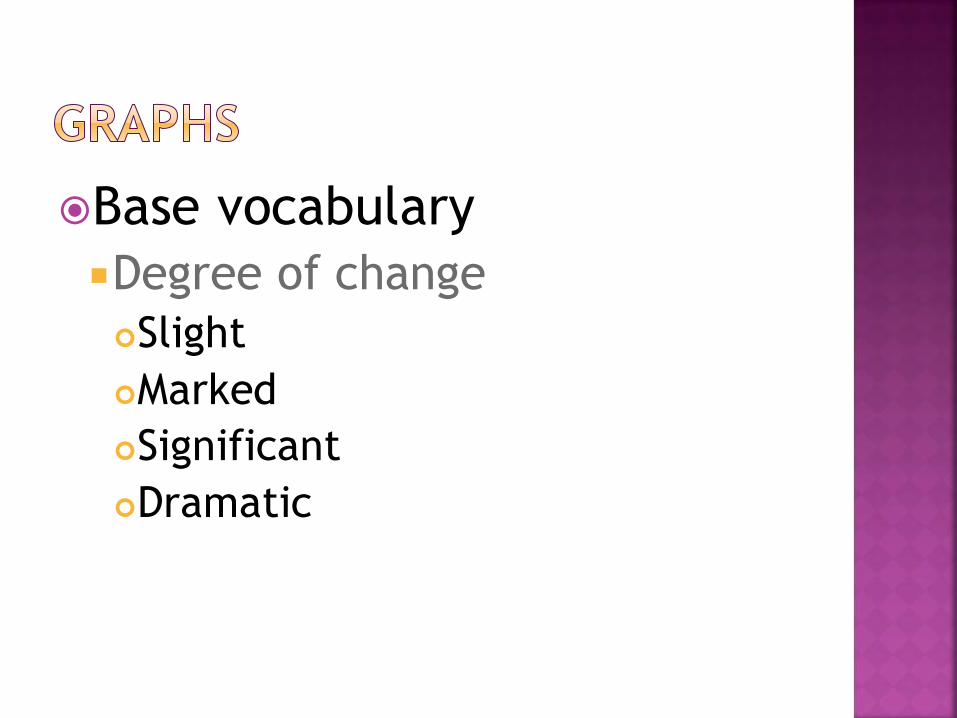
Base vocabulary
Degree of change
Slight
Marked
Significant
Dramatic
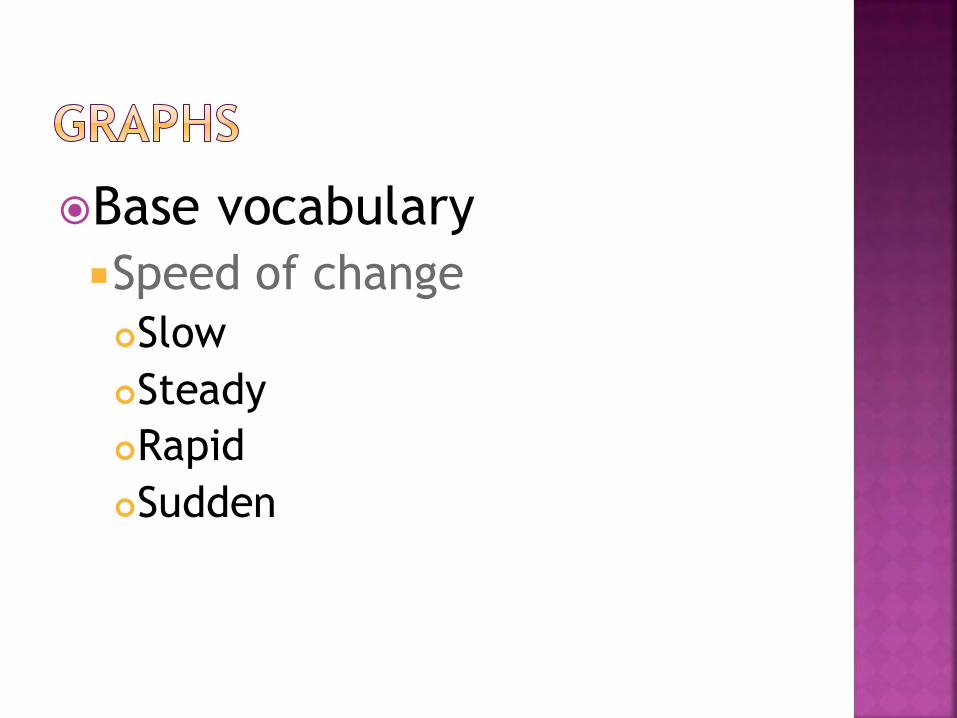
Base vocabulary
Speed of change
Slow
Steady
Rapid
Sudden
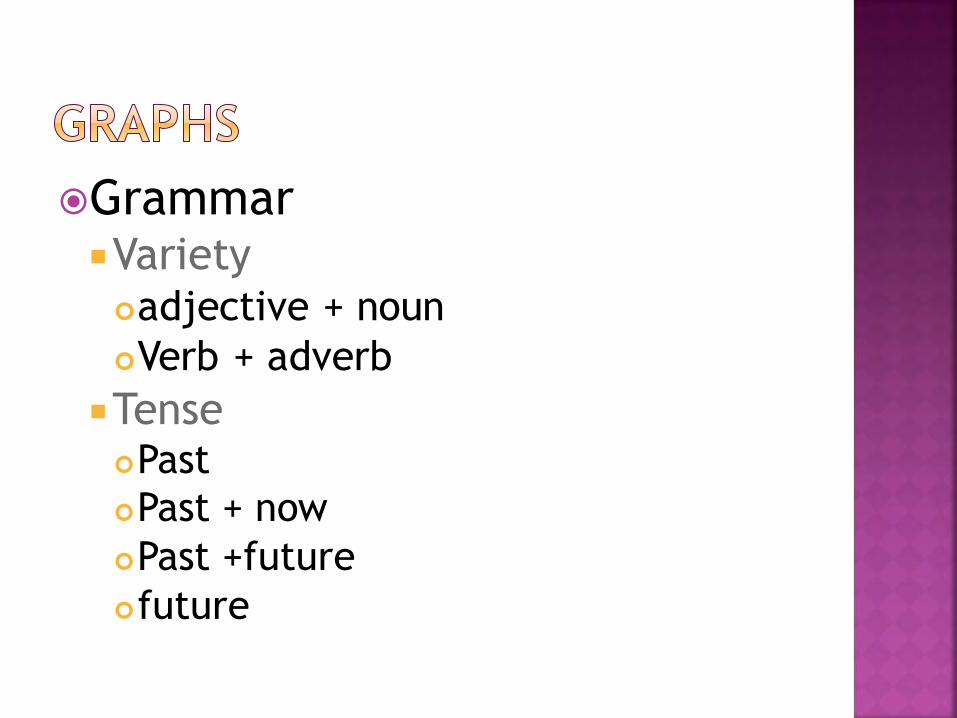
Grammar Variety adjective + noun
Verb + adverb
Tense Past
Past + now
Past +future
future
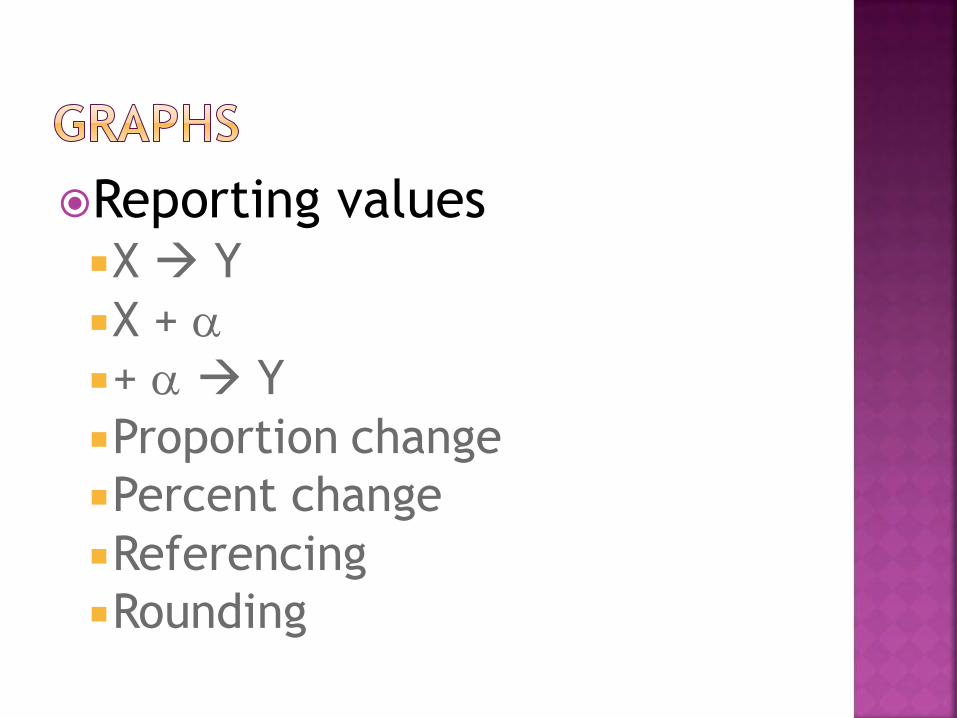
Reporting values X Y
X +
+ Y
Proportion change
Percent change
Referencing
Rounding
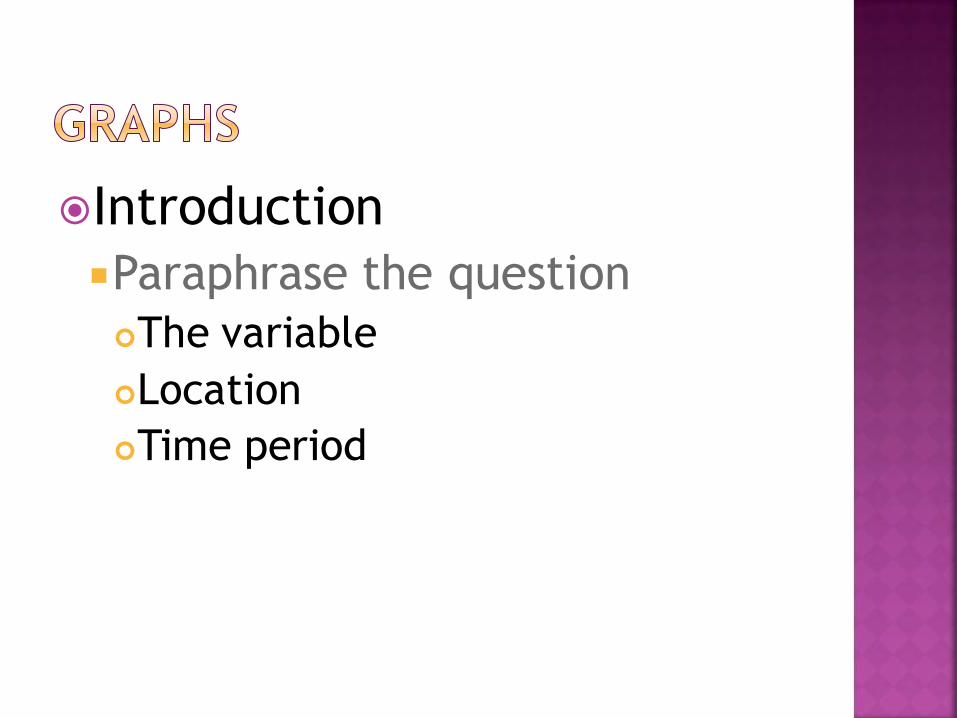
Introduction
Paraphrase the question
The variable
Location
Time period
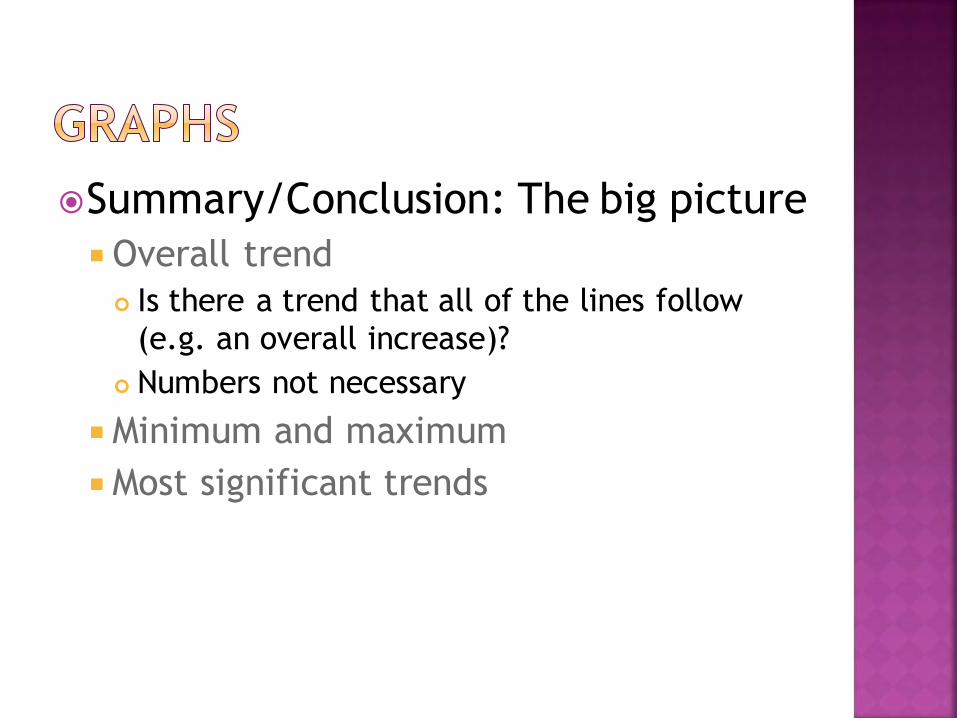
Summary/Conclusion: The big picture
Overall trend
Is there a trend that all of the lines follow
(e.g. an overall increase)?
Numbers not necessary
Minimum and maximum
Most significant trends
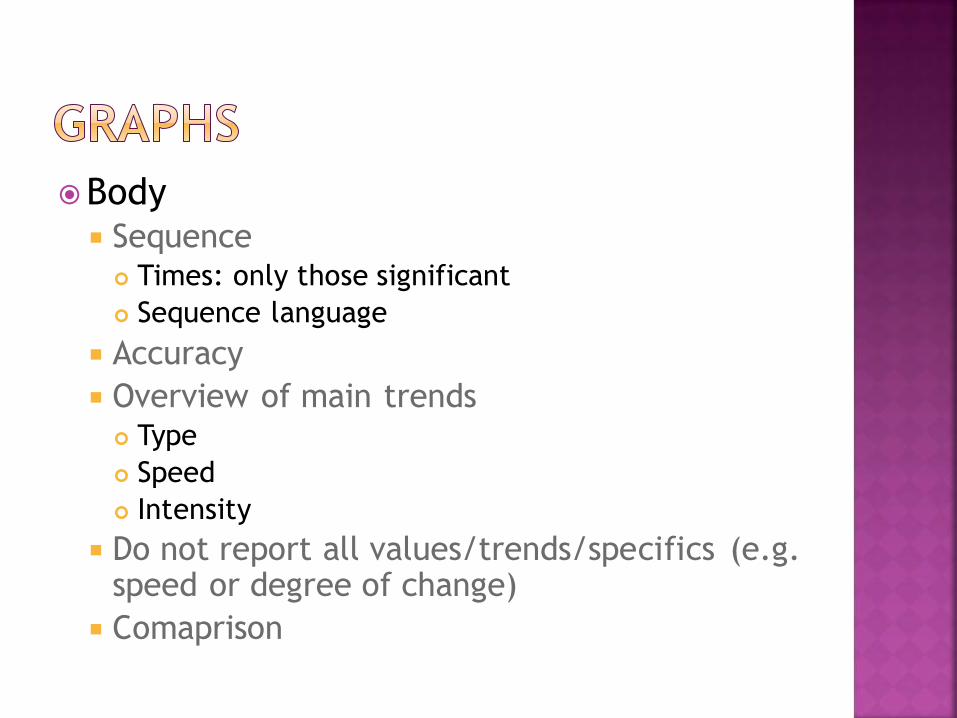
Body Sequence Times: only those significant
Sequence language
Accuracy
Overview of main trends Type
Speed
Intensity
Do not report all values/trends/specifics (e.g. speed or degree of change)
Comaprison
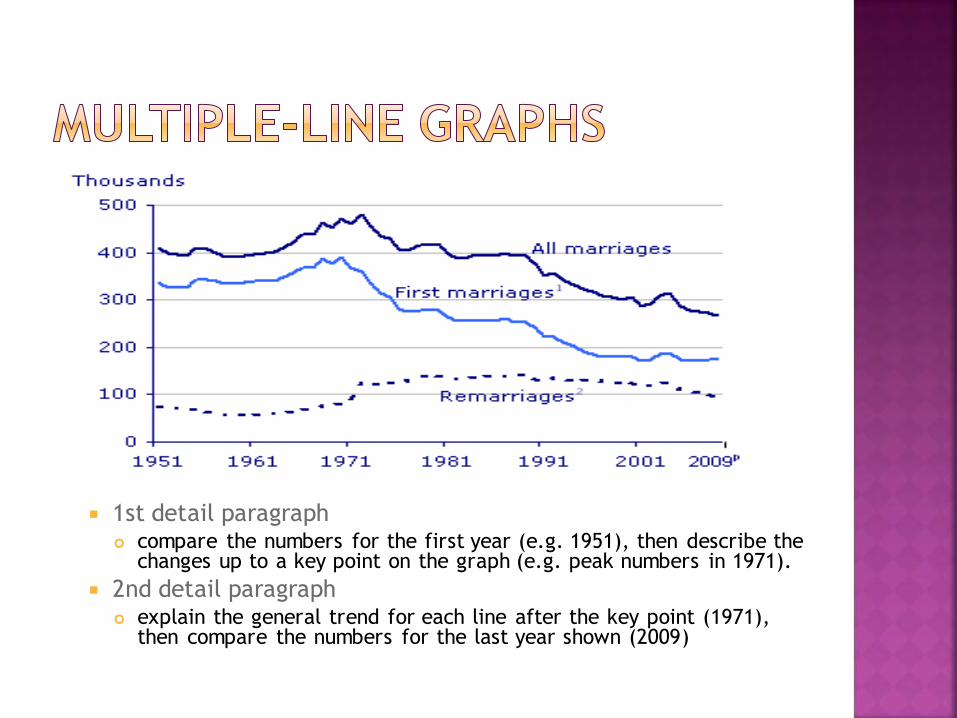
1st detail paragraph compare the numbers for the first year (e.g. 1951), then describe the
changes up to a key point on the graph (e.g. peak numbers in 1971).
2nd detail paragraph explain the general trend for each line after the key point (1971),
then compare the numbers for the last year shown (2009)
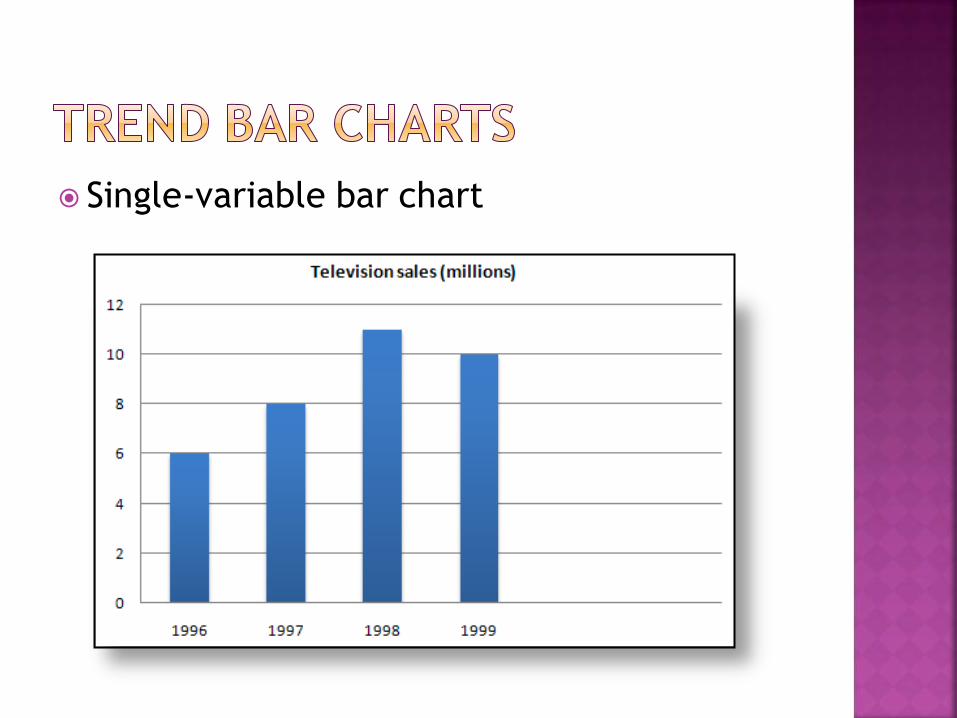
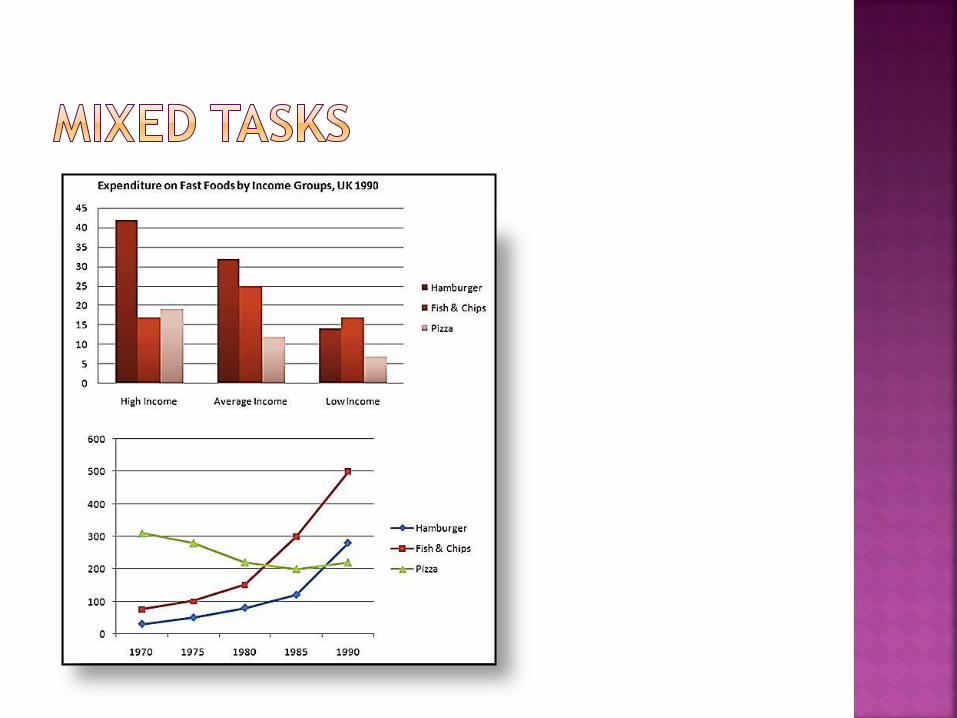
Single-variable bar chart
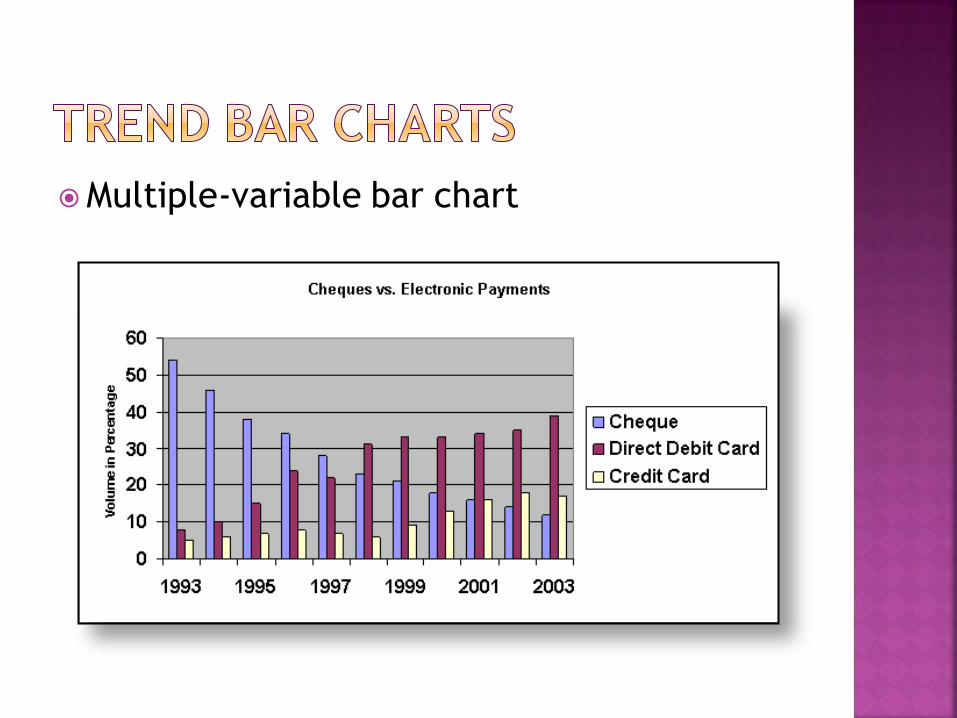
Multiple-variable bar chart
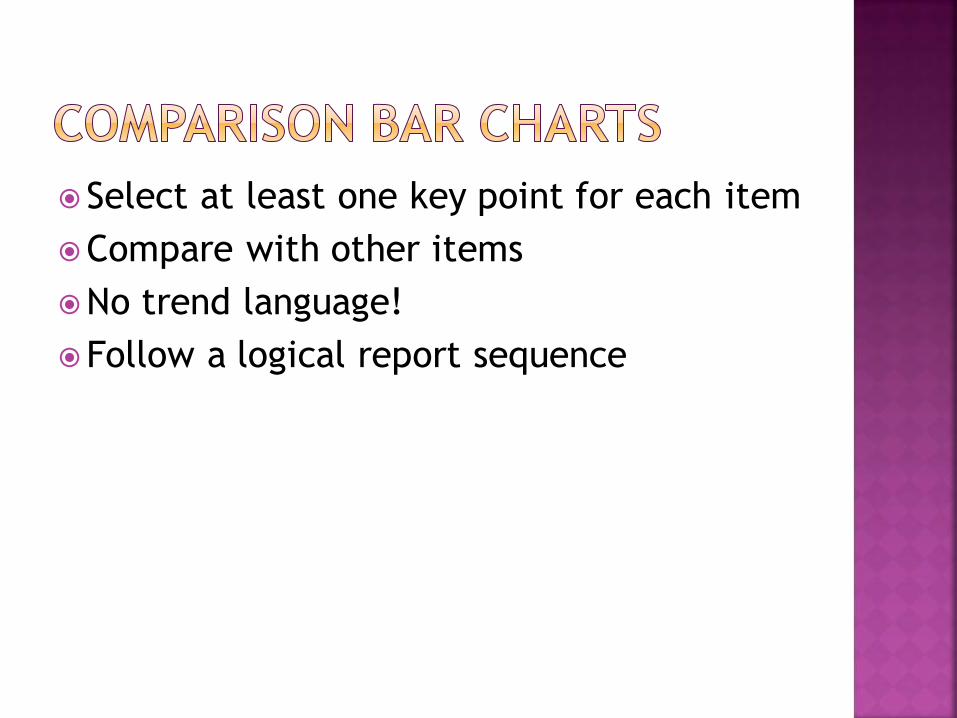
Select at least one key point for each item
Compare with other items
No trend language!
Follow a logical report sequence
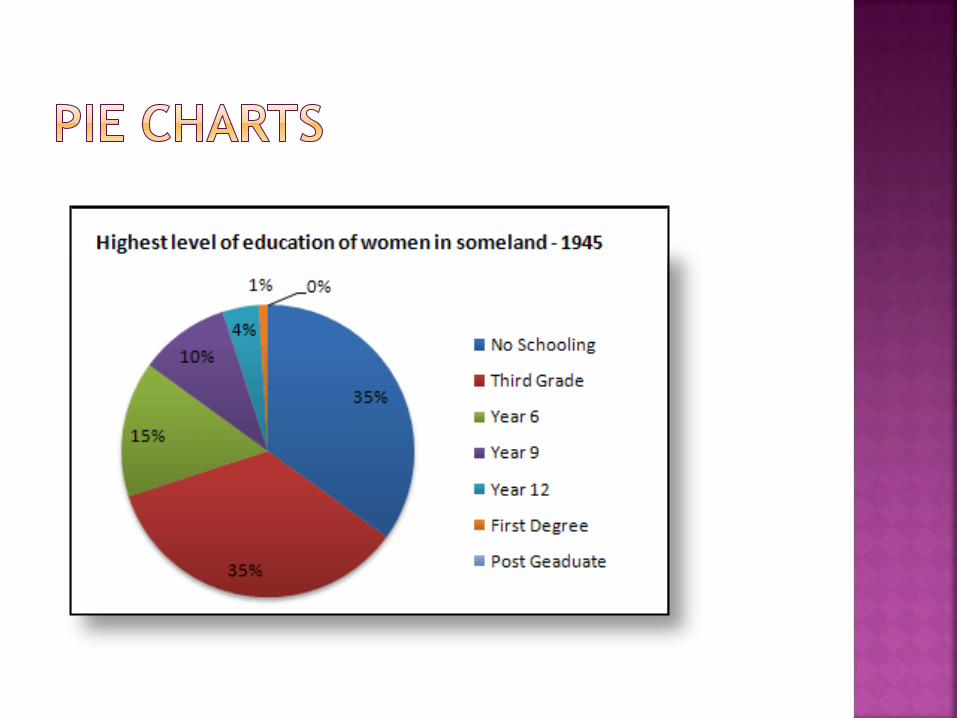
Proportions
Multiple pie charts
Irrelevant separate visuals
Sequence graphs
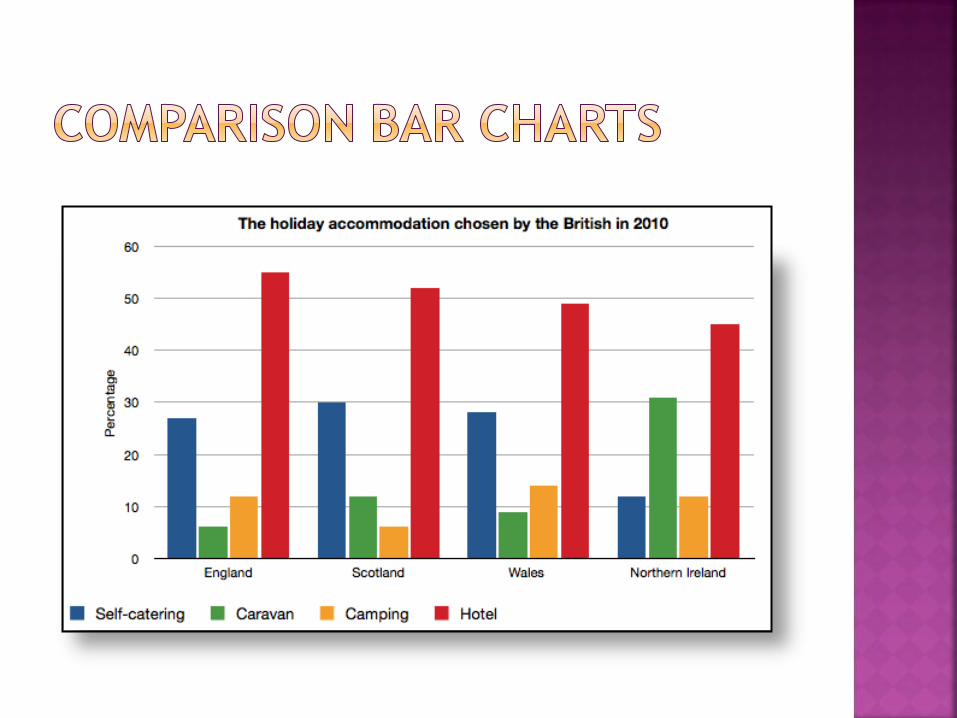
Comparison comparison bar charts
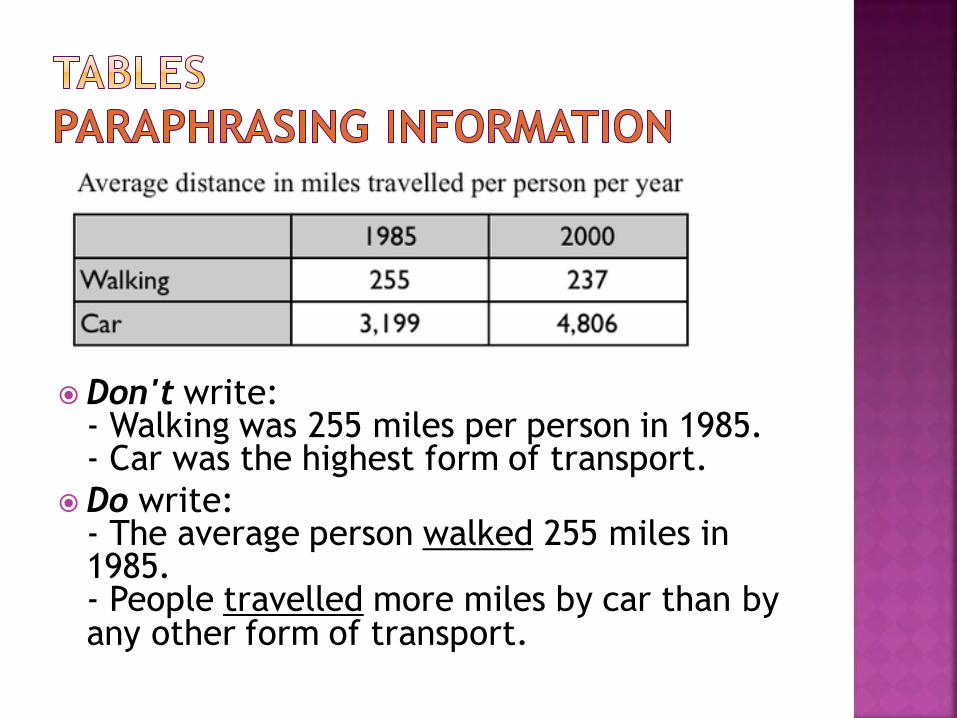
Don't write: - Walking was 255 miles per person in 1985. - Car was the highest form of transport.
Do write: - The average person walked 255 miles in 1985. - People travelled more miles by car than by any other form of transport.
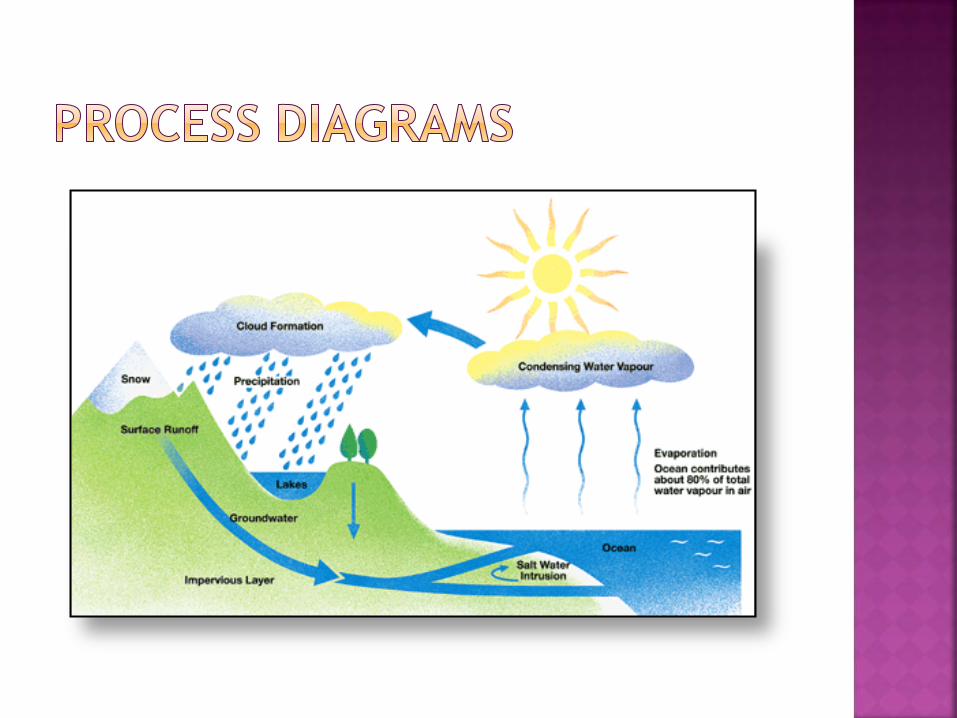
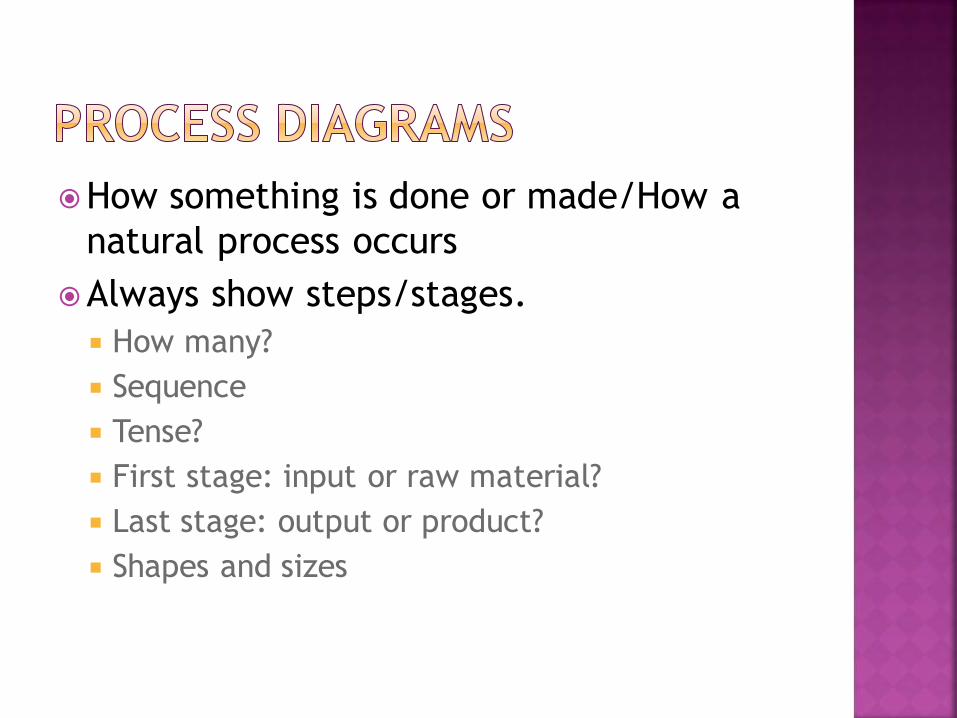
How something is done or made/How a
natural process occurs
Always show steps/stages.
How many?
Sequence
Tense?
First stage: input or raw material?
Last stage: output or product?
Shapes and sizes
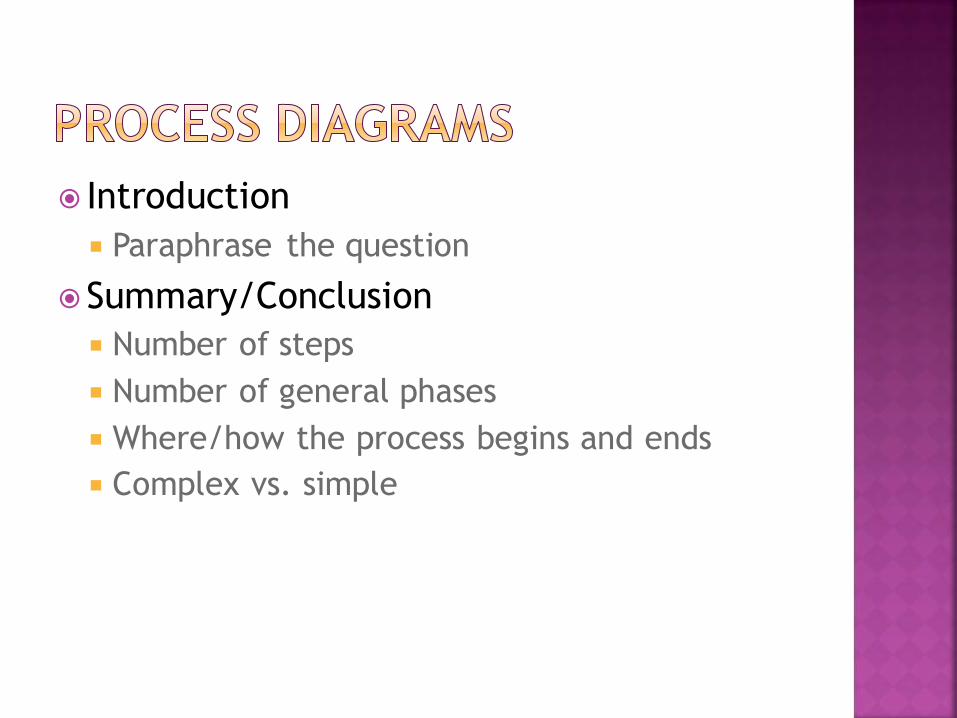
Introduction
Paraphrase the question
Summary/Conclusion
Number of steps
Number of general phases
Where/how the process begins and ends
Complex vs. simple
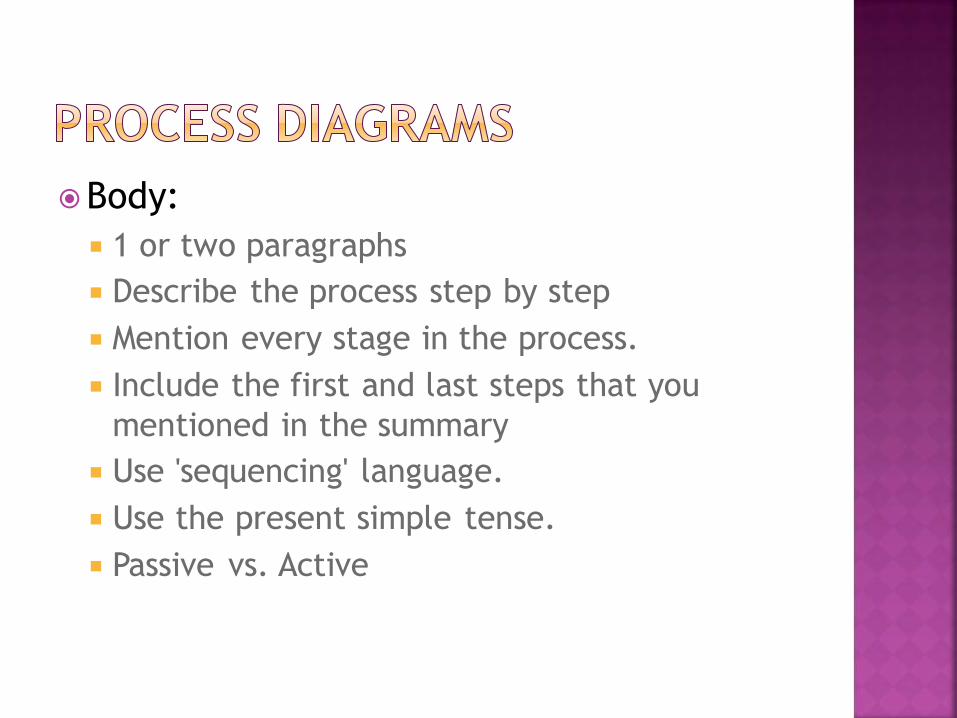
Body:
1 or two paragraphs
Describe the process step by step
Mention every stage in the process.
Include the first and last steps that you
mentioned in the summary
Use 'sequencing' language.
Use the present simple tense.
Passive vs. Active
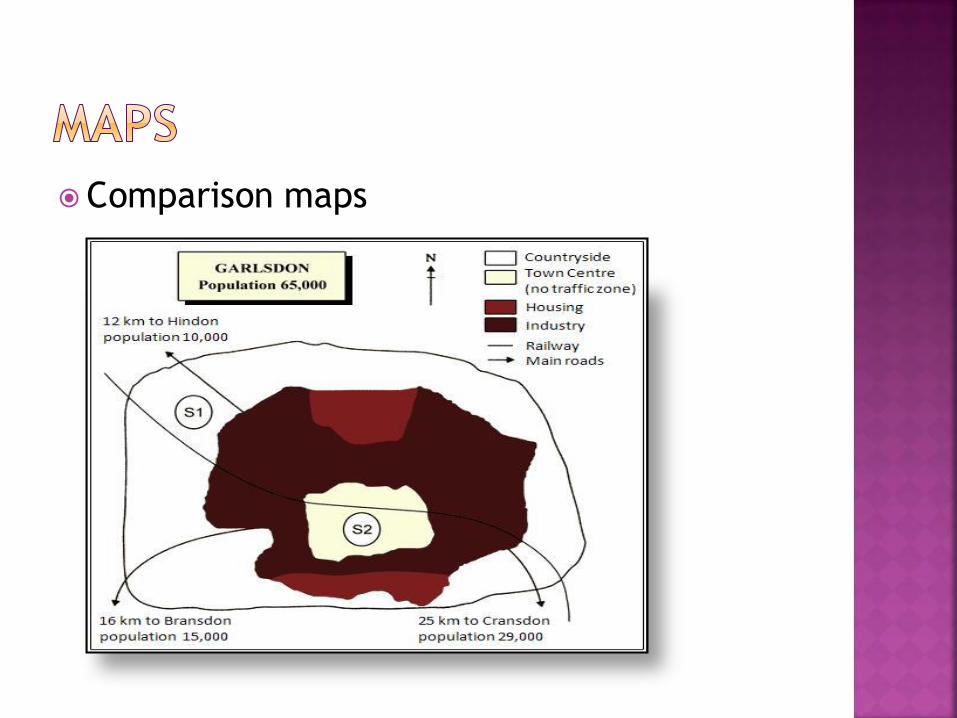
Comparison maps
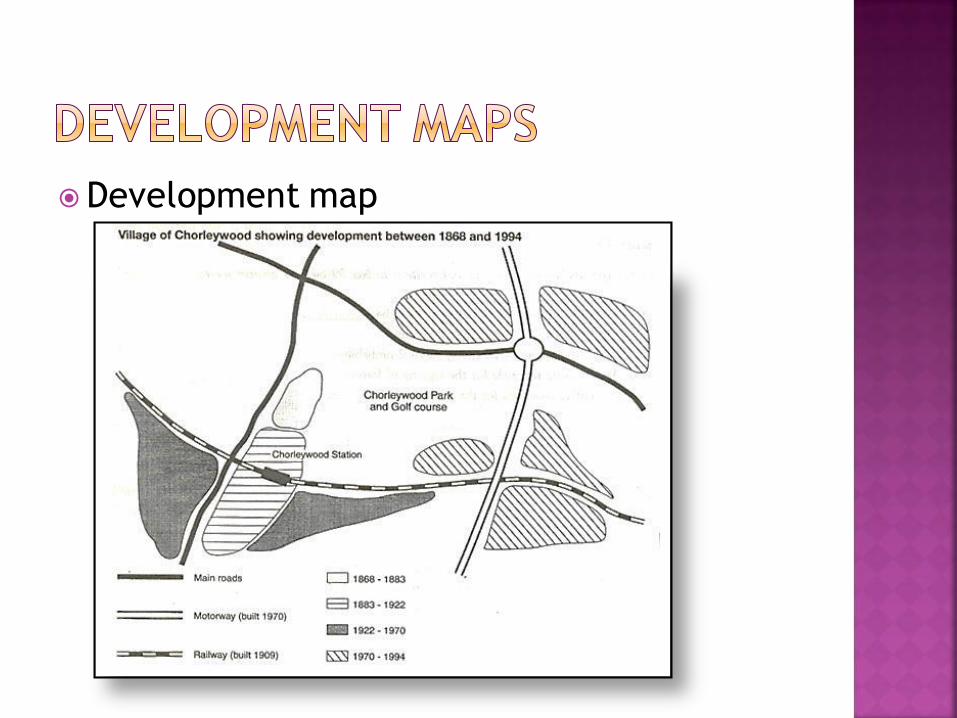
Development map