
SUMMA RY REPORT B 5 2018 08 of R Integrated R · ‐ Vacancies remain high at 572 FTE posts...
51
SUMMA TRUST B Title of R Account Author(s Purpose Recomm Consulta Date Signed o Owner Reviewe Reviewe Committ applicab Reviewe (where a Date(s) a discusse Committ Next Ste Executiv The Integ ARY REPORT BOARD Report able Officer s) of Report mendation ation Underta off by Executi ed by Executi ed by Board tee (where ble) ed by Trust B applicable) at which prev ed by Trust Bo tee eps ve Summary grated Perfor Quality; Key Operatio Finance; I E J R G R C J T p u a w T aken to N ive D S M O O ve Team ‐ ‐ oard T m viously oard / N T m rmance Repo onal Standard ntegrated Pe Executive Dire o Davis, Asso Richard Johns Graeme Boot Ruth Bardell, Claire Florey, udith Laity St The objective performance under review against key workforce tar The Board is r Receive t Nil. Director of HR Strategy & Bu Medical Direc Officer, Chief Officer The Trust Boa meeting Nil. The Board w monthly Integ ort highlights ds; erformance R ectors ociate Directo son, Head of th, Financial P Deputy Direc Access and P trategy Progr e of this rep against key w by the Exe national argets. recommende the report R & OD, Direc usiness Devel ctor, Chief Op Nurse, Joint ard receive th will continue grated Perfor the key perfo 5 July 2Report or Commissio Quality & Saf Planning Man ctor of HR & O Performance ramme Mana port is to pry targets and ecutive Team nd local qu ed to: ctor of opment, perating Chief Financ he IPR at ever to be updat rmance Repo ormance issu 018 oning & Perfo fety Complian nager OD Manager ager ovide the Bo d draw atten m. The IPR i uality, opera ial May 201 ‐ ‐ ry Monthly ed on Trust rt. ues related to Agenda Num ormance nce oard with th ntion to tho includes perational, fina 18 y performanc o: mber: 08 he Trust’s ose areas formance nce and e via the
Transcript of SUMMA RY REPORT B 5 2018 08 of R Integrated R · ‐ Vacancies remain high at 572 FTE posts...

SUMMA
TRUST B
Title of R
Account
Author(s
Purpose
Recomm
ConsultaDate
Signed oOwner
Reviewe
RevieweCommittapplicab
Reviewe(where a
Date(s) adiscusseCommitt
Next Ste
Executiv
The Integ
ARY REPORT
BOARD
Report
able Officer
s)
of Report
mendation
ation Underta
off by Executi
ed by Executi
ed by Board tee (where ble)
ed by Trust Bapplicable)
at which preved by Trust Botee
eps
ve Summary
grated Perfor
Quality;
Key Operatio
Finance;
I
E
J
R
G
R
C
J
Tpuaw
T
aken to N
ive DSMOO
ve Team ‐
‐
oard Tm
viously oard /
N
Tm
rmance Repo
onal Standard
ntegrated Pe
Executive Dire
o Davis, Asso
Richard Johns
Graeme Boot
Ruth Bardell,
Claire Florey,
udith Laity St
The objectiveperformance under reviewagainst key workforce tar
The Board is r
Receive t
Nil.
Director of HRStrategy & BuMedical DirecOfficer, Chief Officer
The Trust Boameeting
Nil.
The Board wmonthly Integ
ort highlights
ds;
erformance R
ectors
ociate Directo
son, Head of
th, Financial P
Deputy Direc
Access and P
trategy Progr
e of this repagainst key
w by the Exenational an
rgets.
recommende
the report
R & OD, Direcusiness Develctor, Chief OpNurse, Joint
ard receive th
will continue grated Perfor
the key perfo
5 July 20
Report
or Commissio
Quality & Saf
Planning Man
ctor of HR & O
Performance
ramme Mana
port is to proy targets andecutive Teamnd local qu
ed to:
ctor of opment, perating Chief Financ
he IPR at ever
to be updatrmance Repo
ormance issu
018
oning & Perfo
fety Complian
nager
OD
Manager
ager
ovide the Bod draw attenm. The IPR iuality, opera
ial
May 201
‐
‐
ry Monthly
ed on Trust rt.
ues related to
Agenda Num
ormance
nce
oard with thntion to thoincludes perfational, fina
18
y
performanc
o:
mber: 08
he Trust’s ose areas formance nce and
e via the

2
Our People;
Partnerships.
The Executive Summary on page 2 of the report provides a summary of the data for May 2017 and commentary on the wider aspects of our performance for the year thus far.
Financial Risks The report summarises the financial risks for the Trust.
Key Risks The Integrated Performance Report sets out mitigating actions in respect of most principal risks in the Board Assurance Framework
Disclosure Statement Performance data is held by the Trust and is used to produce the Integrated Performance Report. Audits have not identified data quality issues.
Equality and
Diversity Statement
There are no performance metrics relating specifically to Equality and Diversity in this report.

SUMMARY INTEGRATED PERFORMANCE REPORT
May 2018

EXECUTIVE SUMMARY
Quality & Safety:‐ There were 4 cases of Clostridium difficile reported in May, above the monthly tolerance. ‐ Although 15 Serious Incidents breached the national timescale for investigations, other markers of incident management are improving‐ FFT response rate target for inpatient/daycase has achieved 25% target for the first time, meeting the Q1 target. Emergency and Birth responses still underperforming. ‐ No dissatisfied complainants were received in May but only 28% complaints closed in May within expected timeframe, deteriorating from 38% in previous month.‐ Regarding Sepsis, admission of IV antibiotics being given within the hour for inpatients has improved for the second consecutive month‐ Benchmarked data for mortality are rising but remain below national average; this is in the context of a stable crude mortality rate
Operational Performance: ‐ The success of Gold Command Control led to major improvement across the range of patient flow indicators. The whole system emergency care access standard remained above both
the 92% local trajectory and the national 95% standard at 96.6%.‐ Delayed transfers of care as a snapshot percentage of days lost reduced to 4.9%, largely due to increased care home bed provision purchased by Cornwall Council – this is the lowest in
2 years.‐ Patient flow pressure improved significantly in‐month due to Gold Command ‐ the escalation status was OPEL1 or 2 throughout the month for all but 2 days.‐ All stroke access indicators were achieved as a result of the improved patient flow.‐ The number of cancelled on the day operations not treated within 28 days fell as anticipated to 9, the lowest since September 2016. Actual cancellations on the day were 59 – 24 fewer
than May last year.‐ Neither the diagnostic nor the RTT standards were met in month and both will not be met in June; however for the 1st time in 12 months incomplete performance improved albeit
slightly and whilst the RTT 52 week wait trajectory was not met, the number (231) reduced for the 1st time in 14 months.‐ The Trust continues to meet all of the quarterly cancer standards, all standards were met in month and quarter although April is likely to see non‐achievement of the 62d standard.‐ 57% of fractured neck of femur patients were operated on within 36 hours, not meeting the 80% standard – this was due to an increase in paediatric demand over the Bank and half‐
term holidays.
Finance: ‐ Reported deficit of £4m year to date, which is £0.1m worse than plan. Key risks are:
• The design and delivery of savings schemes to achieve the £12m cost improvement programme target.• Containing expenditure on service developments within planned sum of £5m within the year.
‐ Agency spend totalled £1.5m in month which is an increase of £0.4m from the previous month.
Our People: ‐ Total staffing deployed during May increased by 58 FTE of which substantive staff increased by 12 FTE and temporary staff increased by 46 FTE. ‐ Sickness absence reduced by 0.11% to 3.35% which is within the Trust standard. ‐ Appraisal compliance during May improved by 4.1% to 77.3% and reflects the second month of improvement following a period of sustained decline in compliance. ‐ Vacancies remain high at 572 FTE posts actively in the recruitment process. Focus continues on recruiting to substantive clinical posts. ‐ Mandatory training compliance decreased by 0.6% to 84.0%. This is 11% below standard and 1% below the level at this time last year.
Partnership: ‐ Progress continues towards an ICP through new system leadership posts, Ethna McCarthy will be Director of Planned Care working alongside the existing Director of Urgent Care ,
Director for Model of Care Development, Finance Director and others in the core team.‐ Combined ED and MIU attendances were 5.5% higher (1006 attendances) in May 18 than May 17, the majority of the increase is in the MIUs.‐ Cornwall 111 continues to meet all 10 financially linked KPIs.
2
KeyUnless noted on each graph, all data shown is for the period up to, and including May 2018.
Directorate/Group Abbreviation Glossary
CONTENTS
Section Name Accountable Officer/s Page
Section Summaries 4
Quality & Safety:Patient Safety/Experience
Chief Nurse 11
Quality & Safety:Patient Safety/Outcomes/Effectiveness
Medical Director 21
Key Operational Standards Chief Operating Officer 27
Finance Director of Finance 39
Our PeopleDirector of Human Resources & Organisational Development
42
PartnershipDirector of Strategy and Business Development
47
3
– Measure shows a decline in
performance over the
previous 3 month period.
CEO – Chief Executive
FUW – Follow up waiting
NIHSS – NIH Stroke Scale
DOSA – Day of surgery admission
SI – Serious Incident
SHMI – Summary Hospital Level
Mortality Indicator
YTD – Year to date
RTT – referral to treatment
DTOC – delayed transfer of care
HSCIC – Health and Social Care
Information Centre
HSMR – Hospital Standardised
Mortality Ratio
FTE – Full time equivalent
SRO – Senior Responsible Officer
ECIP ‐ Emergency Care
Improvement Programme

QUALITYPATIENT SAFETYSROs Medical Director and Chief Nurse
Section Summary
Areas of Concern: Four cases of C.difficile have been reported in May which is above the monthly tolerance of 2 cases and brings the total to date to 9 which is a concern. 13 (39%) Serious Incidents breached the national timescale for investigation (56%)15 Serious Incidents were declared during May.
Actions:A comprehensive improvement plan is in place to remedy the issues with Serious Incidents ‐ both backlog and process.A thematic review is being carried out and the NHSI Infection Control Lead will carry out a Fresh Eyes review to identify any further areas for improvement.
4
Trends:The rate of “new” harm free care (RCHT acquired harm) currently sits at 97.79%; a slight decrease on previous month however remains above target (98.8%).
Improvements: As part of the Cornwall Safety Collaborative, current service improvement activity is focusing on evaluating the paperwork and process of a post‐fall safety huddle on one ward. Zero cases of MRSA Bacteraemia were reported in May.

Section Summary
QUALITYPATIENT EXPERIENCEAccountable Officer : Chief Nurse
5
Areas of concern:The rate of complaints breaching response timescales continues to worsen with only 28% of complaints closed during May being closed by agreed date. FFT response rates for ‘Emergency’ and ‘Birth’ remain below target for the month and quarter.
Trends: Rates of dissatisfied complainants has remained consistently low for six months.FFT showing an upward trend in response rates.
Improvements: The inpatient / day case response has achieved the highest response rate ever, exceeding the end of Q1 target of 25% by 1.8% in May (26.8% )
Actions:Associate Directors of Nursing continue to drive improvements in FFT within their respective divisions. Care Opinion roll out will be part of the Patient Experience Project within the Strong Governance work stream of the Trust Quality Improvement ProgrammeIssuing weekly complaints reports with central team assistance to recover complaints response time.

Section Summary
Areas of Concern:The number of cardiac peri‐arrest calls has increased from previous months, but this is subject to monthly variation and is not an established trend
Improvements:The crude mortality rate for the RCHT slightly improved in April.The level of screening upon admission for Sepsis remains at an excellent (compliant) position.
QUALITY ‐ PATIENT OUTCOMES/EFFECTIVENESSSRO Medical Director
6
Trends:Mortality rates for weekday and weekends continue to (slightly) deteriorate though remain positively under the national average. Re‐setting against national averages is expected in coming months
Actions
RCHT continues to show only one sustained red flag HSMR diagnosis (acute cerebrovascular disease) and the formal report from the external peer review has now been received.The introduction of the Sepsis screening tool on NerveCentre remains on target for September.Work has commenced on the introduction of NEWS2, due to be fully in place by April 2019.

KEY OPERATIONAL STANDARDSSRO Chief Operating Officer
Section Summary
Areas of concern: RTT incompletes and 52 week waits, 6 week diagnostics, non‐bed related elective cancellations on the day, follow‐up outpatients past their to be seen date, fractured neck of femur patients operated on within 72 hours and short notice outpatient clinic cancellations.
Improvements: Improvements to flow related metrics including ED 4 hour performance, ambulance delays, stroke unit admission as well as time spent on the stroke unit and DTOCs associated with Gold Command were sustained. RTT incomplete performance improved for the 1st time in 12 months and the number of 52 week waits reduced (albeit slightly) for the 1st time after 14 months of deterioration.
Actions:1. Focus continues at an Executive‐level to continue to realise benefits from the Gold Command control
in a sustainable way.2. The RTT specialty level recovery plans are being closely managed to ensure actions are delivering at
the required scale and pace to improve RTT, 52 week and diagnostic waits.
Trends: Failure to achieve both the RTT and diagnostic standards continued, whilst 52 week waits and the number of overdue outpatient follow‐ups remain significantly high. Quarterly cancer standards performance continues to be sustained though pressures on the 62 day pathways is on‐going. Measures deteriorating for 3 or more consecutive months were ED unplanned re‐attendances, diagnostics and the day case rate.Cornwall 111 continues to meet all 10 financially linked KPIs.
7

Section Summary
Areas of Concern: • Reported deficit is marginally worse than plan. • Shortfall in savings schemes identified to date. Savings schemes of £10.5m have been identified
against the £12m cost improvement target. A proportion of the identified schemes are assessed as high risk for delivery.
• The delivered savings are lower than plan. • Income levels improved in May although are still below plan for the year to date. • Agency spend was £1.5m in May and this is £0.4m higher than in the previous month.
Trends:• Surgical Services overspent again in month. There is high medical agency spend in the Division. This
brings a risk to the overall financial plan.
Improvements:• Income levels improved month on month.
Actions:1. Identify the £1.5m shortfall in the savings target and reduce the risk in relation to the schemes
identified.2. Ensure that additional costs for Service Developments are limited to £5m in the year.
FINANCESRO Director of Finance
8

Section Summary
Areas of Concern:
• Recruitment continues to be a focus. Active vacancies in the recruitment process total 572 FTE of which 188 FTE are for registered nurses.
• Agency use increased by 56 FTE compared to April and at 177 FTE is at an unsustainable level and cost. This contributed to increased pay costs in month by £0.517m.
Trends:• Mandatory training compliance continued a downward trend, reducing by 0.6% to 84.0%. This
represents 1% below the level at this time last year and is 11% below standard.
Improvements:• Attendance improved for the third consecutive month as sickness reduced by 0.33% to 3.46%.• Appraisal compliance improved during May by 4.1% to 77.3%. However, there remains work to do
as this is 17.7% below standard and 4.6% lower than at this time last year.
Actions:• Work continues to recruit substantively to vacancies to reduce agency use.
OUR PEOPLESRO Director of HR and OD
9

Section Summary
Areas of Concern:Prompt discharge – Delayed transfers of care remain higher than plan, however they remained under 5% and marginally reduced from the April position (standard 3.5%). ED/MIU attendances – A 15% increase in MIU and 2.2% in ED attendances compared to May 17.New Model of Care ‐ Delays in the implementation of the new Hip and Knee pathway remain a significant risk to the timely achievement of objectives. The focus now is on expediting delivery, which will be led by CFT, including implementation of smaller scale process changes, whilst the digital systems are developed.
Trends: The position on DTOCs remains unchanged, the year to date trend is a reduction compared to previous years.
Improvements:• Delayed transfers of care remain at lowest point since May 16 following interventions of ‘Gold’
control.
Actions:
• Operational Plan 18/19 – The Trust’s plan has been adopted by the Trust Board and reflects shared system priorities, a short /visual plan on a page will now be distributed across the Trust.
• System Planning ‐ A workshop has been held with practitioners across health and social care to identify opportunities for increased prevention and improvement to Falls services. This will be developed into a programme of interventions over the forthcoming weeks, as part of the next priority Pathway.
PARTNERSHIPSSRO Director of Strategy and Business Development
10

QUALITY & SAFETYPATIENT SAFETYSummary Dashboard
11

QUALITYPatient SafetySafety ThermometerAccountable Officer: Chief Nurse
(1) The “new” harm free care (RCHThospital acquired harm) decreasedslightly in May to 97.79% (from a highof 98.05% in April). Eleven new harmswere recorded across 511 patients.This is in line with the nationalaverage (97.8%).
(2) Zero new Catheter AssociatedUrinary Tract Infections werereported this month in the pointprevalence audit. RCHT Catheterprevalence in May was much lowerthan previous months’ highs to 16.8%.The national prevalence rate for acuteTrusts is 18.9%.
(3) May’s audit identified six new VTEharms (1.1%). Nationally the rate ofharm is 0.5% for Acute Trusts. Furtherwork on assuring accuracy ofsubmitted data following switchoverto the online submission system sinceApril is underway to understand thishigh rate.
(4) The Trust reported four newpressure ulcer harms in May’s survey.All Category 2, the lowest level ofharm reported and the same as theprevious month. This is a pointprevalence percentage of pressurerelated harms of 0.7%. The nationalaverage is currently 0.9%.
12
92%
93%
94%
95%
96%
97%
98%
99%
100%
Apr‐16
May‐16
Jun‐16
Jul‐16
Aug‐16
Sep‐16
Oct‐16
Nov‐16
Dec‐16
Jan‐17
Feb‐17
Mar‐17
Apr‐17
May‐17
Jun‐17
Jul‐17
Aug‐17
Sep‐17
Oct‐17
Nov‐17
Dec‐17
Jan‐18
Feb‐18
Mar‐18
Apr‐18
May‐18
(1) Safety Thermometer: % New harm free care
Mean
UCL
LCL
% Newharm free
0.0%
0.5%
1.0%
1.5%
2.0%
2.5%
3.0%
Apr‐16
May‐16
Jun‐16
Jul‐16
Aug‐16
Sep‐16
Oct‐16
Nov‐16
Dec‐16
Jan‐17
Feb‐17
Mar‐17
Apr‐17
May‐17
Jun‐17
Jul‐17
Aug‐17
Sep‐17
Oct‐17
Nov‐17
Dec‐17
Jan‐18
Feb‐18
Mar‐18
Apr‐18
May‐18
(2) Safety Thermometer: Catheters and UTIs
Mean
UCL
LCL
Catheters &UTIs
0.0%
0.2%
0.4%
0.6%
0.8%
1.0%
1.2%
Apr‐16
May‐16
Jun‐16
Jul‐16
Aug‐16
Sep‐16
Oct‐16
Nov‐16
Dec‐16
Jan‐17
Feb‐17
Mar‐17
Apr‐17
May‐17
Jun‐17
Jul‐17
Aug‐17
Sep‐17
Oct‐17
Nov‐17
Dec‐17
Jan‐18
Feb‐18
Mar‐18
Apr‐18
May‐18
(3) Safety Thermometer: New VTEs
Mean
UCL
LCL
New VTEs
0%
1%
2%
3%
Apr‐16
May‐16
Jun‐16
Jul‐16
Aug‐16
Sep‐16
Oct‐16
Nov‐16
Dec‐16
Jan‐17
Feb‐17
Mar‐17
Apr‐17
May‐17
Jun‐17
Jul‐17
Aug‐17
Sep‐17
Oct‐17
Nov‐17
Dec‐17
Jan‐18
Feb‐18
Mar‐18
Apr‐18
May‐18
(4) Safety Thermometer: Pressure Ulcers
Mean
UCL
LCL
% of newpressure ulcers

QUALITYPatient SafetySafety Thermometer and FallsAccountable Officer: Chief Nurse
(5) On the Safety Thermometer data collection day in May, nine slips, trips and falls were reported (two higher that April). Seven falls were categorised as ’no harm’ and two ‘low harms’. Low Harm indicates a cut to an arm or the face for example. The Trust’s overall falls rate was 1.7% compared to a national average this month of 1.5%. The Trust’s falls with harm rate was 0.4% compared to the national average of 0.5%.
(6) This month saw a further fall in Datix incident reported inpatient slips, trips and falls per 1000 overall bed days. May’s data was 4.5 compared to 5.3 in April. This is the lowest rate for over twelve months. This downward trajectory mirrors previous years, so focus on sustaining this rate is required.
(7) Zero severe harm incident related to a fall was reported on Datix in May.
As part of the Cornwall Safety Collaborative, current service improvement activity is focusing on evaluating both the documentation and the process as regards a post‐fall safety huddle on Karensa Ward.
13
0.0%
0.2%
0.4%
0.6%
0.8%
1.0%
1.2%
1.4%
Apr‐16
May‐16
Jun‐16
Jul‐16
Aug‐16
Sep‐16
Oct‐16
Nov‐16
Dec‐16
Jan‐17
Feb‐17
Mar‐17
Apr‐17
May‐17
Jun‐17
Jul‐17
Aug‐17
Sep‐17
Oct‐17
Nov‐17
Dec‐17
Jan‐18
Feb‐18
Mar‐18
Apr‐18
May‐18
(5) Safety Thermometer: Falls with Harm
Mean
UCL
LCL
Actual
0.0
1.0
2.0
3.0
4.0
5.0
6.0
7.0
8.0
9.0
Apr‐16
May‐16
Jun‐16
Jul‐16
Aug‐16
Sep‐16
Oct‐16
Nov‐16
Dec‐16
Jan‐17
Feb‐17
Mar‐17
Apr‐17
May‐17
Jun‐17
Jul‐17
Aug‐17
Sep‐17
Oct‐17
Nov‐17
Dec‐17
Jan‐18
Feb‐18
Mar‐18
Apr‐18
May‐18
(6) Falls per 1000 bed days
Mean
UCL
LCL
Actual
0.00%
0.05%
0.10%
0.15%
0.20%
0.25%
0.30%
0.35%
0.40%
Apr‐16
May‐16
Jun‐16
Jul‐16
Aug‐16
Sep‐16
Oct‐16
Nov‐16
Dec‐16
Jan‐17
Feb‐17
Mar‐17
Apr‐17
May‐17
Jun‐17
Jul‐17
Aug‐17
Sep‐17
Oct‐17
Nov‐17
Dec‐17
Jan‐18
Feb‐18
Mar‐18
Apr‐18
May‐18
(7) Moderate/Severe Harm Falls
Mean
UCL
LCL
Actual

QUALITYPatient SafetyInfection Control
Accountable Officer: Chief Nurse
(8) 0 cases of MRSA reported during May.
(9) 2 cases of MSSA bacteraemia were reported in May. One is related to an infected blister which occurred whist in hospital however we have not been able to identify the root cause and the other is still under review.
(10,11) 4 cases of C.difficile have been reported in May which is above the monthly tolerance of 2 cases and brings the total to date to 9; which is a concern. Intensive practice facilitation processes are being implemented in the 2 wards with the most cases. A thematic review is being carried out and the NHSI Infection Control Lead will carry out a ‘Fresh Eyes’ review to identify any further areas for improvement.
14
0
1
2
Apr‐16
May‐16
Jun‐16
Jul‐16
Aug‐16
Sep‐16
Oct‐16
Nov‐16
Dec‐16
Jan‐17
Feb‐17
Mar‐17
Apr‐17
May‐17
Jun‐17
Jul‐17
Aug‐17
Sep‐17
Oct‐17
Nov‐17
Dec‐17
Jan‐18
Feb‐18
Mar‐18
Apr‐18
May‐18
(8) MRSA
Actual
Tolerance
012345678910
Apr‐16
May‐16
Jun‐16
Jul‐16
Aug‐16
Sep‐16
Oct‐16
Nov‐16
Dec‐16
Jan‐17
Feb‐17
Mar‐17
Apr‐17
May‐17
Jun‐17
Jul‐17
Aug‐17
Sep‐17
Oct‐17
Nov‐17
Dec‐17
Jan‐18
Feb‐18
Mar‐18
Apr‐18
May‐18
(9) MSSA Cases
Mean
UCL
LCL
Actual
0.00
1.00
2.00
3.00
4.00
5.00
6.00
7.00
Apr‐16
May‐16
Jun‐16
Jul‐16
Aug‐16
Sep‐16
Oct‐16
Nov‐16
Dec‐16
Jan‐17
Feb‐17
Mar‐17
Apr‐17
May‐17
Jun‐17
Jul‐17
Aug‐17
Sep‐17
Oct‐17
Nov‐17
Dec‐17
Jan‐18
Feb‐18
Mar‐18
Apr‐18
May‐18
(10) C‐Difficile Cases
Mean
UCL
LCL
Tolerance
Actual
0
5
10
15
20
25
30
35
Apr
May Jun
Jul
Aug
Sep
Oct
Nov
Dec Jan
Feb
Mar
(11) C‐Difficile Tolerance
Actual 17/18
Actual 18/19
Tolerance 18/19

15QUALITYPatient SafetyInfection Control
Accountable Officer: Chief Nurse
15
(12,13) Gram –negative bacteraemia –3 cases of E.coli were reported in May. One is thought to be related to a UTI which was present on admission, one is thought to be biliary sepsis and the other is still under review. No lapses in care have been identified.
One Klebsiella bacteraemia has been reported. This related to an abscess which was present on admission to hospital.
No pseudomonas bacteraemia have been reported.
0
1
2
3
4
5
6
7
8
Jan‐17
Feb‐17
Mar‐17
Apr‐17
May‐17
Jun‐17
Jul‐17
Aug‐17
Sep‐17
Oct‐17
Nov‐17
Dec‐17
Jan‐18
Feb‐18
Mar‐18
Apr‐18
May‐18
(12) Gram Negative Bacteraemia Total
Mean
UCL
LCL
Actual0
1
2
3
4
5
6
7
0
1
2
3
4
5
6
Jan‐17
Feb‐17
Mar‐17
Apr‐17
May‐17
Jun‐17
Jul‐17
Aug‐17
Sep‐17
Oct‐17
Nov‐17
Dec‐17
Jan‐18
Feb‐18
Mar‐18
Apr‐18
May‐18
Total
Organ
ism Total
(13) Gram Negative Bacteraemia
E. Coli KlebsiellaPsuedonomas All Organism Total

QUALITY & SAFETYPATIENT EXPERIENCESummary Dashboard
16

QUALITYFriends & Family TestResponse ratesAccountable Officer: Chief Nurse
17
Not Recommended
Recommended
Response Rates
Inpatients and Daycases
27%
1%
96%
Outpatients
95% 0%
Maternity(Antenatal Care)
0%
90%
Emergency Departments
94%
10%
1%
Maternity (Postnatal Ward)
3%90%
Maternity (Birth)
0%
16%
Maternity(Postnatal Community)
0%
100%
97%
In May 3,845 responses to the Friends and Family Test were received.
The inpatient / day case response rate of 26.8% is the highest ever achieved exceeding the Q1 target. Emergency response rate of 9.86% remains well below the 15% target but is the best result so far in 2018
The Postnatal Ward Not Recommend score has reduced from 6% last month to 3% this month. Wheal Prosper has a high score of 7% which is due to 1 extremely unlikely response in 13 responses overall. No comment on survey to cross reference the response
Response rate targets
Q1 Q2
Inpatient/daycase 25% 26%
Emergency 15% 15%
Maternity Birth 25% 26%
Recommendedtargets
Q1 Q2
Inpatient/daycase 98% 98%
Emergency 95% 95%
Maternity Birth 100% 100%
Not Recommended threshold
When ‘Not Recommended’ scores hit 5% this can indicate issues in service.

18QUALITYPatient ExperienceComplaintsAccountable Officer: Chief Nurse
(14, 15) 34 formal and 75 informal complaints were received in May.
(16) Complaints Regulations require that complaints are acknowledged within 3 working days of receipt. 94% of complaints achieved this in May with 2 breaches. Investment in the corporate Complaints Team, with new team members joining in July, will include a full time administrator to support the team and ensure that all complaints are acknowledged within 3 working days.
(17) The Trust aims to respond to complaints within 30 working days unless agreed otherwise with the complainant. Of all complaints closed In May, only 28% were responded to within 30 working days, down from 38% in April and 55% in March. This decline is directly attributable to the very strong focus on reducing the backlog of incidents and serious incidents in the Divisions which are currently being prioritised. To assist the Divisions in recovering performance around complaints, the Complaints Team are issuing weekly status reports and will reinstate central case management of complaints after new team members join in July.
0
10
20
30
40
50
60
Apr‐16
May‐16
Jun‐16
Jul‐16
Aug‐16
Sep‐16
Oct‐16
Nov‐16
Dec‐16
Jan‐17
Feb‐17
Mar‐17
Apr‐17
May‐17
Jun‐17
Jul‐17
Aug‐17
Sep‐17
Oct‐17
Nov‐17
Dec‐17
Jan‐18
Feb‐18
Mar‐18
Apr‐18
May‐18
(14) Total number of formal complaints
Mean
UCL
LCL
Total inMonth
0
20
40
60
80
100
120
140
Apr‐16
May‐16
Jun‐16
Jul‐16
Aug‐16
Sep‐16
Oct‐16
Nov‐16
Dec‐16
Jan‐17
Feb‐17
Mar‐17
Apr‐17
May‐17
Jun‐17
Jul‐17
Aug‐17
Sep‐17
Oct‐17
Nov‐17
Dec‐17
Jan‐18
Feb‐18
Mar‐18
Apr‐18
May‐18
(15) Total number of informal complaints
Mean
UCL
LCL
Total
60%
65%
70%
75%
80%
85%
90%
95%
100%
Apr‐16
May‐16
Jun‐16
Jul‐16
Aug‐16
Sep‐16
Oct‐16
Nov‐16
Dec‐16
Jan‐17
Feb‐17
Mar‐17
Apr‐17
May‐17
Jun‐17
Jul‐17
Aug‐17
Sep‐17
Oct‐17
Nov‐17
Dec‐17
Jan‐18
Feb‐18
Mar‐18
Apr‐18
May‐18
(16) % complaints acknowledged in 3 working days
Actual
Standard
0%
20%
40%
60%
80%
100%Jan‐18
Feb‐18
Mar‐18
Apr‐18
May‐18
(17) % Complaints responded to within agreed timescale
%respondedto withintimescale
Standard

QUALITY Patient ExperienceComplaintsAccountable Officer: Chief Nurse
(18) The number of complaints received per 1,000 bed days has steadily decreased over the past 3 months. This can be attributed to staff being encouraged to try and resolve concerns ‘there and then’ which results in a better experience for the patient.
(19) There were no dissatisfied complainants (complainants who are not satisfied that the first response has fully answered their concerns) in the month of May. There is a robust quality assurance checking process which is completed prior to Chief Nurse approval ensuring that responses are scrutinised for accuracy prior to being sent to the complainant. However, the number of complaints closed this month has decreased and it is expected that this figure will rise next month as more responses are sent to complainants.
(20) There were no non‐clinically justified single sex breaches reported in May.
19
0.00
0.50
1.00
1.50
2.00
2.50
3.00
Apr‐16
May‐16
Jun‐16
Jul‐16
Aug‐16
Sep‐16
Oct‐16
Nov‐16
Dec‐16
Jan‐17
Feb‐17
Mar‐17
Apr‐17
May‐17
Jun‐17
Jul‐17
Aug‐17
Sep‐17
Oct‐17
Nov‐17
Dec‐17
Jan‐18
Feb‐18
Mar‐18
Apr‐18
May‐18
(18) Complaints per 1000 bed days
Mean
UCL
LCL
Value
0
2
4
6
8
10
12
Apr‐16
May‐16
Jun‐16
Jul‐16
Aug‐16
Sep‐16
Oct‐16
Nov‐16
Dec‐16
Jan‐17
Feb‐17
Mar‐17
Apr‐17
May‐17
Jun‐17
Jul‐17
Aug‐17
Sep‐17
Oct‐17
Nov‐17
Dec‐17
Jan‐18
Feb‐18
Mar‐18
Apr‐18
May‐18
(19) Dissatisfied Complainants
Mean
UCL
LCL
Total
0
1
2
3
4
5
6
7
Apr‐16
May‐16
Jun‐16
Jul‐16
Aug‐16
Sep‐16
Oct‐16
Nov‐16
Dec‐16
Jan‐17
Feb‐17
Mar‐17
Apr‐17
May‐17
Jun‐17
Jul‐17
Aug‐17
Sep‐17
Oct‐17
Nov‐17
Dec‐17
Jan‐18
Feb‐18
Mar‐18
Apr‐18
May‐18
(20) Mixed Sex Accommodation breaches
Mean
UCL
LCL
Total

QUALITY Patient ExperienceCompliments & RatingsAccountable Officer: Chief Nurse
(21) Total compliments received during May was 741. Online feedback continues to be mostly positive.
The Trust aims to respond to all feedback left on Care Opinion and this is measured as the % of the last 100 stories responded to. This fluctuates during the month but at end of May was 89%.
Three stories have now led to change. In May, feedback about being unable to contact audiology has resulted in improved and additional contact details being made available on public websites such as NHS Choices.
The roll out of Care Opinion promotional material, and licences to enable managers to respond to feedback directly, now sits within the Strong Governance work stream of the Trust’s Quality Improvement Programme. Access and guidance for responding in the public domain, will be rolled out across the Trust during Q1 and Q2 and should be in place in every service by the end of Q3.
20
Current NHS Choices Rating
Based on 419 Ratings for the Hospital (RCH Treliske)
Source: www.nhs.uk/Services/hospitals/ReviewsAndRatings
Care Opinion Response rates (Treliske)
Source: www.careopinion.org.uk/services/ref12Twitter Followers: 595@RCHTPtExp
01002003004005006007008009001000
Apr‐16
May‐16
Jun‐16
Jul‐16
Aug‐16
Sep‐16
Oct‐16
Nov‐16
Dec‐16
Jan‐17
Feb‐17
Mar‐17
Apr‐17
May‐17
Jun‐17
Jul‐17
Aug‐17
Sep‐17
Oct‐17
Nov‐17
Dec‐17
Jan‐18
Feb‐18
Mar‐18
Apr‐18
May‐18
(21) Total compliments
Mean
UCL
LCL
Total

SAFETY Patient SafetyNever Events & Serious IncidentsAccountable Officer: Medical Director
(22 & 23) There were 15 Serious Incidents reported in May:
2018/11022: Treatment delay (GS)2018/11059: Patient fall (Gastroenterology and Liver Unit)2018/11075: Treatment delay (TU1)2018/11094: Child safeguarding (ED)2018/11142: Unexpected admission to NNU (Truro Birth Centre)2018/11160: Treatment delay (GS)2018/11474: Treatment delay (Kedhlow Building)2018/11559: Treatment delay (Cardiac Investigation Unit)2018/11578: Treatment delay (SAL)2018/12218: Treatment delay (ED)2018/12245: Treatment delay (Truro Birth Centre)2018/12692: Treatment delay (Ophthalmology)2018/13161: Sub‐optimal care of the deteriorating patient (ED)2018/13224: Treatment delay (Dermatology)2018/13400: Sub‐optimal care of the deteriorating patient (ED)
(24) Of the 75 SIs underway in May, 34 were due with KCCG in month. The current overdue backlog KPI stands at 30.
(25) Treatment delays are the most common reason for Serious Incidents.
21
0
1
2
3
4
Apr‐16
May‐16
Jun‐16
Jul‐16
Aug‐16
Sep‐16
Oct‐16
Nov‐16
Dec‐16
Jan‐17
Feb‐17
Mar‐17
Apr‐17
May‐17
Jun‐17
Jul‐17
Aug‐17
Sep‐17
Oct‐17
Nov‐17
Dec‐17
Jan‐18
Feb‐18
Mar‐18
Apr‐18
May‐18
(22) Never Events
Actual
0
5
10
15
20
25
30
35
40
Apr‐16
May‐16
Jun‐16
Jul‐16
Aug‐16
Sep‐16
Oct‐16
Nov‐16
Dec‐16
Jan‐17
Feb‐17
Mar‐17
Apr‐17
May‐17
Jun‐17
Jul‐17
Aug‐17
Sep‐17
Oct‐17
Nov‐17
Dec‐17
Jan‐18
Feb‐18
Mar‐18
Apr‐18
May‐18
(23) Serious Incidents
Dateincidentdeclared
0 20 40 60 80
Slips. Trip, falls
Treatment delay
Diagnostic incident‐ delay / failure to act on test results
Surgical / invasive procedure incident
Sub‐optimal care of the deteriorating patient
Maternity / Obstetric: baby only
Major incident
Pressure Ulcer
Abuse / alleged abuse of child patient by third party
Other
Healthcare Acquired Infection
Disruptive / aggressive / violent behaviour
Abuse / alleged abuse of adult patient by staff
Medication incident
Information Governance
VTE
(25) Serious Incident Types: Apr 2017‐May 2018
2017/18 2018/19
0
10
20
30
40
50
60
70
80
90
Jun‐17
Jul‐17
Aug‐17
Sep‐17
Oct‐17
Nov‐17
Dec‐17
Jan‐18
Feb‐18
Mar‐18
Apr‐18
May‐18
(24) SI Investigations
SIs breached
SIs not breached

SAFETY– Patient SafetyMedicines ManagementMedicine Reconciliation Accountable Officer: Medical Director
(26) The accurate prescribing of medicines at the transfer of care is a high risk area and medicines reconciliation is a key control measure undertaken by the clinical pharmacy team.
Pharmacy undertakes >2,000 meds recs a month for >80% of patients (excluding <24hrs, paeds, Obs and SMH).
NICE guidance is to achieve 100% of patients within 24hrs. RCHT achieves approximately 65% within 24hrs and 86% overall.
Options to improve medicine reconciliation are being explored within divisions
Current improvements in this metric are due to the implementation of a team “huddle” each morning which ensures the team are very aware of current operational pressures and performance.
22
40%45%50%55%60%65%70%75%80%85%90%
Apr‐16
May‐16
Jun‐16
Jul‐16
Aug‐16
Sep‐16
Oct‐16
Nov‐16
Dec‐16
Jan‐17
Feb‐17
Mar‐17
Apr‐17
May‐17
Jun‐17
Jul‐17
Aug‐17
Sep‐17
Oct‐17
Nov‐17
Dec‐17
Jan‐18
Feb‐18
Mar‐18
Apr‐18
May‐18
(26) Medicine Reconciliation
Actual

QUALITY & SAFETYPATIENT OUTCOMES/EFFECTIVENESSSummary Dashboard
23

QUALITY Patient Outcomes/EffectivenessMortalityAccountable Officer: Medical Director
(27) The SHMI is the ratio of observed deaths to expected deaths. It includes those patients who die within 30 days of discharge.The HSMR is the ratio of observed deaths to expected deaths for a basket of 56 (clinical classification system) diagnosis groups which represent approximately 80% of in‐hospital deaths. The overall HSMR is at 97.8 and remains positively below the national benchmark of 100 and continues to sit within the expected range. The crude mortality rate remains stable.
(28) The improvement in weekend mortality compared with weekday has been sustained (HSMR for patients admitted at the weekend remains below that for patients admitted during the week (95.36 compared to 97.8).
RCHT continues to show only one sustained red flag HSMR diagnosis (acute cerebrovascular disease) and the formal report from the external peer review has now been received and a range of actions have been developed.
24
90
95
100
105
110
115
120
125
Apr‐16
May‐16
Jun‐16
Jul‐16
Aug‐16
Sep‐16
Oct‐16
Nov‐16
Dec‐16
Jan‐17
Feb‐17
Mar‐17
Apr‐17
May‐17
Jun‐17
Jul‐17
Aug‐17
Sep‐17
Oct‐17
Nov‐17
Dec‐17
Jan‐18
Feb‐18
Mar‐18
(27) Rolling HSMR by Non‐weekend/Weekend
Rolling 12month HSMR
Non‐weekend
Weekend
5
10
15
20
25
30
80
85
90
95
100
105
110
115
Apr‐16
May‐16
Jun‐16
Jul‐16
Aug‐16
Sep‐16
Oct‐16
Nov‐16
Dec‐16
Jan‐17
Feb‐17
Mar‐17
Apr‐17
May‐17
Jun‐17
Jul‐17
Aug‐17
Sep‐17
Oct‐17
Nov‐17
Dec‐17
Jan‐18
Feb‐18
Mar‐18
Apr‐18
May‐18
Crude M
ortality
SHMI / HSM
R / SMR
(28) SHMI, HSMR, SMR and Crude Mortality
SHMI
HSMR
SMR
Crude Mortality

QUALITY Patient Outcomes/EffectivenessSepsisAccountable Officer: Medical Director
*When looking at the results on these graphs it should be noted that the information is derived from the CQUIN audit, which only requires 50 emergency admissions and 50 inpatients notes to be used as a data source, where available.
(29) 98% screening was achieved in admitting areas. This is based on 1 non screen out of 50 sets of notes reviewed
(30) There has been another increase in the giving of antibiotics within the hour.
(31) There was an increase in screening for inpatients again. This is based on 2 patients out of 50 reviewed. Neither of the 2 that were not screened had sepsis.
(32) There was an increase in antibiotics being given within the hour for inpatients. This was based on 3 patients all of which had had their antibiotics within the hour.
The plan is for the Sepsis screening tool to be implemented in September within the Enerve centre which should improving screening and intervention in sepsis.
25
30%
40%
50%
60%
70%
80%
90%
100%
Apr‐16
May‐16
Jun‐16
Jul‐16
Aug‐16
Sep‐16
Oct‐16
Nov‐16
Dec‐16
Jan‐17
Feb‐17
Mar‐17
Apr‐17
May‐17
Jun‐17
Jul‐17
Aug‐17
Sep‐17
Oct‐17
Nov‐17
Dec‐17
Jan‐18
Feb‐18
Mar‐18
Apr‐18
(29) Patients who met the criteria and were screened for sepsis ‐ ED & other admitting areas
Actual
Standard
0%
20%
40%
60%
80%
100%
Apr‐16
May‐16
Jun‐16
Jul‐16
Aug‐16
Sep‐16
Oct‐16
Nov‐16
Dec‐16
Jan‐17
Feb‐17
Mar‐17
Apr‐17
May‐17
Jun‐17
Jul‐17
Aug‐17
Sep‐17
Oct‐17
Nov‐17
Dec‐17
Jan‐18
Feb‐18
Mar‐18
Apr‐18
(30) IV antibiotics within 1 hour (severe sepsis) ‐ED & other admitting areas
Actual
Standard
0%
20%
40%
60%
80%
100%
Apr‐16
May‐16
Jun‐16
Jul‐16
Aug‐16
Sep‐16
Oct‐16
Nov‐16
Dec‐16
Jan‐17
Feb‐17
Mar‐17
Apr‐17
May‐17
Jun‐17
Jul‐17
Aug‐17
Sep‐17
Oct‐17
Nov‐17
Dec‐17
Jan‐18
Feb‐18
Mar‐18
Apr‐18
(31) Patients who met the criteria and were screened for sepsis ‐ Inpatients
Actual
Standard
0%
20%
40%
60%
80%
100%
Oct‐16
Nov‐16
Dec‐16
Jan‐17
Feb‐17
Mar‐17
Apr‐17
May‐17
Jun‐17
Jul‐17
Aug‐17
Sep‐17
Oct‐17
Nov‐17
Dec‐17
Jan‐18
Feb‐18
Mar‐18
Apr‐18
(32) IV antibiotics within 1 hour (severe sepsis) ‐Inpatients
Actual
Standard

QUALITY Patient Outcomes/EffectivenessCardiac and Peri ArrestsAccountable Officer: Medical Director
26
(33,34) The number of cardiac arrests in May (10) less than previous 2 months (11).
(35) The number of peri‐arrest calls has reduced from previous months in 2018 May (5) April (9) March (7) Feb (7) Jan (8). There is a reduction from the previous years May 2017 peri‐arrest calls (6) May 2016 (11). It was hoped with continued use of Nervecentre, expansion of the outreach service along with more appropriate use of Treatment Escalation Plans the Trust would see a sustained reduction in the number of cardiac arrests. This info has been highlighted to the Resuscitation Committee and D&E group.
(36) 13 out of patients (who were eligible for the Call to Balloon audit) received reperfusion within 150 minutes of calling for help in May. This equated to 81.3%, meeting the 75% standard.
0.00
0.10
0.20
0.30
0.40
0.50
0.60
0.70
0.80
Apr‐16
May‐16
Jun‐16
Jul‐16
Aug‐16
Sep‐16
Oct‐16
Nov‐16
Dec‐16
Jan‐17
Feb‐17
Mar‐17
Apr‐17
May‐17
Jun‐17
Jul‐17
Aug‐17
Sep‐17
Oct‐17
Nov‐17
Dec‐17
Jan‐18
Feb‐18
Mar‐18
Apr‐18
May‐18
(33) Cardiac Arrests per 1000 bed days
Actual
0
2
4
6
8
10
12
14
Apr‐16
May‐16
Jun‐16
Jul‐16
Aug‐16
Sep‐16
Oct‐16
Nov‐16
Dec‐16
Jan‐17
Feb‐17
Mar‐17
Apr‐17
May‐17
Jun‐17
Jul‐17
Aug‐17
Sep‐17
Oct‐17
Nov‐17
Dec‐17
Jan‐18
Feb‐18
Mar‐18
Apr‐18
May‐18
(34) Cardiac Arrests
Actual
02468101214161820
Apr‐16
May‐16
Jun‐16
Jul‐16
Aug‐16
Sep‐16
Oct‐16
Nov‐16
Dec‐16
Jan‐17
Feb‐17
Mar‐17
Apr‐17
May‐17
Jun‐17
Jul‐17
Aug‐17
Sep‐17
Oct‐17
Nov‐17
Dec‐17
Jan‐18
Feb‐18
Mar‐18
Apr‐18
May‐18
(35) Peri Arrests
Actual
0.00%
20.00%
40.00%
60.00%
80.00%
100.00%
Apr‐16
May‐16
Jun‐16
Jul‐16
Aug‐16
Sep‐16
Oct‐16
Nov‐16
Dec‐16
Jan‐17
Feb‐17
Mar‐17
Apr‐17
May‐17
Jun‐17
Jul‐17
Aug‐17
Sep‐17
Oct‐17
Nov‐17
Dec‐17
Jan‐18
Feb‐18
Mar‐18
Apr‐18
May‐18
(36) Primary PCI 'call to balloon' of 75% within 150 minutes
Actual
Standard

Key Operational Standards Summary DashboardAccountable Officer: Chief Operating Officer
27

Key Operational StandardsEmergency & Urgent CareAccountable Officer: Chief Operating Officer
28
Emergency Department Heat Map & Patient Flow Alert Status The heat map shows the number of patients in the Treliske Emergency Department at the start of each hour. This includes both majors and minors, as well as all adults and paediatric patients.
The alert status shows the status provided on the daily bedstate at the start of each day.
The improved OPEL status achieved in April was sustained for most of May, with only 2 out of the 31 days on level 3 (red) escalation – the remaining days were all either green or amber (alert status 1 and 2).
The movement of the medical take to the Acute Medical Unit continued to have a significant positive impact on ED crowding.
DATE 00 01 02 03 04 05 06 07 08 09 10 11 12 13 14 15 16 17 18 19 20 21 22 23
01/05/2018 40 37 35 32 26 26 23 20 22 28 28 24 23 31 29 27 30 35 40 42 51 55 53 48
02/05/2018 47 46 36 32 28 26 24 19 19 26 24 22 33 37 33 40 39 38 41 34 32 25 30 35
03/05/2018 33 33 21 13 9 7 9 10 9 19 24 36 34 38 39 42 46 47 38 35 41 46 40 38
04/05/2018 32 23 19 12 12 9 8 16 21 20 20 25 21 27 33 36 36 37 39 39 35 35 39 30
05/05/2018 21 17 11 10 10 13 11 15 14 18 20 32 40 45 52 47 46 53 63 69 69 62 61 58
06/05/2018 45 32 27 24 19 13 15 15 17 21 25 35 42 50 54 63 60 60 49 39 47 52 53 54
07/05/2018 37 30 23 18 18 12 9 12 12 23 44 52 62 62 47 38 43 47 51 51 45 53 51 50
08/05/2018 43 34 26 26 26 16 13 9 10 10 19 27 29 34 35 33 37 28 30 44 44 38 47 40
09/05/2018 36 32 25 20 15 12 10 11 12 15 29 37 40 39 33 46 48 42 41 37 37 37 46 48
10/05/2018 39 32 26 21 20 14 8 6 5 10 26 32 40 46 41 42 45 41 35 38 42 45 49 55
11/05/2018 37 29 26 18 15 16 14 9 9 13 17 25 41 44 39 30 28 28 31 36 37 43 45 40
12/05/2018 36 26 23 21 15 15 10 6 3 11 29 40 44 48 35 36 52 47 46 28 23 26 24 24
13/05/2018 27 20 18 15 13 13 15 10 15 17 24 43 48 43 45 39 32 44 37 36 37 37 36 26
14/05/2018 25 24 21 16 12 9 12 15 20 15 26 32 39 50 61 57 59 49 44 45 52 47 40 36
15/05/2018 38 33 28 30 22 21 23 21 22 23 28 50 47 38 37 34 33 45 45 53 50 55 53 50
16/05/2018 40 37 26 24 22 21 20 19 21 22 26 30 31 38 35 40 29 27 30 40 42 44 50 51
17/05/2018 42 30 24 21 12 9 11 12 11 10 21 16 29 41 37 37 38 35 34 42 43 41 43 40
18/05/2018 33 22 11 11 15 13 11 10 16 18 23 28 32 38 39 39 44 36 42 44 43 53 62 56
19/05/2018 47 29 25 21 16 12 8 10 17 17 25 27 34 34 46 43 42 43 43 48 51 51 48 44
20/05/2018 33 25 28 32 27 20 15 16 15 21 34 49 48 52 54 61 58 64 57 56 55 52 56 46
21/05/2018 41 36 25 20 17 11 8 11 10 14 22 24 40 42 49 56 48 51 50 51 52 51 54 40
22/05/2018 38 31 15 16 13 13 14 10 17 19 30 33 36 47 48 56 46 39 42 45 45 46 46 41
23/05/2018 31 27 23 17 14 10 11 14 12 16 23 32 35 35 34 38 50 47 50 57 62 59 47 37
24/05/2018 31 26 24 16 16 11 12 14 13 22 39 42 52 50 42 38 32 34 37 47 47 56 53 42
25/05/2018 45 34 29 26 24 20 20 17 17 23 24 30 39 44 47 48 51 49 56 54 47 42 50 58
26/05/2018 51 42 29 26 23 20 20 18 17 18 25 38 48 47 68 71 64 53 58 49 54 44 42 46
27/05/2018 47 41 36 34 30 25 25 18 18 24 41 55 61 69 64 62 59 67 62 63 69 60 43 36
28/05/2018 35 31 23 25 13 11 11 9 16 18 31 48 48 53 56 58 57 55 47 49 38 42 44 43
29/05/2018 41 34 31 26 24 20 19 18 21 28 38 51 49 58 62 53 52 45 52 58 63 77 75 79
30/05/2018 67 54 50 44 40 38 34 32 31 33 37 35 30 35 45 48 51 52 46 42 48 56 62 59
31/05/2018 54 47 38 40 35 32 32 34 29 33 32 27 31 41 38 34 38 38 39 39 45 50 46 51
HOUR OF THE DAY
Alert Status
2
2
1
1
1
1
1
1
1
1
1
1
1
1
2
2
1
1
1
1
1
1
1
1
1
1
2
1
2
3
3

Key Operational StandardsEmergency & Urgent CareAccountable Officer: Chief Operating Officer
29
Winter Pressures Dashboard – May 2018
Category Indicator STANDARD Jan‐17 Feb‐17 Mar‐17 Apr‐17 May‐17 Jun‐17 Jul‐17 Aug‐17 Sep‐17 Oct‐17 Nov‐17 Dec‐17 Jan‐18 Feb‐18 Mar‐18 Apr‐18 May‐18 TREND
ED ED ‐ 4hr Emergency Standard (RCH + WCH) 95% 80.1% 79.7% 77.7% 81.7% 84.5% 85.5% 84.5% 80.3% 74.2% 81.9% 73.7% 66.0% 69.3% 65.2% 78.7% 95.2% 92.6%
ED ED ‐ 4hr Emergency Standard (Type 1 RCH) 95% 75.5% 75.1% 72.5% 76.7% 80.6% 81.5% 80.3% 74.7% 67.6% 77.6% 68.0% 57.8% 61.8% 56.6% 73.1% 94.1% 91.1%
ED ED ‐ Departures left unseen ѱ 5% 1.4% 1.5% 2.1% 2.8% 2.9% 2.5% 3.3% 4.0% 3.6% 2.4% 2.7% 2.9% 1.9% 2.2% 2.0% 1.4% 1.4%
ED ED ‐ Unplanned reattenders ѱ 5% 7.9% 7.2% 8.1% 7.6% 7.2% 7.6% 7.8% 7.5% 7.8% 7.9% 7.8% 8.1% 7.2% 7.0% 7.3% 7.8% 7.9%
ED ED ‐ Time to triage (95th Percenti le) ѱ 15 25 27 32 30 25 29 29 37 39 30 35 41 35 43 60 39 25
ED ED ‐ Time to treatment (Median) ѱ 60 54 55 62 75 72 72 83 85 89 75 76 96 71 88 81 54 66
ED ED ‐ Decision to admit (Mean) ѱ 153 151 154 163 168 163 158 164 178 179 160 175 204 185 202 178 143 152
ED ED ‐ 12 hour trolley waits ѱ 0 0 0 1 0 0 0 0 0 0 0 1 0 0 1 17 0 0
ED ED ‐ Avg patients in department ѱ 33 31 32 32 34 37 38 32 37 42 40 43 35 25 28
ED ED ‐ Hours with >50 patients in department ѱ 73 49 68 64 89 144 145 74 118 188 150 189 137 0 23
ED ED ‐ Medically Expected patients in department at 8am ѱ 27 18 37 40 29 36 32 20 25 23 17 19 34 30 26 25 9 24
ED ED ‐ Medically Expected patients in department at 4pm ѱ 132 117 115 139 116 132 111 119 133 140 148 179 168 172 32 48 24 26
ED ED ‐ Average Medically Expected patients in department at 4pm ѱ 4.3 3.8 4.1 4.5 3.9 4.3 3.7 3.8 4.3 4.7 4.8 6.0 5.4 5.5 1.1 1.5 0.8 0.8
Inpatient Medical Outliers 32 24 21 24 28 21 35 30 34 33 39 46 36 27 27
Inpatient Surgical Outliers 1 1 0 0 0 0 1 3 3 0 1 1 0 1 1
Inpatient Bed occupancy (Base Wards only) 88% 89.3% 89.2% 89.9% 89.2% 87.1% 90.9% 90.2% 91.1% 89.9% 91.3% 92.1% 87.4% 85.8% 87.6%
Inpatient Stranded patients (LOS>7) ‐ Trust average 246 246 235 238 240 219 246 244 240 224 228 253 225 205 204
Inpatient Super‐Stranded patients (LOS>21) ‐ Trust average 98 108 90 98 91 75 100 100 95 87 81 93 80 71 63
Inpatient DTOCs Acute All 48 81 72 82 66 55 52 64 53 45 45 42 38 36 37 42 26 26
Inpatient DTOCS Community All 66 93 93 90 80 83 87 109 68 75 77 63 60 50 58 40 58 50
DTOCS All All 114 174 165 172 146 138 139 173 122 120 122 105 98 86 95 83 83 76
Inpatient DTOCs Acute ‐ Social 22 26 31 31 23 18 21 19 17 21 23 18 11 9 17 13 13 9
Inpatient DTOCS Social (Acute & Community) 28 80 82 89 78 63 73 82 60 61 66 53 38 38 42 32 40 28
Ambulance Ambulance delays ‐ > 30 mins 75 30 21 43 25 64 52 61 93 236 99 92 218 118 152 158 22 27
Ambulance Ambulance delays ‐ > 60 mins 12 0 1 1 1 3 13 1 4 77 21 4 85 11 41 60 1 1
Sepsis Emergency Sepsis ‐ Antibiotics within 60mins 90% 68.0% 56.0% 79.0% 60.0% 70.0% 65.0% 73.0% 61.0% 70.0% 67.0% 77.0% 67.0% 36.0% 43.0% 50.0% 54.0% 48.0%
Staffing Safe Staffing Fil l Rates 96% 94.7% 96.6% 97.7% 97.8% 96.4% 95.7% 94.0% 96.0% 97.6% 94.9% 95.3% 91.4% 94.1% 96.5% 97.3% 99.6% 98.6%
ED audits Care Rounds 90% 96.0% 90.0% 90.0% 87.0% 94.0% 97.0% 90.0% 88.0% 91.0% 93.0% 92.0% 84.0% 82.0% 90.0% 82.0% 95.0% 89.0%
ED audits Pain 90% 88.0% 95.0% 80.0% 90.0% 87.0% 90.0% 95.0% 89.0% 89.0% 86.0% 90.0% 86.0% 86.0% 94.0% 75.0% 81.0% 88.0%
ED audits Documentation 90% 89.0% 94.0% 91.0% 88.0% 96.0% 94.0% 100.0% 94.0% 96.0% 87.0% 87.0% 83.0% 88.0% 83.0% 87.5% 92.5% 78.0%
ED audits NEWS 90% 94.0% 91.0% 89.0% 70.0% 93.0% 80.0% 90.0% 90.0% 90.0% 100.0% 100.0% 90.0% 90.0% 90.0% 100.0% 90.0% 100.0%
ѱ = Type 1 RCH Only
Meeting standard, or improved on last year where no standard exists
Better than last year but not meeting standard/ worse than last year but meeting standard
Worse than last year AND not meeting standard

Key Operational StandardsEmergency & Urgent CareAccountable Officer: Chief Operating Officer
30
(37) Performance against the emergency 4 hour access standard continued above both the local trajectory of 92% and the national 95% standard at 96.6% due to the on‐going impact of Gold Command.
(38) Unplanned re‐attendances (patients returning to ED within 7 days of their original attendance) increased for the fourth consecutive month, rising to 7.2%. This remains under the most recently available national figure of 7.9% (March 18).
(39, 40) Both ambulance measures remained low as crowding remained eliminated from the department due to the significant improvements in patient flow. The percentage of ambulances waiting over 15 minutes to handover reduced to 20% ‐ this compares to 58% in May last year. None waited over 60 minutes.
The median time to triage patients arriving by ambulance was 9 minutes – this is the same as the latest national average (March).
0%1%2%3%4%5%6%7%8%9%
Apr‐16
May‐16
Jun‐16
Jul‐16
Aug‐16
Sep‐16
Oct‐16
Nov‐16
Dec‐16
Jan‐17
Feb‐17
Mar‐17
Apr‐17
May‐17
Jun‐17
Jul‐17
Aug‐17
Sep‐17
Oct‐17
Nov‐17
Dec‐17
Jan‐18
Feb‐18
Mar‐18
Apr‐18
May‐18
(38) Unplanned reattendance at ED (% of total attenders)
Actual
Thresholdmin
Standard
0%
10%
20%
30%
40%
50%
60%
70%
Apr‐16
May‐16
Jun‐16
Jul‐16
Aug‐16
Sep‐16
Oct‐16
Nov‐16
Dec‐16
Jan‐17
Feb‐17
Mar‐17
Apr‐17
May‐17
Jun‐17
Jul‐17
Aug‐17
Sep‐17
Oct‐17
Nov‐17
Dec‐17
Jan‐18
Feb‐18
Mar‐18
Apr‐18
May‐18
(39) Ambulance Delays ‐% waiting over 15 minutes
% Waitingover 15mins
Standard
0
50
100
150
200
250
300
Apr‐16
May‐16
Jun‐16
Jul‐16
Aug‐16
Sep‐16
Oct‐16
Nov‐16
Dec‐16
Jan‐17
Feb‐17
Mar‐17
Apr‐17
May‐17
Jun‐17
Jul‐17
Aug‐17
Sep‐17
Oct‐17
Nov‐17
Dec‐17
Jan‐18
Feb‐18
Mar‐18
Apr‐18
May‐18
(40) Ambulance Handover Delays ‐ 30 & 60 Minutes
Over 30Mins
Over 60Mins
60%
65%
70%
75%
80%
85%
90%
95%
100%
Apr‐16
May‐16
Jun‐16
Jul‐16
Aug‐16
Sep‐16
Oct‐16
Nov‐16
Dec‐16
Jan‐17
Feb‐17
Mar‐17
Apr‐17
May‐17
Jun‐17
Jul‐17
Aug‐17
Sep‐17
Oct‐17
Nov‐17
Dec‐17
Jan‐18
Feb‐18
Mar‐18
Apr‐18
May‐18
(37) ED & MIU (from July17) attenders ‐ 4 hours arrival to discharge, admission or transfer
Actual
Localtrajectory
Standard

Key Operational StandardsEmergency & Urgent CareAccountable Officer: Chief Operating Officer
31
(41) The percentage of ED attenders who left without being seen was 1.4%; remaining well within the 5% standard.
(42) 95th percentile time to initial assessment improved significantly as anticipated due to the removal of crowding from ED achieved through Gold Command actions improving patient flow. The 95th centile wait was 25 minutes, 3 minutes less than May last year.
(43) Median time from arrival to treatment increased to 59 minutes, just below the 60 minute standard. Improvements in this quality indicator are expected with the improvements in patient flow.
(44) There were no 12 hour trolley wait breaches in May.
0%
1%
2%
3%
4%
5%
6%
Apr‐16
May‐16
Jun‐16
Jul‐16
Aug‐16
Sep‐16
Oct‐16
Nov‐16
Dec‐16
Jan‐17
Feb‐17
Mar‐17
Apr‐17
May‐17
Jun‐17
Jul‐17
Aug‐17
Sep‐17
Oct‐17
Nov‐17
Dec‐17
Jan‐18
Feb‐18
Mar‐18
Apr‐18
May‐18
(41) % of ED Attenders who left without being seen
Actual
Standard
0
10
20
30
40
50
60
70
Apr‐16
May‐16
Jun‐16
Jul‐16
Aug‐16
Sep‐16
Oct‐16
Nov‐16
Dec‐16
Jan‐17
Feb‐17
Mar‐17
Apr‐17
May‐17
Jun‐17
Jul‐17
Aug‐17
Sep‐17
Oct‐17
Nov‐17
Dec‐17
Jan‐18
Feb‐18
Mar‐18
Apr‐18
May‐18
(42) 95th percentile, Time to Initial Assessment (mins)
Actual
Standard
0102030405060708090
Apr‐16
May‐16
Jun‐16
Jul‐16
Aug‐16
Sep‐16
Oct‐16
Nov‐16
Dec‐16
Jan‐17
Feb‐17
Mar‐17
Apr‐17
May‐17
Jun‐17
Jul‐17
Aug‐17
Sep‐17
Oct‐17
Nov‐17
Dec‐17
Jan‐18
Feb‐18
Mar‐18
Apr‐18
May‐18
(43) Median Time from Arrival to Treatment (mins)
Actual
Standard
024681012141618
Apr‐16
May‐16
Jun‐16
Jul‐16
Aug‐16
Sep‐16
Oct‐16
Nov‐16
Dec‐16
Jan‐17
Feb‐17
Mar‐17
Apr‐17
May‐17
Jun‐17
Jul‐17
Aug‐17
Sep‐17
Oct‐17
Nov‐17
Dec‐17
Jan‐18
Feb‐18
Mar‐18
Apr‐18
May‐18
(44) 12 hour trolley waits
Actual

Key Operational StandardsLength of StayAccountable Officer: Chief Operating Officer
32
(45) Specialty outliers reduced slightly again to 28, 4 more than May 2017.
(46, 48) The additional care home beds purchased by Cornwall Council during Gold Command continue to have a positive effect on long lengths of stay – LOS over 10 days reduced again to 29.9% compared to 30.6% in May last year. Average LOS was 3.0 days – a further improvement and 0.3 days better than the same month last year.
(47) Morning discharge performance increased to 2.9%.
0%
5%
10%
15%
20%
25%
30%
35%
40%
Apr‐16
May‐16
Jun‐16
Jul‐16
Aug‐16
Sep‐16
Oct‐16
Nov‐16
Dec‐16
Jan‐17
Feb‐17
Mar‐17
Apr‐17
May‐17
Jun‐17
Jul‐17
Aug‐17
Sep‐17
Oct‐17
Nov‐17
Dec‐17
Jan‐18
Feb‐18
Mar‐18
Apr‐18
May‐18
(46) Length of Stay over 10 days
Actual
Standard
0.00%
0.50%
1.00%
1.50%
2.00%
2.50%
3.00%
3.50%
4.00%
Apr‐16
May‐16
Jun‐16
Jul‐16
Aug‐16
Sep‐16
Oct‐16
Nov‐16
Dec‐16
Jan‐17
Feb‐17
Mar‐17
Apr‐17
May‐17
Jun‐17
Jul‐17
Aug‐17
Sep‐17
Oct‐17
Nov‐17
Dec‐17
Jan‐18
Feb‐18
Mar‐18
Apr‐18
May‐18
(47) % Discharges Between 6am and 10am
% Patientsdischargedbefore 10am
0
10
20
30
40
50
60
Apr‐16
May‐16
Jun‐16
Jul‐16
Aug‐16
Sep‐16
Oct‐16
Nov‐16
Dec‐16
Jan‐17
Feb‐17
Mar‐17
Apr‐17
May‐17
Jun‐17
Jul‐17
Aug‐17
Sep‐17
Oct‐17
Nov‐17
Dec‐17
Jan‐18
Feb‐18
Mar‐18
Apr‐18
May‐18
(45) Total specialty outliers
Actual
Standard
2
2.2
2.4
2.6
2.8
3
3.2
3.4
3.6
3.8
Apr‐16
May‐16
Jun‐16
Jul‐16
Aug‐16
Sep‐16
Oct‐16
Nov‐16
Dec‐16
Jan‐17
Feb‐17
Mar‐17
Apr‐17
May‐17
Jun‐17
Jul‐17
Aug‐17
Sep‐17
Oct‐17
Nov‐17
Dec‐17
Jan‐18
Feb‐18
Mar‐18
Apr‐18
May‐18
(48) Average LOS
Actual
Standard(monthlyaverageover 3years)

Key Operational StandardsCancerAccountable Officer: Chief Operating Officer
33
(49‐52) The 62 day referral to treatment and 62 day screening standards were not met in April with the majority of the breaches occurring on the colorectal pathway.
The 62 day standard is expected to remain challenging in quarter 1, given continued difficulties with aspects of the diagnostic pathway. A number of recovery plans are in place in diagnostic specialties to deliver increased capacity.
There were 4.5 breaches of the 104 day backstop target: 1 colorectal, 115 day breach due to diagnostic and surgical outpatient capacity; 2.5 Lung breaches. 116 days due to complex pathway, 113 days due to complex diagnostics and one at 132 days due to complex diagnostics and tertiary delays; 0.5 Urology at 157 days due to delayed diagnostic pathway, referred to Tertiary centre on day 98.
The Trust retains its record of quarterly achievement on all standards since Q2 2010‐11.
90%
91%
92%
93%
94%
95%
96%
97%
98%
99%
Apr‐16
May‐16
Jun‐16
Jul‐16
Aug‐16
Sep‐16
Oct‐16
Nov‐16
Dec‐16
Jan‐17
Feb‐17
Mar‐17
Apr‐17
May‐17
Jun‐17
Jul‐17
Aug‐17
Sep‐17
Oct‐17
Nov‐17
Dec‐17
Jan‐18
Feb‐18
Mar‐18
Apr‐18
(49) Cancer 2 week wait
Actual
Standard
94%
95%
96%
97%
98%
99%
100%
Apr‐16
May‐16
Jun‐16
Jul‐16
Aug‐16
Sep‐16
Oct‐16
Nov‐16
Dec‐16
Jan‐17
Feb‐17
Mar‐17
Apr‐17
May‐17
Jun‐17
Jul‐17
Aug‐17
Sep‐17
Oct‐17
Nov‐17
Dec‐17
Jan‐18
Feb‐18
Mar‐18
Apr‐18
(50) Cancer treated within 31 Days Target
Actual
Standard
80%81%82%83%84%85%86%87%88%89%90%
Apr‐16
May‐16
Jun‐16
Jul‐16
Aug‐16
Sep‐16
Oct‐16
Nov‐16
Dec‐16
Jan‐17
Feb‐17
Mar‐17
Apr‐17
May‐17
Jun‐17
Jul‐17
Aug‐17
Sep‐17
Oct‐17
Nov‐17
Dec‐17
Jan‐18
Feb‐18
Mar‐18
Apr‐18
(51) Cancer treated within 62 Days Target
Actual
Standard
60%65%70%75%80%85%90%95%100%
Apr‐16
May‐16
Jun‐16
Jul‐16
Aug‐16
Sep‐16
Oct‐16
Nov‐16
Dec‐16
Jan‐17
Feb‐17
Mar‐17
Apr‐17
May‐17
Jun‐17
Jul‐17
Aug‐17
Sep‐17
Oct‐17
Nov‐17
Dec‐17
Jan‐18
Feb‐18
Mar‐18
Apr‐18
(52) Percentage receiving first definitive treatment within 62 days of urgent referral from
national screening service
Actual
Standard
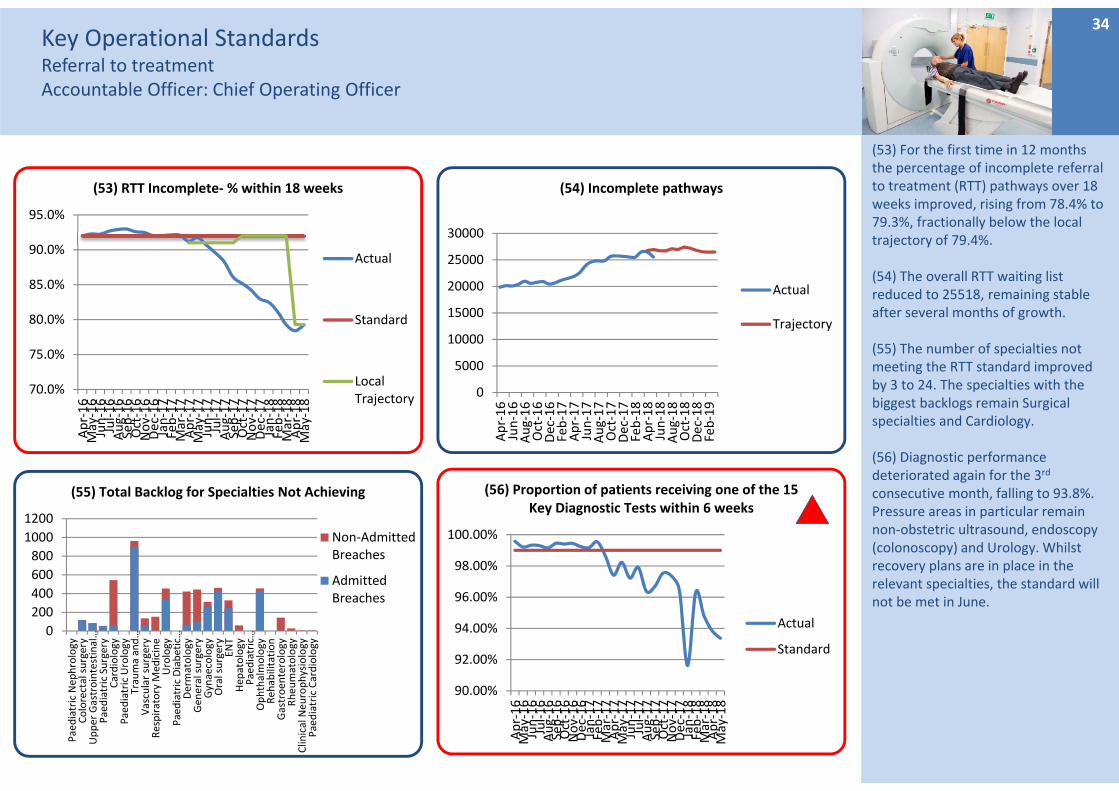
Key Operational StandardsReferral to treatmentAccountable Officer: Chief Operating Officer
34
(53) For the first time in 12 months the percentage of incomplete referral to treatment (RTT) pathways over 18 weeks improved, rising from 78.4% to 79.3%, fractionally below the local trajectory of 79.4%.
(54) The overall RTT waiting list reduced to 25518, remaining stable after several months of growth.
(55) The number of specialties not meeting the RTT standard improved by 3 to 24. The specialties with the biggest backlogs remain Surgical specialties and Cardiology.
(56) Diagnostic performance deteriorated again for the 3rd
consecutive month, falling to 93.8%. Pressure areas in particular remain non‐obstetric ultrasound, endoscopy (colonoscopy) and Urology. Whilst recovery plans are in place in the relevant specialties, the standard will not be met in June.
70.0%
75.0%
80.0%
85.0%
90.0%
95.0%
Apr‐16
May‐16
Jun‐16
Jul‐16
Aug‐16
Sep‐16
Oct‐16
Nov‐16
Dec‐16
Jan‐17
Feb‐17
Mar‐17
Apr‐17
May‐17
Jun‐17
Jul‐17
Aug‐17
Sep‐17
Oct‐17
Nov‐17
Dec‐17
Jan‐18
Feb‐18
Mar‐18
Apr‐18
May‐18
(53) RTT Incomplete‐ % within 18 weeks
Actual
Standard
LocalTrajectory
0
200
400
600
800
1000
1200
Paediatric Nep
hrology
Colorectal surgery
Upper Gastrointestinal…
Paediatric Surgery
Cardiology
Paediatric Urology
Trauma and…
Vascular surgery
Respiratory M
edicine
Urology
Paediatric Diabetic…
Dermatology
Gen
eral surgery
Gynaecology
Oral surgery
ENT
Hep
atology
Paediatric…
Ophthalmology
Reh
abilitation
Gastroen
terology
Rheu
matology
Clinical Neu
rophysiology
Paediatric Cardiology
(55) Total Backlog for Specialties Not Achieving
Non‐AdmittedBreaches
AdmittedBreaches
90.00%
92.00%
94.00%
96.00%
98.00%
100.00%
Apr‐16
May‐16
Jun‐16
Jul‐16
Aug‐16
Sep‐16
Oct‐16
Nov‐16
Dec‐16
Jan‐17
Feb‐17
Mar‐17
Apr‐17
May‐17
Jun‐17
Jul‐17
Aug‐17
Sep‐17
Oct‐17
Nov‐17
Dec‐17
Jan‐18
Feb‐18
Mar‐18
Apr‐18
May‐18
(56) Proportion of patients receiving one of the 15 Key Diagnostic Tests within 6 weeks
Actual
Standard
0
5000
10000
15000
20000
25000
30000
Apr‐16
Jun‐16
Aug‐16
Oct‐16
Dec‐16
Feb‐17
Apr‐17
Jun‐17
Aug‐17
Oct‐17
Dec‐17
Feb‐18
Apr‐18
Jun‐18
Aug‐18
Oct‐18
Dec‐18
Feb‐19
(54) Incomplete pathways
Actual
Trajectory

Key Operational StandardsCancelled OperationsAccountable Officer: Chief Operating Officer
35
(57) At the end of May there were 231 referral to treatment pathways over 52 weeks. Whilst this was above the local trajectory of 203, this was 3 fewer than the previous month – the first time this has reduced in 14 months.
(58) Reportable cancellations on the day increased slightly from April’s record low of 0.6% to 1.0%. There were 59 cancellations on the day, 24 fewer than May last year. Of the 59, only 4 were bed related – the top reason for cancellations was insufficient time. The most affected specialties were Orthopaedics, Cardiology and Vascular.
(59) The number of 28 day rebooking breaches reduced significantly as anticipated, this time to 9 – the lowest since September 2016.
(60) 4.9% of clinics were cancelled with less than 6 weeks’ notice within the range of normal variation. 52% (163) of those cancelled with less than the required notice (as stated in the Trust’s Access Policy) were cancelled for avoidable reasons (mostly planned absence and rota issues). This is static.
0.0%
0.5%
1.0%
1.5%
2.0%
2.5%
3.0%
3.5%
Apr‐16
May‐16
Jun‐16
Jul‐16
Aug‐16
Sep‐16
Oct‐16
Nov‐16
Dec‐16
Jan‐17
Feb‐17
Mar‐17
Apr‐17
May‐17
Jun‐17
Jul‐17
Aug‐17
Sep‐17
Oct‐17
Nov‐17
Dec‐17
Jan‐18
Feb‐18
Mar‐18
Apr‐18
May‐18
(58) Percentage Cancellations on same day
Actual
Standard
0
10
20
30
40
50
60
70
Apr‐16
May‐16
Jun‐16
Jul‐16
Aug‐16
Sep‐16
Oct‐16
Nov‐16
Dec‐16
Jan‐17
Feb‐17
Mar‐17
Apr‐17
May‐17
Jun‐17
Jul‐17
Aug‐17
Sep‐17
Oct‐17
Nov‐17
Dec‐17
Jan‐18
Feb‐18
Mar‐18
Apr‐18
May‐18
(59) 28 day re‐booking breaches & urgent operations cancelled more than once
Breaches
Urgent Morethan Once
0%
1%
2%
3%
4%
5%
6%
7%
Apr‐16
May‐16
Jun‐16
Jul‐16
Aug‐16
Sep‐16
Oct‐16
Nov‐16
Dec‐16
Jan‐17
Feb‐17
Mar‐17
Apr‐17
May‐17
Jun‐17
Jul‐17
Aug‐17
Sep‐17
Oct‐17
Nov‐17
Dec‐17
Jan‐18
Feb‐18
Mar‐18
Apr‐18
May‐18
(60) Short notice OP Clinic cancellations
Actual
0
50
100
150
200
250
Apr‐16
Jun‐16
Aug‐16
Oct‐16
Dec‐16
Feb‐17
Apr‐17
Jun‐17
Aug‐17
Oct‐17
Dec‐17
Feb‐18
Apr‐18
Jun‐18
Aug‐18
Oct‐18
Dec‐18
Feb‐19
(57) RTT waits over 52 weeks for incomplete pathways
Actual
Standard
Trajectory

Key Operational Standards Specialised PathwaysFractured Neck of Femur & Stroke IndicatorsAccountable Officer: Chief Operating Officer
36
(61) The percentage of patients with fractured neck of femur (NOF) operated on within 36 hours was 56.8%, below the 80% standard.
Exceptions continue to be reviewed in detail at the bi‐monthly NOF meeting.
(62, 63) The stroke metrics related to flow remained above their respective standards – 76.8% of patients were admitted to the Stroke Unit within 4 hours, whilst 89.0% of patients spent 90% or more of their time on the unit (the standard is now 83.8%).
Again, this is fundamentally due to the increased patient flow seen as a result of Gold Command interventions.
(64) The percentage of stroke patients receiving at CT scan within 12 hours fell slightly to 92.9%, fractionally below the increased standard of 93.5% (based on the most recently available national average).
0%10%20%30%40%50%60%70%80%90%100%
Apr‐16
May‐16
Jun‐16
Jul‐16
Aug‐16
Sep‐16
Oct‐16
Nov‐16
Dec‐16
Jan‐17
Feb‐17
Mar‐17
Apr‐17
May‐17
Jun‐17
Jul‐17
Aug‐17
Sep‐17
Oct‐17
Nov‐17
Dec‐17
Jan‐18
Feb‐18
Mar‐18
Apr‐18
May‐18
(62) % Patients spending 90% of their time on stroke unit
Actual
Standard
0%10%20%30%40%50%60%70%80%90%100%
Apr‐16
May‐16
Jun‐16
Jul‐16
Aug‐16
Sep‐16
Oct‐16
Nov‐16
Dec‐16
Jan‐17
Feb‐17
Mar‐17
Apr‐17
May‐17
Jun‐17
Jul‐17
Aug‐17
Sep‐17
Oct‐17
Nov‐17
Dec‐17
Jan‐18
Feb‐18
Mar‐18
Apr‐18
May‐18
(64) Stroke patients receiving CT scan within 12 hours
Actual
Standard
0%10%20%30%40%50%60%70%80%90%100%
Apr‐16
May‐16
Jun‐16
Jul‐16
Aug‐16
Sep‐16
Oct‐16
Nov‐16
Dec‐16
Jan‐17
Feb‐17
Mar‐17
Apr‐17
May‐17
Jun‐17
Jul‐17
Aug‐17
Sep‐17
Oct‐17
Nov‐17
Dec‐17
Jan‐18
Feb‐18
Mar‐18
Apr‐18
May‐18
(63) Stroke unit within 4 hours
Actual
Standard
0%10%20%30%40%50%60%70%80%90%100%
Apr‐16
May‐16
Jun‐16
Jul‐16
Aug‐16
Sep‐16
Oct‐16
Nov‐16
Dec‐16
Jan‐17
Feb‐17
Mar‐17
Apr‐17
May‐17
Jun‐17
Jul‐17
Aug‐17
Sep‐17
Oct‐17
Nov‐17
Dec‐17
Jan‐18
Feb‐18
Mar‐18
Apr‐18
May‐18
(61) NOF patients operated on within 36 hours
Actual
Standard

Key Operational Standards Specialised PathwaysStroke IndicatorsAccountable Officer: Chief Operating Officer
37
(65‐68) Performance against the remaining stroke indicators continues above the respective standards other than swallow assessment which dipped very slightly below the increased standard of 87.0%.
*Please note that all standards for stroke are based on the most recent national averages. These have all been reviewed and updated for the new financial year, hence the changes in some of the standards. 0%
10%20%30%40%50%60%70%80%90%100%
Apr‐16
May‐16
Jun‐16
Jul‐16
Aug‐16
Sep‐16
Oct‐16
Nov‐16
Dec‐16
Jan‐17
Feb‐17
Mar‐17
Apr‐17
May‐17
Jun‐17
Jul‐17
Aug‐17
Sep‐17
Oct‐17
Nov‐17
Dec‐17
Jan‐18
Feb‐18
Mar‐18
Apr‐18
May‐18
(65) Scanning CT Urgent within 1 hour
Actual
Standard
0%10%20%30%40%50%60%70%80%90%100%
Apr‐16
May‐16
Jun‐16
Jul‐16
Aug‐16
Sep‐16
Oct‐16
Nov‐16
Dec‐16
Jan‐17
Feb‐17
Mar‐17
Apr‐17
May‐17
Jun‐17
Jul‐17
Aug‐17
Sep‐17
Oct‐17
Nov‐17
Dec‐17
Jan‐18
Feb‐18
Mar‐18
Apr‐18
May‐18
(66) Swallow screening within 4 hours
Actual
Standard
0%10%20%30%40%50%60%70%80%90%100%
Apr‐16
May‐16
Jun‐16
Jul‐16
Aug‐16
Sep‐16
Oct‐16
Nov‐16
Dec‐16
Jan‐17
Feb‐17
Mar‐17
Apr‐17
May‐17
Jun‐17
Jul‐17
Aug‐17
Sep‐17
Oct‐17
Nov‐17
Dec‐17
Jan‐18
Feb‐18
Mar‐18
Apr‐18
May‐18
(68) Swallow Assessment 72 hours
Actual
Standard
0%10%20%30%40%50%60%70%80%90%100%
Apr‐16
May‐16
Jun‐16
Jul‐16
Aug‐16
Sep‐16
Oct‐16
Nov‐16
Dec‐16
Jan‐17
Feb‐17
Mar‐17
Apr‐17
May‐17
Jun‐17
Jul‐17
Aug‐17
Sep‐17
Oct‐17
Nov‐17
Dec‐17
Jan‐18
Feb‐18
Mar‐18
Apr‐18
May‐18
(67) NIHSS Compliance
Actual
Standard

Key Operational StandardsProductivity and efficiency measuresAccountable Officer: Chief Operating Officer
38
(69) Delayed Transfers of Care (DTOC) percentage of days lost (from the validated national snapshot data) reduced to 4.9%, the best achieved since May 2016. This remains due to the significantly reduced number of long stay patients achieved during Gold Command, which is likely to be fundamentally due to the additional care home capacity commissioned by Cornwall Council as part of Gold Command.
(70) The top categories for delay are further non acute NHS care and domiciliary packages, however both categories remain the 2 with the greatest improvement.
(71, 72) The daycase rate reduced for the 3rd consecutive month to 83.2% compared to 86.4% in May last year. This is likely due to RTT recovery plans targeting long waiting theatre cases and is reflected in the improved day of surgery admission rate.
0%
2%
4%
6%
8%
10%
12%
14%
Apr‐16
May‐16
Jun‐16
Jul‐16
Aug‐16
Sep‐16
Oct‐16
Nov‐16
Dec‐16
Jan‐17
Feb‐17
Mar‐17
Apr‐17
May‐17
Jun‐17
Jul‐17
Aug‐17
Sep‐17
Oct‐17
Nov‐17
Dec‐17
Jan‐18
Feb‐18
Mar‐18
Apr‐18
May‐18
(69) Delayed transfers of care (days lost %)
Actual
Standard
0
50
100
150
200
250
300
350
Apr‐16
May‐16
Jun‐16
Jul‐16
Aug‐16
Sep‐16
Oct‐16
Nov‐16
Dec‐16
Jan‐17
Feb‐17
Mar‐17
Apr‐17
May‐17
Jun‐17
Jul‐17
Aug‐17
Sep‐17
Oct‐17
Nov‐17
Dec‐17
Jan‐18
Feb‐18
Mar‐18
Apr‐18
May‐18
(70) Delayed transfers of care by reason
Public Funding
Residential Home
Patient or Family Choice
Nursing Home
Further non acute NHS care
Domiciliary Package
Completion of assessment
Community Equipment
80%
81%
82%
83%
84%
85%
86%
87%
88%
Apr‐16
May‐16
Jun‐16
Jul‐16
Aug‐16
Sep‐16
Oct‐16
Nov‐16
Dec‐16
Jan‐17
Feb‐17
Mar‐17
Apr‐17
May‐17
Jun‐17
Jul‐17
Aug‐17
Sep‐17
Oct‐17
Nov‐17
Dec‐17
Jan‐18
Feb‐18
Mar‐18
Apr‐18
May‐18
(71) Daycase rate
Actual
Standard
84%
86%
88%
90%
92%
94%
96%
98%
100%
Apr‐16
May‐16
Jun‐16
Jul‐16
Aug‐16
Sep‐16
Oct‐16
Nov‐16
Dec‐16
Jan‐17
Feb‐17
Mar‐17
Apr‐17
May‐17
Jun‐17
Jul‐17
Aug‐17
Sep‐17
Oct‐17
Nov‐17
Dec‐17
Jan‐18
Feb‐18
Mar‐18
Apr‐18
May‐18
(72) DOSA Rate
Actual
Standard

Key Operational StandardsProductivity and efficiency measuresAccountable Officer: Chief Operating Officer
39
(73) Net emergency readmissions within 28 days was 6.0% ‐ the upper limit of normal variation – it was 5.5% in May last year.
(74) The outpatient DNA rate increased to 6.0% after April’s low 5.8%.
(75) The proportion of follow‐up outpatients waiting more than 1 month past their to be seen by date reduced to 5.3% but remains high.
The biggest backlogs remain in Ophthalmology, Urology, Hepatology and Cardiology. The Trust’s Clinical Harm Review Panel is developing a process with support for the Transformation Team to standardise harm review processes and reviews are underway. The co‐efficient tool continues to be used to inform risk assessment and booking prioritisation.
(76) Average points are used as a measure of productivity within outpatient clinics, with attended new patients equating to 2 points and follow‐ups to 1. The average points per clinic reduced to 10.1 – remaining on an overall downward trend.
4.0%
4.5%
5.0%
5.5%
6.0%
6.5%
7.0%
7.5%
Apr‐16
May‐16
Jun‐16
Jul‐16
Aug‐16
Sep‐16
Oct‐16
Nov‐16
Dec‐16
Jan‐17
Feb‐17
Mar‐17
Apr‐17
May‐17
Jun‐17
Jul‐17
Aug‐17
Sep‐17
Oct‐17
Nov‐17
Dec‐17
Jan‐18
Feb‐18
Mar‐18
Apr‐18
May‐18
(74) All OP DNA Rate
Actual
National UQ
0%1%2%3%4%5%6%7%8%9%
Apr‐16
May‐16
Jun‐16
Jul‐16
Aug‐16
Sep‐16
Oct‐16
Nov‐16
Dec‐16
Jan‐17
Feb‐17
Mar‐17
Apr‐17
May‐17
Jun‐17
Jul‐17
Aug‐17
Sep‐17
Oct‐17
Nov‐17
Dec‐17
Jan‐18
Feb‐18
Mar‐18
Apr‐18
May‐18
(75) Patients on the FUWL 1 Month Past Their To Be Seen Date
Actual
9.8
10.0
10.2
10.4
10.6
10.8
11.0
11.2
Apr‐16
May‐16
Jun‐16
Jul‐16
Aug‐16
Sep‐16
Oct‐16
Nov‐16
Dec‐16
Jan‐17
Feb‐17
Mar‐17
Apr‐17
May‐17
Jun‐17
Jul‐17
Aug‐17
Sep‐17
Oct‐17
Nov‐17
Dec‐17
Jan‐18
Feb‐18
Mar‐18
Apr‐18
May‐18
(76) Average Points per Clinic
Actual
Standard
0%
1%
2%
3%
4%
5%
6%
7%
Apr‐16
May‐16
Jun‐16
Jul‐16
Aug‐16
Sep‐16
Oct‐16
Nov‐16
Dec‐16
Jan‐17
Feb‐17
Mar‐17
Apr‐17
May‐17
Jun‐17
Jul‐17
Aug‐17
Sep‐17
Oct‐17
Nov‐17
Dec‐17
Jan‐18
Feb‐18
Mar‐18
Apr‐18
May‐18
(73) Net Emergency Readmissions within 28 days
Actual
Standard

FINANCESummary Dashboard
40

FINANCEIncome, Expenditure and SavingsAccountable Officer: Director of Finance
(77) I& E ‐ For the year to date the Trust has a £4m deficit which is £0.13m worse than plan. The forecast for the full year remains the planned £11.9m deficit although there are risks to this related to the savings shortfall and high agency spend.
Patient related income was largely on plan in M2 which is an improvement against M1. The Trust’s block contract with Kernow CCG secures income levels although it should be noted that there continues to be significant underperformance in relation to elective activity against plan. Surgical Services reported a cumulative adverse variance against plan of c£0.25m caused by the backfilling of vacant posts and the level of sickness.
Expenditure ‐ In month, pay totalled £20.6m against a budget of £20.2m. Pay is £0.3m over budget for the year to date. Non‐pay spend for the year to date is as planned.
(78) CIP ‐ Savings of £0.8m have been delivered against a plan of £1.2m. Half of the savings to date are non‐recurrent.
41
(14.0)
(12.0)
(10.0)
(8.0)
(6.0)
(4.0)
(2.0)
0.0
2.0
£ms
(77) I&E Surplus / (deficit) ‐ actual v plan
Actual Plan
0.0
2.0
4.0
6.0
8.0
10.0
12.0
14.0
£ms
(78) CIP – actual v plan
Actual Plan

FINANCECash and CapitalAccountable Officer: Director of Finance
(79) Agency spend –Monthly spend totalled £1.5m in May compared to £1.1m in April.
The 20 most expensive agency staff cost the Trust £259k in month 2 compared to £300k in month 1.
In month 2, there were 72 agency workers that have worked for the Trust for more than two months, down from 108 in March.
(80) Cash – The cash balance at the end of the month was £10m. This will reduce during the year and the Trust will need cash support based on its £11.9m planned deficit.
(81) Capital – Capital spend is below plan although is expected to return to plan by the year end. The Trust expects to operate within its Capital Resource Limit.
42
0.0
2.0
4.0
6.0
8.0
10.0
12.0
14.0
16.0
£ms
(79) Capital spend ‐ actual v plan
Actual Plan
0.0
2.0
4.0
6.0
8.0
10.0
12.0
14.0
£ms
(80) Cash ‐ actual v plan
Actual Minimum cash balance
0.0
0.2
0.4
0.6
0.8
1.0
1.2
1.4
1.6
£ms
(81) Agency and Locum spend ‐ actual v plan
Actual Plan

OUR PEOPLESummary Dashboard
43

OUR PEOPLEKey Workforce IndicatorsAccountable Officer: Director of HR & OD
(81) Sickness absence in May decreased by 0.11% to 3.35%. The current rate is within standard. Long‐term absence at 2.36% is much higher than short‐term at 1.58% p.a. predominantly due to stress and MSK problems.
(82) Turnover decreased by 0.2% to 9.2% for the year to 31 May. Circa 3% of turnover is due to annual training rotations for junior doctors.
(83) Pay spend increased in May by £0.517m compared to April. As shown in the ‘Total Staffing’ chart, net temporary use increased by 46 FTE and substantive staff increased by 12 FTE in May.
(84) Active vacancies represent those in the recruitment process; between the approval to recruit to the starter joining the Trust. During May the number of FTE vacancies being advertised increased by 65.94 FTE to 572.47 FTE.
44
2.5%
3.0%
3.5%
4.0%
4.5%
5.0%
Apr‐16
May‐16
Jun‐16
Jul‐16
Aug‐16
Sep‐16
Oct‐16
Nov‐16
Dec‐16
Jan‐17
Feb‐17
Mar‐17
Apr‐17
May‐17
Jun‐17
Jul‐17
Aug‐17
Sep‐17
Oct‐17
Nov‐17
Dec‐17
Jan‐18
Feb‐18
Mar‐18
Apr‐18
May‐18
(81) Sickness rate (Month)
Sickness %
Standard
8%
9%
10%
11%
12%
Apr‐16
May‐16
Jun‐16
Jul‐16
Aug‐16
Sep‐16
Oct‐16
Nov‐16
Dec‐16
Jan‐17
Feb‐17
Mar‐17
Apr‐17
May‐17
Jun‐17
Jul‐17
Aug‐17
Sep‐17
Oct‐17
Nov‐17
Dec‐17
Jan‐18
Feb‐18
Mar‐18
Apr‐18
May‐18
(82) Turnover rate
Turnover %
16
17
18
19
20
21
Apr‐16
May‐16
Jun‐16
Jul‐16
Aug‐16
Sep‐16
Oct‐16
Nov‐16
Dec‐16
Jan‐17
Feb‐17
Mar‐17
Apr‐17
May‐17
Jun‐17
Jul‐17
Aug‐17
Sep‐17
Oct‐17
Nov‐17
Dec‐17
Jan‐18
Feb‐18
Mar‐18
Apr‐18
May‐18
(83) Pay Expenditure (£m's)
Pay Spend
0%
2%
4%
6%
8%
10%
12%
14%Aug‐16
Sep‐16
Oct‐16
Nov‐16
Dec‐16
Jan‐17
Feb‐17
Mar‐17
Apr‐17
May‐17
Jun‐17
Jul‐17
Aug‐17
Sep‐17
Oct‐17
Nov‐17
Dec‐17
Jan‐18
Feb‐18
Mar‐18
Apr‐18
May‐18
(84) Active Vacancies %
Total ActiveVacancies
ActiveRegisteredNurses
ActiveMedical Staff

OUR PEOPLEKey Workforce IndicatorsAccountable Officer: Director of HR & OD
(85) The vacancy gap reflects funded establishment less substantive staff in post. Both the total and nursing vacancies reduced as recruits started work following the April peak of new investment funding. Medical vacancies continued to reduce during May following successful recruitment.
(86) Appraisal compliance in May improved notably by 4.1% to 77.3%. This is the second month of improvement following a sustained period of declining compliance. However, compliance is 4.6% below the same point last year and 17.7% below the 95% of eligible staff standard.
(87) Mandatory training compliance in May decreased by 0.6% to 84.0%. Compliance is currently 11.0% below standard and 7% lower than at this time last year.
(88) Total staffing deployed in May increased by 58 FTE of which substantive staff increased by 12 FTE and temporary staff increased by 46 FTE. Across temporary staffing, bank usage reduced by 10 FTE and agency increased by 56 FTE.
45
4%
6%
8%
10%
12%
14%
16%
18%
Aug‐16
Sep‐16
Oct‐16
Nov‐16
Dec‐16
Jan‐17
Feb‐17
Mar‐17
Apr‐17
May‐17
Jun‐17
Jul‐17
Aug‐17
Sep‐17
Oct‐17
Nov‐17
Dec‐17
Jan‐18
Feb‐18
Mar‐18
Apr‐18
May‐18
(85) Vacancy Gap %
TotalVacancies
TotalRegisteredNurses
Total MedicalStaff
50%55%60%65%70%75%80%85%90%95%100%
Apr‐16
May‐16
Jun‐16
Jul‐16
Aug‐16
Sep‐16
Oct‐16
Nov‐16
Dec‐16
Jan‐17
Feb‐17
Mar‐17
Apr‐17
May‐17
Jun‐17
Jul‐17
Aug‐17
Sep‐17
Oct‐17
Nov‐17
Dec‐17
Jan‐18
Feb‐18
Mar‐18
Apr‐18
May‐18
(86) Appraisal Rate
Appraisal %
Standard
75%
80%
85%
90%
95%
100%
Apr‐16
May‐16
Jun‐16
Jul‐16
Aug‐16
Sep‐16
Oct‐16
Nov‐16
Dec‐16
Jan‐17
Feb‐17
Mar‐17
Apr‐17
May‐17
Jun‐17
Jul‐17
Aug‐17
Sep‐17
Oct‐17
Nov‐17
Dec‐17
Jan‐18
Feb‐18
Mar‐18
Apr‐18
May‐18
(87) Mandatory Training Rate
TrainingCompliance
Standard
4000
4200
4400
4600
4800
5000
5200
5400Apr‐16
May‐16
Jun‐16
Jul‐16
Aug‐16
Sep‐16
Oct‐16
Nov‐16
Dec‐16
Jan‐17
Feb‐17
Mar‐17
Apr‐17
May‐17
Jun‐17
Jul‐17
Aug‐17
Sep‐17
Oct‐17
Nov‐17
Dec‐17
Jan‐18
Feb‐18
Mar‐18
Apr‐18
May‐18
(88) Total Staffing FTE
Substantive Bank Agency

OUR PEOPLEKey Workforce IndicatorsAccountable Officer: Director of HR & OD
(89) Challenges remain to find cap compliant agencies. However, agency framework compliance during May remained very high with medical and AHP staff at 100% compliant. 99% of agency nursing shifts were framework compliant and 13.5% were cap compliant during May.
46
0%
10%
20%
30%
40%
50%
60%
70%
80%
90%
100%
Agency Framework Cap Compliance
(89) Agency Framework / Cap Compliance
All Nursing
Medical
AHP

OUR PEOPLEH&S ReportingAccountable Officer: Chief Operating Officer
(92) The number of sharps incidents is showing an overall downward trend, but there has been an increase in the last 4 months. The number of incidents relating to dirty sharps has reduced to 5, but there has been an increase in the number of splash incidents (11).
(93) RIDDOR reports decreased again to 2 this month, both patient related falls.
(94) There were no reported cases of occupational dermatitis. This still remains low. There is a potential change to the glove supplier possible, that may impact on the number of cases seen.
47
0
5
10
15
20
25
30
Apr‐16
May‐16
Jun‐16
Jul‐16
Aug‐16
Sep‐16
Oct‐16
Nov‐16
Dec‐16
Jan‐17
Feb‐17
Mar‐17
Apr‐17
May‐17
Jun‐17
Jul‐17
Aug‐17
Sep‐17
Oct‐17
Nov‐17
Dec‐17
Jan‐18
Feb‐18
Mar‐18
Apr‐18
May‐18
(92) Sharps ‐ Incidents reported
Actual
0
2
4
6
8
10
12
Apr‐16
May‐16
Jun‐16
Jul‐16
Aug‐16
Sep‐16
Oct‐16
Nov‐16
Dec‐16
Jan‐17
Feb‐17
Mar‐17
Apr‐17
May‐17
Jun‐17
Jul‐17
Aug‐17
Sep‐17
Oct‐17
Nov‐17
Dec‐17
Jan‐18
Feb‐18
Mar‐18
Apr‐18
May‐18
(93) Number of RIDDOR reports
Actual
0
1
2
3
4
5
6
Apr‐16
May‐16
Jun‐16
Jul‐16
Aug‐16
Sep‐16
Oct‐16
Nov‐16
Dec‐16
Jan‐17
Feb‐17
Mar‐17
Apr‐17
May‐17
Jun‐17
Jul‐17
Aug‐17
Sep‐17
Oct‐17
Nov‐17
Dec‐17
Jan‐18
Feb‐18
Mar‐18
Apr‐18
May‐18
(94) Confirmed cases of occupational dermatitis
Actual

Partnership – Offer, integrated care, as close to home as possibleSummary DashboardAccountable Officer: Director of Strategy and Business Development
48
3.1i Develop Shaping Our Future (SOF) with our partner organisations. • Progress continues towards an ICP through new system leadership posts, Ethna McCarthy will be Director of
Planned Care wef 1st July 2018, working alongside the existing Director of Urgent Care , Director for Model of Care Development, Finance Director and others in the core team.
• A new work‐stream within the Pathways Programme has been formally launched with a multi‐professional, multi‐organisational workshop on Falls held in June. Data shows the Cornwall STP to benchmark poorly against peers on the number of falls. Priorities for improvement will be confirmed in July, focussing on falls prevention and reducing falls in community settings (out of hospital).
• Model of Care development is continuing with small tests of concept across localities including a frailty pilot at WCH in conjunction with Penwith locality, intended to impact ahead of winter.
• Implementation of the MSK pathway is now focussing on what can be achieved without IT developments to offset further delay.

Partnership3.3 Offer prompt appropriate dischargeAccountable Officer: Chief Operating Officer3.4 Research, Development and InnovationAccountable Officer: Director of Strategy and Business Development
(95,96) Reduce Growth in ED Attendances
Attendances at both ED and MIUs grew by 5.5% in May 18 compared to May 17 and ahead of trajectory. Most of the additional attendances were in MIUs.
(97) 1.5% growth in ED is predicted for 2018/19, May showed a 2.2% increase.
(98) RD&I RD&I trials are just below trajectory and should be recoverable in year.
DTOCs – please refer to chart 69 on slide 38.
49
0
2000
4000
6000
8000
10000
12000
14000
Apr
May Jun
Jul
Aug
Sep
Oct
Nov
Dec Jan
Feb
Mar
(95) ED & MIU Attendances
ED 2018‐19
MIU 2018‐19
MIU 2017‐18
ED 2017‐18
‐4.00%
‐2.00%
0.00%
2.00%
4.00%
6.00%
8.00%
10.00%
12.00%
14.00%
Apr‐18
May‐18
Jun‐18
Jul‐18
Aug‐18
Sep‐18
Oct‐18
Nov‐18
Dec‐18
Jan‐19
Feb‐19
Mar‐19
(96) YoY ED Attendance % change by month
Percentagechange
Standard
‐3.00%
‐2.50%
‐2.00%
‐1.50%
‐1.00%
‐0.50%
0.00%
0.50%
1.00%
1.50%
2.00%
Apr‐18
May‐18
Jun‐18
Jul‐18
Aug‐18
Sep‐18
Oct‐18
Nov‐18
Dec‐18
Jan‐19
Feb‐19
Mar‐19
(97) YTD ED Attendance % change
Percentagechange
Standard
0
500
1000
1500
2000
2500
3000Apr‐18
May‐18
Jun‐18
Jul‐18
Aug‐18
Sep‐18
Oct‐18
Nov‐18
Dec‐18
Jan‐19
Feb‐19
Mar‐19
(98) R,D & I ‐ Patients recruited into clinical trials
Actual YTD
Standard