Sumitomo Metal Industries, Ltd. Financial Results for ... · PDF fileSumitomo Metal...
22
- 1 - Sumitomo Metal Industries, Ltd. Financial Results for FY2009 (year ended March 31, 2010) The following information was originally prepared and published by the Company in Japanese as it contains timely disclosure materials to be submitted to the Tokyo Stock Exchange. This English summary translation is being provided for your convenience only. To the extent there is any discrepancy between this English translation and the original Japanese version, please refer to the Japanese version. The following financial information was prepared in accordance with generally accepted accounting principles in Japan. Company name : Sumitomo Metal Industries, Ltd. Listed on : Tokyo, Osaka, Nagoya, Sapporo and Fukuoka Stock Exchange Code number : 5405 URL : http://www.sumitomometals.co.jp/ Contact : Toshifumi Matsui, Manager, Public Relations Group Phone +81-3-4416-6115 (Figures less than a million yen are truncated.) 1. Highlights of Consolidated Financial Results for FY2009 (year ended March 31, 2010) (1) Consolidated Statements of Income (%: change from previous year) Net Sales Operating income/(losss) Ordinary income/(loss) Net income/(loss) Million yen % Million yen % Million yen % Million yen % FY 2009 1,285,845 -30.3 (928) - (36,634) - (49,772) - FY 2008 1,844,422 5.7 226,052 -17.6 225,736 -24.3 97,327 -46.1 Net income /(loss) per share Diluted net income per share ROE (Net income /Shareholders’ equity) ROA (Ordinary income /Total assets) ROS Operating income/Net Sales Yen Yen % % % FY 2009 (10.74) - -5.9 -1.5 -0.1 FY 2008 20.98 - 11.1 9.3 12.3 (Note) Equity in earnings/(loss) of non-consolidated affiliates (Million yen): FY2009 (22,524); FY2008 22,179 (2)Consolidated Balance Sheets Total assets Net assets Equity ratio Net assets per share Million yen Million yen % Yen FY 2009 2,403,670 879,209 34.5 178.87 FY 2008 2,452,535 904,371 35.0 184.92 (Note) Shareholders’ Equity (Million yen): FY2009 829,219; FY2008 857,697 (3)Consolidated Statements of Cash Flows Net Cash provided by operating activities Net Cash used in investing activities Net Cash provided by financing activities Cash and cash equivalents at end of year Million yen Million yen Million yen Million yen FY 2009 67,002 (172,933) 87,843 26,233 FY 2008 190,582 (214,977) 52,623 42,979
-
Upload
vuongthuan -
Category
Documents
-
view
222 -
download
4
Transcript of Sumitomo Metal Industries, Ltd. Financial Results for ... · PDF fileSumitomo Metal...

- 1 -
Sumitomo Metal Industries, Ltd.
Financial Results for FY2009 (year ended March 31, 2010) The following information was originally prepared and published by the Company in Japanese as it contains timely disclosure materials to be submitted to the Tokyo Stock Exchange. This English summary translation is being provided for your convenience only. To the extent there is any discrepancy between this English translation and the original Japanese version, please refer to the Japanese version. The following financial information was prepared in accordance with generally accepted accounting principles in Japan. Company name : Sumitomo Metal Industries, Ltd. Listed on : Tokyo, Osaka, Nagoya, Sapporo and Fukuoka Stock Exchange Code number : 5405 URL : http://www.sumitomometals.co.jp/ Contact : Toshifumi Matsui, Manager, Public Relations Group Phone +81-3-4416-6115 (Figures less than a million yen are truncated.) 1. Highlights of Consolidated Financial Results for FY2009 (year ended March 31, 2010) (1) Consolidated Statements of Income (%: change from previous year)
Net Sales Operating income/(losss)
Ordinary income/(loss) Net income/(loss)
Million yen % Million yen % Million yen % Million yen %
FY 2009 1,285,845 -30.3 (928) - (36,634) - (49,772) -FY 2008 1,844,422 5.7 226,052 -17.6 225,736 -24.3 97,327 -46.1
Net income /(loss) per share
Diluted net income per
share
ROE(Net income
/Shareholders’ equity)
ROA (Ordinary income
/Total assets)
ROS Operating
income/Net Sales
Yen Yen % % %
FY 2009 (10.74) - -5.9 -1.5 -0.1FY 2008 20.98 - 11.1 9.3 12.3
(Note) Equity in earnings/(loss) of non-consolidated affiliates (Million yen): FY2009 (22,524); FY2008 22,179 (2)Consolidated Balance Sheets Total assets Net assets Equity ratio Net assets per share Million yen Million yen % YenFY 2009 2,403,670 879,209 34.5 178.87FY 2008 2,452,535 904,371 35.0 184.92
(Note) Shareholders’ Equity (Million yen): FY2009 829,219; FY2008 857,697 (3)Consolidated Statements of Cash Flows Net Cash provided by
operating activities Net Cash used in
investing activities Net Cash provided by
financing activities
Cash and cash equivalents at end
of year Million yen Million yen Million yen Million yenFY 2009 67,002 (172,933) 87,843 26,233FY 2008 190,582 (214,977) 52,623 42,979

- 2 -
2. Dividends Dividend per share Dividend
amount (full-year)
Dividend payout ratio(consolidated)
Dividend per net assets
(consolidated) End of
1st quarterEnd of
2nd quarter End of
3rd quarterFiscal
year-end Total
Yen Yen Yen Yen Yen Million yen % %FY 2008 - 5.00 - 5.00 10.00 46,382 47.7 5.3FY 2009 - 2.50 - 2.50 5.00 23,179 - 2.7FY2010(target) - 2.50 - 2.50 5.00 46.3 3. Projected Consolidated Financial Performance for FY2010 (year ending March 31, 2011)
(%: change from previous year) Net Sales Operating
income Ordinary income Net income Net
income Million yen % Million yen % Million yen % Million yen % Yen1st Half ending Sept. 30, 2010
- - - - - - - - -
Yearly total - - 90,000 - 80,000 - 50,000 - 10.79
With regard to forecasts of yearly net sales and business performance for the first half for FY2010, we are unable to make an appropriate forecasting. Please refer to “(1) Analysis of business performance” in “1. Business performance” on page 4 to 7 of this document for the reason. 4. Other (1) Changes in material subsidiaries during the current period (Changes in specific subsidiaries affecting the scope of consolidation): None (2) Changes in the principle/procedure of accounting method and presentation, etc. related to the preparation of consolidated financial statements (Items to be noted as changes related to the matter which is material to be a basis of preparing consolidated financial statements) (i) Changes following the revision of accounting standards, etc.: Yes (ii) Changes other than (i): None
(3) Number of issued shares (common stock)
a) Number of shares of common stock issued and outstanding (including treasury shares) Last day of FY 2009: 4,805,974,238 shares Last day of FY 2008: 4,805,974,238 shares
b) Number of treasury shares Last day of FY 2009: 170,152,892 shares Last day of FY 2008: 167,882,514 shares
(Reference) Financial Performances on Non-Consolidated Basis (Note) Information with regsrd to “Financial Performances on Non-Consolidated Basis” is not
translated in English. Please refer to our original Japanese document.

The forecasts or targets included in this document reflect the company’s current beliefs and are based upon information currently available to it. Forward-looking statements appear in a number of places in this document and include statements regarding our current intent, belief, targets, forecasts or expectations or the current intent, belief, targets, forecasts or expectations of our management. In many, but not all cases, we used words such as “aim,” “anticipate,” “believe,” “estimate,” “expect,” “hope,” “intend,” “may,” “plan,” “predict,” “probability,” “risk,” “should,” “will,” and similar expressions, as they relate to us or our management, to identify forward-looking statements. Forward-looking statements are not guarantees of future performance. These statements reflect our current views with respect to future events and are subject to risks, uncertainties and assumptions. Should one or more of these risks or uncertainties materialize or should underlying assumptions prove incorrect, actual results may vary materially from those which are anticipated, aimed at, believed, estimated, expected, intended or planned. We identify in our yuka shoken hokokusho and financial summaries, including “(1) Analysis of business performance” in “1. Business performance” on page 4 to 7 of this document, important factors that could cause these differences. Sumitomo Metals Industries, Ltd. is under no obligation, and disclaims any obligation, to update its forward-looking statements whether as a result of new information, future events or otherwise, or to advise of any changes in the assumptions and factors on which they are based.
- 3 -

- 4 -
1. Business performance (1) Analysis of business performance
(a) Business performance during the current period
【Current period business environment】 Sumitomo Metals Group’s business environment was generally difficult in FY2009. Demand for steel, which were weak during the first half of the period under review, showed a recovery during the second half of the period but remained at a low level as the period total. Demand for steel products in the energy sector where the Sumitomo Metals Group is focusing its efforts remained particularly low.
【Current period business results】 Business results in the period under review deteriorated from the previous period as a result of several factors. In addition to the decline in sales volume and sales price due to the deteriorating economic environment, our financial performances were suffered by temporary negative factors such as the use of raw materials purchased through contracts in the previous fiscal year and the valuation loss of inventories caused by decline in raw material prices. As a result, our Group’s business performance on a consolidated basis in the current period was net sales of 1,285.8 billion yen, an operating loss of 0.9 billion yen, an ordinary loss of 36.6 billion yen, and a net loss of 49.7 billion yen.
Business Performance on a Consolidated Basis (Billion yen)
FY2008 FY2009 Increase/(Decrease)Amount Percentage
Net sales 1,844.4 1,285.8 (558.5) -30.3%Operating income/(loss) 226.0 (0.9) (226.9) - Ordinary income/(loss) 225.7 (36.6) (262.3) - Net income/(loss) 97.3 (49.7) (147.0) -
(Yen per US Dollar)Foreign Exchange Rate 101 93 - -
【Performance by segment】 (Billion yen)
Net sales Increase/
(Decrease)*1 Operating
Income/(loss) *1 Increase/
(Decrease) Steel Segment*2 1,205.8 (30.7%) (7.6) -
Pipe & Tube 472.9 (34.0%) Steel Sheet & Plate 498.5 (28.8%) Railway & Automotive 86.6 (17.8%) Kokura 101.6 (31.3%) Naoetsu 23.4 (43.2%) Other Steel 22.6 (21.5%) Other*3 79.9 (22.8%) 6.7 -Corporate or eliminations - - (0.0) -
Total 1,285.8 (30.3%) (0.9) -*1 Percentage compared with the previous period. *2 Pipe & Tube: Pipe & Tube Company Steel Sheet & Plate: Steel Sheet, Plate & Structural Steel Company Railway & Automotive: Railway, Automotive & Machinery Parts Company Kokura: Sumitomo Metals (Kokura), Ltd. Naoetu: Sumitomo Metals (Naoetsu), Ltd. *3 From FY 2009 (ended March 31, 2010), Engineering and Electronics have been included in “Other.”

- 5 -
【Business measures in the current period】 Although the Sumitomo Metals Group had no choice but to scale back production in the face of low demand in the first half of the period under review, we prepared for the next cycle of demand growth by taking advantage of reduced work load to give technical training to employees, conduct extensive facility maintenance and carry out on-site manufacturing trials for products development. Throughout the period we made every effort to reduce costs and control expenses. We are steadily implementing investment plans and business measures needed to “accelerate our distinctiveness” and “strengthen our strengths” to achieve our medium- and long-term policies of maximizing our corporate value through sustainable growth.
In our upstream crude steel manufacturing processes, the new No. 1 blast furnace at the Wakayama Steel Works began operation in July 2009.
With regard to our pipe & tube business, we are making a progress with a joint-venture project with Vallourec Group to construct an integrated steel plant to produce seamless pipe in Brazil. The plant is expected to be operational in 2010. We have made mutual equity investments with Vallourec to deepen our cooperative relationship. The Sumitomo Metals Group and the Nippon Steel Corporation Group merged their arc-welded stainless steel pipe and tube businesses in July 2009 to maximize the strengths of both Groups and formed a new company: Sumikin & Nippon Steel Stainless Steel Pipe Co., Ltd. In February 2010, the Pipe & Tube Company decided to make investments to increase production capacity of steam generator tube at the Steel Tube Works at Amagasaki that are in greater demand for use in nuclear power plants. The new facilities are scheduled to begin operation in April 2013. The Kashima Steel Works is proceeding with the investment to increase production capacity of ultra-high-strength, large-diameter welded steel pipe. The new facilities are scheduled to begin operation in March 2011.
With regard to our steel sheet business, we collaborate with our business partners to expand its business in emerging foreign markets that are expected to grow in the medium- and long-term. The project with the China Steel Corporation (CSC) of Taiwan and other partners to establish a joint venture in Vietnam to manufacture and sell cold-rolled coil, hot-dipped galvanized steel sheet, electromagnetic steel sheet and others received official approval from the Vietnamese government in May 2009. The plant is expected to commence operations in 2012.
In India, we reached a basic agreement with a local company, Bhushan Steel Limited in December 2009, for Bhushan to supply some of the sheet steel manufactured at its Orissa plant as OEM product to be sold under the SMI brand. The Company is providing technical support for the construction and operation of the Orissa plant.
With regard to the railway, automotive & machinery parts business, we started a joint venture to manufacture and sell forged crankshafts with a local company, Amtek Limited and other partners in April 2010 with an expectation that automobile demand in India will increase.
Sumitomo Metals (Kokura), Ltd., our manufacturer of specialty steel bars and wire rods, installed the world’s most advanced bar finishing mill at its factory. As part of its project to renew and innovate its steel-making process, the company’s new refining furnace and continuous casting mill began

- 6 -
operation. The project will be completed when the construction of new phosphorous removal furnace, scheduled to begin operation in October 2010, is completed. These new facilities will ensure both high quality and high production efficiency in the specialty steel bar and wire rod sectors, and will enable the company to better meet the more sophisticated needs of its customers. Businesses in other sectors are reorganizing their businesses in line with Sumitomo Metals Group’s intention to focus its resources on its core competencies. We, together with Chuo Denki Kogyou Co., Ltd. (an affiliated company for which the equity method is applied) are aiming to develop their business in the field of rechargeable batteries for automobiles and others, where demand for products is expected to increase greatly. Both companies have combined their operations in this sector in Chuo Denki Kogyou Co., Ltd. We have transferred 60% ownership of Sumikin Bridge Co., Ltd. to Yokogawa Bridge Holdings Corporation, and started the joint venture in October 2009. It is scheduled to merge our consolidated subsidiary Sumitomo Metal Micro Devices, Inc. with a new company that will be 80% owned by Hokuriku Electric Industry Co. and 20% owned by us.

- 7 -
Table 1 summarizes the main investments and overseas operations in the current period. (Billion yen)
Area Target Details Investment Amount Timeline
Iron & Steel- making Process
An annual capacity of 5 million tons at Wakayama Steel Works
1st step<Construction of a new No.1 blast furnace, etc. included in the project>
160.0
<118.0>
Began operation in July, 2009
2nd step (Construction of a new No.2 blast furnace, reinforcement of steel making facilities, etc.)
115.0 Scheduled to begin operation in second half of FY 2012
Pipe & Tube
Establish a manufacturing hub for seamless pipe in Brazil
Establishment of a joint venture with Vallourec Group for integrated seamless pipe manufacturing
*200.0
Scheduled to be operational in 2010
Deepen cooperative relationship with Vallourec
Purchasing Vallourec’s stock for the mutual equity investments
11.3 Completed in the first half of FY2009
Expand production capacity of ultra-high-strength line pipes
Equipment improvement at the plate mill and large- diameter (UOE) pipe mill
10.0 Scheduled to begin operation in Mar., 2011
Expand production capacity of steam generator tubes for nuclear power plants
Capacity expansion of cold working, finishing and inspection facilities.
14.0 Scheduled to begin operation in Apr., 2013
Steel Sheet
Strengthen relationship with a partner in the steel sheet sector in India
Participation in an integrated steel works project of Bhushan Steel Limited in India
(Technical Assistance)
-------------
(OEM Supply)
Reached basic agreement in Dec., 2009
Establish manufacturing and sales hub of steel sheet in Vietnam
Establishment of a joint venture for production and sales of cold-rolled steel sheet, electromagnetic steel sheet and hot-dip galvanized steel sheet with China Steel
*115.0
Scheduled to begin operation in 2012
Railway, Automotive & Machinery Parts
Establish manufacturing and sales hub of forged crankshaft in India
Establishment of a joint venturewith Amtek Limited.
1.0 Began operation in April, 2010
Specialty Steel
Enhance competitiveness of steel bars at Sumitomo Metals (Kokura), Ltd.
Renewal of finishing roll equipment for steel bars
2.0 Began operation in Aug., 2009
Achieve steel-making process innovation at Sumitomo Metals (Kokura), Ltd.
Introduction of new refining furnace and continuous casting mill.
27.0 Began operation in Dec., 2009
Introduction of a new phosphorous removal furnace
Scheduled to begin operation in Oct., 2010
*Total investment amount with joint venture partners.

- 8 -
(b) Outlook for the following period (consolidated) It is very difficult to predict the business environment in the next fiscal year. Although we predict that demand for steel will recover, future trends in raw material prices and the influence they will have on the sales prices of steel products are difficult to foresee. The market prices of raw materials such as iron ore and coal are rising, spurred on by demand; meanwhile, structural changes in the raw materials market is forcing us to change the pricing system that procurements of main raw materials will have to be arranged via quarterly contracts rather than annual contracts. As a result, we expect, at this point in time, that our raw material costs will significantly increase in FY2010. Given these circumstances, we will strive to further reduce costs to improve our financial condition, and make efforts to quickly reflect changes in raw material prices in the sales prices of our products. Our financial target in consolidated basis for FY2010 is 90 billion yen in operating income, 80 billion yen in ordinary income and 50 billion yen in net income. With regard to forecasts of yearly net sales and business performance for the first half for FY2010, we are unable to make an appropriate forecasting. We will disclose such forecasts when we are able to make the forecasts. We will notify with the situation of forecasting on the occasion of financial report for 1st quarter of FY2010.
(2) Analysis of financial situation (i) Assets, liabilities and net assets (consolidated) Total assets, as of the end of the current period, were 2,403.6 billion yen with a decrease of 48.8 billion yen compared with the end of the previous period, mainly due to decrease in valuation loss of inventories. Liabilities totaled 1,524.4 billion yen with a decrease of 23.7 billion yen, due to reasons such as decrease in notes and accounts payable, while debt increased by 148.3 billion yen to 1,138.3 billion yen. Net assets at the end of the current period were 879.2 billion yen, a decrease of 25.1 billion yen from the end of the previous period.
(ii) Cash Flows (consolidated) Net cash provided by operating activities was 67.0 billion yen in the current period, which was 123.5 billion less than the previous period. Reason for this decrease is because the net income in the current period was negative due to temporary negative factors such as the use of raw materials purchased through contracts in the previous fiscal year and the valuation loss of inventories caused by decline in raw material prices, in addition to a decrease in sales volume as well as prices. Net cash used in investing activities was 172.9 billion yen in the current period, which was 42.0 billion yen less than the previous period. The reason for this decrease is because we decreased investments in the current period from the previous period. Net cash provided by financial activities in the current period totaled 87.8 billion yen, which was a 35.2 billion yen increase from the previous period, mainly due to an increase in debt. As a result, the amount of cash and cash equivalents at the end of the current period decreased by 16.7 billion yen to 26.2 billion yen.

- 9 -
FY2006 FY2007 FY2008 FY2009
Equity ratio 38.3% 37.3% 35.0% 34.5%Equity ratio on a market value basis 127.2% 75.1%
38.6% 56.6%
Cash flows / debt ratio 4.4 4.0 5.4 21.7Interest coverage ratio 14.9 16.7 13.3 4.3
Equity ratio: Shareholders’ equity / Total assets Equity ratio on a market value basis: Total market value of shares / Total assets Cash flows / debt ratio: Debt / (Operating cash flows - Interest payments) Interest coverage ratio: Operating cash flows / Interest payments * All figures are calculated on a consolidated basis. * “Debt” means net debt, i.e., the total of outstanding borrowing, corporate bonds and commercial
paper minus cash and deposits. * “Operating cash flows” is “net cash provided by operating activities” of the consolidated statements
of cash flows. “Interest payments” is “interest paid” in the consolidated statements of cash flows. (3) Basic policy regarding distribution of profits; dividend payouts in the current and following period The Sumitomo Metals Group intends to maximize its corporate value through sustainable growth with the optimum balance between quality and scale. Cash generated by our business will first be used in investments aimed to increase corporate value. Our investment strategy calls for investments that are designed to help accelerate distinctiveness and bring cash returns in excess of the cost of capital to contribute to increase our corporate value. We will pass on appropriate returns to our shareholders and all stakeholders. Our basic dividend policy is to pay a stable dividend. Our medium- and long-term targeted D/E ratio is below 1.0. In the current period, we faced a decrease in sales volume as well as prices due to deterioration in economy; however, we were profitable excluding temporary negative factors such as the use of raw materials purchased through contracts in the previous fiscal yearand the valuation loss of inventories caused by decline in raw material prices. Under these circumstances, we expect to make a year-end dividend of 2.5 yen per share, bringing the total cash dividend for the full fiscal year, including the interim dividend payment already made earlier in the current fiscal year, to 5 yen per share. While the forecast of our business environment is still not clear, under our policy to continue stable dividend payment, we will make effort to maintain dividend of 5 yen per share for the following fiscal year.
Note: D/E ratio = Debt / Shareholders’ equity

2. Current status of Sumitomo Metals Group
Domestic Overseas
Purchasing raw materials, etc. ・ Sumitomo Metals (Kokura), Ltd ・ Western Tube & Conduit Corp.
Selling products ・ East Asia United Steel Co. ・ Seymour Tubing, Inc.
・ Sumikin Iron & Steel Corporation ・ International Crankshaft Inc.
・ Sumitomo Metals (Naoetsu), Ltd ・ Huizhou Sumikin Forging Co., Ltd.
・ Sumitomo Pipe & Tube Co., Ltd. ※ VAM USA LLC
・ Sumikin Steel & Shapes, Inc. ※ Vallourec & Sumitomo Tubos do
・ Sumitomo Metal Logistics ・ Sumitomo Metal Pipeline & Piping, Ltd. Brasil Ltda.
Service Co., Ltd.Transporting raw materials, etc. ・ Sumikin Stainless Steel Tube Co., Ltd
※ Daiichi Chuo Kisen Kaisha Transporting products ・ Sumikin Plant, Ltd.
※ Kyoei Steel Ltd.
※ Nippon Steel & Sumikin Coated
Sheet Corporation
※ OSAKA Titanium technologies Co., Ltd.
※ Nippon Steel & Sumikin Metals
・ Sumimetal Mining Co., Ltd. Products Co., Ltd
Supply raw materials, etc. ※ Nippon Steel & Sumikin Stainless
Steel Corporation
※ Nippon Steel & Sumikin Welding Co., Ltd.
・ Sumitomo Metal (SMI) Electronics
Devices, Inc
・ Sumikin Kosan Co., Ltd
※ SUMCO CORPORATION
※ Sumitomo Precision Products Co., Ltd.
(Remark) Company marked ・ : Consolidated subsidiariesCompany marked ※: Related affiliate to which the equity method is applicable
Procurement, Sales, Transportation, Supply Business in general (production, sales etc)
Other
Sumitom
o Metal Industries, Ltd.
Customers
Major Affiliated Companies
※ Sumikin Bussan Corpration
Steel Business
Company
※ Kashima Kyodo Electric Power
※ Chuo Denki Kogyo Co., Ltd.
- 10 -

- 11 -
3. Management policy (1) The Company’s basic management policy
The Sumitomo Metals Group’s basic policy is to maximize corporate value through steady growth with an emphasis on both quality and scale. Based on this policy, the Sumitomo Metals Group, adhering to the Sumitomo business philosophy, history and business experience refined over 400 years and epitomized by the words “Placing prime importance on integrity and sound management”, as well as inheriting over a century of Sumitomo Metals’ manufacturing history, is making efforts to appropriately manage and operate in an uncertain business environment. Based on this approach, the Sumitomo Metals Group will seek to become a company trusted by its shareholders and all stakeholders alike.
(2) Medium- and Long-term company business strategy Under our medium- and long-term policies of maximizing corporate value through sustainable growth, the Sumitomo Metals Group is carrying out strategies that “accelerate our distinctiveness” and “strengthen our strengths” to create an earnings structure resilient to downside risk. To promote these business strategies, we believe it is essential that we continue to enhance our intangible assets that do not appear on our financial statements. Examples of these intangible assets are our relationship of trust built through businesses with our customers, our own technology that we believe to be very different from our competitors’, and the pride and commitment of our employees to their work.
(3) Issues that our company must deal with The business environment for FY2010 remains unclear. The market prices of raw materials such as iron ore and coal are rising, spurred on by demand; meanwhile, structural changes in the raw materials market is forcing us to change the pricing system that procurements of main raw materials will have to be arranged via quarterly contracts rather than annual contracts. As a result, we expect, at this point in time, that our raw material costs will significantly increase in FY2010. Under these circumstances, while seeking the understanding of our customers, we make efforts to reflect changes in raw material prices in the sales prices of our products. At the same time, we will reduce costs and control expenditure to improve our financial condition and make necessary investments in line with our medium- and long-term policies to achieve growth with the optimum balance between quality and scale.
The globalization of the steel industry is an important issue against a background of growing demand for steel products, mainly in the emerging countries. We are proceeding with several overseas joint ventures to deal with this issue, namely, a plant to produce seamless pipe in Brazil, a steel sheet business in Vietnam, and a steel sheet and crankshaft production facilities in India. We are always studying for measures to demonstrate the strengths of the Sumitomo Metals Group in overseas markets. For example, we are studying a feasibility of our future involvement with Bhusan Steel of India as a joint-venture partner in a project to build an integrated blast furnace and steelworks in West Bengal.
Corporate responses to issues concerning the global environment are becoming increasingly important. Sumitomo Metals Group is working to both reduce CO2 emissions during product manufacture and to produce products that will in turn help in the reduction of emissions of this greenhouse gas. One example of reduction of CO2 emissions during product manufacture can be seen at our Brazilian blast furnace integrated seamless steel pipe plant, where the blast furnace will be charcoal-fired. The charcoal produced from eucalyptus trees grown on our own plantation will be used to reduce the iron ore to iron in the furnace, and the CO2 released in the process will be then reabsorbed by the growing eucalyptus trees so that the net CO2 emissions are effectively zero. Example of reduction of CO2 emissions through our products are our seamless stainless steel pipes that are used for highly efficient thermal power generation and for the development of clean-burning natural gas fields, and our high-quality sheet steel and other products that enable lighter, and

- 12 -
therefore more fuel efficient, automobiles. Going forward, the Sumitomo Metals Group will continue to enhance our corporate value and contribute to society through management practices that give careful consideration to the global environment.
4. Consolidated financial statements (1) Consolidated Balance Sheets
(Million yen)
Items At the end of
FY 2008 (As of March 31, 2009)
At the end of FY2009
(As of March 31, 2010)
(Assets) Current assets: Cash and deposits 41,056 19,710
Notes and accounts receivable-trade 135,804 151,507Merchandise and finished goods 208,713 147,581Work in process 37,278 24,940Raw materials and supplies 264,257 213,607Deferred tax assets 18,762 12,331Other 32,576 36,905Allowance for doubtful accounts (1,087) (153)
Total current assets 737,362 606,431Noncurrent assets: Property, plant and equipment: Buildings and structures 732,565 769,596 Accumulated depreciation (485,500) (502,135) Buildings, net 247,065 267,460 Machinery, equipment and vehicles: 2,142,288 2,261,553
Accumulated depreciation (1,762,482) (1,821,813)Machinery, equipment and vehicles, net 379,805 439,740
Land 341,477 340,324 Construction in progress 153,098 80,985 Other 76,963 80,409
Accumulated depreciation (65,203) (67,075) Other, net 11,759 13,334
Total property, plant and equipment 1,133,207 1,141,845 Intangible assets
Goodwill 381 1,609 Other 4,845 4,860 Total intangible assets 5,226 6,470Investment and other assets:
Investment securities 483,001 533,458 Deferred tax assets 42,519 15,917 Other 51,475 100,533 Allowance for doubtful accounts (258) (986) Total investments and other assets 576,738 648,923
Total noncurrent assets 1,715,172 1,797,239
Total assets
2,452,535 2,403,670

- 13 -
(1) Consolidated Balance Sheets (Continured) (Million yen)
Items At the end of
FY 2008 (As of March 31, 2009)
At the end of FY2009
(As of March 31, 2010)
(Liabilities) Current liabilities:
Notes and accounts payable-trade 313,706 204,969 Short-term loans payable 237,323 286,893 Commercial papers - 24,000 Current portion of bonds 24,000 10,000 Income taxes payable 36,841 - Deferred tax liabilities 275 428 Other 131,821 113,063 Total current liabilities 743,969 639,355Noncurrent liabilities: Bonds payable 160,652 185,658 Long-term loans payable 568,035 631,802
Lease obligations 26,516 -Deferred tax liabilities 4,505 4,364Deferred tax assets regarding revaluation 6,919 6,919Provision for retirement benefits 22,510 19,948Provision for special repairs 225 208
Other 14,829 36,203 Total noncurrent liabilities 804,194 885,105
Total liabilities 1,548,163 1,524,461(Net Assets)
Shareholders’ equity: Capital stock 262,072 262,072
Capital surplus 61,829 61,829Retained earnings 680,807 596,254Treasury stock (90,528) (91,106)
Total shareholders’ equity 914,180 829,050Valuation and translation adjustments:
Valuation difference on available-for sale securities (41,542) 2,324
Deferred gains or losses on hedges (690) (979)Revaluation reserve for land 11,833 11,834Foreign currency translation adjustment (26,083) (13,009)
Total valuation and translation adjustment (56,483) 169
Minority interests 46,674 49,989Total net assets 904,371 879,209
Total liabilities and net assets 2,452,535 2,403,670

- 14 -
(2) Consolidated Statements of Income
(Million yen)
Items FY 2008
(April 1, 2008 - March 31, 2009)
FY 2009 (April 1, 2009-
March 31, 2010) Net Sales 1,844,422 1,285,845Cost of sales 1,481,158 1,163,191Gross profit 363,264 122,654Selling, general and administrative expenses:
Shipment expenses 41,622 33,108Employees’ salaries and allowances 39,773 37,376Research and development expenses 20,342 20,821
Other 35,473 32,276 Total selling, general and administrative
expenses 137,211 123,583
Operating income/(loss) 226,052 (928)Non-operating income:
Interest income 1,355 764Dividends income 7,783 3,380Equity in earnings of affiliates 22,179 -Other 15,662 17,241
Total non-operating income 46,981 21,386Non-operating expenses:
Interest expenses 14,577 15,730Equity in losses of affiliates - 22,524Loss on sales and retirement of noncurrent assets 8,363 7,023
Foreign exchange losses 5,797 - Other 18,558 11,813 Total non-operating expenses 47,297 57,091Ordinary income/loss 225,736 (36,634)Extraordinary loss: Loss on change in equity - 1,592 Restrucuring loss - 1,532 Impairment loss 11,144 - Loss on valuation of investment securities 16,776 -
Environmental expenses 3,355 -Total extraordinary loss 31,276 3,124
Income/(loss) before income taxes and minority interests 194,459 (39,758)
Income taxes: Income taxes-current 82,038 5,050
Income taxes-deferred 12,838 4,205 Total income taxes 94,877 9,255Minority interests in income 2,254 757Net income/(loss) 97,327 (49,772)

- 15 -
(3) Statements of changes in net assets (Note) The table “Statements of changes in net assets” is not translated in English. Please refer to
our original Japanese document. (4) Consolidated Statement of Cash Flows
(Million yen) FY 2008
(April 1, 2008 - March 31, 2009)
FY 2009(April 1, 2009-
March 31, 2010) Operating activities: Income/(loss) before income taxes and minority interests 194,459 (39,758)
Depreciation and amortization 110,896 121,640Increase (decrease) in allowance for doubtful accounts 845 (189)Increase (decrease) in provision for retirement benefits (2,477) (2,466)
Increase (decrease) in provision for special repairs 1 (17)Interest income and dividend income (9,138) (4,145)Interest expenses 14,577 15,730Equity in (earnings) losses of affiliates (22,179) 22,524Loss (gain) on change in equity - 1,592Loss on business restructuring - 1,532Impairment loss 11,144 -Loss (gain) on valuation of investment securities 16,776 -Environmental expenses 3,355 -Decrease (increase) in notes and accounts receivable-trade 35,192 (25,781)
Decrease (increase) in inventories (77,950) 123,614Increase (decrease) in notes and accounts payable-trade (14,780) (107,993)
Other 26,120 (440) Subtotal 286,843 105,840 Income taxes paid (96,260) (38,838)Net cash provided by (used in) operating activities 190,582 67,002Investing activities:
Interest and dividends income received 23,836 12,190 Purchase of investment securities (48,864) (24,738) Payments for investments in capital (15,793) (39,406) Purchase of property, plant and equipment and
intangible assets (177,685) (137,331)
Payments of loans receivable (3,461) - Collection of loans receivable 8,801 - Other (1,809) 16,351Net cash provided by (used in) investment activities (214,977) (172,933)

- 16 -
(4) Consolidated Statement of Cash Flows (Continued) (Million yen)
FY 2008(April 1, 2008 -
March 31, 2009)
FY 2009(April 1, 2009 -
March 31, 2010) Financing activities: Interest expenses paid (14,352) (15,530) Net increase (decrease) in short-term loans payable (3,707) (9,308) Increase (decrease) in commercial papers (19,000) 24,000 Proceeds from long-term loans payable 159,660 196,725 Repayments of long-term loans payable (49,855) (74,677) Proceeds from issuance of bonds 49,988 35,000 Redemption of bonds (31,500) (24,000) Proceeds from sales and lease back arrangement 18,298 - Repayments of finance lease obligations (9,234) (10,232) Purchase of treasury stock (318) - Cash dividends paid (46,389) (34,782) Other (966) 649Net cash provided by (used in) financing activities 52,623 87,843Effect of exchange rate change on cash and cash equivalents (2,210) 1,448
Net increase (decrease) in cash and cash equivalents 26,018 (16,639)Cash and cash equivalents at beginning of period 16,669 42,979Increase (decrease) in cash and cash equivalents resulting from change of scope of consolidation 284 (147)
Increase (decrease) in cash and cash equivalents resulting from merger of subsidiaries 7 39
Cash and cash equivalents at end of period 42,979 26,233

- 17 -
(5) Notes on going concern assumption: Not applicable. (6)Material items in preparing consolidated financial statements 1. Items regarding the scope of consolidation (a) Number of consolidated subsidiaries: 72 companies
Names of major consolidated subsidiaries are as follows: Sumitomo Metals (Kokura), Ltd., East Asia United Steel Corporation, Sumikin Iron & Steel Corporation, Sumitomo Metals (Naoetsu), Ltd., Sumitomo Pipe & Tube Co., Ltd., Sumikin Steel & Shapes, Inc., Sumitomo Metal Logistics Service Co., Ltd., Sumikin & Nippon Steel Stainless Steel Pipe Co.,Ltd., Sumitomo Metal (SMI) Electronics Devices, Inc., Western Tube & Conduit Corporation, Seymour Tubing, Inc., International Crankshaft Inc., Huizhou Sumikin Forging Co., Ltd.
1 company that began operation in the current consolidated fiscal year, and 1 companiy which newly became a subsidiary, are newly listed as consolidated subsidiaries. Meanwhile, 1 company that is no longer a subsidiary, 1 company that changed its status to be an affiliate to which equity method is applied, and 1 company that merged with another subsidiary, are excluded from the list of the consolidated subsidiaries.
2. Items regarding application of equity method (a) Number of non-consolidated subsidiaries to which the equity method is applicable:
1 company Company name: Kanto Special Steel Works, Ltd.
(b) Number of related affiliates to which the equity method is applicable: 36 companies
Names of major related affiliates are as follows: SUMCO Corporation, Kashima Kyodo Electric Power Company, Kyoei Steel Ltd., Daiichi Chuo Kisen Kaisha, Sumikin Bussan Corporation, Nippon Steel & Sumikin Coated Sheet Corporation, Sumitomo Precision Products Co., Ltd., Osaka Titanium Technologies Co, Ltd., Nippon Steel & Sumikin Metal Products Co., Ltd., Nippon Steel & Sumikin Stainless Steel Corporation, Chuo Denki Kogyo Co., Ltd., Nippon Steel & Sumikin Welding Co., Ltd., VAM USA LLC, Vallourec & Sumitomo Tubos do Brasil Ltda.
From the current fiscal year, a company which was classified as a consolidated subsidiary in the
previous fiscal year has been re-classified as a company to which equity method is applied.
With respect to SUMCO Corporation, equity method is applied based on the company’s consolidated financial statements.
3. Matters regarding accounting methods adopted in the consolidated financial statements
(Note) This provision is not translated in English. Please refer to our original Japanese document. (7) Items to be noted as changes in the basis for presenting consolidated financial statements
(Note) This provision is not translated in English. Please refer to our original Japanese document.

- 18 -
(8) Footnotes regarding consolidated financial statements 1. Segement Information (i) Segment information by business sector (a)FY2008 (year ended March 31, 2009) (Million yen)
Steel Engineering Electronics Other Total Corporate or eliminations Consolidated
Sales to customers 1,740,794 11,679 45,350 46,597 1,844,422 - 1,844,422Intersegment sales 2,500 16 - 20,042 22,559 (22,559) -
Total sales 1,743,294 11,695 45,350 66,640 1,866,981 (22,559) 1,844,422Cost of sales and operating expenses 1,512,452 11,925 49,973 66,558 1,640,909 (22,539) 1,618,370
Operating income/ (loss) 230,841 (229) (4,622) 82 226,071 (19) 226,052
Assets 1,944,609 6,730 117,734 419,824 2,488,899 (36,364) 2,452,535Depreciation 103,883 8 3,726 3,278 110,896 - 110,896Impairment loss on fixed assets 1,196 - 9,947 - 11,144 - 11,144
Capital expenditures 153,930 25 1,760 4,556 160,273 - 160,273 (b) FY 2009 (year ended March 31, 2010) (Million yen)
Steel Other Total Corporate or eliminations Consolidated
Sales to customers 1,205,861 79,984 1,285,845 - 1,285,845Intersegment sales 2,006 18,592 20,598 (20,598) -
Total sales 1,207,868 98,576 1,306,444 (20,598) 1,285,845Cost of sales and operating expenses 1,215,487 91,854 1,307,342 (20,567) 1,286,774
Operating income/ (loss) (7,618) 6,721 (897) (31) (928)
Assets 1,939,342 609,521 2,548,864 (145,194) 2,403,670Depreciation 118,062 3,578 121,640 - 121,640Capital expenditures 135,447 2,420 137,868 - 137,868
- 19 -
(Remarks) Major products for respective segments Segment Major products etc.
Steel Steel sheets and plates
Steel plates for structural uses, steel plates and sheets for low-temperature service, steel plates and sheets for line pipe, high-tensile-strength steel plates and sheets, hot strip, cold strip, electromagnetic steel sheets, hot-dip galvanized steel sheets, electrolytic galvanized steel sheets, pre-painted steel sheets, pre-coated steel sheets, stainless steel precision rolled strips, pure nickel sheet etc.
Construction materials
H-shapes, fixed outer dimension H-shapes, lightweight welded beams, sheet piles, steel pipe piles etc.
Steel tubes and pipes Seamless steel tubes and pipes, electric resistance welded tubes and pipes, large-diameter arc-welded pipes, hot ERW, specially shaped tubes, various coated tubes and pipes, stainless steel tubes and pipes etc.
Steel bars and wire rods
Mechanical structural quality wire rods, cold heading quality wire rods, spring quality bar, machining steel, bearing steel, stainless bar and wire rods etc.
Railway, automotive, and machinery parts
Wheels, axles, bogie trucks, gear units for electric cars,couplers etc.
Steel castings and forgings
Die forged crankshafts, materials for mold, aluminum wheels, flange for transmission tower, crane wheels, rolls etc.
Semi-finished iron products
Steel billets and slabs, pig iron for steel making etc.
Other steel Titanium products, steel making technology, electric power, land and sea transport of steel materials, maintenance of machinery and facilities, pipelines, energy plant, sales of lime stone etc.
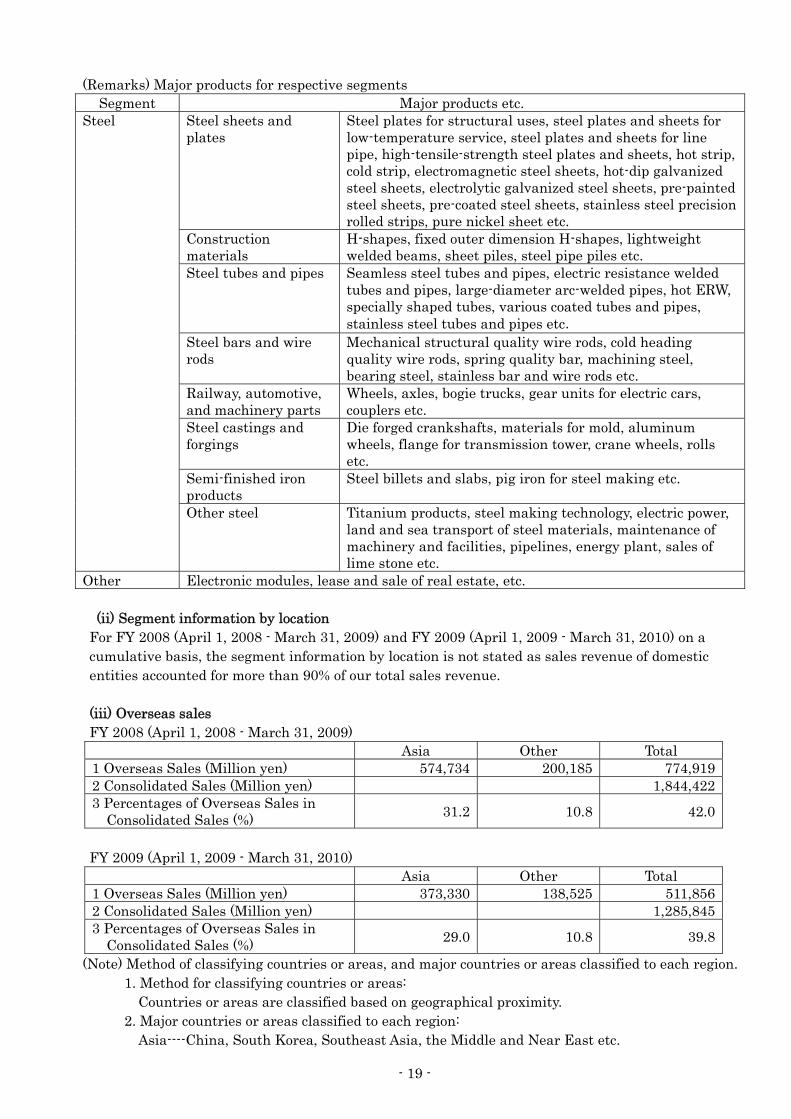
Other Electronic modules, lease and sale of real estate, etc. (ii) Segment information by location For FY 2008 (April 1, 2008 - March 31, 2009) and FY 2009 (April 1, 2009 - March 31, 2010) on a cumulative basis, the segment information by location is not stated as sales revenue of domestic entities accounted for more than 90% of our total sales revenue.
(iii) Overseas sales FY 2008 (April 1, 2008 - March 31, 2009) Asia Other Total1 Overseas Sales (Million yen) 574,734 200,185 774,9192 Consolidated Sales (Million yen) 1,844,4223 Percentages of Overseas Sales in
Consolidated Sales (%) 31.2 10.8 42.0
FY 2009 (April 1, 2009 - March 31, 2010) Asia Other Total1 Overseas Sales (Million yen) 373,330 138,525 511,8562 Consolidated Sales (Million yen) 1,285,8453 Percentages of Overseas Sales in
Consolidated Sales (%) 29.0 10.8 39.8
(Note) Method of classifying countries or areas, and major countries or areas classified to each region. 1. Method for classifying countries or areas: Countries or areas are classified based on geographical proximity. 2. Major countries or areas classified to each region: Asia----China, South Korea, Southeast Asia, the Middle and Near East etc.
- 20 -
2. Information on business performance per share (Note) This provision is not translated in English. Please refer to our original Japanese document. 5. Non-consolidated Financial Statement This provision is not translated in English. Please refer to our original Japanese document. 6. Others (1) Change of officers: These changes were announced on February 23and on April 27th of this year. (a) A Candidate to become a new Director
Yoshitaka Hotta
(b) A candidate to become a new Corporate Auditor Hirohiko Minato
(c) A candidate to become a new Corporate Auditor Hirotake Abe
(d) Retired Director Yoshinari Ishizuka (Retired on March 31, 2010, appointed to be Advisor of SUMCO Corporation
on April 1, 2010)
(e) A Standing Corporate Auditor to retire Shigeru Sakurai
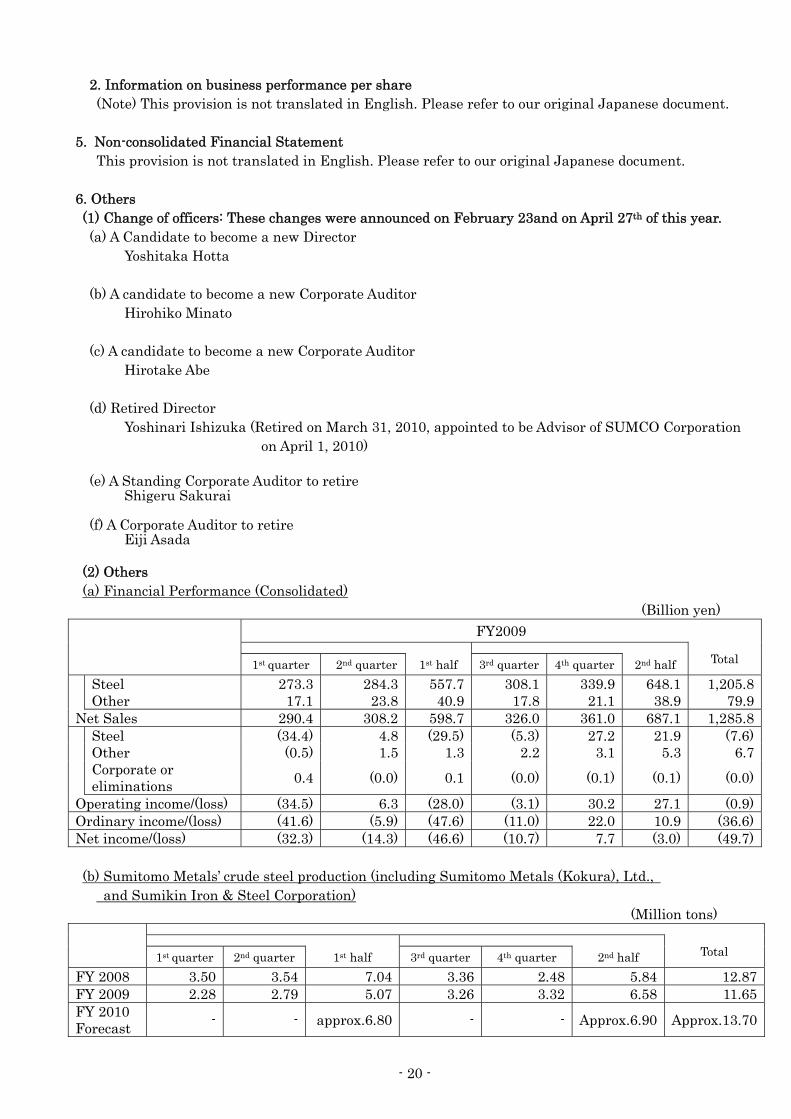
(f) A Corporate Auditor to retire Eiji Asada (2) Others (a) Financial Performance (Consolidated)
(Billion yen) FY2009
Total 1st quarter 2nd quarter 1st half 3rd quarter 4th quarter 2nd half Steel 273.3 284.3 557.7 308.1 339.9 648.1 1,205.8 Other 17.1 23.8 40.9 17.8 21.1 38.9 79.9Net Sales 290.4 308.2 598.7 326.0 361.0 687.1 1,285.8 Steel (34.4) 4.8 (29.5) (5.3) 27.2 21.9 (7.6) Other (0.5) 1.5 1.3 2.2 3.1 5.3 6.7 Corporate or
eliminations 0.4 (0.0) 0.1 (0.0) (0.1) (0.1) (0.0)
Operating income/(loss) (34.5) 6.3 (28.0) (3.1) 30.2 27.1 (0.9)Ordinary income/(loss) (41.6) (5.9) (47.6) (11.0) 22.0 10.9 (36.6)Net income/(loss) (32.3) (14.3) (46.6) (10.7) 7.7 (3.0) (49.7) (b) Sumitomo Metals’ crude steel production (including Sumitomo Metals (Kokura), Ltd.,
and Sumikin Iron & Steel Corporation) (Million tons)
Total 1st quarter 2nd quarter 1st half 3rd quarter 4th quarter 2nd half
FY 2008 3.50 3.54 7.04 3.36 2.48 5.84 12.87FY 2009 2.28 2.79 5.07 3.26 3.32 6.58 11.65FY 2010 Forecast - - approx.6.80 - - Approx.6.90 Approx.13.70

- 21 -
(c) Export ratio (including Sumitomo Metals (Kokura), Ltd., Sumitomo Metals (Naoetsu), Ltd. and Sumikin Iron & Steel Corporation) (Value basis %)
Total 1st quarter 2nd quarter 1st half 3rd quarter 4th quarter 2nd half
FY 2008 44 44 44 46 48 47 45FY 2009 48 42 45 41 41 41 43 (d) Foreign exchange rate
(Yen/US$)
Total 1st quarter 2nd quarter 1st half 3rd quarter 4th quarter 2nd half
FY 2008 105 108 106 96 94 95 101FY 2009 97 94 95 90 91 90 93FY 2010 Forecast - - approx.90 - - approx.90 approx.90
(e) Consolidated exposure to foreign exchange fluctuations
FY 2008 FY 2009Excess payment of
approx. 0.2 billion US$ per year Excess receipt of
approx. 0.7 billion US$ per year* (f) Average price of steel products (including Sumitomo Metals (Kokura), Ltd., Sumitomo
Metals (Naoetsu), Ltd. and Sumikin Iron & Steel Corporation) (Thousand yen/ton)
Total 1st quarter 2nd quarter 1st half 3rd quarter 4th quarter 2nd half
FY 2008 110.1 126.9 118.6 130.3 132.7 131.3 124.3FY 2009 109.4 86.8 96.8 79.0 84.3 81.7 88.0 (g) Debt (Consolidated)
(Billion yen) As of
March 31,2009 As of
March 31, 2010 Forecast
As of March 31, 2011 990.0 1,138.3 approx. 1,100.0
(h) Capital Expenditure and Depreciation (Consolidated; Tangible assets)
(Billion yen) FY 2009 Forecast FY 2010Capital Expenditure 136.6 approx. 120.0 Depreciation 120.8 approx. 130.0 (i) Number of Employees (Consolidated)
(Employees) As of
March 31, 2009 As of
March 31, 2010 24,245 23,674

- 22 -
(j) Analysis on consolidated ordinary income FY 2009 ← FY 2008 (Foreign exchange (TTM) assumption:
93 Yen/US$ (FY 2009) ← 101 Yen/US$ (FY 2008) (Billion yen)
FY 2009 FY 2008 Increase/(Decrease)Consolidated
ordinary income/(loss) (36.6) 225.7 (262.3)
Positive impact Negative impact Raw materials price decrease*1 224.0 Losses from valuation (124.0)
Cost improvement 35.0
Decrease of equity in earnings, and increase of equity in losses, of unconsolidated subsidiaries
(44.7)
Inevntory valuation 35.0 Negative impact of production cut (20.0)
Increase of fixed costs (9.0) Sales mix and others (358.6)
Total 294.0 Total (556.3)Difference: (262.3)
*1 Positive impact of “Raw materials price decrease” includes negative impact of 92.0 billion yen due to carry-over of raw materials costs.