SULFUR ANALYZER OPERATION MANUAL...SulfurChromeTM SULFUR ANALYZER OPERATION MANUAL P/N: MA1479DI...
132
SulfurChrome TM SULFUR ANALYZER OPERATION MANUAL P/N: MA1479DI REV: 7 – August 2019 Galvanic Applied Sciences Inc. 7000 Fisher Road S.E. Calgary, Alberta, Canada T2H 0W3 Phone: (403) 252-8470 Fax: (403) 255-6287 E-Mail: [email protected] Service: [email protected] World Wide Web: http://www.galvanic.com
Transcript of SULFUR ANALYZER OPERATION MANUAL...SulfurChromeTM SULFUR ANALYZER OPERATION MANUAL P/N: MA1479DI...

SulfurChromeTM
SULFUR ANALYZER OPERATION MANUAL
P/N: MA1479DI REV: 7 – August 2019
Galvanic Applied Sciences Inc. 7000 Fisher Road S.E.
Calgary, Alberta, Canada T2H 0W3
Phone: (403) 252-8470 Fax: (403) 255-6287
E-Mail: [email protected] Service: [email protected]
World Wide Web: http://www.galvanic.com

Revision 7 2 August 02, 2019
NOTICES This system is covered by a limited warranty. A copy of the warranty is included with this manual. The operator is required to perform routine maintenance as described herein on a periodic basis to keep the warranty in effect. For routine maintenance procedures, refer to All information in this manual is subject to change without notice and does not represent a commitment on the part of Galvanic Applied Sciences, Inc. No part of this manual may be reproduced or transmitted in any form or by any means without the written permission of Galvanic Applied Sciences, Inc. Note: Changes or modifications not expressly approved by Galvanic Applied Sciences, Inc. could void the user's authority to operate the equipment. © Copyright 2019, Galvanic Applied Sciences, Inc. All rights reserved. Printed in Canada

Revision 7 3 August 02, 2019
Table of Contents
SulfurChromeTM ........................................................................... 1
Section 1: General Description of the SulfurChrome Sulfur Chromatograph Analyzer ......................................................... 14
1.1 Introduction ............................................................................................... 14 1.2 Functional Description .............................................................................. 14
Section 2: SulfurChrome Sulfur Chromatograph Components .................................................................................................... 16
2.1 Chromatograph System ............................................................................ 16 2.1.1 Columns ....................................................................................................... 17 2.1.2 Chromatograph Valve ................................................................................. 17
2.2 Detector System ....................................................................................... 17 2.2.1 Reaction Furnace ........................................................................................ 17 2.2.2 Reaction Cell ............................................................................................... 18 2.2.3 Photomultiplier Tube (PMT) ....................................................................... 19 2.2.4 Ozone Generator ......................................................................................... 19
2.3 Electronics ................................................................................................ 20 2.3.1 Controller Board .......................................................................................... 20 2.3.2 Input / Output (I/O) Board ........................................................................... 21 2.3.3 Display Board and SulfurChrome local display ....................................... 21 2.3.4 Pre-Amplifier Boad ...................................................................................... 22 2.3.5 SulfurChrome Electrical Connections ....................................................... 22
Section 3: Analyzer Installation and Set-up ........................... 24 3.1 Sampling ................................................................................................... 24
3.1.1 Sampling Point Location ............................................................................ 24 3.1.2 Sample Volume and Flow Rate .................................................................. 24 3.1.3 Contamination and Reactivity Precautions .............................................. 24
3.2 Installation Site Selection .......................................................................... 24 3.3 Installation ................................................................................................ 24 3.4 SulfurChrome Initial Start-up .................................................................... 26
Section 4: Using the Keypad and Local Display .................... 29 4.1 Overview ................................................................................................... 29 4.2 Keypad Controller ..................................................................................... 29 4.3 Analysis Results Tab ................................................................................ 30 4.4 Chromatogram Tab ................................................................................... 31 4.5 Alarms Tab ............................................................................................... 31 4.6 GC Status Tab .......................................................................................... 32 4.7 I/O Status Tab........................................................................................... 33 4.8 System Tab............................................................................................... 33
Revision 7 4 August 02, 2019
4.8.1Info Sub-tab .................................................................................................. 33 4.8.2 Network Sub-tab .......................................................................................... 34 4.8.3 Tools Sub-tab .............................................................................................. 35
Section 5: AccuChrome GUI Software Operation .................. 36 5.1 AccuChrome GUI Software Introduction ................................................... 36 5.2 Interfacing the Chromatograph to the Computer....................................... 36
5.2.1 Direct Connection ....................................................................................... 36 5.2.2 Remote Connection via LAN ...................................................................... 36
5.3 Connecting to the SulfurChrome using the AccuChrome GUI Software ... 37 5.3.1 Create New Connection Setup ................................................................... 37 5.3.2 Open Existing Connection ......................................................................... 38 5.3.3 Connect to Front Panel ......................................................................... 38 5.3.4 Connect to Default Connection .................................................................. 38
5.4 Logging into the SulfurChrome using the GUI Software ........................... 39 5.5 Main Screen - View Mode ......................................................................... 39
5.5.1 Quick Access Toolbar ................................................................................ 40 5.5.2 Toolbar ......................................................................................................... 40
5.5.2.1 Changing the Password ................................................................................................. 41 5.5.2.2 About .............................................................................................................................. 42
5.5.3 System Operating Parameters ................................................................... 42 5.5.3.1 Alarm Tab ....................................................................................................................... 43
5.5.4 Main Information Tabs ................................................................................ 43 5.5.4.1 Read Only Mode ............................................................................................................ 43 5.5.4.2 Edit Mode ....................................................................................................................... 43 5.5.4.2 Factory Mode ................................................................................................................. 43
5.6 Chromatogram Tab .............................................................................. 43 5.6.1 Chromatogram Tab Ribbon Bar ................................................................. 45
5.6.1.1 Trace Color .................................................................................................................... 45 5.6.1.2 Selected Curve ............................................................................................................... 45 5.6.1.3 Auto Scale ...................................................................................................................... 46 5.6.1.4 Edit Chromatogram ........................................................................................................ 46 5.6.1.5 Actions............................................................................................................................ 46 5.6.1.6 Components ................................................................................................................... 48 5.6.1.7 Chromatogram Functions .............................................................................................. 50 5.6.1.8 Chart Functions .............................................................................................................. 51
5.7 Analysis Results Tab ................................................................................ 52 5.8 Archive Tab............................................................................................... 53
5.8.1 Toolbar ......................................................................................................... 54 5.8.2 Periodic Trend Data .................................................................................... 55
5.9 Events Tab ............................................................................................... 55 5.10 Reports Tab ............................................................................................ 57 5.11 Configure GC Tab ................................................................................... 58
5.11.1 General Guidelines for Editing a Configuration ..................................... 60 5.11.2 Component Table ...................................................................................... 60
5.11.2.1 The Ribbon – Sulfur Method ........................................................................................ 61 5.11.2.2 Chromatographic Parameters ...................................................................................... 61 5.11.2.3 Physical Properties ...................................................................................................... 64
5.11.3 Action List .................................................................................................. 65
Revision 7 5 August 02, 2019
5.11.3.1 Add Action .................................................................................................................... 66 5.11.3.2 Edit Action .................................................................................................................... 67
5.11.4 Streams Setup ........................................................................................... 68 5.11.4.1 Stream Setup Parameters ........................................................................................... 69 5.11.4.2 Stream Alarms Setup ................................................................................................... 71
5.11.5 Stream Sequencer ..................................................................................... 72 5.11.6 Stream Scheduler ...................................................................................... 72 5.11.7 Digital Inputs ............................................................................................. 73 5.11.8 Digital Outputs .......................................................................................... 74 5.11.9 Analog Inputs ............................................................................................ 75 5.11.10 Analog Outputs ....................................................................................... 76 5.11.11 Global Setting .......................................................................................... 76
Section 6: SulfurChrome Validation ........................................ 78 6.1 Overview ................................................................................................... 78 6.2 Role of the Calibration Gas and the Reference Gas ................................. 78 6.3 Analyzer Calibration .................................................................................. 78 6.4 Analyzer Validation ................................................................................... 79
6.4.1 Determining if the Chromatograph is Functioning in an Acceptable Manner .................................................................................................................. 80 6.4.2 Remedial Activities if the Observed Results do not Meet the Certified Values ................................................................................................................... 80
Section 7: Modbus .................................................................... 82 7.1 Modbus Overview ..................................................................................... 82 7.2 Modbus List .............................................................................................. 83
7.2.1 Adding a Modbus List ................................................................................. 83 7.2.2 Deleting a Modbus List ............................................................................... 84 7.2.3 Copying a Modbus List ............................................................................... 84 7.2.4 Modbus List Details – Slave Mode ............................................................. 84 7.2.5 Modbus List Details – Master Mode .......................................................... 84
7.3 Modbus List Page - Enron Mode .............................................................. 85 7.4 Modbus List Page – Modicon 16 Mode ..................................................... 87 7.5 Modbus List Page – Modicon with Floating Points .................................... 87 7.6 Communication Ports ............................................................................... 87
Section 8: Operational Procedures ......................................... 90 8.1 Maintenance Shutdown ............................................................................ 90 8.2 Vacuum Leak Testing ............................................................................... 90
8.2.1 Basic Vacuum Test Procedure ................................................................... 91 8.2.2 Determining Vacuum Leak Location ......................................................... 91
8.2.2.1 Checking the Ceramic Tubes ................................................................................... 92 8.3 Hydrogen Gas Cylinder Replacement ...................................................... 92 8.4 Helium Gas Cylinder Replacement ........................................................... 92 8.5 Desiccant Replacement ............................................................................ 92 8.6 Ceramic Tube Replacement ..................................................................... 92
8.6.1 Ceramic Tube Removal .............................................................................. 93

Revision 7 6 August 02, 2019
8.6.2 Ceramic Tube Replacement ....................................................................... 94
Section 9: Service Procedures ................................................ 98 9.1 Reaction Cell Cleaning ............................................................................. 98 9.2 Chromatograph Injection Valve Maintenance ......................................... 100
9.2.1 Valve Removal and Replacement Procedure .......................................... 100 9.3 Photomultiplier Tube (PMT) Testing and Replacement .......................... 101
9.3.1 Testing PMT Response ............................................................................. 101 9.3.2 Removing/Replacing the PMT .................................................................. 102 9.3.3 Matching PMT Power Supply to the Photomultiplier Tube .................... 103
9.3.3.1 Electron Tube Photomultiplier Test Ticket Information ................................................ 103 9.3.3.2 Setting the PMT Power Supply .................................................................................... 103 9.3.3.3 Setting the Signal Gain and the Pre-Amp Board ......................................................... 104
9.4 Peltier Coolers Testing and Replacing .................................................... 105 9.4.1 Peltier Coolers Testing ............................................................................. 105 9.4.2 Testing and Modifying Replacement Peltier Coolers ............................. 106 9.4.3 Peltier Cooler Replacement ...................................................................... 106
9.4 Ozone Production ................................................................................... 107 9.4.1 Testing for ozone production ................................................................... 107 9.4.2 Testing Ozone Generator Components................................................... 108
9.4.2.1 Ozone Power Supply Board ......................................................................................... 108 9.4.2.2 Ozone Generator Transformer ..................................................................................... 108 9.4.2.3 Ozone Generator Assembly ......................................................................................... 108
Section 10: Maintenance and Troubleshooting ................... 110 10.1 Weekly Checkup ................................................................................... 110 10.2 Troubleshooting Tips ............................................................................ 110
10.2.1 Performance and Sensitivity .................................................................. 110 10.2.2 Poor Analyzer Repeatability ................................................................... 111 10.2.3 Noisy / Spiky / Elevated Baseline .......................................................... 111
10.3 Troubleshooting Guide ......................................................................... 112 10.4 Spare Parts List .................................................................................... 114
Appendix A: Specifications .................................................... 115 1. General Specifications .............................................................................. 115 2. Cabinet Dimensions .................................................................................. 116 3. SulfurChrome Wiring Diagram .................................................................. 117
Appendix B: Theory of Gas Chromatography ...................... 118 1. What is Gas Chromatography?................................................................. 118 2. Basic Parts and Terminology of a Gas Chromatograph ............................ 118 3. How are the Components Separated? ...................................................... 119 4. How are the Components Detected and Quantified?................................ 119 5. The Chromatograph Output: The Chromatogram ..................................... 120 6. Definition of Terms .................................................................................... 121
Revision 7 7 August 02, 2019
Appendix C: Valco 10 port Valve Technical Information ..... 122
Appendix D: ADI Dia-Vac Pump Operating Instructions ..... 124
Revision 7 8 August 02, 2019
Table of Figures Figure 1: Reaction Furnace Reactions ....................................................................................................... 14 Figure 2: Reaction Cell Reactions .............................................................................................................. 15 Figure 3: SulfurChrome functional diagram ................................................................................................ 16 Figure 4: Chromatograph Valve Flow Diagram........................................................................................... 17 Figure 5: Typical Reaction Furnace ............................................................................................................ 18 Figure 6: Reaction Furnace Flow ................................................................................................................ 18 Figure 7: Reaction Cell ................................................................................................................................ 19 Figure 8: Photomultiplier Tube (PMT) Assembly ........................................................................................ 19 Figure 9: Ozone Generator ......................................................................................................................... 20 Figure 10: Controller Board ......................................................................................................................... 21 Figure 11: Input / Output (I/O) Board .......................................................................................................... 21 Figure 12: Display Board ............................................................................................................................. 22 Figure 13: Pre-Amplifier Board.................................................................................................................... 22 Figure 14: SulfurChrome Electrical Connections ........................................................................................ 23 Figure 15: Typical Utility Gas Connections ................................................................................................. 25 Figure 16: Keypad Controller ...................................................................................................................... 29 Figure 17: Analysis Results Tab ................................................................................................................. 30 Figure 18: Chromatogram Tab .................................................................................................................... 31 Figure 19: Alarms Tab ................................................................................................................................. 32 Figure 20: GC Status Tab ........................................................................................................................... 32 Figure 21: I/O Status Tab ............................................................................................................................ 33 Figure 22: Info Sub-Tab .............................................................................................................................. 34 Figure 23: Network Sub-Tab ....................................................................................................................... 34 Figure 24: Tools Sub-Tab ........................................................................................................................... 35 Figure 25: AccuChrome Icon ...................................................................................................................... 37 Figure 26: Log In Navigation Dialog Box .................................................................................................... 37 Figure 27: New Connection Setup Dialog Box............................................................................................ 37 Figure 28: Existing Connection Dialog Box................................................................................................. 38 Figure 29: Select Mode Dialogue Box ........................................................................................................ 39 Figure 30: Main Screen Chromatogram Tab .............................................................................................. 39 Figure 31: Quick AccessToolbar ................................................................................................................. 40 Figure 32: The Ribbon ................................................................................................................................ 40 Figure 33: Change Password Dialog Box ................................................................................................... 41 Figure 34: About Dialog Box ....................................................................................................................... 42 Figure 35: Status Parameters ..................................................................................................................... 42 Figure 36: Alarms Table .............................................................................................................................. 43 Figure 37: Chromatogram Tab .................................................................................................................... 44 Figure 38: Chart Right Click Menu .............................................................................................................. 44 Figure 39: Interlaced Chromatogram Display (With Border) ....................................................................... 45 Figure 40: Chromatogram Tab Ribbon Bar ................................................................................................. 45 Figure 41: Trace Color Palette .................................................................................................................... 45 Figure 42: Edit Chromatogram Dialog Box ................................................................................................. 46 Figure 43: Presenting Actions on the Chromatogram ................................................................................. 46 Figure 44: Action list choice ........................................................................................................................ 47 Figure 45: Actions sub-menu ...................................................................................................................... 47 Figure 46: Add Action dialog box (Valve Off) .............................................................................................. 47 Figure 47: Add Action Dialog box (Set Gain) .............................................................................................. 48 Figure 48: Component Table Selection ...................................................................................................... 48 Figure 49: Component Peak Integration Data ............................................................................................ 49 Figure 50: Individual component (Zoomed In) ............................................................................................ 49 Figure 51: Component editing on Chromatogram Tab ............................................................................... 49 Figure 52: Component edit window accessed on the chromatogram Tab ................................................. 50 Figure 53: Chromatogram Functions .......................................................................................................... 51

Revision 7 9 August 02, 2019
Figure 54: Chart Functions.......................................................................................................................... 52 Figure 55: Analysis Results Tab ................................................................................................................. 52 Figure 56: Display of Physical Properties ................................................................................................... 53 Figure 57: Archive Tab ................................................................................................................................ 53 Figure 58: Filter Condition Examples .......................................................................................................... 55 Figure 59: Incorrect Filter Condition ............................................................................................................ 55 Figure 60: Events Tab ................................................................................................................................. 56 Figure 61: Reports Tab ............................................................................................................................... 57 Figure 62: Sample Stream Analysis Report ................................................................................................ 58 Figure 63: Configure GC Tab ...................................................................................................................... 58 Figure 64: The Ribbon (Sulfur Method) ...................................................................................................... 60 Figure 65: Component Table ...................................................................................................................... 61 Figure 66: Detection and Identification of Peaks ........................................................................................ 63 Figure 67: Explanation of Peak Detection ................................................................................................... 64 Figure 68: Calculated Physical Properties .................................................................................................. 64 Figure 69: Action List with Tools ................................................................................................................. 65 Figure 70: Add Action Dialog Box ............................................................................................................... 66 Figure 71: Set Gain Action Dialog Box ....................................................................................................... 67 Figure 72: Edit Action Dialog Box ............................................................................................................... 68 Figure 73: Streams Setup ........................................................................................................................... 68 Figure 74: Stream Setup Parameters ......................................................................................................... 69 Figure 75: Alarm Limits Table ..................................................................................................................... 71 Figure 76: Stream Sequencer Screen ........................................................................................................ 72 Figure 77: Stream Scheduler ...................................................................................................................... 73 Figure 78: Digital Inputs .............................................................................................................................. 73 Figure 79: Digital Outputs Screen ............................................................................................................... 74 Figure 80: Analog Input Screen .................................................................................................................. 75 Figure 81: Analog Outputs Screen .............................................................................................................. 76 Figure 82: Global Setting ............................................................................................................................ 76 Figure 83: Stream Sequencer Selection of the Configure G.C. Tab .......................................................... 79 Figure 84: Configure G.C. Table ................................................................................................................. 81 Figure 85: Detection and Identification of Peaks ........................................................................................ 81 Figure 86: Main Modbus Page .................................................................................................................... 82 Figure 87: Adding a Modbus List ................................................................................................................ 83 Figure 88: Modbus List Details – Slave Mode ............................................................................................ 84 Figure 89: Modbus List Details - Master Mode ........................................................................................... 84 Figure 90: Enron Mode, Short Integers ....................................................................................................... 86 Figure 91: Enron Mode, Floating Points ..................................................................................................... 87 Figure 92: Communication Ports Page ....................................................................................................... 88 Figure 93: Setting Port Configuration - Serial ............................................................................................. 88 Figure 94: Setting Ethernet Configuration ................................................................................................... 89 Figure 95: Removing the Ceramic Tubes ................................................................................................... 94 Figure 96: Back-to-Back Ferrules ............................................................................................................... 95 Figure 97: Ceramic Tube Basic Assembly .................................................................................................. 96 Figure 98: Chromatograph Valve .............................................................................................................. 100 Figure 99: Cabinet Dimensions ................................................................................................................. 116 Figure 100: Main Wiring Diagram ............................................................................................................. 117 Figure 101: Chromatograph Components ................................................................................................ 118 Figure 102: Sample Gas Flow Through The Column ............................................................................... 119 Figure 103: Chromatogram Description .................................................................................................... 120
Revision 7 10 August 02, 2019
Safety Symbols used in Manual
The Danger symbol indicates a hazardous situation that, if not avoided will result in death or serious injury.
The Warning symbol indicates a hazardous situation that, if not avoided could result in death or serious injury.
The Caution symbol with the safety alert symbol indicates a hazardous situation that, if not avoided could result in minor or moderate injury.
The Notice symbol is used to highlight information that will optimize the use and reliability of the system.

Revision 7 11 August 02, 2019
Important Safety Guidelines for the SulfurChrome Sulfur Gas Chromatograph Analyzer Please read the following warnings and cautions carefully before using the SulfurChrome Sulfur Gas Chromatograph.
This equipment must be used as specified by the manufacturer or overall safety will be impaired.
Access to this equipment should be limited to authorized, trained personnel ONLY.
: Due to the thermal mass of the hardware, cooling of the items takes substantial time .
Observe all warning labels on the analyzer enclosures. The analog outputs and alarm relay contacts may be powered by a source separate from the one (s) used to power the analyzer system. Disconnecting the main power source may not remove power from the analog output signals Any safety recommendations or comments contained herein are suggested guidelines only. Galvanic Applied Sciences Inc. bears no responsibility and assumes no liability for the use and/or implementation of these suggested procedures. This system, when operating in its normal mode, and/or when it is being serviced, maintained, installed and commissioned contains items which may be hazardous to humans if handled or operated incorrectly or negligently. These items include, but are not limited to; a) High Voltage Electrical Energy (particularly in the Ozone Generator compartment) b) Toxic and Explosive Gases c) High Temperature Surfaces The SulfurChrome Gas Chromatograph can be configured to be safely operated in a Class 1, Div 2, Groups B, C. D area.

Revision 7 12 August 02, 2019
Manufacturer’s Warranty Statement Galvanic Applied Sciences Inc. (“Seller”) warrants that its products will be free from defects in materials and workmanship under normal use and service in general process conditions for 12 months from the date of Product start-up or 18 months from the date of shipping from Seller’s production facility, whichever comes first (the “Warranty Period”). Products purchased by Seller from a third party for resale to Buyer ("Resale Products") shall carry only the warranty extended by the original manufacturer. Buyer agrees that Seller has no liability for Resale Products beyond making a reasonable commercial effort to arrange for procurement and shipping of the Resale Products. Buyer must give Seller notice of any warranty claim prior to the end of the Warranty Period. Seller shall not be responsible for any defects (including latent defects) which are reported to Seller after the end of the Warranty Period. THIS WARRANTY AND ITS REMEDIES ARE IN LIEU OF ALL OTHER WARRANTIES OR CONDITIONS EXPRESSED OR IMPLIED, ORAL OR WRITTEN, EITHER IN FACT OR BY OPERATION OF LAW, STATUTORY OR OTHERWISE, INCLUDING BUT NOT LIMITED TO, WARRANTIES OR CONDITIONS OF MERCHANTABILITY AND FITNESS FOR A PARTICULAR PURPOSE, WHICH SELLER SPECIFICALLY DISCLAIMS. Seller’s obligation under this warranty shall not arise until Buyer notifies Seller of the defect. Seller’s sole responsibility and Buyer’s sole and exclusive remedy under this warranty is, at Seller’s option, to replace or repair any defective component part of the product upon receipt of the Product at Seller’s production facility, transportation charges prepaid or accept the return of the defective Product and refund the purchase price paid by Buyer for that Product. If requested by Buyer, Seller will use its best efforts to perform warranty services at Buyer’s facility, as soon as reasonably practicable after notification by the Buyer of a possible defect provided that Buyer agrees to pay for travel time, mileage from the Seller’s facility or travel costs to the airport / train station closest to Buyer’s facility plus all other travel fees, hotel expenses and subsistence. Except in the case of an authorized distributor or seller, authorized in writing by Seller to extend this warranty to the distributor’s customers, the warranty herein applies only to the original purchaser from Seller (“Buyer”) and may not be assigned, sold, or otherwise transferred to a third party. No warranty is made with respect to used, reconstructed, refurbished, or previously owned Products, which will be so marked on the sales order and will be sold “As Is”. Limitations These warranties do not cover:
• Consumable items such as lamps.
• Analyzer components which may be damaged by exposure to contamination or fouling from the process fluid due to a process upset, improper sample extraction techniques or improper sample preparation, fluid pressures in excess of the analyzer’s maximum rated pressure or fluid temperatures in excess of the analyzer’s maximum rated temperature. These include but are not limited to sample filters, pressure regulators, transfer tubing, sample cells, optical components, pumps, measuring electrodes, switching solenoids, pressure sensors or any other sample wetted components.
• Loss, damage, or defects resulting from transportation to Buyer’s facility, improper or inadequate maintenance by Buyer, software or interfaces supplied by Buyer, operation outside the environmental specifications for the instrument, use by unauthorized or untrained personnel or improper site maintenance or preparation.
• Products that have been altered or repaired by individuals other than Seller personnel or its duly authorized representatives, unless the alteration or repair has been performed by an authorized factory trained service technician in accordance with written procedures supplied by Seller.
Revision 7 13 August 02, 2019
• Products that have been subject to misuse, neglect, accident, or improper installation.
• The sole and exclusive warranty applicable to software and firmware products provided by Seller for use with a processor internal or external to the Product will be as follows: Seller warrants that such software and firmware will conform to Seller’s program manuals or other publicly available documentation made available by Seller current at the time of shipment to Buyer when properly installed on that processor, provided however that Seller does not warrant the operation of the processor or software or firmware will be uninterrupted or error-free.
The warranty herein applies only to Products within the agreed country of original end destination. Products transferred outside the country of original end destination, either by the Seller at the direction of the Buyer or by Buyer’s actions subsequent to delivery, may be subject to additional charges prior to warranty repair or replacement of such Products based on the actual location of such Products and Seller’s warranty and/or service surcharges for such location(s). Repaired Products Repaired products are warranted for 90 days with the above exceptions. Limitation of Remedy and Liability IN NO EVENT SHALL SELLER BE LIABLE TO BUYER FOR ANY INDIRECT, CONSEQUENTIAL, INCIDENTAL, SPECIAL OR PUNITIVE DAMAGES, OR FOR ANY LOSS OF USE OR PRODUCTION, OR ANY LOSS OF DATA, PROFITS OR REVENUES, OR ANY CLAIMS RAISED BY CUSTOMERS OF BUYER OR ANY ENVIRONMENTAL DAMAGE OR ANY FINES IMPOSED ON BUYER BY ANY GOVERNMENTAL OR REGULATORY AUTHORITIES, WHETHER SUCH DAMAGES ARE DIRECT OR INDIRECT, AND REGARDLESS OF THE FORM OF ACTION (WHETHER FOR BREACH OF CONTRACT OR WARRANTY OR IN TORT OR STRICT LIABILITY) AND WHETHER ADVISED OF THE POSSIBILITY OF SUCH DAMAGES OR NOT.
Revision 7 14 August 02, 2019
Section 1: General Description of the SulfurChrome Sulfur Chromatograph Analyzer
1.1 Introduction
The Galvanic Applied Sciences SulfurChrome Sulfur Chromatograph Analyzer was designed as a sulfur specific gas chromatograph to measure sulfur compounds in process or transmission natural gas streams. The analyzer is fully automated and designed to perform on-line, real time analysis. The Windows™ based configuration program allows the user to view chromatograms as well as configure the analyzer.
Sulfur chemiluminescence is a two-stage detection method in which the sample is reduced in air and hydrogen under vacuum at 750°C to generate sulfur monoxide. The sulfur monoxide is then carried to a reaction chamber where it reacts with ozone to generate sulfur dioxide and light. The light generated is then measured by a photomultiplier tube, and this signal is linearly proportional to the quantity of sulfur in the sample.
The installation of a capillary column before the detection system permits the speciation and measurement of individual sulfur compounds. Since the detection method is equimolar in response to all sulfurs, a single component calibration standard can be used to generate a response factor for all sulfur compounds.
The purpose of this manual is to provide a functional description of the SulfurChrome Sulfur Chromatograph system, a description of the function of each component in the system, a description of the user interface software, installation and start-up information, routine maintenance requirements, a trouble shooting guide, a configuration report of your specific system, a recommended spare parts lists, and system drawings.
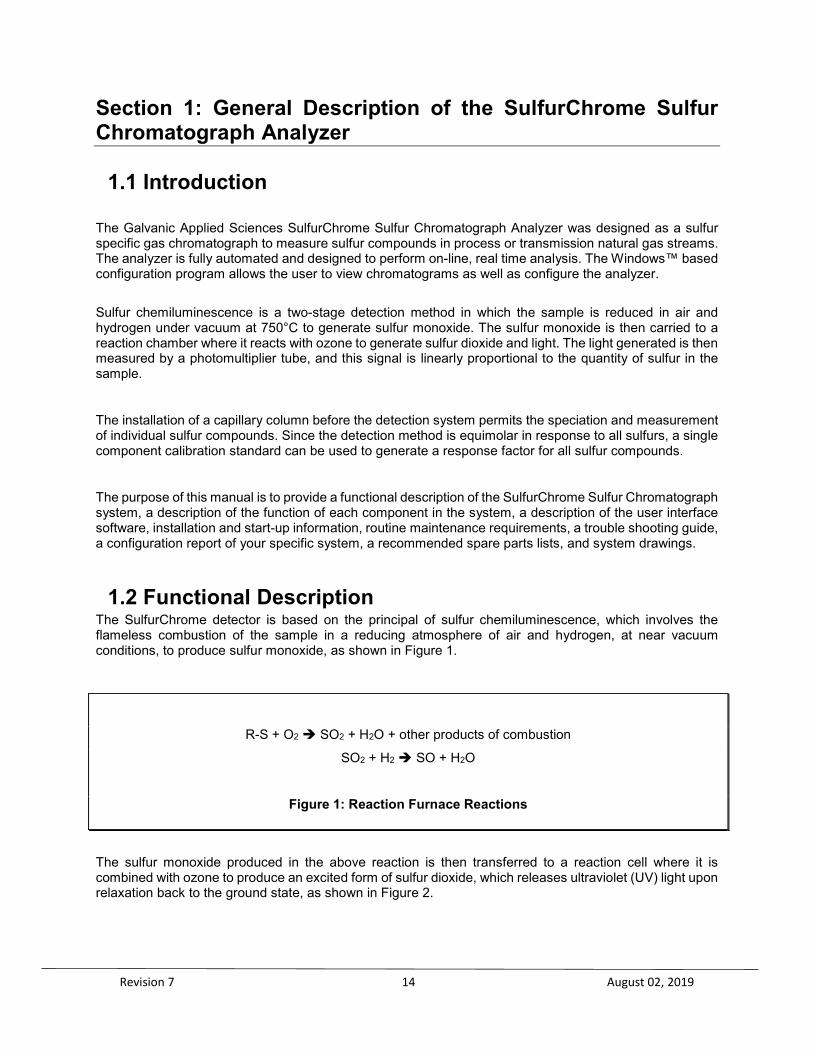
1.2 Functional Description The SulfurChrome detector is based on the principal of sulfur chemiluminescence, which involves the flameless combustion of the sample in a reducing atmosphere of air and hydrogen, at near vacuum conditions, to produce sulfur monoxide, as shown in Figure 1.
The sulfur monoxide produced in the above reaction is then transferred to a reaction cell where it is combined with ozone to produce an excited form of sulfur dioxide, which releases ultraviolet (UV) light upon relaxation back to the ground state, as shown in Figure 2.
R-S + O2 SO2 + H2O + other products of combustion
SO2 + H2 SO + H2O
Figure 1: Reaction Furnace Reactions

Revision 7 15 August 02, 2019
The UV light released is detected by a photomultiplier tube and is linearly proportional to the amount of sulfur present.
Installation of the appropriate chromatograph valve(s) and column(s) makes the measurement of individual sulfur compounds possible. The concentrations of the individual species can be added together to arrive at a total sulfur concentration.
The nature of this measurement makes the detector specific only to sulfur compounds and free from interference from the hydrocarbon component of the sample. The reduction of the sulfur compounds to a common species produces a true equimolar response, thus making a more accurate total sulfur measurement possible. Also, it allows the user to use a single component calibration standard to measure different sulfur components.
Sensitivity down to the parts per billion level is easily attained and the detector has a linear range of five orders of magnitude. These features make a chemiluminescence Sulfur Chromatograph an ideal instrument for measuring sulfur in process streams.
SO + O3 SO2* + O2
SO2* SO2 + light (350 nm)
Figure 2: Reaction Cell Reactions

Revision 7 16 August 02, 2019
Section 2: SulfurChrome Sulfur Chromatograph Components The SulfurChrome Sulfur Chromatograph consists of a chromatograph system used to separate the vaiour sulfur-containing components in the sample stream, a detector system to measure the various sulfur-containing components, and an electronics system to control the analyzer operation, calculate sample concentrations, and control the analyzer’s inputs and outputs. The overall flow diagram of the SulfurChrome Sulfur Chromatograph is shown in Figure 3.
Figure 3: SulfurChrome functional diagram
2.1 Chromatograph System The chromatograph system of the analyzer consists of a Valco 10-port diaphragm chromatograph injection valve and a chromatograph column.

Revision 7 17 August 02, 2019
2.1.1 Columns In applications where component separation is required, a steel coated glass capillary column or a 1/8" Teflon packed column will typically be used. See the Configuration Report in the Appendices for the valves, columns, and setup used in your specific application.
2.1.2 Chromatograph Valve The chromatograph valve is designed to automatically deliver an accurate volume of sample to the detector. Sample flows continuously through a fixed volume sample loop. The valve is pneumatically actuated to change the flow path of the gases inside the valve such that the carrier gas picks up the sample and carries it to the column. The flow path through the chromatograph valve is shown in Figure 4.
Figure 4: Chromatograph Valve Flow Diagram
2.2 Detector System The detector system components include: Reaction Furnace, Reaction Cell, Photomultiplier Tube, and Ozone Generator.
2.2.1 Reaction Furnace The reaction furnace consists of a resistor coil embedded in a ceramic material. A Fuji Controller, located on the front of the analyzer, controls temperature via thermocouple feedback. Passing through the inside of the reaction furnace are two ceramic tubes; it is here where the sulfur monoxide is formed. This design employs a flameless combustion process and relies on intimate surface contact between sample, hydrogen and the heated ceramic tubes. The sulfur monoxide created in this chemical reaction is carried under vacuum to the reaction cell mounted atop the PMT assembly. The reaction furnace assembly is shown in Figure 5. The gas flow through the reaction furnace assembly is shown in Error! Reference source not found..

Revision 7 18 August 02, 2019
Figure 5: Typical Reaction Furnace
Figure 6: Reaction Furnace Flow
2.2.2 Reaction Cell The reaction cell is attached to the Photomultiplier Tube (PMT) assembly. It is sealed with three Viton O-rings to maintain vacuum conditions and to eliminate interference from ambient light. The cell has a hollow section inside it (the reaction chamber) where the sulfur monoxide produced in the reaction furnace is combined with ozone to form the chemiluminescence species (SO). The reaction cell is separated from the photomultiplier tube with an ultraviolet band pass filter, which eliminates light produced by other potential reactions in the cell. A pressure transducer is ported to the cell to provide vacuum pressure reading as a diagnostic function. The reaction cell is shown in Figure 7.

Revision 7 19 August 02, 2019
Figure 7: Reaction Cell
2.2.3 Photomultiplier Tube (PMT) The PMT is an extremely sensitive light detector which outputs a current which is directly proportional to light intensity. It is mounted inside an aluminum enclosure which has the reaction cell mounted on its top. The PMT is kept at a lower operating temperature (0°C - 5°C) to reduce baseline noise and drift. This is accomplished with a pair of Peltier thermoelectric coolers, which are sandwiched between a cooling block (which houses the PMT) and a heat sink located on the back side of the assembly. The heat sink itself is mounted inside the Flowmeter Cabinet, and dissipates the heat created from the cooling process. The photomultiplier tube is powered from the PMT power supply, which has an adjustable voltage output ranging from 0-1250VDC. The signal from the PMT is sent to the pre-amp board, and then on to the microprocessor. The photomultiplier tube assembly is shown in Figure 8.
Figure 8: Photomultiplier Tube (PMT) Assembly
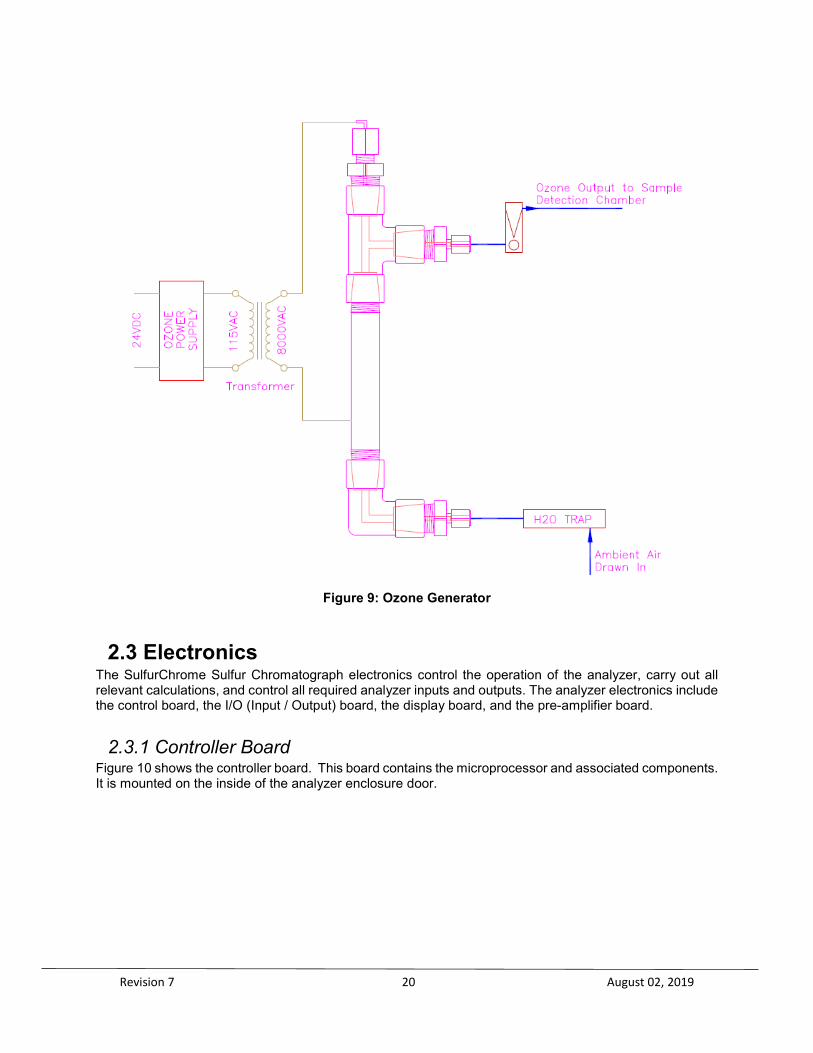
2.2.4 Ozone Generator The ozone generator consists of a stainless steel tube with a glass electrode fitted inside of it. A power supply and a voltage transformer produce a 7,500 – 8,000 VAC electric field inside the tube, between the tube and the electrode. A vacuum draws air through the ozone generator assembly. The high voltage potential existing in the ozone generator assembly converts oxygen in the air to ozone. The ozone is sent to the reaction cell, where it is combined with the sulfur monoxide present to create sulfur dioxide in an excited state, which emits light upon relaxation. The ozone generator assembly is shown in Figure 9.
Revision 7 20 August 02, 2019
Figure 9: Ozone Generator
2.3 Electronics The SulfurChrome Sulfur Chromatograph electronics control the operation of the analyzer, carry out all relevant calculations, and control all required analyzer inputs and outputs. The analyzer electronics include the control board, the I/O (Input / Output) board, the display board, and the pre-amplifier board.
2.3.1 Controller Board Figure 10 shows the controller board. This board contains the microprocessor and associated components. It is mounted on the inside of the analyzer enclosure door.

Revision 7 21 August 02, 2019
Figure 10: Controller Board
2.3.2 Input / Output (I/O) Board Figure 11 shows the I/O board. The I/O board contains all the inputs and outputs required for the GC analysis as well as customer connections.
Figure 11: Input / Output (I/O) Board
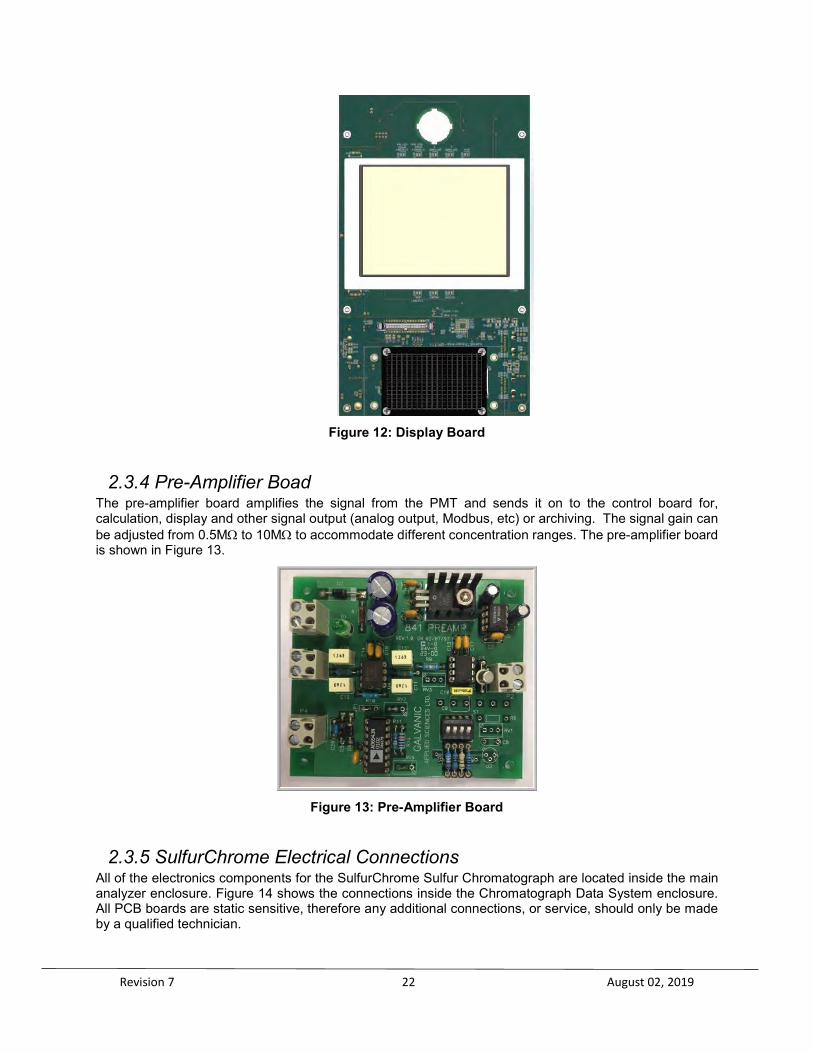
2.3.3 Display Board and SulfurChrome local display The display board, on which is mounted the analyzer’s full-colour local display screen, is mounted on the analyzer electronics enclosure door. The display uses a local intrinsically safe keypad for navigation and can be used to view status data about the SulfurChrome Sulfur Chromatograph. The analyzer’s local display is an industrial VGA display with 640 x 480 resolution. It uses TFT technology with 260,000 colours and is sunlight readable. The display board is shown in Figure 12.
Revision 7 22 August 02, 2019
Figure 12: Display Board
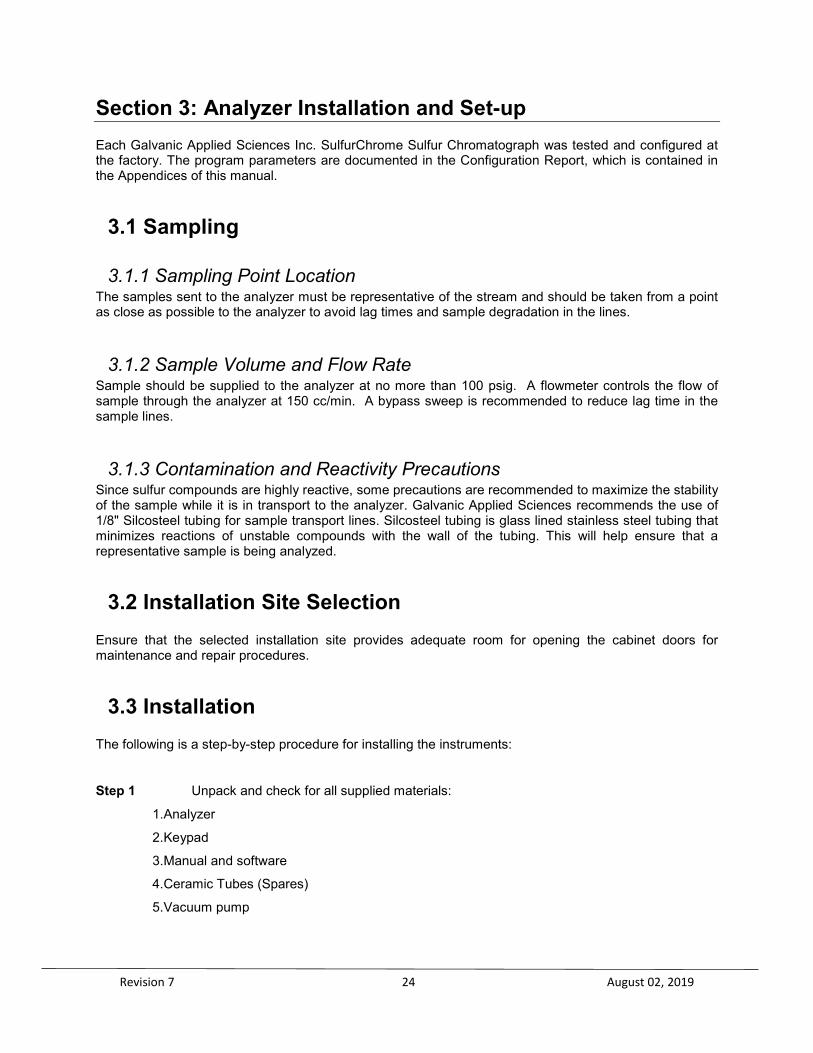
2.3.4 Pre-Amplifier Boad The pre-amplifier board amplifies the signal from the PMT and sends it on to the control board for, calculation, display and other signal output (analog output, Modbus, etc) or archiving. The signal gain can be adjusted from 0.5MΩ to 10MΩ to accommodate different concentration ranges. The pre-amplifier board is shown in Figure 13.
Figure 13: Pre-Amplifier Board
2.3.5 SulfurChrome Electrical Connections All of the electronics components for the SulfurChrome Sulfur Chromatograph are located inside the main analyzer enclosure. Figure 14 shows the connections inside the Chromatograph Data System enclosure. All PCB boards are static sensitive, therefore any additional connections, or service, should only be made by a qualified technician.

Revision 7 23 August 02, 2019
Figure 14: SulfurChrome Electrical Connections
Revision 7 24 August 02, 2019
Section 3: Analyzer Installation and Set-up Each Galvanic Applied Sciences Inc. SulfurChrome Sulfur Chromatograph was tested and configured at the factory. The program parameters are documented in the Configuration Report, which is contained in the Appendices of this manual.
3.1 Sampling
3.1.1 Sampling Point Location The samples sent to the analyzer must be representative of the stream and should be taken from a point as close as possible to the analyzer to avoid lag times and sample degradation in the lines.
3.1.2 Sample Volume and Flow Rate Sample should be supplied to the analyzer at no more than 100 psig. A flowmeter controls the flow of sample through the analyzer at 150 cc/min. A bypass sweep is recommended to reduce lag time in the sample lines.
3.1.3 Contamination and Reactivity Precautions Since sulfur compounds are highly reactive, some precautions are recommended to maximize the stability of the sample while it is in transport to the analyzer. Galvanic Applied Sciences recommends the use of 1/8" Silcosteel tubing for sample transport lines. Silcosteel tubing is glass lined stainless steel tubing that minimizes reactions of unstable compounds with the wall of the tubing. This will help ensure that a representative sample is being analyzed.
3.2 Installation Site Selection Ensure that the selected installation site provides adequate room for opening the cabinet doors for maintenance and repair procedures.
3.3 Installation The following is a step-by-step procedure for installing the instruments:
Step 1 Unpack and check for all supplied materials:
1. Analyzer
2. Keypad
3. Manual and software
4. Ceramic Tubes (Spares)
5. Vacuum pump

Revision 7 25 August 02, 2019
Step 2 Connect all supply and sample lines.
Utility gases are connected to the bulkheads located on above the flowmeter panel of the analyzer. Refer to Figure 15 for connection locations.
The following are materials required to complete the installation of the SulfurChrome Sulfur Chromatograph which are not supplied with the Analyzer:
A) Cylinder size 300, 285cf, of Hydrogen UHP (99.999% pure) Dual stage regulator set at 60 psig.
B) Cylinder size 300, 285cf, of Helium UHP (99.999% pure) Dual stage regulator set at 80 psig.
C) Cylinder size 80A, 76cf, H2S (hydrogen sulfide) calibration standard (concentration level around 75% of range). Dual stage stainless steel regulator set at 15 psig.
D) Transfer lines: all transfer lines should be stainless steel or better
Figure 15: Typical Utility Gas Connections
DO NOT use regulators that have been in previous service due to possible contamination.

Revision 7 26 August 02, 2019
Step 3 Connect the vacuum pump to the Analyzer.
The ADI Dia-Vac H302 model will be supplied with the output of one pump head tubed with ¼” SS tubing in series to the inlet of the other head. Connect the input of the pump to the vacuum port of the analyzer and connect the output of the pump to vent.
Step 4 Before proceeding with the start-up procedure, ensure that the following conditions have been met:
1) Power has been connected to the analyzer. Do not turn the power on at this time.
2) Utility gases have been connected to the analyzer. Hydrogen is supplied at 60 psig. Helium is supplied at 80 psig. PMT purge air (instrument air) should be supplied at 15 psig. Utility gas pressures must be present, however all flow devices on the analyzer must be off. (Note: The Helium flow controls the retention times during sample processing and adjusting it at this time will affect the factory calibration setting - simply ensure that the Helium pressure is set at 20psig on the regulator on the front of the flowmeter panel and that the chromatograph isolation valve located above the reaction furnace inside the main analyzer enclosure is in the off position).
3) The vacuum pump has been connected to the analyzer, and the block valve on the inlet of the pump is in the OFF position.
4) The reaction furnace must be powered off at this time.
5) Ensure that the ceramic reaction tubes are correctly installed (and not broken).
3.4 SulfurChrome Initial Start-up
Step 1: Ensure that all pre-startup conditions have been met (also refer to Section 3.3 for additional
details).
• All supply and sample gases have been connected and are pressurized
(as per the installation section).
• Vacuum Pump has been connected to the Analyzer
• Power has been connected to Analyzer, but not turned on
• Reaction Furnace must be cold: not yet energized
• The Block Valve between the Chromatograph Oven and the Reaction Furnace is in the off position (valve handle pointing towards the sidewall).
• Ceramic Tubes correctly installed (refer to Ceramic Tube Replacement, Section 8.6).
It is very important that the pre-start up checklist and start up procedures be performed in the order that they are presented here. Poor Analyzer sensitivity and repeatability may result if these procedures are not properly followed.
Revision 7 27 August 02, 2019
Step 2: At this point the valve at the inlet of the Pump must be in the OFF position (valve handle
perpendicular to direction of flow, vacuum is not to be applied at this point). Power up the Pump. Power up the analyzer and open the breaker switch for the furnace.
Step 3: If the Ceramic Tubes that were supplied installed with the Analyzer are being used, then the system can be vacuum leak checked at this time (see Vacuum Leak Testing Procedure, section 8.2). If new Ceramic tubes are required, then refer to the section on Ceramic Tube Replacement, section 8.6, for the correct procedure. Do not perform the leak checking procedure at this time (It can be done later).
Step 4: If the unit has been leak checked, then return the system to atmospheric pressure (a reading of close to zero on the vacuum pressure indicator). This can be done by opening any Fitting on the Reaction Cell, or more simply by temporarily opening the Ozone Flowmeter and waiting for the indicated vacuum pressure to fall to near zero.
Step 5: The Block Valve to the inlet of the Pump must be off at this time. Turn on the Reaction Furnace and wait until it reaches 750°C. This will take 3 – 5 minutes.
DO NOT proceed until the Reaction Furnace reaches 750°C.
Step 6: Once the Reaction Furnace reaches 750°C turn the Block Valve at the Vacuum Pump Inlet to ON and proceed IMMEDIATELY to the next step.
Step 7: Turn on the Hydrogen and Combustion Air Flow meters at the same time. Set the Hydrogen flow to 4.5 and the Combustion Airflow to 2 or as indicated on the flow meter bodies.
Step 8: The Helium should be supplied to the Analyzer at 80psi. The Helium Pressure Regulator on the Flowmeter Panel should be set at 20psi.
Step 9: Open the Block Valve located between the Chromatograph Oven and the Reaction Furnace.
DO NOT turn on the reaction furnace at this time. It will be activated at a later step in the start up procedure.
DO NOT run Combustion Air without Hydrogen (or vice-versa) to the Reaction Furnace while it is hot. This will cause irreparable damage to the Ceramic Tubes.

Revision 7 28 August 02, 2019
Step 10: Set the Ozone Flowmeter flow to 2 or as indicated on the flow meter body.
Step 11: Turn on the sample flow to Analyzer. Set Sample Flowmeter to a flow of 1-2. Process
sample that is known to contain sulfur or a calibration mix can be used. The sample should be clean and dry. Start an analysis run.
An analysis run can be started by either pressing the Run/Halt button on the analyzer keypad or by clicking on the Halt button in the GUI software.
Step 12: Optimize the Helium flow such that the H2S peak retention time is 80 seconds ± 2 seconds.
Step 13: Allow the Analyzer to stabilize for a period of 16-24 hours. Calibrate the Analyzer as described in Section 6.3. The SulfurChrome Sulfur Chromatograph is now ready to begin analyzing sample.
The flows will fight each other and may require several adjustments before they stabilize.

Revision 7 29 August 02, 2019
Section 4: Using the Keypad and Local Display
4.1 Overview The display on the SulfurChrome provides a broad overview of the system status and the concentration of the various compounds in the sample. It consists of a variety of tabs that display different types of information, including analysis results, a live chromatogram, hardware status, alarms, and a variety of system configuration parameters. Navigation between the various tabs on the analyzer’s local display can be accomplished by using the attached keypad controller.
4.2 Keypad Controller The Keypad Controller shown in Figure 16 is used to navigate between the various screens of the display, enter data and initiate/terminate runs.
Figure 16: Keypad Controller
Numerical keys and the decimal key on the keypad are used for the entry of numerical data into the analyzer. The keypad also has several labelled buttons whose functions are described in Table 1.
Table 1: Keypad Button Functions
Button Function Panel Prev
Used to navigate to the tab to the left of the currently displayed tab
Panel Next
Used to navigate to the tab to the right of the currently displayed tab
Field Prev
Used to navigate to the previous data entry field on the currently displayed tab (only useful if a data entry field is present on the displayed tab)
Field Next
Used to navigate to the next data entry field on the currently displayed tab (only useful if a data entry field is present on the displayed tab)
Home Used to navigate back to the display’s hom screen (the Analysis Results tab) Run / Halt
• If the analyzer is currently halted, pressing this button will cause the analyzer to begin an analysis operation.
• If the analyzer is currently carrying out an analysis operation, pressing this button will cause the analyzer to halt at the completion of the current analysis operation.
Del Deletes data from the currently selected data entry field. Exit Used to exit editing the currently selected data entry field without saving changes
Enter Used to save changes to a currently selected data entry field.

Revision 7 30 August 02, 2019
4.3 Analysis Results Tab The Analysis Results tab shown in Figure 17 presents the analytical results and calculated physical properties from the most recent run. Data from previous analysis runs can be obtained by using the Next / Prev Field buttons to select the Older button (the check mark by Latest will be removed) and pressing Enter. The Newer button is used to present more recent data if the Older button has been used. Selecting the Latest checkbox and pressing Enter will cause the most recently collected data to be displayed.
Figure 17: Analysis Results Tab
Each data record includes an indication of the stream that was analyzed for that data record, as well as the time at which the sample was injected into the chromatography column (i.e. the time at which the analysis started). The fields on this page are for display only – no data can be edited from this tab. Table 2 describes the data that is available on this page.
Table 2: Analysis Results Data
Data Field Explanation Stream Indicates the stream analyzed for the currently displayed data record
Injection Time Indicates the time at which the analysis whose results are currently displayed was initiated.
Components Table Identifies all configured analysis components by name and indicates their measured concentration
Physical Properties Table
Identifies all physical properties calculated from the concentration of components in the sample and indicates their calculated values.
Vacuum Pressure Indicates the current vacuum pressure measured in the reaction cell Furnace Temp. Indicates the current temperature of the reaction furnace in °C (should be
~750°C in normal operation) Oven Temperature Indicates the current temperature of the chromatography oven in °C (should
be 70°C in normal operation) PMT Reading Indicates the current signal output from the photomultiplier tube in mV
Revision 7 31 August 02, 2019
The bottom line of the display indicates system status. The right two values indicate the elapsed time (↑) and the remaining time (↓) in the current analysis cycle. The first field on the bottom line of the display will present Run, Halt Pending or Halt, depending on the present status of the chromatograph. This indicator will also be colour coded for quick identification of status, with Run displaying on a green background, Halt Pending on a yellow background, and Halt on a red background. The second field on the bottom line of the display indicates alarm status. If an alarm is present, the field will flash red and read Alarm. Finally, the Manual I/O OFF field indicates that the I/O board is not under manual control; if the I/O board is under manual control this field will turn red and indicate Manual I/O ON. This line of the display is visible on ALL tabs of the local display.
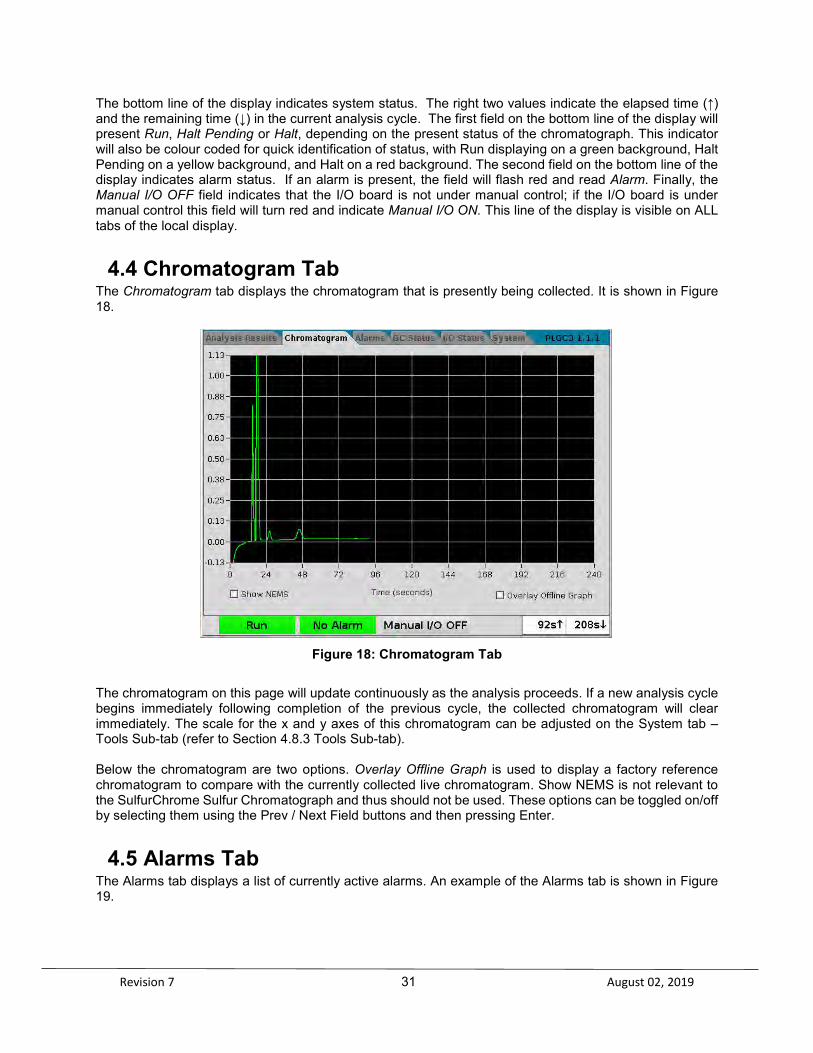
4.4 Chromatogram Tab The Chromatogram tab displays the chromatogram that is presently being collected. It is shown in Figure 18.
Figure 18: Chromatogram Tab
The chromatogram on this page will update continuously as the analysis proceeds. If a new analysis cycle begins immediately following completion of the previous cycle, the collected chromatogram will clear immediately. The scale for the x and y axes of this chromatogram can be adjusted on the System tab – Tools Sub-tab (refer to Section 4.8.3 Tools Sub-tab). Below the chromatogram are two options. Overlay Offline Graph is used to display a factory reference chromatogram to compare with the currently collected live chromatogram. Show NEMS is not relevant to the SulfurChrome Sulfur Chromatograph and thus should not be used. These options can be toggled on/off by selecting them using the Prev / Next Field buttons and then pressing Enter.
4.5 Alarms Tab The Alarms tab displays a list of currently active alarms. An example of the Alarms tab is shown in Figure 19.

Revision 7 32 August 02, 2019
Figure 19: Alarms Tab
Alarms will remain listed on the Alarms tab until condition that caused the alarm to be triggered is cleared. The alarms list indicates the source of the alarm, a description of the specific alarm, and the time at which the alarm was triggered.
4.6 GC Status Tab The GC Status tab, shown in Figure 20, indicates the instantaneous status of several key parameters related to the analyzer’s operation.
Figure 20: GC Status Tab

Revision 7 33 August 02, 2019
The values in these fields are read-only and cannot be edited. The parameters shown here include the current stream being analyzed, the elapsed / remaining time in the analysis cycle, the chromatography oven and reaction furnace temperatures, the reaction cell vacuum pressure, and parameters related to the detector / photomultiplier tube.
4.7 I/O Status Tab The I/O Status tab, shown in Figure 21, is used to indicate the present status of the Digital Inputs, Relays, Valves and Solenoids
Figure 21: I/O Status Tab
A green background indicates that the device is currently turned on while a grey background indicates that it is turned off. The information on the I/O Status tab cannot be edited using the keypad controller. If the Averaged Values check box is selected, the displayed analog output and input values are averaged over a period defined internal to the analyzer. If the Default Names check box is selected, the names for the analog inputs and outputs will be the names assigned during manufacturing, rather than names entered into the GUI software.
4.8 System Tab The System tab is divided into 3 sub tabs.
4.8.1Info Sub-tab The Info sub-tab, shown in Figure 22, presents information that may be useful when you are requesting assistance from Galvanic Applied Sciences. This information cannot be edited using the keypad controller.

Revision 7 34 August 02, 2019
Figure 22: Info Sub-Tab
The information on this sub-tab relates to the analyzer identification, as well as hardware related parameters that may be useful in the event that technical support is required.
4.8.2 Network Sub-tab The Network sub tab, shown in Figure 23, contains parameters that are used to establish communication between the analyzer and either a local PC or a remote PC over a local area network.
Figure 23: Network Sub-Tab
For more information on how to use the information contained on this sub-tab to establish communication between the analyzer and a computer, please refer to section 5.3.
Revision 7 35 August 02, 2019
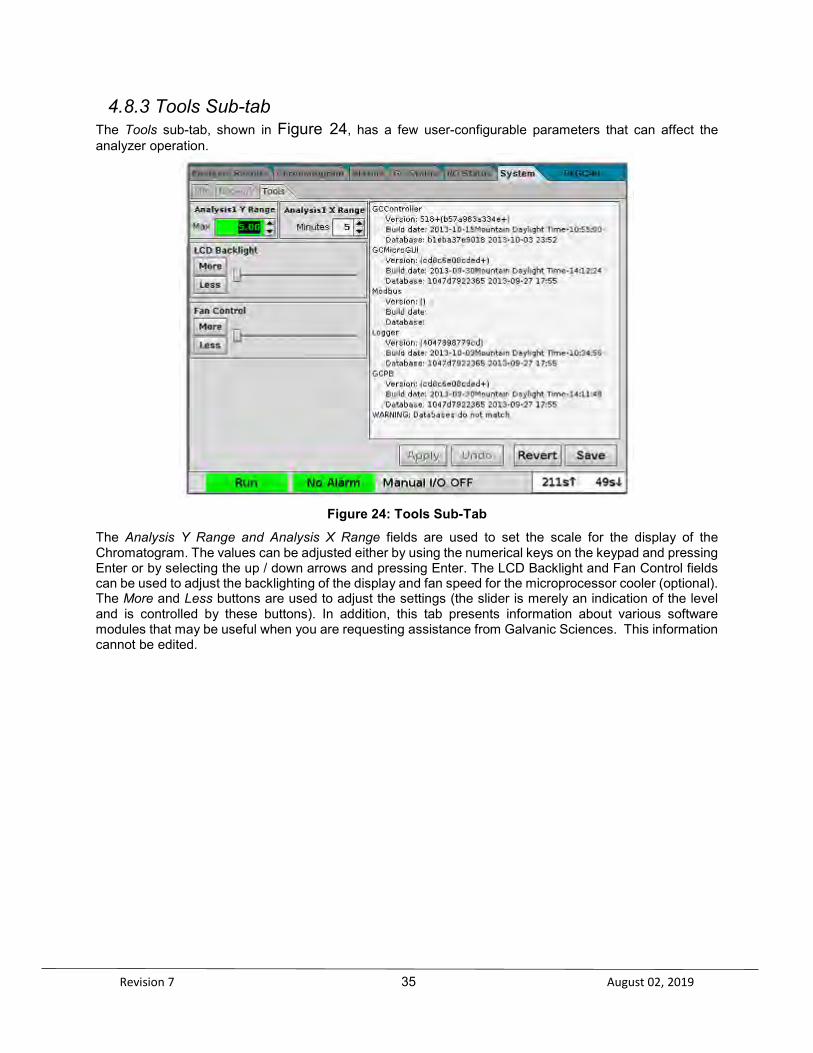
4.8.3 Tools Sub-tab The Tools sub-tab, shown in Figure 24, has a few user-configurable parameters that can affect the analyzer operation.
Figure 24: Tools Sub-Tab
The Analysis Y Range and Analysis X Range fields are used to set the scale for the display of the Chromatogram. The values can be adjusted either by using the numerical keys on the keypad and pressing Enter or by selecting the up / down arrows and pressing Enter. The LCD Backlight and Fan Control fields can be used to adjust the backlighting of the display and fan speed for the microprocessor cooler (optional). The More and Less buttons are used to adjust the settings (the slider is merely an indication of the level and is controlled by these buttons). In addition, this tab presents information about various software modules that may be useful when you are requesting assistance from Galvanic Sciences. This information cannot be edited.

Revision 7 36 August 02, 2019
Section 5: AccuChrome GUI Software Operation
5.1 AccuChrome GUI Software Introduction The AccuChrome graphical user interface software (GUI) on the computer is designed to view and edit the SulfurChrome Sulfur Chromatograph configuration (which describes the overall operation of the system), collect and process chromatographic data, generate reports, and archive data.
5.2 Interfacing the Chromatograph to the Computer Before the AccuChrome software can be used, the SulfurChrome analyzer must be connected to the PC with the AccuChrome software installed. A PC can be connected to the SulfurChrome analyzer either directly using an Ethernet cable or remotely via a local area network (LAN).
5.2.1 Direct Connection To connect the SulfurChrome analyzer to the local PC, a regular Ethernet (CAT5) cable can be used. Follow the procedure below.
1. Connect the CAT5 cable from the ethernet port on the computer to the ethernet port on the
back side of the Controller/Display board assembly. Refer to Figure 10, page 21. 2. Access the System tab, Network sub-tab on the display on the chromatograph using the Next
Panel key on the keypad controller. Refer to Figure 23, page 34. 3. Make note of the IP Address in the Direct Connect box – this will be the IP address used to
connect to the analyzer. 4. Ensure that the Status field in the Direct Connect box reads Active – this will indicate that the
cable connecting the analyzer to the computer is correctly connected.
5.2.2 Remote Connection via LAN To connect the SulfurChrome analyzer to a remote computer via a local area network, follow the procedure below.
1. Connect the CAT5 cable from the ethernet port on the back side of the Controller/Display board assembly to the local area network hardware (switch, router, etc). Refer to Figure 10, page 21.
2. If the local area network assigns IP addresses to all connected devices via DHCP, use the Next / Previous Field buttons to select DHCP and press Enter. An IP address will be assigned to the analyzer.
3. If the local area network requires manual input of address parameters, enter the correct parameters into the IP Address, Netmask, and Gateway fields using the numerical keys.
4. When finished entering the address parameters, select Apply and press Enter. 5. Make sure that the Status field in the Network box reads Active – this will indicate that the
analyzer is correctly connected into the local area network. 6. Access the System tab, Network sub-tab on the display on the chromatograph using the Next
Panel key on the keypad controller. Refer to Figure 23, page 34. 7. Make note of the IP Address in the Direct Connect box – this will be the IP address used to
connect to the analyzer. 8. Ensure that the Status field in the Direct Connect box reads Active – this will indicate that the
cable connecting the analyzer to the computer is correctly connected.
Revision 7 37 August 02, 2019
5.3 Connecting to the SulfurChrome using the AccuChrome GUI Software
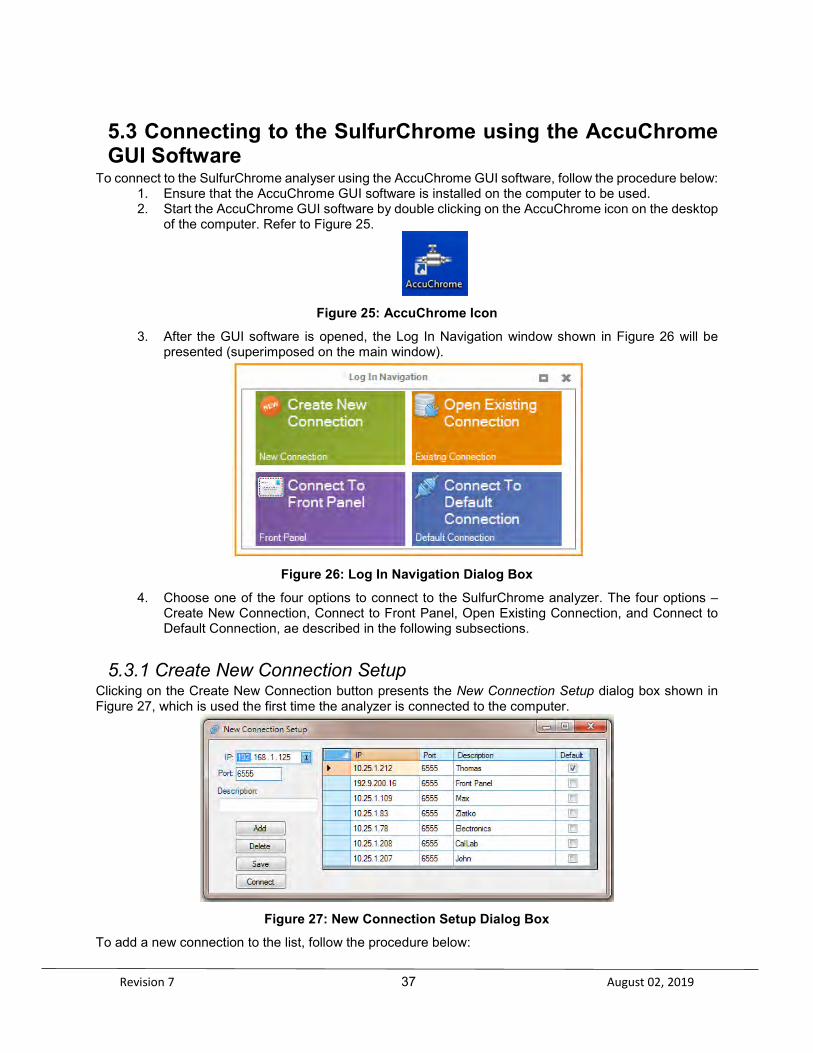
To connect to the SulfurChrome analyser using the AccuChrome GUI software, follow the procedure below: 1. Ensure that the AccuChrome GUI software is installed on the computer to be used. 2. Start the AccuChrome GUI software by double clicking on the AccuChrome icon on the desktop
of the computer. Refer to Figure 25.
Figure 25: AccuChrome Icon
3. After the GUI software is opened, the Log In Navigation window shown in Figure 26 will be presented (superimposed on the main window).
Figure 26: Log In Navigation Dialog Box
4. Choose one of the four options to connect to the SulfurChrome analyzer. The four options – Create New Connection, Connect to Front Panel, Open Existing Connection, and Connect to Default Connection, ae described in the following subsections.
5.3.1 Create New Connection Setup Clicking on the Create New Connection button presents the New Connection Setup dialog box shown in Figure 27, which is used the first time the analyzer is connected to the computer.
Figure 27: New Connection Setup Dialog Box
To add a new connection to the list, follow the procedure below:
Revision 7 38 August 02, 2019
1. Enter the IP address into the IP field. The IP address entered here must match the IP address given in the Network Sub-Tab on the analyzer’s display (refer to Figure 23).
2. Ensure that the port is set to 6555. 3. Enter the name for of the system in the Description field. 4. Press the Add button, then press the Save button. The information will appear in the table. 5. Move the to the appropriate IP and place a check mark in the default field for that IP. 6. Press Connect.
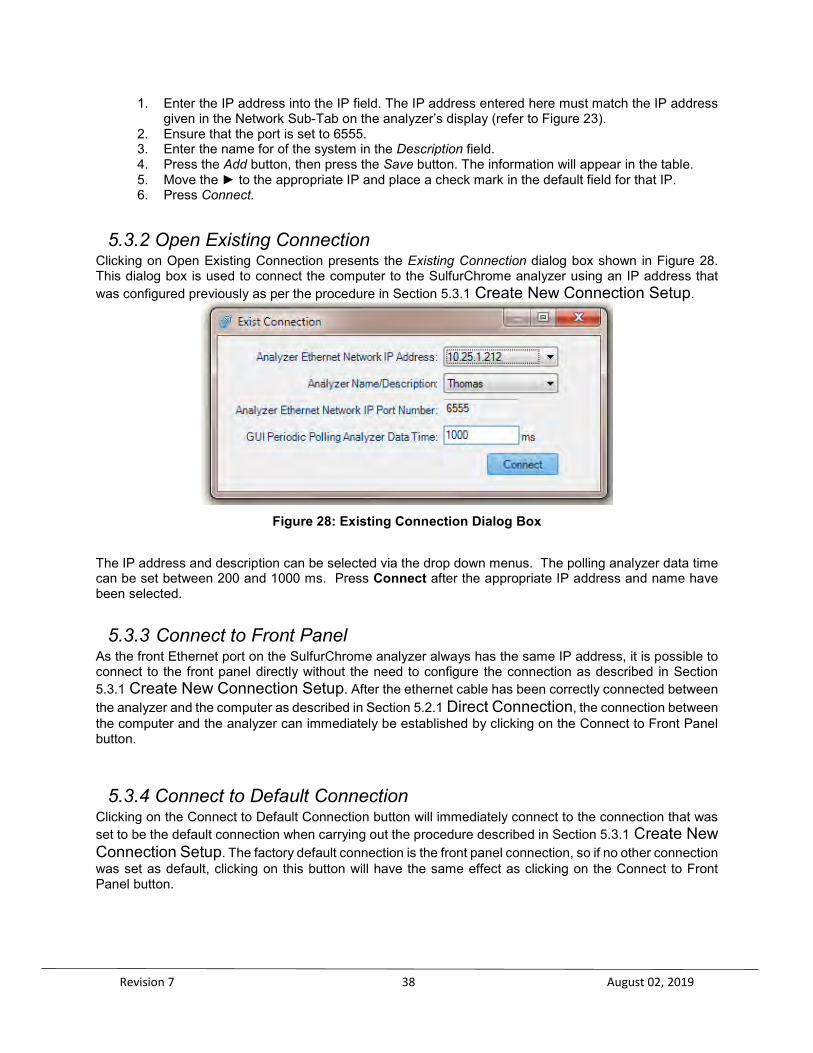
5.3.2 Open Existing Connection Clicking on Open Existing Connection presents the Existing Connection dialog box shown in Figure 28. This dialog box is used to connect the computer to the SulfurChrome analyzer using an IP address that was configured previously as per the procedure in Section 5.3.1 Create New Connection Setup.
Figure 28: Existing Connection Dialog Box
The IP address and description can be selected via the drop down menus. The polling analyzer data time can be set between 200 and 1000 ms. Press Connect after the appropriate IP address and name have been selected.
5.3.3 Connect to Front Panel As the front Ethernet port on the SulfurChrome analyzer always has the same IP address, it is possible to connect to the front panel directly without the need to configure the connection as described in Section 5.3.1 Create New Connection Setup. After the ethernet cable has been correctly connected between the analyzer and the computer as described in Section 5.2.1 Direct Connection, the connection between the computer and the analyzer can immediately be established by clicking on the Connect to Front Panel button.
5.3.4 Connect to Default Connection Clicking on the Connect to Default Connection button will immediately connect to the connection that was set to be the default connection when carrying out the procedure described in Section 5.3.1 Create New Connection Setup. The factory default connection is the front panel connection, so if no other connection was set as default, clicking on this button will have the same effect as clicking on the Connect to Front Panel button.
Revision 7 39 August 02, 2019
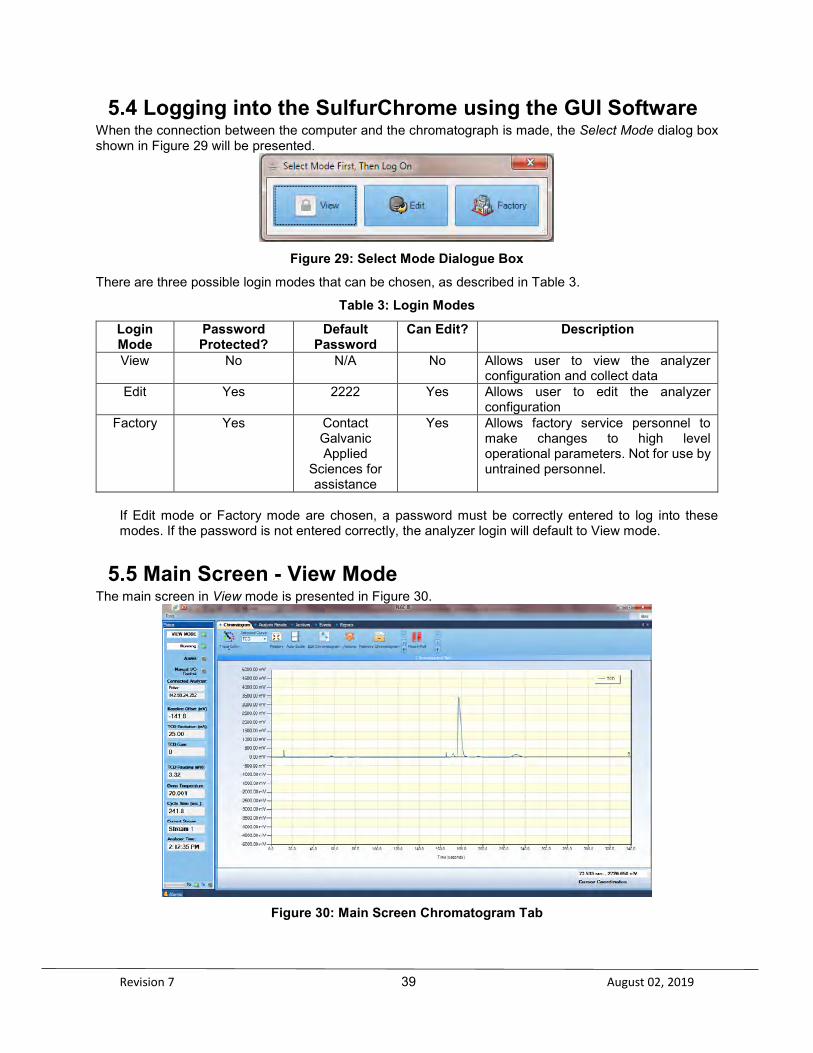
5.4 Logging into the SulfurChrome using the GUI Software When the connection between the computer and the chromatograph is made, the Select Mode dialog box shown in Figure 29 will be presented.
Figure 29: Select Mode Dialogue Box
There are three possible login modes that can be chosen, as described in Table 3.
Table 3: Login Modes
Login Mode
Password Protected?
Default Password
Can Edit? Description
View No N/A No Allows user to view the analyzer configuration and collect data
Edit Yes 2222 Yes Allows user to edit the analyzer configuration
Factory Yes Contact Galvanic Applied
Sciences for assistance
Yes Allows factory service personnel to make changes to high level operational parameters. Not for use by untrained personnel.
If Edit mode or Factory mode are chosen, a password must be correctly entered to log into these modes. If the password is not entered correctly, the analyzer login will default to View mode.
5.5 Main Screen - View Mode The main screen in View mode is presented in Figure 30.
Figure 30: Main Screen Chromatogram Tab

Revision 7 40 August 02, 2019
The main screen of the AccuChrome GUI software consists of a number of different regions with different purposes – the Quick Access Toolbar, the Tools menu, the system parameters Status fields, the Alarms tab, and the main information tabs.
5.5.1 Quick Access Toolbar The Quick Access Toolbar, shown in Figure 31, is located at the top left corner of the AccuChrome GUI software window, and consists of three buttons that are used for a variety of purposes.
Figure 31: Quick AccessToolbar
The functions of the three buttons in the Quick Access Toolbar are given in Table 4.
Table 4: Quick Access Toolbar buttons
Button Function Description
Menu
Access a menu that includes the standard Windows commands Restore, Move, Size, Maximize, Minimize, and Close.
Connect / Disconnect
- If connection to the analyzer has not been established, opens the Log In Navigation Dialog Box (Figure 26) - If connection to the analyzer has been established, disconnects the connection between the PC and the analyzer.
Run / Halt
- If an analysis is progress, prompts the analyzer to Halt at the end of the current analysis (status indicators on analyzer screen / in GUI will change from Run to Halt Pending) - If analyzer is halted, immediately initiates an analysis.
5.5.2 Toolbar The Tools button immediately below the Quick Access Toolbar presents the Toolbar as shown in Figure 32.
Figure 32: The Ribbon
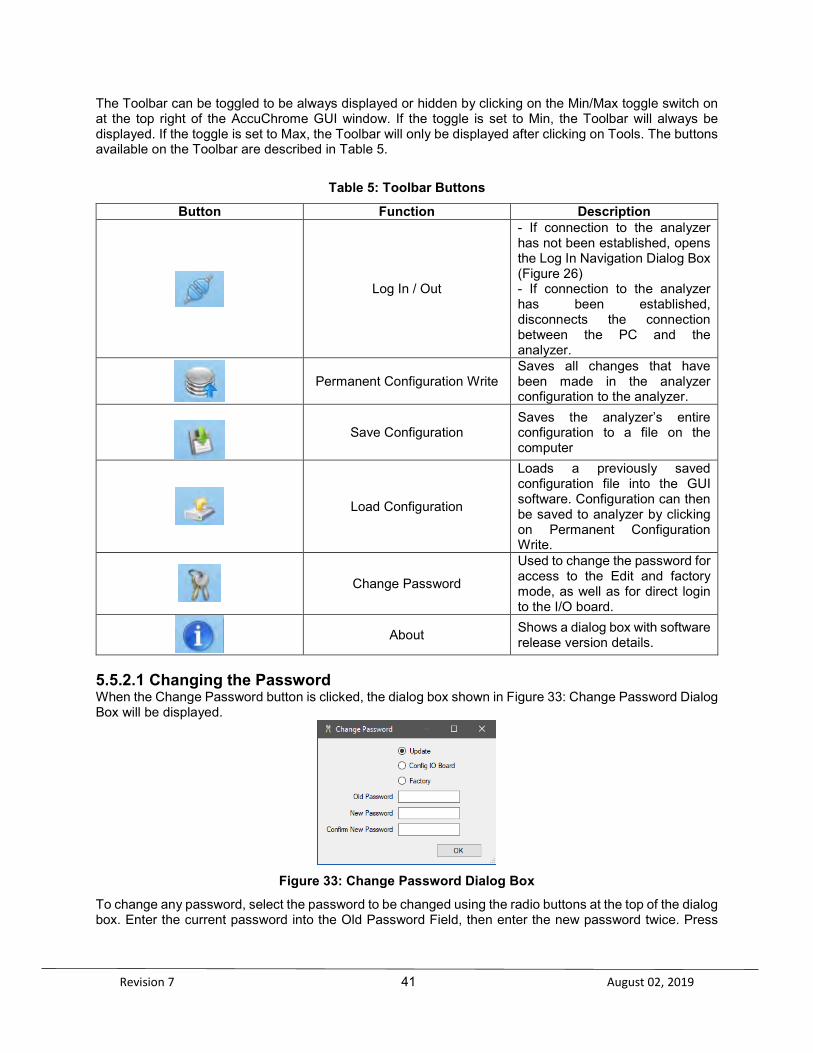
Revision 7 41 August 02, 2019
The Toolbar can be toggled to be always displayed or hidden by clicking on the Min/Max toggle switch on at the top right of the AccuChrome GUI window. If the toggle is set to Min, the Toolbar will always be displayed. If the toggle is set to Max, the Toolbar will only be displayed after clicking on Tools. The buttons available on the Toolbar are described in Table 5.
Table 5: Toolbar Buttons
Button Function Description
Log In / Out
- If connection to the analyzer has not been established, opens the Log In Navigation Dialog Box (Figure 26) - If connection to the analyzer has been established, disconnects the connection between the PC and the analyzer.
Permanent Configuration Write
Saves all changes that have been made in the analyzer configuration to the analyzer.
Save Configuration Saves the analyzer’s entire configuration to a file on the computer
Load Configuration
Loads a previously saved configuration file into the GUI software. Configuration can then be saved to analyzer by clicking on Permanent Configuration Write.
Change Password
Used to change the password for access to the Edit and factory mode, as well as for direct login to the I/O board.
About Shows a dialog box with software
release version details. 5.5.2.1 Changing the Password When the Change Password button is clicked, the dialog box shown in Figure 33: Change Password Dialog Box will be displayed.
Figure 33: Change Password Dialog Box
To change any password, select the password to be changed using the radio buttons at the top of the dialog box. Enter the current password into the Old Password Field, then enter the new password twice. Press

Revision 7 42 August 02, 2019
OK to confirm. If the current password is not entered correctly, or if the two new passwords do not match, the password will not be changed. 5.5.2.2 About When the About button is clicked, the dialog box shown in Figure 34 will be displayed.
Figure 34: About Dialog Box
The version number and release ID are useful for troubleshooting purposes and should be provided to Galvanic Applied Sciences in the event of requiring assistance with the software.
5.5.3 System Operating Parameters The left column of the window presents the status of the system and a variety of operating parameters, as shown in Figure 35. These fields are updated once per second and cannot be edited by the operator. The displayed parameters are as follows: • The first field indicates the GUI connection status: OFFLINE, READ ONLY or UPDATE. • The second field indicates the status of the chromatograph: RUNNING, HALT or HALT
PENDING. • The Alarms LED indicates any system or analysis alarms. • The Manual I/O Control LED indicates if the analyzer has manually been placed under
manual control by the user. This function would normally be used for troubleshooting purposes. If the I/O is under manual control, the analyzer cannot carry out any automated functions.
• The Connected Analyzer fields identify the analyzer that is connected to the GUI Software First field indicates the IP address description. Second Field indicates the IP address of the SulfurChrome on the LAN.
• The Baseline Offset (mV) is an indication of the detector offset that is required for the chromatogram baseline to be at or close to zero
• The TCD Excitation (mA) field is not relevant to the SulfurChrome Sulfur Chromatograph. This field will have a value of zero.
• The TCD Gain is a multiplication factor used to manipulate the peak height of each distinct component in the gas stream on the chromatogram.
• The TCD Reading (mV) is the raw mV signal being output from the analyzer detector. • The Oven Temperature is the live temperature reading in the chromatograph oven
enclosure, in degrees Celsius (°C) • The Cycle Time (sec.) is the amount of time, in seconds, passed since the start of the
current analysis • The Current Stream is the stream that is currently being analyzed. • The Analyzer Time is the clock time that is used for all time-stamped logs (archives, etc)
that are produced by the analyzer. A green stripe at the bottom of this region indicates that data is being transferred. If the SulfurChrome analyzer is transmitting data to the computer, the Rx indicator will be green. If the computer is transmitting data to the SulfurChrome analyzer, the Tx indicator will be green.
Figure 35: Status Parameters
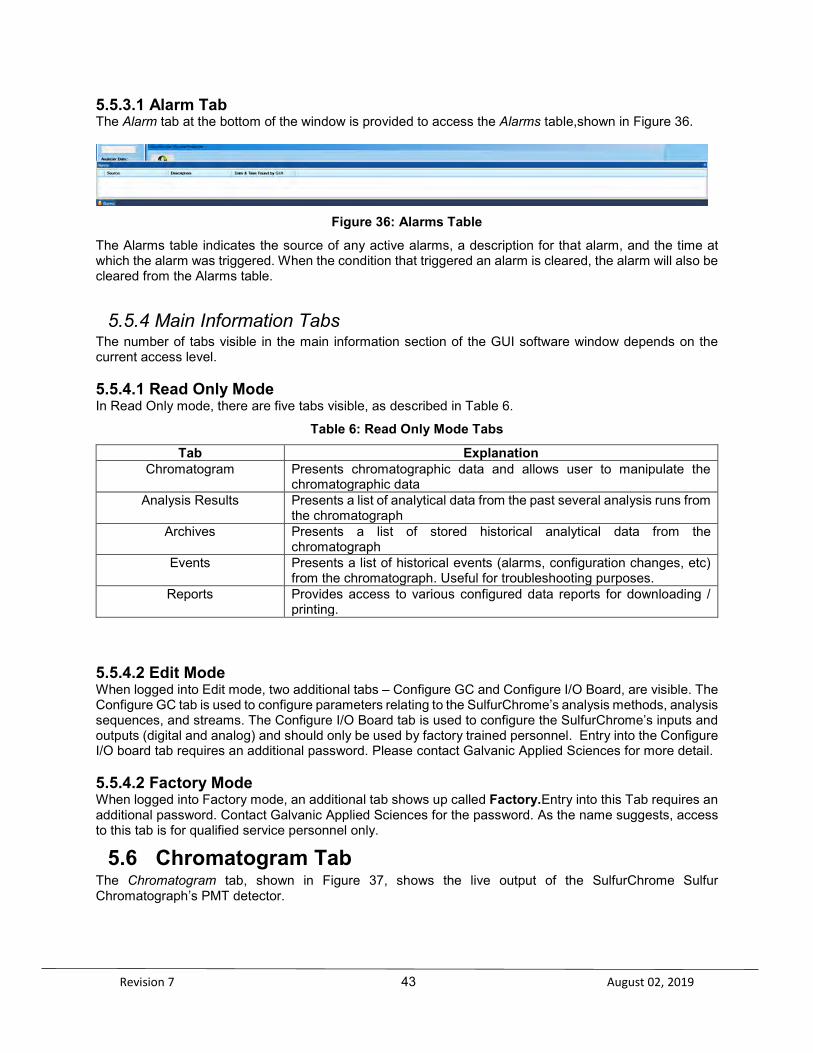
Revision 7 43 August 02, 2019
5.5.3.1 Alarm Tab The Alarm tab at the bottom of the window is provided to access the Alarms table,shown in Figure 36.
Figure 36: Alarms Table
The Alarms table indicates the source of any active alarms, a description for that alarm, and the time at which the alarm was triggered. When the condition that triggered an alarm is cleared, the alarm will also be cleared from the Alarms table.
5.5.4 Main Information Tabs The number of tabs visible in the main information section of the GUI software window depends on the current access level. 5.5.4.1 Read Only Mode In Read Only mode, there are five tabs visible, as described in Table 6.
Table 6: Read Only Mode Tabs
Tab Explanation Chromatogram Presents chromatographic data and allows user to manipulate the
chromatographic data Analysis Results Presents a list of analytical data from the past several analysis runs from
the chromatograph Archives Presents a list of stored historical analytical data from the
chromatograph Events Presents a list of historical events (alarms, configuration changes, etc)
from the chromatograph. Useful for troubleshooting purposes. Reports Provides access to various configured data reports for downloading /
printing.
5.5.4.2 Edit Mode When logged into Edit mode, two additional tabs – Configure GC and Configure I/O Board, are visible. The Configure GC tab is used to configure parameters relating to the SulfurChrome’s analysis methods, analysis sequences, and streams. The Configure I/O Board tab is used to configure the SulfurChrome’s inputs and outputs (digital and analog) and should only be used by factory trained personnel. Entry into the Configure I/O board tab requires an additional password. Please contact Galvanic Applied Sciences for more detail.
5.5.4.2 Factory Mode When logged into Factory mode, an additional tab shows up called Factory.Entry into this Tab requires an additional password. Contact Galvanic Applied Sciences for the password. As the name suggests, access to this tab is for qualified service personnel only.
5.6 Chromatogram Tab The Chromatogram tab, shown in Figure 37, shows the live output of the SulfurChrome Sulfur Chromatograph’s PMT detector.
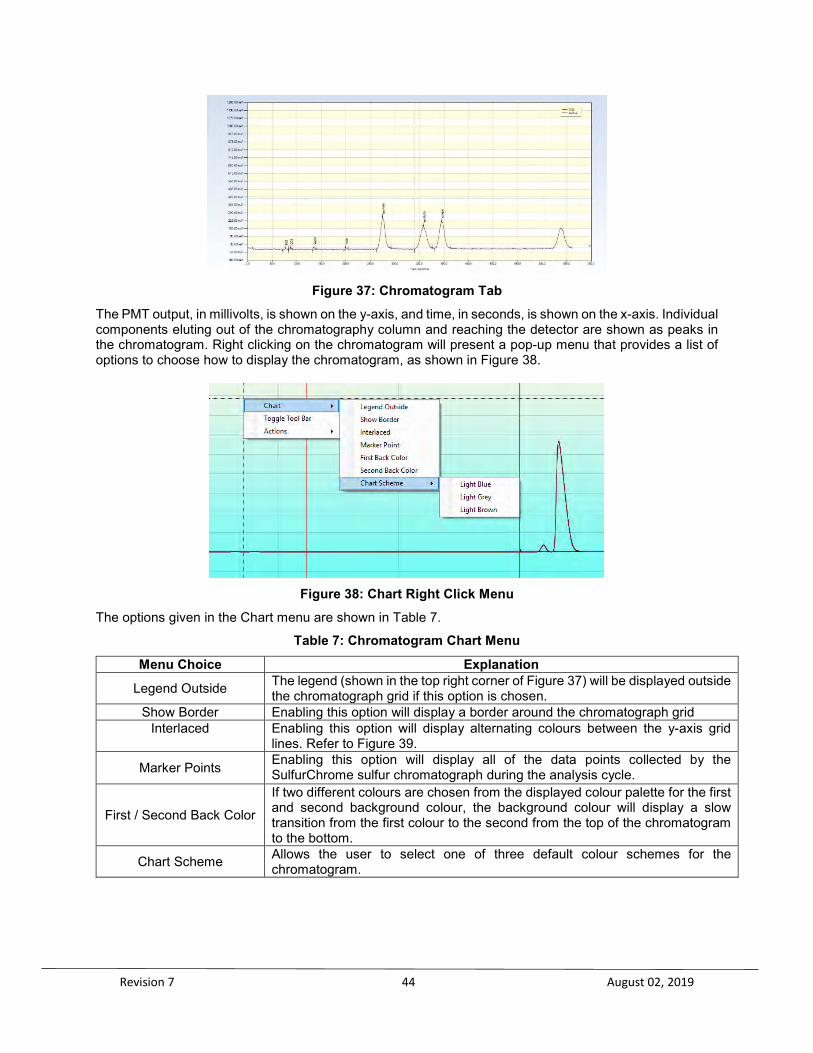
Revision 7 44 August 02, 2019
Figure 37: Chromatogram Tab
The PMT output, in millivolts, is shown on the y-axis, and time, in seconds, is shown on the x-axis. Individual components eluting out of the chromatography column and reaching the detector are shown as peaks in the chromatogram. Right clicking on the chromatogram will present a pop-up menu that provides a list of options to choose how to display the chromatogram, as shown in Figure 38.
Figure 38: Chart Right Click Menu
The options given in the Chart menu are shown in Table 7.
Table 7: Chromatogram Chart Menu
Menu Choice Explanation
Legend Outside The legend (shown in the top right corner of Figure 37) will be displayed outside the chromatograph grid if this option is chosen.
Show Border Enabling this option will display a border around the chromatograph grid Interlaced Enabling this option will display alternating colours between the y-axis grid
lines. Refer to Figure 39.
Marker Points Enabling this option will display all of the data points collected by the SulfurChrome sulfur chromatograph during the analysis cycle.
First / Second Back Color
If two different colours are chosen from the displayed colour palette for the first and second background colour, the background colour will display a slow transition from the first colour to the second from the top of the chromatogram to the bottom.
Chart Scheme Allows the user to select one of three default colour schemes for the chromatogram.

Revision 7 45 August 02, 2019
Figure 39: Interlaced Chromatogram Display (With Border)
There are two other options in the pop up menu that appears when right-clicking on the chromatogram. The ‘Toggle Tool Bar’ option turns the Ribbon Bar described in Section 5.6.1 Chromatogram Tab Ribbon Bar on or off. The Actions menu is described in Section 5.6.1.5.
5.6.1 Chromatogram Tab Ribbon Bar The Ribbon Bar on the chromatogram tab, shown in Figure 40, provides access to a number of commands to present the chromatogram as desired.
Figure 40: Chromatogram Tab Ribbon Bar
5.6.1.1 Trace Color The Trace Color command presents a palette of colours as shown in Figure 41.
Figure 41: Trace Color Palette
To select the desired colour for the detector trace (i.e. the chromatogram), move the cursor to that colour and press the left mouse button. This function is a standard Windows feature. 5.6.1.2 Selected Curve If two or more chromatograms are presented on the same display, the Selected Curve drop down menu can be used to select the currently active chromatogram. Clicking on the arrow will present a list of the
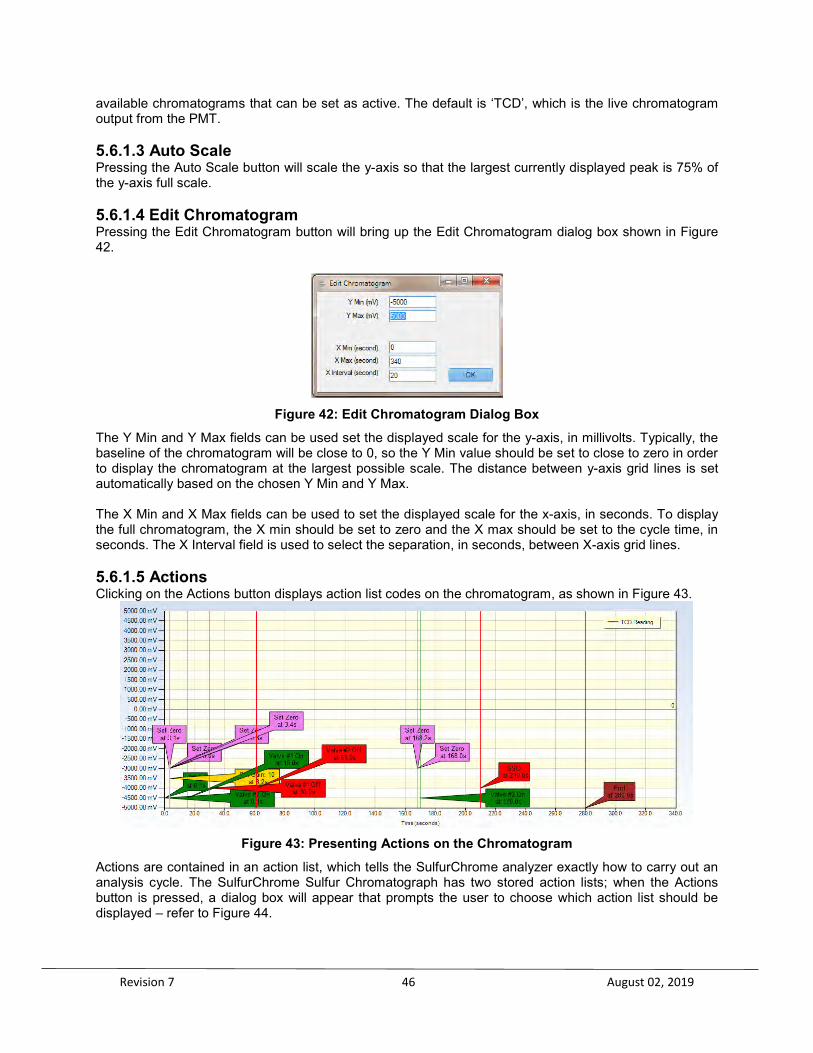
Revision 7 46 August 02, 2019
available chromatograms that can be set as active. The default is ‘TCD’, which is the live chromatogram output from the PMT. 5.6.1.3 Auto Scale Pressing the Auto Scale button will scale the y-axis so that the largest currently displayed peak is 75% of the y-axis full scale. 5.6.1.4 Edit Chromatogram Pressing the Edit Chromatogram button will bring up the Edit Chromatogram dialog box shown in Figure 42.
Figure 42: Edit Chromatogram Dialog Box
The Y Min and Y Max fields can be used set the displayed scale for the y-axis, in millivolts. Typically, the baseline of the chromatogram will be close to 0, so the Y Min value should be set to close to zero in order to display the chromatogram at the largest possible scale. The distance between y-axis grid lines is set automatically based on the chosen Y Min and Y Max. The X Min and X Max fields can be used to set the displayed scale for the x-axis, in seconds. To display the full chromatogram, the X min should be set to zero and the X max should be set to the cycle time, in seconds. The X Interval field is used to select the separation, in seconds, between X-axis grid lines. 5.6.1.5 Actions Clicking on the Actions button displays action list codes on the chromatogram, as shown in Figure 43.
Figure 43: Presenting Actions on the Chromatogram
Actions are contained in an action list, which tells the SulfurChrome analyzer exactly how to carry out an analysis cycle. The SulfurChrome Sulfur Chromatograph has two stored action lists; when the Actions button is pressed, a dialog box will appear that prompts the user to choose which action list should be displayed – refer to Figure 44.

Revision 7 47 August 02, 2019
Figure 44: Action list choice
The displayed action list codes can be edited in one of two ways. Right clicking on the action list code label will allow the user to edit the timing and action type. Placing the cursor over the action list code label or action list code line will allow the use to left click and drag to reposition the action list code. The active action list can also be edited from the right click menu Actions sub-menu, shown in Figure 45.
Figure 45: Actions sub-menu
There are four options available in the Actions sub-menu if an action list code label / line are right-clicked. If the right click is made somewhere else in the chromatogram grid, only two of these options – Add Action and Save Actions are available. The options are described in Table 8.
Table 8: Actions Sub-Menu
Menu Option Explanation Add Action Allows user to add an additional action to the active action list. The Add
Action dialog box is shown in Figure 46: Add Action dialog box Delete Action Deletes the action list code that was right clicked
Edit Action Allows the user to edit the right clicked action list code Save Actions Saves changes to the active action list
Figure 46: Add Action dialog box (Valve Off)
In the Add Action dialog box, the user can select the action type (Valve on or off, Set Gain, Set Zero, End of Analysis) from the first drop down menu. For Valve On / Off, the valve to be turned on or off can be set

Revision 7 48 August 02, 2019
from the second drop down menu. For Set Gain, the gain can be set from the TCD Amplifier fields, shown in
Figure 47: Add Action Dialog box (Set Gain)
For all added actions, the time (in seconds) at which the action is to be executed should be placed into the Action Time field. When completed, press Add to add the action to the active action list. Press the X at the top right corner of the dialog box to exit without adding the action list action. For more information about action lists and action list codes, please refer to section 5.11.3.
5.6.1.6 Components Clicking on the Components button will bring up dialog box shown in Figure 48: Component Table Selection which allows the user to select which of the SulfurChrome Sulfur Chromatograph’s two component tables should be displayed.
Figure 48: Component Table Selection
Once the component table is selected, the peak integration data based on the selected component table will be displayed below the chromatogram, as shown in Figure 49.
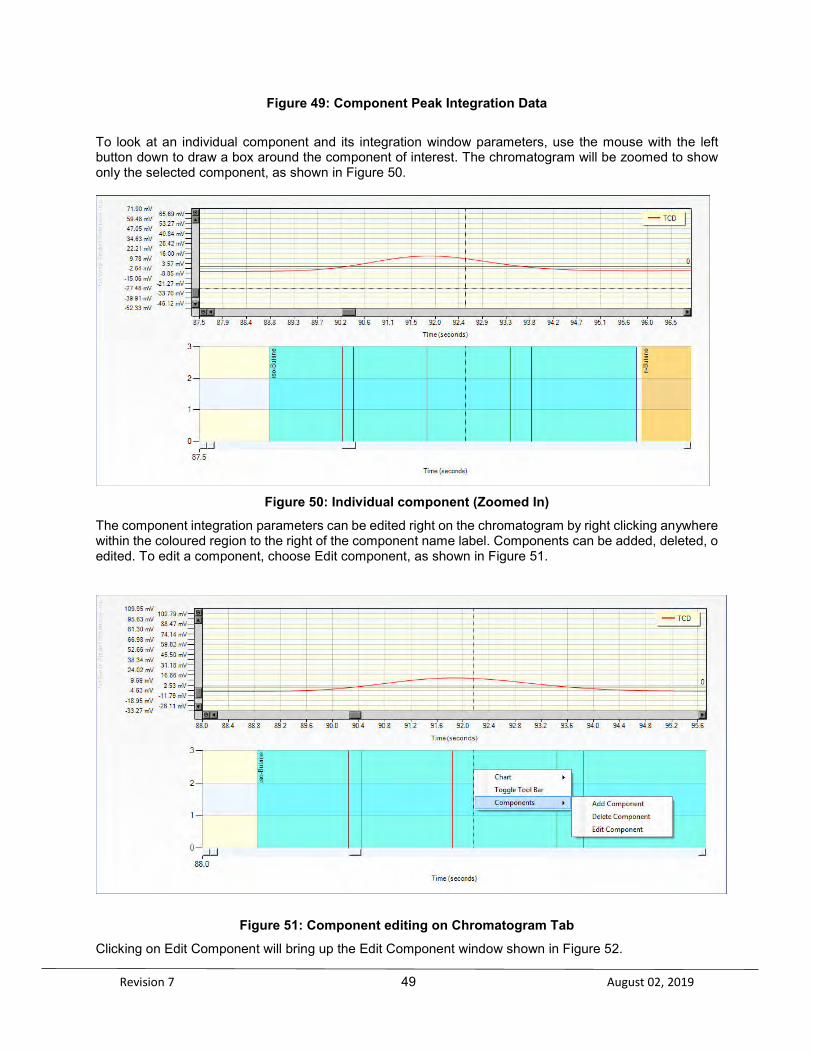
Revision 7 49 August 02, 2019
Figure 49: Component Peak Integration Data To look at an individual component and its integration window parameters, use the mouse with the left button down to draw a box around the component of interest. The chromatogram will be zoomed to show only the selected component, as shown in Figure 50.
Figure 50: Individual component (Zoomed In)
The component integration parameters can be edited right on the chromatogram by right clicking anywhere within the coloured region to the right of the component name label. Components can be added, deleted, o edited. To edit a component, choose Edit component, as shown in Figure 51.
Figure 51: Component editing on Chromatogram Tab Clicking on Edit Component will bring up the Edit Component window shown in Figure 52.

Revision 7 50 August 02, 2019
Figure 52: Component edit window accessed on the chromatogram Tab
For more information about component tables and editing individual components, refer to Section 5.11.2. 5.6.1.7 Chromatogram Functions The icon and arrows directly to the right of the Action icon are used to access a variety of chromatogram-related functions. The selection of the desired function can be performed by pressing the up or down arrows to the left of the icon. As an alternative, all the icons can be viewed simultaneously by pressing the bottom arrow, as shown in Figure 53.

Revision 7 51 August 02, 2019
Figure 53: Chromatogram Functions The available Chromatogram Functions are shown in Table 9.
Table 9: Chromatogram Functions
Button Title Explanation
Retrieve
Chromatogram
Presents a standard Windows Save dialog box to download and save chromatograms from the SulfurChrome analyzer to the connected PC in *.bin format.
Upload
Chromatogram
Presents a standard Windows Open dialog box to upload saved chromatograms in *.bin format to the SulfurChrome analyzer for analysis.
Analyze Chromatogram
Determines the concentration of the various components in the sample stream and calculates physical parameters based on the current analyzer configuration. See note below the table.
Show Analysis
Markers
Displays markers on the chromatogram that indicate the start and stop points for the integration of each peak, as well as the retention time for each peak
View
Chromatogram
Presents a standard Windows Open dialog box to select a locally saved chromatogram in *.bin format for viewing in the Chromatogram tab (chromatogram is NOT uploaded to the SulfurChrome analyzer and cannot be re-analyzed).
Factory
Chromatogram
Presents a standard Windows Save dialog box to allow for the downloading of a factory calibration chromatogram from the SulfurChrome analyzer in *.bin format.
Retrieving and uploading of chromatograms is normally done as part of the troubleshooting of the system. The user can change the parameters of the component table and determine what the results are with the revised component table values. These calculations are not archived or available for reports.
5.6.1.8 Chart Functions The icon at the extreme right of the ribbon bar is used to access a variety of functions directly related to the chromatogram being collected. The selection of the desired function can be performed by pressing the up or down arrows to the left of the icon. Pressing the bottom down arrow button will cause all chart functions to be displayed at once, as shown in Figure 54.
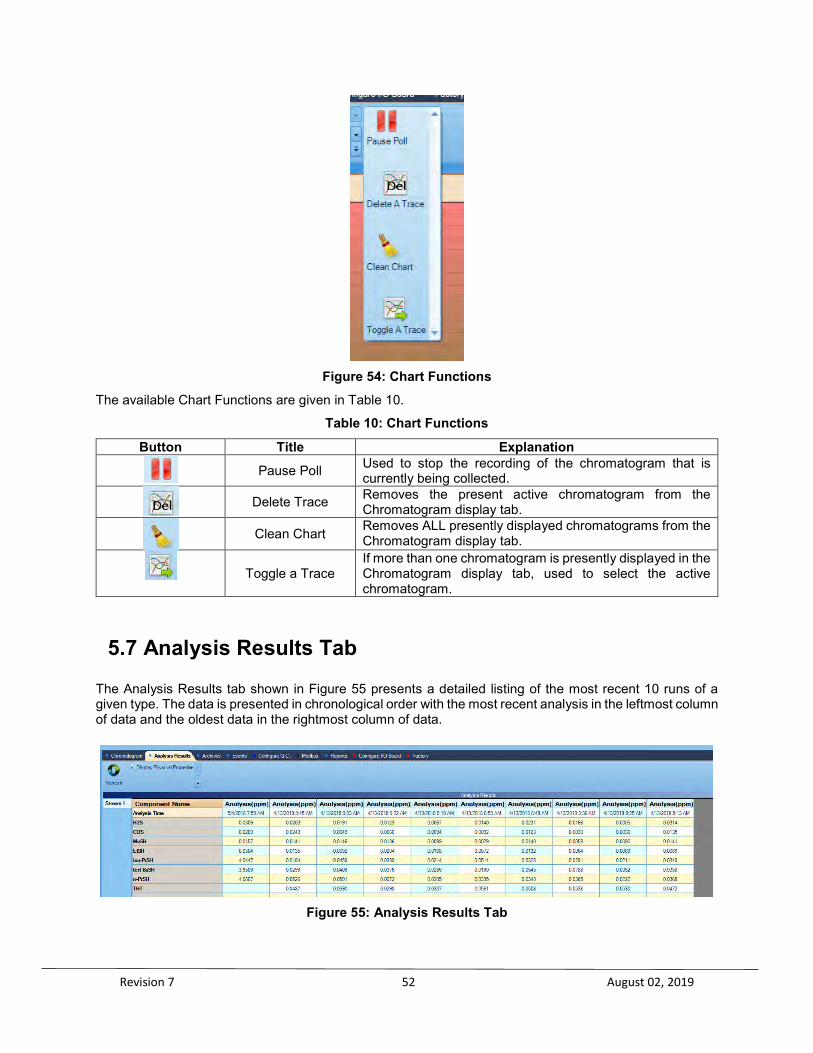
Revision 7 52 August 02, 2019
Figure 54: Chart Functions
The available Chart Functions are given in Table 10.
Table 10: Chart Functions
Button Title Explanation
Pause Poll Used to stop the recording of the chromatogram that is currently being collected.
Delete Trace Removes the present active chromatogram from the
Chromatogram display tab.
Clean Chart Removes ALL presently displayed chromatograms from the
Chromatogram display tab.
Toggle a Trace If more than one chromatogram is presently displayed in the Chromatogram display tab, used to select the active chromatogram.
5.7 Analysis Results Tab
The Analysis Results tab shown in Figure 55 presents a detailed listing of the most recent 10 runs of a given type. The data is presented in chronological order with the most recent analysis in the leftmost column of data and the oldest data in the rightmost column of data.
Figure 55: Analysis Results Tab

Revision 7 53 August 02, 2019
The left column presents a list of tabs indicating streams for which data is available. The Refresh icon is used to poll the analyzer to collect the most recent data for the currently displayed screen. The and arrows in the upper right corner are used to scroll the data. Note that these will only be shown if the size of the AccuChrome GUI window is not large enough to show all 10 runs worth of data. If the Display Physical Properties check box is selected, additional information as shown in Figure 56 will be presented.
Figure 56: Display of Physical Properties
If there is an error / alarm encountered in any of the results displayed on the Analysis Results tab, the Run Status field for that analysis run will be red and indicate Error. Clicking on the bell icon at the left of this field will bring up a pop up window explaining what the Error was. Refer to Section 5.7 for more details about the data shown in the Analysis Results tab.
5.8 Archive Tab The Archive tab, shown in Figure 57, is used to access and view archived data from the SulfurChrome Sulfur Gas Chromatograph’s on-board memory.
Figure 57: Archive Tab
Data is logged into the SulfurChrome’s on-board memory after each completed analysis, as well as on an hourly and daily basis. For each analysis cycle, the time at which the analysis was started (timestamp), the
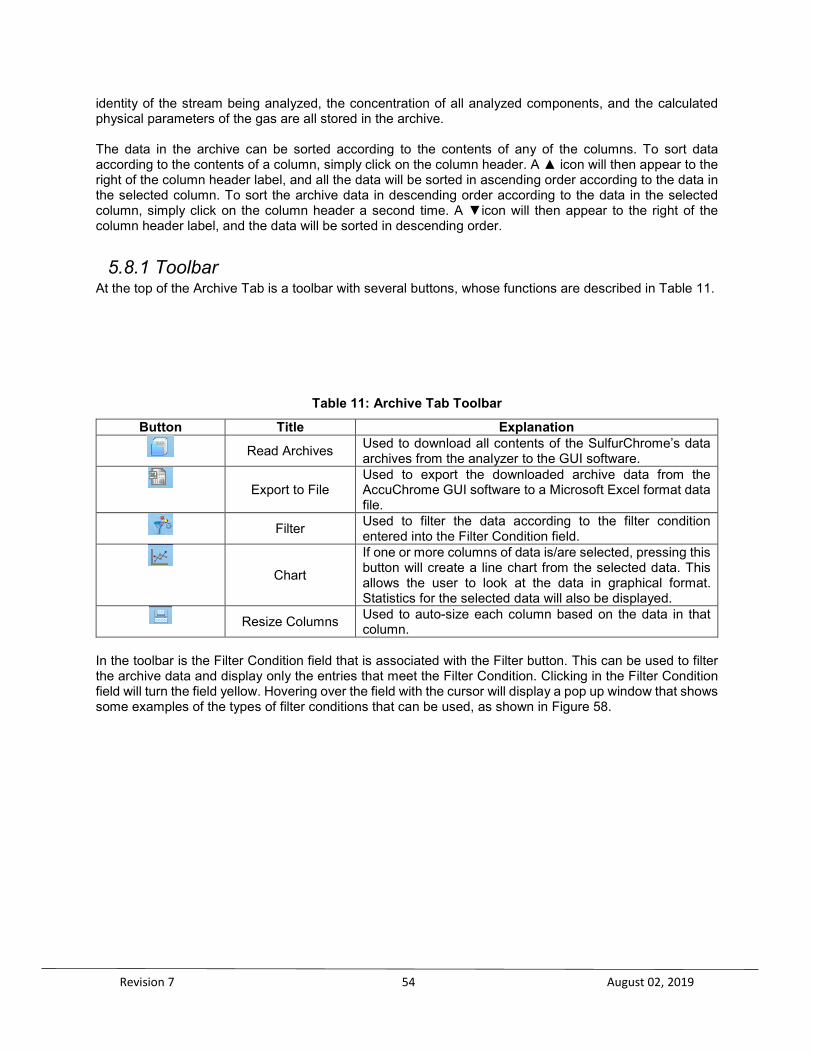
Revision 7 54 August 02, 2019
identity of the stream being analyzed, the concentration of all analyzed components, and the calculated physical parameters of the gas are all stored in the archive. The data in the archive can be sorted according to the contents of any of the columns. To sort data according to the contents of a column, simply click on the column header. A icon will then appear to the right of the column header label, and all the data will be sorted in ascending order according to the data in the selected column. To sort the archive data in descending order according to the data in the selected column, simply click on the column header a second time. A icon will then appear to the right of the column header label, and the data will be sorted in descending order.
5.8.1 Toolbar At the top of the Archive Tab is a toolbar with several buttons, whose functions are described in Table 11.
Table 11: Archive Tab Toolbar
Button Title Explanation
Read Archives Used to download all contents of the SulfurChrome’s data archives from the analyzer to the GUI software.
Export to File Used to export the downloaded archive data from the AccuChrome GUI software to a Microsoft Excel format data file.
Filter Used to filter the data according to the filter condition entered into the Filter Condition field.
Chart
If one or more columns of data is/are selected, pressing this button will create a line chart from the selected data. This allows the user to look at the data in graphical format. Statistics for the selected data will also be displayed.
Resize Columns Used to auto-size each column based on the data in that column.
In the toolbar is the Filter Condition field that is associated with the Filter button. This can be used to filter the archive data and display only the entries that meet the Filter Condition. Clicking in the Filter Condition field will turn the field yellow. Hovering over the field with the cursor will display a pop up window that shows some examples of the types of filter conditions that can be used, as shown in Figure 58.

Revision 7 55 August 02, 2019
Figure 58: Filter Condition Examples
If the filter condition is entered incorrectly, or an invalid filter condition is entered, a pop up box as shown in Figure 59 will appear when the Filter button is pressed; otherwise pressing the Filter button will cause the data to be filtered according to the filter condition.
Figure 59: Incorrect Filter Condition
After the data has been successfully filtered, to re-display all the data from the data archive simply uncheck the Filtered Records checkbox; after this checkbox is unchecked all data records will then be re-displayed.
5.8.2 Periodic Trend Data The Hourly Trend tab on the bottom of the screen is used to present a table that is similar to Figure 57. At the top of each hour (e.g. 7:00AM, 8:00AM, 9:00AM, etc), the analyzer will store data similar to that stored in the Run Data tab after each complete analysis cycle. In addition, the analyzer will also calculate hourly statistics for each component and calculated parameter, including the hourly minimum, hourly maximum, and hourly mean (average). The Daily Trend data is similar to the Hourly Trend, except that the data is collected daily at a specified hour and the statistics are calculated on a daily basis. The time at which the data is collected on a daily basis can be specified in the Configure GC tab – Stream Sequencer section of the AccuChrome GUI software. Please refer to section 5.11.5 for more information.
5.9 Events Tab The Events tab, shown in Figure 60, displays a list of all events that have occurred in the SulfurChrome analyzer’s operation life time.

Revision 7 56 August 02, 2019
Figure 60: Events Tab
Events can include configuration changes, alarms becoming active, alarms being cleared, calibrations, and many other possibilities. The events are listed in the Event Log according to the time at which the event occurred. Every time any kind of event takes place, a full event log record is recorded in the analyzer’s memory. The event log is useful as a troubleshooting tool. The Event Log can be downloaded from the analyzer’s memory by pressing the Read Events button, and the data can be exported to a Microsoft Excel format file by pressing the Export to File button.

Revision 7 57 August 02, 2019
5.10 Reports Tab The Reports tab shown in Figure 61 is used to generate various data reports for saving to the local computer and/or printing to a connected printer.
Figure 61: Reports Tab
At the top of the page are three options that can be enabled by placing a checkmark in the checkbox. The options are listed in Table 12.
Table 12: Report Options
Report Option Explanation
Output to Printer If this option is selected, the chosen report will automatically be sent to the computer’s default printer for printing.
Output to PDF File If this option is selected, the chosen report will be saved to a PDF file. The user has the ability to choose the destination folder and the file name for the PDF file.
Open File After Saving PDF File If this option is selected, the saved PDF file will automatically open in the computer’s default PDF file viewer program after being saved.
There are five types of reports available. The different report types are described in Table 13.
Table 13: Report Types
Report Type Explanation
Analysis Report
Shows the results of the last stream analysis for a given stream. Refer to Figure 62 for an example. The report will include a time stamp, as well as the calculated component concentrations and physical properties. If the SulfurChrome has more than one analysis stream, there will be Analysis Report buttons for each configured analysis stream.
Hourly Average Report
Shows the average results (component concentrations and physical properties) collected at the top of the last hour. If the SulfurChrome has more than one analysis stream, there will be Hourly Average Report buttons for each configured analysis stream.
Daily Average Report Shows the average results (component concentrations and physical properties) collected at the specified time of the most recent full day. If the SulfurChrome has more than one analysis stream, there will be Daily Average Report buttons for each configured analysis stream.
Calibration Report Shows the results of the last calibration run. Post Calibration Report Shows the changes that were made to the analyzer configuration
as a result of the last calibration run.
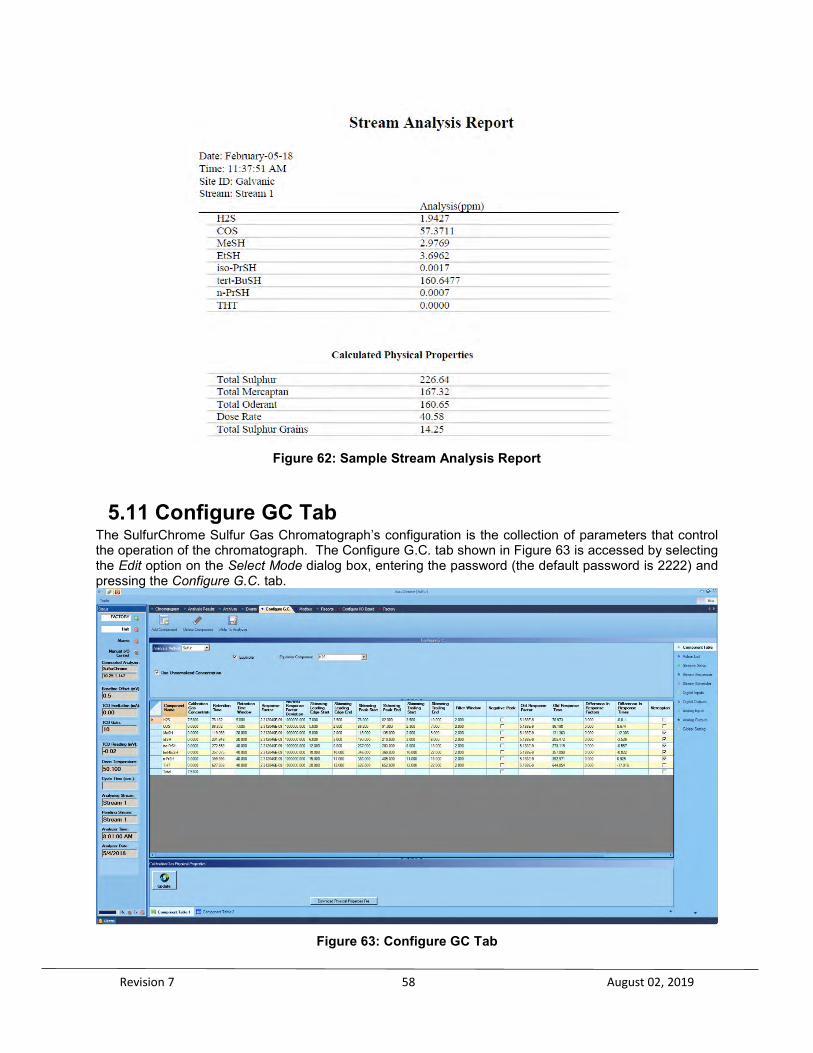
Revision 7 58 August 02, 2019
Figure 62: Sample Stream Analysis Report
5.11 Configure GC Tab The SulfurChrome Sulfur Gas Chromatograph’s configuration is the collection of parameters that control the operation of the chromatograph. The Configure G.C. tab shown in Figure 63 is accessed by selecting the Edit option on the Select Mode dialog box, entering the password (the default password is 2222) and pressing the Configure G.C. tab.
Figure 63: Configure GC Tab
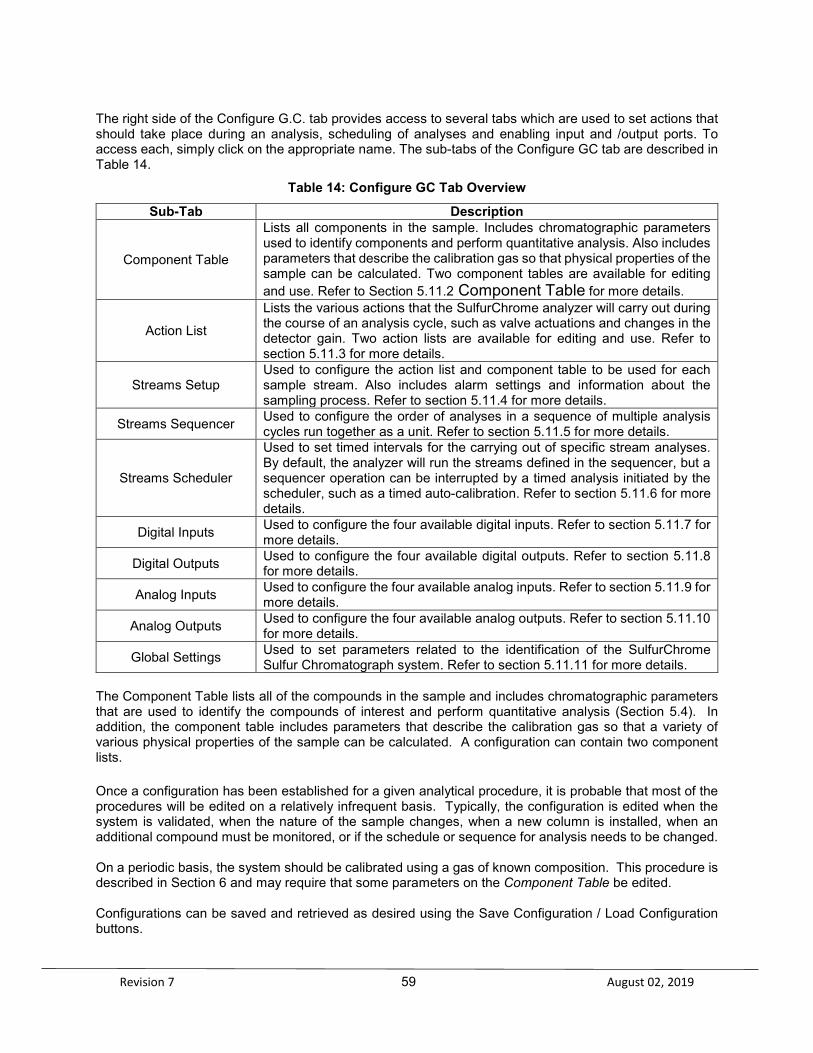
Revision 7 59 August 02, 2019
The right side of the Configure G.C. tab provides access to several tabs which are used to set actions that should take place during an analysis, scheduling of analyses and enabling input and /output ports. To access each, simply click on the appropriate name. The sub-tabs of the Configure GC tab are described in Table 14.
Table 14: Configure GC Tab Overview
Sub-Tab Description
Component Table
Lists all components in the sample. Includes chromatographic parameters used to identify components and perform quantitative analysis. Also includes parameters that describe the calibration gas so that physical properties of the sample can be calculated. Two component tables are available for editing and use. Refer to Section 5.11.2 Component Table for more details.
Action List
Lists the various actions that the SulfurChrome analyzer will carry out during the course of an analysis cycle, such as valve actuations and changes in the detector gain. Two action lists are available for editing and use. Refer to section 5.11.3 for more details.
Streams Setup Used to configure the action list and component table to be used for each sample stream. Also includes alarm settings and information about the sampling process. Refer to section 5.11.4 for more details.
Streams Sequencer Used to configure the order of analyses in a sequence of multiple analysis cycles run together as a unit. Refer to section 5.11.5 for more details.
Streams Scheduler
Used to set timed intervals for the carrying out of specific stream analyses. By default, the analyzer will run the streams defined in the sequencer, but a sequencer operation can be interrupted by a timed analysis initiated by the scheduler, such as a timed auto-calibration. Refer to section 5.11.6 for more details.
Digital Inputs Used to configure the four available digital inputs. Refer to section 5.11.7 for more details.
Digital Outputs Used to configure the four available digital outputs. Refer to section 5.11.8 for more details.
Analog Inputs Used to configure the four available analog inputs. Refer to section 5.11.9 for more details.
Analog Outputs Used to configure the four available analog outputs. Refer to section 5.11.10 for more details.
Global Settings Used to set parameters related to the identification of the SulfurChrome Sulfur Chromatograph system. Refer to section 5.11.11 for more details.
The Component Table lists all of the compounds in the sample and includes chromatographic parameters that are used to identify the compounds of interest and perform quantitative analysis (Section 5.4). In addition, the component table includes parameters that describe the calibration gas so that a variety of various physical properties of the sample can be calculated. A configuration can contain two component lists. Once a configuration has been established for a given analytical procedure, it is probable that most of the procedures will be edited on a relatively infrequent basis. Typically, the configuration is edited when the system is validated, when the nature of the sample changes, when a new column is installed, when an additional compound must be monitored, or if the schedule or sequence for analysis needs to be changed. On a periodic basis, the system should be calibrated using a gas of known composition. This procedure is described in Section 6 and may require that some parameters on the Component Table be edited. Configurations can be saved and retrieved as desired using the Save Configuration / Load Configuration buttons.

Revision 7 60 August 02, 2019
5.11.1 General Guidelines for Editing a Configuration When generating/editing a configuration, the following guidelines should be followed:
a) It is necessary to be in Edit mode to generate or edit a configuration.
b) After a configuration is generated/edited using the computer, it must be uploaded to the
SulfurChrome Sulfur Chromatograph for the changes made to take effect. Each sub-tab in the Configure GC tab has its own Write to analyzer button, which is used to upload configuration changes from the active sub-tab to the analyzer. These writes are temporary, meaning that if analyzer power was lost, the changes made to the configuration would also be lost. Further, changing to another sub-tab without first writing any changes made to the analyzer will cause all changes made to the active sub-tab to be lost. To make the changes permanent a Permanent Configuration Write must be executed from the master tool bar.
c) A configuration can be stored on the computer and retrieved as needed. Configuration files are
saved as *.cfg files in the directory of your choice. If a configuration is retrieved, it must be uploaded to the SulfurChrome Sulfur Chromatograph analyzer before it can be used.
d) If a new or edited configuration is written to the analyzer while an analysis is being performed, the
edits will not take effect until the start of the next run. It is suggested that the analyzer be in Halt mode while changes are being made so that the effects of these changes can be observed immediately in the next analysis cycle.
e) When navigating from tab to tab in the GUI software, the configuration data for that tab is
automatically read from the analyzer. If changes are made, but not written to the analyzer, they will be lost when navigating to another tab.
5.11.2 Component Table The Component Table sub-tab consists of three regions:
• A ribbon which contains controls for the table of chromatographic information and is used to enter a number of values used in calculations.
• A table of chromatographic parameters for each component to be analyzed • A table that displays the calculated physical properties for the calibration gas.
The Ribbon, shown in Figure 64, is used to add or delete components from the component table, send a configuration to the chromatograph, and enter values required for calculations.
Figure 64: The Ribbon (Sulfur Method)
For the SulfurChrome Sulfur Chromatograph, only the Sulfur analysis method can be chosen.
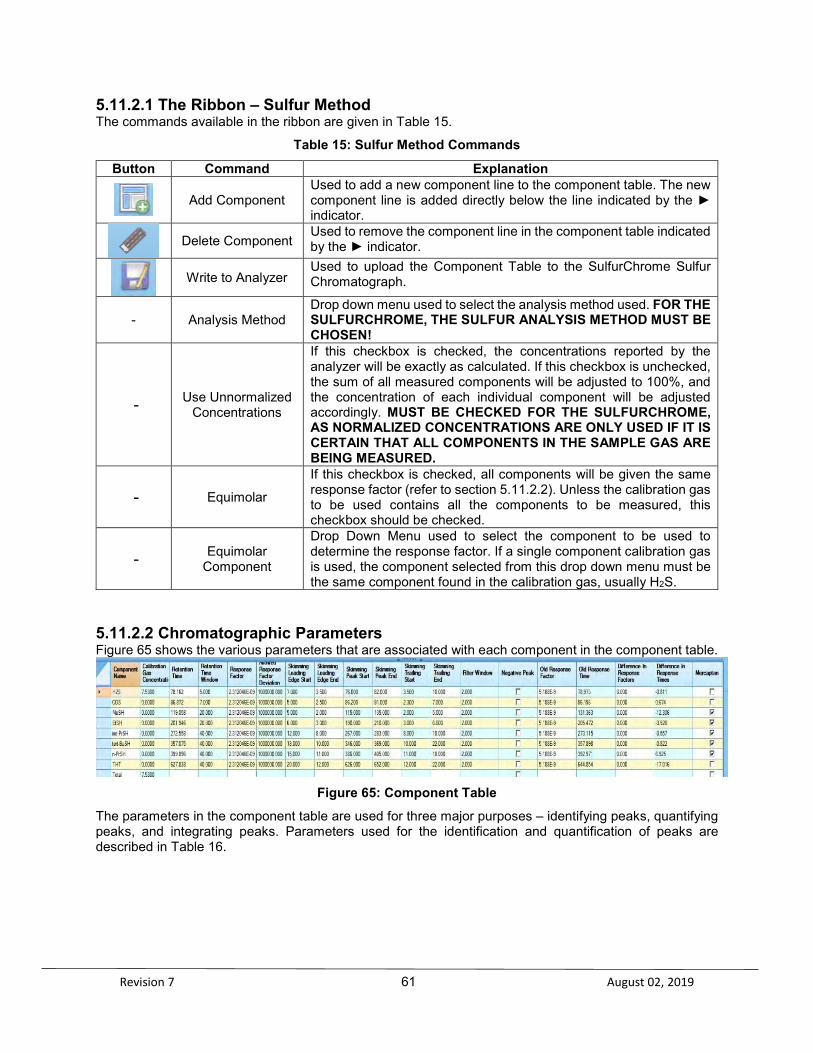
Revision 7 61 August 02, 2019
5.11.2.1 The Ribbon – Sulfur Method The commands available in the ribbon are given in Table 15.
Table 15: Sulfur Method Commands
Button Command Explanation
Add Component
Used to add a new component line to the component table. The new component line is added directly below the line indicated by the indicator.
Delete Component
Used to remove the component line in the component table indicated by the indicator.
Write to Analyzer
Used to upload the Component Table to the SulfurChrome Sulfur Chromatograph.
- Analysis Method Drop down menu used to select the analysis method used. FOR THE SULFURCHROME, THE SULFUR ANALYSIS METHOD MUST BE CHOSEN!
- Use Unnormalized Concentrations
If this checkbox is checked, the concentrations reported by the analyzer will be exactly as calculated. If this checkbox is unchecked, the sum of all measured components will be adjusted to 100%, and the concentration of each individual component will be adjusted accordingly. MUST BE CHECKED FOR THE SULFURCHROME, AS NORMALIZED CONCENTRATIONS ARE ONLY USED IF IT IS CERTAIN THAT ALL COMPONENTS IN THE SAMPLE GAS ARE BEING MEASURED.
- Equimolar
If this checkbox is checked, all components will be given the same response factor (refer to section 5.11.2.2). Unless the calibration gas to be used contains all the components to be measured, this checkbox should be checked.
- Equimolar Component
Drop Down Menu used to select the component to be used to determine the response factor. If a single component calibration gas is used, the component selected from this drop down menu must be the same component found in the calibration gas, usually H2S.
5.11.2.2 Chromatographic Parameters Figure 65 shows the various parameters that are associated with each component in the component table.
Figure 65: Component Table
The parameters in the component table are used for three major purposes – identifying peaks, quantifying peaks, and integrating peaks. Parameters used for the identification and quantification of peaks are described in Table 16.

Revision 7 62 August 02, 2019
Table 16: Peak Identification and Quantification Parameters
Parameter Explanation
Component Name The name of the component to be quantified. The component name should NOT be changed except under the express instructions of a factory trained technician from Galvanic Applied Sciences.
Retention Time
Time (s) at which the maximum signal from the detector is obtained for the component. Peaks in a chromatogram are identified on the basis of their retention times. This value is automatically calculated for each component in a calibration gas mixture during an automatic calibration cycle. For other components, the used retention time should be the average of the retention times for at least three consecutive analysis cycles. The previous retention time (previous to the last calibration) for each component is given in the Old Response Time column. The difference between the current and old retention time for each component is given in the Difference in Response Times column.
Retention Time Window
Amount of time (s) that a peak is allowed to shift to the left or right of the retention time and still be identified as the given component. Example: In Figure 65, H2S has a retention time of 78.162s, and a retention time window of 5s. Thus, any peak that occurs at 78.162±5s will be identified as H2S. In general, peaks that elute earlier in the analysis will have smaller retention time windows than those that elute later in the analysis.
Calibration Gas Concentration
Concentration of each component in the calibration gas mixture. For the SulfurChrome Sulfur GC, typically the calibration gas will contain only one component (usually H2S), so the concentrations of all other components will be given as 0. Typical units for concentration for the SulfurChrome Sulfur GC are parts per million (ppm).
Response Factor
A multiplication factor that is used to convert the raw area under a component peak into a concentration value. The formula for calculating concentration is given in Equation 1. The response factor for each component is calculated based on the calibration gas concentration during an auto calibration according to the formula given in Equation 2. The previous response factor (i.e. prior to the most recent auto calibration) for each component is given in the Old Response Factor column. The percentage difference between the current response factor and the old response factor is given in the Difference in Response Factor column. If the Equimolar’ checkbox is checked, all components will have the same response factor – this is the default for the SulfurChrome Sulfur GC.
Allowed Response Factor Deviation
The amount (%) the response factor is permitted to change in an auto calibration and still have the new response factor be accepted for use. The values in this column are only used if the Calibration Deviation Alarm is enabled.
Equation 1: Calculation of Component Concentration
[𝑛𝑛] = 𝑅𝑅𝑅𝑅𝑛𝑛 ∗ 𝐴𝐴𝑛𝑛 Where: [n] = concentration of component ‘n’ RFn = Response Factor of Component ‘n’ An = Area under the peak of component ‘n’
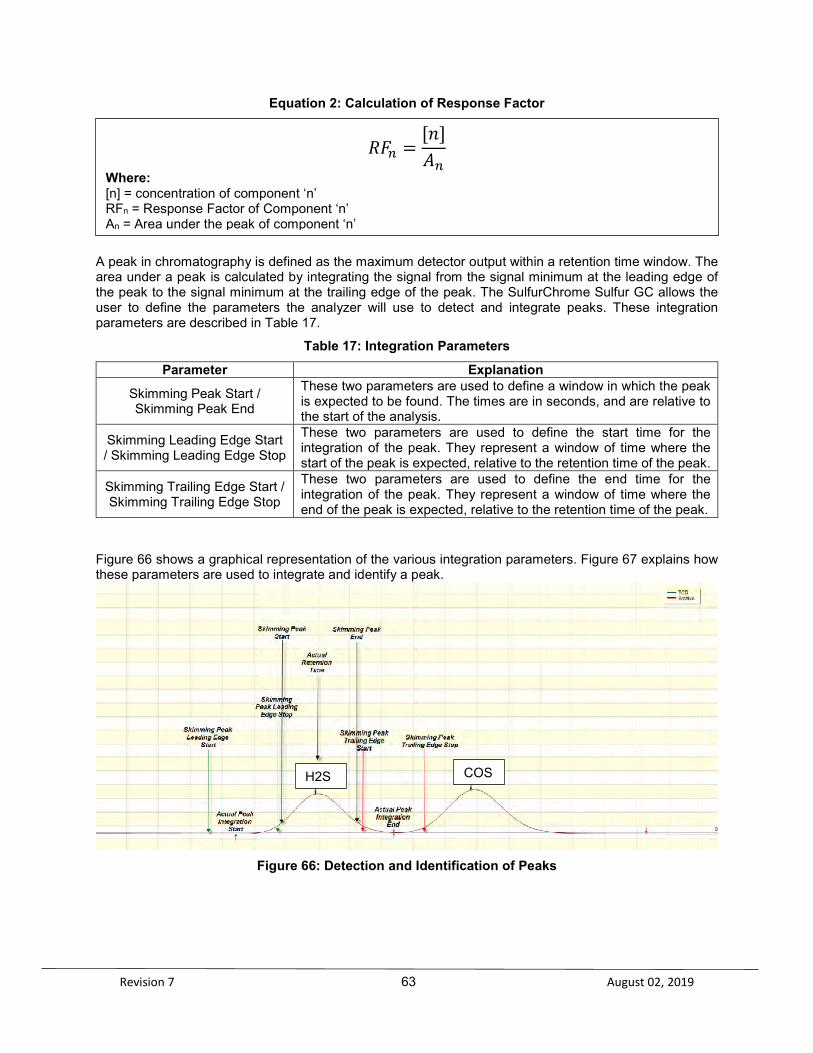
Revision 7 63 August 02, 2019
Equation 2: Calculation of Response Factor
A peak in chromatography is defined as the maximum detector output within a retention time window. The area under a peak is calculated by integrating the signal from the signal minimum at the leading edge of the peak to the signal minimum at the trailing edge of the peak. The SulfurChrome Sulfur GC allows the user to define the parameters the analyzer will use to detect and integrate peaks. These integration parameters are described in Table 17.
Table 17: Integration Parameters
Parameter Explanation
Skimming Peak Start / Skimming Peak End
These two parameters are used to define a window in which the peak is expected to be found. The times are in seconds, and are relative to the start of the analysis.
Skimming Leading Edge Start / Skimming Leading Edge Stop
These two parameters are used to define the start time for the integration of the peak. They represent a window of time where the start of the peak is expected, relative to the retention time of the peak.
Skimming Trailing Edge Start / Skimming Trailing Edge Stop
These two parameters are used to define the end time for the integration of the peak. They represent a window of time where the end of the peak is expected, relative to the retention time of the peak.
Figure 66 shows a graphical representation of the various integration parameters. Figure 67 explains how these parameters are used to integrate and identify a peak.
Figure 66: Detection and Identification of Peaks
𝑅𝑅𝑅𝑅𝑛𝑛 =[𝑛𝑛]𝐴𝐴𝑛𝑛
Where: [n] = concentration of component ‘n’ RFn = Response Factor of Component ‘n’ An = Area under the peak of component ‘n’
H2S COS

Revision 7 64 August 02, 2019
Figure 67: Explanation of Peak Detection
The Filter Window column in the component table is used to apply smoothing to the chromatogram for more accurate and repeatable integrations. The values in this column should not be changed from the factory values except after consultation with Galvanic Applied Sciences. If a checkmark is placed in the checkbox in the Negative Peak column, this indicates to the analyzer that the given component’s peak is upside down; that is to say, the peak is below the baseline rather than above. However, on the SulfurChrome Sulfur GC, no peaks are expected to be negative, so this checkbox should NOT be checked for any components. 5.11.2.3 Physical Properties The Calibration Gas Physical Properties section of the Component Table sub-tab is empty in the Sulfur method. However, there are some physical properties that are calculated on the basis of the calculated concentrations for all components, as shown in Figure 68.
Figure 68: Calculated Physical Properties
The physical properties of the sample gas are explained in Table 18.
The peak for H2S is expected at 78.162sec. ± 5.000 sec. as defined by the component table.The Skimming Peak Start and Skimming Peak End parameters are 76 seconds and 82 seconds. This means that the apex of the peak is expected to occur between these two times. The Skimming Peak Leading Edge Start and Skimming Peak Leading Edge End parameters are 7 and 3.5 seconds. This means that the start of the peak integration will occur between 78.162 seconds minus 7 seconds (71.162s) and 78.162 seconds minus 3.5 seconds (74.662s). The start of the peak is defined as the minimum value of the detector signal between these two points. The Skimming Peak Leading Edge Start and Skimming Peak Leading Edge End times are defined relative to the retention time so that the peak integration start time will move with the peak if the retention time of the peak shifts. The Skimming Peak Trailing Edge Start and Skimming Peak Trailing Edge End parameters are 3.5 and 10 seconds. This means that the end of the peak integration will occur between 78.162 seconds plus 3.5 seconds (81.662s) and 78.162 seconds plus 10 seconds (88.162s). The end of the peak is defined as the minimum value of the detector signal between these two points. The Skimming Peak Trailing Edge Start and Skimming Peak Trailing Edge End times are defined relative to the
t ti ti th t th k i t ti d ti ill ith th k if th

Revision 7 65 August 02, 2019
Table 18: Calculated Physical Properties
Parameter Explanation
Total Sulfur The calculated total sulfur concentration is the sum of ALL sulfur components concentrations in the sample gas. Reported in ppm.
Total Mercaptan
The calculated Total Mercaptan concentration is the sum of all MERCAPTAN species in the sample gas. Reported in ppm. For a component to be included in the Total Mercaptan concentration, the checkbox in the Mercaptan column of the component table must be checked for that component.
Total Odorant
The calculated Total Odorant is the sum of all ODORANT species in the sample gas. Reported in ppm. For a component to be included in the Total Odorant calculation, the checkbox in the Odorant column of the component table must be checked for that component.
Dose Rate The Dose Rate is the Total Odorant value in ppm converted to pounds of sulfur per million cubic feet of gas.
Total Sulfur Grains The calculated Total Sulfur Grains is the Total Sulfur value in ppm converted to grains of sulfur per 100 standard cubic feet of gas.
5.11.3 Action List The Action List shown in Figure 69 is used to program a variety of activities during the separation such as opening/closing a valve, setting the gain, setting a zero and indicating the end of an analysis.
Figure 69: Action List with Tools

Revision 7 66 August 02, 2019
Above the Action List are four tool buttons whose functions are described in Table 19.
Table 19: Action List Tool Buttons
Button Command Explanation
Add Action
Used to add a new action to the active action list. The Add Action command is explained in more detail in section 5.11.3.1.
Delete Action
Used to remove the action in the action list table indicated by the indicator.
Edit Action
Used to edit the action in the action list table indicated by the indicator. The Edit Action command is explained in more detail in section 5.11.3.2.
Write to Analyzer
Used to save any changes made to the Action List to the analyzer.
5.11.3.1 Add Action When the Add Action button is pressed, the Add Action dialog box shown in Figure 70 is shown.
Figure 70: Add Action Dialog Box
The Action Type is selected via the top drop down menu. There are several different types of actions available. 5.11.3.1.1 Valve Actions Valve actions can be selected as either On or Off. There are several types of hardware that can be switched on or off. Chromatograph valves (CV) are valves that are used to inject sample into the chromatography column or change the direction of the gas flow through the column(s) in the chromatography oven. There can be as many as four chromatograph valves in a single analyzer depending on the configuration. Additional solenoids (SOL) and relays (REL) can also be controlled using the Valve On / Off actions. Choose the valve number to be actuated and state (on or off) to which the chosen valve is to be set from the drop down menus. Enter the time, in seconds relative to the start of the analysis, at which the action is to take place in the Action Time field. Click on the Add button to add the chosen action to the action list.

Revision 7 67 August 02, 2019
5.11.3.1.2 Set Gain The Gain is a factor by which the signal output from the photomultiplier tube is multiplied to produce the reading output shown on the chromatogram. If the Set Gain option is selected from the Action Type dropdown menu, the Add Action dialog boxes changes as shown in Figure 71.
Figure 71: Set Gain Action Dialog Box
The gain can be set from 0.2 to 3,200,000 by setting the Dx switches (e.g. if D7 is set to 1 and all other are set to 0, the gain is 0.2). The Gain factor that is associated with a specific switch setting is automatically calculated and shown in the Gain field. A Gain of 1 indicates that the signal output from the PMT will not increase or decrease as a result of being multiplied by the gain. Increasing the gain can be used to increase the peak height for small peaks (i.e. peaks of components with very low concentration), while decreasing the Gain below 1 can be used to reduce the peak height from very large peaks (i.e. peaks of components with very large concentration). Note, however, that increasing the gain will also increase the baseline noise, which can have an effect on the peak integration. The time at which the gain is to be set can be entered into the Action Time field, and the Add button can be clicked to add the action to the action list. 5.11.3.1.3 Set Zero The Set Zero action applies an offset to the current detector output such that the adjusted detector output after this action is 0mV. This offset will be applied to all detector readings after this action until another Set Zero action is carried out. Typically this type of action is carried out after a valve actuation (on or off) to compensate for baseline variations cause by a change of flow through the chromatography columns. The time at which the Set Zero action is to be carried out is set in the Action Time field, and then Add is clicked to add the action to the action list. 5.11.3.1.4 End of Analysis The End of Analysis action tells the analyzer that the analysis is complete. No further integration will be carried out after this point, and the analyzer will carry out end-of-analysis calculations (peak integration, peak identification, component concentrations, and physical properties). The time set in the Action Time will determine the analysis cycle time for the SulfurChrome Sulfur Gas Chromatograph. 5.11.3.2 Edit Action When the Edit Action button is pressed, the Edit Action dialog box shown in Figure 72 is displayed.

Revision 7 68 August 02, 2019
Figure 72: Edit Action Dialog Box
The Edit Action dialog box is almost identical to the Add Action dialog box. The Action Type, Valve Number, Gain Switch settings, and Action Times are adjusted in the same way as for adding a new action. Once the action has been edited as desired, press OK to save the changes to the action list.
5.11.4 Streams Setup The Streams Setup screen shown in Figure 73 is used to set a variety of parameters that define the various analysis, calibration, and reference streams that can be analyzed by the SulfurChrome Sulfur Gas Chromatograph.
Figure 73: Streams Setup

Revision 7 69 August 02, 2019
There are a number of tabs at the bottom left of the Streams Setup screen that allow access to the configuration of the various configured analysis streams. Additionally, there are three tool buttons at the top of the Streams Setup screen whose functions are described in Table 20.
Table 20: Stream Setup Tool Buttons
Button Command Explanation
Add Run
Adds an additional tab at the bottom right of the screen that can be used to configure an additional analysis stream.
Delete Run Used to delete the currently active analysis stream tab.
Write to Analyzer Used to save any changes made to the Streams Setup to the
analyzer. 5.11.4.1 Stream Setup Parameters The left side of the Streams Setup screen shows a variety of parameters that are used to configure various aspects of the analysis stream operation. The parameters are shown in more detail in Figure 74.
Figure 74: Stream Setup Parameters
The various fields in this section of the screen are described in Table 21.

Revision 7 70 August 02, 2019
Table 21: Stream Setup Parameters
Field Explanation
Run Name
The name for the stream being edited. The value entered in this field does not affect the operation of the analyzer in any way, but it is displayed elsewhere in the GUI and on the analyzer’s local display when this run is being carried out. For this reason, a sufficiently descriptive name is suggested.
Run Type
The type of analysis run to be carried out on the stream currently being edited. There are three types of run types available:
• Analysis Run – the current stream is a sample gas. The sample gas will be analyzed, after which the component concentrations and physical properties for the sample gas will be calculated and displayed.
• Reference Run – the current stream is a reference gas containing known components at known concentration levels. The gas will be analyzed by the analyzer, after which the component concentrations and physical properties will be calculated and displayed. The reference run is used to compare the results of this run with the certificate values for the reference gas to determine whether or not the analyzer’s calibration is still valid.
• Calibration – the current stream is a reference gas containing known components at known concentration levels. The gas will be analyzed by the analyzer, after which new response factors / retention times will be calculated and written into the analyzer’s component table.
Action List Index
Tells the analyzer which action list the analyzer is to use for the current analysis. A SulfurChrome Sulfur Gas Chromatograph can be configured with two different action lists, so a value of 1 or 2 can be selected from this drop down menu.
Component Table Index
Tells the analyzer which component table the analyzer is to use for the current analysis. A SulfurChrome Sulfur Chromatograph can be configured with two different component tables, so a value of 1 or 2 can be selected from this drop down menu.
Allow Stream Switch (s)
If the analyzer is running a sequence of analyses, and the subsequent analysis is of a different stream than the current analysis, the value entered into this field will tell the analyzer how many seconds after the start of the current analysis it should switch to the next stream.
Purge Time (s)
Indicates the minimum time the analyzer should purge the sample loop with sample after switching to a new stream prior to carrying out an analysis. In most cases, the Allow Stream Switch time is set such that the sample loop is purged for a sufficient amount of time before the current analysis is complete. In this case, the analyzer can begin the next analysis immediately. However, if this is not the case, or if the stream switch occurs while the analyzer is halted, the analyzer will purge for this amount of time prior to beginning the analysis.
Reject Run from Archive
If this option is selected, if a component high concentration or low concentration alarm occurs during an analysis of this stream, the data from this analysis will not be included in the hourly / daily averages for this stream.
Solenoid These checkboxes are used to select the solenoid(s) to be actuated for this analysis stream. Any solenoid that is checked will be switched on when this analysis is to be carried out.
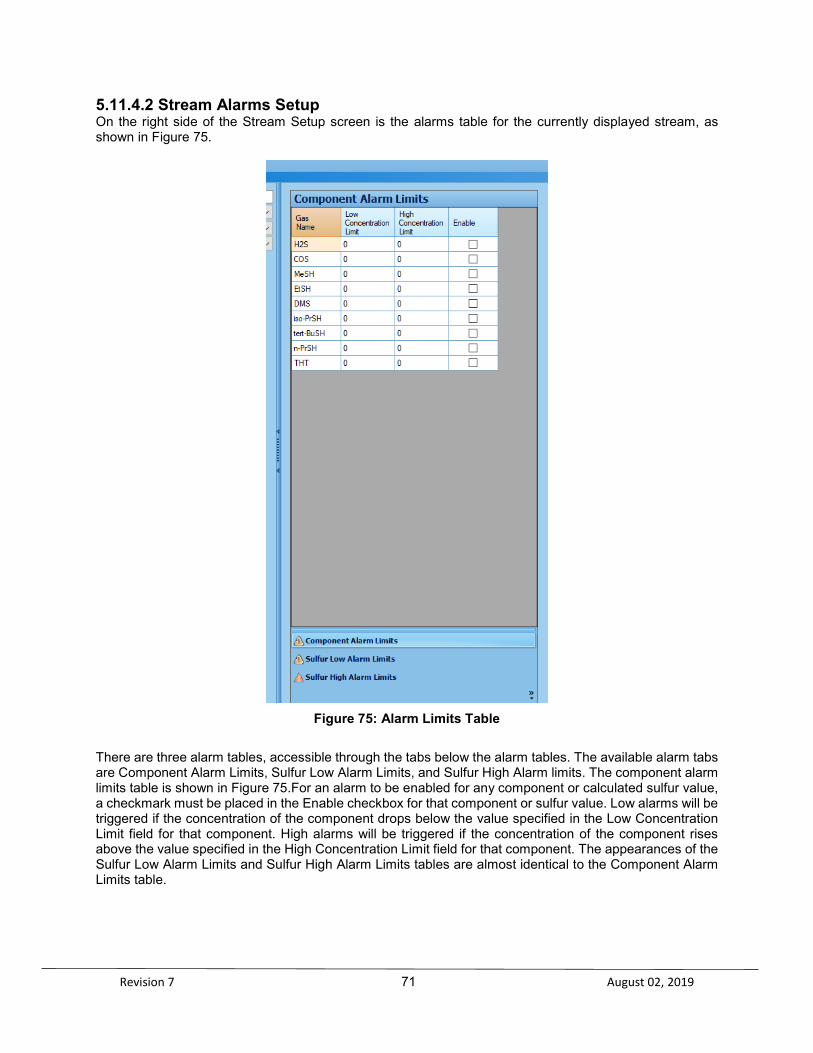
Revision 7 71 August 02, 2019
5.11.4.2 Stream Alarms Setup On the right side of the Stream Setup screen is the alarms table for the currently displayed stream, as shown in Figure 75.
Figure 75: Alarm Limits Table
There are three alarm tables, accessible through the tabs below the alarm tables. The available alarm tabs are Component Alarm Limits, Sulfur Low Alarm Limits, and Sulfur High Alarm limits. The component alarm limits table is shown in Figure 75.For an alarm to be enabled for any component or calculated sulfur value, a checkmark must be placed in the Enable checkbox for that component or sulfur value. Low alarms will be triggered if the concentration of the component drops below the value specified in the Low Concentration Limit field for that component. High alarms will be triggered if the concentration of the component rises above the value specified in the High Concentration Limit field for that component. The appearances of the Sulfur Low Alarm Limits and Sulfur High Alarm Limits tables are almost identical to the Component Alarm Limits table.

Revision 7 72 August 02, 2019
5.11.5 Stream Sequencer The Stream Sequencer setup screen, shown in Figure 76, is used to configure the analysis sequences that the SulfurChrome Sulfur Chromatograph can run automatically.
Figure 76: Stream Sequencer Screen
An analysis sequence is a series of analysis runs that are run in sequential order. If a sequencer is defined and enabled by placing a checkmark in the Enable box, the analyzer will automatically carry out the sequence of analysis runs until it is either halted or until the sequencer operation is interrupted by a timed or manually initiated run. To enter a run in a sequence, click on the drop down menu and select the desired run type. The available runs are those that have been generated on the Streams Setup screen. To remove a run from the sequencer, simply click on the Delete Stream button. An entire sequencer can be deleted by clicking on the Delete Sequencer button at the top of the screen, and a whole new sequencer can be added by clicking on the Add Sequencer button, also at the top of the screen. The various configured sequencers can be accessed via tabs at the bottom of the screen.
5.11.6 Stream Scheduler
The Stream Scheduler, shown in Figure 77, is used to configure when the various streams should be analyzed and indicate if a stream is to be analyzed on a repetitive basis. Each configured stream can be scheduled independently.

Revision 7 73 August 02, 2019
Figure 77: Stream Scheduler
To set the start time for a stream: a) Press the adjacent to the date to present a calendar of the month indicated in the date line and
click on the desired day. b) Click on the desired hour and minute in the time field. If you want to start a run at a time not
indicated in the time field, set an approximate time via the numerical buttons and adjust the time via the or button.
If desired, repetitive runs for a given stream can be scheduled by editing the Days and Hours fields of the Frequency region. If values of zero are placed in both the Days and Hours fields, this will configure the scheduled run to run once at the scheduled time and not repeat at any time after this.
5.11.7 Digital Inputs The Digital Inputs screen, shown in Figure 78, is used to configure the four digital inputs (two wet and two dry).
Figure 78: Digital Inputs
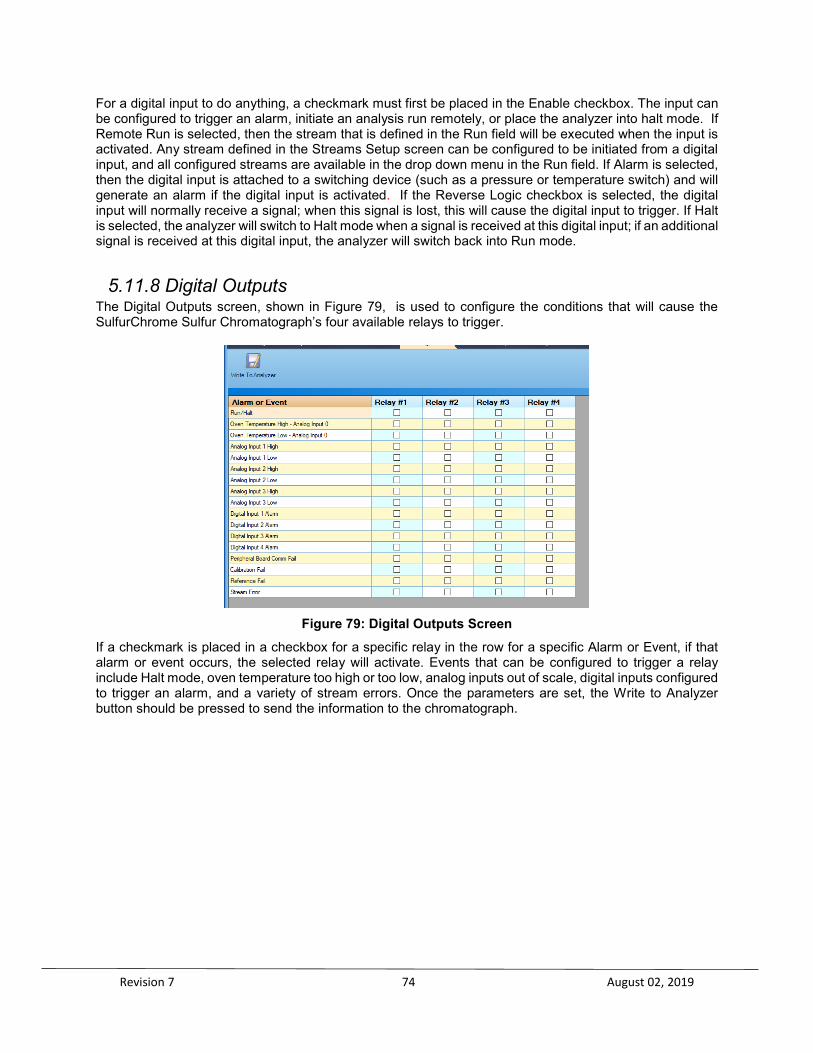
Revision 7 74 August 02, 2019
For a digital input to do anything, a checkmark must first be placed in the Enable checkbox. The input can be configured to trigger an alarm, initiate an analysis run remotely, or place the analyzer into halt mode. If Remote Run is selected, then the stream that is defined in the Run field will be executed when the input is activated. Any stream defined in the Streams Setup screen can be configured to be initiated from a digital input, and all configured streams are available in the drop down menu in the Run field. If Alarm is selected, then the digital input is attached to a switching device (such as a pressure or temperature switch) and will generate an alarm if the digital input is activated. If the Reverse Logic checkbox is selected, the digital input will normally receive a signal; when this signal is lost, this will cause the digital input to trigger. If Halt is selected, the analyzer will switch to Halt mode when a signal is received at this digital input; if an additional signal is received at this digital input, the analyzer will switch back into Run mode.
5.11.8 Digital Outputs The Digital Outputs screen, shown in Figure 79, is used to configure the conditions that will cause the SulfurChrome Sulfur Chromatograph’s four available relays to trigger.
Figure 79: Digital Outputs Screen
If a checkmark is placed in a checkbox for a specific relay in the row for a specific Alarm or Event, if that alarm or event occurs, the selected relay will activate. Events that can be configured to trigger a relay include Halt mode, oven temperature too high or too low, analog inputs out of scale, digital inputs configured to trigger an alarm, and a variety of stream errors. Once the parameters are set, the Write to Analyzer button should be pressed to send the information to the chromatograph.

Revision 7 75 August 02, 2019
5.11.9 Analog Inputs
The Analog Inputs screen shown in Figure 80 is used to configure the SulfurChrome Sulfur Chromatograph’s four analog inputs.
Figure 80: Analog Input Screen
Three of these analog inputs are require for signals from the chromatograph oven temperature RTD, the reaction furnace temperature thermocouple, and the vacuum pressure transducer. The analog input configuration for these three inputs SHOULD NOT be changed without guidance from the factory. If a fourth analog input device is required, the alarm limits should be set, and the appropriate check boxes selected for this input. The scaled value field for each analog input shows the current value of this input. Once the parameters are set, the Write to Analyzer button should be pressed to send the information to the chromatograph

Revision 7 76 August 02, 2019
5.11.10 Analog Outputs
The Analog Outputs screen, shown in Figure 81, is used to configure the scale and output parameter for each of the SulfurChrome Sulfur Chromatograph’s four analog (4-20mA) outputs.
Figure 81: Analog Outputs Screen
For each analog output, the scaled value that will correspond to a current output of 4mA is entered into the Minimal value field. In most cases, this will be a value of 0. The scaled value that will correspond to a current output of 20mA is entered into the range field. The desired output parameter can be selected from the drop down menu. All components and calculated physical properties for each analysis stream are available for output from the analog outputs; however, results from reference and calibration runs cannot be output to the analog outputs. When all four analog outputs are configured as desired, press the Write to Analyzer button to save changes to the analyzer.
5.11.11 Global Setting The Global Setting screen, shown in Figure 82, is used to configure a variety of system parameters.
Figure 82: Global Setting
The Contract Start Hour is the time at which the daily average is calculated for use in archives and Modbus outputs. The value entered into this field should be a number between 0(midnight) and 23 (11pm). If the Halt on Start Up check box is checked, when the analyzer is powered up it will initially be in Halt mode and must be manually placed into Run mode. For the SulfurChrome Sulfur Chromatograph, it is highly recommended that this check box be checked. If this check box is not checked, the analyzer will

Revision 7 77 August 02, 2019
immediately enter into Run mode after it is powered on. The Site ID and Location fields can be modified as required for easier identification of the connected analyzer. The Serial Number field displays the connected analyzer’s serial number and cannot be edited. The Firmware Version, Rosetta Version, and Build ID fields all display analyzer firmware-related values and may be useful for troubleshooting in the event of a problem with the analyzer. The Unnormalized Total Out Of Spec alarm that can be enabled on this screen is not relevant to the SulfurChrome Sulfur Chromatograph and should be left disabled.

Revision 7 78 August 02, 2019
Section 6: SulfurChrome Validation
6.1 Overview
The SulfurChrome Sulfur Chromatograph should be validated on a monthly basis or as per the measurement requirements of the user. The validation process involves analyzing a known gas mixture and comparing the analyzer results to the certified value of the known mixture. This known mixture is referred to as the calibration gas. The validation process is also used to assess the status of the chromatograph and may be useful in indicating the presence of e potential problems such as worn chromatograph valves or contaminated columns. As the response of the sulfur chemiluminescence method is equimolar to ALL sulfur-containing compounds, a calibration gas containing only one sulfur component (typically hydrogen sulfide, H2S) can be used to successfully calibrate the SulfurChrome Sulfur Chromatograph; the concentration of H2S in this calibration mixture is recommended to be around 75% of the analyzer full scale in a balance of nitrogen or methane. For validation purposes, however, it is recommended to have a mixture of most / all of the sulfur components expected to be found in the sample gas as this will allow easier comparison of calculated concentrations and retention times.
6.2 Role of the Calibration Gas and the Reference Gas The calibration gas and the reference gas are typically the same gas, but are handled differently in the application software. If a mixture of multiple sulfur components is available, this should always be used as the reference gas; a mixture of H2S in nitrogen or methane is always used for calibration. In the Stream Sequencer screen, the operator must indicate the nature of the gas to be analyzed. • Calibration Gas - If the Calibration Stream is selected, the certified composition of the
calibration gas (which is entered in the Component Table) is used in conjunction with the peak area to calculate the response factor that is used for all components.
• Reference Gas - If the Reference Stream is selected, the composition of the gas is determined using the existing response factors and reported. When the Reference Stream is run, the chromatograph will analyze the calibration gas and simply report the values for each component without making any adjustment to the response factors. The reported composition of the gas should be compared to that reported by the supplier of the calibration gas to ensure that the system is operating on an acceptable basis.
• Sample Gas - If the Sample Stream is selected, the composition of the sample gas will be determined using the existing response factors.
6.3 Analyzer Calibration Before a calibration is performed, it is suggested that the reference stream is analyzed. This allows the user to determine if the chromatograph is operating in an acceptable manner, or a fault is present. As an example, if three is significant plugging of a valve or a column, it is probable that one or more compounds will not elute at the proper time, and the reported concentrations of various components of the sample will be significantly different that that expected for the gas. If a reference stream is not analyzed before a calibration stream, it is possible
that the user will generate an invalid calibration via the calibration process. Running the Reference run allows the user to identify this problem and correct it while running the Calibration will mask the problem by simply adjusting the response factor.

Revision 7 79 August 02, 2019
In some cases it may be desirable to perform a daily auto calibration to ensure that the chromatograph is functioning correctly on a day to day basis. A daily calibration can be set up to perform the calibration automatically (see Section 5.11.6). In this case the chromatograph will automatically make adjustments to the response factor within limits set by the user in the Allowable Response Factor Deviation entry of the Configure G.C. table . The chromatograph can also be set up to run the reference gas on a daily basis. In this case the results of the analysis of the calibration gas are reported and the user should compare the results to the reported concentrations provided by the supplier of the gas and determine if the SulfurChrome Sulfur Chromatograph is operating correctly based on those results.
6.4 Analyzer Validation To perform a validation of the SulfurChrome Sulfur Chromatograph, follow the procedure below. a) Place the analyzer into Reference mode via the Stream Sequencer selection of the
Configure G.C. tab (Figure 83).
Figure 83: Stream Sequencer Selection of the Configure G.C. Tab
b) Click on the Add Sequencer button to add a new sequence. Click on the Enable button
to enable this new sequence.
c) Set the top entry in the Sequence of Runs field to Ref 1 (or Ref 2 as required). If there are additional entries in the table, delete them by moving the highlight to it (the active entry will be highlighted in blue) and press the Delete Sequence button.
d) In the Default tab, click on the Enable checkbox to remove the checkmark. This will
disable the current analysis sequencer so that the analyzer will only run the Reference sequencer.
e) Transmit the changes to the analyzer by pressing the Write to Analyzer icon at the top of
the window. When the information has been transmitted, made the analyzer will
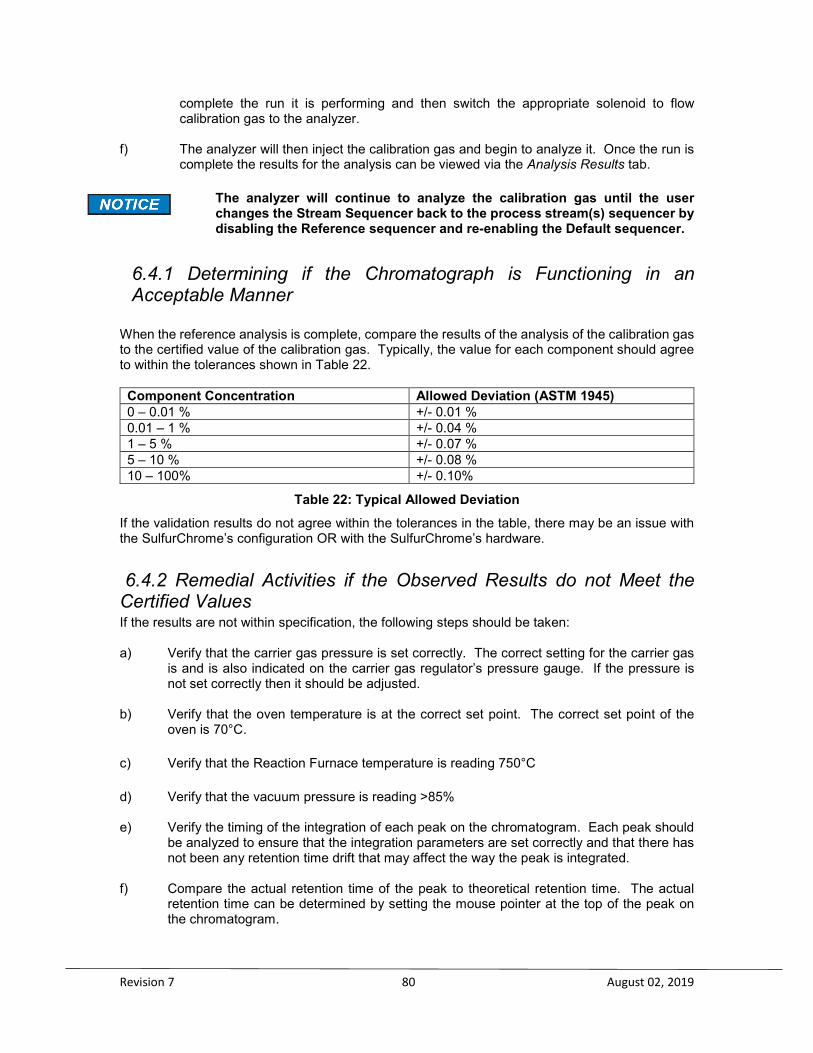
Revision 7 80 August 02, 2019
complete the run it is performing and then switch the appropriate solenoid to flow calibration gas to the analyzer.
f) The analyzer will then inject the calibration gas and begin to analyze it. Once the run is
complete the results for the analysis can be viewed via the Analysis Results tab.
The analyzer will continue to analyze the calibration gas until the user changes the Stream Sequencer back to the process stream(s) sequencer by disabling the Reference sequencer and re-enabling the Default sequencer.
6.4.1 Determining if the Chromatograph is Functioning in an Acceptable Manner
When the reference analysis is complete, compare the results of the analysis of the calibration gas to the certified value of the calibration gas. Typically, the value for each component should agree to within the tolerances shown in Table 22.
Component Concentration Allowed Deviation (ASTM 1945) 0 – 0.01 % +/- 0.01 % 0.01 – 1 % +/- 0.04 % 1 – 5 % +/- 0.07 % 5 – 10 % +/- 0.08 % 10 – 100% +/- 0.10%
Table 22: Typical Allowed Deviation If the validation results do not agree within the tolerances in the table, there may be an issue with the SulfurChrome’s configuration OR with the SulfurChrome’s hardware.
6.4.2 Remedial Activities if the Observed Results do not Meet the Certified Values If the results are not within specification, the following steps should be taken: a) Verify that the carrier gas pressure is set correctly. The correct setting for the carrier gas
is and is also indicated on the carrier gas regulator’s pressure gauge. If the pressure is not set correctly then it should be adjusted.
b) Verify that the oven temperature is at the correct set point. The correct set point of the
oven is 70°C.
c) Verify that the Reaction Furnace temperature is reading 750°C
d) Verify that the vacuum pressure is reading >85% e) Verify the timing of the integration of each peak on the chromatogram. Each peak should
be analyzed to ensure that the integration parameters are set correctly and that there has not been any retention time drift that may affect the way the peak is integrated.
f) Compare the actual retention time of the peak to theoretical retention time. The actual
retention time can be determined by setting the mouse pointer at the top of the peak on the chromatogram.
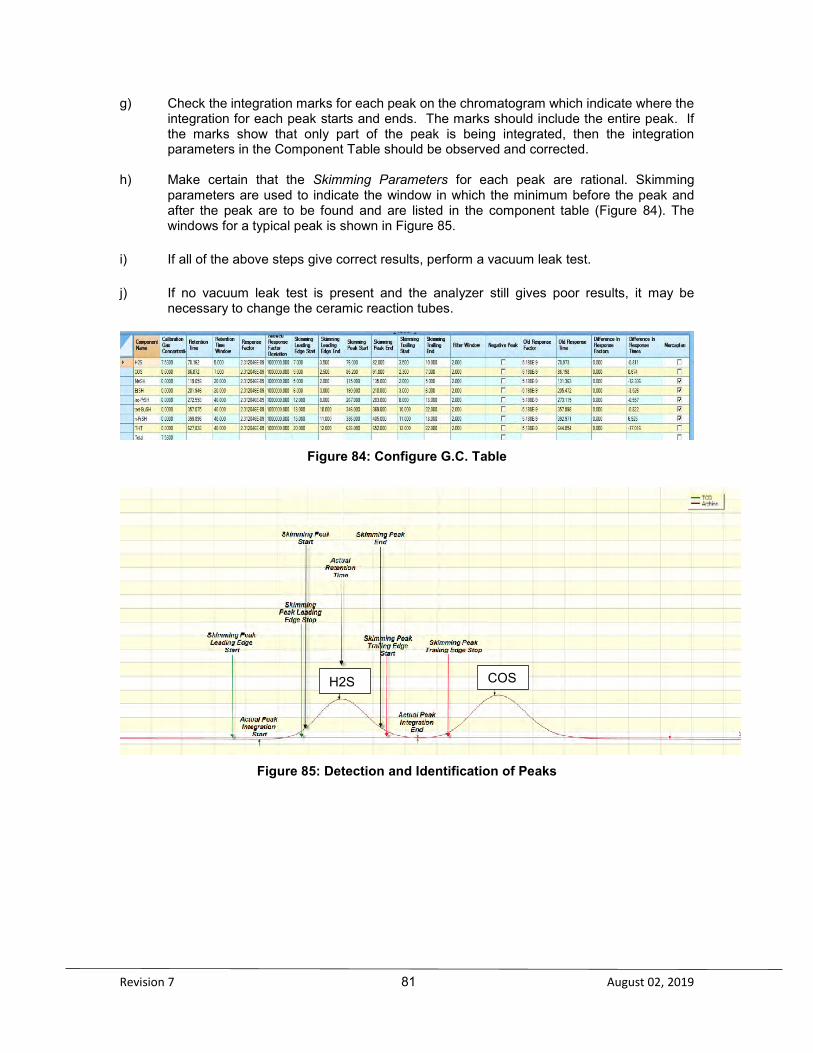
Revision 7 81 August 02, 2019
g) Check the integration marks for each peak on the chromatogram which indicate where the integration for each peak starts and ends. The marks should include the entire peak. If the marks show that only part of the peak is being integrated, then the integration parameters in the Component Table should be observed and corrected.
h) Make certain that the Skimming Parameters for each peak are rational. Skimming
parameters are used to indicate the window in which the minimum before the peak and after the peak are to be found and are listed in the component table (Figure 84). The windows for a typical peak is shown in Figure 85.
i) If all of the above steps give correct results, perform a vacuum leak test.
j) If no vacuum leak test is present and the analyzer still gives poor results, it may be necessary to change the ceramic reaction tubes.
Figure 84: Configure G.C. Table
Figure 85: Detection and Identification of Peaks
H2S COS

Revision 7 82 August 02, 2019
Section 7: Modbus 7.1 Modbus Overview
The Modbus tab allows the user to set up the analyzer to output data in 3 varieties of the MODBUS communication protocol - Enron, Modicon 16, and Modicon Floating Point. As there are a large number of possible configurations for Modbus, and every user may desire a slightly different configuration, this manual will only cover the basics of Modbus configuration. If the user requires assistance in setting up a Modbus configuration, the Service department at Galvanic Applied Sciences Inc. will assist in configuring the unit as desired. When the Modbus selected, the main Modbus page shown in Figure 86 is opened. There are three pages to the tab, which are accessed via three sub-tabs on the right side of the screen. The Modbus Lists sub tab is used to configure and display the Modbus list(s) and the available data points that can be entered into a Modbus list. The Communication Ports sub-tab lists the various available communication ports and allows the user to configure the ports used for Modbus communication. The Modbus Monitor sub tab shows the raw data output from the Modbus.
Figure 86: Main Modbus Page
At the top of the Modbus page is a toolbar with several buttons. The functions of these buttons are described in Table 23.
Table 23: Modbus Toolbar Buttons
Button Command Explanation
Write to Analyzer
Saves the current Modbus list to the SulfurChrome Sulfur Chromatograph.
Edit Mode Clicking on this button enables Edit mode, allowing the user to
make changes to the current Modbus configuration.
Save Configuration Saves the current Modbus configuration to a file on the user’s PC
(.cfg format)
Load Configuration Allows the user to load a previously saved Modbus configuration
file (.cfg format) to the SulfurChrome sulfur chromatograph.
Export to PDF
Allows the user to export the Modbus configuration file to a PDF file. Useful for providing a record of the Modbus configuration to the control room for programming the receiving device.
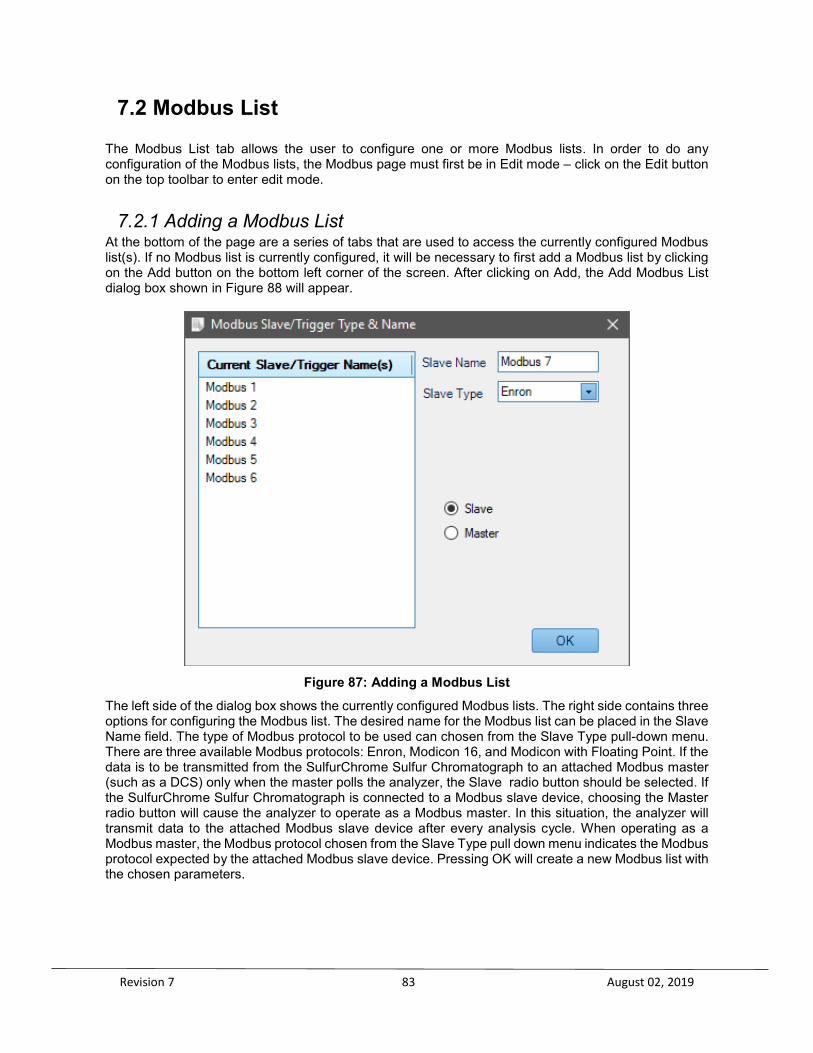
Revision 7 83 August 02, 2019
7.2 Modbus List
The Modbus List tab allows the user to configure one or more Modbus lists. In order to do any configuration of the Modbus lists, the Modbus page must first be in Edit mode – click on the Edit button on the top toolbar to enter edit mode.
7.2.1 Adding a Modbus List At the bottom of the page are a series of tabs that are used to access the currently configured Modbus list(s). If no Modbus list is currently configured, it will be necessary to first add a Modbus list by clicking on the Add button on the bottom left corner of the screen. After clicking on Add, the Add Modbus List dialog box shown in Figure 88 will appear.
Figure 87: Adding a Modbus List
The left side of the dialog box shows the currently configured Modbus lists. The right side contains three options for configuring the Modbus list. The desired name for the Modbus list can be placed in the Slave Name field. The type of Modbus protocol to be used can chosen from the Slave Type pull-down menu. There are three available Modbus protocols: Enron, Modicon 16, and Modicon with Floating Point. If the data is to be transmitted from the SulfurChrome Sulfur Chromatograph to an attached Modbus master (such as a DCS) only when the master polls the analyzer, the Slave radio button should be selected. If the SulfurChrome Sulfur Chromatograph is connected to a Modbus slave device, choosing the Master radio button will cause the analyzer to operate as a Modbus master. In this situation, the analyzer will transmit data to the attached Modbus slave device after every analysis cycle. When operating as a Modbus master, the Modbus protocol chosen from the Slave Type pull down menu indicates the Modbus protocol expected by the attached Modbus slave device. Pressing OK will create a new Modbus list with the chosen parameters.

Revision 7 84 August 02, 2019
7.2.2 Deleting a Modbus List Clicking on the Delete button in the bottom left corner of the page will delete the currently displayed Modbus list.
The currently displayed Modbus list will be deleted IMMEDIATELY after pressing the DELETE button. No confirmation will be requested! Only click the Delete button when certain that the Modbus list must be deleted.
7.2.3 Copying a Modbus List Clicking on the Copy button in the bottom left corner of the page allows the user to copy the currently displayed Modbus list to a new Modbus list. The Copy Modbus List dialog box is identical to the Add Modbus List dialog box shown in Figure 87; however, the only parameter that can be changed when copying a Modbus list is the name of the Modbus list to which the currently displayed Modbus list is to be copied to.
7.2.4 Modbus List Details – Slave Mode Above the currently displayed Modbus list is a series of parameters that allows the user to further configure the Modbus list. The details for a Modbus list in Slave mode is shown in Figure 88
Figure 88: Modbus List Details – Slave Mode
The information displayed in the Modbus List Details is shown in Table 24.
Table 24: Modbus List Details - Slave Mode
Parameter Explanation
Type Shows the type of the currently displayed Modbus list. This parameter cannot be edited here – it can only be changed when a new Modbus list is added.
Address Allows the user to set the Modbus list address. This value is required to tell the Modbus master what address to poll for the data.
Endian
Allows the user to select the data format as Big Endian or Little Endian. This parameter defines if the most significant bit or the least significant bit is transmitted first. Selection of the Endian parameter depends on the configuration of the Modbus master.
32 Bit Register Swap
For 32-bit registers that are transmitted as 2 16-bit words, this parameter configures whether the integer or the fractional part of the number is transmitted in first in the first word. This parameter is meaningless for the Modicon 16 Modbus list type. The configuration of this parameter depends on the configuration of the Modbus master.
Read Only If this parameter is selected, the Modbus list is Read Only – the Modbus master can read data from registers in the list, but is unable to write data to registers in the list.
7.2.5 Modbus List Details – Master Mode The details for a Modbus list in Master mode is shown in Figure 89.
Figure 89: Modbus List Details - Master Mode

Revision 7 85 August 02, 2019
The information displayed in the Modbus List details for Master mode are given in Table 25.
Table 25: Modbus List Details (Master Mode)
Parameter Explanation
Channel Number
Allows user to select the communication channel used for communication between the SulfurChrome Sulfur Chromatograph and the Modbus slave device. If the connection between the analyzer and the Modbus slave is Ethernet, select TCP; otherwise, select the serial COM port number.
Slave Modbus Address The Modbus address configured at the Modbus slave device.
Slave IP Address The IP address of the Modbus slave device. Only used if the Modbus slave device is connected to the analyzer using Ethernet.
Slave Port The communication port number of the Modbus slave device. Only used if the Modbus slave device is connected to the analyzer using Ethernet.
Telemetry
Allows the user to select the communication protocol used for communication between the analyzer and the Modbus slave device. Available Ethernet protocols are TCP and RTU over TCP. Available serial protocols are Serial ASCII and Serial RTU.
Slave Big Endian Select this checkbox if the Modbus slave device expects data in the big endian format.
Slave Swapped Floats Select this checkbox if…
Slave Enron 32-Bit Select this checkbox if the Modbus slave device expects data in the Enron 32-bit format.
Slave Count From One Select this checkbox if…
7.3 Modbus List Page - Enron Mode
An Enron Modbus list contains 4 nodes on the Modbus tree. They are Coils, Short Integers, Long Integers, and Floating Point. Coils are Boolean data points - that is to say, they have a value of either 0 or 1. To that end, data points entered into the Coils node would usually be data points that are simple status indicators, indicating the status of a given alarm, input, or output. If the value of the data point is 0, the status of the logged alarm, relay, etc., would be off, and if the value is 1, the status would be on. Short integers are 16 bit whole numbers with either positive or negative sign. Long integers are 32 bit whole numbers with either positive or negative sign. Floating point values are also 32 bit numbers, but unlike the integers they do not have a sign, but they do have decimal points. Typically, they refer to concentration information. The left column on the Modbus List page indicates the available points and the right column lists the items, the Register where the data is transmitted and the Real Time Value . If desired the user can indicate a Manual Set Value by clicking on the Enable Manual Set Value box and then entering the value in the adjacent field, then pressing the Write to Analyzer icon. As an example, the user might want to adjust the Hour field for the onset of daylight saving time .

Revision 7 86 August 02, 2019
A typical example of Short integers is presented in Figure 90 and an example of Floating Points is presented in Figure 91.
Figure 90: Enron Mode, Short Integers

Revision 7 87 August 02, 2019
Figure 91: Enron Mode, Floating Points
7.4 Modbus List Page – Modicon 16 Mode
A Modicon 16 Modbus list contains 4 nodes on the Modbus tree. They are Output Status, Input Status, Input Register, and Output Register. The Input and Output Status nodes contain Boolean data points. Data points in the Output Status node are able to be written to, so the Output Status node can contain data points such as stream requests. If the value in a given stream was changed from 0 to 1, the analyzer would then initiate that stream. Data points in the Input Status node are read-only, so this node would contain data points such as alarm, input, and output status that cannot be changed remotely. Input Registers are data points that are read-only outputs of analyzer data, such as calculated concentration. Please note that Modicon 16 only outputs data as 16 bit numbers, so the display of decimal points in this type of Modbus list is not possible. Output Register contains non-Boolean data points that can be written to remotely. This could include calibration gas concentration, alarm set points, and response factors.
7.5 Modbus List Page – Modicon with Floating Points
Modicon with Floating Point is similar to the Modicon 16, as it contains 4 main nodes on the Modbus tree. However, the Input and Output Registers contain sub-nodes. They are Register Short, Register Long, and Register Float. Thus, the input and output registers can output data in 16-bit, 32-bit, or 32-bit with floating point in the Modicon with Floating Point Modbus list.
7.6 Communication Ports
The Communication Ports page shown in Figure 92 is used toconfigure the external ports through which Modbus data is exported.
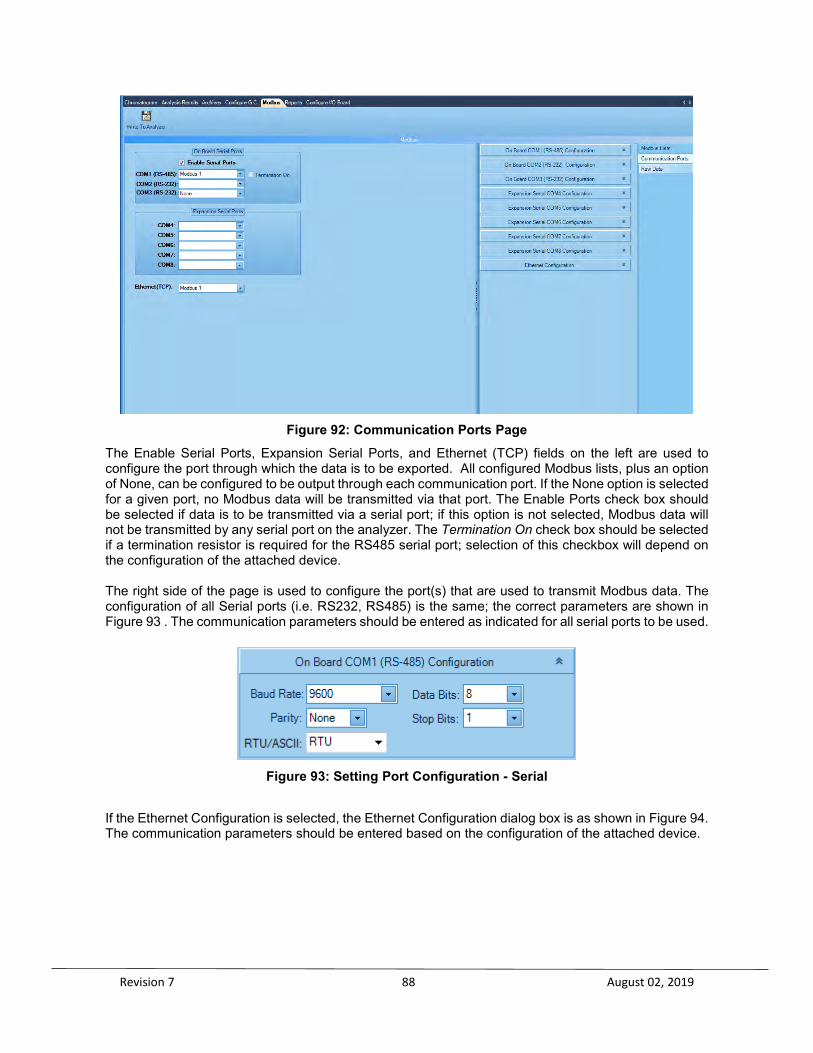
Revision 7 88 August 02, 2019
Figure 92: Communication Ports Page
The Enable Serial Ports, Expansion Serial Ports, and Ethernet (TCP) fields on the left are used to configure the port through which the data is to be exported. All configured Modbus lists, plus an option of None, can be configured to be output through each communication port. If the None option is selected for a given port, no Modbus data will be transmitted via that port. The Enable Ports check box should be selected if data is to be transmitted via a serial port; if this option is not selected, Modbus data will not be transmitted by any serial port on the analyzer. The Termination On check box should be selected if a termination resistor is required for the RS485 serial port; selection of this checkbox will depend on the configuration of the attached device. The right side of the page is used to configure the port(s) that are used to transmit Modbus data. The configuration of all Serial ports (i.e. RS232, RS485) is the same; the correct parameters are shown in Figure 93 . The communication parameters should be entered as indicated for all serial ports to be used.
Figure 93: Setting Port Configuration - Serial
If the Ethernet Configuration is selected, the Ethernet Configuration dialog box is as shown in Figure 94. The communication parameters should be entered based on the configuration of the attached device.

Revision 7 89 August 02, 2019
Figure 94: Setting Ethernet Configuration
When the required parameters have been selected correctly, press the Write to Analyzer button to save the changes to the SulfurChrome Sulfur Chromatograph.
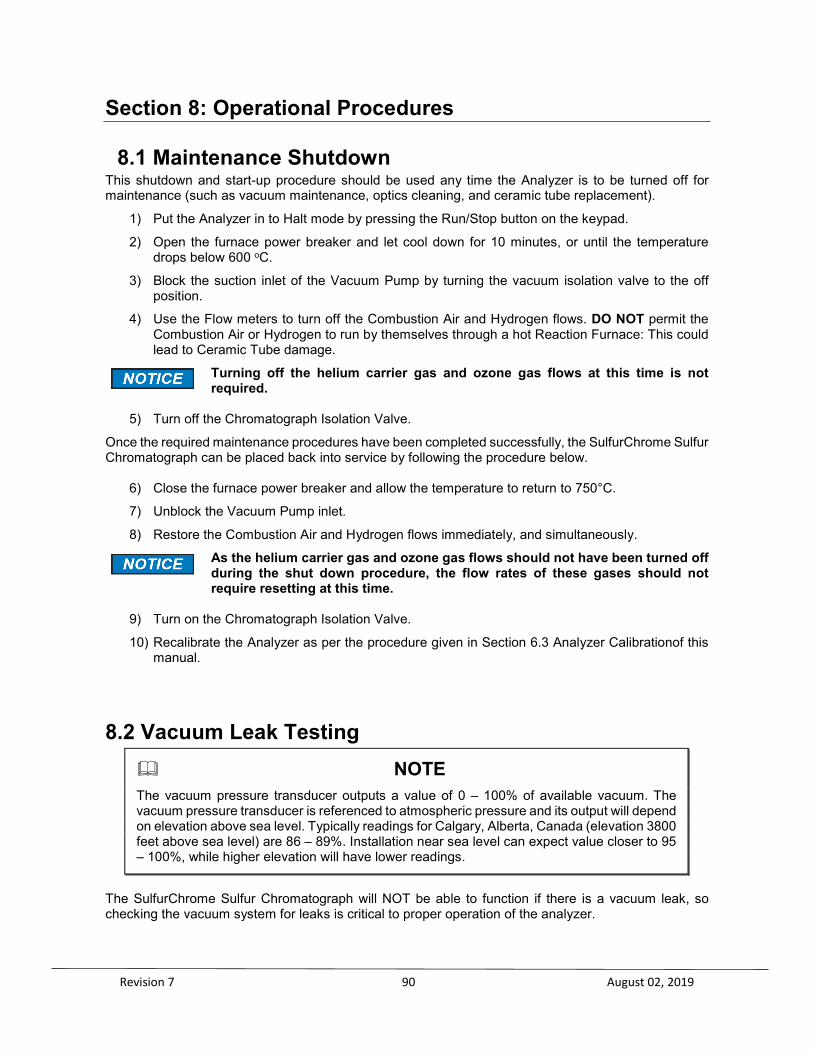
Revision 7 90 August 02, 2019
Section 8: Operational Procedures
8.1 Maintenance Shutdown This shutdown and start-up procedure should be used any time the Analyzer is to be turned off for maintenance (such as vacuum maintenance, optics cleaning, and ceramic tube replacement).
1) Put the Analyzer in to Halt mode by pressing the Run/Stop button on the keypad.
2) Open the furnace power breaker and let cool down for 10 minutes, or until the temperature drops below 600 oC.
3) Block the suction inlet of the Vacuum Pump by turning the vacuum isolation valve to the off position.
4) Use the Flow meters to turn off the Combustion Air and Hydrogen flows. DO NOT permit the Combustion Air or Hydrogen to run by themselves through a hot Reaction Furnace: This could lead to Ceramic Tube damage.
Turning off the helium carrier gas and ozone gas flows at this time is not required.
5) Turn off the Chromatograph Isolation Valve.
Once the required maintenance procedures have been completed successfully, the SulfurChrome Sulfur Chromatograph can be placed back into service by following the procedure below.
6) Close the furnace power breaker and allow the temperature to return to 750°C.
7) Unblock the Vacuum Pump inlet.
8) Restore the Combustion Air and Hydrogen flows immediately, and simultaneously.
As the helium carrier gas and ozone gas flows should not have been turned off during the shut down procedure, the flow rates of these gases should not require resetting at this time.
9) Turn on the Chromatograph Isolation Valve.
10) Recalibrate the Analyzer as per the procedure given in Section 6.3 Analyzer Calibrationof this manual.
8.2 Vacuum Leak Testing
The SulfurChrome Sulfur Chromatograph will NOT be able to function if there is a vacuum leak, so checking the vacuum system for leaks is critical to proper operation of the analyzer.
NOTE The vacuum pressure transducer outputs a value of 0 – 100% of available vacuum. The vacuum pressure transducer is referenced to atmospheric pressure and its output will depend on elevation above sea level. Typically readings for Calgary, Alberta, Canada (elevation 3800 feet above sea level) are 86 – 89%. Installation near sea level can expect value closer to 95 – 100%, while higher elevation will have lower readings.

Revision 7 91 August 02, 2019
8.2.1 Basic Vacuum Test Procedure To check for a vacuum leak, follow the procedure below.
1) If the Analyzer is running, perform a maintenance shutdown. Turn the Ozone Flowmeter OFF.
2) Open the Block Valve on the Vacuum Pump and allow the vacuum reading to stabilize at its maximum value. This may take several minutes.
3) Close the Block Valve on the Vacuum Pump. Monitor the vacuum reading for one minute: If the reading drops by more than 0.5% then a leak is present.
If there is a leak, the next step is to determine where it is and fix it.
8.2.2 Determining Vacuum Leak Location The most probable location of a Vacuum Leak is the Ceramic Tubes, so isolate them from the system and repeat the basic test procedure. There is a short black Teflon tube running from the Ceramic Tube assembly up to a bulkhead bracket, this is the PMT sample transfer line Bulkhead (the sample flows through this tube from the Reaction Furnace into the top of the PMT assembly). Disconnect that short tube from the bulkhead fitting, and cap the bulkhead fitting with a 1/8” tube cap. Repeating the test now will check the integrity of the vacuum from the Reaction Cell to the Pump. If the unit still fails the basic vacuum test, check all of the PMT fittings to ensure that they are tight. Also check the fittings and all connections running from the Vacuum Pump to the analyzer. Repeat the test procedure, and if the unit passes, skip up to the section on checking the Ceramic Tubes.
If the unit still fails the basic vacuum test, the leak may be the in the reaction cell or one of the tubes running from the Vacuum Pump to the Reaction Cell.
If a leak inside the flow meter cabinet is suspected, it is possible to eliminate that possibility by connecting the main ¼” vacuum line running into the Main Cabinet directly to the Vacuum Transducer and repeating the test. If the unit still fails the basic vacuum test, the leak may be due to a loose fitting or cracked tube inside the Flowmeter Cabinet. It would be then necessary to remove the cabinet access panel on the left side of the enclosure, and check all the black tubes and their fittings.
If a leak from the Reaction Cell is suspected, it will be necessary to remove it from the PMT and check the O-Rings (refer to Section 9.1 for the correct procedure). If required, replace the O-Rings and repeat the vacuum test.
It is also possible that the leak may be in the lines running to and from the Ozone Generator, the Combustion Air line which runs from the Reaction Furnace to the Combustion Air Flowmeter, or the Hydrogen line which runs from the Reaction Furnace to the Hydrogen Flowmeter.
To rule out the presence of a leak in the ozone lines, remove the Ozone Moisture Trap, plug it with a 1/8” tube cap, open the Vacuum Pump Block Valve, fully open the Ozone Flowmeter, and then monitor the ozone flow. After a period of time, the flow should drop to nothing and the flow indicator will sit on the bottom of the Flowmeter tube.
To rule out the presence of a leak in the Combustion Air or Hydrogen lines, connect these lines one at a time to the PMT ‘Sample In’ Bulkhead and repeat the vacuum test (thus eliminating the Reaction Tubes from the system).
NOTE Repeated vacuum testing on Ceramic Tubes may reduce their sensitivity and performance. It is generally not advisable to perform a vacuum test on new Ceramic Tubes, until they have become conditioned. If after running a new set of Ceramic Tubes for a day the Analyzer is not performing well, then perform a maintenance shutdown and vacuum test.
Revision 7 92 August 02, 2019
An additional short piece of 1/8” tubing with fittings on both ends is useful for testing this possibility. If tubing is not available, the combustion air line can be removed and used to check the hydrogen line as well.
8.2.2.1 Checking the Ceramic Tubes:
Remove the Ceramic Tubes and check that their fittings are all tight (refer to section 8.6 for the correct procedure). It may be necessary to replace the Teflon ferrules. If the Ceramic Tubes are cracked or broken, they will have to be replaced.
8.3 Hydrogen Gas Cylinder Replacement Ideally, the Hydrogen cylinder should be replaced before it runs out. If this supply gas runs out, and it is left for long periods of time, then the analyzer may require a 24-hour start up time. Additionally, the Ceramic Tubes will probably require replacement; running either Hydrogen or Combustion Air alone through the Ceramic Tubes could significantly reduce their sensitivity and performance.
Galvanic Applied Sciences recommends using a two cylinder manifold system. The pressure regulator on the main bottle is set 10psi higher than the reserve bottle ensuring that the main bottle will be drained first and provide uninterrupted gas flow. If a cylinder needs to be replaced perform a maintenance shutdown, change the bottle and restart the Analyzer (refer to the section on Maintenance Shutdown).
A large hydrogen cylinder should last 2 - 3 months provided there are no leaks in the hydrogen supply line. Galvanic Applied Sciences recommends the use of a size 300 (285 cubic feet) cylinder of UHP (99.999% pure) hydrogen gas with a dual stage regulator set at 60psig on the low pressure regulator.
8.4 Helium Gas Cylinder Replacement Ideally, the helium cylinder should be replaced before it runs out. If the helium supply runs out, the Analyzer may require a 24-hour start up time. Galvanic Applied Sciences recommends using a two cylinder manifold system. A large helium cylinder should last 3 - 6 months depending on the helium flow rate / application, provided there are no leaks in the helium supply line.
8.5 Desiccant Replacement The inlets to the ozone generator and the combustion air are equipped with Moisture Traps that are filled with indicating desiccant. The color of the desiccant should be observed regularly. The Analyzer is supplied with mol sieve desiccant that changes from blue to white when it is spent. Any indicating desiccant such as silica gel or Drierite can be used.
Desiccant replacement should take place at the same time as other regular maintenance.
To change the desiccant, remove the clamps that hold the Moisture Traps in place. Remove the fittings attached to the top and bottom of the Moisture Traps. Screw the top off of the cylinder and empty out the old desiccant, fill with new desiccant, and then reinstall the desiccant cylinders.
8.6 Ceramic Tube Replacement The Ceramic Tubes do not need to be changed regularly. They can remain in service for a considerable period of time without requiring replacement. They only need to be changed when their sensitivity has been damaged by either a vacuum leak, running them without the correct balance of supply gasses, or due to improper start-up and/or shutdown procedures.
The Ceramic Tubes can have an impact upon the performance of the Analyzer. If a problem with the Ceramic Tubes is suspected, please also refer to sections 10.2 and 10.3 – Analyzer Troubleshooting.
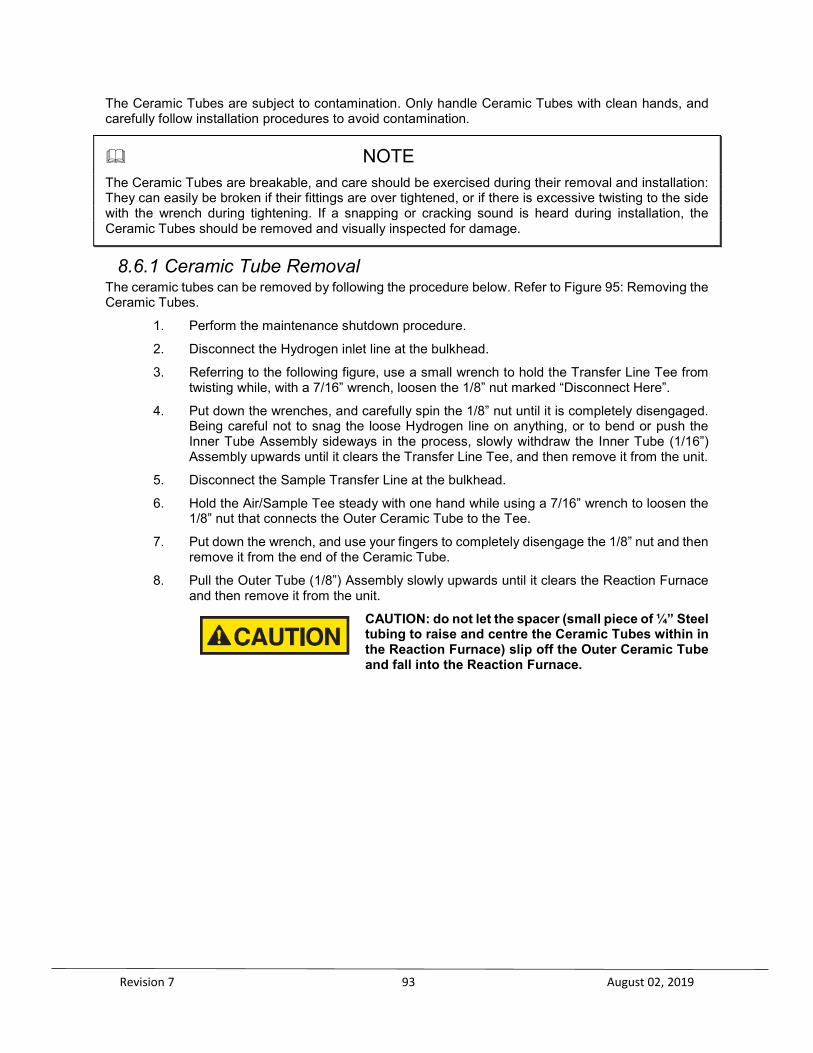
Revision 7 93 August 02, 2019
The Ceramic Tubes are subject to contamination. Only handle Ceramic Tubes with clean hands, and carefully follow installation procedures to avoid contamination.
NOTE The Ceramic Tubes are breakable, and care should be exercised during their removal and installation: They can easily be broken if their fittings are over tightened, or if there is excessive twisting to the side with the wrench during tightening. If a snapping or cracking sound is heard during installation, the Ceramic Tubes should be removed and visually inspected for damage.
8.6.1 Ceramic Tube Removal The ceramic tubes can be removed by following the procedure below. Refer to Figure 95: Removing the Ceramic Tubes.
1. Perform the maintenance shutdown procedure.
2. Disconnect the Hydrogen inlet line at the bulkhead.
3. Referring to the following figure, use a small wrench to hold the Transfer Line Tee from twisting while, with a 7/16” wrench, loosen the 1/8” nut marked “Disconnect Here”.
4. Put down the wrenches, and carefully spin the 1/8” nut until it is completely disengaged. Being careful not to snag the loose Hydrogen line on anything, or to bend or push the Inner Tube Assembly sideways in the process, slowly withdraw the Inner Tube (1/16”) Assembly upwards until it clears the Transfer Line Tee, and then remove it from the unit.
5. Disconnect the Sample Transfer Line at the bulkhead.
6. Hold the Air/Sample Tee steady with one hand while using a 7/16” wrench to loosen the 1/8” nut that connects the Outer Ceramic Tube to the Tee.
7. Put down the wrench, and use your fingers to completely disengage the 1/8” nut and then remove it from the end of the Ceramic Tube.
8. Pull the Outer Tube (1/8”) Assembly slowly upwards until it clears the Reaction Furnace and then remove it from the unit.
CAUTION: do not let the spacer (small piece of ¼” Steel tubing to raise and centre the Ceramic Tubes within in the Reaction Furnace) slip off the Outer Ceramic Tube and fall into the Reaction Furnace.

Revision 7 94 August 02, 2019
Figure 95: Removing the Ceramic Tubes
8.6.2 Ceramic Tube Replacement
NOTES All of the connections made to Ceramic Tubes use Teflon ferrules and employ a special ‘back-to-back’ two back ferrule arrangement shown in Figure 96: Back-to-Back Ferrules, which helps to reduce leakage.
Refer to the Back-to-Back Ferrule figure. Tighten these connections finger tight plus ½ to ¾ of a turn (Caution: over tightening could break the Ceramic Tubes, in particular the 1/16” Inner Ceramic Tube).
Before handling them, thoroughly clean hands and take all possible steps to prevent contamination of the new Ceramic Tubes.
Completely disassemble the Outer and Inner Ceramic Tube Assemblies and discard all used Teflon ferrules and used Ceramic Tubes.
Carefully note how the assemblies were constructed and/or refer to Figure 97 which shows the layout and orientation of all ferrules and fittings for re-assembly.
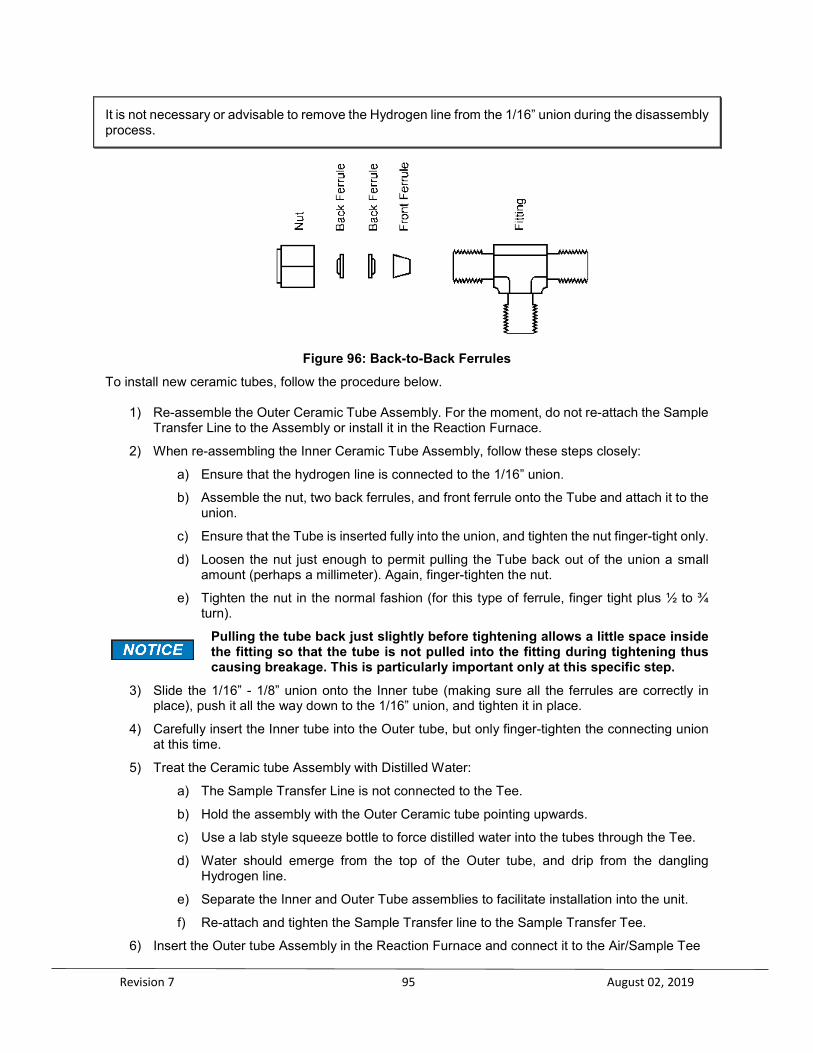
Revision 7 95 August 02, 2019
It is not necessary or advisable to remove the Hydrogen line from the 1/16” union during the disassembly process.
Figure 96: Back-to-Back Ferrules
To install new ceramic tubes, follow the procedure below.
1) Re-assemble the Outer Ceramic Tube Assembly. For the moment, do not re-attach the Sample Transfer Line to the Assembly or install it in the Reaction Furnace.
2) When re-assembling the Inner Ceramic Tube Assembly, follow these steps closely:
a) Ensure that the hydrogen line is connected to the 1/16” union.
b) Assemble the nut, two back ferrules, and front ferrule onto the Tube and attach it to the union.
c) Ensure that the Tube is inserted fully into the union, and tighten the nut finger-tight only.
d) Loosen the nut just enough to permit pulling the Tube back out of the union a small amount (perhaps a millimeter). Again, finger-tighten the nut.
e) Tighten the nut in the normal fashion (for this type of ferrule, finger tight plus ½ to ¾ turn).
Pulling the tube back just slightly before tightening allows a little space inside the fitting so that the tube is not pulled into the fitting during tightening thus causing breakage. This is particularly important only at this specific step.
3) Slide the 1/16” - 1/8” union onto the Inner tube (making sure all the ferrules are correctly in place), push it all the way down to the 1/16” union, and tighten it in place.
4) Carefully insert the Inner tube into the Outer tube, but only finger-tighten the connecting union at this time.
5) Treat the Ceramic tube Assembly with Distilled Water:
a) The Sample Transfer Line is not connected to the Tee.
b) Hold the assembly with the Outer Ceramic tube pointing upwards.
c) Use a lab style squeeze bottle to force distilled water into the tubes through the Tee.
d) Water should emerge from the top of the Outer tube, and drip from the dangling Hydrogen line.
e) Separate the Inner and Outer Tube assemblies to facilitate installation into the unit.
f) Re-attach and tighten the Sample Transfer line to the Sample Transfer Tee.
6) Insert the Outer tube Assembly in the Reaction Furnace and connect it to the Air/Sample Tee

Revision 7 96 August 02, 2019
The sample transfer line Tee should end up facing the cabinet side wall once the Air/Sample Tee has been tightened in place. It may take several attempts to accomplish this (use judgment to determine which angle the Sample Transfer line should initially be facing so that it ends up pointing were it should afterwards).
7) Carefully guide the Inner Ceramic Tube Assembly into the Tee, and thus into the Outer Ceramic Tube Assembly. Use a small wrench to hold the Transfer Line Tee from twisting while, with a 7/16” wrench, tighten the 1/8” nut connecting the inner and outer assemblies.
8) Re-connect the Hydrogen line.
Do not perform a Vacuum leak test at this time.
Figure 97: Ceramic Tube Basic Assembly

Revision 7 97 August 02, 2019

Revision 7 98 August 02, 2019
Section 9: Service Procedures Only Qualified Technicians should carry out Service Procedures.
This section has been written specifically for a standard SulfurChrome Sulfur Chromatograph. The procedures in this section may vary slightly for other models.
There are few user-serviceable parts in the SulfurChrome Sulfur Chromatograph. The descriptions and procedures in this section are intended for qualified service technician use only. Unauthorized service or modification of the Analyzer during the warranty period may invalidate warranty coverage. Please contact the Service Department of Galvanic Applied Sciences for all service requests. Follow all safety precautions pertaining to the installation and operation of this Analyzer and related equipment. If the Analyzer is installed in a hazardous area, follow all precautions as outlined in this manual, and those governing the district that the analyzer is installed. This analyzer should be approved for the jurisdiction and area in which it is installed. Contact Galvanic Applied Sciences with any questions regarding safe operation of this Analyzer before using it. Please read all operational procedures and note all cautions and warnings before operating this Analyzer. Technical assistance may be obtained from: Galvanic Applied Sciences, Inc, Analyzer Service Department 7000 Fisher Road SE Calgary, Alberta, Canada T2H 0W3 Phone: (403) 252-8470 Fax: (403) 255-6287 E-mail: [email protected]
9.1 Reaction Cell Cleaning The Reaction Cell should be removed and cleaned every 6 to 12 months (every 3 – 6 maintenance cycles). A build up of the by-products from the chemical reactions taking place within the Analyzer will have an adverse impact upon sensitivity and performance.
The Reaction Cell can be removed using the following procedure.
1) Perform the maintenance shutdown procedure.
2) A switch for each individual sub-system is provided inside the main cabinet on the left side: turn off the PMT so that the Photomultiplier Tube is not energized when the Reaction Cell is removed. The light on the PMT Power Supply board should go out. Caution: exposing the Photomultiplier Tube to direct light while energized may cause permanent damage to it.
3) Disconnect all of the tubes going to the reaction chamber. Disconnect the Sample Transfer line at the bulkhead Fitting.
4) The six hex screws holding the Reaction Cell in place should be loosened only a little at a time, alternating back and forth between opposite sides of the Reaction Cell.

Revision 7 99 August 02, 2019
5) Slowly remove the Reaction Cell, being careful that the glass Optical Filter does not fall.
6) Remove the Sample Transfer line from the Reaction Cell.
The Reaction Cell and Optical Filter can be cleaned using the following procedure.
1) Isopropyl Alcohol can be used to initially clean the Optical Filter, the Reaction Cell and its attached Fittings. Afterwards, rinse these components very well with hot water and dry them with a soft tissue. Ensure that these components are clean of lint or any other contaminant after the cleaning process and during installation.
2) Check the end of the Sample Transfer line to ensure that it is clean: it can also be cleaned in the same manner. Re-attach the Sample Transfer line to the Reaction Cell: note that the end of the Sample Transfer line enters the Reaction Cell and should come flush to the inside surface of the Reaction Chamber once the nut is tightened.
3) If it is necessary to replace this line, carefully cut the new black Teflon tubing with a sharp, clean utility knife so that the end of the replacement tubing is flush with the inside of the Reaction Chamber; take extreme care not to scratch or mark the inside of the Reaction Chamber with the knife (it is probably best to tighten the nut with excess tubing protruding, carefully mark the tubing and then remove it for cutting).
CAUTION If the Reaction Cell O-Rings are not correctly in place, tightening the hex screws will crack the Optical Filter. Over tightening the Reaction Cell hex screws could crack the Optical Filter. If the hex screws are not tightened in an alternating fashion, a little at a time across alternate sides of the Reaction Cell, the Optical Filter may crack.
The Reaction Cell can be reinstalled by using the following procedure.
1) Inspect the O-rings for damage and replace them if necessary. Note that there is one O-Ring that sits underneath the Optical Filter, two that sit above it, and that they are all different sizes (Galvanic replacement O-Ring Kit: # SA1732).
2) Reassemble the Reaction Cell ensuring that all O-rings are properly in place.
a) Insert the Optical Filter into its place, with its O-Ring installed underneath it.
b) A small piece of thin, smooth cardboard, or a slick piece of stiff, thin plastic could be used to hold the O-Rings to the underneath of the Reaction Cell.
c) Carefully lower the Reaction Cell into position without letting the O-Rings move.
d) Lightly tighten in a couple of the hex screws to help keep the O-Rings in position.
e) Slowly and carefully wiggle the cardboard/plastic so that the O-rings remain in place.
3) When replacing the hex screws, tighten them a little at a time alternating between opposite sides of the Reaction Cell.
a) Gently tightening each hex screw about three times will probably be enough, but keep going around until all the hex screws are snug.
b) You should be able to see the Reaction Cell lowering evenly all around during the tightening process.
c) If it seems that the O-Rings may not be seated correctly, do not continue tightening: remove the Reaction Cell and re-attempt the procedure.
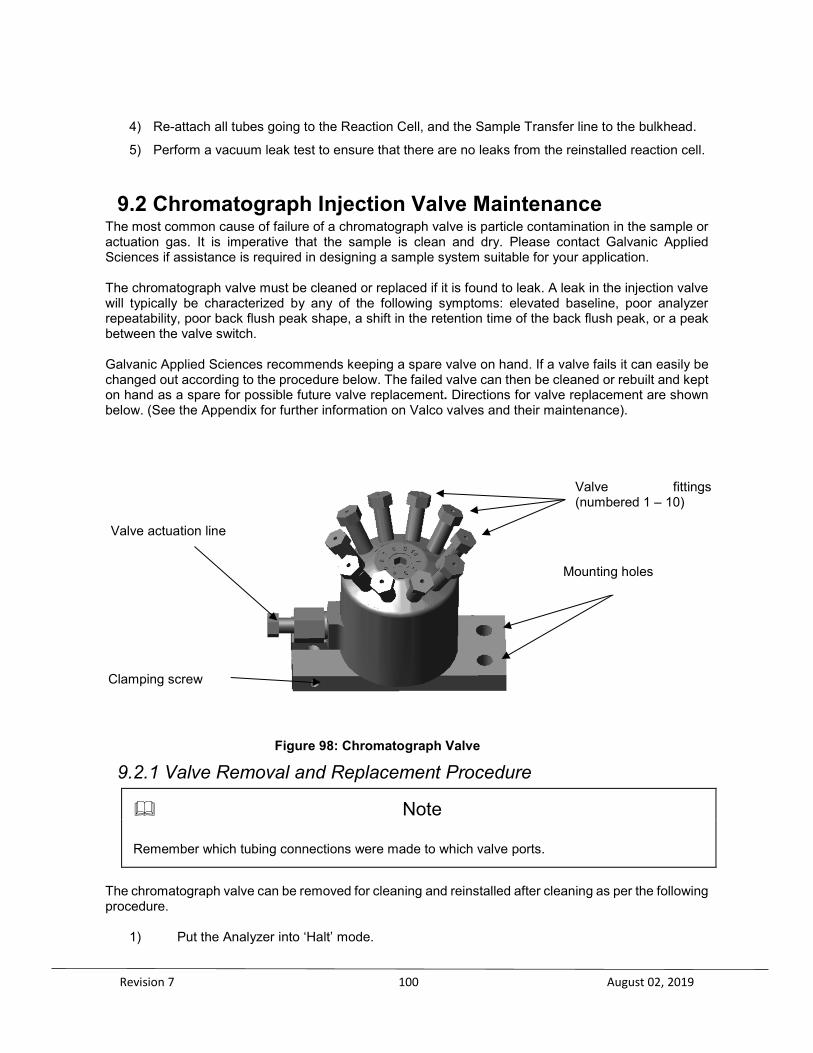
Revision 7 100 August 02, 2019
4) Re-attach all tubes going to the Reaction Cell, and the Sample Transfer line to the bulkhead.
5) Perform a vacuum leak test to ensure that there are no leaks from the reinstalled reaction cell.
9.2 Chromatograph Injection Valve Maintenance The most common cause of failure of a chromatograph valve is particle contamination in the sample or actuation gas. It is imperative that the sample is clean and dry. Please contact Galvanic Applied Sciences if assistance is required in designing a sample system suitable for your application.
The chromatograph valve must be cleaned or replaced if it is found to leak. A leak in the injection valve will typically be characterized by any of the following symptoms: elevated baseline, poor analyzer repeatability, poor back flush peak shape, a shift in the retention time of the back flush peak, or a peak between the valve switch.
Galvanic Applied Sciences recommends keeping a spare valve on hand. If a valve fails it can easily be changed out according to the procedure below. The failed valve can then be cleaned or rebuilt and kept on hand as a spare for possible future valve replacement. Directions for valve replacement are shown below. (See the Appendix for further information on Valco valves and their maintenance).
Figure 98: Chromatograph Valve
9.2.1 Valve Removal and Replacement Procedure
The chromatograph valve can be removed for cleaning and reinstalled after cleaning as per the following procedure.
1) Put the Analyzer into ‘Halt’ mode.
Note Remember which tubing connections were made to which valve ports.
Valve fittings (numbered 1 – 10)
Valve actuation line
Clamping screw
Mounting holes

Revision 7 101 August 02, 2019
2) Turn off the sample gas flow to the Analyzer. Leave all other utility gases flowing. 3) Note how all the lines are connected to the valve so that they can be easily reconnected. 4) Undo all ten fittings that go into the ten ports of the valve. Undo the air actuation line. 5) Turn off Block Valve to the inlet of the reaction furnace (chromatograph isolation valve). 6) Remove the valve by loosening the screws that hold down the valve-mounting bracket. 7) Replace the valve and the mounting screws. 8) Re-connect the ten fittings to the correct ports. Re-attach the actuation line. 9) Return the sample flow to the Analyzer. 10) Open the block valve at the inlet of the reaction furnace 11) At this point the Analyzer is ready to resume analysis, but should be allowed time for
stabilization.
9.3 Photomultiplier Tube (PMT) Testing and Replacement The PMT does not need to be changed regularly: It can remain in service for a considerable period of time without requiring replacement. It only needs to be changed when there is a loss of sensitivity or a degradation of repeatability that is linked directly to the PMT.
The PMT can have an impact upon the performance of the analyzer. If a problem with the PMT is suspected, please also refer to sections 10.2 and 10.3 for further troubleshooting tips.
CAUTION The Photomultiplier Tube is an extremely sensitive light detector and should not be operated under daylight or room lighting levels. Even when not under power, exposure to daylight or normal lighting conditions causes a reaction within the Photomultiplier Tube that, while not actually damaging to the tube, may have an adverse affect upon it’s operational sensitivity and repeatability for a period of time. The Photomultiplier Tube manufacturer recommends that: “Tubes are not exposed to daylight or fluorescent room lights but are loaded into instruments under subdued lighting conditions”.
9.3.1 Testing PMT Response
To test the PMT’s response to light, follow the procedure below. 1) Perform a maintenance shutdown. 2) Disconnect the Vacuum Transducer tube that runs to the Reaction Cell at the Reaction Cell. 3) Monitor the signal baseline: it will probably rise due to the increased light entering the Reaction
Chamber. 4) Use a small flashlight to very briefly shine light into the open fitting: the baseline should go off scale
(exceed 2999mV).
If the baseline does NOT go off scale as it should, follow the procedure below.
1) Verify that the LED on the PMT Power Supply board is on (indicating that the board is powered up). 2) Additionally, use a Multimeter to measure the DC voltage powering the Photomultiplier Tube:
a) Note: Turn off power to the Mainboard prior to measuring this voltage (the appropriate switch on the main termination block will turn off power to just the Mainboard. CAUTION: failure to do so may cause damage to the Mainboard).
b) Note: The Multimeter will need to be able to measure DC voltages up to 1,250 VDC (if the Multimeter is not able to read High DC voltage, do not use it).
Revision 7 102 August 02, 2019
c) Note: The power connections come off the right hand side of the PMT Power Supply board. d) Note: The voltage should read between 800 and 1200 VDC (typically 1000 -1100 VDC).
This indicates that the Photomultiplier Tube is receiving the appropriate supply voltage.
3) Check that the LED on the signal Pre-Amp board is also on. a) Confirm that signal gain is set to at least 1M-Ohm (refer to the procedure on Pre-Amp gain). b) Use a Multimeter to measure the raw signal output from the Pre-Amp board while repeating the
above response test (this will indicate whether or not a signal is making it to the output of the Pre-Amp board).
If these steps fail to produce the expected results, it is probable that the PMT and/or the PMT Socket has failed and requires replacement. Remove the PMT as described in section 9.3.2 and visually inspect it for damage or other irregularities. Also refer to sections 10.2 and 10.3 for further troubleshooting tips.
9.3.2 Removing/Replacing the PMT The Photomultiplier Tube can be removed and replaced without performing a maintenance shutdown. The analyzer can be left on during the PMT removal and replacement processes if the following steps are adhered to.
1) Read the Caution notice at the beginning of section 9.3. 2) Turn off the PMT power at the Main Termination Block using the appropriate switch. 3) Ensure that power-indicating LED on the PMT Power Supply is not illuminated. 4) Use the four thumbscrews to release to the PMT Base Cover, and remove it.
a) Note: the thumbscrews do not need to be completely removed, only backed off to permit the PMT Base Cover to slip down.
5) The PMT signal cable may be held to the side, separated from the high voltage wires, with a cable twist-restrainer: undo the twist-restrainer and free the signal cable to facilitate the removal and replacement of the Photomultiplier Tube.
6) Use a slot screwdriver to undo the two 6-32 screws on the underside of the PMT Assembly that are securing the PMT Socket in place.
7) Lower the PMT Socket, with Photomultiplier Tube, straight down until it clears the PMT Assembly.
8) Remove the Tube from the Socket, and inspect both for signs of corrosion or irregularities. 9) Replace the Photomultiplier Tube by reversing the proceeding removal steps, noting:
a) There is one missing pin on the Tube and it will only fit into the socket one way. b) There are two black O-Ring washers installed onto the PMT Socket to help prevent light
leakage into the PMT Chamber. c) There may be a protective cap or cover on the end of a new Photomultiplier Tube that
protects it from incidental and unnecessary exposure to light: remove this just prior to inserting the new Photomultiplier Tube into the PMT Assembly.
d) There is a cut-out on the back/bottom of the PMT Base Cover to allow the PMT signal and voltage wires to pass through: ensure the wires pass through this cut-out.
e) The thumbscrew washers go on the exterior of the PMT Base Cover. f) Separate the signal wire from the high voltage wires by tying it back in the cable twist-
restraint. 10) The signal mV level on the LCD display should rise slightly when PMT power is re-instated.
Note that anytime the Photomultiplier Tube is turned off for a while, or replaced, it will take time for the unit to reach and stabilize at its correct operating temperature.
Revision 7 103 August 02, 2019
Note When removing the Photomultiplier Tube, check for condensation on the Tube or corrosion in the socket as a result of condensation. If condensation is present, check that the PMT purge system is connected and operating correctly.
9.3.3 Matching PMT Power Supply to the Photomultiplier Tube For optimum performance and lifespan, the Photomultiplier Tube should be operated at a suitable supply Voltage. The Galvanic Applied Sciences PMT Power Supply board (PT0847) can be adjusted from 0 VDC - 1250 VDC. This adjustment can be made at potentiometer R1 on the Power Supply board, using a small screwdriver: please follow all steps of the procedure and all cautions closely to avoid equipment damage. Typically, the recommended voltage setting for an Electron Tubes Limited Photomultiplier Tube will be between 700 and 1100 VDC. This recommended setting can be obtained from the test ticket the Electron Tubes provides with each Photomultiplier Tube. Electron Tubes recommends the Photomultiplier Tube not be operated beyond the maximum recommended overall sensitivity specified. Beyond this limit, feedback effects become significant, resulting in unstable performance with the possibility of breakdown. 9.3.3.1 Electron Tube Photomultiplier Test Ticket Information
Nominal Sensitivity Voltage Level: This is the recommended minimum operating voltage setting for the PMT voltage supply. On the Electron Tube test ticket look for: Volts @ 200A/lm = X, where X will be the Voltage setting for that individual Photomultiplier Tube. Maximum Overall Sensitivity Voltage Level: This is the maximum voltage beyond which the PMT should not be operated (permanent damage or premature failure could otherwise result). On the Electron Tube test ticket look for: Volts @ 2000A/lm = X, where X will be the Voltage setting for that individual Photomultiplier Tube.
9.3.3.2 Setting the PMT Power Supply
Note Ozone production, Ceramic Tube sensitivity, Pre-Amp board gain settings, and other factors also affect Analyzer sensitivity and performance. Please understand the reason that the PMT Power Supply needs to be changed before making any adjustments; it is desirable to keep the PMT power Supply Voltage setting as low as possible while still providing acceptable levels of performance.
The PMT Power Supply can be adjusted without performing a maintenance shut down. However, to prevent damage to other analyzer electronics, the analyzer controller board and input / output board should be powered down prior to carrying out this procedure. Prior to installing a new Photomultiplier Tube, it should be confirmed that the PMT Power Supply is set below the Maximum Overall Sensitivity Voltage Level. Follow these steps for setting the initial PMT Power Supply voltage: 1) Ensure that a Photomultiplier Tube is not installed (or that the voltage supply wires running
to the Photomultiplier Tube have been disconnected) so that the Photomultiplier Tube is not accidentally exposed to voltages exceeding the recommended Maximum Overall Sensitivity Voltage Level.

Revision 7 104 August 02, 2019
2) Obtain the Electron Tube test ticket information for the Photomultiplier Tube that is going to be installed in the Analyzer.
3) Put the Analyzer into Halt mode. 4) At the end of the current analysis, turn off the controller board and IO board.
a) Note: use the appropriate switch on the Main Termination Block (located in the Main Cabinet on the Left Sidewall) to disconnect power to just the controller board and I/O board).
b) Ensure that all lights on the controller board and IO board are off, indicating that they have powered down
5) Ensure that the Voltage Meter being used is capable of measuring High DC Voltage. 6) Measure the DC voltage from the connector (P2) on the right hand side of the PMT Power
Supply board: it will probably be between 800 – 1250 VDC. 7) A small screwdriver can be used to lower or raise the voltage by turning the potentiometer
(R1) on the PMT Power Supply board. a) Note: clockwise decreases the voltage. b) Note: counter-clockwise increases the voltage.
8) For an initial setting, adjust the voltage so that it is somewhat less than the Maximum Overall Sensitivity Voltage Level (i.e.: Volts @ 2000A/lm = 1018.00 V, set at 975 – 1000V). a) Note: a lower setting will reduce the mV/ppm chromatogram peak height. b) Note: a higher setting will increase the mV/ppm chromatogram peak height.
9) Following the Removal/Replacement procedures, install the Photomultiplier Tube. 10) Once power has been restored to the PMT circuit, power up the Mainboard. 11) Allow time for the Oven temperature to stabilize. 12) Run several calibration sequences and compare the calibration standard to the mV peak
height that is obtained (Peak Analysis data or chromatogram). (a) Note: there are several factors that can affect peak height and sensitivity. (b) Note: for a standard 0-20ppm H2S Analyzer, a 50mV/ppm is a good minimum
response, for example: 10ppm calibration standard should provide a peak height of approximately 500mV).
13) If the peak height is more than acceptable for the application, then it would be desirable to reduce the PMT power Supply voltage (reducing the PMT Power Supply could increase the signal to noise ratio and improve the repeatability of the analyzer).
(a) Follow the steps listed above for halting the analyzer and powering down the controller / IO board prior to measuring or re-adjusting the PMT Power Supply board voltage level.
14) Note: if the peak height is not acceptable, it is possible that Photomultiplier Tube is either faulty or has lower sensitivity, or that one of the other factors affecting performance needs to be addressed. Refer to sections 10.2 and 10.3 and address all other possibilities that would account for low sensitivity.
15) Keep repeating the voltage adjustment process until the desired balance for performance and sensitivity is attained.
9.3.3.3 Setting the Signal Gain and the Pre-Amp Board
The raw PMT signal is amplified by the 841 Pre-Amp Board (PT0847) before it is sent to the microprocessor control circuitry. Switch bank ‘S1’ has four switches for controlling the amount of signal gain. The signal gain is controlled by four resistors, from left to right: 0.5M - 1M - 5M – 10M Ohm. The gain factor is added if the switch is down. The standard setting for a 0-20ppm Analyzer is 1M-Ohm. To increase, or add, gain amplification, simply move additional or higher gain switches into the down position. For lower range analyzers, change the default gain to a higher setting (i.e.: 5 M-ohm) so that the mV/ppm ration is increased. Note: this board simply amplifies the raw signal from the Photomultiplier Tube; signal noise is also increased accordingly.
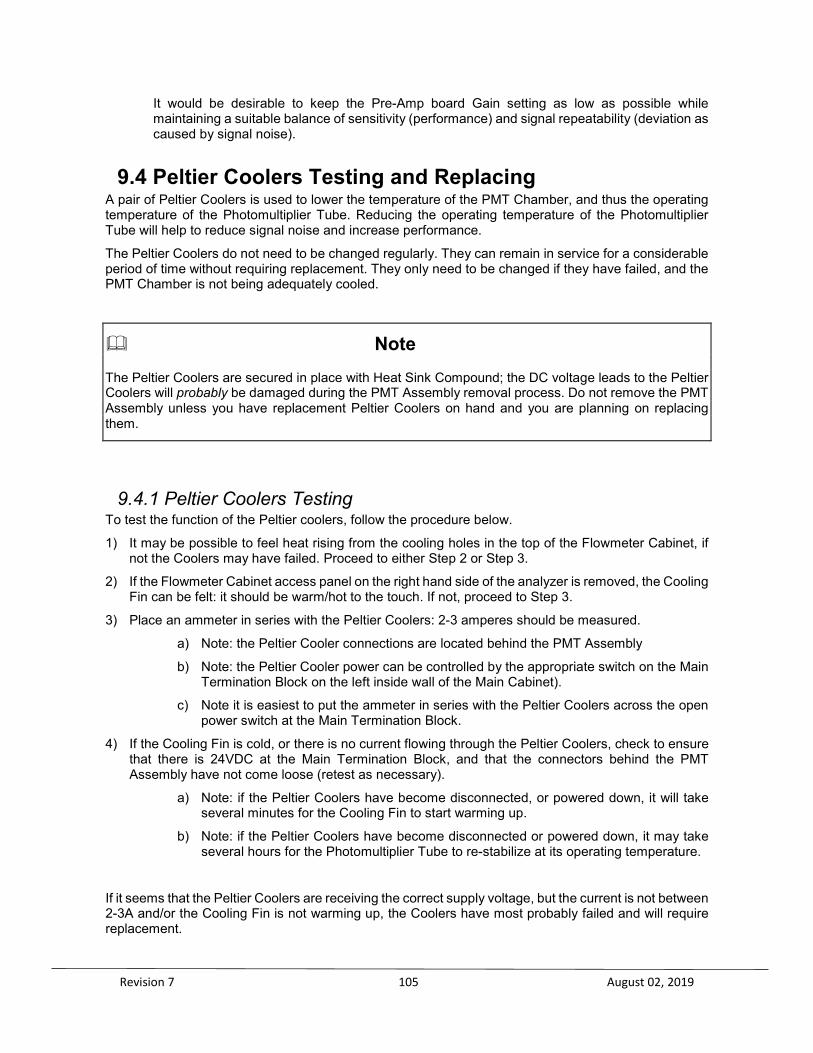
Revision 7 105 August 02, 2019
It would be desirable to keep the Pre-Amp board Gain setting as low as possible while maintaining a suitable balance of sensitivity (performance) and signal repeatability (deviation as caused by signal noise).
9.4 Peltier Coolers Testing and Replacing A pair of Peltier Coolers is used to lower the temperature of the PMT Chamber, and thus the operating temperature of the Photomultiplier Tube. Reducing the operating temperature of the Photomultiplier Tube will help to reduce signal noise and increase performance.
The Peltier Coolers do not need to be changed regularly. They can remain in service for a considerable period of time without requiring replacement. They only need to be changed if they have failed, and the PMT Chamber is not being adequately cooled.
Note The Peltier Coolers are secured in place with Heat Sink Compound; the DC voltage leads to the Peltier Coolers will probably be damaged during the PMT Assembly removal process. Do not remove the PMT Assembly unless you have replacement Peltier Coolers on hand and you are planning on replacing them.
9.4.1 Peltier Coolers Testing To test the function of the Peltier coolers, follow the procedure below.
1) It may be possible to feel heat rising from the cooling holes in the top of the Flowmeter Cabinet, if not the Coolers may have failed. Proceed to either Step 2 or Step 3.
2) If the Flowmeter Cabinet access panel on the right hand side of the analyzer is removed, the Cooling Fin can be felt: it should be warm/hot to the touch. If not, proceed to Step 3.
3) Place an ammeter in series with the Peltier Coolers: 2-3 amperes should be measured.
a) Note: the Peltier Cooler connections are located behind the PMT Assembly
b) Note: the Peltier Cooler power can be controlled by the appropriate switch on the Main Termination Block on the left inside wall of the Main Cabinet).
c) Note it is easiest to put the ammeter in series with the Peltier Coolers across the open power switch at the Main Termination Block.
4) If the Cooling Fin is cold, or there is no current flowing through the Peltier Coolers, check to ensure that there is 24VDC at the Main Termination Block, and that the connectors behind the PMT Assembly have not come loose (retest as necessary).
a) Note: if the Peltier Coolers have become disconnected, or powered down, it will take several minutes for the Cooling Fin to start warming up.
b) Note: if the Peltier Coolers have become disconnected or powered down, it may take several hours for the Photomultiplier Tube to re-stabilize at its operating temperature.
If it seems that the Peltier Coolers are receiving the correct supply voltage, but the current is not between 2-3A and/or the Cooling Fin is not warming up, the Coolers have most probably failed and will require replacement.

Revision 7 106 August 02, 2019
9.4.2 Testing and Modifying Replacement Peltier Coolers The Replacement Coolers will need to be tested and modified prior to installation. While the procedure for this testing and modification is given below, this procedure should NOT be attempted without factory guidance and optimally should only be performed at the factory.
1) The Coolers can be tested individually with a 12VDC-power source.
Determine the hot and cold sides during the testing, and label them with a pencil to help prevent making an error during assembly and installation.
2) Connect the Two Peltier Coolers in series: solder and insulate the connection.
3) Connect 20-24AWG Gold Crimp Connection Sockets (DIGI-KEY 800 344-4539) to the remaining DC negative and positive leads.
Note: Insulating the Crimp Connectors with heat shrink tubing at this point will prevent the leads from fitting through holes in the PMT sidewall. Insulate them at a later point in the process.
9.4.3 Peltier Cooler Replacement To replace the Peltier coolers, follow the procedure below.
1) Obtain replacement Peltier Coolers: tested, modified and ready to install.
Note: Heat Sink Compound will also be required. Galvanic Applied Sciences recommends the use of TECHSPRAY Silicone Free Heat Sink Compound, -40c to 200c, will not harden).
2) Perform a maintenance shutdown.
3) Remove the Photomultiplier Tube (refer to section 9.3.2).
4) Disconnect all the tubes running to the PMT Assembly.
5) Use the appropriate switch at the Main Termination Block to power down the Peltier Coolers, and pull apart the connectors running to them (located behind the PMT Assembly).
6) Remove the six thumbscrews w/springs that are holding the PMT Assembly in place.
7) Pull the PMT Assembly from the wall and remove it from the Analyzer:
Note: it may require some force to break the seal created by the heat sink compound and the leads to the existing Peltier Coolers will probably be broken in the process.
8) It will be necessary to remove the plastic Isolation Plate from the back of the assembly, and the PMT Sidewall to facilitate the removal and replacement of the Coolers.
Note: remember the orientation and position of all components. 9) Clean the old heat sink compound from all components.
10) Installing the new Peltier Coolers is basically the reverse of the removal process.
a) Read the General Notes on re-assembly and installation.
b) Carefully guide the Cooler leads through the sidewall holes, ensure all foam installation material is replaced as it was.
c) Re-attach all PMT Assembly plates, install the heat transfer plate into position.
d) Use heat shrink tubing to insulate the leads to the Peltier Coolers.
e) Remount the PMT Assembly in the main cabinet.
f) Re-attach all tubes and wires.
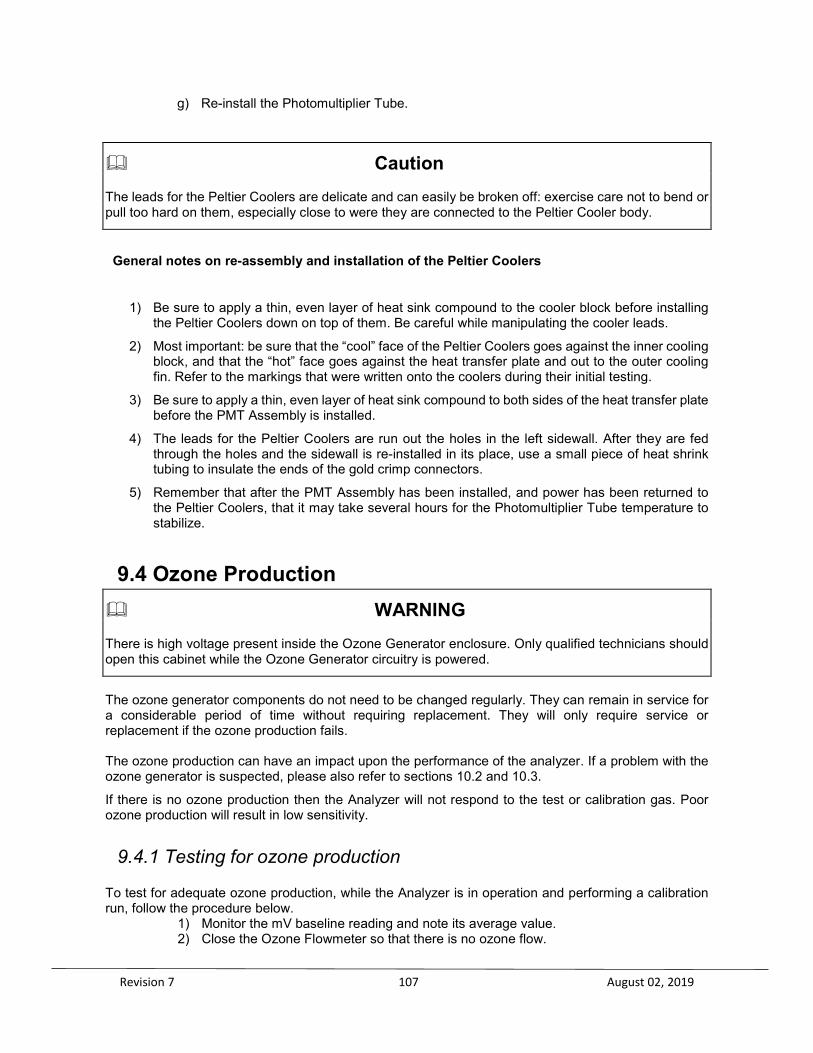
Revision 7 107 August 02, 2019
g) Re-install the Photomultiplier Tube.
Caution The leads for the Peltier Coolers are delicate and can easily be broken off: exercise care not to bend or pull too hard on them, especially close to were they are connected to the Peltier Cooler body.
General notes on re-assembly and installation of the Peltier Coolers
1) Be sure to apply a thin, even layer of heat sink compound to the cooler block before installing the Peltier Coolers down on top of them. Be careful while manipulating the cooler leads.
2) Most important: be sure that the “cool” face of the Peltier Coolers goes against the inner cooling block, and that the “hot” face goes against the heat transfer plate and out to the outer cooling fin. Refer to the markings that were written onto the coolers during their initial testing.
3) Be sure to apply a thin, even layer of heat sink compound to both sides of the heat transfer plate before the PMT Assembly is installed.
4) The leads for the Peltier Coolers are run out the holes in the left sidewall. After they are fed through the holes and the sidewall is re-installed in its place, use a small piece of heat shrink tubing to insulate the ends of the gold crimp connectors.
5) Remember that after the PMT Assembly has been installed, and power has been returned to the Peltier Coolers, that it may take several hours for the Photomultiplier Tube temperature to stabilize.
9.4 Ozone Production WARNING There is high voltage present inside the Ozone Generator enclosure. Only qualified technicians should open this cabinet while the Ozone Generator circuitry is powered.
The ozone generator components do not need to be changed regularly. They can remain in service for a considerable period of time without requiring replacement. They will only require service or replacement if the ozone production fails. The ozone production can have an impact upon the performance of the analyzer. If a problem with the ozone generator is suspected, please also refer to sections 10.2 and 10.3.
If there is no ozone production then the Analyzer will not respond to the test or calibration gas. Poor ozone production will result in low sensitivity.
9.4.1 Testing for ozone production To test for adequate ozone production, while the Analyzer is in operation and performing a calibration run, follow the procedure below.
1) Monitor the mV baseline reading and note its average value. 2) Close the Ozone Flowmeter so that there is no ozone flow.

Revision 7 108 August 02, 2019
3) Note that the baseline should drop, and the Analyzer should stop responding to the calibration gas. Note the average baseline value with no ozone flow.
4) Reset the ozone flow rate to 2 and continue monitoring the baseline. 5) The baseline should increase and the Analyzer should start responding to the
calibration gas. Guideline: For a typical baseline between 3-5mV, closing the Ozone Flowmeter should reduce the baseline to 1mV or less.
If there is little or no change in the baseline while performing the above test, it is also possible that the Ceramic Tubes or Photomultiplier Tube may require replacement: if the Ceramic Tubes or Photomultiplier Tube are not operating correctly then it may not be possible to test for ozone production. Please refer to sections 10.2 and 10.3 for further troubleshooting tips. The ozone generator components can be removed, inspected, and replaced without performing a maintenance shutdown. The analyzer can be left running, but the ozone generator circuitry will need to be powered down before the plastic guard is removed from the ozone cabinet. 9.4.2 Testing Ozone Generator Components The ozone generator has several components whose functionally should be tested individually. 9.4.2.1 Ozone Power Supply Board
1) Check that the green power LED on the Ozone Power Supply board is illuminated. 2) Use a Multimeter to ensure that there is 115-120 VAC(+/- 0.2VAC) output on the Ozone
Generator Constant Voltage Power Supply board. 9.4.2.2 Ozone Generator Transformer
1) Power down the ozone generator circuitry (the appropriate switch on the Main
Termination Block located on the Main Cabinet left sidewall will turn off power to just the ozone generator circuit).
2) Check that the green power LED on the board is NOT illuminated. Note: for additional safety it is recommended that the 24VDC power connector to the Ozone Power Supply board be pulled free from the board.
3) Remove the plastic guard. This plastic safety guard should never be removed while the ozone generator circuit is powered.
4) Disconnect and measure the resistance of the primary and secondary coils of the Ozone Transformer. a) Note: the primary coil should read approximately 4-5 Ohms. b) Note: the secondary coil should read approximately 18-25 K-Ohms.
9.4.2.3 Ozone Generator Assembly
1) Power down the ozone generator circuitry (the appropriate switch on the Main Termination Block located on the Main Cabinet left sidewall will turn off power to just the ozone generator circuit).
2) Check that the green power LED on the board is NOT illuminated. Note: for additional safety it is recommended that the 24VDC power connector to the Ozone Power Supply board be pulled free from the board.
3) Remove the plastic guard. This plastic safety guard should never be removed while the ozone generation circuit is powered up.
4) Important: Turn off the Ozone Flowmeter before disconnecting tubes to protect the integrity of the vacuum pressure.

Revision 7 109 August 02, 2019
5) Disconnect the tubing and wiring connections to the Ozone Generator Assembly. 6) Loosen the clamps and remove the Ozone Generator Assembly from the unit. 7) Remove one of the Fittings: there should be a very strong, distinctive odor of ozone.
Note: the Teflon fitting is the most difficult to re-seal, so it is best to remove one of the stainless steel fittings.
8) If there is no smell of ozone, remove the electrode and then the elbow to inspect the internal centering ring. a) Note: the internal centering ring holds the lower end of the electrode in place. b) Note: the centering ring is located in the lower end (near the elbow) of the 4” pipe. c) Note: degradation of the centering ring may contaminate ozone production.
Ensure that protective plastic guard is properly re-installed before re-energizing the ozone generation circuitry. If the Ozone Generator Assembly has been removed or disassembled, it would be advisable to perform a vacuum leak test on the ozone system (refer to the section on vacuum leak testing).

Revision 7 110 August 02, 2019
Section 10: Maintenance and Troubleshooting
10.1 Weekly Checkup The SulfurChrome Sulfur Chromatograph will provide reliable service with very little attention. However, a weekly checkup will ensure that the analyzer is operating to specifications.
The Weekly Checkup Report should be filled in, dated and kept on file. These reports will give a record of the analyzer's performance and will be useful in planning gas bottle replacement schedules as well as in troubleshooting.
In the Checkup Report the gas cylinder pressures are recorded as they were found and as they were left. All flows and pressures are also recorded and should be adjusted as necessary. The reaction furnace temperature, column temperature (if required), vacuum pressure and baseline reading should also be recorded. If any of the diagnostic parameters are incorrect consult the Troubleshooting Guide in this manual or contact Galvanic Applied Sciences. The combustion air and ozone air supply moisture traps (desiccators) should be checked at this time.
NOTE DO NOT adjust the helium pressure or flows at the analyzer because doing so will change retention times of eluting compounds: retention times and gates will have to be reset.
NOTE Changing the Hydrogen or Combustion Air flows after the Analyzer has stabilized will reduce the Analyzer sensitivity. If the Analyzer does not recover the lost sensitivity, then a maintenance shutdown and a startup will be required to re-establish the chemical reaction in the Ceramic Tubes.
NOTE If there are any flow adjustments made that cause a change in the Analyzer sensitivity, then a calibration of the Analyzer will be necessary.
10.2 Troubleshooting Tips 10.2.1 Performance and Sensitivity
The most typical problems encountered will deal with lack of sensitivity, or lack of response. There are several different things that can affect the level of performance of the SulfurChrome Analyzer; if one or more of the sub-systems aren’t operating at full potential then the overall performance will suffer accordingly. The things that will have the greatest impact upon sensitivity include: the ceramic tubes, ozone generation, the photomultiplier tube, and the vacuum. If there is a problem with sensitivity or response, before replacing any components be sure that the analyzer is leak free and passes all vacuum testing. The better the unit holds vacuum the better the unit will perform. An erratic and diminishing response to a known calibration gas is almost a sure sign of a leak someplace in the system. Sometimes all that is needed to solve the problem is to quickly check all tubing fittings with a wrench: just give them
Revision 7 111 August 02, 2019
a little “snug” to ensure that they are tight. This is especially true of the fittings used on the ceramic tubes. After operating for a day or so, new Teflon ferrules used on the ceramic tubes tend to relax and can be tightened just a little bit more. Next, check everything else possible that doesn’t require component replacement:
1) Check to make sure that all supply and calibration gases are set at the correct flow rates and pressures (refer to the section on Installation and also Procedures).
2) Check the ozone production (refer to the section on Procedures). 3) Refer to the rest of this section and the Troubleshooting Guide.
10.2.2 Poor Analyzer Repeatability
1) If the Analyzer is repeatable on calibration gas, but not sample gas, then check for proper peak gating and retention times.
2) Check baseline for stability. If noisy and/or spiky, refer to the Troubleshooting Guide and see the additional notes below.
3) Check for proper valve actuation pressure (60psi for Valco DV22), and switching.
10.2.3 Noisy / Spiky / Elevated Baseline
1) Turn off the ozone flowmeter: this should produce a “true” analyzer baseline free of any potential chemical reactions that may cause noise or spikes. If baseline improves then this indicates that there may be an internal leak in the injection valve causing sulfur sample to flow continuously through the detector. It may also indicate a contaminated utility gas supply, utility gas pressure regulator or associated fitting and tubing.
2) Isolate the Pre-Amp and the Main Board by shorting the Pre-Amp Board input with a 1 M-Ohm resistor. This should produce an output of very close to zero and should be very stable: If not then Pre-Amp Board may be faulty.
3) Check for condensation on the PMT or corrosion in the PMT socket as a result of condensation. If condensation present then install PMT purge if not already there.
4) If signal spikes off scale and returns to normal with regularity, then the PMT may have been exposed to helium or water. Check to ensure that the PMT purge is using air or nitrogen.
5) Check for proper PMT cooling. Place an ammeter in series with Peltier Cooler circuit. Approximately 2–3 amperes should be measured: If not then one or both of the coolers may be damaged.
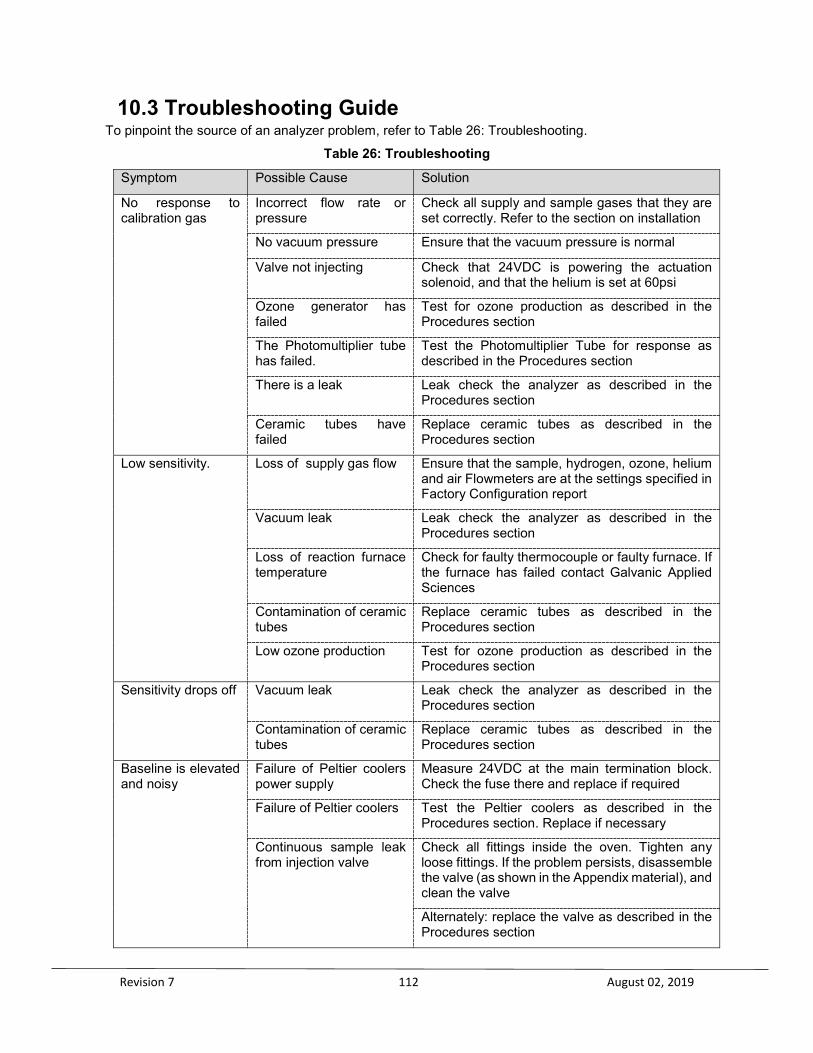
Revision 7 112 August 02, 2019
10.3 Troubleshooting Guide To pinpoint the source of an analyzer problem, refer to Table 26: Troubleshooting.
Table 26: Troubleshooting
Symptom Possible Cause Solution
No response to calibration gas
Incorrect flow rate or pressure
Check all supply and sample gases that they are set correctly. Refer to the section on installation
No vacuum pressure Ensure that the vacuum pressure is normal
Valve not injecting Check that 24VDC is powering the actuation solenoid, and that the helium is set at 60psi
Ozone generator has failed
Test for ozone production as described in the Procedures section
The Photomultiplier tube has failed.
Test the Photomultiplier Tube for response as described in the Procedures section
There is a leak Leak check the analyzer as described in the Procedures section
Ceramic tubes have failed
Replace ceramic tubes as described in the Procedures section
Low sensitivity. Loss of supply gas flow Ensure that the sample, hydrogen, ozone, helium and air Flowmeters are at the settings specified in Factory Configuration report
Vacuum leak Leak check the analyzer as described in the Procedures section
Loss of reaction furnace temperature
Check for faulty thermocouple or faulty furnace. If the furnace has failed contact Galvanic Applied Sciences
Contamination of ceramic tubes
Replace ceramic tubes as described in the Procedures section
Low ozone production Test for ozone production as described in the Procedures section
Sensitivity drops off Vacuum leak Leak check the analyzer as described in the Procedures section
Contamination of ceramic tubes
Replace ceramic tubes as described in the Procedures section
Baseline is elevated and noisy
Failure of Peltier coolers power supply
Measure 24VDC at the main termination block. Check the fuse there and replace if required
Failure of Peltier coolers Test the Peltier coolers as described in the Procedures section. Replace if necessary
Continuous sample leak from injection valve
Check all fittings inside the oven. Tighten any loose fittings. If the problem persists, disassemble the valve (as shown in the Appendix material), and clean the valve
Alternately: replace the valve as described in the Procedures section

Revision 7 113 August 02, 2019
Symptom Possible Cause Solution
Baseline is elevated Contamination of ceramic tubes
Replace ceramic tubes as described in the Procedures section
Light leak Ensure PMT reaction cell is properly fitted as described in the Procedures section
Ensure PMT socket cover is securely in place
Baseline is low Contamination of ceramic tubes
Replace ceramic tubes as described in the Procedures section
Ozone generation has failed
Test for ozone production as described in the Procedures section
Continue to test ozone generation components as necessary. Refer to Procedures section
Baseline is flat lined (no noise present)
The Photomultiplier tube has failed
Test the Photomultiplier tube for response as described in the Procedures section
The PMT power supply has failed
Check the 24 VDC input power to the PMT power supply with a voltmeter
The pre-amp has failed Contact Galvanic Applied Sciences
Poor Analyzer repeatability
Ozone generator power supply board not providing a constant voltage
Check the output voltage from the board: It should be between 110 VAC and 120 VAC, and should not drift more than ± 0.2 VAC. If the voltage is noisy replace the board
Vacuum pump oil is dirty or contaminated
Dirty or contaminated oil will cause the vacuum to be unstable resulting in poor repeatability
Failure of Peltier coolers Test the Peltier coolers as described in the Procedures section. Replace if necessary
Continuous sample leak from injection valve
Check all fittings inside the oven. If the problem persists, disassemble the valve (as shown in the Appendix material), and clean the valve
Alternately: replace the valve as described in the Procedures section
Peak between valve switches
The valve is leaking because it is dirty
Disassemble the valve (as shown in the Appendix material), and clean the valve
No flow when cal is initiated
Solenoid is not energizing Check that there is 24VDC at the solenoid, and that it is wired to connector P5 terminals 1 and 2. If solenoid still does not energize, replace it
Erratic Flowmeter float
Flowmeter tube is contaminated
Remove and clean Flowmeter tube with isopropyl alcohol and dry with clean, dry instrument air
Incorrect readings Peaks have shifted and retention times have changed
Check that the helium pressure is set correctly and then adjust the flow rate to set the peak retention times correctly.
Analyzer display reads “X.XXX”
Analyzer is in Halt mode Start the Analyzer: after the end of an analysis run the display will update
Blank Display Display not setup in GUI Setup the display parameters in the GUI

Revision 7 114 August 02, 2019
10.4 Spare Parts List Table 27 includes a list of spare parts that may be useful to keep on hand in the event that replacement is necessary.
Table 27: Spare Parts
Part Description P/N
Valco MODEL DV22 10 port Diaphragm Valve BA0946
Valco DV22-21D Replacement Diaphragm BA1734
Inner Ceramic Tube (1/16”) MC0746
Outer Ceramic Tube (1/8”) MC0745
1/16” Teflon Ferrules (package of ten) T-100-Set
1/8” Teflon Ferrules (package of ten) T-200-Set
RTD-830 Oven Temperature Sensor (RTD) BA1587
Photo Multiplier Tube BA0755
Socket for Photo Multiplier Tube BA0756
UV Bandpass Filter MC0760
Reaction Cell Viton O-Ring Kit SA1732
Ozone Generator Assembly SA0868
Ozone Generator Voltage Transformer BA0741
Capillary Column, Restek 30m x 0.53mmID x 7umdf BA0776
Column Connectors and Graphite Ferrules TF1645/46
SulfurChrome Display board PT2890
SulfurChrome controller board PT2874
SulfurChrome I/O Board PT2935
Excitation Board (for the RTD signal) PT2127
PMT Power Supply Board PT0847
841 Pre-Amp Board PT1574
Ozone Generator Constant Voltage Power Interface Board PT1440
Moisture Trap (desiccant) Refill CO0888
SulfurChrome SulfurChrome Operation Manual MA1479DI

Revision 7 115 August 02, 2019
Appendix A: Specifications
1. General Specifications Range 0 – 10 ppm 0 - 1 % Components 16 maximum Response 5 to 15 minutes typical Linearity 2% Repeatability 2% of full scale Operating Temperature 10 to 40° C Humidity 0-95% non-condensing Electrical Ratings 120VAC – 240VAC single phase 50/60Hz at 5A National Electric Code Class 1 Division 2, Groups BCD, T3 Communications Modbus RS232, Modbus RS485, Modbus TCP/IP Digital Inputs 2 Dry Contact, 2 Wet Contact (12/24VDC) Analog Inputs 3 Universal Inputs, User Programmable (RTD, 4-20mA, transducer) Analog Outputs 4x 4-20mA, user scalable, user selectable loop or self powered Relays 4 x SPDT relays, 8amp @ 250VAC Valve Valco Model DV22 10 port Number of streams Up to 4 streams Columns See Configuration Report for details Weight 150 pounds (approximate) Utility gasses CARRIER GAS: UHP Helium consumed at 6 – 30 cc/min depending
on application. VALVE ACTUATION GAS: UHP Helium supplied from same cylinder as carrier gas or instrument air. HYDROGEN: UHP Hydrogen consumed at 80 cc/min. AIR: Reaction furnace and ozone generator air are drawn from ambient. INSTRUMENT AIR is used for PMT and cabinet purge (Z-purge). CALIBRATION GAS: Hydrogen sulfide in nitrogen is recommended.

Revision 7 116 August 02, 2019
2. Cabinet Dimensions
Figure 99: Cabinet Dimensions

Revision 7 117 August 02, 2019
3. SulfurChrome Wiring Diagram
Figure 100: Main Wiring Diagram

Revision 7 118 August 02, 2019
Appendix B: Theory of Gas Chromatography
1. What is Gas Chromatography? Gas chromatography is the separation of a gaseous mixture of compounds (solutes) into its individual components. By separating the sample, it is possible to identify and measure the amount of the various components present.
2. Basic Parts and Terminology of a Gas Chromatograph
Parts Carrier Gas – carries the sample gas through the column and over the detector. This is also called the ‘mobile phase’. Carrier Regulator – maintains a constant pressure of the carrier gas to ensure a constant carrier flow rate. Sample Valve – injects a measured amount of sample gas into the carrier. Column – a glass or metal tube that contains the stationary phase (to be described shortly). The sample gas passes through, and the components of the gas are separated within the column. Detector – senses the changes in property being measured as the individual components elute from the column. It identifies and, with a response factor, quantifies the components of the sample. Oven – The detector and column are maintained at a constant temperature by the oven. Constant temperature is essential to achieve proper separation of components.
Figure 101: Chromatograph Components Terms Component – one specific species of the sample gas (i.e. methane, propane, etc.). Elution – the process of moving the separated sample components completely through the stationary phase. Mobile phase – an inert gas (helium) that carries the sample gas over the stationary phase and through the column. It is also referred to as the carrier gas. Stationary phase – an adsorptive material that is contained inside the column. The individual components of the sample gas will adsorb to the stationary phase by varying amounts, depending on molecular properties of those components.

Revision 7 119 August 02, 2019
Flow of Mobile Phase
Interaction With Stationary Phase
Detector
LeastMost
InjectorTime = t1
Time = t2
Time = t3
Sample Gas Column
3. How are the Components Separated? The components within a gas sample are separated in a gas chromatograph by distribution of the components between a ‘mobile phase’ and a ‘stationary phase’. A mobile phase is generally an inert gas such as helium, argon, or nitrogen. The mobile phase, which is also called the carrier gas, transports the sample gas through the column, where the stationary phase exists. The stationary phase is an adsorptive material that is contained inside the column. The individual components of the sample gas will adsorb (stick) to the stationary phase by different amounts. This is because the components to be separated have varying affinities (chemical attractions) for the stationary phase. Those components that have a higher affinity for the stationary phase will pass through the system slower than those components that have a lower affinity for the stationary phase. As a result of these differences in affinity, sample components will become separated from each other as they travel through the stationary phase in the column. The components will emerge from the column (elute) at different times. When the components reach the end of the column, they pass over the detector, where they are identified and their concentrations are determined. The figure below shows the separation process as the carrier gas moves the sample through the column.
Figure 102: Sample Gas Flow Through The Column
4. How are the Components Detected and Quantified? The purpose of a detector is to monitor the carrier gas as it emerges from the column and to generate a signal in response to variation in its composition due to eluted components. The detector used in chemiluminescence Analyzers is a photomultiplier tube (PMT). The photomultiplier tube (PMT) is an extremely sensitive light detector which outputs a current which is directly proportional to light intensity. As all sulfurs are converted to a single species in the reaction furnace, the response of the PMT is equimolar; it will response equally to all sulfur species. Installation of a chromatograph valve and column makes the separation and measurement of individual sulfur compounds possible. The concentrations of the individual species can be added together to arrive at a total sulfur concentration.

Revision 7 120 August 02, 2019
5. The Chromatograph Output: The Chromatogram The signal output by the PMT is used to generate a chromatogram, which is a graph of detector response against time. The presence of a component will cause an increase in response from the PMT which appears as a ‘peak’ on the chromatogram. The components are identified by the microprocessor according to the length of time it takes them to elute from the column. The concentration of each component is calculated using a response factor determined during calibration with a certified standard. The figure below shows the different characteristics and definitions of a typical chromatogram, assuming two components called ‘A’ and ‘B’.
Figure 103: Chromatogram Description
tM - dead time: time for non-retained species to move through the column. VM - dead volume: volume of mobile phase in the column. tR - retention time: the time it takes a component band to completely travel through the column. Each component will have a characteristic retention time. VR - retention volume - the volume of gas that passes through the column between the point of injection and the peak maximum of the component. A - peak area - response is proportional to the concentration of the component. h - peak height - the distance between the peak maximum and the baseline geometrically produced beneath the peak.
Baseline
Peak

Revision 7 121 August 02, 2019
6. Definition of Terms There are several terms used in this manual that the user should become familiar with.
Baseline: A baseline is that portion of a chromatogram where no detectable sample components emerge from the column. It appears as a flat line along the bottom of the chromatogram.
Chromatogram: A chromatogram is the permanent record of a single analysis run. It can be stored on a PC using the user interface software or recorded on a chart recorder. It displays the component peaks during an analysis cycle.
Component: Any one of several species that may appear in a sample. For example natural gas may contain several components such as Nitrogen, Methane, Carbon Dioxide, Ethane, propane, n-butane, iso-Butane, n-Pentane, iso-Pentane, and C6+.
Equimolar: Equal response to a species
Elution: The process of moving the separated sample
components completely through the stationary phase.
Normalization: The process of multiplying the set of component concentrations by a constant factor to make their sum (or the sum of some related quantity) 1. Normalization is simply the re-expressing of component concentrations in terms of percents.
Peak: The measurement made by the Analyzer involves injecting a fixed sample volume into a carrier stream, which takes it to the detector. The detector sees the sample that passes by it and produces an output that is approximately triangular in shape. This output can be viewed on the user interface software or a chart recorder and is referred to as a peak.
Peak Area: Peak area is the sum of the detector readings from the start to the end of the peak readings minus the baseline. Peak area is used to calculate response factors and concentrations.
Response Factor: The correction factor used to convert peak area into concentration.
Retention Time: The time that elapses between the start of an analysis and the maximum height of a peak. Peak retention time is used to identify individual components in an analysis.
Specific Gravity: The ratio of the density of a substance to the density
of water at the same temperature.
Standard Cubic Foot: The quantity or volume of gas occupying a cubic foot of space at 60° F and 14.696 PSIA.
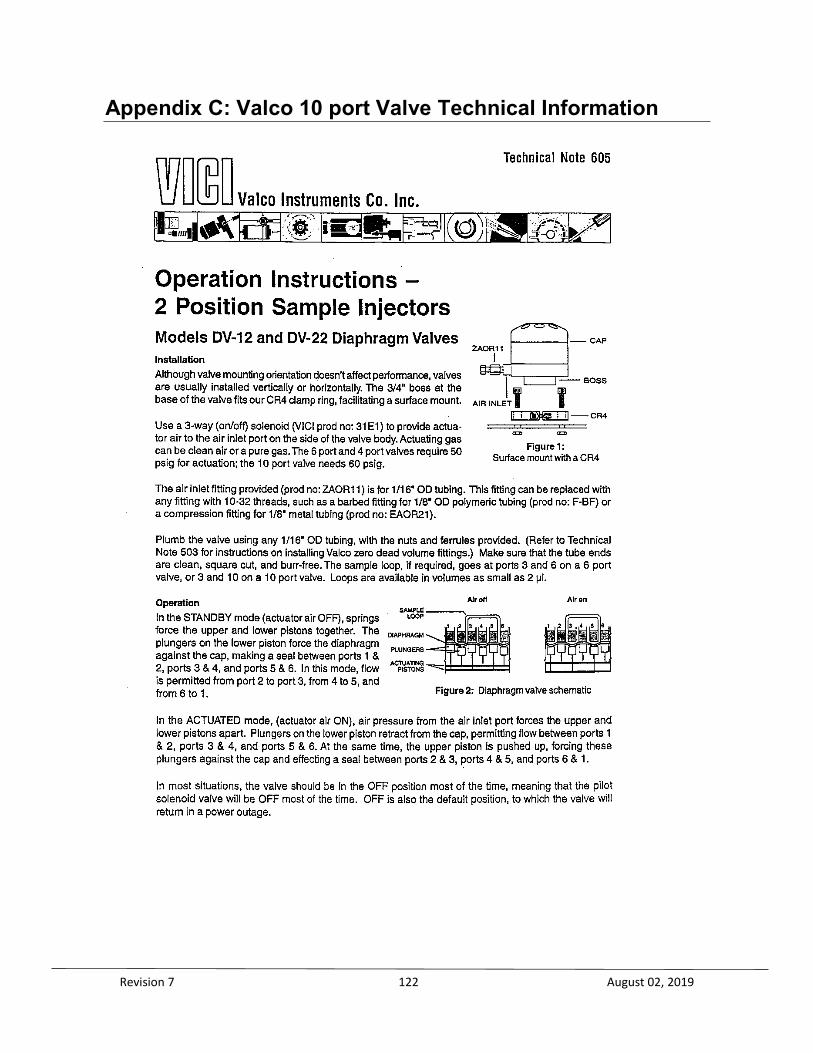
Revision 7 122 August 02, 2019
Appendix C: Valco 10 port Valve Technical Information

Revision 7 123 August 02, 2019
Revision 7 124 August 02, 2019
Appendix D: ADI Dia-Vac Pump Operating Instructions
Revision 7 125 August 02, 2019
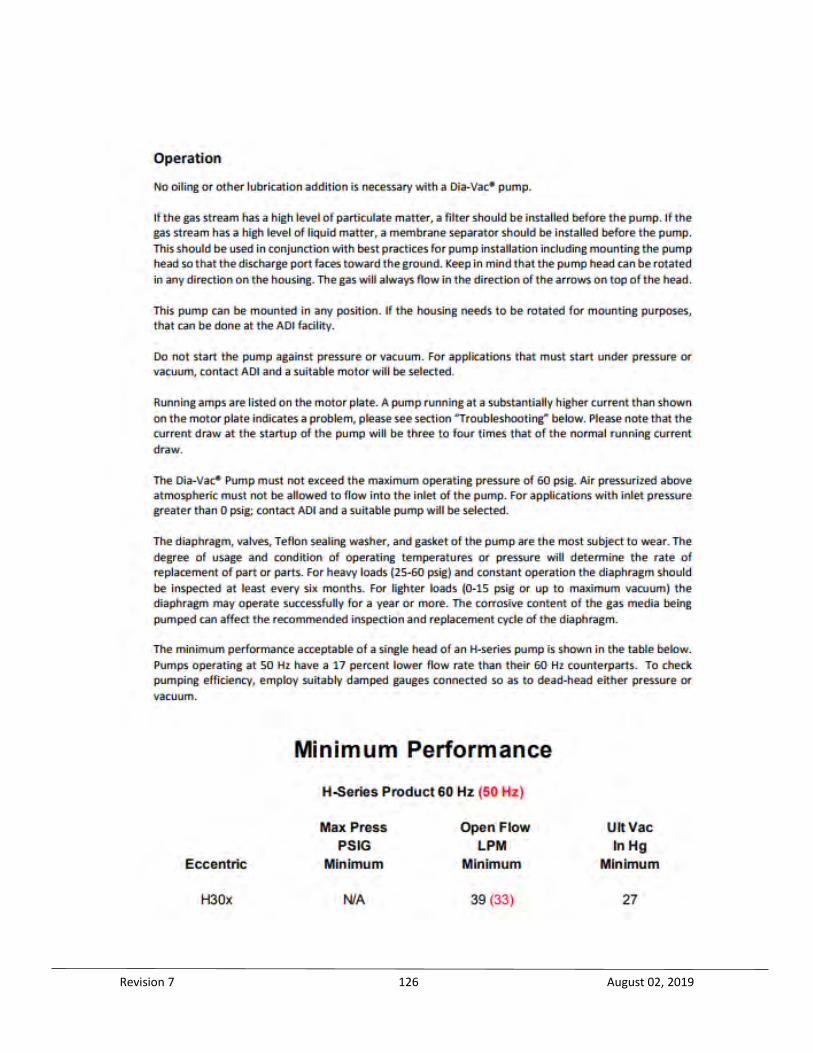
Revision 7 126 August 02, 2019
Revision 7 127 August 02, 2019

Revision 7 128 August 02, 2019
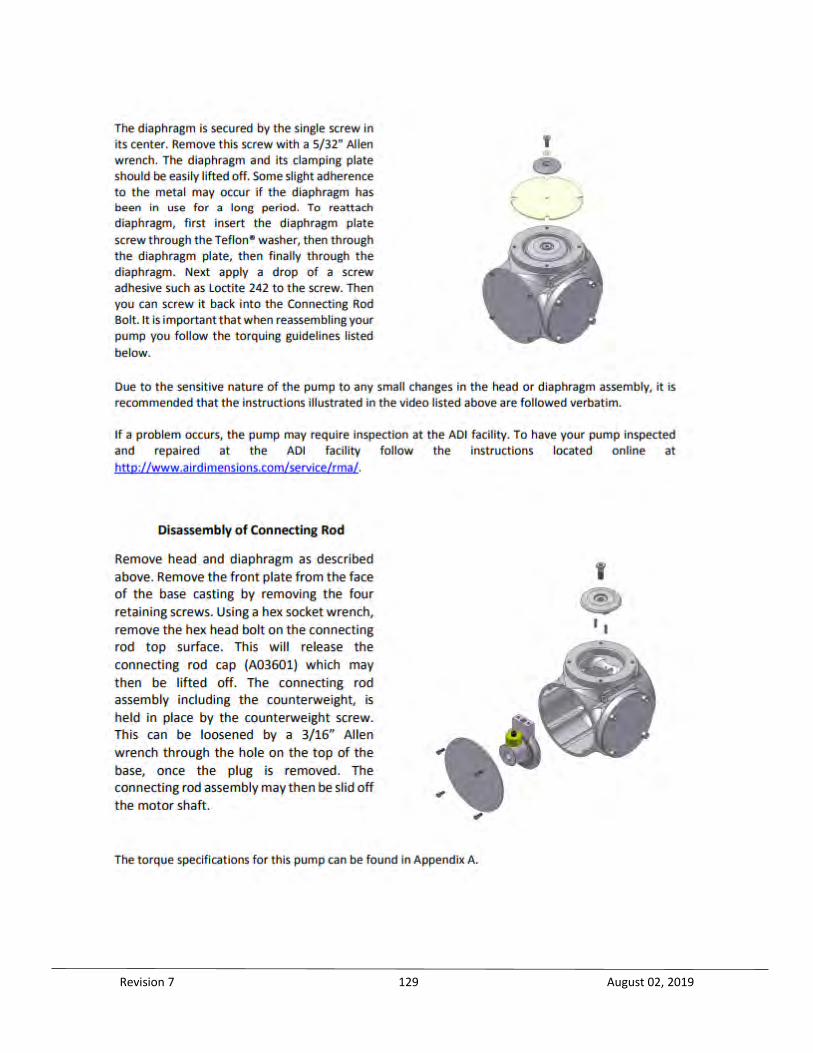
Revision 7 129 August 02, 2019

Revision 7 130 August 02, 2019

Revision 7 131 August 02, 2019
H-Series Torque Chart

Revision 7 132 August 02, 2019