Suitable Graphic Representation for Annotated-Space-Time-Path · Suitable Graphic Representation...
102
Nannan He March, 2009 Suitable Graphic Representation for Annotated-Space-Time-Path
Transcript of Suitable Graphic Representation for Annotated-Space-Time-Path · Suitable Graphic Representation...

Nannan He March, 2009
Suitable Graphic Representation for Annotated-Space-Time-Path
Suitable Graphic Representation for Annotated Space-Time-Path
by
Nannan He
Thesis submitted to the International Institute for Geo-information Science and Earth Observation in partial fulfilment of the requirements for the degree of Master of Science in Geo-information Science and Earth Observation, Specialisation: Geoinformatics
Thesis Assessment Board
Chair: Dr. R.A. de By External examiner: Dr. G. Andrienko Supervisor: Prof. Dr. M.J. Kraak (RTL) Second supervisor: Dr. O. Huisman
INTERNATIONAL INSTITUTE FOR GEO-INFORMATION SCIENCE AND EARTH OBSERVATION ENSCHEDE, THE NETHERLANDS

Disclaimer
This document describes work undertaken as part of a programme of study at the International Institute for Geo-information Science and Earth Observation. All views and opinions expressed therein remain the sole responsibility of the author, and do not necessarily represent those of the institute.

i
Abstract
New data sets are being generated by diverse applications such as mobile phone, digital commercial transactions, Web-logging software and various types of GPS “tagging”. The information provided is not only about locations and time, but also attribute information related. A new data type Annotated-Space-Time-Path (A-STP) is proposed developed from the existing Space-Time-Path construct. The investigation of the characteristics of A-STPs, available annotation types and creation of A-STPs is an effective method to gain an insight of the data type. To investigate on A-STPs further, visualization and exploration of the dataset are required. However, we are facing the situation that lack of suitable tools to visualize and explore A-STPs.
Based on the analysis of spatio-temporal data and reviewing of existing visualization techniques, the Space-Time-Cube is selected as the basic visualization environment for A-STPs. Meanwhile, Shneiderman’s Visual Information-Seeking Mantra is adopted to carry out the visualization and exploration tasks, involving three steps: overview, zoom/filter and details-on-demand. In order to enhance the exploratory ability of Space-Time-Cube, interactive tools and functions are developed and implemented resulting in an extended Space-Time-Cube for visualizing and exploring A-STPs, implemented in uDig. The visualization and exploration procedure follows the Visual Information-Seeking Mantra. A usability evaluation is made by means of combination of focus group and questionnaires. Finally, conclusions and further recommendations are presented.
Keywords: GPS data, annotations, Annotated-Space-Time-Path, Space-Time-Cube, Shneiderman’s Visual Information-Seeking Mantra, usability evaluation

ii

iii
Acknowledgements
I would like to take this opportunity and appreciate all the people who have helped and supported me in this thesis research.
First of all, I would like to express my deep appreciation to my thesis supervisor, Prof Menno-Jan Kraak, for his valuable advices, edifying guidance, and continuous encouragement through the entire duration of my thesis work. He made great effort to build the construe and also refine every details of my work. I have learned how to conduct a scientific research under a rigorous scholarship which will benefit my whole life. I would like to thank another supervisor, Dr.Otto Huisman. He opened my mind with expert suggestions and improved my English writing a lot.
Secondly, my sincere appreciation will go to Mr. Bas Retsios, who helped me a lot during the prototype design and implement phases. He devoted a lot of time to the technique issue in my research and also gave me a great many suggestions generously. I could not accomplish the technique work without his help.
I also would like to send my thanks to ITC for giving me the opportunity to study here and complete my thesis research. I am inspired by the staff in ITC by showing their kindness and professional attitude of teaching and exchanging the knowledge.
I am heartily thankful my dear friends. They are all my classmates in GFM-01 2007 and I am grateful that I have such a warm class like a big family and we are sharing a wonderful time on studying and entertainment.
I would like thank to the Chinese Community in ITC. They brought me a lot of fun and made me feel at home. Especially, Li Xia, Zhou Liang, Wu Jiexia, He Yuxiang, Yin Zun, Zhao xi, Wang Tiejun, Si Yali.
Last, but not least, I would like to thank my parents and Zhang Peng especially. Thanks for their forever understand, supporting and caring.

iv

v
Dedicated to my parents

vi

vii
Table of contents
1. Introduction ......................................................................................................................................11.1. Motivation and Problem Statement.......................................................................................11.2. Research Identification .........................................................................................................3
1.2.1. Research Objective ....................................................................................................31.2.2. Research Questions....................................................................................................31.2.3. Innovation aimed at ...................................................................................................41.2.4. Related work..............................................................................................................4
1.3. Methodology .........................................................................................................................51.4. Summary ...............................................................................................................................6
2. Graphic representation of spatio-temporal data ...............................................................................72.1. Introduction ...........................................................................................................................72.2. Space and time issue .............................................................................................................7
2.2.1. Spatio-temporal properties in geographic space........................................................72.2.2. Time-geography and the notation apparatus..............................................................8
2.3. Visual representation of spatio-temporal data ......................................................................92.3.1. Representational framework of spatio-temporal data..............................................102.3.2. Representational method of spatio-temporal data ...................................................122.3.3. Graphic representation variables .............................................................................172.3.4. Visualization tasks ...................................................................................................18
2.4. Techniques and tools of spatio-temporal geovisualization .................................................192.5. Summary .............................................................................................................................20
3. Space-Time-Path and Annotations.................................................................................................213.1. Introduction .........................................................................................................................213.2. Space-Time-Path .................................................................................................................21
3.2.1. Generation of STP ...................................................................................................213.2.2. Illustration of STP....................................................................................................22
3.3. From Space-Time-Path to Annotated-Space-Time-Path.....................................................233.4. Representations of Annotations ..........................................................................................24
3.4.1. Traditional forms of annotations .............................................................................243.4.2. Other forms of annotations ......................................................................................25
3.5. Creation of Annotated-Space-Time-Paths ..........................................................................253.5.1. Geographic information contained in A-STPs ........................................................263.5.2. Annotation types and tagging them to STPs............................................................283.5.3. Summary of tagging annotations .............................................................................31
3.6. Summary .............................................................................................................................324. Conceptual visualization environment for Annotated-Space-Time-Paths .....................................33
4.1. Introduction .........................................................................................................................334.2. Visualization environment design tasks..............................................................................344.3. Visualization environment for A-STP ................................................................................34
4.3.1. Map ..........................................................................................................................344.3.2. Animated map..........................................................................................................354.3.3. Space-Time-Cube ....................................................................................................36

viii
4.4. Interactive tools .................................................................................................................. 364.5. Visualization of Annotated-Space-Time-Path in Space-Time-Cube ................................. 36
4.5.1. Overview:................................................................................................................ 374.5.2. Zoom/Filter: ............................................................................................................ 404.5.3. Details-on-demand:................................................................................................. 46
4.6. Summary............................................................................................................................. 485. Phototype implementation............................................................................................................. 49
5.1. Introduction ........................................................................................................................ 495.2. Preparation ......................................................................................................................... 49
5.2.1. Software and Space-Time-Cube plug-in................................................................. 495.2.2. Data collection ........................................................................................................ 495.2.3. Data processing....................................................................................................... 50
5.3. Implement the prototype to visualize Annotated-Space-Time-Path................................... 505.3.1. Overview................................................................................................................. 515.3.2. Zoom/Filter ............................................................................................................. 535.3.3. Details-on-demand .................................................................................................. 595.3.4. Additional tools and functions................................................................................ 63
5.4. Summary............................................................................................................................. 636. Prototype evaluation...................................................................................................................... 65
6.1. Introduction ........................................................................................................................ 656.2. Usability and Usability evaluation ..................................................................................... 656.3. Evaluation methods ............................................................................................................ 66
6.3.1. Existing Evaluation methods .................................................................................. 666.3.2. Selection of evaluation methods in this research.................................................... 66
6.4. Usability evaluation............................................................................................................ 676.4.1. Objectives and tasks................................................................................................ 676.4.2. Participators ............................................................................................................ 676.4.3. Procedure ................................................................................................................ 686.4.4. Results..................................................................................................................... 68
6.5. Summary............................................................................................................................. 727. Conclusion and recommandation .................................................................................................. 73
7.1. Conclusions ........................................................................................................................ 737.1.1. Annotated-Space-Time-Path................................................................................... 737.1.2. Visual Information-Seeking Mantra ....................................................................... 747.1.3. Space-Time-Cube.................................................................................................... 757.1.4. Summary ................................................................................................................. 76
7.2. Recommendations for further research .............................................................................. 76Bibliography.......................................................................................................................................... 78URLs ..................................................................................................................................................... 82Appendices ............................................................................................................................................ 83
Appendix 1: Usability evaluation tasks and questionnaire ........................................................... 83Appendix 2: Personal information collection ............................................................................... 87

ix
List of figures
FIGURE 1-1 DEFINITION OF PROBLEM IN THIS RESEARCH.........................................................................3 FIGURE 1-2 METHODOLOGY WORK FLOW GRAPH ....................................................................................5 FIGURE 2-1 CHARACTERISTICS OF CHANGE IN SPATIAL AND TEMPORAL DOMAIN...................................8 FIGURE 2-2 THE NOTATION APPARATUSES SYSTEM OF TIME-GEOGRAPHY ..............................................9 FIGURE 2-3 STRUCTURE FOR SECTION 2.3..............................................................................................10 FIGURE 2-4 THE BASIC COMPONENTS OF THE TRIAD FRAMEWORK .......................................................11 FIGURE 2-5 THE OPERATIONAL TASK TYPOLOGY FRAMEWORK.............................................................12 FIGURE 2-6 MINARD’S MAP FROM 1869 SHOWING NAPOLEON’S 1812 CAMPAIGN IN RUSSIA...............13 FIGURE 2-7 URBAN GROWTH OF THE CITY OF MAASTRICHT MAPPED BY A SINGLE STATIC MAP...........13 FIGURE 2-8 TEMPORAL POLLUTANT LEVELS IN LOS ANGELS MAPPED BY A SERIES OF STATIC MAPS...14 FIGURE 2-9 URBAN GROWTH OF THE CITY OF MAASTRICHT MAPPED BY AN ANIMATION .....................14 FIGURE 2-10 THE ANIMATED MAP LEGEND............................................................................................15 FIGURE 2-11 NAPOLEON’S RUSSIAN CAMPAIGN IN SPACE-TIME-CUBE ................................................16 FIGURE 2-12 BASIC GRAPHIC VARIABLES...............................................................................................17 FIGURE 3-1 AN EXAMPLE OF GPS TRACK FIGURE 3-2 AN EXAMPLE OF GPS POINT CLOUD ........22 FIGURE 3-3 RELATION BETWEEN SPACE-TIME-PATH AND THE THREE BASIC COMPONENTS.................23 FIGURE 3-4 THE DEVELOPMENT FROM STP TO ANNOTATED-SPACE-TIME-PATH.................................23 FIGURE 3-5 THE INTERLINKS BETWEEN INTERNAL KNOWLEDGE AND EXTERNAL KNOWLEDGE, AND
EXPERIENCE ....................................................................................................................................24 FIGURE 3-6 FOUR POSSIBLE TYPES OF LOCATION-BASED INFORMATION CONTAINED IN ANNOTATIONS
........................................................................................................................................................26 FIGURE 3-7 DIFFERENT ORIENTATION OF PHOTOS CAUSE DIFFERENT VIEW ..........................................27 FIGURE 3-8 AN EXAMPLE OF PHOTO WITH IT ADDITIONAL INFORMATION.............................................28 FIGURE 4-1 STRATEGY FOR VISUALIZATION ENVIRONMENT DESIGN .....................................................33 FIGURE 4-2 AN EXAMPLE OF ANIMATION TO SHOW GPS TRACK ...........................................................35 FIGURE 4-3 FUNDAMENTAL OF VISUALIZING ANNOTATED-SPACE-TIME-PATH IN SPACE-TIME-CUBE 37 FIGURE 4-4 THREE APPROACHES TO SHOW OVERVIEW OF ANNOTATED-SPACE-TIME-PATH ................38 FIGURE 4-5 OVERVIEW OF ANNOTATED-SPACE-TIME-PATH.................................................................40 FIGURE 4-6 SELECTION OF PARTICULAR ANNOTATED-SPACE-TIME-PATH BY SELECTING LAYERS......41 FIGURE 4-7 FILTER ABOUT “WHEN (TIME T1)”.......................................................................................41 FIGURE 4-8 FILTER ABOUT “WHEN (TIME T1 TO T2?)” ...........................................................................42 FIGURE 4-9 FILTER ABOUT “WHERE (POINT LOCATION)” (APPROACH 1) ...............................................43FIGURE 4-10 FILTER ABOUT “WHERE (POINT LOCATION)” (APPROACH 2) .............................................43 FIGURE 4-11 FILTER ABOUT “WHERE (LINE/AREA LOCATION)” (APPROACH 1) .....................................44 FIGURE 4-12 FILTER ABOUT “WHERE (LINE/AREA LOCATION)” (APPROACH 2) .....................................44 FIGURE 4-13 INTERACTIVE LEGEND .......................................................................................................45 FIGURE 4-14 FILTER ABOUT ELEMENTARY “WHAT” ..............................................................................46 FIGURE 4-15 VISUALIZATION OF GRAPHIC ANNOTATION.......................................................................46 FIGURE 4-16 PHOTO MATCHING AROUND POINT AREA ..........................................................................47 FIGURE 5-1 COLLECTION OF DATASET FOR IMPLEMENTATION ..............................................................50 FIGURE 5-2 INTERFACE OF GENERATE ANNOTATED-SPACE-TIME-PATH...............................................51 FIGURE 5-3 OVERVIEW OF IMPLEMENTATION ........................................................................................51

x
FIGURE 5-4 OVERVIEW OF ANNOTATED-SPACE-PATH WITH 3D REPRESENTATION (A) AND ICONS (B) 52 FIGURE 5-5 OVERVIEW OF IMPLEMENTATION FROM DIFFERENT ANGLE............................................... 53 FIGURE 5-6 ZOOM IN VIEW OF ANNOTATED-SPACE-TIME-PATH........................................................... 54 FIGURE 5-7 HIGHLIGHT THE SELECTED ANNOTATED-SPACE-TIME-PATH............................................. 55 FIGURE 5-8 FILTER ABOUT “WHEN (TIME T1)”...................................................................................... 55 FIGURE 5-9 FILTER ABOUT “WHERE (POINT LOCATION)” (APPROACH 1) .............................................. 56 FIGURE 5-10 FILTER ABOUT “WHERE (POINT LOCATION)” (APPROACH 2) ............................................ 56 FIGURE 5-11 FILTER ABOUT “WHERE (LINE/AREA LOCATION)” (LEFT) AND “WHEN (TIME T1TO T2)”
(RIGHT) .......................................................................................................................................... 57 FIGURE 5-12 FILTER ABOUT “WHAT” .................................................................................................... 58 FIGURE 5-13 FILTER ABOUT “WHAT” AND “WHEN”/“WHERE”.............................................................. 58 FIGURE 5-14 FIRST VIEWS OF DETAILS-ON-DEMAND ............................................................................ 59 FIGURE 5-15 MINIATURE AND FULL SIZE VIEW OF GRAPHIC ANNOTATION........................................... 60 FIGURE 5-16 COMPARISON VIEW OF GRAPHIC ANNOTATION ................................................................ 61 FIGURE 5-17 VIEW OF GEONAMES......................................................................................................... 61 FIGURE 5-18 VIEW OF TEXT................................................................................................................... 62 FIGURE 5-19 VIEW OF DYNAMIC ANNOTATIONS ................................................................................... 62 FIGURE 6-1 MEASURE SCORE FOR TASK 1 OVERVIEW IN TWO GROUPS................................................. 70FIGURE 6-2 MEASURE SCORE FOR TASKS RELATED TO ZOOM/FILTER................................................... 70 FIGURE 6-3 MEASURE SCORE FOR TASK RELATED TO DETAILS-ON-DEMAND ....................................... 71 FIGURE 6-4 OVERALL USABILITY MEASURE SCORE............................................................................... 71

xi
List of tables
TABLE 2-1 DATA TYPES LINKED TO VISUAL VARIABLES........................................................................18 TABLE 3-1 TYPES OF ANNOTATIONS AND INFORMATION CONVEYED ....................................................25 TABLE 3-2 ANNOTATION TAGGING METHOD ACCORDING TO FOUR TYPES OF LOCATION-BASED
INFORMATION .................................................................................................................................31 TABLE 4-1 CHARACTERISTICS OF THE THREE OVERVIEW APPROACHES ................................................38 TABLE 4-2 THE FILTER TASK ABOUT “WHEN”........................................................................................42 TABLE 4-3 THE FILTER TASK ABOUT “WHERE”......................................................................................45 TABLE 5-1 ICON PICTURES APPLIED IN THE RESEARCH ..........................................................................52 TABLE 5-2 COMBINATION OF COLOUR, SHAPE AND SIZE FOR EACH ANNOTATION TYPE .......................53 TABLE 5-3 SUMMARY OF ASSISTANT TOOLS AND FUNCTIONS ACCORD TO DIFFERENT COMPONENTS ..59 TABLE 6-1 AVERAGE RECOGNITION ACCURACY AND TIME CONSUMING FOR EACH TASK.....................69 TABLE 6-2 USERS’ PREFERENCE OF AVAILABLE TOOLS AND FUNCTIONS..............................................72 TABLE 7-1 SUMMARY OF FUNCTIONS AND TOOLS IN IMPLEMENTATION ...............................................76

xii

SUITABLE GRAPHIC REPRESENTATION FOR ANNOTATED-SPACE-TIME-PATH
1
1. Introduction
1.1. Motivation and Problem Statement
Background
Our dynamic geo-community currently witness a trend which demonstrates an increased need for personal geo-data (Kraak 2003). Benefit form the increasing popularity of modern computer science and Internet, Goodchild (2007) reveals a new trend that “in recent months, there has been an explosion of interest in using the Web to create, assemble, and disseminate geographic information provided voluntarily by individuals”. He described “human as sensors”; especially the citizens who act as observers and voluntarily participate in collecting geographic information. They are concerned about where they stayed, where they are, how they get to another destination and the time issue.
To satisfy these demands, the aid of latest technology is indispensable. Recent and continuing advances in mobile telecommunications technology have had a significant impact upon the nature and volume of information stored about individual spatial behaviour. New technology products possess vast potential in recording personal movements and activities. PDA (personal digital assistant), smartphone or other mobile devices which incorporate GPS (Global Positioning System), as well as providing Internet connection are becoming important means of acquiring and accessing information and data about individual movement. These handheld devices are convenient to collect individual-level georeferenced data, including the coordinates of the locations and the registered time.
It is important to note that what can be obtained from the advanced technology is not only limited to purely geo-data. While we locate ourselves at some places, additional information like photographs, sounds are gathered synchronously by mobile devices. These photographs and other forms of relevant information could be added as annotated attributes of GPS data. The present extensive use of the mobile devices generates large qualities of dataset and inspires people get an exploratory view of these data.
Visualizing Space-Time-Path
GPS was originally introduced only for navigation, but as its capability was expanded and mobility was increased, it is adopted for recording the trace of moving objects. The traces or paths of moving objects over time can be recognized, by both the changes of the coordinates and each registered time. This series of locations and related time information constitute a GPS track, referring to a path which indicates the moving object across space through time. Miller termed this type of dataset as a Space-Time-Path (STP) (Miller 1991). This path is also known as life line (Hägerstrand 1970) and mobile trajectory (Smyth 2000).
From a visualization perspective, a highly interactive representation environment is competent to simulate this real world activity and to offer an exploratory insight into the typical spatio-temporal dataset. Via Internet connections, people are able to exhibit and share their own GPS data using for

SUITABLE GRAPHIC REPRESENTATION FOR ANNOTATED-SPACE-TIME-PATH
2
instance Google-map and Google-earth as platforms. The current software integrate temporal component with the spatial elements mainly in 2-D and 2.5-D visualization environments. In term of Hägerstrand’s Time-geography, Space-Time-Cube (STC) in the form of a 3-D space-time framework is the most prominent method to visualize the spatio-temporal data.
Annotated trajectories
Spatio-temporal data have three major components: space (where), time (when) and objects (what) (Peuquet 1994). Each component consists of specific characteristics which are linked by various relationships. While GPS system is capable to fit our personal needs of acquiring where and when, the requirement of obtaining and representing the third component objects is arising. In order to investigate a moving object in space and gain a deep understand of its trajectory, various types of questions need to be answered, e.g. how is the object when it arrived at the particular location, what was the environment of the object at a selected moment, and when the object visited another place what occurred. These questions reflect that the third component should contain the features that can represent both the internal and external properties about the object. The internal attributes indicate the self-state of the moving object. Comparatively, the external attributes should be illustrated by environment where the object stayed at specific moment. As mentioned before, modern mobile devices enable us to capture information including moving object itself and the surrounding situation at the locations when we record the GPS data. The timestamp, for instance, photographs are clear to mark the place where the photo was taken and to remind us that particular moment, what was happening at that place. Obviously, this attached information can be realized as the annotations of the GPS tracks.
Problem Statement
In recent years, there has been a burst of interest to create, assemble, and disseminate geographic information voluntarily by individuals, which is stimulated by using the modern equipments and Web connection. This kind of information is named as volunteered geographic information (VGI) by Goodchild (2007). Although rich datasets are available by taking advantage of new technology, it leads to a new challenge we are facing “We may be able to acquire data of a new form or quality that cannot be analyzed with existing tools as the datasets may be so large, dense or contain so many dimensions that no current tool supports interactive investigation effectively” (Gennady Andrienko & Natalia Andrienko 2005). The typical dataset example is the collection of GPS tracks and appending annotated attributes which is promoted by enabling techniques. Here we term this data type as Annotated-Space-Time-Path (A-STP). At present, there are limited options provided to us to investigate and apply human perceptual abilities to the exploration of this complicated data type available by current techniques. From a Geo-information perspective, a comprehensive understanding of these problems requires multidisciplinary approaches and suitable tools for dealing with large amount of complex spatio-temporal data (Kraak and Husiman 2008). Therefore, this research will concentrate on developing a proper visualization environment of annotated movement data for exploratory process (see figure 1-1).

SUITABLE GRAPHIC REPRESENTATION FOR ANNOTATED-SPACE-TIME-PATH
3
Figure 1-1 Definition of problem in this research
1.2. Research Identification
The main research objective is to design a suitable visual representation that allows exploration of the Annotated-Space-Time-Path (A-STP) of moving objects.
1.2.1. Research Objective
The specific objectives of the research are: • To specify graphic representations that are suitable to represent the complicated
characteristics of moving objects, especially for the spatio-temporal data, based on time-geography theory and research on Space-Time-Path, which are general and specific level respectively
• To gain insight in the nature of A-STPs • To find a proper strategy for visualization • To design an effective environment (prototype) that allows the visual exploration tasks of A-
STPs using the Space-Time-Cube • To test the usability of the prototype by the user-based evaluation
1.2.2. Research Questions
The questions that are attempted to answer in the research are the following: 1. What roles do the time-geography theory and Space-Time-Cube play when we are willing to
visualize spatio-temporal data? 2. What visualization methods exist to visualize spatio-temporal data? 3. What are the defects of existent representations? 4. What defines Space-Time-Path?
WHEN
WHERE WHAT
Annotations of GPS Track
e.g. photographs
Movement Data e.g. GPS track
+

SUITABLE GRAPHIC REPRESENTATION FOR ANNOTATED-SPACE-TIME-PATH
4
5. What type of annotated information is possible to be appended to the Space-Time-Path as annotation?
6. What is A-STP? 7. What strategy could be adopted for visualizing A-STP? 8. What are the required functionalities of visual environment for A-STP? How to devise and
integrate these functionalities in this environment? 9. What does the necessary graphic representation look like? How to perform it? 10. How can the A-STP be queried, analyzed or edited in this environment? 11. How effective the designed representation method is?
1.2.3. Innovation aimed at
The current technology provides us many possibilities to access individual movement data and information. Unfortunately, we are lack of powerful and effective tools to represent and explore these dataset. This research aims at designing a suitable visualization tool to fill the gap. What is studied in this research will expand the functionality of an existing visualization environment (Space-Time-Cube)and allow us to explore this new form of dataset.
1.2.4. Related work
In time-geography (Hägerstrand 1970), individual behaviour was initially identified constrained by both temporal and spatial attributes. The space and time are considered inseparable in Hägerstrand’ time-geography. It presumes that the each person is always following a path through space and time at daily, weekly, yearly and even his whole life scale. An individual‘s movement is formulated as a trajectory through a 3D space-time framework, where its base represents spatial dimensions (geography) and the vertical axis represents time. This 3D visualization environment is defined as Space-Time-Cube. Typically, it contains Space-Time-Path which addresses individual’s movement. Miller (1991) applied principle of Space-Time-Cube in digital GIsystem to establish accessibility measure in an urban environment. The large amount and detailed spatio-temporal data is also applied in research of human activity patterns in space-time (Kwan and Lee 2003). To study individual accessibility to locations in a given period of time (Huisman and Forer 1998), Space-Time-Prism (Lenntorp 1976) was incorporated into Space-Time-Cube. Recently, a more interactive and flexible Space-Time-Cube with extended functionality was proposed to users for viewing, manipulating and querying the GPS track data (Kraak 2003; Kraak and Koussoulakou 2004). With the generated geographic information that are increasingly devoted by individual, Goodchild (2007) termed this kind of information as volunteered geographic information (VGI). He explained several technologies which enable this VGI spread. Spinellis (2003) developed Geotemporal Web (GTWeb) system which could automatically converts raw data from the typical vacation trip into a lively Web site. Moreover, a GTWeb site represents the trip overview, timelines, maps and annotated photographs.

SUITABLE GRAPHIC REPRESENTATION FOR ANNOTATED-SPACE-TIME-PATH
5
������������ ������ ����������������������������������������� ���������
�� ��������������������Q7, Q8
������ ����������������� ������ ����Q9, Q10
��!"���������������������Q11
#������������������$������������
�������������
%������ ��&��'�
(��)��������������������Q4-Q6
*��+������������"������"������,��������� �������� ���������-���������� ����������
Q1-Q3
1.3. Methodology
The research work will be composed by six phases sketched below (figure 1-2):
Figure 1-2 Methodology work flow graph
(1) Study on spatio-temporal data, geovisualization theory and time-geography. The main approach in this section will be literature review, which focus on: � Exploring the three components of spatio-temporal data � Existing visualization methods for representing Space-Time-path � Interactive tools � Visual Information-Seeking Mantra
(2) Gain insight of the GPS data along certain paths as well as annotated information, e.g. photographs, unique landmarks, sounds, discuss the meaning of annotations and current techniques for adding annotation
(3) A conceptual framework will be deduced from the literature study, in which the combination of selective tools and assisted functionalities are addressed.
(4) Based on the conceptual framework, a prototype will be created using open source software. The collected dataset will be used as test data for the prototype.
(5) Evaluate and test the usefulness of the prototype. (6) Generalize the results and propose the recommendations.

SUITABLE GRAPHIC REPRESENTATION FOR ANNOTATED-SPACE-TIME-PATH
6
1.4. Summary
In the first chapter, the research problem, objectives and methodology are discussed. The remaining part of the thesis will include 6 chapters:
Chapter 2 will review the related literature about the characteristics of spatio-temporal data and existing visualization methods for them. For the subsequent prototype design, novel interactive tools,and the goals and substance of Shneiderman’s Visual Information-Seeking Mantra will be introduced.
In chapter 3, insight of A-STPs will be obtained. The development from STP to A-STP will be illustrated. The available annotation types and the properties of annotations will be described subsequently. At last, the specific suitable tagging techniques for certain annotation type will be indicated.
Chapter 4 conceptually defines a visualization environment for A-STPs. Selection of visualization environment is decided based on a comparison among the existing visualization methods. The overall design will provide an exploratory visualization environment for A-STPs by adopting Shneiderman’s Visual Information-Seeking Mantra, which includes overview, zoom/filter and details-on-demand three visual tasks. The diverse annotation representations and exploratory strategy will be described.
Chapter 5 implements the conceptual prototype. The data processing, operations and interactive tools will be reported.
A short Usability evaluation will be conducted in chapter 6. The usability concept, current available evaluation methods and method selection for this research will be discussed shortly. Detailed procedure of evaluation session will follow. An analysis of results will be described.
The conclusion and recommendation follows in the chapter 7.

SUITABLE GRAPHIC REPRESENTATION FOR ANNOTATED-SPACE-TIME-PATH
7
2. Graphic representation of spatio-temporal data
2.1. Introduction
In this chapter, discussion of space and time components in geographic space will be presented firstly and then development of analysis and exploration the general properties of spatio-temporal data from the geovisualization perspective will be described. The characteristics of graphic representation variables will be briefly explained next. The last part in this chapter is about the visualization methods and techniques of graphic representation.
2.2. Space and time issue
2.2.1. Spatio-temporal properties in geographic space
“Things occur or exist in relation to space and time” (Peuquet 2002). Space is certainly a basic element in geographic space. The knowledge and awareness of place is rooted deeply in human consciousness which focuses on real and physical environment. After studying on “space” for a long time, people realized that time is an equally important dimension which “has been part of geographic understanding” (Sauer 1974).
At the early stage of studies, space and time are considered abstract, which are restricted to exist in its own nature without relation to anything external. From this viewpoint, position in space is distinct and definite occurring at a particular moment; similarly, time exists in itself, regardless of what happens in time. As knowledge of space and time deepened gradually, Einstein described a relative and continuous view of spatio-temporal phenomena, which deems space and time are attached to each other. When absolute view of space and time largely concerns how place and object at a particular point in time, the relative view thinks about how the area, place or spatial structure develops over time. “We need to know where places are, what are they like, and how and why they change over time” (Lawton 1983). As we study the processes over space and time, the time dimension must be involved, as Hägerstrand (1970) stated “time has a critical importance when it comes to fitting people and things together for functioning in socio-economic systems, whether these undergo long-term changes, or rest in something which could not be defined as a steady state.”
At the fundamental level, historical view of space and time can be categorized into either continuousor discrete (MacEachren 1995). The continuous view points out that all objects are contained within space and time, whereas the discrete view focuses on an object occurs at distinct spatial locations or within restricted area. Spatio-temporal phenomena are also classified according to the type of changes that occurs to objects over time (Blok 2000) (see figure 2-1):
� Changes in the spatial domain: appearance, disappearance, mutation and movement � Changes in the temporal domain: moment in time, pace, duration, sequence and frequency

SUITABLE GRAPHIC REPRESENTATION FOR ANNOTATED-SPACE-TIME-PATH
8
Figure 2-1 Characteristics of change in spatial and temporal domain (Blok 2000)
2.2.2. Time-geography and the notation apparatus
The study of human activities and movements in space and time has been an important research area in geographic science. In this domain, an innovative and instructive approach integrating space, time and human activity perspectives is known as time-geography. This research was initiated by Torsten Hägerstrand at Lund University, Sweden in the 1970s. Time and space are seen as inseparable in this theory. The essence of Hägerstrand’s time-geography was formulated as all the actions and events that sequentially make up an individual’s existence have both temporal and spatial attributes (Golledge and Stimson 1997). Time-geography deals with complex space-time phenomena by analyzing space-time patterns at individual level and observing paths of individuals through space, time and their interactions (Peuquet 1994). The aim of time-geography is basically to develop a model of society, in which human behaviour or activities are simultaneously located in space and time based on a set of constraints, which are composed by physiological and physical necessities, private and common decision (Hägerstrand 1970; Hägerstrand 1989). Three major constraints are “capability constrains”, “coupling constraints” and “authority constraints”. Through understanding how the three constraints impact on human movement and activity patterns, time-geography not only fuse distinct scientific areas e.g. geography and human science together (Lenntorp 1999). It also attempts to reveal the complex interaction between space and time and their joint effect on the structure of human (Ian G. Cullen 1975).
During the developing process of time-geography, Hägerstrand took a path as a basic element. He developed the basis of the time-geography notation system in order to keep track of both the spatial and temporal dimensions at the same time. The notation system, in many cases, has been seen as the hallmark of time-geography. They show the fundamental capabilities of the time-geography that explore the human activities in space and time.

SUITABLE GRAPHIC REPRESENTATION FOR ANNOTATED-SPACE-TIME-PATH
9
The notation apparatus system includes (see figure 2-2):
Figure 2-2 The notation apparatuses system of time-geography (Moore, Whigham et al. 2003)
� Space-Time-Cube: a 3D space-time frame work, where the horizontal plane represents spatial dimension and the vertical axis represents time elapsing (Kraak 2003)
� Space-Time-Path (lifeline): a trajectory through time and over space, from the point when and where an individual started his/her activities to the point when and where he/she ceased (Golledge and Stimson 1997)
� Space-Time-Prism: individual ability limited by transport planning, other locations that accessible from any point for a given period and physical constraints (Lenntorp 1976)
� Bundle: a group of several path locations where may occur possible interaction � Station: vertical line indicates a stay at the particular location. It can be home, workplace, or
restaurant. � Domain: a control area treated as container to restrict objects inside or outside perimeter
Time-geography should not be simply looked upon as a composition of space and time, but rather a framework for analysis. It is a great challenge that can specify the possible relation between the human behaviour and natural environment in theoretical formulations (Pred 1977). Meanwhile, it offers many valuable tools to provide rich views of the geographic space. The great benefit of this approach is that it changed the situation that the emphasis used to focus on space and time was shifted to people partially. Our traditional GIS, i.e. place-based perspective is gradually changed into more people-based perspective (time-geography) (Miller 2002).
2.3. Visual representation of spatio-temporal data
The study on visual representation of spatio-temporal data starts on the representational framework, which determines the three basic components of spatio-temporal data: location, time and attribute. Based on the framework, several presentation methods are discussed. Graphic variables are also an important means to present geographic data based on a flexible application of them. The last part of this section is an introduction of Shneiderman’s Visual Information-Seeking Mantra. The structure is sketches below (Figure 2-3).

SUITABLE GRAPHIC REPRESENTATION FOR ANNOTATED-SPACE-TIME-PATH
10
Figure 2-3 Structure for section 2.3
2.3.1. Representational framework of spatio-temporal data
Our awareness of the complexities of the world increases our desire to understand the nature of geographic space, and more specially, spatio-temporal data and the information derived from them. Depending on the magnitude and complexity of the available geographic dataset, challenges arise as how the data can be transformed into information and how these information can be visualized is posed to all the geographic researchers (Kraak 2003).
Initially, to do an analysis, we need to know what is known and what is to be found (Andrienko N. 2003). In defining the potential information needs, Bertin (1983) takes a systematic approach according to the structure of data. Bertin’s framework is based on two notions: “question types” and “reading level”. The notion of question types was introduced as “there are as many types of questions as components in the information”. Further, the unknown component refers to a “search target”. A complementary division of each question type is termed as “reading level”. The advantage of Bertin’s framework is that it can direct the tool or application developer quickly to relate tasks to the component of data (Andrienko N. 2003).
While Bertin considered data in general, Peuquet applied this method on spatio-temporal data specifically. a triad spatial-temporal representation framework (Peuquet 1994) is created by distinguishing three components of spatio-temporal data: locations (where), time (when) and attribute (what) (see figure 2-4).
$� ������������.���������
�����
����
����� �� �
$� ��������������������������������������� ��
����
���������� �
�������������� �
)�� ����"���������
���������/��0������
����������������1����

SUITABLE GRAPHIC REPRESENTATION FOR ANNOTATED-SPACE-TIME-PATH
11
Figure 2-4 The basic components of the Triad framework
Subsequently, three basic types of questions are defined according to them (Peuquet 1994): 1) when + where what: Describe the object or sets of objects (what) that are present at
a given location or set of locations (where) at a given time or sets of times (when). 2) when + what where: Describe the location or set of locations (where) occupied by a
given object or sets of objects (what) at a given time or sets of times (when). 3) where + what when: Describe the time or sets of times (when) that a given object or
sets of objects (what) occupied a given location or set of locations (where).
The reading level was elaborated upon by applying this thought independently on spatial and temporal dimensions of spatio-temporal data (Koussoulakou and Kraak 1992). Researchers should be able to discern spatial, temporal and attribute components under different reading level. Andrienko (2003) developed an operational task typology framework by integrating the reading level discussed by Koussoulakou and Kraak, Peuquet’s framework and exploratory tasks on identification and comparison (see figure 2-5). In this framework, the operational tasks are incorporated successful to joint the “search level” and the “when, where, what” framework to get a four-dimension scheme. This results in four categories: � elementary “when” and elementary “what + where”: describes characteristics of this object
(location) at the given time moment; � elementary “when” and general “what + where”: describes the situation at the given time moment� general “when” and elementary “what + where”: describe the dynamics of characteristics of this
object (at this location) over time; � general “when” and general “what + where”: describe the evolution of the overall situation over
time
+�������2�����3� ����������2����3�
�����2����3�

SUITABLE GRAPHIC REPRESENTATION FOR ANNOTATED-SPACE-TIME-PATH
12
Figure 2-5 The operational task typology framework (Andrienko N. 2003)
Through the reviewed work, it can be realized that establishment of a sophisticated representational framework need a clear comprehension of the nature of spatio-temporal data, a definite search level and a well defined search target. As a result, designing a representational framework is required to define the set of aims and tasks specifically for each particular type of data, probably by adopting some general typology.
2.3.2. Representational method of spatio-temporal data
The goal of representing time in Geographic Information System (GIS) has been addressed by Peuquet (1994) as: “…to represent stored spatio-temporal data in a way that conforms to human conceptualizations of the world in space-time and geographic theory and to technical demands for accuracy and flexibility in computer-based analysis and visual presentation”. In This section, in order to discover the defects of them and state the demand of more effective methods, existing visualization techniques that are used to represent spatio-temporal data will be discussed severally.
2.3.2.1. Single static map
The single static map uses specific graphic variables and symbols to show change in order to represent an event (Kraak and Ormeling 2003). Figure 2-6 is a classic example that Minard’s map shows Napoleon’s campaign in Russia. This map simply but effectively visualizes the dynamic process during the campaign. The symbol represents the route of Napoleon’s army and the thickness indicates the variation of the number of soldiers.

SUITABLE GRAPHIC REPRESENTATION FOR ANNOTATED-SPACE-TIME-PATH
13
Figure 2-6 Minard’s map from 1869 showing Napoleon’s 1812 campaign in Russia (Copy from lecture handout of Kraak, 2008)
Another example is mapping the urban growth of the city of Maastricht in the Netherlands (see figure 2-7). The change of value which is one of the basic graphic variables has been used to represent different time. The lighter value shows the newer expanding area of this city.
Figure 2-7 Urban growth of the city of Maastricht mapped by a single static map (Copy from lecture handout of Blok, 2008)
The static map limits dynamic changes on one graphic image. The changes can refer to changes in spatial domain or attributes domain. The static map is easy to understand if graphic variables are used properly. However, there are some problems existing in static map. For example, the continuous time is represented instead of time points, which deviates the consecutive characteristics of spatio-temporal data. Furthermore, the complicated changes, like the original city area may change into non-city area after several years, could not be reflected in a single map.

SUITABLE GRAPHIC REPRESENTATION FOR ANNOTATED-SPACE-TIME-PATH
14
2.3.2.2. Series of static maps
While single static map could not display events that stretch over time clearly. A solution is to split it into a set of maps. Change will be perceived by looking at the succession of individual maps depicting the event in successive snapshots (see figure 2-8).
Figure 2-8 Temporal pollutant levels in Los Angels mapped by a series of static maps (Tufte, 1982)
In series of maps, the variation of both spatial and temporal dimensions is replaced by the representation of spatial sequence only. The cognition of temporal change is indirectly conveyed to the reader by following the spatial sequence. The reader needs to combine the information in each individual map into an event (Koussoulakou and Kraak 1992). Since series of maps is constituted by small multiples, each representing a distinct moment in time, changing one of these small multiples may offer an entire view of the changing process. The inefficiencies of series of static map are that it is difficult to deal with the long series and the information loss between each two static map and the information missing between each two static map.
2.3.2.3. Animated map
Animation shows time elapsing and represents information about entities evolving under the influence of long-term trends (Gennady Andrienko & Natalia Andrienko 2005). Change will be perceived by displaying several snapshots after each other (see figure 2-9). It is strongly associated with the representation of change over time.
Figure 2-9 Urban growth of the city of Maastricht mapped by an animation (Copy from lecture handout of Blok, 2008)
As early as the 1930s, cartographers experimented with adding the time dimension to representing dynamic geographic processes with animated map display. It is a dynamic visual statement that

SUITABLE GRAPHIC REPRESENTATION FOR ANNOTATED-SPACE-TIME-PATH
15
displays through movement or change in the display. The most important aspect of an animated map is concluded as “what happens between each frame is more important than what exists on each frame” (Peterson 1995). The difference between animated maps and a series of static maps is that the variations introduced to represent an event have to be deduced not from a spatial sequence but from real movement on the map itself (Kraak 2003).
As mentioned, the animated map is very useful to demonstrate trends and process, as well as provide insight into spatial relations. And yet, sometimes, it may contain too much abundant information for reader to understand and absorb. It might be caused by the animated map has its own temporal scale, or it has its temporal resolution (the smallest temporal unit resolvable) and pace (the amount of change per unit time) (Harrower and Fabrikant 2008). Many attempts have been made to make the animated more intelligible and controllable. A legend of animated map (see figure 2-10) plays an important role to allow reader to communicate with the animation by adjusting the speed, the staring point or any other temporal properties. When the whole dynamic process is perceived fully by reader, the detailed information could also be reviewed easily.
Figure 2-10 The animated map legend (Dykes 2005)
2.3.2.4. Space-Time-Cube
The conceptual model of Space-Time-Cube can be traced down to the time-geography, which was originally introduced by the paper “what about people in regional science” (Hägerstrand 1970). The advent of Space-Time-Cube remedies the situation many GIS-based tools were limited to deal with time properties. The spatial and temporal dimensions of the data are able to be viewed simultaneously and in a uniform way. This 3D framework was described as “space time aquarium”, where the two dimensional horizontal planes (along the x and y axis) represent the geographic space and the vertical axis (z axis) represents the time (see figure 2-2). The principal objective of Space-Time-cube is to integrate both spatial and temporal dimensions of human activities into an analytical framework. The map about Napoleon’ Russian campaign (see figure 2-6) was successfully incorporated into Space-Time-Cube (see figure 2-11). In this example, point locations represent the places where the battles happened, while the shew lines represent the troop movement over the time and the thickness indicates the variation of the number of soldiers.

SUITABLE GRAPHIC REPRESENTATION FOR ANNOTATED-SPACE-TIME-PATH
16
Figure 2-11 Napoleon’s Russian Campaign in Space-Time-cube (Copy from lecture handout of Kraak, 2008)
As mentioned before, in the Space-Time-Cube, many additional concepts could be able to represent. Here, four important ones will be illustrated. Basically, Space-Time-Path is a trajectory of moving object through time and space (see figure 2-2). The Space-Time-Path can be projected on the base of Space-Time-Cube, resulting in a path’s footprint. The vertical line of Space-Time-Path indicates there is no movement over space. When the line is slope, the velocity can be detected. The shallower the slope of the line means the faster the speed.
Another important time-geography concept is Space-Time-Prism (see figure 2-2). It refers to the possible locations where people can reach restricted by time and space constraints. The widest extend of Space-Time-Prism is called the Potential Path Space (PPS) and its footprint is called Potential Path Area (PPA). In the ideal environment, it assumes that every location on the cycle edge can be reached. However, in reality, due to the natural conditions and transport system, it may not be possible to obtain.
The new data collection technology brings an increasing interest in the Space-Time-Cube. This has been discussed by (Huisman and Forer 1998; Miller 1999; Kraak 2003; Kwan and Lee 2003; Kraak and Koussoulakou 2004; Eccles 2008). The key words of the geovisualization environment are interactive, dynamics and alternative views. Assisted by the advanced GIS-based 3D modelling techniques, Space-Time-Cube and its affiliated functionalities is apparently regarded as a profitable approach for human activities in space and time (Kapler and Wright 2005; Eccles 2008). It is flexible to changes the views, manipulate data, query data and see the result.
Unfortunately, regarding to the question “what”, there is no obvious answer can be derived from Space-Time-Cube. Because the attributes of spatio-temporal data always changes along the time, there is no particular functionalities to display them. To improve the response of the question “what” in Space-Time-cube, other data sources need to be link to the Space-Time-cube in order to provide more concrete information about the identity “what” of the object. This is also the major research objective.

SUITABLE GRAPHIC REPRESENTATION FOR ANNOTATED-SPACE-TIME-PATH
17
2.3.3. Graphic representation variables
To portray the geographic data, symbology plays an important role to convey the information and enhance people’s conception. The graphic cues are extracted from the objects or phenomena in reality. The perceptual characteristics of the graphic cues are caused by various basic differences in the graphic character of the graphic cues. Bertin (1983) systematize all the differences among symbols as being cases of six graphic variables including (see figure 2-12):
• Difference in size • Difference in lightness or (colour) value • Difference in grain or texture • Difference in colour hue • Difference in orientation • Difference in shape
Figure 2-12 Basic graphic variables
For each graphic variables, Bertin proposed corresponding rules for their appropriate use, based on own features of each variables and possible combination of them. Among the six graphic variables, colour is an excellent selective variable. Colour variation is simply the perceptible difference which can be perceived between uniform arrears having the same value (Bertin 1983). Colour is differentiated at three aspects: colour hue, colour saturation and the (grey) value or lightness. The nature of colour determines that it can combine easily with other variables such as value, size to provide different perception. The speciality of size is that any figure can vary in size regardless of its position, value, texture, colour, orientation or shape, in point or line symbol.
Considering the nature of data, two types of data exist: qualitative and quantitative (Bertin 1983). Qualitative data is also called nominal data. Nominal data exists as discrete, named values without a natural order among the values. Due to the measurability, quantitative data can be classified as interval and ratio. The difference between them is that interval data does not have absolute zero. Between qualitative and qualitative data, ordinal data exists. These four types of data can also be characterized by graphic variables (see table 2-1).

SUITABLE GRAPHIC REPRESENTATION FOR ANNOTATED-SPACE-TIME-PATH
18
������ ������� ����"��� ������
��,�� ���� ���� ����
0����� ���� ���� )���4��5����� ���� ����
���������� ����
6��������� ���� ��� �� ����
Table 2-1 Data types linked to visual variables
2.3.4. Visualization tasks
While the volume of geo-information is incredibly increased with the advent of novel techniques, geovisualization must be able to represent the collection of rich varied dataset. The exploration of the data is becoming extremely difficulty without following certain visualization methods. While more and more integrations of techniques and tasks appear, visualization methods will enable convenient exploration of growing information by a wider range of users. One frequently cited guideline to practitioners who seek to design novel systems is the "Visual information-seeking mantra", proposed by Shneiderman in 1996. In his method, data visualization usually follows a three-strategy process (Shneiderman 1996):
� Overview: It offers an overview of the entire dataset. Gain an overview of data possibly include gauging the number of items and the range and distribution of the attribute values, or estimating how much things have changed since last time the user reviewed the data (Craft 2005; Plaisant 2005).
� Zoom/ Filter:Users need to be able to zoom in on items of interest. Users are typically interested in some portion of the collected data, and they need assistant tools to enable them to deal with the zoom focus and zoom factor. There are three basic types of zooming: geometric zooming, fisheye zoom and semantic zooming. � Geometric zooming: allows the user to specify the scale of magnification and increasing or
decreasing the magnification of an image by that scale (Stephens 2003). � Fisheye zoom: magnifies the centre of the field of view, with a continuous fall-off in
magnification toward the edges (Möller 2004). � Semantic zooming: is a way to provide different represent for different spatial scales (Modjeska
1997). It does not only change parameters of a graphical representation, but modifies the selection and structure of data to be displayed.
Filter offers the opportunity for users to quickly focus on the subjects they are interested by eliminating unwanted items. It can be done by a direct selection of the desired subset (browsing) or by s specification of properties of the desired subset (querying) (Dykes 2005). It is a combination of selection and perception enhancement. The techniques involves in filter task including dynamic queries (Shneiderman 2004), sorting, grouping or highlighting.

SUITABLE GRAPHIC REPRESENTATION FOR ANNOTATED-SPACE-TIME-PATH
19
� Details-on-demandSometime, users need to select one item or group to get insight of the details of them. This can be useful for relating the detailed information to the rest of the dataset or for quickly solving particular tasks, such as identifying a specific data element amongst many or relating attributes of two or more data points (Craft 2005).
Shneiderman’s Visual Information-Seeking Mantra is concluded based on extensive practical experience. It is a starting point to design advanced visualization environment for information exploration. It makes use of remarkable human perceptual ability for visual information. Within the visualization, there are opportunities supported by interactive tools for representing relations by zooming, by linked window or selecting interesting items by query or by highlighting. Thus, the dependent interactive tools will be introduced.
2.4. Techniques and tools of spatio-temporal geovisualization
Geovisualization is an integrated field where scientific visualization, image analysis, cartography, information visualization, exploratory data analysis and GIScince are combined together to provide theory, methods and tools for visual exploration, analysis, synthesis and presentation of data that contains geographic information (MacEachren and Kraak 2001). High levels of interaction are becoming a primary concern and requirement of the modern geovisualization whether we communicate with data for exploration, analysis and learning new information. Technologies advance as one important feature of the development of geovisualization facilitating human spatial cognition and the potential visual approaches gain insight into the data, solve problem, draw conclusion and directly interact with the data (Dykes 2005). A number of dominant visual techniques and tools will be briefly discussed in this section.
� Multiple linked views Multiple linked views (MLVs) enable user to quickly view a scenario, compare it with previous realizations, example prosperities such as dependencies view and sizes, put this view to one side and try another scenario (Roberts 2004; Dykes 2005). As the multiple linked views are gathered together, the information conveyed by individual view can be perceived as a whole body. It allows users to carry out further investigation and exploration, such as brushing.
� Brushing Brushing is an interactive selection process which is always combined with linking views. Once one object is selected in one view, all the corresponding points will be shown as highlight in other views also. It is a process to connect the selected data to other views of the dataset. The linkage between the multiple linked views and brushing provides more information than considering the component visualization independently (Dykes 2005).
� Query Query is an effective way to make user control the contents of the display, and quickly focus on his interesting items by filtering the unexpected ones (Shneiderman 2004). It creates a subset from a known data. There are two ways to conduct the query task. The first method is to filter out other items

SUITABLE GRAPHIC REPRESENTATION FOR ANNOTATED-SPACE-TIME-PATH
20
which do not satisfy the constraints set by query languages, for example, SQL . The other method is to utilize some visual tools, such as highlight the selected items.
� Highlight Highlight plays a valuable role in facilitating exploration and analysis (Robinson 2006). It can be completed by flashing or increasing the size of the interesting items, as well as by eliminating the uninteresting items and keeping the interesting items at mean time (Shneiderman 2004; Dykes 2005). Additionally, providing a deeper level of interaction within highlighting may help analysts acquire contextual information via a well-designed interface.
2.5. Summary
Relating literature was reviewed in this chapter. The basic knowledge about spatio-temporal data and existing visualization methods are discussed. Shneiderman’s Visual Information-Seeking Mantra is being considered as an appropriate strategy to conduct a series of visual tasks. A description of potential interactive tools is succeeding. All these information provide a context for the manner of visualization of spatio-temporal data. In the subsequent chapter, the target of this visualization research, Annotated-Space-Time-Path will be analyzed in terms of its characteristics, components and creation methods,

SUITABLE GRAPHIC REPRESENTATION FOR ANNOTATED-SPACE-TIME-PATH
21
3. Space-Time-Path and Annotations
3.1. Introduction
Continuous technological advances are dramatically altering the way which geospatial data is collected, shared and disseminated. More and more people unconsciously participate in creating geographic information not only geographic scientists, but also everyday people. This remarkable phenomenon involved people is named as “volunteered geographic information (VGI)” (Goodchild 2007). It results in the contemporary geography is called as “Neogeography” (Turner 2006) . Neogeography is essentially about people using and creating their own maps to share location information, help shape context and convey understanding through knowledge of places.
Innovative technologies have had a profound impact on the nature and volumes of data available to the geovisualization community. New datasets are being generated by diverse applications such as mobile communications technology, digital commercial transactions, Web-logging software and various types of GPS “tagging”. The information provided is not only about locations, but also about other information related to locations. For example, Wikimapia (URL 3.1) presents nearly 7 million places that have been identified and annotated by its users. The advent of the Google Maps (URL 3.2) application programming interface (API) has enabled data from multiple sources to form a new integrated data. OpenStreetMap (URL 3.3) allows users to view, edit and use geographic data in a collaborative way which individuals’ GPS data can be shown on map. Photo mapping technique is used to post the photos to exact position where they were taken by matching the coordinates. These photos linked to locations are made public to let visitor to see places in detail. “Tagging” allows nearly all possible online content to be linked to its geographic location, whether described in formalized terms such as latitude/longitude coordinates or in linguistic descriptors such as place names(Gartner 2007).
This chapter will expand the existing notion of Space-Time-Path into a new integrative phenomenon Annotated-Space-Time-Path. It could be investigated from three perspectives: (1) what types of annotation are applicable, (2) what geographic information can be potentially conveyed by these annotations, and (3) how to create an Annotated-Space-Time-Path, i.e. how to link annotations to Space-Time-Path.
3.2. Space-Time-Path
3.2.1. Generation of STP
Due to the rapid increase in the use of mobile devices, vast quantities of spatio-temporal data are being generated and collected. GPS and Geo-sensor networks support the data collection of moving objects (Dykes and Mountain 2003). GPS operates satellite network that provides three-dimensional

SUITABLE GRAPHIC REPRESENTATION FOR ANNOTATED-SPACE-TIME-PATH
22
location. Receiver uses several of several of the satellite broadcasting to determine its current position and time. The place marked by GPS receiver is called as “GPS waypoints” in GPS log. A number of GPS points will constitute a GPS track (see figure 3-1). One major approach to create a GPS log is recording locations by GPS at a regular or irregular time interval. Another one is, for example, GPS track logs representing individual movement can be used to generate point-density surfaces giving a representation of where an individual spends his time and their familiarity with specific locations from which information can be extracted (see figure 3-2). These rich datasets offer great opportunities for understanding and analyzing human activities across many domains from a geographic perspective.
Figure 3-1 An example of GPS track Figure 3-2 An example of GPS point cloud
(URL 3.4) (Brunsdon 2007)
Among the growing available spatio-temporal datasets, a significant type is the dataset that records the locations of a moving object through time. It can be a GPS track, individual transport data or a travelling diary. It is a time-stamped record of locations that an individual passed at regular or irregular intervals. The space-time observations in this dataset are discrete. The data type fits the features of “Space-Time-Path” (Miller 1991) mentioned in previous chapter. Therefore, the generation of Space-Time-Path mainly relies on using GPS nowadays.
3.2.2. Illustration of STP
In geographical space, every moment of moving objects or individuals is specifically linked to certainlocation. A dynamic path through a series of locations can be described by following the order of time. For instance, a mobile trajectory recorded by GPS receivers could represent individual movement in space-time. In fact, this track is constituted by a set of GPS points. However, besides the geographic and temporal information, there is no attribute information involved in Space-Time-Path, which is also a basic element belonging to spatio-temporal data (see figure 3-3). The detailed information about the attribute of the Space-Time-Path, e.g. the status of moving object or place at one point in time, how the environment change between two locations or what happened at a particular location needs to be supplied by other means.

SUITABLE GRAPHIC REPRESENTATION FOR ANNOTATED-SPACE-TIME-PATH
23
Figure 3-3 Relation between Space-Time-Path and the three basic components
3.3. From Space-Time-Path to Annotated-Space-Time-Path
As mentioned in chapter 2 (see section 2.3.1), Peuquet (1994) considered the key feature of spatio-temporal data is that they are constituted by three major components: location (where), time (when) and attribute (what). In principle, Space-Time-Path is only a trajectory of moving object through time and space. Consequently, a series of questions around the Space-Time-Path are raised by exploring the nature of it, such as how is the object when it arrived at the particular location, what was the environment of the object at a selected moment, and when the object visited another place what occurred. These questions are closely related to the Space-Time-Path and support us to get insight into this trajectory. Although Space-Time-Path does not possess the ability to answer all the above questions, it still provides great opportunities to remedy the deficiencies by adding other sources of information.
Based on the above requirement, an innovative form of Space-Time-Path needs to be created. This extended Space-Time-Path must be able to answer the question “what” and realize the visual tasks by containing all the possible relevant information. From another point of view, assisted by novel technologies, the amount and format of available dataset are becoming larger and more diverse. The combination of Space-Time-Path and the relevant user-generated annotations appears feasible. Here, a new term “Annotated-Space-Time-path” (A-STP) is proposed to describe this new data form (see figure 3-4). Comparing to regular Space-Time-Path, Annotated-Space-Time-Path is an integrated dataset. The basic constituent of Annotated-Space-Time-Path is still the spatio-temporal trajectory composed by a set of GPS points, and then, according to the places and time it travelled, various kinds of annotations can be attached to it. It elaborates the spatial, temporal and inherent properties of any existence in geographic space in diverse expressive forms. These annotations could be introductions of some interesting places, a photo recording a memorable moment or specially designed for some practical applications, like sports, public transportation.
Figure 3-4 The development from STP to Annotated-Space-Time-Path
����
������������ �
������
��� ������������
�����
+������� ���������7�
��
��
5�
�
8������������������
�
�����
����
������
�����
������
������ �� ��

SUITABLE GRAPHIC REPRESENTATION FOR ANNOTATED-SPACE-TIME-PATH
24
3.4. Representations of Annotations
As mentioned, Space-Time-Path could not fully satisfy people’s curiosity about the location, changes and events for lack of concrete information. User-generated geographic data offer great opportunity to improve the situation in providing enormous amount of location-based data, images, and other geographically relevant information which can be used to address attribute features of the Space-Time-Path, although they may be disorder and inaccurate. However, not all kinds of data can convey information explicitly due to their own limitations and human cognition. Only a few numbers of either direct or indirect expressions can be perceived well based on our knowledge of geographic space. These direct and indirect experiences are very profitable for our spatial learning of the spatio-temporal data, while the known knowledge about the spatio-temporal also plays an important role to help us interpret and understand these experiences better (see figure 3-5).
Figure 3-5 The interlinks between internal knowledge and external knowledge, and experience (Adopted from Peuquet 1994)
3.4.1. Traditional forms of annotations
In the strict sense, Space-Time-Path is all about location and time, which are naturally recorded by the GPS. Thus, the locations where the coordinates was logged and corresponding time are two inherent and vital properties of Space-Time-Path. From the view of users’ perception, the coordinates need to be translated as geonames and corresponding time should be labelled at each record point. Among the annotations, geonames and time labels are the two principal annotations that are derived from the original GPS data.
To convey the additional information, graphic images and language are the two primary, essential means of conveying information between individuals, and thereby provide an indirect source of knowledge (Peuquet 2002). Graphic images can be shown in many forms, including photographs, drawings, diagrams and maps. The photograph is the most popular representational form nowadays. It is used as annotations to address the situation of the place at the time it was taken. Usually, it is stored
���������������
When Time
Where Location
What Attribute
�����
� ���� �
�������
����
�����������
INTERNALLY STORED KNOWLEDGE DIRECT & INDIRECT EXPERIENCE
�����������
9���������������
�������������

SUITABLE GRAPHIC REPRESENTATION FOR ANNOTATED-SPACE-TIME-PATH
25
in a raster format. Drawings are essentially composed of points, lines and areas. Its application is similar to photographs. The written language, normally we call it as text. The text can be used to store the information either location-based or time-based. The content can be about geography, economy, social system and environment policy. Graphic images and written document are able to store the information and file of past events and then transmit knowledge.
3.4.2. Other forms of annotations
Most annotations can be represented by graphic images or descriptions. But it should be noticed that some information can not be neither quantified nor depicted properly by the above annotations. There are two types of dynamic annotations involved. The first type is sound which has been explored as a way to communicate information with users. It is initially used to visualize the uncertain spatial information (Hearnshaw and Unwin 1994). The information contained in sound could be generated from the traveller or the surroundings. For instance, standing in a forest, one exciting thing is to listen to sound of birds. Videos are capable to represent successive movements. It is powerful to express a dynamic process in real life. By these special forms, the expressions of what become more diverse.
Table 3-1 shows which type of information can be conveyed by which kind of annotations exactly: $� ���������������� ������������"�����
������ �������� � �� �������� �������� ��� � ���� ���� � ��� �� ����
�������
������� � ���� ���� ���������������������������������������
�������� ����������������������������������
�
�
)�� ����������
�� �� ������� ���������������������
)������� �������� ��������� �����������������
��5�� ������ � �� ��������� ������ ������� �!� ������� ����
�� ������������:��
"������ ����������� ���������!������������������������� �� �����
��������������� �����
����� �����������������������������������������������
Table 3-1 Types of annotations and information conveyed
Till now, available kinds of annotations have been described. However, by which means to attach them to the Space-Time-Path, and then, produce an Annotated-Space-Time-Path have not been explained. In the next section, this question will be answered.
3.5. Creation of Annotated-Space-Time-Paths
The Neogeography (Turner 2006) illustrates the extraordinary developing trend, which is about sharing location information with public and convey the understanding through the knowledge of place. It consists of s set of novel techniques and tools and brings a profound revolution of the available types of geographic datasets and the way we used to create and acquire them.

SUITABLE GRAPHIC REPRESENTATION FOR ANNOTATED-SPACE-TIME-PATH
26
A characteristic in the Neogeography is called “geotagging” (Turner 2006), which is a process of adding geographic identification data to various kinds of dataset such as text document, photography and video. These datasets usually consist of latitude and longitude coordinates, though they can also include altitude, bearing, accuracy data, and place names.
Another process is called “geocoding” (Turner 2006), which is able to convert the geonames into the coordinates (latitude and longitude). It can determine the position of a named location using automatic techniques. Since it provides the opportunity to get accurate and mappable coordinates from large datasets of address and geonames, it can be applied to tag text information.
Geotagging is the most common way to tag annotations, followed by geocoding. However, they are not able to deal with all annotation types. In GPS dataset, geographic information and related temporal information is registered. Taking the unique feature of geographic space into account, one special item only occurs at particular location at certain time. It is impossible to show one given item at same locations at same time. Accordingly, one annotation could be linked to the corresponding location by having identical time. Thus, using time is an effective tagging method for the type of annotations that contain explicit temporal information.
The selection of tagging method is determined by the property of annotation itself, i.e. the information it contained. For this reason, the next section will start from the investigation of the geo-information contained in annotations, the characteristics of each annotation and the specific tagging method for each annotation is discussed at last.
3.5.1. Geographic information contained in A-STPs
Basically, Annotated-Space-Time-Path is generated by people changing their locations along time. The geographic information is thought as the most essential information included. In terms of geometric properties of locations in reality, all spatial objects can be classified as point, segments and area around point or segment. Geo-information contained in annotations could be classified according to the four types locations (see figure 3-6).
Figure 3-6 Four possible types of location-based information contained in annotations
���� ��������
��� � � �����������
��� � � �������

SUITABLE GRAPHIC REPRESENTATION FOR ANNOTATED-SPACE-TIME-PATH
27
Point A point always refers to an exact location on Space-Time-Path. Geonames are considered to give the first impression to people about locations. Unfortunately, some places they share the same name. Under this circumstance, other auxiliary information is needed to locate certain place. For example, comparison of two photos is able to reveal the environment of different places, although they might use the same geoname. From the temporal perspective, point can be also deemed as a time point on Space-Time-Path. It records observation at certain place of certain moment. Besides the geonames, the suitable annotations for point include photos, drawings, diagrams, maps, texts, sound and video. Among these, photo is a special form annotation which may result in different impression by taken from different direction (see figure 3-7). Therefore, when we take the photo for a specific location, the orientation we facing also need to be stored.
Figure 3-7 Different orientation of photos cause different view (Kraak 2005)
Segment A segment of the Space-Time-Path can be regarded as a linear path, which is a continuous track of moving object. From time dimension, it is corresponding to a period. The intrinsic different of segment from point is that it reflects a process which evolves along time. The basic annotation types for segment are photos, drawings, diagrams, maps, texts and geonames. As a dynamic process, how the moving object went through locations over time and what the individual saw and felt in this duration can be annotated appropriately by sounds or videos. Additionally, the annotations about segment of Space-Time-Path could be a series of photos arranged by the order of the locations to create a Virtual Reality Environment.
Area around point or segment An area in reality could be refers to combinations of a point or a segment of Space-Time-Path and its surrounding areas. For example, a wooden house within a big park or a distinctive street within a shopping area is both can be treated as area around point or segment. Since it contains points and lines, most attributes which belongs to point location or segment within the area can be used. Meanwhile, providing the information of surrounding area will extend the isolated information of a point or a segment to a large area. Regarding to point area or segment area, available annotations types could include photos, drawings, diagrams, maps, texts, geonames, sound and videos.

SUITABLE GRAPHIC REPRESENTATION FOR ANNOTATED-SPACE-TIME-PATH
28
3.5.2. Annotation types and tagging them to STPs
As discussed, three main options available exist for tagging annotations to Space-Time-Path, i.e. coordinates, geonames and time. Adoption of tagging method relies on the own characteristics of each annotation type. Subsequently, the proper tagging method for each annotation will be illustrated successively.
� Graphic images: � Photos: Digital camera has been widely used in our daily life and it is becoming a convenient
and fast way to record the features of the places we travelled. Digital camera is time-stamped, which means that the time when the photo was taken will be registered automatically (figure 3-8). By comparing the time of the photo to the track log, we can find out where the photographer stayed at that time and mark the location by using this photo.
Figure 3-8 An example of photo with it additional information (URL 3.5)
On the other hand, along with the advent of integration of digital camera and GPS receiver, the GPS information could be added to the original information of the photos (most commonly, the EXIF metainfo inside JPGs). The GPS track log is able to link the photo to an exact position by matching time. Otherwise, photo could be converted into a geocoded photograph which is a photograph associated with a geographical location usually by geographical coordinates such as latitude, longitude and altitude, or to a street address. When geocoding the photos, must be sure the digital camera is sync with the GPS time, if not the correlation will be displaced.
� Drawings: Drawing could be a simple and direct illustration of certain place by showing the obvious features of the place, for example, the remarkable buildings, the natural scenery, or the positional relation of several landmarks of a city. Although, drawing reflects geographic information, it does not have any accurate coordinates used as connexion. The geoname record in drawing could be clues linking to locations on Space-Time-Path. Without knowing the place name, time-related information in drawings could be useful to tie to exact locations on the Space-Time-Path.

SUITABLE GRAPHIC REPRESENTATION FOR ANNOTATED-SPACE-TIME-PATH
29
� Diagrams: Diagrams always depict a particular phenomenon such as the population distribution, the economic statistic data. Usually, indirect geographic or temporal information stores in them. The suitable tagging method for diagram is geocoding which can convert the geoname involved in the diagram into precise coordinates.
� Maps: The inherent capability of maps is to give a general image of the earth’s surface: roads, rivers, houses and the nature of the vegetation (MacEachren 1995). It can be treated as typical location-based annotation. The large scale maps could show detailed information of the areas around points or segments which are not able to represent on the Space-Time-path. To link map to Space-Time-Path, the major method is to match the place recorded in the track log with the exactly same place on the map by using identical coordinates.
� Geonames: Geonames are the most direct way to convey the geographic information to readers. It is a special type annotation which is also used as a linkage to tag other annotations. When using GPS receiver to record current position and time, the geonames corresponding to each points could be written in a notepad. Some locations we may not physically stayed or some data may only simply be named as “Chile” or “The Eiffel Tower”. To mark these locations, geonames need to be transformed into coordinates. Meanwhile, there are some concerns about the geonames. The more accurate and specific the geonames provide more precise coordinates we can get. For example, a building address would return an exact point location, whereas a city name will return an area which the boundary may not be very precise. Additionally, it is noteworthy that a general geonames may have many valid solutions. Therefore, under normal conditions, most geocoding return all possible locations and an estimated ranking of accuracy. The user may choose the most accurate result by comparing all the results.
� Text: Although there are many new methods to record the events occurred at certain location and time, text document is still extensively used because it is easy to create and store. Text often contains the location-related information like the geonames or the temporal information when the event happed or how long it lasted. Therefore, using either of them to tie the text to particular point location or segment of the Space-Time-Path is allowable.
� Dynamic display: � Sound: Obviously, making a sound record is much faster than drawing a draft or writing a text.
We can directly record what we saw on the road or at the place by saying them or what we heard at that current situation. The sound data will be worthless if it cannot tell the record belongs to which location. Therefore, we need to mention the place or the time we made the record in the sound data, like “ITC building, waypoint 18” or “ITC building, 4 o’clock in afternoon, august, 20th, 2008”. Alternatively, the device which is used to record sound could be synchronized to the GPS receiver. Using the timestamps in the sound data, it could look up the GPS data to know where you were at this time, and tag the sound data to the recording location on the Space-Time-Path.

SUITABLE GRAPHIC REPRESENTATION FOR ANNOTATED-SPACE-TIME-PATH
30
� Videos: Using videos to record the track information is growing fast nowadays. It records the activities in our real lives without any modification or abstraction. The location information and time are naturally stored in the videos like the street name by shoot the street nameplate and the time when it starts and stops will show when you play this video. Another advantage of taking videos is that details like bus stops and telephone boxes will all get captured on a video. Using the location-based information or the time-based information that is caught by video, it could be attached to Space-Time-Path.

SUITABLE GRAPHIC REPRESENTATION FOR ANNOTATED-SPACE-TIME-PATH
31
3.5.3. Summary of tagging annotations
After clarified the content and the tagging method of each annotation type, it needs to be realized that how to tag annotation principally depends on the information that annotation contained. In respect that each annotation has its limitations to convey certain kind of information, the tagging option would be varied according to the information it expressed. It means even the same annotation may have different tagging method because of its different containing. Table 3-2 summarizes the combination of different annotation types and suited tagging methods.
���������� �� "���������� ����� )������
�� ;� ;� ;�
�� ;� ;� ;�
��� ;� ;� ;�
�������
��� ;� ;� ;�
�� <� ;� ;�
�� <� ;� ;�
��� <� ;� ;�
�������
��� <� ;� ;�
�� <� <� ;�
�� <� <� ;�
��� <� <� ;�
��������
��� <� <� ;�
�� ;� ;� ;�
�� ;� ;� ;�
��� ;� ;� ;�
1� ��
��� ;� ;� ;�
�� <� ;� ;�
�� <� ;� ;�
��� <� ;� ;�
)�������
��� <� ;� ;�
�� <� ;� ;�
�� <� ;� ;�
��� <� ;� ;�
��5��
��� <� ;� ;�
�� <� ;� ;�
�� <� ;� ;�
��� <� ;� ;�
�����
��� <� ;� ;�
�� <� ;� ;�
�� <� ;� ;�
��� <� ;� ;�
0������
��� <� ;� ;�
Table 3-2 Annotation tagging method according to four types of location-based information (P: point; S: segment; AP: area around point; AS: area around segment; Y: yes; N: no)

SUITABLE GRAPHIC REPRESENTATION FOR ANNOTATED-SPACE-TIME-PATH
32
3.6. Summary
The detailed knowledge of Annotated-Space-Time-Path is discussed in this chapter. Along with the development of new techniques, annotations for GPS track become available and diverse. Therefore, a rich dataset Annotated-Space-Time-Path emerges. The useable annotation types are described. Furthermore, the tagging techniques suitable for different annotations types are summaries based on their features. Accordingly, an exploratory visualization environment for Annotated-Space-Time-Paths will be conceptually designed in next chapter.

SUITABLE GRAPHIC REPRESENTATION FOR ANNOTATED-SPACE-TIME-PATH
33
4. Conceptual visualization environment for Annotated-Space-Time-Paths
4.1. Introduction
At present, the basic technique for recording individual movement is using GPS to record the change of time and positions as you move. By this means, a track log which registers the way traveled will be obtained. Although people could acquire more geographic information than ever through this way, GPS data is not able to provide necessary and detailed information due to its characteristics. Countless questions are still to be answered. Taking the advantage of modern tools, collecting annotation along the track is getting easier and the types of annotation are becoming more diverse. Either to show the detailed information of the track log made by traveler or to give a vivid impression to other people who have interesting in the concrete places in the track log, effective visualization of the combination of track log and the relating annotations, i.e. Annotated-Space-Time-Path, is apparently necessary.
In this chapter, based on the fundamental cartographic theory, selection of proper representation approach of the Annotated-Space-Time-Path will be identified firstly. Subsequently, visualization environment for Annotated-Space-Time-Path will be designed conceptually according to Shneiderman’s Visual Information-Seeking Mantra. Figure 4-1 sketches the structure and content of this chapter.
Figure 4-1 Strategy for visualization environment design
Visualization Environment Design
Map Animated map
STC
Symbols
Representation of the A-STPs
Basic visualization method
Basic cartographic theory
Interactive tools
Shneiderman’s information seeking mantra

SUITABLE GRAPHIC REPRESENTATION FOR ANNOTATED-SPACE-TIME-PATH
34
4.2. Visualization environment design tasks
The specific tagging method applied to each type of annotation and creation of Annotated-Space-Time-Path is discussed in the third chapter. To design a suitable visualization environment for Annotated-Space-Time-Path becomes to an ongoing task. The visualization environment requires capabilities for visualizing Annotated-Space-Time-Path and providing exploratory functions for users. Designing such an environment, two principal aspects should be taken into account: the characteristics of the data to be visualized and the exploratory tasks to be supported (Dykes 2005). Before deciding which visualization environment will be choose, the prior matter is to decide what visualization tasks the users may undertake and what are the objectives of these tasks.
Geovisualization aims to provide compact graphic presentations and user interface for interactively manipulating large number of items. It usually follows a three-step process: overview first, zoom and filter, and finally details-on-demand. This is termed as “Visual Information-Seeking Mantra” (Shneiderman 1996) (see section 2.3.4). The first step in this strategy allows the users to gain an overview of the data. Through the overview, the user may get a clear impression of the whole dataset and be able to identify the interesting part of the dataset. The second step keeps the overview visualization, while focusing on the interesting subset. The last step offers a further exploration on the details of the data. It produces (interactive) visual representations of diverse data to reinforce human cognition and enable the viewer to gain knowledge about the dataset.
4.3. Visualization environment for A-STP
4.3.1. Map
Regarding to map, all the information is included in one frame which is two dimensional graphic normally. While the location information is elaborated, the temporal information only can be represented in text or by other means, not as an individual dimension. As mentioned before, a classic example is Minard’s map (see figure 2-6) showing Napoleon’s 1812 campaign in Russia which uses text and diagram to express the temporal information. Theoretically, most annotations could be tagged to the Space-Time-path in map. However, several problems exist in practice.
Advantages: 1) Geographic information is conveyed clearly. 2) The changes can be portrayed if proper graphic variables used. 3) Additional information could be included.
Disadvantages: 1) Since the spatial and temporal information in ordinary map is separated, the temporal property of
Annotated-Space-Time-Path can not be represented explicitly by means of map. 2) Due to the disability of showing time, map largely limits the usable types of annotation to only
those can be tagged by geographic information. 3) To tag annotations, especially the dynamic ones, it is hard to define which part of trajectory is
related.

SUITABLE GRAPHIC REPRESENTATION FOR ANNOTATED-SPACE-TIME-PATH
35
4.3.2. Animated map
The animated map is a series of individual maps that shown in a quick succession for the purpose of depicting some type of trend or change (Peterson 1995). It is widely used in many geovisualization occasions to deal with spatio-temporal data (Peterson 1995; Blok 2005). Therefore, as one form of spatio-temporal data, Space-Time-Path is also can be displayed by it (see figure 4-2). At each display moment, the animated map shows the only positions of the moving objects at the corresponding time. Moreover, it can show the routes of the objects from the starting moment of the movement to the currently represented movement. When the objects moved to the end of the animation, the entire route is visible. The dynamic graphic variables of animation include: size, shape, position, speed, viewpoint, distance, scene, texture, pattern, shading and colour (Peterson 1995). These variables enrich the information load of the animation, such as the speed of the movement, different locations indicated by different shape or colour symbols.
Figure 4-2 An example of animation to show GPS track
However, the primary interest of the research is not only to visualize the Space-Time-Path by animated map, but to show the additional annotations under this environment. The effectiveness of animated map to display the annotations is a question to be investigated. As animated map is a dynamic process, the timing of showing annotations is an important issue to be concerned, e.g. should an annotation only be showed in the exact time-related frame or after annotations are displayed, they should disappear or remain.
Advantages: 1) Dynamic graphic variable could be used to represent changes. 2) Temporal information is included. 3) Good at performing a real case stimulated process
Disadvantages: 1) The perception of the process of Space-Time-Path is largely determined by the speed of the frame.
If it is too fast, users can not perceive the detail, reversely, the dynamic process will be not coherent.
2) If the annotations only showed at the exact time-related frame, it is hard to compare annotations at two distinct moments of the same place as the animated map can not show them at the same time.
3) If the annotations showed from the time-related frame till the end, when new annotations of the same place are tagged, the users may be confused by the order in the annotations.

SUITABLE GRAPHIC REPRESENTATION FOR ANNOTATED-SPACE-TIME-PATH
36
4) If the annotations displayed through the entire process, the temporal information of the annotations are blurred, which will lead the information contained in the annotations can not be clearly conveyed to the users.
5) The annotations collected at very near moment may overlap each other.
4.3.3. Space-Time-Cube
Based on the literature review in second chapter, it is convinced that Space-Time-Cube is capable to represent the complex trajectory of individual movement in space-time with many interacting dimensions, which include the location, time, duration and sequence (Mark and Egenhofer 1998; Andrienko N. 2003; Kraak and Husiman 2008). Unlike animated map reduces the dimensionality of data, Space-Time-Cube preserves the natural prosperities of the Space-Time-Path and reveals the relation of space and time explicitly. It provides an unambiguous overview of human’s activity. Some conditions like a short stay or visit one place several times which may lead confusions in animated map is solved properly by Space-Time-Cube. Any state of moving object is easy to specify in both temporal and spatial dimensions.
Because our research purpose is to visualize Space-Time-Path combined the annotations, “pure” form of Space-Time-Cube is insufficient to accomplish this work. However, with the aid of fast developing computer techniques, Space-Time-Cube has a great potentiality to visualize Annotated-Space-Time-Path effectively. More interactive functions and tools will be incorporated into this visualization environment to offer a handy manipulation and in-depth exploration of the spatio-temporal data.
4.4. Interactive tools
“An important embodiment of innovative geovisualization is the interaction techniques that allow the data analyst to directly interact with the visualization and dynamic change the visualization according to the exploration objectives” (Daniel A Keim 2005). After studying and comparing the existing visualization environments, there is a strong need to enhance their interactive capabilities which will enable users to access to and request the Annotated-Space-Time-Path effectively. As discussed in section 2.4, several potential useful interactive tools are described. They are highlighting, multiple linked views and querying etc. It is noteworthy that independent interactive tools are also possible to relate and combine together to promote the interactive ability.
4.5. Visualization of Annotated-Space-Time-Path in Space-Time-Cube
In the previous sections, Space-Time-Cube is selected as visualization environment for Annotated-Space-Time-Path. The succeeding attempt is to apply adaptive strategy to represent Annotated-Space-Time-Path in Space-Time-Cube. Annotated-Space-Time-path is one type of spatio-temporal data, which basic components are common with all spatio-temporal data. As discussed, Shneiderman’s Visual Information-Seeking Mantra provides a feasible solution to visualize various type of information. The information will be represented gradually according to the sequence of tasks. On the other hand, it allows user-controlled exploration to some extent.

SUITABLE GRAPHIC REPRESENTATION FOR ANNOTATED-SPACE-TIME-PATH
37
According to the previous study on Bertin’s framework and Andrienkon’s operational task typology framework (Bertin 1983; Andrienko N. 2003), establishing a representational framework is summarized as “need a clear comprehension of the nature of spatio-temporal data, a definite search level and a well defined search target”. In this research, the nature of Annotated-Space-Time-Path is inquired. The three visual tasks can be considered as different search level. The three basic components of Annotated-Space-Time-path (time, location and attribute) could be employed as “search target” in filter stage. Additionally, novel-information exploration tools, such as highlight and linked view will be largely helpful.
Implementing the visual tasks to explore the properties of Annotated-Space-Time-Path is fundamental to visualize it in Space-Time-Cube (see figure 4-3).
Figure 4-3 Fundamental of visualizing Annotated-Space-Time-Path in Space-Time-Cube
4.5.1. Overview:
As the first visualization task, the aim of overview is to give an entire impression of the data collection to users. In this research, more specifically, the overview should be able to present the entire dataset of Annotated-Space-Time-Path, display the annotations properly as well. The temporal and geographic information of the Annotated-Space-Time-Path can be represented by different dimensions in Space-Time-Cube. The amount of annotations, distribution of annotation types and relevant information needs to be reflected by the placement of annotations. Figure 4-4 exhibits several feasible approaches to represent the overview.
6"��"����
=�������.������
����������������
)�� ����
��������
��5�� )������ �������
��������
����
����
����� �� �

SUITABLE GRAPHIC REPRESENTATION FOR ANNOTATED-SPACE-TIME-PATH
38
(a) (b) (c) Figure 4-4 Three approaches to show overview of Annotated-Space-Time-path
The first approach is currently used by Google-map and some other websites which allow people to tag information (see figure 4-4 (a)). It only places the annotations at the corresponding locations directly without using any substitute. Using icons to replace the real annotations is the main purpose of the second approach (see figure 4-4 (b)). The application of icons is promoted by advanced computer graphics. A well-known example is graphical user interface (GUI) which is firstly developed by Alan Kay and Douglas Engelbart (Alan Dix 2004). It offers graphic icons and visual indicators to carry out commands. In the third approach, geometric symbols are used to substitute real annotations (see figure 4-4 (c)). Using geometric symbols to portray objects or phenomena in reality is widely applied in map design (Kraak and Ormeling 2003) and other geovisualization aspect. The significant difference among these approaches is that they are using different mode of expression to represent the annotations at the overview phase. The table 4-1 summaries the specific characteristic of the three approaches.
� $������������� ����� )�����������������
6"���� � #��� <�� <��
�����������5����
������ ����
��������
<�� #��� #���
��� ������������
���������
<�� #��� #���
$������������
���������
���������
<��������� <�� #���
������������
���������������
��������
#��� #��� #���
�������� $�� $�� $�%&��
Table 4-1 Characteristics of the three overview approaches
In the above table, a comparison of the three approaches is apparent. Overlap is likely to occur by placing real annotations on Annotated-Space-Time-path. Therefore, the precise corresponding location of the associated annotations may be misunderstood. For further operation, important features like annotation type, annotation amount and annotation distribution achieve a discernable overview

SUITABLE GRAPHIC REPRESENTATION FOR ANNOTATED-SPACE-TIME-PATH
39
stage (Craft 2005). From this perspective, because the dynamic annotations can not be presented in static in overview stage, icon and geometric symbols are both adoptable. Geographic and scientific visualization applications usually use abstract representations determined by the nature of the data being displayed (Dykes 2005). However, limitations still exist. The perception of icons and geometric symbols are indirect, auxiliary tools are required. The main criteria for selecting icon pictures is that they are should be able to convey the features of the objects. Comparatively, the selection of graphic symbols is more complicated.
Geometric symbol is a conversion of objects or phenomena in reality. It conveys different sensation by changing its graphic variables. To label different annotation type distinctively, graphic representation variables should be selected properly (Bertin 1983; Slingsby Aidan 2008). In this research, the annotation type is nominal data. According to the discussion of properties of graphic variables in section 2.3.3, there are three graphic variables might be aided to represent nominal data, which are colour, orientation and shape (see figure 2-12). As Bertin (1983) declared: “colour is an excellent selective variable. It combines easily with other variables and is eminently ‘legible’”. Therefore, colour variable is selected as the first element to design the geometric symbols for annotations. However, when the symbol is not large enough, the colour will become less distinguishable. Combined with shape variable, this problem will be solved. As the shape variable facilitates external identification (Bertin 1983), the symbol that fused both colour and shape will be able to represent different annotation distinctively. Besides the difference in qualitative properties, the difference existing in amount needs to be indicated as well. When many annotation types assemble at one place, the property of the data becomes quantitative. It contains much richer quantitative information than other places where only have one annotation type. In table 2-1, the only common variable to represent quantitative data is size. It is an ideal choice to make a distinction of the unequal quantitative data.
Therefore, using colour combined with shape and size to indicate various annotation types could be an appropriate method. The graphic annotation, text, geonames and dynamic annotation will share the same size, but not the colour and shape. The annotation included in one category will have the same shape, but in different colour. The symbol of multiple annotations will have a larger size than any other symbols since it at least contains two annotation types.
As known, Space-Time-Cube is a 3D visualization environment, while the icon is limited to 2D display; geometric symbols are more flexible to be drawn as 2D or 3D graph. However, the placement of the annotation representations in the 3D environment is undecided. It matters the orientation variable. The basic orientation types are two: oblique and orthogonal (Bertin 1983). And “Note that all the oblique signs tend to form a family in contrast to the orthogonal signs”. Annotated-Space-Time-Path rises up in Space-Time-Cube with the increasing of time, its direction is uncertain. Since, the oblique signs provide more options than orthogonal signs, the annotation symbols will be placed oblique to the associated location.
In Space-Time-Cube, the projection of the entire Annotated-Space-Time-Path could be viewed at the base map of Space-Time-Cube as a footprint. As discussed before, planar map offers a direct impression of the geographic information about the track. Hence, a 2D map is added as a linked

SUITABLE GRAPHIC REPRESENTATION FOR ANNOTATED-SPACE-TIME-PATH
40
window to show the track of Annotated-Space-Time-Path and it might aid the user in filtering the geographic information (see figure 4-5).
Figure 4-5 Overview of Annotated-Space-Time-Path
4.5.2. Zoom/Filter:
Zooming is a well-known view alteration technique that is widely used in a number of applications (Rao 1994; Anumpan 1995). The benefits and applicable methods are discussed before.
The aim of filter is to look for the interesting information. By allowing users to control the contents of the display, users can quickly focus on their interests by eliminating unwanted items (Shneiderman 1996). Based on the previous knowledge of filter, three optional methods to present the results of filter are available in the research: � not selected items disappear, while the selected ones remain the same � not selected items become grey/transparent � selected items are highlighted
From the perspective of perception of Annotated-Space-Time-Path, three major interests may direct users to focus on certain items on Annotated-Space-Time-Path: interests of space, time and attribute, which are also three essential components of spatio-temporal data. The attribute refers to the annotations. Because it is the critical component to enrich the original Space-Time-Path, the emphasis of exploration in this research is mainly about seeking annotations. Hence, every component of Annotated-Space-Time-Path can be deemed as “search target” to carry out the filter task. Moreover, filter about the combination of the components may also be executable.
1. Filtering about “A-STP”
In this research, Annotated-Space-Time-Path is a typical spatio-temporal data type. The example question about “A-STP” can be “which particular Annotated-Space-Time-Path is required?” Spatio-temporal is composed by the three elements which determine its characteristic as well (Peuquet 1994). The variation of any elements could alter the entire properties of the Annotated-Space-Time-Path. For this reason, different focus about the components will result various answers for this question. As
�����
������
������ �� ��

SUITABLE GRAPHIC REPRESENTATION FOR ANNOTATED-SPACE-TIME-PATH
41
each Annotated-Space-Time-Path is saved as different layer, uses could select the layer referring to certain Annotated-Space-Time-Path they are interested in (see figure 4-6).
Figure 4-6 Selection of Particular Annotated-Space-Time-Path by selecting layers
2. Filter about “when”
As mentioned before, at the fundamental level, space and time can be categorized into either continuous or discrete (MacEachren 1995). According to this categorization, changes in time can be detected by two different approaches: distinct moments and continuously dynamic process. Therefore, the filter tasks about temporal variable will be designed based on these two aspects.
(1) Filter about “when (time t1)”From the discrete view, time is constituted by a series of distinct time point. The possible query can be “what is the corresponding annotation and place at 5:00pm June 8th, 2008?” In Space-Time-Cube, the Z-axis represents temporal information. Any time scale, second, minute, day, month and year can be conveyed by Z-axis. The precise time information could be revealed by time label which is displayed along the Z-axis. The basic idea of the correlation of space and time on Annotated-Space-Time-path is that one time point only can correspond to one certain location. In this case, by providing accurate time information, corresponding location and the linked annotations could be found (see figure 4-7).
Figure 4-7 Filter about “when (time t1)”
(2) Filter about “when (time t1 to t2?)” From perspective of continuous, a time interval reflected as a secgment on Annotated-Space-Time-Path. The involved question could be “what the available annotations from 4:13 to 4:20 on Sep 15th, 2008?” A selection box inside the Space-Time-Cube will be capable to define the required segment. Since the operation is executed in 3D Space-Time-Cube, the performance is indeed a 3D selection and the tool is named as 3D selection box. The segment inside the 3D selection box is the required item.
�����
������
������ �� ��
T
t1
Annotated-STP 1
Annotated-STP 2

SUITABLE GRAPHIC REPRESENTATION FOR ANNOTATED-SPACE-TIME-PATH
42
Because the Z-axis is the only source of temporal information in Space-Time-Cube, the question will be answered by the aid of it eventually. The starting time and ending time is determined by the bottom and top of the 3D selection box (see figure 4-8). Its corresponding segment is the answer of where and linked annotations would answer what.
Figure 4-8 Filter about “when (time t1 to t2?)”
Table 4-2 summaries the procedure of filter task about “when”: �� ����'������()� ����'������*�����(7)�
��� ������������������ *������ &���������������+�*������
>������
'"����� �����������)�
,��� ����� ��� -���������
������������ �
������� ����� � �� &�� ���������
����
>�����
'"����� �����������)�
-���������� ������ ��� � ��
�������������
-�������������������� ���������
Table 4-2 The filter task about “when”
3. Filter about “where”
In Space-Time-Cube, the geographic information is represented by its bottom plane constituted by X and Y axis. The relating time could be answered by means of Z-axis. On the other hand, due to the clear geographic impression, 2D map might play an important role in the location-related filter task. In terms of geographic properties of Annotated-Space-Time-Path, four location types exist: point location, segment and area around point/segment (see section 3.5.1). Reflected on an Annotated-Space-Time-Path, point location is still represent as point and the other geographic places correspond to segment. Therefore, the questions about where can be classified based on the location types.
(1) Filter about “where (point location)” The point location in geographic space is represented also as point on Annotated-Space-Time-Path. The associated annotation and time will be easily discovered. The question might be asked like “when we arrived at the ITC building and what the scene over there?” Since the geographic information are both displayed in 3D Space-Time-Cube and 2D map in the proposed model, two main feasible approaches exist.
T
t1
t2
�����
������
������ �� ��

SUITABLE GRAPHIC REPRESENTATION FOR ANNOTATED-SPACE-TIME-PATH
43
This first approach is performed in Space-Time-Cube. On one hand, due to the movable base map, the point location is able to determined by the intersections of base map and Annotated-Space-Time-Path Meanwhile, the question about when will be indicated by the intersection of Z-axis and base map (see figure 4-9 (a)). On the other hand, a drop line starting from the base map and pointing to the exact location on Annotated-Space-Time-Path could be profitable. Moreover, temporal information about the location can be offered by another drop line rooting from Z-axis and also pointing to Annotated-Space-Time-Path (see figure 4-9 (b)).
(a) (b)
Figure 4-9 Filter about “where (point location)” (approach 1)
Alternatively, the task could be performed outside the Space-Time-Cube. As mentioned, a linked 2D map is used as a linked view to represent the track of Annotated-Space-Time-Path. On the track, the annotated locations will show in little square. The interesting location will be highlighted after selected, and the result of the execution will be brought back on the Annotated-Space-Time-Path (see figure 4-10).
Figure 4-10 Filter about “where (point location)” (approach 2)
(2) Filter about “where (segment/area location)” Besides point location, the other geographic place could be related to segment location or area location. For example, the likely question could be “what is time when we travelled Enschede and what are the available annotations?” This specific information seeking can be carried out in two different ways.
In the first method, defining the section will execute on Annotated-Space-Time-Path directly. As seen before, applying 3D selection box to define certain segment of Annotated-Space-Time-Path is an effective option. The required segment could be identified by making use of the projection of 3D
T T
t

SUITABLE GRAPHIC REPRESENTATION FOR ANNOTATED-SPACE-TIME-PATH
44
selection box on the base map. While the interesting area range is covered by the projection, the segment is selected (see figure 4-11). The size of the cube is adjustable according to users’ interest.
Figure 4-11 Filter about “where (line/area location)” (approach 1)
In the second method, a bound box to define the area of interest (AOI) in the 2D linked map window will be employed. Interesting location will be contained within the bound box (see figure 4-12). Unlike the 3D selection box, bound box usually works in 2D space. The part of track that located inside the bound box means selected. Meanwhile, the corresponding part on the Annotated-Space-Time-Path is selected also.
Figure 4-12 Filter about “where (line/area location)” (approach 2)

SUITABLE GRAPHIC REPRESENTATION FOR ANNOTATED-SPACE-TIME-PATH
45
Table 4-3 generalizes the filter task about “where”: � ������' �����������)� ������'�����4������������)�
"��������� ?������� ��������� .�����$����� &�����������
����+���������
?���������
��"4+� ���(���� � ���� ���� �������� ��� ���� �������� ���
+��������� ������
����
������ ������ ������ �� ��� �� ���
��� ��������� ������� ������� <�� ������� <��
>�����
������������������������
�� ������� �� ������� �� �
������
�� �
�����
�� �
�����
>����
������������
����������
������������
�����������
������
���������
������������
�����������
������
���������
������������
�����������
���������������
������������
�����������
�� ���
�����������������
�������� ���
Table 4-3 The filter task about “where”
4. Filter about “what”
what refers to various annotations contained in Annotated-Space-Time-Path. It conveys the information about geographic objects or phenomena at the special time. The typical question could be “what are all the associated photos with Annotated-Space-Time-Path 1” To solve it, an interactive legend is needed (see figure 4-13).
Figure 4-13 Interactive legend
Users are able to select and view the certain annotation type according to their preference. For example, if the demanded annotation is sound, the colour of all the other symbols representing other annotation types will change into grey. If sound is one of the multiple annotation types at some
PhotoDrawingMapDiagramTextGeonameSoundVideoMulti-annotation
�����
������
������ �����

SUITABLE GRAPHIC REPRESENTATION FOR ANNOTATED-SPACE-TIME-PATH
46
locations, the brown diamond which symbolizes possessing multiple annotations at those locations will transform as blue triangle which stands for sound annotation (see figure 4-14).
Figure 4-14 Filter about elementary “what”
5. Filter about “what” + “time interval” and “what” + “segment/area location”The essential of these two questions is to look for required annotation type under certain temporal /geographic condition. To complete the questions, it needs to combine different approaches used in the earlier research. Filter about time interval and line/area location can be completed by means of 3D selection box. Based on that method, further information about which annotation type is required can be aided by the interactive legend.
4.5.3. Details-on-demand:
Details-on-demand is the last stage of Shneiderman's Visual Information-Seeking Mantra. It stands for techniques which provide more details on the dataset only after the user requested them (Hinum 2006). Basic operation is to simply clicking on an item and review details in a separate or popup window(Dykes 2005).
Approaches to visualize different annotations types are discussed as below. � Graphic annotation As mentioned, graphic annotations includes photo, map, drawing and diagram. Normally, they will be represented as miniatures firstly. Further, they will be visualized in a pop up window outside the Space-Time-Cube (see figure 4-15). Yet, there also exists another situation that one annotation type may have many instances. To show these instances, branches could be also used. The detailed content could be conveyed and perceived by the large size window.
Figure 4-15 Visualization of graphic annotation

SUITABLE GRAPHIC REPRESENTATION FOR ANNOTATED-SPACE-TIME-PATH
47
Among these four graphic annotations, photo is the most powerful illustration of space and time. It might provide much more diverse information than other annotations. As mentioned, the orientation of photos can be preserved in the attached file by novel techniques. Thus, when the miniatures display inside the Space-Time-Cube, they will be placed according to the orientation when they were took. A clear impression of the location of the objects or phenomena will be offered. According to this principle, a number of photos around a point location or along a street could be composed together. The photos could be placed one by one based on their orientation and taken time. In this manner, a vivid virtual environment will be built and users will gain much richer than viewing single photo. Figure 4-16 gives an example of placement of the photos around a point area.
Figure 4-16 Photo matching around point area
� Text Text as a documental annotation is important to enrich the amount and species of information (MacEachren 1995). The document will be represented in a linked view which is linked to specific geometric symbol.
� Geoname Geoname is the most direct way to convey the geographic information to users. Concerning its speciality, it could be the first and the most basic information that users would like to know. Thus, from the perspective of user-friendly, it is better to place it just next to the location where the geoname is known.
� Dynamic annotation Nowadays, the available data sources for geovisualization are increasing fast. The supplementary annotations types are not limited to the traditional forms. Dynamic annotation is a good example including sound and video. The sound could be set as play automatically or manually play. The video can not be played automatically. Only when the user clicks on the corresponding symbol, the media player will show up and the video could be played by click on the play button. The user could stop or pause the video by controlling the media player.
Identify and compare are two concernful cognitive operations (Andrienko N. 2003). To view each annotation can be considered as a process of identify, which is to distinguish different items. The comparison is a further development of filter. It is used in the sense of determining relationships, in particular (but not exclusively), similarity–difference relationships (Andrienko N. 2003). For example,

SUITABLE GRAPHIC REPRESENTATION FOR ANNOTATED-SPACE-TIME-PATH
48
the photos taken at the same location at different time could be used to make a comparison. It is a way to enable users gain a deep and correlative perception of dataset.
To make a comparison, multiple linked views would be necessary. It enable the user to quickly view a scenario, compare it with pervious realization, examine properties and gain an overall impression by putting windows next to each other. It offers a context of the entire exploratory process. The information can be seen from different angles, perspectives, and alternative viewpoints. Furthermore, the user may generate additional windows that contain the visual result of the new parameters, so they can compare different ideas side-by-side (Roberts 2004). With such exploratory tool, the user is able to obtain a deeper understanding of the underlying information (Dykes 2005).
4.6. Summary
The Visual Information-Seeking Mantra (Shneiderman 1996) summarizes many visual design guidelines and provides an excellent framework for designing visualization applications. By adopting this strategy, an extended Space-Time-Cube is proposed to visualize and explore the informative data type Annotated-Space-Time-Path in this chapter. The different approaches to accomplish certain visual task are described. And the required functionality and tools are addressed as well. In the succeeding chapter, the designed prototype will be realized.
SUITABLE GRAPHIC REPRESENTATION FOR ANNOTATED-SPACE-TIME-PATH
49
5. Phototype implementation
5.1. Introduction
In the previous chapter, based on the comparison of several visualization environments and the analysis of characteristics of Annotated-Space-Time-Path, Space-Time-Cube is employed as the basic visualization environment to visualize Annotated-Space-Time-Path. According to Shneiderman’s Visual Information-Seeking Mantra, an extended Space-Time-Cube with interactive tools and functions is proposed. In this chapter, the implementation the prototype will be discussed
5.2. Preparation
5.2.1. Software and Space-Time-Cube plug-in
The software applied in this implementation is GIS software which name is uDig. It is an open source desktop application framework, built with Eclipse Rich Client (RCP) technology. It is written in Java and released under GNU Lesser General Public License. It is a desktop located and internet oriented software which provides a complete solution for GIS data access, editing and viewing.
The Space-Time-Cube plug-in has been developed two years ago by Mr. Retsios from ITC. It offers a basic framework of Space-Time-Cube and allows the GPS path to be represented as Space-Time-Path in it, as well as the associated spatio-temporal information. There are three major icons in the interface of uDig to aid the representation realized.
Open the Space-Time-Cube: this icon will show the framework of Space-Time-Cube as an independent window in uDig interface.
Reset the Space-Time-Cube: pressing this icon will reset the Space-Time-Cube back to the original position. It is very useful when user lost the Space-Time-Cube by inappropriate zooming and can not undo the work to former situation.
Load the layers into application: this icon will allow the selected layers be loaded into Space-Time-Cube.
5.2.2. Data collection
The study area Aamsveen is located at the suburban of Enschede, Provincie Overijssel, Netherlands. The data is collected in the afternoon of 11th, November, 2008. The collected data includes: � A GPS track � A set of waypoints of locations of signs � Photos of the signs and their environment

SUITABLE GRAPHIC REPRESENTATION FOR ANNOTATED-SPACE-TIME-PATH
50
� Map for certain locations � Drawing for some locations � Text for some locations � Video and sound for some locations Figure 5-1 depicts the collection of dataset:
Figure 5-1 Collection of dataset for implementation
5.2.3. Data processing
The GPS track is a GPX file which is readable by Space-Time-Cube plug-in in uDig. It can be converted into Space-Time-Path by the Space-Time-cube plug-in. The major work at the data processing stage is to tag annotations to the corresponding locations. As discussed, three approaches are available. They are using coordinates, time and geoname to tag annotations respectively. Due to lack of geonames in the collected dataset, the waypoint number is used as geoname although it is not very accurate. The tagging methods are more relied on the coordinates and time in this research. The Photos that contain GPS file can be linked to the accurate locations quickly. The annotations that do not have GPS information are tagged by matching the temporal information. The document which contains the waypoints information and the linked annotations is saved as a shp file, which is created in ArcGIS and readable to the Space-Time-Cube plug-in.
5.3. Implement the prototype to visualize Annotated-Space-Time-Path
After processing the dataset, the Annotated-Space-Time-Path will be generated. Figure 5-2 illustrates the interface for generating Annotated-Space-Time-Path. The GPX file will be loaded as Space-Time-Path and the shp file will be loaded as annotations.
Annotated-Space-Time-path

SUITABLE GRAPHIC REPRESENTATION FOR ANNOTATED-SPACE-TIME-PATH
51
Figure 5-2 Interface of generate Annotated-Space-Time-Path
As mentioned, the prototype is extended by adopting Shneiderman’s Visual Information-Seeking Mantra. The method for realizing the prototype also uses this concept as a reference. Moreover, interactive tools are integrated to facilitate the visual tasks. The entire implementation procedure will be demonstrated specifically based on overview, zoom and filter, and finally details-on-demand.
5.3.1. Overview
Figure 5-3 illustrates the overview of the implementation prototype. The Annotated-Space-Time-Path is visualized as a green pipeline within the Space-Time-Cube, where different annotations are linked to. Temporal information is provided by Z-axis, which is displayed as time label along with Z-axis. The 2D plane conveys the geographic information about the study area. The longitude and latitude are showed at the corner of the 2D plane. Moreover, a base map is added as context to provide a perceivable geographic background. The footprint on the base map is the projection of Annotated-Space-Time-Path. At the same time, a linked 2D map is used to represent the track of Annotated-Space-Time-Path in a planar view. The entire track is constituted by a series of GPS points, in which the brown dots means there are associated with annotations. The connection between annotation symbols and Space-Time-Path is directed by a short line in Space-Time-Cube. The intersection of the short line and Annotated-Space-Time-Path indicates the exact location that processes annotations. Since the annotation is replaced by abstract presentation, interactive legend plays a valuable role in the overview phase. It illustrates the properties of the annotation symbols. Without it, the sense of annotation types will not be preserved completely. Users are able to find out the meaning of the annotation symbols by comparing them with the legend.
Figure 5-3 Overview of implementation

SUITABLE GRAPHIC REPRESENTATION FOR ANNOTATED-SPACE-TIME-PATH
52
In the above example, the annotation symbols are represented in 2D shape. Apart from this, they also can be showed in 3D shape and icons (see figure 5-4).
(a) (b) Figure 5-4 Overview of Annotated-Space-Path with 3D representation (a) and icons (b)
The concrete selection of icon pictures and geometric symbols are presented in table 5-1 and 5-2: ������������
������������
����
��������
���������
��� ����
��������
����
��������
���������
��� ����
��������
����
��������
������ � ������ � ���
��������
�
�� �� !��� �
�
"����
�
#���
" ����
�����������
Table 5-1 Icon pictures applied in the research

SUITABLE GRAPHIC REPRESENTATION FOR ANNOTATED-SPACE-TIME-PATH
53
����������� ������ ������������������ "������������ �����
����
������ �
�������� �
"��� �
�
)�� ������������
�
������ � �
��5�� ���� �
)������ !��� � �
�� �� ����������������
#��� �
1�������������� " ���������������� �
Table 5-2 Combination of colour, shape and size for each annotation type
Space-Time-Cube is an interactive 3D environment, which is allowed to rotate in order to gain overviews from different angles and perspective (see figure 5-5).
Figure 5-5 Overview of implementation from different angle
5.3.2. Zoom/Filter
Zoom/filter is an important phase of entire visual tasks. As discussed, there are three possible methods to accomplish the zoom task: geometric zooming, fisheye zoom and semantic zooming. Considering the practical needs, geometric zooming is suggested in this research. The feature of this technique is that it allows the user focus on a specific area and information outside of this area is generally discarded. Figure 5-6 shows an example of zoom.

SUITABLE GRAPHIC REPRESENTATION FOR ANNOTATED-SPACE-TIME-PATH
54
Figure 5-6 Zoom in view of Annotated-Space-Time-path
Filtering is one of the basic interaction techniques often used to limit the amount of displayed information through filter criteria. Normally, the uninteresting items are eliminated, where the interesting items preserve. Thus, based on this conventional method, the way to represent the filter result is to only remain the selected items. The items that do not fit the filter criteria will not appear. Still, the implementation will follow the exploration of Annotated-Space-Time-Path in terms of analysis of its constituent.
1) Filter about “object” To select certain Annotated-Space-Time-Path, there are two possible methods. One is treating different Annotated-Space-Time-Path as distinct layers, thereby, via choose layer to make a selection of Annotated-Space-Time-Path. Or use highlighting to distinguish the selected and the not selected Annotated-Space-Time-Path (see figure 5-7).

SUITABLE GRAPHIC REPRESENTATION FOR ANNOTATED-SPACE-TIME-PATH
55
Figure 5-7 Highlight the selected Annotated-Space-Time-path
2) Filter about “when (time t1)” In Space-Time-Cube, the temporal information is conveyed by Z-axis. One time point is corresponded to exact location which represented as a point on Annotated-Space-Time-Path. To define the associated time point of particular location can be interpreted as find a point location on Annotated-Space-Time-Path. It can be conducted by moving the footprint till the interesting time is appeared along the Z-axis, then, the interesting location will identified and the corresponding annotations of this location will be determined (see figure 5-8).
Figure 5-8 Filter about “when (time t1)”
3) Filter about “where (point location)”In the last chapter, two potential methods to solve this problem exist there. The first one are operated within Space-Time-Cube and the second on is conducted on the linked 2D map individually. Although 2D map provide a clear perception of geographic information, the response of the execution on it still needs to be transited back to Space-Time-Cub, due to no available temporal information on 2D map. Therefore, the operations carried out inside the Space-Time-Cube are selected to realize.

SUITABLE GRAPHIC REPRESENTATION FOR ANNOTATED-SPACE-TIME-PATH
56
By taking advantage of interactive tools, two different approaches are designed to complete the task. In the first approach, finding specific location on Annotated-Space-Time-Path is considered similar to find corresponding time point, since they are corresponding to each other. The difference is moving base map instead of footprint in this task. By matching the base map with the interesting location, the geographic information of the location can be acknowledged. Meanwhile, the annotations belonging to this location will be identified, as well as the corresponding time (see figure 5-9). The second approach will use the drop line that is a feature in the original Space-Time-Cub plug-in. the drop line is used to link the location on the base map and the corresponding location on Annotated-Space-Time-Path. Consequently, according to the drop lines, the particular location and the associated annotations will be discovered (see figure 5-10).
Figure 5-9 Filter about “where (point location)” (approach 1)
Figure 5-10 Filter about “where (point location)” (approach 2)
4) Filter about “where (segment/area location)”As mentioned in chapter four, two methods are proposed to for filter about “where (line/area location)”. The first is 3D selection inside the Space-Time-Cub by using 3D selection box to indicate the range of interesting segment. When the 3D selection box is floating in the Space-Time-Cub, its

SUITABLE GRAPHIC REPRESENTATION FOR ANNOTATED-SPACE-TIME-PATH
57
projection will be visible on the base map to illustrate which area is included. According to the area within the rectangular projection, users can make a choice by adjusting the size and position of the 3D selection box to determine the interesting segment (see figure 5-11). Because of the complexity of programming and indirect temporal information offering by the 2D map, the second is not implemented.
5) Filter about “when (time t1to t2)” Similarly to filter about “where (line/area location)”, 3D selection will also be applied here. As seen, 3D selection box is able to fix the range of particular segment on Annotated-Space-Time-Path. By moving footprint till it intersects with the bottom and top of the 3D selection box, the associated time to the start point and end point are easy to identify. The adjustment of cube size is based on this criterion. The annotations taken in the certain period will be inside the 3D selection box and stay remained (see figure 5-11).
Figure 5-11 Filter about “where (line/area location)” (left) and “when (time t1to t2)” (right)
6) Filter about “what”The “what” component in Annotated-Space-Time-Path is mainly about annotations. The exploration of the annotations can be realized by means of interactive legend. As mentioned, interactive legend play an important role in indicating the properties of annotation symbols. Another significant role of it

SUITABLE GRAPHIC REPRESENTATION FOR ANNOTATED-SPACE-TIME-PATH
58
is to help user to select interesting annotation type. When the check box is not selected, the corresponding annotation type will not appear. If the original annotation type is multiple, after the selection, only the selected annotation symbol will be kept. By checking the boxes, the filter about “what” is accomplished (see figure 5-12).
Figure 5-12 Filter about “what”
7) Filter about “what” and “when”/”where”Apart from the pure selection of annotations, the filter about “when” and “where” can be combined together. User may like to know certain annotation type in a period or on a segment. Based on the 3D selection, filter about �when (time t1to t2)” and “where (line/area location)” is solved, the rest of the problem could be answered by combining the interactive legend. Once the interesting segment is identified by the 3D selection box, the required annotation types can be checked by the legend. The geographic information answered by the projection on base map and temporal information provide by the time label along the Z-axis (see figure 5-13).
Figure 5-13 Filter about “what” and “when”/“where”
Different tools and functions are developed to meet the requirement of each visual task. Table 5-3 summaries the component(s) and the assistant tools and functions in Space-Time-Cube used to address them.

SUITABLE GRAPHIC REPRESENTATION FOR ANNOTATED-SPACE-TIME-PATH
59
"�� ������� 0������,��������������������������
,���4�������
$%@��� A������������
&����� ��'�� (���������)��������
&������������������� %��� ��� ��������
&������*�������������� +����������%���������������)�
���@���������%��� ���
&����� ��'�������� +����������%���������������)�
(���������)��������
����� ��������,�����
����)����*�����)����+����������)���������,�����
-� ��B�$��.�� ������������������������. %���/���������
������������������������0��
Table 5-3 Summary of assistant tools and functions accord to different components
5.3.3. Details-on-demand
In the final stage of the applied Visual Information-Seeking Mantra, details-on-demand, various annotations should be represented to users. In terms of the characteristics of each annotation, the methods to visualize them are diverse. Based on the analysis in third chapter, there are four primary annotation types existing: graphic annotation, geonames, text and dynamic annotation. If there is only one annotation at the location, click on the annotation symbol, the annotations will show up instantly. However, if the location tied with several annotation types or multi-annotations in one type, click on the symbol linked to the Annotated-Space-Time-Path, more annotation symbols will appear to the scene. A short line is suggested to link the symbol and corresponding location on the Annotated-Space-Time-Path. While one location has multiple annotation types, branches will extend from the symbol of multi-annotations. The symbol of specific annotation type will show at the end of branches after clicking on the symbol of multi-annotations (see figure 5-14).
Figure 5-14 First views of Details-on-demand

SUITABLE GRAPHIC REPRESENTATION FOR ANNOTATED-SPACE-TIME-PATH
60
Multiple linked views play important role in this stage. On one hand, various types of annotation are able to display at the same time to offer diverse information. On the other hand, the comparison between the annotations is possible to conduct.
� Graphic annotation Graphic annotation includes photo, map, drawing and diagram. All of them are represented as graphs to covey different information. The visualization of them is firstly to show a miniature of them, which give a general view to users. Subsequently, users could choose their interesting items based on the fist view. The full size of graphic annotation can be obtained by clicking on the miniature in a pop up window (see figure 5-15).
Figure 5-15 Miniature and full size view of graphic annotation
Additionally, comparative views could be made among the graphic annotation. Through the filter, a series of photos about one location taken at the same time are able to provide the views from different angles. Or the photos about one location taken at different time could be used to examine the difference among them. Users are allowed to view several photos at the same time, and compare them further (figure 5-16).

SUITABLE GRAPHIC REPRESENTATION FOR ANNOTATED-SPACE-TIME-PATH
61
Figure 5-16 Comparison view of graphic annotation
� Geonames Geoname is a common annotation for Annotated-Space-Time-Path. However, because the study area in this research is fairly small, this is no specific geoname for each waypoint location. It is suggested to use waypoint number to replace the geoname in this case. For gaining a clear impression, geonames are placed next to each annotation symbol (see figure 5-17).
Figure 5-17 View of geonames
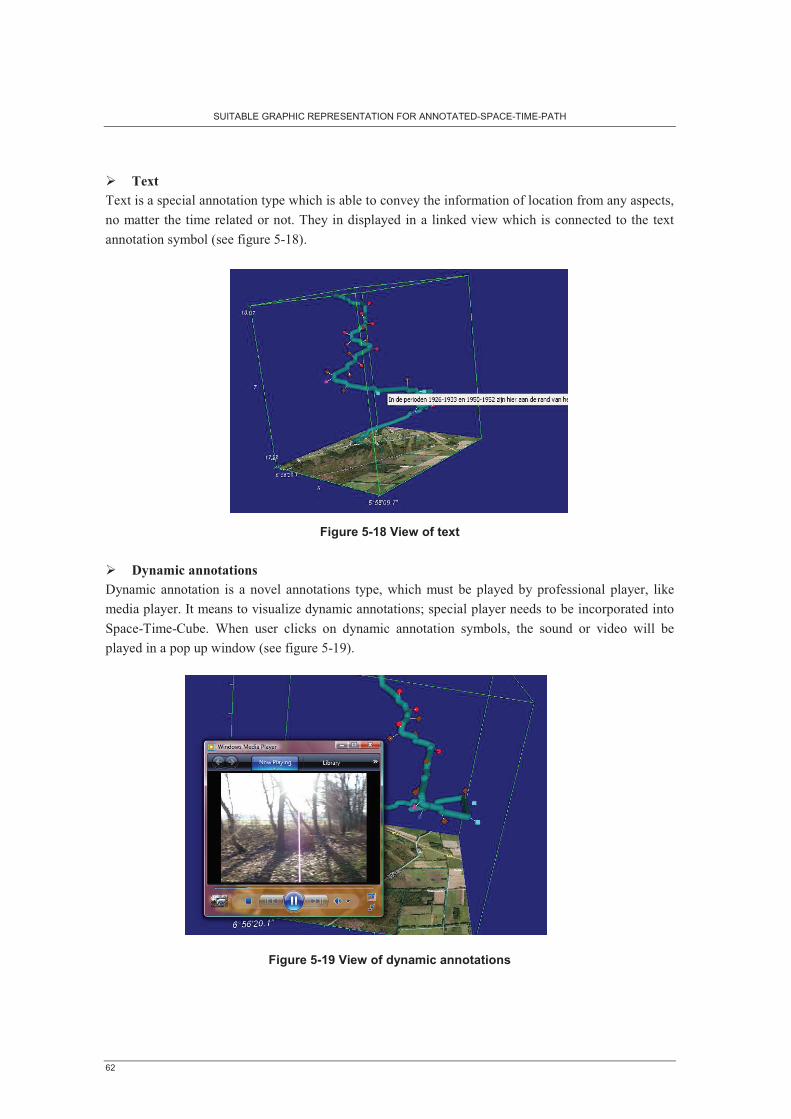
SUITABLE GRAPHIC REPRESENTATION FOR ANNOTATED-SPACE-TIME-PATH
62
� Text Text is a special annotation type which is able to convey the information of location from any aspects, no matter the time related or not. They in displayed in a linked view which is connected to the text annotation symbol (see figure 5-18).
Figure 5-18 View of text
� Dynamic annotations Dynamic annotation is a novel annotations type, which must be played by professional player, like media player. It means to visualize dynamic annotations; special player needs to be incorporated into Space-Time-Cube. When user clicks on dynamic annotation symbols, the sound or video will be played in a pop up window (see figure 5-19).
Figure 5-19 View of dynamic annotations

SUITABLE GRAPHIC REPRESENTATION FOR ANNOTATED-SPACE-TIME-PATH
63
5.3.4. Additional tools and functions
� Thickness of Space-Time-Path: users are allowed to adjust the thickness of Space-Time-Path. It can be used to depict some certain variable of Space-Time-Path.
� Opacity level of base map: base map can be made transparent when necessary. The advantage of this tool is to make footprint more clear and hide base map sometimes.
5.4. Summary
The designed prototype in previous chapter is fulfilled in chapter five. The study area is in Aamsveen, suburban of Enschede. The process of implementation is also followed the Visual Information-Seeking Mantra. The prototype supports both visualization and exploration ability for Annotated-Space-Time-Path. The usability evaluation of the prototype will be discussed in subsequent chapter.

SUITABLE GRAPHIC REPRESENTATION FOR ANNOTATED-SPACE-TIME-PATH
64

SUITABLE GRAPHIC REPRESENTATION FOR ANNOTATED-SPACE-TIME-PATH
65
6. Prototype evaluation
6.1. Introduction
One of the objectives in this research is to select or develop an evaluation method by which usability of the proposed visualization environment for Annotated-Space-Path can be measured. The process of evaluation will be divided into three stages. The first one is to select a proper evaluation method and design evaluation tasks according to time plan, feasibility and other practical situation. Subsequently, the second stage is to carry out the evaluation test based on the designed tasks and obtain feedback from the evaluation. The six participants from different professional area will be grouped as two groups to conduct the evaluation. Summarizing the feedback result is the goal of the last stage.
6.2. Usability and Usability evaluation
Designing an effective visualization environment for large geospatial datasets is a major concern in the geovisualization community. However, this work will be of little use if it is not developed within a usability testing principles (Slocum T. A. 2001). Usability of GIS products and specifically geovisualization tools has received considerable attention in recent years (Koua 2006). It is termed as ‘The extent to which a product can be used by specified users to achieve specified goals with effectiveness, efficiency and satisfaction in a specified context of use’ by the International Standardization Organisation ISO 9241-11(see URL 6.1). More specifically, it is the capability of the software product to be understood, learned, used and attractive to the user, when used under specified conditions. Usually, it is measured in three aspects (Faulkner.X 2000): � Effectiveness – the ability of a given system-a human and computer interaction system, in this
case, to accomplish user’s task correctly � Efficiency – how quickly a certain task can be accomplished in a given time period � Satisfaction – the degree of comfort felt by users when using the system or whether they prefer
one system over others
In order to investigate the three factors, an empirical usability testing is planed to assess the tool’s ability to meet user performance and satisfaction (Koua and Kraak 2004). It comprises a number of methods which are suitable for different types of systems and users and are also appropriate for different stages in a system’s design process (Dykes 2005). Usability testing can then verify that user needs and usability goals have been met and that users are able to use the system on their own with a sense of control and satisfaction (Dumas 1999; Kuniavsky 2003). Applying usability testing to geovisualization, however, may not be propitious, because of the difficulties of defining the nature of users and designing proper tasks. Choosing a usability evaluation method requires consideration of the time consuming, methodology issue, stage of product and objectives of evaluation.

SUITABLE GRAPHIC REPRESENTATION FOR ANNOTATED-SPACE-TIME-PATH
66
6.3. Evaluation methods
6.3.1. Existing Evaluation methods
Several evaluation methods can be used in usability testing to gather supplementary data. Four primary methods are briefly introduced below: � Think aloud Think aloud method is formally defined as a method which asks participators to carry out a specific problem-solving task and allows them speak out their thoughts while dealing with the problem and analyzing the results (Someren 1994). It has been widely applied in geovisualization (van Elzakker 1999; Blok 2005). It is an effective way to build up an interaction between user's mental model and the product. However, a disturbance of the cognitive process, memory errors, or participator’s feeling inclined may lead to an invalid result. Another disadvantage of this method is it is very time consuming (van Elzakker 1999).
� Heuristic evaluation Heuristic Evaluation is developed by Jakob Nielsen and belongs to expert evaluation. It aims at identify any problems associated with the design of user interface (UI). It specifically involves participators examining the interface and judging its compliance with recognized usability principles (Nielsen 1993). The participators need to inspect the interface alone. Heuristic evaluation is recommended is the early stage of product, since it is a less expensive and quick method to find major UI problem.
� Focus group Focus group (Nielsen 1993) is an informal method to be used to measure use’s needs and feelings. Basically, focus group is a form of interview which allows users to discuss new concepts and identify problems over one or two hours (Morgan 1998; Richard A Krueger 2000). But, there should be six to nine users at the same time in the same group. A moderator who is in charge of for maintaining the focus of groups on a preplanned script of specific issues and set goals for the type of information to be gathered. It is an easy, inexpensive and effective qualitative method which can be applied in any stage of the product design.
� Questionnaires From a usability perspective, questionnaires is a indirect method to gather information, since they do not study on the model itself whereas only provide users’ opinions about the model (Nielsen 1993). However, it is found that users could give more valuable answers such as what features they especially like or dislike, if they had experienced the system shortly before they answer the questionnaires. Meanwhile, a comparison of the results from the questionnaires will reinforce the reliability of evaluation results. The form of questionnaires is diverse, which can be conducted by mails e-mails or phones (Armstrong 1988).
6.3.2. Selection of evaluation methods in this research
To evaluate a product, applying different evaluation methods can provide feedback from various aspects and help to improve the product (Nielsen 1993). The selection of the evaluation method is based on time budget, the status of the product and the purpose of the evaluation, i.e. what information is required to know. As discussed above, think aloud is a time consuming method and
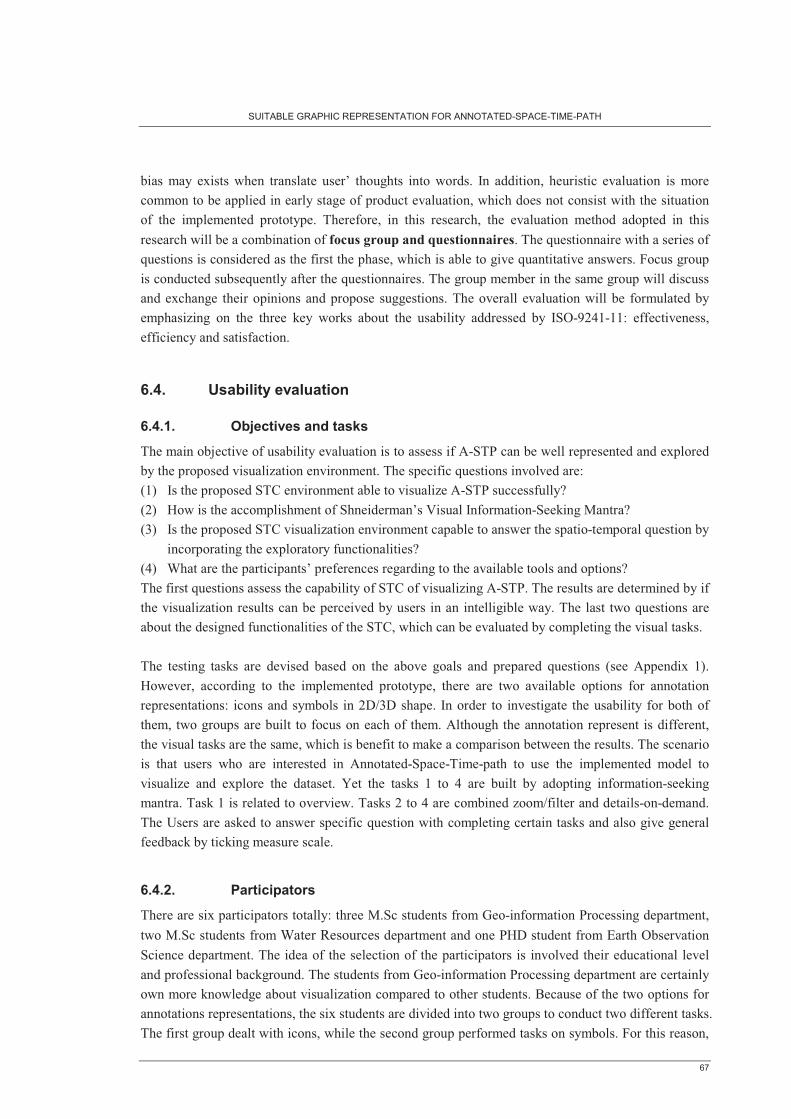
SUITABLE GRAPHIC REPRESENTATION FOR ANNOTATED-SPACE-TIME-PATH
67
bias may exists when translate user’ thoughts into words. In addition, heuristic evaluation is more common to be applied in early stage of product evaluation, which does not consist with the situation of the implemented prototype. Therefore, in this research, the evaluation method adopted in this research will be a combination of focus group and questionnaires. The questionnaire with a series of questions is considered as the first the phase, which is able to give quantitative answers. Focus group is conducted subsequently after the questionnaires. The group member in the same group will discuss and exchange their opinions and propose suggestions. The overall evaluation will be formulated by emphasizing on the three key works about the usability addressed by ISO-9241-11: effectiveness, efficiency and satisfaction.
6.4. Usability evaluation
6.4.1. Objectives and tasks
The main objective of usability evaluation is to assess if A-STP can be well represented and explored by the proposed visualization environment. The specific questions involved are: (1) Is the proposed STC environment able to visualize A-STP successfully? (2) How is the accomplishment of Shneiderman’s Visual Information-Seeking Mantra? (3) Is the proposed STC visualization environment capable to answer the spatio-temporal question by
incorporating the exploratory functionalities? (4) What are the participants’ preferences regarding to the available tools and options? The first questions assess the capability of STC of visualizing A-STP. The results are determined by if the visualization results can be perceived by users in an intelligible way. The last two questions are about the designed functionalities of the STC, which can be evaluated by completing the visual tasks.
The testing tasks are devised based on the above goals and prepared questions (see Appendix 1). However, according to the implemented prototype, there are two available options for annotation representations: icons and symbols in 2D/3D shape. In order to investigate the usability for both of them, two groups are built to focus on each of them. Although the annotation represent is different, the visual tasks are the same, which is benefit to make a comparison between the results. The scenario is that users who are interested in Annotated-Space-Time-path to use the implemented model to visualize and explore the dataset. Yet the tasks 1 to 4 are built by adopting information-seeking mantra. Task 1 is related to overview. Tasks 2 to 4 are combined zoom/filter and details-on-demand. The Users are asked to answer specific question with completing certain tasks and also give general feedback by ticking measure scale.
6.4.2. Participators
There are six participators totally: three M.Sc students from Geo-information Processing department, two M.Sc students from Water Resources department and one PHD student from Earth Observation Science department. The idea of the selection of the participators is involved their educational level and professional background. The students from Geo-information Processing department are certainly own more knowledge about visualization compared to other students. Because of the two options for annotations representations, the six students are divided into two groups to conduct two different tasks. The first group dealt with icons, while the second group performed tasks on symbols. For this reason,

SUITABLE GRAPHIC REPRESENTATION FOR ANNOTATED-SPACE-TIME-PATH
68
to minimize the effect of participators’ impact, the members in the same group are mixed from different background. Their personally information are also collected as a context (see Appendix 2).
6.4.3. Procedure
The evaluation session is executed on 10th, February, 2008 in a closed computer cluster in ITC. The session started at 3:30 pm and ended at 5:00pm. The entire duration is about one and half hour. All the participators were attended the evaluation at the same time and performed the tasks individually. The whole evaluation session contains four steps: (1) Welcome the participators and give them a 5 minute opening speech of the objective of the evaluation (2) Introduce the prototype and explain the mechanism of the prototype with a 10 minutes demonstration, at the same time, participators could familiar with the software (3) Participators execute the task on the prototype and complete a questionnaire individually. Time consuming for each task is record by them (5) Participators discuss and give suggestions
6.4.4. Results
There are two types of answers existing in the questionnaires. One is declarative expression and other is quantitative answer by assessed by a measure scale. Possible range of scores is from 1 to 5, which refer to very poor, poor, moderate, good and excellent. The analysis will embark from two different annotation representations: icons and symbols in 2D/3D.
6.4.4.1. Recognition accuracy and related time consuming
Table 6-1 summaries the accuracy of the answers and gives the average spending time for each individual task. The recognition accuracy reflects the users’ perception of the visualization and exploration results, while time spending always relates to number of questions and the complexity of the tasks. First group spent more time on task 1 (15min) than group2 (13min). Task 2, 3 and 4 all contain two parts in each task. Task 2 is testing the recognition about filter about point location and time point. The percentages of correctness of task 2 in the first group are 72% and 73%, and 75% and 80% in the second group. The accuracy in second group is still higher than the first group. In the third task, participators were asked to perform the combination of filter about line/area location and annotation type, view the selected annotations in the end. The lowest accuracy occurs in the part a (filter about line/area location) done by the first group (66%) and it took 7 min. The accuracy is also not high in second group but it took less time. Task 4 is to operate filter about time interval and annotation type, at last, view the annotations. The percentages of correctness are 70%, 73% and 73%, 78% in the two groups. It cost 7 min and 5min in part a for different group, and both 2 min in part b.

SUITABLE GRAPHIC REPRESENTATION FOR ANNOTATED-SPACE-TIME-PATH
69
)��� � ��� �� $�������
C��������
�"�����
���������
���������
�"����������
�������
�����
�����'� '�1� 2DE� '3�
(������%� ��������
���������
3�2� F�E� 2�������
(������%� ���� �
������
F�D� F+E� 3�
(������%� �����*����
���������
G�'H� 22E� F�����+�
(������%� ��
�����������
''�'�� 2DE� 1�
(������%� ���� �
����,���
'+�'1� FHE� F�
��������
�� ���������4�
�����
����1�
��������� ��� '3� F+E� ��
�����'� '�1� FDE� '+�
(������%� ��������
���������
3�2� F3E� 1�������
(������%� ���� �
������
F�D� DHE� +�
(������%� �����*����
���������
G�'H� F�E� 3�����+�
(������%� ��
�����������
''�'�� FHE� +�
(������%� ���� �
����,���
'+�'1� F+E� 3�
��������
�� ���������4�
����������(�4���
����1�
��������� ��� '3� FDE� ��
Table 6-1 Average recognition accuracy and time consuming for each task
Although two groups dealt with different annotation representations, they carried out the same tasks. Therefore, the comparison between the accuracy might suggest that which annotation representation could result a more precise answer. The accuracy is relatively low in the first group, because they do not have special legend which can provide aid for understanding the meaning of icons. The participators have to indentify the icons on their own comprehension. However, this decision is also influenced by the design and the selections of the icons and shape and colour of symbols. Through the table, it can be found that the questions about time-related question provide more accurate answers. It might be caused by time information can be directly display on screen than location information always needs to be identified by participators. In this research, the reason task 1 took the most time than other tasks might be able to summary into two points: four questions involved and gain a perception of annotations representation.
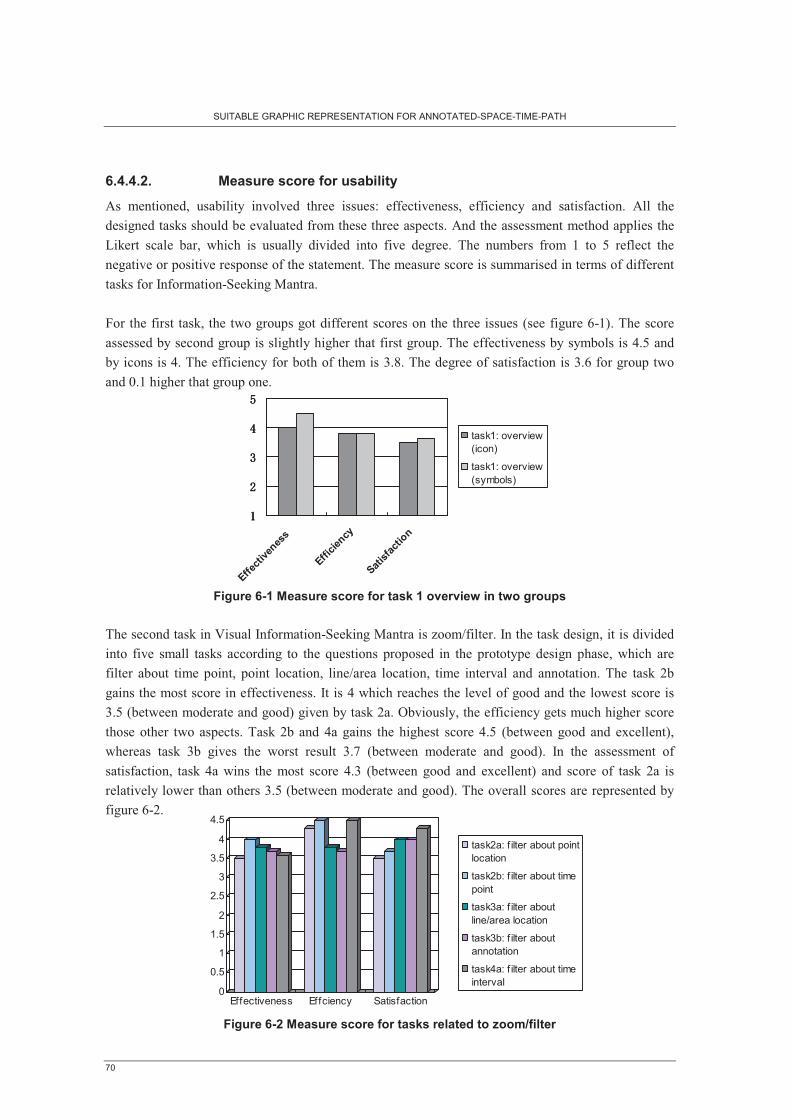
SUITABLE GRAPHIC REPRESENTATION FOR ANNOTATED-SPACE-TIME-PATH
70
6.4.4.2. Measure score for usability
As mentioned, usability involved three issues: effectiveness, efficiency and satisfaction. All the designed tasks should be evaluated from these three aspects. And the assessment method applies the Likert scale bar, which is usually divided into five degree. The numbers from 1 to 5 reflect the negative or positive response of the statement. The measure score is summarised in terms of different tasks for Information-Seeking Mantra.
For the first task, the two groups got different scores on the three issues (see figure 6-1). The score assessed by second group is slightly higher that first group. The effectiveness by symbols is 4.5 and by icons is 4. The efficiency for both of them is 3.8. The degree of satisfaction is 3.6 for group two and 0.1 higher that group one.
Figure 6-1 Measure score for task 1 overview in two groups
The second task in Visual Information-Seeking Mantra is zoom/filter. In the task design, it is dividedinto five small tasks according to the questions proposed in the prototype design phase, which are filter about time point, point location, line/area location, time interval and annotation. The task 2b gains the most score in effectiveness. It is 4 which reaches the level of good and the lowest score is 3.5 (between moderate and good) given by task 2a. Obviously, the efficiency gets much higher score those other two aspects. Task 2b and 4a gains the highest score 4.5 (between good and excellent), whereas task 3b gives the worst result 3.7 (between moderate and good). In the assessment of satisfaction, task 4a wins the most score 4.3 (between good and excellent) and score of task 2a is relatively lower than others 3.5 (between moderate and good). The overall scores are represented by figure 6-2.
Figure 6-2 Measure score for tasks related to zoom/filter
0
0.5
1
1.5
2
2.5
3
3.5
4
4.5
Effectiveness Effciency Satisfaction
task2a: f ilter about pointlocation
task2b: f ilter about timepoint
task3a: f ilter aboutline/area location
task3b: f ilter aboutannotation
task4a: f ilter about timeinterval
����
����
����
Effecti
venes
s
Efficie
ncy
Satisfa
ction
task1: overview(icon)
task1: overview(symbols)

SUITABLE GRAPHIC REPRESENTATION FOR ANNOTATED-SPACE-TIME-PATH
71
The last stage in Visual Information-Seeking Mantra is details-on-demand which corresponds to task 4b. Figure 6-3 represents the usability score for this task. The scores for task 4b are 4.3, 4 and 4.5 in the three issues individually.
Figure 6-3 Measure score for task related to details-on-demand
Besides the measure score for specific task, the assessment for the overall prototype usability is also conducted. More specifically, the evaluation of the overall prototype is based on three subjects: understandable, user-friendly and practical ability, which mainly focus on the evaluation of functions (see figure 6-4). Through the table, it can be noted that in the understandable ability gains the highest score 4.2 (between good and excellent) in efficiency. And in other two aspect, understandable ability gains 3.3 in effectiveness and lowest score in satisfaction 3.3. User-friendly is assessed as lowest score in both effectiveness and efficiency 3.3 (between moderate and good) and 3.8 (between moderate and good). Practical ability gains 3.8, 4 and 3.8 in the three usability measurement.
Figure 6-4 Overall usability measure score
6.4.4.3. Users’ preference
As mentioned, questionnaire is an effective method to provide the information about user’s preference. Therefore, taking this advantage, the available tools and functions are judged according to users’ preference. Still, the measure score is applied here to give quantitative answer (see table 6-2).
1
2
3
4
5
Effectivess Effciency Satisfaction
task4b: details-on-demand
0
0.5
1
1.5
2
2.5
3
3.5
4
4.5
Effectivenss Effciency Satisfaction
understandable
user-friendly
parctical
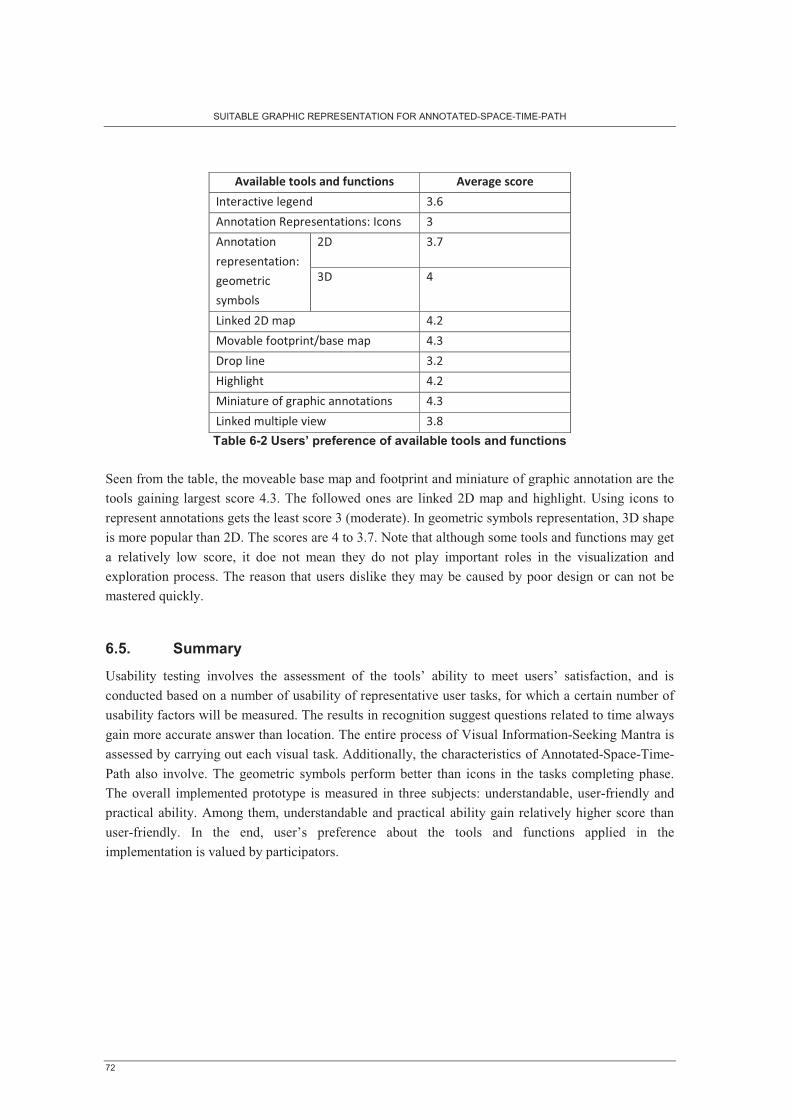
SUITABLE GRAPHIC REPRESENTATION FOR ANNOTATED-SPACE-TIME-PATH
72
�"������������������������� �"�����������
5�������,����� +02�
�����������-�����������B�5������ +�
��� +0F������������
�����������B�
�� �����
�. %����
+�� 1�
�������� ��� 10��
"�,�%��(��������*%��� ��� 10+�
���������� +0��
A���������� 10��
"����� ���(��������������������� 10+�
����� ������,���� +0D�
Table 6-2 Users’ preference of available tools and functions
Seen from the table, the moveable base map and footprint and miniature of graphic annotation are the tools gaining largest score 4.3. The followed ones are linked 2D map and highlight. Using icons to represent annotations gets the least score 3 (moderate). In geometric symbols representation, 3D shape is more popular than 2D. The scores are 4 to 3.7. Note that although some tools and functions may get a relatively low score, it doe not mean they do not play important roles in the visualization and exploration process. The reason that users dislike they may be caused by poor design or can not be mastered quickly.
6.5. Summary
Usability testing involves the assessment of the tools’ ability to meet users’ satisfaction, and is conducted based on a number of usability of representative user tasks, for which a certain number of usability factors will be measured. The results in recognition suggest questions related to time always gain more accurate answer than location. The entire process of Visual Information-Seeking Mantra is assessed by carrying out each visual task. Additionally, the characteristics of Annotated-Space-Time-Path also involve. The geometric symbols perform better than icons in the tasks completing phase. The overall implemented prototype is measured in three subjects: understandable, user-friendly and practical ability. Among them, understandable and practical ability gain relatively higher score than user-friendly. In the end, user’s preference about the tools and functions applied in the implementation is valued by participators.

SUITABLE GRAPHIC REPRESENTATION FOR ANNOTATED-SPACE-TIME-PATH
73
7. Conclusion and recommandation
The objective of research focuses on devising a suitable exploratory visualization for a new spatio-temporal data, Annotated-Space-Time-Path. The research limits the basic visualization environment as Space-Time-Cube and extends it by combining several interactive tools. Shneiderman’s Visual Information-Seeking Mantra is adopted as a main guide to visualize the Annotated-Space-Time-Path stepwise. It includes three visual tasks: overview, zoom/filter and details-on-demand. Several representation methods were attempted to propose in each visual task. During the visual task completing, the extended Space-Time-Cube was also designed to explore the characteristics of Annotated-Space-Time-Path by analyzing its components. Based on the available data collection and platform (uDig), the prototype was fulfilled. To investigate the usability of the extended Space-Time-Cube, an evaluation of the prototype was conducted. In this chapter, the research will be reviewed and further research will be recommended.
7.1. Conclusions
Based on the objectives and content of this research, the conclusions will be evolved from three key issues in the research: Annotated-Space-Time-Path, Visual Information-Seeking Mantra and extend Space-Time-Cube. The three issues indicate the data, applied methodology and implement in this research.
7.1.1. Annotated-Space-Time-Path
Peuquet (1994) defined three main components existing in spatio-temporal data: when, where and what. The when and where associate with the time and location moving object exists, while whatrefers to the attributes belonged to the moving object. Related literatures are reviewed in the second chapter as an accomplishment of first objective.
Along with the development of novel techniques, the when and where of spatial object is able be indicated by GPS data, which can be converted into a Space-Time-Path. However, the component what is missing in this type of data. User-generated information provides a great opportunity to convey the information about what by diverse forms of annotations. Therefore, the original Space-Time-Path is developed into a more informative dataset, Annotated-Space-Time-Path, which can offer more detailed information about the moving object.
The second objective associated with Annotated-Space-Time-Path is to “gain insight of the nature” of it. It involves four parts. Firstly, identify the usable annotation types (see section 3.4). Generally, the annotations are divided into graphic annotation, geonames, text, and dynamic annotation four types. Furthermore, graphic annotation includes photo, drawing, map and diagram. Sound and video are belonged to Dynamic annotation. From geographic perspective, the essential information of Space-Time-Path is around point, segment, and area around point and segment. The annotation type

SUITABLE GRAPHIC REPRESENTATION FOR ANNOTATED-SPACE-TIME-PATH
74
containing the certain information of these four geographic types is specified individually (see section 3.5.1). Subsequently, the characteristics of different annotations are analyzed (see section 3.5.2). Based on the discussion, the corresponding tagging techniques are assigned to different annotation types to tag them to Space-Time-Path (see table 3-2). The available tagging techniques are by means of coordinates, geonames and time.
The close analysis of Annotated-Space-Time-Path is conducted in the third chapter. Due to the speciality of Annotated-Space-Time-Path, an environment processing both visualization and exploration ability is required. However, another important issue should be clarified before creating the environment is to select appropriate and systematic scheme for visualization and exploration.
7.1.2. Visual Information-Seeking Mantra
Visual Information-Seeking Mantra is proposed by Shneiderman in 1996. It is a general methodology for directing visualization tasks. Its application responses the third objective “find proper strategy for visualization”. It is introduced in chapter two. The main steps involved are overview, zoom/filter and details-on-demand. It provides an elaborate plan of actions to visualize and explore data gradually which is also consistent with the cognitive procedure of human being. Combine with the characteristics of Annotated-Space-Time-Path, the aims of each step is more specific.
� Overview Overview plays an important role in the first impression. From observing the overview, the entire dataset should be able to perceive. The features of Annotated-Space-Time-Path, e.g. what are the temporal range and geographic range of the data, which part has most number of annotations, how many annotation types are included, which annotation types are the largest, must be illustrated. Therefore, how to represent the annotations and how to place them become the principal questions in the overview stage.
� Zoom/Filter The goal of zoom and filter is to focus on interesting items from users’ perspective. It can be considered as a user-controlled exploratory process. Geometric zoom is selected to be realized in the prototype. To conduct filter task, the characteristics of Annotated-Space-Time-Path are involved. More specifically, the filter will embark from the three components of spatio-temporal data. According to the reviewed literature in the second chapter, time is able to be divided into two types. Location is classified based on geographic information contained in Annotated-Space-Time-Path. Based on this idea, the filter will carry out around: (1) Filter about Annotated-Space-Time-Path (2) Filter about time point (3) Filter about time interval (4) Filter about point location (5) Filter about segment/area location (6) Filter about annotations

SUITABLE GRAPHIC REPRESENTATION FOR ANNOTATED-SPACE-TIME-PATH
75
Meanwhile, since the correlation of the components of spatio-temporal data is inseparable, the filter task can also be performed by combining components together. Therefore, another two possible filter tasks are generated. In fact, it is a combination of above filter tasks. (7) Filter about time interval + Filter about annotations (8) Filter about segment/area location + Filter about annotations
� Details-on-demand As the last task in the entire process, details-on-demand must be able to reveal the annotations to users. The elaborate information about geographic space will be provided in various annotations. The diverse annotations are required to be visualized suitably in terms of their properties. At this phase, users’ perception of the Annotated-Space-Time-Path will become complete.
Information-Seeking Mantra only provides a theoretical strategy for visualization and exploration of Annotated-Space-Time-Path, the specific implement needs to rely on a suitable designed environment.
7.1.3. Space-Time-Cube
Extracting from the literature views about existing methods for visualizing spatio-temporal data, Space-Time-Cube is deemed as a dominate method to represent spatio-temporal data, especially, the Space-Time-Path. Therefore, it is used to visualize the extend form of Space-Time-Path, Annotated-Space-Time-Path. The objectives around Space-Time-Cube are two: “design an effective prototype that allows the visual exploration tasks of an A-STP” and “test effectiveness and usability of the prototype”. The chapter four and five are the answers to the first issue and chapter six answers the other one.
Due to the request of exploration, interactive functions and tools need to be incorporated into the original Space-Time-Cube. They are discussed in chapter two (see section 2.4). Adopting the Visual Information-Seeking Mantra, the visualization and exploration of Annotated-Space-Time-Path within the extended Space-Time-Cube is conceptually designed (see chapter four). It also starts from the overview step. The question about “how to represent the annotations and how to place them” should be answered. Applying the basic knowledge of cartography, geometric symbols in 2D and 3D are devised. Meanwhile, the computer graphics provides another option; using icons to represent annotations (see section 4.5.1). The both methods aim at representing annotation clearly from qualitative and quantitative aspects. The execution of zoom/filter is aided by interactive tools and functions. Several approaches may exist at the same time to solve one problem (see section 4.5.2). It is noteworthy that a 3D selection is proposed in the approaches. It effectively solves the problems about selection of time interval or segment on Annotated-Space-Time-Path. In the stage of details-on-demand, annotations is represented in different forms by means of miniature, lined window, media player etc. Some attempts, like building Virtual Environment by linked related photos together, are also illustrated (see section 4.5.3).
The conceptual prototype is implemented on the platform uDig (see chapter five). The implementation does not contain all the designed methods, due to the time and programming reasons. Still, Visual Information-Seeking Mantra guides the procedure of the implementation. The finally version of the prototype is summarized in table 7-1.

SUITABLE GRAPHIC REPRESENTATION FOR ANNOTATED-SPACE-TIME-PATH
76
Evaluation is carried out in chapter six. It applies the both focus group and questionnaires. It emphasizes on assessing the usability of prototype from effectiveness, efficiency and satisfaction by completing designed tasks. The result of the usability evaluation is valuable for further work.
0��������� �� .����������������
6"��"����
����������� �����������
!� ����� �. %���
������
!� ����� �. %���
���+��
������
=���� !� �����6�� �
.������������������ A��������� �� ��
����� ���� ������� �� ��.������������
����������
����"���
+�� �������� %��� )�
�������
�� ��
�����
��������
?��� ���� ��������� ��.������������
��������
+��4�����
��������
+����������)�%���
����
�� ��
�
�
�
�
�
�
.������
.���������������������5�������,����� �� ��
���������������� ����������/� ����� �/� ������.����0�
Table 7-1 Summary of functions and tools in implementation
7.1.4. Summary
The whole research started from the new trend “VGI” (Goodchild 2007), under this context, diverse and rich dataset is generated. However, current tools are not able to investigate them. Thus, a research problem appears. Meanwhile, applying the knowledge of Neography (Turner 2006), the user-generated dataset can be constructed as a data type “Annotated-Space-Time-path”. By adopting Shneiderman’s Visual Information-Seeking Mantra, the visualization and exploration of the data type is conducted. Space-Time-Cube is selected as the basic visualization environment and integrated interactive tools facilitated the interactive ability.
7.2. Recommendations for further research
Based on the implemented prototype and evaluation results, the further work is listed. � In the current interactive legend, only the representative colour for each annotation type is
displayed. Shapes as a selective graphic variables, should also be represented. � A further study on icons and criteria of selecting icon pictures are succeeding work. In the
usability evaluation, geometric symbols gain higher score than icons, especially the 3D symbols. However, this may caused by several reasons, e.g. the selection of icon pictures, the setting of icons, and lack of legend for icon. All these reasons may lead to ambiguous understanding of icons. Thus,

SUITABLE GRAPHIC REPRESENTATION FOR ANNOTATED-SPACE-TIME-PATH
77
� Selection of graphic variables should be pay learned further. The comparison of 2D and 3D geometric symbols in this research is not complete. To find out which one is more suitable, more scientific proof need to be found. And the influence of the selection of graphic variables also needs to be tested.
� In the realized prototype, some conceptually designed functions are not implemented. The linked 2D map does not involve in the selection work actually. Although the drop line is used to select point location as an indicator, the interaction of it still needs to be improved. The Virtual Environment constituted by a series of photos will be realized hopefully.
� Different user group is assigned to accomplish different tasks and make a comparison between the results. The knowledge level and background of the group members will affect the evaluation results. Hence, the comparison between two groups can not be fully accepted. And more tasks, questions and participators should be taken into account.
� From the cartography perspective, the visualization and exploration of Annotated-Space-Time-Path could attempt to be done in 2D space and more visualization methods should be considered. The basic idea in this research is limited on using an extended Space-Time-Cube. However, compared to Space-Time-Cube, maps have a wider application in reality. Thus, the subsequent work would be a study on map and find out how to visualization Annotated-Space-Time-Path on it.

SUITABLE GRAPHIC REPRESENTATION FOR ANNOTATED-SPACE-TIME-PATH
78
Bibliography
Alan Dix, J. F., Gregory D. Abowd, Russell Beale (2004). Human-computer Interaction, Pearson Education. Andrienko N., A. G., Gatalsky, P. (2003). "Exploratory spatio - temporal visualization : an analytical review." In: Journal of Visual Languages and Computing, 14(2003), pp. 503-541. Anumpan, V., Dar,S., Leibfried, T., and Petajan, E. (1995). Dataspace: {3D} visualization of large databases. Proceedings International Symposium on Information Visualization, Atlanta, GA. Armstrong, J. S., and Lusk, E.J. (1988). "Return postage in mail surveys." public opinion quarterly 51: 233-248. Bertin, J. (1983). Semiology of graphics : diagrams, networks, maps. Madison, The University of Wisconsin Press. Blok, C. A. (2000). Monitoring change : characteristics of dynamic geo - spatial phenomena for visual exploration. In: Spatial Cognition II : an interdisciplinary approach to representing and processing spatial knowledge / Ch. Freksa ... [et al.] (eds.) Berlin : Springer verlag, 2000. ISBN 3540646035 (Lecture Notes in Artificial Intelligence : 1404) pp. 16-30. Blok, C. A., Ormeling, F. J. promotor, Kraak, M. J. promotor (2005). Dynamic visualization variables in animation to support monitoring of spatial phenomena. ITC Dissertation;119. Utrecht Enschede, Universiteit Utrecht ITC: 188. Brunsdon, C. (2007). Path Estimation from GPS Tracks, Department of Geography, University of Leicester. Craft, B. a. C., P. (2005). "Beyond guidelines: what can we learn from the visual information seeking mantra?" Information Visualisation 6-8 July 2005: 110-118. D.Spinellis, D. (2003) Position-Annotated Photographs: A Geotemporal Web. Pervasive ComputeringVolume, 72-79 DOI: Daniel A Keim, C. P., Mike Sips (2005). Information Visualization: Scopes, Techniques and Opportunitities for Geovisualization Exploring geovisualization. J. Dykes, A. M. MacEachren and M. J. Kraak. Amsterdam Elsevier. Dumas, J. S., and Redish, J.C. (1999). A practical Guide to Usability Testing Intellect Books, Exeter: 404. Dykes, J., MacEachren, A. M., Kraak, M. J. (2005). Exploring geovisualization. Amsterdam Elsevier. Dykes, J. A. and D. M. Mountain (2003). "Seeking structure in records of spatio-temporal behaviour: visualization issues, efforts and applications." Computational Statistics & Data Analysis 43(4): 581-603. Eccles, R., Kapler, Thomas, Harper, Robert, Wright, William (2008). "Stories in GeoTime." Inf Visualization 7(1): 3-17.

SUITABLE GRAPHIC REPRESENTATION FOR ANNOTATED-SPACE-TIME-PATH
79
Faulkner.X (2000). Usability Engineering. New York, Palgrave. Gartner, G., Bennett, David A., Morita, Takashi (2007). "Towards Ubiquitous Cartography." Cartography and Geographic Information Science 34: 247-257. Gennady Andrienko & Natalia Andrienko, J. D., Mark Gahegan, Jonathan C.Roberts & Peter Rodgers, Martin theus (2005). Creating Instruments for Ideation: Software Approaches to Geovisualization. Exploring Geovisualization. D. Jason, M. M. Alan and M. J. Kraak. Amsterdam Elsevier. Golledge, R. G. and R. J. Stimson (1997). Spatial behaviour : a geographic perspective. New York etc., The Guildford Press. Goodchild, M. (2007). "Citizens as sensors: the world of volunteered geography." GeoJournal 69(4): 211-221. Hägerstrand, T. (1970). "What about people in regional science?" Papers in Regional Science 24(1): 7-24. Hägerstrand, T. (1989). "Reflections on “what about people in regional science?”" Papers in Regional Science 66(1): 1-6. Harrower, M. and S. Fabrikant (2008). The role of map animation for geographic visualization. Geographic Visualization: Concepts, Tools and Applications. M. a. T. M. Dogde. Chichester, Wiley & Sons. Hearnshaw, H. M. e. and D. J. e. Unwin (1994). Visualization in geographical information systems. Chichester etc., Wiley & Sons. Hinum, K. (2006). An Interactive Information Visualization for High Dimensional. Vienna Vienna University of Technology. PHD. Huisman, O. and P. Forer (1998). "Computational agents and urban life spaces : a preliminary realisation of the time - geography of student lifestyles." In: Proceedings of the Third International Conference on GeoComputation, 17-19 September 1998, Bristol, U.K. 18 p. Ian G. Cullen, V. G. (1975). Urban Networks: The Structure of Activity Patterns, Pergamon Press. Kapler, T. and W. Wright (2005). "GeoTime information visualization." Inf Visualization 4(2): 136-146. Koua, E. L. and M. J. Kraak (2004). "usability framework for the design and evaluation of an exploratory geovisualization environment." In: IV 2004 : Proceedings of the 8th international conference on information visualization, London 14-16 July, 2004. IEEE Computer Society Press, 2004. ISBN 0-7695-2177-0 pp. 153-158. Koua, E. L., Maceachren, A., Kraak, M. J. (2006). "Evaluating the usability of visualization methods in an exploratory geovisualization environment." International Journal of Geographical Information Science 20(4): 425-448. Koussoulakou, A. and M. J. Kraak (1992). "Spatio-temporal maps and cartographic communication." The cartographic journal 29: 101-108.

SUITABLE GRAPHIC REPRESENTATION FOR ANNOTATED-SPACE-TIME-PATH
80
Kraak, M.-J. (2003). "Geovisualization illustrated." ISPRS Journal of Photogrammetry and Remote Sensing 57(5-6): 390-399. Kraak, M.-J. and O. Husiman (2008). Beyond exploratory visualization of space-time paths, International Institute for Geoinformation Science and Earth Observation (ITC): 28. Kraak, M. J. (2003). Geovisualization and time : new opportunities for the space - time cube. Kraak, M. J. (2003). "space - time cube revisited from a geovisualization perspective." In: ICC 2003 : Proceedings of the 21st international cartographic conference : cartographic renaissance, 10-16 August 2003, Durban, South Africa. International Cartographic Association (ICA), 2003. pp. 1988-1996. Kraak, M. J. (2005). "Timelines, temporal resolution, temporal zoom and time geography." In: ICC 2005 : Proceedings of the 22nd international cartographic conference : mapping approaches into a changing world, 9-16 July 2005, A Coruña, Spain. International Cartographic Association (ICA), 2005. ISBN: 0-958-46093-0. 7 p. Kraak, M. J. and A. Koussoulakou (2004). "visualization environment for the space - time cube." In: SDH 2004 : Proceedings of the 11th international symposium on spatial data handling : advances in spatial data handling II. : 23-25 August 2004, University of Leichester. / ed. by P.F. Fisher. - Berlin etc.: Springer, 2004. pp. 189-200. Kraak, M. J. and F. J. Ormeling (2003). Cartography : visualization of geospatial data. Harlow, Addison Wesley Longman. Kuniavsky, M. (2003). Observing the User Experience: A Practitioner's Guide to User Research. San Francisco, Morgan Kaufmann. Kwan, M.-P. and J. Lee (2003). Geovisualization of Human Activity Patterns Using 3D GIS: A Time-Geographic Approach. Spatially Integrated Social Science: Examples in Best Practice. M. F. Goodchile and D. G. Janelle. New York, Oxford University Press. Lawton, R. (1983). "Space, place and time." In: Geography : Journal of the Geographical Association, 68(1983)3, pp. 193-207. Lenntorp, B. (1976). Paths in Space-Time Environment: A Time Geographic Study of the Movement Possibilities of Individuals, Department of Geography, The Royal University of Lund. Lenntorp, B. (1999). "Time-geography – at the end of its beginning." GeoJournal 48(3): 155-158. MacEachren, A. M. (1995). How maps work : representation, visualization and design. New York etc., The Guildford Press. MacEachren, A. M. and M. J. Kraak (2001). "Research challenges in geovisualization." Cartography and geographic information science 28(1). Mark, D. M. and M. J. Egenhofer, Eds. (1998). Geospatial Lifelines. Integrating Spatial and Temporal Database, Geschäftsstelle Schloss Dagstuhl, Univ. des Saarlandes. Miller, H. J. (1991). "Modelling accessibility using space-time prism concepts within geographical information systems." International Journal of Geographical Information Science 5(3): 287-301.

SUITABLE GRAPHIC REPRESENTATION FOR ANNOTATED-SPACE-TIME-PATH
81
Miller, H. J. (1999). "Measuring space-time accessibility benefits within transportation networks: Basic theory and computational procedures." Geographical Analysis 31(2): 187-212. Miller, H. J. (2002). What about people in geographic information science? ACTOR2002 (Action-oriented approaches in geographicinformation science). Lucerne Inn, Holden, Maine, USA. Modjeska, D. (1997). Navigation in Electronic Worlds: A Research Review, Computer Systems Research Group, University of Toronto. Möller, M. T. a. T. (2004). "Human Factors in Visualization Research." Transactions on Visualization and Computer Graphics 10: 72-84. Moore, A. B., P. A. Whigham, et al. (2003). Sport and Time Geography: A good match? Proceedings of 15th Annual Colloquium of the Spatial Information Research Centre. Dunedin, New Zealand: University of Otago. Morgan, D. L. (1998). Planning focus groups. Thousand Oaks etc., Sage. Nielsen, J. (1993). Usability engineering. Amsterdam, Morgan Kaufmann. Peterson, M. P. (1995). Interactive and animated cartography. Englewood Cliffs, Prentice Hall. Peuquet, D. J. (1994). "It's about time : a conceptual framework for the representation of temporal dynamics in geographic information systems." In: Annals of the Association of American Geographers, 84(1994)3, pp. 441-461. Peuquet, D. J. (2002). Representations of space and time. New York, The Guilford Press. Plaisant, C. (2005). Information Visualization and the Challenge of Universal Usability. Exploring Geovisualization. A. M. M. J. Dykes, M.-J. Kraak, Elsevier. Pred, A. (1977). "The Choreography of Existence: Comments on Hagerstrand's Time-Geography and Its Usefulness." Economic Geography 53(2): 207-221. Rao, R. a. C., S.K. (1994). The table lens: merging graphic and symbolic representaion in an interactive focus + context visualization for tabular information. Proceddings Human Factors in Computing Systems CHI 94 Conference, Bpston, MA. New York. Richard A Krueger, M. A. C. (2000). Focus Groups: A Practical Guide for Applied Research, Sage Publications (CA). Roberts, J. C. (2004). Exploration through Multiple Linked Views. Canterbury, Computing Laboratory, University of Kent. Robinson, A. C. (2006). Hightlighting Techniques to Support Geovisualization. ICA Commission on Visualization and Virtual Environments Workshop Sauer, C. O. (1974). "The Fourth Dimension of Geography." Annals of the Association of American Geographers 64(2): 189-192.

SUITABLE GRAPHIC REPRESENTATION FOR ANNOTATED-SPACE-TIME-PATH
82
Shneiderman, B. (1996). "The eyes have it: a task by data type taxonomy for information visualizations." Processings of the 1996 IEEE Symposium on Visual Languages (IEEE Computer Society Press). Shneiderman, H. H. a. B. (2004). "Dynamic query tools for time series data sets: Timebox widgets for interactive exploration." Information Visualization 3: 1-18. Slingsby Aidan, D. J., Wood Jo (2008). "Using treemaps for variable selection in spatio-temporal visualisation." Inf Visualization 7(3-4): 210-224. Slocum T. A., B. C. A., Bin Jiang, Koussoulakou A., Montello D. R., Fuhrmann S., Hedley N. R. (2001). "Cognitive and usability issues in geovisualization." Cartography and geographic information science 28(1). Smyth, S. (2000). Mining mobile trajectories. Someren, M. W. v. B., Y.F. and Sandberg, J.A.C (1994). The think aloud method: a practical guide to modelling cognitive processes. London, Academic Press. Stephens, T. (2003). A Passion for Metadata – An Interview with Todd Stephens of BellSouth. Wilshire Conferences. Turner, A. (2006). Introduction to neography. Sebastopol, O'Reilly. van Elzakker, C. P. J. M. (1999). "Thinking aloud about exploratory cartography." In: ICC 1999 : Proceedings of the 19th International cartographic conference and 11th general assembly : touch the past, visualize the future : August 14-21, 1999 Ottawa. International Cartographic Association (ICA), 1999. CD-ROM. 11 p.
URLs
3.1 www.Wikimapia.org3.2 http://maps.google.com/3.3 www.openstreetmap.org3.4 http://www.qcontinuum.org/gpstrack/3.5 http://wiki.openstreetmap.org/index.php/Mapping_techniques6.1 http://www.usabilitynet.org/management/b_what.htm

SUITABLE GRAPHIC REPRESENTATION FOR ANNOTATED-SPACE-TIME-PATH
83
Appendices
Appendix 1: Usability evaluation tasks and questionnaire
The entire design methodology is adopted Shneiderman’s Information-Seeking Mantra. It includes three phase: overview, zoom/filter and details-on-demand. The usability evaluation is also developed based on this concept.
Overview: Taks1: Open UGID, load layer mymap.shp, GPS file and background.jpg. Produce an A-STP and gain an overview of it. Note that the representation of annotations is symbols in 2D/3D or icons. Observe the A-STP, if necessary, by clicking on mouse, rotate the STC to change view angle. 1. How many waypoints are existing? 2. Which annotation symbol is the most? 3. Look up the legend, which annotation is corresponded to this symbol? 4. How many annotation types can be currently observed from the overview? Please rank the overview representation of A-STP in terms of effectiveness, efficiency and satisfaction. Effectiveness
1 2 3 4 5 Efficiency
1 2 3 4 5 Satisfaction
1 2 3 4 5
Zoom/Filter Taks2: Part a: filter on point location Use base map or drop line to find waypoint 20 on A-STP and zoom into it, and click on the annotation symbol. 5. What is the annotation symbol existing at this location? 6. What is the relating time of this location?
Part b: filter on time point Reset the STC to back to the overview of A-STP. Drag the footprint to time 17:48, zoom into the corresponding location on A-STP and click on the annotation symbol. 7. What is the number of the waypoint of the corresponding location? 8. What is the annotation symbol existing at this location?
Please rank the zooming of the A-STP in terms of effectiveness, efficiency and satisfaction based on the operation and observation of task2.

SUITABLE GRAPHIC REPRESENTATION FOR ANNOTATED-SPACE-TIME-PATH
84
Effectiveness 1 2 3 4 5
Efficiency 1 2 3 4 5
Satisfaction 1 2 3 4 5
Zoom/Filter + details-on-demand Taks3: Part a: filter on line/area location Use 3D selection box to find out the area including waypoint 8 to 14 on A-STP. 9. What is the corresponding time interval to this area? 10. Compare to the legend and the linked annotation symbol in this area, what annotations are
available?
Part b: filter on annotations Maintain the 3D selection box of the area. Select annotation type: video in interactive legend. View the videos 11. Describe what happened to the annotation symbols inside 3D selection box.
12. How many annotation symbol left after the selection?
Please rank the filtering of the A-STP in terms of effectiveness, efficiency and satisfaction based on the operation and observation of above task. Effectiveness
1 2 3 4 5 Efficiency
1 2 3 4 5 Satisfaction
1 2 3 4 5
Please rank the visualization of annotations in terms of effectiveness, efficiency and satisfaction based on the operation and observation of above task. Effectiveness
1 2 3 4 5 Efficiency
1 2 3 4 5 Satisfaction
1 2 3 4 5

SUITABLE GRAPHIC REPRESENTATION FOR ANNOTATED-SPACE-TIME-PATH
85
Task4: Part a: filter on time interval Use 3D selection box to find out the way points between 17:53 to 18:00 on A-STP. And move the base map to observe which the corresponding locations on the map are. 13. List the number of these way points 14. Compare to the legend and the linked annotation symbol to these locations, what annotations are
available?
Part b: details-on-demand Keep the selected time interval, pick out annotation type: photo in the interactive legend. Click on the photo annotation symbol and view the photos. 15. Describe what the difference is between the photo symbol and video symbol after clicking on
them.
Please rank the filtering of the A-STP in terms of effectiveness, efficiency and satisfaction based on the operation and observation of above task. Effectiveness
1 2 3 4 5 Efficiency
1 2 3 4 5 Satisfaction
1 2 3 4 5
Please rank the visualization of annotation in terms of effectiveness, efficiency and satisfaction based on the operation and observation of above task. Effectiveness
1 2 3 4 5 Efficiency
1 2 3 4 5 Satisfaction
1 2 3 4 5
time spending Task 1
Part a Task 2 Part b Part a Task 3 Part b Part a Task 4 Part b

SUITABLE GRAPHIC REPRESENTATION FOR ANNOTATED-SPACE-TIME-PATH
86
Overall evaluation: According to the accomplishment of task 1 to 4, rank the overall impression of the proposed STC environment functions for visualizing A-STP in terms of effectiveness, efficiency and satisfaction. Effectiveness
� Understandable � User-friendly � Practical
Efficiency � Understandable � User-friendly � Practical
Satisfaction � Understandable � User-friendly � Practical
Please rank the available tools and options according to your preference. (1 to 5 refers to preference from low to high)
Interactive legend 1 2 3 4 5 Annotation Representations: Icons 1 2 3 4 5
2D 1 2 3 4 5 Annotation representation: geometric symbols
3D 1 2 3 4 5
Linked 2D map 1 2 3 4 5 Movable footprint/base map 1 2 3 4 5 Drop line 1 2 3 4 5 Highlight 1 2 3 4 5 Miniature of graphic annotations 1 2 3 4 5 Linked multiple views 1 2 3 4 5
Please add additional comments here about the prototype. (e.g. the individual visual task, the interactive tools, suggestions etc.)
1 2 3 4 5 1 2 3 4 5 1 2 3 4 5
1 2 3 4 5 1 2 3 4 5 1 2 3 4 5
1 2 3 4 5 1 2 3 4 5 1 2 3 4 5

SUITABLE GRAPHIC REPRESENTATION FOR ANNOTATED-SPACE-TIME-PATH
87
Appendix 2: Personal information collection
Participator’s information survey: 1. Your education level is: � PHD � MSc � Bachelor
2. Your professional background is:
3. Have you contacted geo-visualization before and if yes, how much do you know about it? � Low � Moderate � High � Very High
4. Experience with UDIG � Low � Moderate � High � Very high
5. Could you name one website which provides annotation visualization?