Suitability of new sources of olive oil intended to be...
31
EUR 23395 EN - 2008 Suitability of new sources of olive oil intended to be used as simulant D in migration testing C. Simoneau, G. Beldì, F. Franchini, P. Hannaert
Transcript of Suitability of new sources of olive oil intended to be...

EUR 23395 EN - 2008
Suitability of new sources of olive oil intended to be used as
simulant D in migration testing
C. Simoneau, G. Beldì, F. Franchini, P. Hannaert

2
The mission of the IHCP is to provide scientific support to the development and implementation of EU policies related to health and consumer protection. The IHCP carries out research to improve the understanding of potential health risks posed by chemical, physical and biological agents from various sources to which consumers are exposed.
European Commission Joint Research Centre Institute for Health and Consumer Protection Contact information Address: DG JRC, IHCP TP 260, I-21020 Ispra E-mail: [email protected] Tel.: 39.0332.785889 Fax: 39.0332.785707 http://ihcp.jrc.ec.europa.eu/ http://www.jrc.ec.europa.eu/ Legal Notice Neither the European Commission nor any person acting on behalf of the Commission is responsible for the use which might be made of this publication.
Europe Direct is a service to help you find answers to your questions about the European Union
Freephone number (*):
00 800 6 7 8 9 10 11
(*) Certain mobile telephone operators do not allow access to 00 800 numbers or these calls may be billed.
A great deal of additional information on the European Union is available on the Internet. It can be accessed through the Europa server http://europa.eu/ JRC 45928 EUR 23395 EN ISBN 978-92-79-09289-3 ISSN 1018-5593 DOI 10.2788/78957 Luxembourg: Office for Official Publications of the European Communities © European Communities, 2008 Reproduction is authorised provided the source is acknowledged Printed in Italy

3
Table of Contents
1 SPECIFICATIONS..................................................................................................................... 6
2 DEFINITIONS AND EXPERIMENTAL APPROACHES..................................................... 6 2.1 IODINE VALUE...................................................................................................................... 6 2.2 ACID VALUE ........................................................................................................................ 6 2.3 PEROXIDE VALUE................................................................................................................. 7 2.4 REFRACTIVE INDEX.............................................................................................................. 7 2.5 GAS CHROMATOGRAPHIC ANALYSES.................................................................................... 7
3 SCREENING OF SOURCES OF OLIVE OILS...................................................................... 8 3.1 SAMPLES TESTED.................................................................................................................. 8 3.2 RESULTS OF SPECIFICATION TESTS ....................................................................................... 8
3.2.1 Iodine value .................................................................................................................... 8 3.2.2 Acidity ............................................................................................................................. 9 3.2.3 Peroxide value ................................................................................................................ 9 3.2.4 Refractive index ............................................................................................................ 10 3.2.5 Gas chromatographic analyses..................................................................................... 10
4 CHOICE OF OIL...................................................................................................................... 11
5 HOMOGENEITY ASSESSMENT.......................................................................................... 12 5.1 STRATEGY .......................................................................................................................... 12 5.2 EXPERIMENTAL .................................................................................................................. 13
5.2.1 Sampling ....................................................................................................................... 13 5.2.2 Data treatment .............................................................................................................. 14
5.3 CRL-FCM HOMOGENEITY RESULTS................................................................................... 17 5.3.1 Determination of the acid value A.V. and the acidity ................................................... 17 5.3.2 Determination of the iodine value I.V........................................................................... 18 5.3.3 Determination of the peroxide value P.V...................................................................... 20 5.3.4 Determination of refractive index R.I. .......................................................................... 22
5.4 SSOG HOMOGENEITY RESULTS .......................................................................................... 23 5.4.1 Determination of the acid value A.V. and the acidity ................................................... 23 5.4.2 Determination of the iodine value I.V........................................................................... 25 5.4.3 Determination of the peroxide value P.V...................................................................... 27
6 STABILITY CONTROL.......................................................................................................... 28
7 CONCLUSIONS ....................................................................................................................... 29
8 REFERENCES.......................................................................................................................... 29

4

5
1 EXECUTIVE SUMMARY
Regulation EC/882/2004 on Feed and Food Controls establishes the JRC as Community Reference Laboratory for Food Contact Materials (CRL-FCM). The Regulation requires a supporting network of European National Reference Laboratories (NRLs). This Regulation supports the harmonised enforcement of food legislation including food contact materials and the creation of a reference laboratory system operated by the JRC to systematically exchange and assess information on emerging issues related to chemicals released from food contact materials.
The Council Directive 85/572/EEC of 19 December 1985 lays down the list of simulants for overall and specific migration testing, to be used for testing migration of constituents of plastic materials and articles intended to come into contact with foodstuff.
This Directive lists the appropriate simulants to be used in migration tests with a particular foodstuff or group of foodstuffs. Within simulants, simulant D is rectified olive oil that has to satisfy characteristics such as acidity, peroxide index, iodine index, refractive index.
Until 2005 rectified olive oil with documented appropriate technical specifications was commercially available from the company Pira International (UK). However commercial production stopped, and other potential sources available (Korea Japan, Sigma) did not necessarily provide specifications documented specifically for use as “simulant D”.
Since the oil specifications set in the EU legislation are crucial, both for compliance testing but also in the frame of an ISO accreditation for migration in oil, NRLs suggested the CRL-FCM to investigate specifications potential sources of olive oil to develop a source of simulant D for their purposes.
The purpose of this study was to:
• Find potential suppliers for rectified olive oil
• Evaluate characteristics of oil on batch samples
• Select one supplier to purchase a lot of adequate defined specifications
• Establish the adequacy and homogeneity of the oil of a 500L lot
• Confirm the evaluation by independent analyses and certification by a specialised accredited institution for those specifications.
The results demonstrated the feasibility of at least one source of olive oil, which was then provided to the National Reference Laboratories as a deliverable of the workprogramme 2007.

6
2 SPECIFICATIONS
Directive 85/572/EEC indicates for many types of foods the food simulant to be used in migration testing to check compliance. For Simulant D the requirements are:
Parameter Reference Values (Directive 85/572/EEC)
Acidity <0.5% expressed as % oleic acid Peroxide Index <10 milli-equivalents O2/kg
Iodine Index 80-88 g/100g Refractive Index* 1.4665 - 1.4679 nD
Table 1: Simulant D specifications
3 DEFINITIONS AND EXPERIMENTAL APPROACHES
Olive oils are usually characterised by several parameters, among such parameters, iodine value, acid value, peroxide value and refractive index were determined because they are the parameters specified into the above mentioned directive.
3.1 Iodine Value
The Iodine Value (I.V.) of a fat is the number of grams of halogen absorbed by 100 g of fat and expressed as the weight of iodine.
The Wijs method [4] is recommended for industrial and commercial analyses. It foresees an addition to the test portion of an iodine monochloride solution in an acetic and carbon tetrachloride mixture; the determination of the excess halogen is made by addition of potassium iodide aqueous solution and titration of the liberated iodine with a standardised sodium thiosulphate solution.
3.2 Acid Value
The Acid Value (A.V.) of a fat is the number of mg of potassium hydroxide to neutralise the free fatty acids in 1 g of fat.
The acidity is a conventional expression of the percentage of free fatty acids and it is expressed as percentage of oleic acid.
Using the Acid Value - indicator method [5], a solution of a known quantity of the fat

7
is analysed in a mixture of ethanol and diethyl ether, following by titration of the free fatty acid present with a potassium hydroxide solution.
3.3 Peroxide Value
The Peroxide Value (P.V.) is the quantity of those substances in the sample, expressed in terms of milliequivalents of active oxygen per Kg, which oxidise potassium iodide under operating conditions described.
The method [6] consists in the treatment of the test portion dissolved in acetic acid and chloroform with a solution of potassium iodide. The liberated iodine is titrated with a standardised sodium thiosulphate solution.
3.4 Refractive Index
The refractive index of a medium is the ratio of the speed of the light at a definite wavelength in vacuum to its speed in the medium.
The refractive index [7] of a given substance varies with the wavelength of the light and with the temperature. Generally the speed in the air is used instead of the speed in vacuum and the selective wavelength is the mean wavelength of the D-lines of sodium (589.6 nm).
The refractive index is given at 25°C using a digital refractometer refractometer suitable in a range from 1.3330 to 1.5318 nD.
3.5 Gas chromatographic analyses
Further characterisation of the rectified olive oils (not foreseen by the Directive) was performed by gas chromatography. In particular, it was decided to investigate intact triglycerides chromatographic profiles, in order to see whether this could be an additional discriminating parameter.
The olive oil is almost totally composed by triglycerides (98%-99%). The most represented fat acids are the following: oleic (65%-80%), linoleic (< 13%) and palmitic (7%-15%). Other substances, in minor quantity, are contained in olive oil, such as hydrocarbons, tocopherols fatty alcohols and waxes.
Olive oils were analysed by GC-FID (Hewlett Packard), equipped with a DB17-HT column (30 m x 0.25 mm x 0.15 μm), programmed starting from 130°C, 20°C/min till 360°C for 35 min. On-column injection with inlet at 200°C. The olive oil concentration was 2 mg/mL in isooctane. Injection volume 1 μL.

8
4 SCREENING OF SOURCES OF OLIVE OILS
4.1 Samples tested
The CRL-FCM selected several rectified oil samples from different sources, either industrial than commercial to check their suitability for the use in migration tests.
All the analysed oils were of the same quality level with the minimum content of extra virgin olive oil.
The samples selected are reported in table 2.
Name Source ACEF Sigma-Aldrich Dante Market Bertolli Market Borgo Antico Market
SALOV – sample A Industry SALOV – sample B Industry UNILEVER – sample A Industry UNILEVER – sample B Industry
Table 2: Rectified olive oil samples
4.2 Results of specification tests
4.2.1 Iodine value
Each sample was analysed in triplicate; Table 3 reports the mean values.
Sample I.V. g/100g ACEF 83.1 Dante 84.1 Bertolli 84.3 Borgo Antico 83.1 SALOV – sample A 84.1 SALOV – sample B 84.3 UNILEVER – sample A 84.1 UNILEVER – sample B 84.1 Directive 85/572/EEC 80 – 88
Table 3: Iodine Value (Wijs)

9
All oil samples satisfied the requirements of the Directive 85/572/EEC.
4.2.2 Acidity
Each sample was analysed in triplicate; Table 4 reports the mean values.
Sample A.V. [%] ACEF 0.41 Dante 0.17 Bertolli 0.20 Borgo Antico 0.48 SALOV – sample A 0.14 SALOV – sample B 0.14 UNILEVER – sample A 0.15 UNILEVER – sample B 0.15 Directive 85/572/EEC < 0.5
Table 4: Acid Value
All oil samples satisfied the requirements of the Directive 85/572/EEC.
4.2.3 Peroxide value
Each sample was analysed in triplicate; Table 5 reports the mean values.
Sample P.V. ACEF 5.6 Dante 3.0 Bertolli 3.0 Borgo Antico 4.6 SALOV – sample A 0.9 SALOV – sample B 1.0 UNILEVER – sample A 2.0 UNILEVER – sample B 2.1 Directive 85/572/EEC < 10
Table 5: Peroxide Value
All oil samples satisfied the requirements of the Directive 85/572/EEC.

10
4.2.4 Refractive index
Each sample was analysed in triplicate; Table 6 reports the mean values.
Sample I.V. [nD] ACEF 1.4682 Dante 1.4678 Bertolli 1.4676 Borgo Antico 1.4675 SALOV – sample A 1.4675 SALOV – sample B 1.4674 UNILEVER – sample A 1.4675 UNILEVER – sample B 1.4675 Directive 85/572/EEC 1.4665 – 1.4679
Table 6: Refractive Index
All oil samples except the ACEF sample satisfied the specified the requirements of the Directive 85/572/EEC.
4.2.5 Gas chromatographic analyses
The chromatographic profiles obtained were all very similar; none of them was showing different interfering peaks than those from triglycerides. Therefore it was not possible to discriminate the oils using these analyses.
The oils chromatograms are reported in figures 1-6 below.
Figure 1: ACEF oil Figure 2: DANTE oil
ACEF DANTE

11
Figure 3: BERTOLLI oil Figure 4: BORGO ANTICO oil
Figure 5: SALOV oil Figure 6: UNILEVER oil
5 CHOICE OF OIL
All the selected oils satisfied the parameters specified in the Directive 85/572/EEC.
The choice was made from the more conveniently available industrial suppliers ready to provide large lots of batch olive oil rectified to the appropriate levels. Both industrial suppliers were of equal value and the choice of the purchase of a larger prototype lot (e.g. SALOV S.p.a.) was made based on commercial offers received and responsiveness indicators in the context of this study specifically, and thus does not represent a general conclusion as to potential suppliers.
BERTOLLI BORGO ANTICO
SALOV UNILEVER

12
6 HOMOGENEITY ASSESSMENT
6.1 strategy
The strategy followed is outlined in figure 7 below:
Figure 7: Development plan
Upon receiving the 500L of rectified of oil to specifications, the CRL-FCM performed analyses of homogeneity study, following the experimental scheme reported in figure 8, with the aim to provide the suitability of the rectified oil according to the requirements of Directive 85/572/EEC.
To this aim, the CRL-FCM was also further supported by an external regional institute holding specific accreditations fort he analyses of oils and fats and specifically for the analyses described as parameters in Directive 85/572/EEC.
The general scheme was therefore as described in figure x below, where both 1) the producer (SALOV) provided supporting documentation of the technical specifications of the batch of oil, 2) the CRL-FCM performed the full set of homogeneity study, and 3) the external accredited laboratory Stazione Sperimentale per le Industrie degli Oli e dei Grassi (SSOG), Milano, Italy performed a set for homogeneity to provide a certificate of analyses.
BATCH OF OIL FROM PRODUCER
HOMOGENEITY ASSESSMENT
CERTIFICATE OF ANALYSES (85/572/EEC)
OIL DISTRIBUTION TO NRLS

13
Figure 8: Homogeneity test experimental scheme
As batch of materials may be slightly heterogeneous to some degree, when such a bulk material is split for distribution to various laboratories, the units produced vary slightly in composition among themselves [8]. The CRL-FCM checked that this variation was sufficiently small for the purpose according to the scheme.
The test specified called for the selection of ten or more units at random after the putative homogenised material had been split and packaged into discrete samples for distribution. The material from each sample was then analysed in duplicate, under randomised repeatability conditions (that is, all in one run) using a method with sufficient analytical precision. The results were submitted to the one-way analysis of variance (ANOVA).
6.2 Experimental
6.2.1 Sampling
Ten containers (cans) were selected from THE CRL-FCM strictly at random from the whole batch. Separately the contents of each of the 10 selected containers were homogenised and two test portions from each were taken. Samples were labeled by assigning a sequential number as shown in table 7.
Prepare the whole of the bulk oil
Divide the material into 5L containers
Separately homogenise the contents of each of the 10 selected containers and take two test portions from each.
Select 10 containers strictly at random using a computer -generated table sequence
Label the test portions
Sort the 20 test portions into a random order and carry out all analytical operations on them in that order (computer package used to generate new random sequences)
Return the 20 analytical results
JRC
SALOV
JRC
SSOG+
14
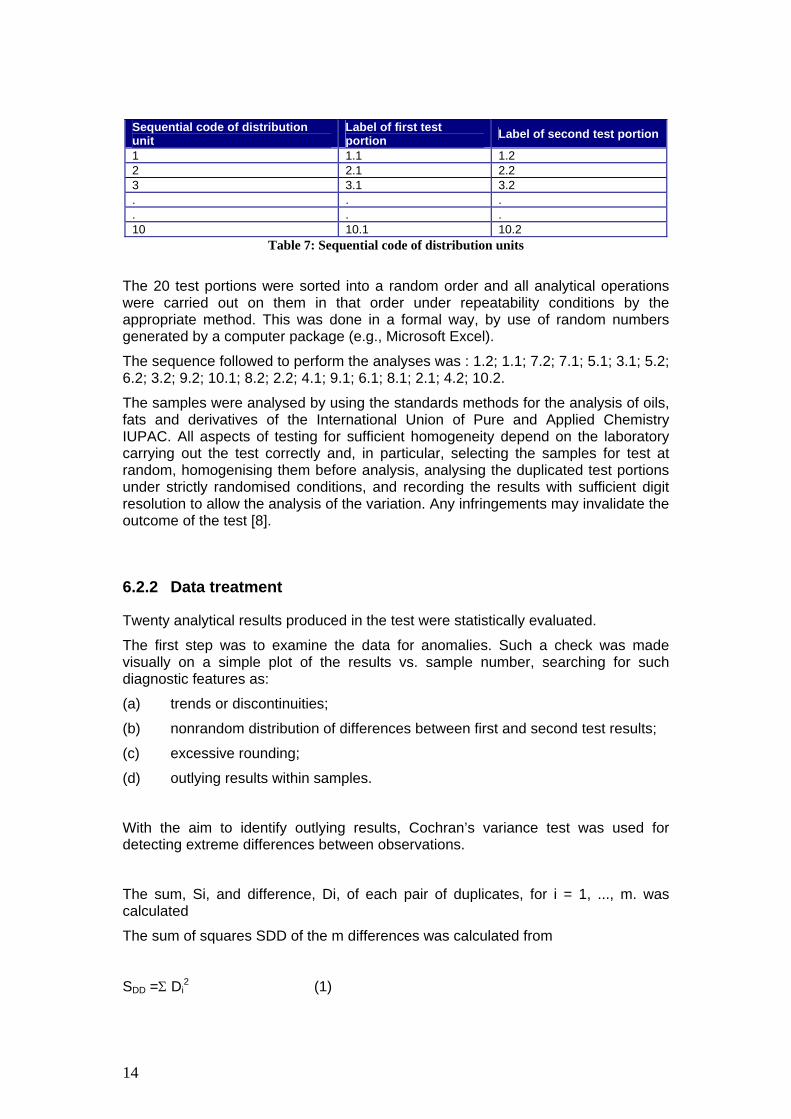
Table 7: Sequential code of distribution units
The 20 test portions were sorted into a random order and all analytical operations were carried out on them in that order under repeatability conditions by the appropriate method. This was done in a formal way, by use of random numbers generated by a computer package (e.g., Microsoft Excel).
The sequence followed to perform the analyses was : 1.2; 1.1; 7.2; 7.1; 5.1; 3.1; 5.2; 6.2; 3.2; 9.2; 10.1; 8.2; 2.2; 4.1; 9.1; 6.1; 8.1; 2.1; 4.2; 10.2.
The samples were analysed by using the standards methods for the analysis of oils, fats and derivatives of the International Union of Pure and Applied Chemistry IUPAC. All aspects of testing for sufficient homogeneity depend on the laboratory carrying out the test correctly and, in particular, selecting the samples for test at random, homogenising them before analysis, analysing the duplicated test portions under strictly randomised conditions, and recording the results with sufficient digit resolution to allow the analysis of the variation. Any infringements may invalidate the outcome of the test [8].
6.2.2 Data treatment
Twenty analytical results produced in the test were statistically evaluated.
The first step was to examine the data for anomalies. Such a check was made visually on a simple plot of the results vs. sample number, searching for such diagnostic features as:
(a) trends or discontinuities;
(b) nonrandom distribution of differences between first and second test results;
(c) excessive rounding;
(d) outlying results within samples.
With the aim to identify outlying results, Cochran’s variance test was used for detecting extreme differences between observations.
The sum, Si, and difference, Di, of each pair of duplicates, for i = 1, ..., m. was calculated
The sum of squares SDD of the m differences was calculated from
SDD =Σ Di2 (1)
Sequential code of distribution unit
Label of first test portion Label of second test portion
1 1.1 1.2 2 2.1 2.2 3 3.1 3.2 . . . . . . 10 10.1 10.2
15
Cochran’s test statistic is the ratio of D2max, the largest squared difference to this
sum of squared differences
C = D2max / SDD (2)
The ratio was calculated and compared with the appropriate critical value from tables.
Results for Cochran outlying pairs detected at the 95 % or higher level of confidence should always be inspected closely for evidence of transcription or other errors in the analysis. An outlying pair should not be rejected unless it is significant at the 99 % level or irremediable analytical procedure errors are found. A single Cochran outlier at the 99 % level should be excluded from the ANOVA [9].
After Cochran’s variance test the data are submitted to one-way analysis of variance.
For each accepted set of result (i), the mean value x i
_ was calculated as the
arithmetic mean of the individual measurements:
xn
xii
ijj
ni_= ∑
=
11
(3)
ni being the number of measurements carried out in the ith set (j = 1 ... ni). The corresponding standard deviation was estimated as:
⎥⎥⎦
⎤
⎢⎢⎣
⎡
−= ∑
=
−in
j i
iiji
nxxs
1
2
1)(
_
(4)
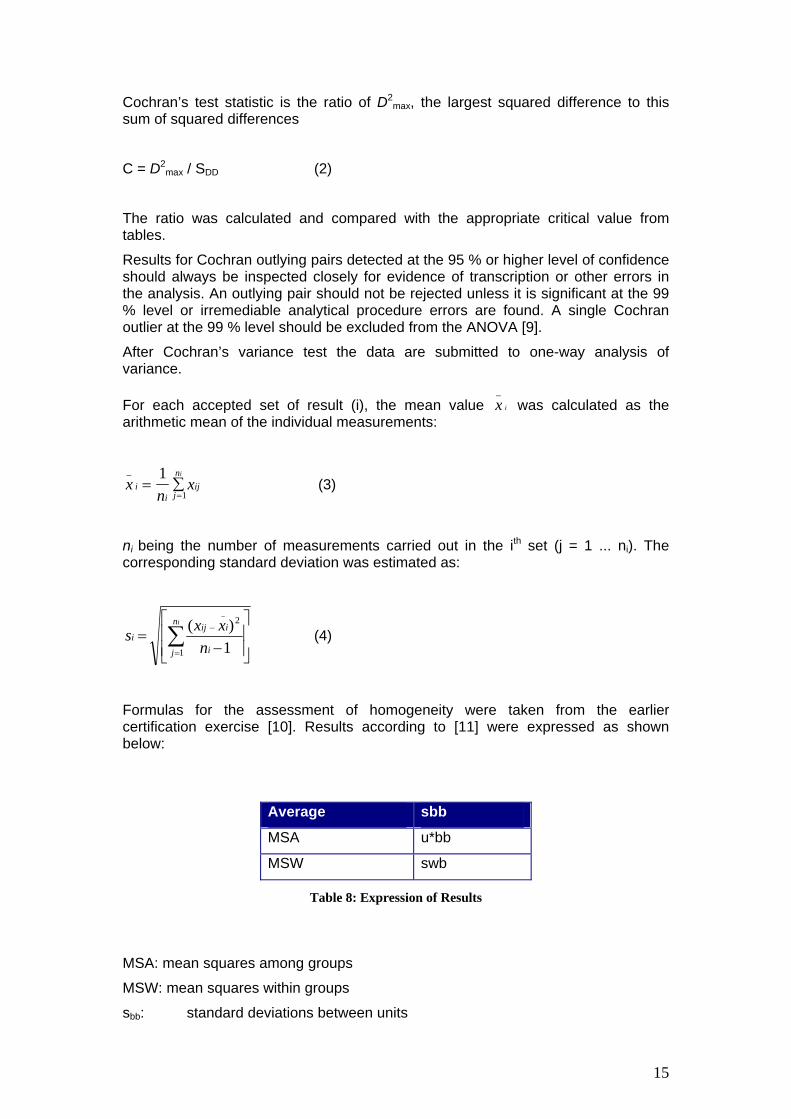
Formulas for the assessment of homogeneity were taken from the earlier certification exercise [10]. Results according to [11] were expressed as shown below:
Table 8: Expression of Results
MSA: mean squares among groups
MSW: mean squares within groups
sbb: standard deviations between units
Average sbb
MSA u*bb
MSW swb
16
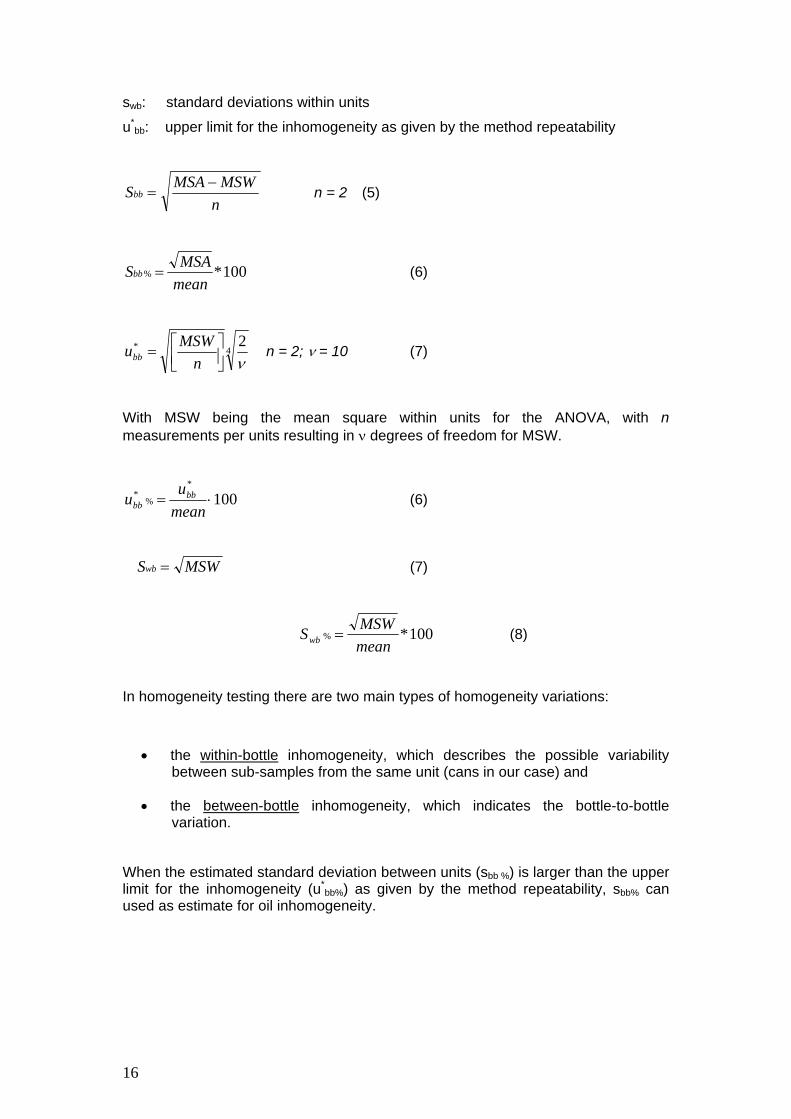
swb: standard deviations within units
u*bb: upper limit for the inhomogeneity as given by the method repeatability
nMSWMSASbb
−= n = 2 (5)
100*%meanMSASbb = (6)
4* 2ν⎥⎦
⎤⎢⎣⎡=
nMSWubb n = 2; ν = 10 (7)
With MSW being the mean square within units for the ANOVA, with n measurements per units resulting in ν degrees of freedom for MSW.
100*
%* ⋅=
meanuu bb
bb (6)
MSWSwb = (7)
100*%meanMSWSwb = (8)
In homogeneity testing there are two main types of homogeneity variations:
• the within-bottle inhomogeneity, which describes the possible variability between sub-samples from the same unit (cans in our case) and
• the between-bottle inhomogeneity, which indicates the bottle-to-bottle variation.
When the estimated standard deviation between units (sbb %) is larger than the upper limit for the inhomogeneity (u*
bb%) as given by the method repeatability, sbb% can used as estimate for oil inhomogeneity.

17
Visual appraisal : Acidity
0.000
0.020
0.040
0.060
0.080
0.100
0.120
0.140
0.160
0.180
0.200
1 2 3 4 5 6 7 8 9 10
Distribution unit serial identity code
Ana
lytic
al re
sulta
( %
ole
ic a
cid)
First resultSecond results
6.3 CRL-FCM homogeneity results
6.3.1 Determination of the acid value A.V. and the acidity
The same IUPAC standard method used in the first characterisation of the different oils was also used for the homogeneity assessment. A solution of a know quantity of the oil to be analysed in a mixture of ethanol and diethyl ether, followed by titration of the free fatty acid present with an ethanolic solution of potassium hydroxide.
Twenty aliquots of 10 different oil cans were analysed under repeatability conditions by following the random sequence generated. The results are reported in table 9.
Table 9: Acidity results
No anomalous values were observed in the datasets after visual appraisal (figure 9).
Figure 9: Visual appraisal for acidity results
Sample Result 1 (%oleic acid)
Result 2 (%oleic acid)
1 0.15 0.15
2 0.15 0.14
3 0.17 0.16
4 0.14 0.15
5 0.16 0.17
6 0.14 0.17
7 0.16 0.15
8 0.15 0.14
9 0.14 0.18
10 0.17 0.15

18
No outlying results where detected by Cochran’s variance test (table 10)
Cochran's test
largest value of D2 Sum of D2 largest value of D2/ Sum of D2 5% Critical value (m=10)
1.54E-03 0.003 0.458 0.602
largest value of D2/ Sum of D2 < critical value
Table 10: Cochran’s variance test
Data were pooled and a 1-way ANOVA over the data was performed as described by Linsinger et al. [11]. Results are reported in table 11.
Results from homogeneity study ANOVA
Average 0.15 mean value
MSA 0.00018 mean squares among groups
MSW 0.00017 mean squares within groups
sbb% 8.67% inhomogeneity between cans
swb% 8.35 % inhomogeneity within cans
U*bb% 3.95 % upper limit for the inhomogeneity as given by the method repeatability
sbb% > U*bb% sbb% can be used to estimate the inhomogeneity of oil
Table 11: ANOVA’s variance test result for acidity analyses
Considering the inhomogeneity calculated the batch of oil remains within the range permitted by Directive 85/572/EEC that is 0.5% maximum.
6.3.2 Determination of the iodine value I.V.
The same IUPAC standard method used in the first characterisation of the different oils was also used for the homogeneity assessment. The principle of the method is based on the addition to the test portion of an iodine monochloride solution in an acetic and carbon tetrachloride mixture. After a time of reaction, determination of the excess of halogen by addition of potassium iodide aqueous solution and tritation of the liberated iodine with standardised sodium thiosulphate solution. Twenty aliquots of 10 different oil cans were analysed under repeatability conditions by following the random sequence generated. The results are reported in table 12

19
Visual appraisal : Iodine value
65.000
70.000
75.000
80.000
85.000
90.000
95.000
1 2 3 4 5 6 7 8 9 10
Distribution unit serial identity code
Anal
ytic
al re
sulta
First result
Second results
Table 12: Iodine value results
No anomalous values were observed in the datasets after visual appraisal shown in figure 10.
Figure 10: Visual appraisal for iodine value
No outlying results where detected by Cochran’s variance test (table 13).
Cochran's test
largest value of D2 Sum of D2 largest value of D2/ Sum of D2 5% Critical value (m=10)
13.790 38.696 0.360 0.602
largest value of D2/ Sum of D2 < critical value
Table 13: Cochran’s variance test result for iodine value analyses
Sample Result 1 (g/100g)
Result 2 (g/100g)
1 85.3 84.3
2 85.7 84.1
3 83.9 83.2
4 85.0 85.9
5 84.6 82.8
6 83.9 87.5
7 80.7 84.4
8 85.7 85.1
9 83.2 81.5
10 82.7 82.5

20
Data were pooled and a 1-way ANOVA over the data was performed as described by Linsinger et al. [11]. Results are reported in table 14.
Results from homogeneity study ANOVA
Average (g/100g) 84.1 mean value MSA 3.43 mean squares among groups MSW 1.93 mean squares within groups
sbb% 2.20 % inhomogeneity between cans
swb% 1.65 % inhomogeneity within cans
U*bb% 0.78 % upper limit for the inhomogeneity as given by the method repeatability
sbb% > U*bb% => sbb% can be used to estimate the inhomogeneity of oil
Table 14: ANOVA’s variance test result for iodine value analyses
Considering the inhomogeneity calculated the batch of oil remains within the range permitted by Directive 85/572/EEC that is 80 to 88.
6.3.3 Determination of the peroxide value P.V.
The same IUPAC standard method used in the first characterisation of the different oils was also used for the homogeneity assessment. The principle of the method is based on the treatment of a test portion, in solution in acetic acid and chloroform, by a solution of potassium iodide and the tritation of the liberated iodine with standardised sodium thiosulphate solution.
Twenty aliquots of 10 different oil cans were analysed under repeatability conditions by following the random sequence generated. The results are reported in table 15.
Table 15: Peroxide value results
Sample Result 1 (meqO2/kg)
Result 2 (meqO2/kg)
1 1.3 1.3
2 1.4 1.3
3 1.5 1.4
4 1.3 1.3
5 1.3 1.4
6 1.3 1.3
7 1.3 1.3
8 1.3 1.8
9 1.7 1.3
10 1.6 1.7

21
Visual appraisal : Peroxide Value
0.0000.2000.4000.6000.8001.0001.2001.4001.6001.8002.000
1 2 3 4 5 6 7 8 9 10
Distribution unit serial identity code
Anal
ytic
al re
sulta
( m
illi
equi
vale
nts)
Series2
Series3
No anomalous values were observed in the datasets after visual appraisal shown in figure 11.
Figure 11: Visual appraisal for peroxide value
No outlying results where detected by Cochran’s variance test (table 16). Cochran's test
largest value of D2 Sum of D2 largest value of D2/ Sum of D2 5% Critical value (m=10)
0.214 0.365 0.587 0.602
largest value of D2/ Sum of D2 < critical value
Table 16: Cochran’s variance test result for peroxide value analyses
Data were pooled and a 1-way ANOVA over the data was performed as described by Linsinger et al. [11]. Results are reported in table 17.
Results from homogeneity study ANOVA
Average (meqO2/kg) 1.4 mean value
MSA 0.027 mean squares among groups
MSW 0.018 mean squares within groups
sbb% 11.64 % inhomogeneity between cans
swb% 9.59 % inhomogeneity within cans
U*bb% 4.53 % upper limit for the inhomogeneity as given by the method repeatability
sbb% > U*bb% => sbb% can be used to estimate the inhomogeneity of oil
Table 17: ANOVA’s variance test result for peroxide value analyses
Considering the inhomogeneity calculated the batch of oil remains within the range permitted by Directive 85/572/EEC that is 10 maximum.

22
Visual appraisal : Refractive index
1.4672
1.4673
1.4673
1.4674
1.4674
1.4675
1.4675
1 2 3 4 5 6 7 8 9 10
Distribution unit serial identity code
Ana
lytic
al re
sulta
( nD
)
First resultSecond results
6.3.4 Determination of refractive index R.I.
The same IUPAC standard method used in the first characterisation of the different oils was also used for the homogeneity assessment. The refractive index of a medium is the ratio of the speed of the light at a definite wavelength in vacuum to its speed in the medium.
The refractive index of a given substances varies with the wavelength of the light and with the temperature. Generally the speed in the air is used instead of the speed in vacuum and the selective wavelength is the mean wavelength of the D-lines of sodium (589.6 nm).
The refractive index was measured by using a digital refractometer.
Table 18: Refractive index results
No anomalous values were observed in the datasets after visual appraisal shown in figure 12.
Figure 12: Visual appraisal for refractive index
Sample Result 1 (nD)
Result 2 (nD)
1 1.4674 1.4675
2 1.4675 1.4675
3 1.4674 1.4675
4 1.4675 1.4674
5 1.4674 1.4674
6 1.4674 1.4675
7 1.4674 1.4673
8 1.4675 1.4675
9 1.4675 1.4674
10 1.4675 1.4674

23
No outlying results where detected by Cochran’s variance test (table 19).
Cochran's test
largest value of D2 Sum of D2 largest value of D2/ Sum of D2
5% Critical value (m=10)
1E-08 5E-08 0.200 0.602
largest value of D2/ Sum of D2 < critical value
Table 19: Cochran’s variance test result for refractive index analyses
Data were pooled and a 1-way ANOVA over the data was performed as described by Linsinger et al. [11]. Results are reported in table 20.
Results from homogeneity study ANOVA
Average 1.4674 mean value
MSA 2.72222E-09 mean squares among groups
MSW 2.5E-09 mean squares within groups
sbb% 0.0035 % inhomogeneity between cans
swb% 0.0034% inhomogeneity within cans
U*bb% 0.0016% upper limit for the inhomogeneity as given by the method repeatability
sbb% > U*bb% => sbb% can be used to estimate the inhomogeneity of oil
Table 20: ANOVA’s variance test result for refractive index analyses
Considering the inhomogeneity calculated the batch of oil remains within the range permitted by Directive 85/572/EEC that is 1.4665 to 1.4679.
6.4 SSOG homogeneity results
6.4.1 Determination of the acid value A.V. and the acidity
SSOG analysed twenty aliquots of 10 different oil cans under repeatability conditions by following the random sequence generated. The results are reported in table 21.

24
Visual appraisal : Acidity
0.060
0.065
0.070
0.075
0.080
0.085
0.090
1 2 3 4 5 6 7 8 9 10
Distribution unit serial identity code
Ana
lytic
al re
sulta
( %
ole
ic a
cid)
First resultSecond results
Table 21: Acidity results
No anomalous values were observed in the datasets after visual appraisal shown in figure 13.
Figure 13: Visual appraisal for acidity results
No outlying results where detected by Cochran’s variance test (table 22).
Cochran's test
largest value of D2 Sum of D2 largest value of D2/ Sum of D2
5% Critical value (m=10)
1.0E-04 0.0003 0.333 0.602
largest value of D2/ Sum of D2 < critical value
Table 22: Cochran’s variance test result for acidity analyses
Data were pooled and a 1-way ANOVA over the data was performed as described by Linsinger et al. [11]. Results are reported in table 23.
Sample Result 1 (%oleic acid)
Result 2 (%oleic acid)
1 0.07 0.07
2 0.07 0.08
3 0.07 0.07
4 0.08 0.07
5 0.07 0.08
6 0.08 0.08
7 0.07 0.07
8 0.08 0.08
9 0.08 0.08
10 0.07 0.07

25
Results from homogeneity study ANOVA
Average
(%oleic acid) 0.07 mean value
MSA 3.833E-05 mean squares among groups
MSW 0.000015 mean squares within groups
sbb% 8.31 % inhomogeneity between cans
swb% 5.20 % inhomogeneity within cans
U*bb% 2.46 % upper limit for the inhomogeneity as given by the method repeatability
sbb% > U*bb% => sbb% can be used to estimate the inhomogeneity of oil
Table 23: ANOVA’s variance test result for acidity analyses
Considering the inhomogeneity calculated the batch of oil remains within the range permitted by Directive 85/572/EEC that is 0.5% maximum.
6.4.2 Determination of the iodine value I.V.
SSOG analysed twenty aliquots of 10 different oil cans under repeatability conditions by following the random sequence generated. The results are reported in table 24
Table 24: Iodine value results
No anomalous values were observed in the datasets after visual appraisal shown in figure 14.
Sample Result 1 (g/100g)
Result 2 (g/100g)
1 82.4 82.3
2 81.8 82.5
3 82.4 81.7
4 81.9 81.9
5 82.2 82.0
6 82.0 82.1
7 82.5 82.3
8 82.3 81.4
9 82.1 82.2
10 81.9 81.7

26
Visual appraisal : Iodine value
80.000
80.500
81.000
81.500
82.000
82.500
83.000
83.500
84.000
1 2 3 4 5 6 7 8 9 10
Distribution unit serial identity code
Anal
ytic
al re
sulta
First result
Second results
Figure 14: Visual appraisal for iodine value
No outlying results where detected by Cochran’s variance test (table 25).
Cochran's test
largest value of D2 Sum of D2 largest value of D2/ Sum of D2 5% Critical value (m=10)
0.810 1.940 0.420 0.602
largest value of D2/ Sum of D2 < critical value
Table 25: Cochran’s variance test result for iodine value analyses
Data were pooled and a 1-way ANOVA over the data was performed as described by Linsinger et al. [11]. Results are reported in table 26.
Results from homogeneity study ANOVA Average (g/100g) 82.1 mean value
MSA 0.08 mean squares among groups MSW 0.10 mean squares within groups
sbb% 0.34 % inhomogeneity between cans
swb% 0.38 % inhomogeneity within cans
U*bb% 0.18 % upper limit for the inhomogeneity as given by the method repeatability
swb% > U*bb% => swb% can be used to estimate the inhomogeneity of oil
Table 26: ANOVA’s variance test result for iodine value analyses
Considering the inhomogeneity calculated the batch of oil remains within the range permitted by Directive 85/572/EEC that is 80 to 88.

27
Visual appraisal : Peroxide Value
0.0000.2000.4000.6000.8001.0001.2001.4001.6001.8002.000
1 2 3 4 5 6 7 8 9 10
Distribution unit serial identity code
Anal
ytic
al re
sulta
( m
illi
equi
vale
nts)
Series2
Series3
6.4.3 Determination of the peroxide value P.V.
SSOG analysed twenty aliquots of 10 different oil cans under repeatability conditions by following the random sequence generated. The results are reported in table 27.
Table 27: Peroxide value results
No anomalous values were observed in the datasets after visual appraisal shown in figure 15.
Figure 15: Visual appraisal for peroxide value
No outlying results where detected by Cochran’s variance test (table 28). Cochran's test
largest value of D2 Sum of D2 largest value of D2/ Sum of D2 5% Critical value (m=10)
0.010 0.060 0.167 0.602
largest value of D2/ Sum of D2 < critical value
Table 28: Cochran’s variance test result for peroxide value analyses
Sample Result 1 (meqO2/kg)
Result 2 (meqO2/kg)
1 1.2 1.2
2 1.2 1.1
3 1.2 1.2
4 1.2 1.2
5 1.1 1.2
6 1.1 1.2
7 1.2 1.2
8 1.2 1.1
9 1.1 1.0
10 1.1 1.2

28
Data were pooled and a 1-way ANOVA over the data was performed as described by Linsinger et al. [11]. Results are reported in table 29.
Results from homogeneity study ANOVA Average (meqO2/kg)
1.16 mean value
MSA 0.004 mean squares among groups
MSW 0.003 mean squares within groups
sbb% 5.60 % inhomogeneity between cans
swb% 4.72 % inhomogeneity within cans
U*bb% 2.23 % upper limit for the inhomogeneity as given by the method repeatability
sbb% > U*bb% => sbb% can be used to estimate the inhomogeneity of oil
Table 29: ANOVA’s variance test result for peroxide value analyses
Considering the inhomogeneity calculated the batch of oil remains within the range permitted by Directive 85/572/EEC that is 10 maximum.
7 STABILITY CONTROL
The oil was distributed to NRLs only after the homogeneity of whole batch was established.
The CRL-FCM is currently performing on-going analyses monthly on aliquots of the distributed olive oil stored at 18°C to check that the parameters remain within the range permitted by EU directive 85/572/EEC.
The values obtained so far are reported below.
Acidity Peroxide number Iodine value (Wijs) Refractive Index at 25°C
Reference value
0.5 % maximum 10 maximum 80 to 88 1.4665 to 1.4679
November 2007 0.07 1.16 82.08 1.4674
December 2007 _ _ _ _
January 2008 0.07 1.31 83.77 1.4674
February 2008 _ _ _ _
. . . . .
Expiry date
If any parameters will be find outside the permitted range the NRLs who received the oil would be informed immediately.

29
8 CONCLUSIONS
The analyses performed confirmed that the batch studied has a variation sufficiently small for the purpose.
In each case, the measured value was found to be within the range permitted by EC Directive 85/572/EEC, hence the batch of oil is held to be suitable for use in overall and specific migration testing.
9 REFERENCES
1. Directives 82/711/EEC: laying down the basic rules necessary for testing migration of the constituents of plastic materials and articles intended to come into contact with foodstuffs
2. Directive 97/48/EC: amending for the second time Council Directive 82/711/EEC laying down the basic rules necessary for testing migration of the constituents of plastic materials and articles intended to come into contact with foodstuffs
3. Directive 2002/72/EC: relating to plastic materials and articles intended to come into contact with foodstuffs
4. Standard methods for the analyses of oils, fats and derivatives. C. Paquot and A. Hautfenne. International Union of Pure and Applied Chemistry, 7th revised and enlarged edition, 88.
5. Standard methods for the analyses of oils, fats and derivatives. C. Paquot and A. Hautfenne. International Union of Pure and Applied Chemistry, 7th revised and enlarged edition, 73.
6. Standard methods for the analyses of oils, fats and derivatives. C. Paquot and A. Hautfenne. International Union of Pure and Applied Chemistry, 7th revised and enlarged edition, 199
7. Standard methods for the analyses of oils, fats and derivatives. C. Paquot and A. Hautfenne. International Union of Pure and Applied Chemistry, 7th revised and enlarged edition, 34.
8. M Thompson, S. Ellison, AND R Wood. The international harmonised protocol for the proficiency testing of analytical chemistry laboratory (IUPAC technical report) Pure Appl. Chem., Vol. 78, No. 1, pp. 145–196, 2006.
9. J Pauwels, A Van der Veen, A Lamberty, H Schimmel. Accred Qual Assur (2000) 5:95-9.
10. T.P.J. Linsinger, J. Pauwels, H. Schimmel, A. Lamberty, A.M.H. van der Veen, G. Schumann, L. Siekmann. Estimation of the uncertainty of CRM in accordance with GUM: application to the certification of four enzyme CRMs. Fresenius J Anal Chem (2000) 368: 589-594
11. T.P.J. Linsinger, J. Pauwels, A.M.H. van der Veen, H. Schimmel, A. Lamberty. Homogeneity and stability of reference materials. Accred Qual Assur (2001) 6: 20-25

30
European Commission EUR 23395 EN – Joint Research Centre – Institute for Health and Consumer Protection Title: Suitability of new sources of olive oil intended to be used as simulant D in migration testing. Author(s): C. Simoneau, G. Beldi’, F. Franchini, P. Hannaert Luxembourg: Office for Official Publications of the European Communities 2008 – 30 pp. – 21 x 29 cm EUR – Scientific and Technical Research series – ISSN 1018-5593 ISBN 978-92-79-09289-3 DOI 10.2788/78957 Abstract The Council Directive 85/572/EEC of 19 December 1985 lays down the list of simulants for overall and specific migration testing, to be used for testing migration of constituents of plastic materials and articles intended to come into contact with foodstuff. This Directive lists the appropriate simulants to be used in migration tests with a particular foodstuff or group of foodstuffs. Within simulants, simulant D is rectified olive oil that has to satisfy characteristics such as acidity, peroxide index, iodine index, refractive index. Until 2005 rectified olive oil with documented appropriate technical specifications was commercially available from the company Pira International (UK). However commercial production stopped, and other potential sources available (Korea Japan, Sigma) did not necessarily provide specifications documented specifically for use as “simulant D”. Since the oil specifications set in the EU legislation are crucial, both for compliance testing but also in the frame of an ISO accreditation for migration in oil, NRLs suggested the CRL-FCM to investigate specifications potential sources of olive oil to develop a source of simulant D for their purposes. The results demonstrated the feasibility of at least one source of olive oil, which was then provided to the National Reference Laboratories as a deliverable of the workprogramme 2007.
How to obtain EU publications Our priced publications are available from EU Bookshop (http://bookshop.europa.eu), where you can place an order with the sales agent of your choice. The Publications Office has a worldwide network of sales agents. You can obtain their contact details by sending a fax to (352) 29 29-42758.

The mission of the JRC is to provide customer-driven scientific and technical support for the conception, development, implementation and monitoring of EU policies. As a service of the European Commission, the JRC functions as a reference centre of science and technology for the Union. Close to the policy-making process, it serves the common interest of the Member States, while being independent of special interests, whether private or national.
LB
-NA
-23395-EN-C