Suggestions for “Safe” Residue Substitutions in Site ...€¦ · J. Mol. Biol. (1991) 217,...
9
J. Mol. Biol. (1991) 217, 721-729 Suggestions for “Safe” Residue Substitutions in Site-directed Mutagenesis Domenico Bordo’y’ and Patrick Argosl 1European Molecular Biology Laboratory Meyerhofstrasse I, Postfach 10 22 09 6900 Heidelberg, Federal Republic of Germany 2 Istituto Nazionale Ricerca sul Cancro V. Benedetto XV, 10 16132 Genova, Italy (Received 19 July 1990; accepted 22 October 1990) The conserved topological structure observed in various molecular families such as globins or cytochromes c allows structural equivalencing of residues in every homologous structure and defines in a coherent way a global alignment in each sequence family. A search was performed for equivalent residue pairs in various topological families that were buried in protein cores or exposed at the protein surface and that had mutated but maintained similar unmutated environments. Amino acid residues with atoms in contact with the mutated residue pairs defined the environment. Matrices of preferred amino acid exchanges were then constructed and preferred or avoided amino acid substitutions deduced. Given the conserved atomic neighborhoods, such natural in vivo substitutions are subject to similar constraints as point mutations performed in site-directed mutagenesis experiments. The exchange matrices should provide guidelines for “safe” amino acid substitutions least likely to disturb the protein structure, either locally or in its overall folding pathway, and most likely to allow probing of the structural and functional significance of the substituted site. 1. Introduction Site-directed mutagenesis has become a very important and yet facile tool to explore the struc- tural and functional significance of particular residues within proteins (for example, see Knowles, 1987; Shaw, 1987; Gruetter et al., 1987). A typical experiment would involve substitutions of an amino acid thought to be essential for catalysis and then assaying the resultant variant for activity. It is central to the success of these experiments that disturbance of the protein fold and structural characteristics, locally as well as globally, be kept to a minimum; otherwise the loss of activity, for instance, would be a result of conformational changes and t.he exchanged residue be improperly identified as catalytic. Residue substitutions, where the latter situation does not occur, can be con- sidered as “safe”. 1980, 1982; Chothia & Lesk, 1986; Bashford et al., 1987); rules obtained in this way are useful for designing site-directed mutagenesis experiments. Protein engineering in the laboratory often faces similar trials. For example, suppose that charges on a protein surface are to be altered to construct a cation binding site. Which amino acids near the surface would be safer to substitute to achieve the desired charge configuration? Natural evolution has “engineered” protein struc- tures by modifying certain molecular properties such as substrate specificity or surface charges and yet conserved the global protein topology. By comparing known conserved three-dimensional pro- tein structures it is possible to glean hints about how this process was performed (Lesk & Chothia, In this work residue exchange matrices are calcu- lated that represent point mutational preferences as observed in homologous and known three- dimensional protein structures. Alignments of primary sequences determined from spatial super- position of the main-chain C” and taken from nine molecular families allowed identification of strnctur- ally equivalent residues in each of the fa#milial sequence sets. A search was then performed for equivalent residues that had mutated but main- tained similar unmutated environments defined by these atoms in contact with the central residue pairs. Such point mutations as observed in known tertiary structures are likely to be, with present-day knowledge: the closest possible mimic of in vivo site- directed mutagenesis. Residue exchange statistics and their significance 0022-2836/91/040721-09 $03.00/O 721 0 1991 Academic Press Limited
Transcript of Suggestions for “Safe” Residue Substitutions in Site ...€¦ · J. Mol. Biol. (1991) 217,...

J. Mol. Biol. (1991) 217, 721-729
Suggestions for “Safe” Residue Substitutions in Site-directed Mutagenesis
Domenico Bordo’y’ and Patrick Argosl 1 European Molecular Biology Laboratory
Meyerhofstrasse I, Postfach 10 22 09 6900 Heidelberg, Federal Republic of Germany
2 Istituto Nazionale Ricerca sul Cancro V. Benedetto XV, 10 16132 Genova, Italy
(Received 19 July 1990; accepted 22 October 1990)
The conserved topological structure observed in various molecular families such as globins or cytochromes c allows structural equivalencing of residues in every homologous structure and defines in a coherent way a global alignment in each sequence family. A search was performed for equivalent residue pairs in various topological families that were buried in protein cores or exposed at the protein surface and that had mutated but maintained similar unmutated environments. Amino acid residues with atoms in contact with the mutated residue pairs defined the environment. Matrices of preferred amino acid exchanges were then constructed and preferred or avoided amino acid substitutions deduced. Given the conserved atomic neighborhoods, such natural in vivo substitutions are subject to similar constraints as point mutations performed in site-directed mutagenesis experiments. The exchange matrices should provide guidelines for “safe” amino acid substitutions least likely to disturb the protein structure, either locally or in its overall folding pathway, and most likely to allow probing of the structural and functional significance of the substituted site.
1. Introduction
Site-directed mutagenesis has become a very important and yet facile tool to explore the struc- tural and functional significance of particular residues within proteins (for example, see Knowles, 1987; Shaw, 1987; Gruetter et al., 1987). A typical experiment would involve substitutions of an amino acid thought to be essential for catalysis and then assaying the resultant variant for activity. It is central to the success of these experiments that disturbance of the protein fold and structural characteristics, locally as well as globally, be kept to a minimum; otherwise the loss of activity, for instance, would be a result of conformational changes and t.he exchanged residue be improperly identified as catalytic. Residue substitutions, where the latter situation does not occur, can be con- sidered as “safe”.
1980, 1982; Chothia & Lesk, 1986; Bashford et al., 1987); rules obtained in this way are useful for designing site-directed mutagenesis experiments. Protein engineering in the laboratory often faces similar trials. For example, suppose that charges on a protein surface are to be altered to construct a cation binding site. Which amino acids near the surface would be safer to substitute to achieve the desired charge configuration?
Natural evolution has “engineered” protein struc- tures by modifying certain molecular properties such as substrate specificity or surface charges and yet conserved the global protein topology. By comparing known conserved three-dimensional pro- tein structures it is possible to glean hints about how this process was performed (Lesk & Chothia,
In this work residue exchange matrices are calcu- lated that represent point mutational preferences as observed in homologous and known three- dimensional protein structures. Alignments of primary sequences determined from spatial super- position of the main-chain C” and taken from nine molecular families allowed identification of strnctur- ally equivalent residues in each of the fa#milial sequence sets. A search was then performed for equivalent residues that had mutated but main- tained similar unmutated environments defined by these atoms in contact with the central residue pairs. Such point mutations as observed in known tertiary structures are likely to be, with present-day knowledge: the closest possible mimic of in vivo site- directed mutagenesis.
Residue exchange statistics and their significance
0022-2836/91/040721-09 $03.00/O 721
0 1991 Academic Press Limited
722 D. Bordo and P. Argos
were determined for all the structural equivalents in the various molecular families. The preferred and avoided substitutions were elicited from three struc- tural contexts: buried residues, amino acids exposed beyond some water-accessible surface area thres- hold, and then all cases regardless of accessible state. These exchange matrices should provide con- siderable aid in the difficult process of deciding which residue to exchange and then with which amino acid it should be substituted to maintain protein structural integrity. The preferred exchanges are also discussed in terms of residue physicochemical characteristics.
2. Data and Methods
(a) Aligned structures
aligned sequence sets were taken from 9 molecular families: globins, immunoglobulins, cytochromes c, serine proteases, subtilisins, calcium binding proteins, acid proteases, toxins, and virus capsid proteins. The total number of sequences, each with known 3-dimensional structure as contained in the 1989 Brookhaven database collection (Bernstein et al., 1977); was 55. Table 1 lists their database code identification, protein name, species, reference for the 3-dimensional structure, and, where present, reference in which the alignment of the familial sequences used here was determined. The alignments were generally achieved by careful examination of the X-ray crystallographic structures coupled with spatial super- position of the main-chain C” atoms (Rossmann & Argos, 1981). In 3 cases (calcium binding proteins, acid proteases and toxins) structures were superimposed by the present authors using the technique of Rossmann & Argos (Rossmann & Argos, 1976; 1977; Brgos & Rossmann, 1979). Due to the increasing number of solved protein structures, many of those used in the present work ext’racted from the 1989 release of the Brookhaven data- base were not’ included in the references showing the familial alignments. These further sequences, indicated by an asterisk in Table 1, were aligned by the authors to the closest family member in both sequence and st’ructure.
When considering statistics for buried residues (solvent- accessible surface area below an upper limit), both constant and variable domains were utilized from the immunoglobulins. However, the variable regions were excluded from the exchange matrix statistics involving surface-exposed amino acids, since large segments of the variable domain loops bind antigens and therefore are subject to special constraints. For a similar reason, side- chains contributing to subunit interface or cofactor contacts were not included in the substitution calculations.
(b) Similarity of environment
In a previous paper, Bordo & Argos (1990) carefully defined a measure of similarity (see 8” as given by them in eqns (1) and (3)) between 2 atomic environments surrounding structurally equivalent residues. The same measure is used here. An environment or neighborhood for a residue (called a central residue) is defined by the number of a,toms and amino acid types that are within 45 A (1 A = 0.1 nm) of any side-chain atom in the
surrounded residue. The similarity score S is expressed as
a fraction and is defined as:
The denominator is simply the mean number of atoms belonging to residues present in at least 1 of the 2 environ- ments (6 = main-chain atoms, $ = side-chain atoms). The mean refers to the 2 sets of atoms in each of the 2 environments. The numerator is the sum of the mean number of all main-chain atoms by the 2 environments regardless of the mutational state of the equivalent, neigh- borhood residues plus the mean number of side-&in atoms s from residues that touch at least 1 atom of the mutated centra,l residues (i.e. within 4.5 A). The term 6, is 0 if the ith residue is mutated and 1 if identically conserved. xi is over all residues that touch at least 1 of the central residues. Therefore, similarity of 2 environ- ments will be diminished only if there are mutations in the equivalent environmental residues. That is, if strcc- turally equivalent residues forming the neighborhood of a central residue in I protein structure are conserved in the ather structure despite their absence in the neighborhood of the equivalent central residue in the latter structure, the similarity score is not decreased. This allows for cases where contacts made by the substituted central residue with its neighbors change only in consequence of its change in size a.nd shape. For instance, environmental residues can move considerably to accommodate a, small residue changing to a large one. Though the side-chains in contact with the larger residue are not in contact with the small one, they are nonetheless available without mutation to make conta,ct as necessitated by the substi- tuted residue. Water-accessible surfaces of the combined main-chain and side-chain for each residue was calculated by the procedure of Kabsch & Sander (1983).
(c) Statistical sipificance of exchanges
Count’s were made for every observable substitution of central residues with similar neighborhood at a preset similarity threshold. To give statistical significance to these figures, a comparison between observed and expected number of substitutions was performed under the following hypothesis. Consider a pool of LV amino acids. N = xi n, (i = 1 to 20); where the ith amino arid type appears ni times. The exchange i+j is a directed replacement of the amino acid i with the amino acidj (e.g. Ala,+Asp) and substitution i-j refers to either 1: -.i or j-+i (e.g. Ala-+Asp or Asp-t Ala,). There are N(N- 1) ;;tfi”, exchanges in the pool, of which xini(nl- I) are
residues kind. Therefore ,V’ =&@- l)-&ni(if- tpis zienumber of possible exchanges involving pairs of different residues. Since the observed mutations refer to only substituted residues. S’: and not N, represents the pool of available exchanges. The probability pi,j is then given by ninjJN’, and the probability to observe a substitution pi-j becomes:
pimj = 2ninj/N’. (2) Given a total number of X observed subst’itutions, the expected number of subst,itutions nimj is therefore Xpi-,.
The population ni (i = 1 to 20) was calculated in the following manner. Given a set of structurally aligned sequences for a particular molecular family, each align- ment column would generally contain several amino acid types. The count for the populat,ion ni (i = 1 to 20) was

“Safe” Residue Substitutions 723
Table 1 Tertiary structures used in this work
Family BRKt Protein Origin Structure reference Alignment referencet
Hemoglobin
Immunoglobulins
4HHB Hemoglobin Human Fermi et al. (1984) 2MHB Hemoglobin Equine Ladner et al. (1977) 1FDH Gamma globin Human Frier & Perutz (1977) 1MBD Myoglobin Whale Phillips (1980) 1MBS Myoglobin Seal Scouloudi & Backer (1978) 2LHB Hemoglobin V Sea lamprey Hendrickson et al. (1973) 1ECA Erythrocruorin Chironomous Steigemann & Weber (1979) 2LHl Leghemoglobin Lupin Vainshtein et al. (1977)
lFB4 FAB Kol Human Marquart et al. (1950) 1FBJ FAB IgA Mouse Navia et al. (1979) lFC1 FcIggl Human Deisenhofer (1981) lFC2 Fc Human Deisenhofer (1981) lIG2 Fc Kol Human Marquart et al. (1980) 1MCP FAB Mouse Segal et al. (1974) 1PFC Fc Iggl Porcine Bryant et al. (1985) lRE1 FAB Bence-Jones Human Epp et al. (1975) 2RHE FAB Bence-Jones Human Furey et al. (1983) YFAB FAB New Human Saul et al. (1978) SHFL FAB Iggl Mouse Sheriff eZ al. (1987) lF19 FAB Mouse Lascombe et al. (1989)
Cytochromes c 155c Cytochrome ~550 Paraeoccus D Timkovich & Dickerson (1976) 3C2C Cytochrome c2 Rhodospirillum R Salemme et al. (1973) 4CYT Cytochrome c Bonito fish Takano & Dickerson (1980) 1CYC Ferrocytochrome e Tuna fish Tanaka et al. (1975) 1CCR Cytochrome c Rice Ochi et al. (1983) 451c Cytochrome ~551 Pseudomonas A Matsuura et al. (1982)
* *
Dickerson (1980)
* *
Serine proteases Craik et al. (1983) 2SGA Proteinase A Streptomyces G Moult et al. (1985) 3SGB Proteinase B Streptomyces G Read et al. (1983) 2ALP Alpha-lytic protease Lysobacter E. Fujinaga et al. (1985) 4CHA Alpha chymotrypsin Bovine Tsukada & Blow (1985) 3PTB Beta trypsin Bovine Marquart et al. (1983) 2TRM Trypsin Rat Sprang et al. (1987) 1TON Tonin Rat Fujinaga & James (1987) BKAI Kallikrein Porcine Bode et al. (1983) 1SGT Trypsin Streptomyces G Read & James (1988) 3EST Elastase Porcine Meyer et al. (1988) 3RP2 Mast, cell protease Rat Remington et al. (1988)
Subtilisins 1SBT
2PRK 1CSE
Calcium binding protems 3CLN 3CPV
Acid proteases
Toxins
Viruses
31CB 4TNC
2APP 2APR 4APE
1CTX 1NXB 2ABX
ZTBV 4SBV 2STV 1MEV 4RHV
Proteinase K Subtilisin Karlsberg
B. amylolique- faeensis
Fungus B. subtilis
Paehler et al. (1984) Bode et al. (1987)
Calmodulin Ca-binding
parvalbumin B Ca binding protein Troponin C
Rat Babu et al. (1988) * Carp Moews & Kretsinger (1975) *
Bovine Szebenyi &. Moffat (1986) * Chicken Satyshur et al. (1988) *
Penicillopepsin Fungus James & Sielecki (1983) * Rhizopuspepsin Mold Suguna et al. (1987) * Endothiapepsin Fungus Pearl & Blundell (1984) *
Alpha cobratoxin Cobra Walkinsha-w et al. (1980) * Neurotoxin B Sea snake Tsernoglou et al. (1978) * Alpha bugarotoxin Krait Love & Stroud (1986) *
Tomato bushy stunt Virus Hopper et al. (1984) Southern bean mosaic Virus Silva & Rossmann (1985) Satellite tobacco necr. Virus Jones & Liljas (1984) Mengo Virus Luo et al. (1987) Rhino Virus Arnold & Rossmann (1988)
Rossmann et al. (1983)
Luo et al. (1987) Luo et al. (1987)
Alden et al. (1971)
Lesk & Chothia (1980)
*
*
Amzel & Poljak (1979) * * * * * * * * *
* * * * * *
Froemmel & Sander (1989)
t The column labeled BRK gives the Brookhaven database entry name (Bernstein et al., 1977). $ References showing structural sequence alignments used in this work. An asterisk refers to the cases where the structural alignment
was performed by the authors.

724 D. Bordo and P. Argos
Table 2 Residue counts for the nine structural
protein families
Residue type Ruriedt Exposedf: All5
GUY 161 226 445 Ala 182 250 515 Ser 108 375 533 Pro 34 194 249 Asp 28 255 315 CYS 38 23 71 Asn 33 258 313 Thr 79 341 477 Qlu 11 239 255 Val 206 166 415 Glll 26 201 248 His 20 69 105 Met 49 47 107 Leu 165 135 331 Ile 125 104 265 LYS 5 297 320 Arg 9 162 193 Phe 89 88 208 TY~ 38 128 191 Trp 30 33 68
t Residues having solvent-acceesibie surface less than or equal to 10 A’. Counts are performed as described in Data and Methods.
$ Residues having solvent-accessible surface more than or equal to 30 B*. Counts are performed as described in Data and Methods.
$ All residues are counted, regardless of their exposure to solvent.
increased by 1 only once for each amino acid type in the alignment column, regardless of its number of appear- ances. This was consistent with the counts for redundant central iosidue pairs. For instance, suppose an alignment position contained 3 Ala and 2 Gly residues in a particular topologic family, a total of 6 residue substjitutions can be counted; however; since they are all st’ructurally equiva- lent, only 1 should be taken: namely, that Gly-Ala substi- tution with the highest environmental simI1arit.y score. This selection is consistent with the aim of this study to find conserved neighborhoods tolerating mutant central residues. Total counts ni (; = I to 20) were determined for all the alignment’ positions in all the molecular families under 3 water-accessible conditions and are given in Table 2: The probability to observe CI substitutions i-j out of X trials taken from a pool of LV residues (A’ = ci?zi) assuming a binomial distribution is given by:
Pi&j(x, a) = %
0
Py-j( 1 -pi-j)x-cr>
where pi_j is given in eqn (2), and:
x
0
X!
a = a! (X-n)!’
Given the number of observed substitutions ni-j; it is straightforward to calculate its chance probability with eqn (3) (see e.g. Korn & Korn, 1968). If the sum of all probabilities piej(X. a) for nimj I c( < X is less than or equal to 0.05, t,he preference of the substitutions can be eon- sidered significant at the 95% confidence level or better. Consider the following hypothetical illustration. Suppose the pool of residues consisted of 10 amino acids for each of
Table 3 Number of substitutions for buried residues involving
volume and polarity alterations
Similarity (ye)? 100 95 90 85 80
Observed substikrtions 12 34 65 124 206 Total number with volume ~ 1 9 24 57
change > 1 methyl group Total number with polarit,y 2 2 14 33 63
group change Hydrophobic/hydrophilic - - 1 I 1
substitutions
t Percentage similarity threshold of central residue environments (see eqn (1)).
the 20 types (ni = 10, i = 1 t,o 20), then X = 200 and the number of possible non-identical amino acid exchanges LY’ is:
(200 x 199) -xi (10 x 9) = 38,000.
If; for instance, 1000 substit,utions are observed (X = IOOO), the expected niej using eqn (2), is 2 x 1000 x 10 x 10/38,000 N 6. Assume that, for a given pair i-j (e.g.
Ala-Thr) the observed number of substitutions nA,a.Thr is 12, then if
P ~~a.~~r(1000,12)~q~,a~~hr(1000:13)+ + P Ala-& 1000,1000) 4 = 0.05
the substitution preference between Ala and Thr can be considered significant with at, least 95% confidence.
3. Results and Discussion
Table 2 lists the residue population for each of the amino acids in the three structural states examined for central residue substit.utions: (1) buried in the protein core (solvent-accessible surface for both residues I 10 A2); (2) exposed (solvent-accessible surface area 2 30 A2); and (3) ali the possible access- ibility states allowed. The residue pool represents, under the const.raint,s discussed in Data, and Methods, the composition of amino acids available for possible substitutions. These populations are important in calculating the substitution statistical significance (see Data and Methods).
In a previous paper (Bordo 6c Argos, 1990): substitution statistics were gathered from only one sequence family (globins) and for only buried residues. The buried exchange counts given here increased by at, least a factor of 5 from the addit’ion of eight, sequence families (Table 1). The basic trends observed were nonetheless conserved. The results in Table 3 make this salient. Very few of the total substitutions show volume changes greater than one methyl group (k 35 A3) and a, movement (referred to as a “jump”) to another polarity group (Grantham, 1974) where the three possible groups are defined (1 letter code used) by (WYFMCILV), (FATGS) and (HBRQDEN). These constraints imply considerable impact on the development of protein cores in structures maintaining main-chain fold; a detailed discussion can be found in the earlier work (Bordo & Argos, 1990). All ensuing work given here is unique to this report,
‘;Safe” Besidue Xubstitutions 725
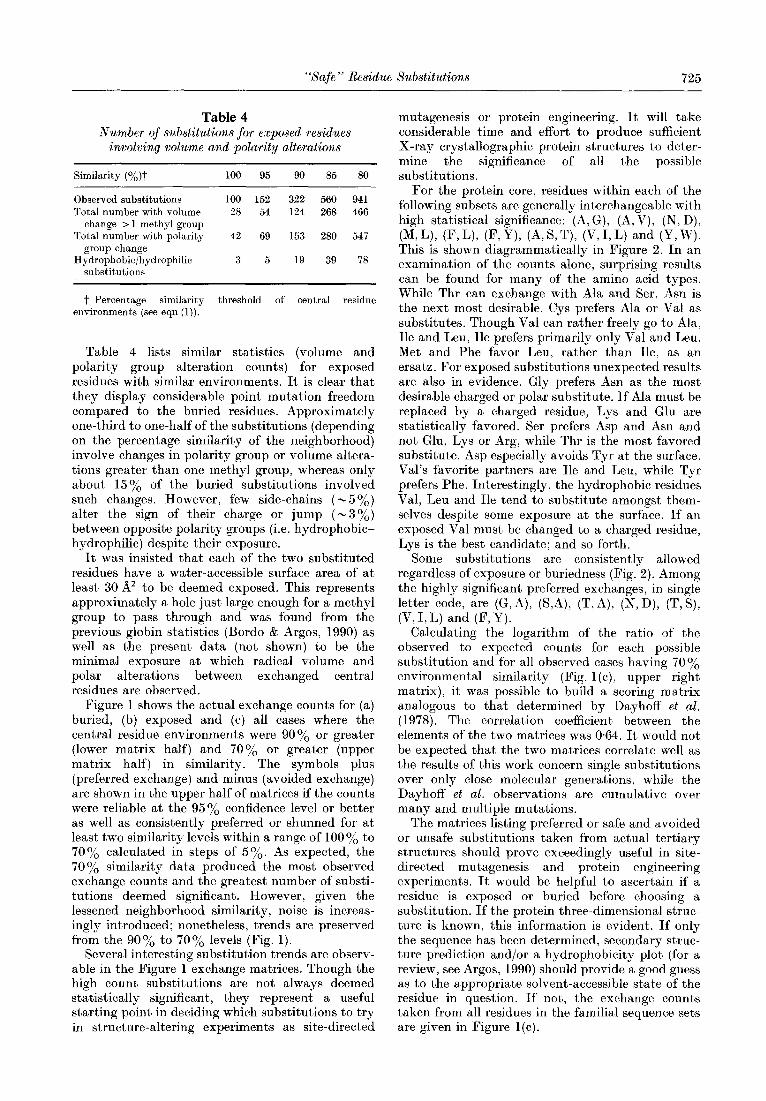
Table 4 Number of substitutions for exposed residues
involving volume and polarity alterations
Similarity (%)t
Observed substitutions Total number with volume
change > 1 methyl group
100 95 90 85 80
100 152 322 560 941 28 54 124 268 466
Total number with polarity group change
42 69 153 280 547
Hydrophobic/hydrophilic substitutions
3 5 19 39 78
t Percentage similarity threshold of central residue environments (see eqn (1)).
Table 4 lists similar statistics (volume and polarity group alteration counts) for exposed residues with similar environments. It is clear that they display considerable point mutation freedom compared to the buried residues. Approximately one-third to one-half of the substitutions (depending on the percentage similarity of the neighborhood) involve changes in polarity group or volume altera- tions greater than one methyl group, whereas only about 15% of the buried substitutions involved such changes. However, few side-chains (-5%) alter the sign of their charge or jump (-3%) between opposite polarity groups (i.e. hydrophobic- hydrophilic) despite their exposure.
It was insisted that each of the two substituted residues have a water-accessible surface area of at least 30 8’ to be deemed exposed. This represents approximately a hole just large enough for a methyl group to pass through and was found from the previous globin statistics (Bordo & Argos, 1990) as well as the present data (not shown) to be the minimal exposure at which radical volume and polar alterations between exchanged central residues are observed.
Figure 1 shows the actual exchange counts for (a) buried, (b) exposed and (c) all cases where the central residue environments were 90% or greater (lower matrix half) and 70% or greater (upper matrix half) in similarity. The symbols plus (preferred exchange) and minus (avoided exchange) are shown in the upper half of matrices if the counts were reliable at the 95% confidence level or better as well as consistently preferred or shunned for at least two similarity levels within a range of 100 y. to 70% calculated in steps of 5%. As expected, the 70% similarity data produced the most observed exchange counts and the greatest number of substi- tutions deemed significant. However, given the lessened neighborhood similarity, noise is increas- ingly introduced; nonetheless, trends are preserved from the 90% to 70% levels (Fig. 1).
Several interesting substitution trends are observ- able in the Figure 1 exchange matrices. Though the high count substitutions are not always deemed statistically significant, they represent a useful starting point in deciding which substitutions to try in structure-altering experiments as site-directed
mutagenesis or protein engineering. It will take considerable time and effort to produce sufficient X-ray crystallographic protein structures to deter- mine the significance of all the possible substitutions.
For the protein core, residues within each of the following subsets are generally interchangeable with high statistical significance: (A, G), (A, V), (N, D), (M,L), (F,L), P,Y), (A,S,T), (V,LL) and (Y,W). This is shown diagrammatically in Figure 2. In an examination of the counts alone, surprising results can be found for many of the amino acid types. While Thr can exchange with Ala and Ser, Asn is the next most desirable. Cys prefers Ala or Val as substitutes. Though Val can rather freely go to Ala, Ile and Leu, Ile prefers primarily only Val and Leu. Met and Phe favor Leu, rather than Ile, as an ersatz. For exposed substitutions unexpected results are also in evidence. Gly prefers Asn as the most desirable charged or polar substitute. If Ala must be replaced by a charged residue, Lys and Glu are statistically favored. Ser prefers Asp and Asn and not Glu, Lys or Arg, while Thr is the most favored substitute. Asp especially avoids Tyr at the surface. Val’s favorite partners are Ile and Leu, while Tyr prefers Phe. Interestingly, the hydrophobic residues Val, Leu and Ile tend to substitute amongst them- selves despite some exposure at the surface. If an exposed Val must be changed to a charged residue, Lys is the best candidate; and so forth.
Some substitutions are consistently allowed regardless of exposure or buriedness (Fig. 2). Among the highly significant preferred exchanges, in single letter code, are (G,A), (S,A), (T,A), (N,D), (T,S), (V, I, L) and (F, Y).
Calculating the logarithm of the ratio of the observed to expected counts for each possible substitution and for all observed cases having 70% environmental similarity (Fig. l(c), upper right matrix), it was possible to build a scoring matrix analogous to that determined by Dayhoff et al. (1978). The correlation coefficient between the elements of the two matrices was 0.64. It would not be expected that the two matrices correlate well as the results of this work concern single substitutions over only close molecular generations, while the Dayhoff et al. observations are cumulative over many and multiple mutations.
The matrices listing preferred or safe and avoided or unsafe substitutions taken from actual tertiary structures should prove exceedingly useful in site- directed mutagenesis and protein engineering experiments. It would be helpful to ascertain if a residue is exposed or buried before choosing a substitution. If the protein three-dimensional struc- ture is known, this information is evident. If only the sequence has been determined, secondary struc- ture prediction and/or a hydrophobicity plot, (for a review, see Argos, 1990) should provide a good guess as to the appropriate solvent-accessible state of the residue in question. If not, the exchange counts taken from all residues in the familial sequence sets are given in Figure l(c).

726 D. Rordo and P. Argos
1 GI Ai SI cf TI P! Dl VI NI LI II Qi Ml El H! K\ F{ RI YI W/ -----------___-__-_L------------------------------------------------------------------------------------ G 23tl 6 I 3 5 01 0 8- 0 A 9 I 18tl 4 13t 31 1 32t 3 s 51 11 16t 11 2 5 8 C 11 01 0 01 0 4 0 T 41 51 0 11 1 10 2 P 01 01 0 0 I 0 1 0 D iI !I 1 0 0 0 I 0 31 V 1 0 N 01 II 0 1 Ei t 0 L IO1 II 01 01 01 01 01 31 01
4 14
4 0
3 1 I 01 0 l- 8 3 I 01 0 5 3 0 I 01 0 3 1 0 I 01 0 1 6 0 I 4 01 0 2 0 0 I 0 01 0 1 0 0 I 0 01 0 0
39t 11 31 0 6 0 ; / 1 0 01 0 1
I 19+l 2 I 15ti 0 I 1 i 0 f 13t
0 1 0 0 0 0 0 0 0 0 1 0 0 0 1 1 0
0 0
01 0 21 0 II 1 01 0
3 0
0 0 0 3 1 4 1 1 1 0 0 0 6i 1
1
0 0 0 0 0 5 4 1 1 0 0 0 1 0 4t
0 34t
I II 1 0 I I 1 Ii 01 01 01 0 01 01 0 0 I 01 0
Ei 1 3 01 0 01 1
I 0
i / 01 i 01 0
oi oi 0 01 01 0 01 01 0
I GI A _------------
G I I 29t
I SI Cl TI PI D -- .-------------__________
VI Nl LI Ii QI MI El H I .----______________-------------------- .-_
71 11141 4
Kl FI RI Yl WI .------------__-_--------
33t1 1 53t1 2
I 1 0 I
211 0 61 0 91 0 21 0 71 0
20 3ot 80t
2
3 1 3 3 1 2 6 0 4 1
12 1 1 0 0
19 19-1 29
1 20
23 23 45
0 20 21
3 6
13 0
17 6- 7-
1 2 2 1 0 1 0 2 0 2 1 0
I I
I I I
I I
I -.
DI V ---------
34 I 16- 44t1 9- 33 1 63t 39 1 30- 59t1 31- 74+1 17-
01 6 01 3 29 I 48 47tl 32
~25112-116~ 7-
23 34t 35
0 38t 21 25- 15 32 14
7 29t
3 30
9
11 71 11 71 51 51 11 11 31 91 31 91 4-l 4-l 21 21 2-l 20 I 2-l 20 I 4-i 4-i 0 I 0 I YilI YilI 01 7-l 01 7-l 21 01 21 01
01 61 01 61 11 11 11 11 21 51 21 51 2-l 2-l 01 01 21 8; 21 8; 41 41 01 01 51 71 51 71 6-l 6-l 21 21
3ot1 1-I l- 261 51 5 50 I 6-l 4
3: I 1: I 1: 12 I 3-I 2 45tl 6 / 4
6 I 14+/ 141 1101 5
I A 8 S 10 C 0 T 2 P 3 D 2 V 1 N 7 L 0 I 0 Q 0 M 0 E 3 H 2 K 4 F 0 R 1 Y 0 W 0
17 0 9 5 2 2 3 1 1 3 0 6 1
10 0 1 1 0
20 34
0 30 11 17
7 18 13
6
2132t1 7 2 I 25 I 14 01 11 0 51251 7 11191 a l/42+1 4 li101 0
I I I I I I
bl I
11 I I I I I I
I .-- I
I I
M .---
6 11
6- 0
15 1
131 6 1 1 4 1 5 0 2 0 3 0 0
0 0 0 0 0 0 0 0 0 0 0
2 I 01 4 0” I 1
21 1 II 0 61 3 01 1 II 0 01 2 II 0
(b)
9'
0 1 1 0 0 0 0 1 0
8 7
23-1 1
3 1 0 0 0 1 3 3 2 4
2 11
1 6 1
284 1
0 0
1 3
/ i I 5
_/ “3- j lli I 3
1 0
-1
I Gl Al SI Cl TI P _------------------_------------- NI Ll II Q
_-----_-___-------_ Ei H
--------- 231 8 46tl 12 32 I 16
21 0 34 I 11 221 8
K I F! RI Yl WI .-------------------_s___ 3J. I 4-l 13 / 10-I 3 I 54 I 10-I 21 / 14 I 4 I 53 1 8-l 31 1 11-l 4 1
01 21 01 01 Ii 58+l 15 I 29 / 10-I 1 / 22 I 31 91 4-l 11
G A S C T P D V N L
:! M E H x F R Y W
23 14
0
79t/651 4 ~11Ot~ 8
351 I5 01 01
211431 0 101 71 0
45 I 25 73t1 35
12wj 40 71 4
I 31
7-l 19 24 I 39 16 / 46
31 1 29 I 42
3-l 11 9-i 19
77t1 13 8-l 20
45t1 21 I 8
0 I 31 1 21 9 01 0 01 8 2i 0 01 4 II 1 01 0
5 1 2 9 0 0 1 0 4 3 5 0 2 0 0
I 4 8 5 3 7 8 4 8 0
14 1 5 0 0
3 11 0 10 6 1
6 12 0 2 1 0 3 2 0 6 6 0 0 1 0 6 6 0 2 0 0
11 5 0 0 0 0 3 4 0 2 0 0 0 0 0
5 I 11 2 0 I 15 II 0 01 2 11 4 01 0 5 I 12 21 0 21 2 01 0 11 2 01 0 01 0
12-
1 7
17 4 2 3 0 2 0 2 2 0
61tl 9- 9-l 65t
I 13- 2 I 0 I 10 31 1 II 7 21 1 II 0 71 2 01 4 21 1 01 2 II 1
( c )
25 I 4-l 91 2-l 01 21 I 19 1 16 1 12 I O-l 36 I 7-1101 9-l 21 17 I 22 I 11 I 14 I 9 I
7-ii5i 6-i 6i 5j 3WI 2-1181 51 21 6 I 51 21 21 11
1-l 47t1 4 19 I 18 I 7
3 I 17 I 30+1 15
9i 9 I
./ 9 I 291 I 3 I
I 1; I 61 IO1
i 4 2-
10 3 4
1 0 2 1 0
i oi i 0 IO1 I O! / 15
31 6
0 9 1 0
10 I 5-l 0 i 31 81 21
38.f I 3-l 31 4-1 23+/ 9t1
I41 21 0 I I 12+1 01 I! I
I 3-
; 45- I
Figure 1. Observed substitutions for (a) buried, (b) exposed and (c) all cases. The lower halves of the matrices give substitution counts for central residues with 90 % or greater similar environments, while the upper halves are for 70% or greater similarity. When counts show a statistically meaningful (95% or greater confidence) increase or decrease compared to the expected figures for at least 2 similarity levels ranging from 100% to 70% in steps of 5%, with the trend being consistent, a + or - sign is given to indicate preferred or avoided substitutions, respectively. In the exposed data, immunogiobulin variable domains were not included.

‘;Safe” Residue Xubstitutions 727
Figure 2. Statistically preferred (95% or greater confi- dence level as indicated by a + in Fig. 1) substitutions observed in buried residues (grey segments) and exposed residues (black segments) are shown. Residues roughly equivalent are grouped together in 5 subsets, which generally correlate with side-chain physicochemical properties.
Lim & Sauer (1989) have performed mutation experiments on 2 repressor protein core side-chains and the mutants were assayed for functionality and stability. Interestingly, all of the single protein core mutants could have been predicted from this work (Bordo & Argos, 1990).
Site-directed mutagenesis is an important tool in probing the structural and functional significance of particular residues within a protein sequence (for reviews, see Knowles, 1987; Shaw, 1987). Amino acid residues might be altered to check for their participation in catalysis, cofactor or substrate binding, molecular and receptor recognition, domain interfaces, oligomeric interactions, and the like. It is essential in such experiments that the protein fold, locally and globally, not be perturbed; otherwise, loss of activity or whatever aspect is under study would be incorrectly ascribed to the mutated residue. “Safe” substitutions are thus requisite for the success of the mutant probe as an indicator of critical residues in structure and func- tion. This work provides exchange matrices that should be directly applicable in maintaining the fold and that are taken from known three-dimensional protein structures with diverse folds. Of course, the resulbs represent general trends and cannot be expected to work in every local context, but they should be a great improvement over randomly selected substitutions and act as a good guide regarding what to substitute and what not to substitute. For example, suppose Cys were a suspected active site residue. If exposed or buried, though the substitution data base is not sufficient to identify statistically significant exchanges for Cys, the observed substitutions counts would recom- mend Ala; if the Cys is likely to be buried, Val is also a possible candidate.
Zvelebil & Sternberg (1988) examined several known tertiary structures and determined that His is the most frequently occurring catalytic residue. Assuming its exposure to the solvent, the exchange matrix suggests Ser as the safest substitution. In the review by Shaw (1987) on specific point mutations for several molecular species, the Gly- Ala substitution is one of the most frequent mentioned. Apparently the proteins maintained their fold while proven assays displayed altered activity. The exchange matrices presented in this work suggest the Gly-Ala substitution as highly significant in the buried or exposed states.
In protein engineering as well as molecular modeling, where new structures are built from those with known tertiary and homologous primary struc- tures (for a review, see Sali et al., 1990), it is often crucial to know which residues can be substituted safely. Can a substituted residue in a molecular model be placed in the same environment displayed by the known native structure? For instance, if a His is to be introduced in an exposed loop to eng- ineer cation binding, would it be safer to substitute a Ser, Glu, Asn or Lys in the known structure? The exchange matrices of Figure 1 provide direct answers. In fact, Sali et al. (1990) in their review on modeling cite only two specific examples where residues are allowed limited choices due to folding requirements. Both involve constrained Se]-Thr substitutions in buried b-strands where the side- chain oxygen atoms bond to main-chain atoms. Among the preferred exchanges, the Ser-Thr one is highly preferred both in the exposed and buried substitutions matrices reported here (Fig. 2). A further protein engineering example would involve a desired residue substitution to stabilize a predicted or known helix. The exchange should be from a residue of lower to higher helical preference (Palau et al., 1982). Combining this requirement with the exchange matrix counts of Figure 1 should provide a very rational substitution, especially if the tertiary structure is not known, which is typic- ally the situation. For example, if Ile were buried and part of a helix is to be stabilized, the mat,rix of Figure 1 (a) suggests Leu and then Met as likely substitution candidates.
Malcolm et al. (1990) have published results of mutants of game bird lysozymes. Point mutations on in wivo triplets Thr40-IleX-Ser91 (TIS) or Ser40- Val55-Thr91 (SVT) included, respectively, TVS, SIS, TIT and SVS, SIT, TVT. The mutants were assayed for thermal stability and it was found that TIT, SIT and TVT were more stable than the respective wild-type and TVS, SIS and SVS less so. The buried-residue exchange matrices in this work would predict that Val + Ile and Ser + Thr would be ideal substitutions to preserve main-chain fold and enhance thermal stability under the assumption that increasing the volume of a side-chain within one methyl group would result in better hydro- phobic packing to maintain the protein structure. In every case, this is exactly what occurred experi- mentally. In fact, when the exchange from the wild-

728 D. Bordo and P. Argos
type involved it volume decrease, the fold was maintained but thermal stability diminished.
The authors thank Gareth Chelvanayagam, Jaap Heringa and Peter Sibbald for many helpful discussions.
References Alden, R. A., Birktoft, J. J., Kraut, J., Robertus, J. D. &
Wright, C. S. (1971). Biochem. Biophys. Res. Commun. 45, 337-449.
Amzel, L. M. & Poljak, R. (1979). Annu. Rev. Biochem. 48, 961-997.
Argos, P. (1990). Methods Enzymol. 182, 751-776. $rgos, P. & Rossmann, M. G. (1979). Biochemistry, 18,
4951-4960. Arnold, E. & Rossmann, M. G. (1988). Acta Crystallogr.
sect. A, 44, 270-282. Babu, Y. S., Bugg, C. E. C Cook, W. J. (1988). J. Mol.
Biol. 204, 191-204. Bashford, D., Chothia, C. & Lesk, A. M. (1987). J. Mol.
Biol. 196, 199-216. Bernstein, F. C., Koetzle, T. F., Williams, G. J. B., Meyer,
E. F., Brice: M. D., Rodgers, J. R., Kennard, O., Schimanouchi, T. & Tasumi, M. (1977). J. Mol. Biol. 112, 535-542.
Bode, W., Chen, Z., Bartels, K.; Kutzbach, C., Schmidt- Kastner, G. & Bartunik, H. (1983). J. Mol. Biol. 164, 237-282.
Bode, W., Papamokos, E., & Musil, D. (1987). Eur. J. Biochem. 166, 673-692.
Bordo, D. & Argos, P. (1990). J. Mol. Biol. 211, 975-988. Bryant, S. H., Amzel, L. M., Phizackerley, R. P. &
Poljak, R. J. (1985). Acta Crystallogr. sect. B, 41, 362-368.
Chothia, C. & Lesk, A. M. (1986). EMBO J. 5, 823-826. Craik, C. S., Rutter, W. R. & Fletterick, R. (1983).
Science, 220, 11251129. Dayhoff, M. O., Schwartz, R. M. & Orcutt, B. C. (1978).
Atlas of Protein Sequence and Structure, vol. 5, suppl. 3, pp. 345-362. National Biochemical Foundation, Georgetown University Medical Center, Washington, DC.
Deisenhofer, J. (1981). Biochemistry, 20, 2361-2370. Dickerson, R. E. (1980). Sci. Amer. 242, 98-112. Epp, O., Lattman, E. E., Schiffer, M., Huber, R. & Palm,
W. (1975). Biochemistry, 14, 4943-4952. Fermi, G.; Perutz, M. F., Shaanan, B. & Fourme, R.
(1984). J. Mol. Biol. 175, 159-174. Frier, J. A. & Perutz, M. F. (1977). J. Mol. BioZ. 112,
97-112. Froemmel, C. & Sander, C. (1989). Proteins, 5, 22-37. Fujinaga, M. & James, M. N. G. (1987). J. Mol. Biol. 195,
373-396. Fujinaga, M.; Delbaere, L. T. J., Brayer, G. D. & James,
M. N. G. (1985). J. Mol. Biol. 84, 479-502. Furey, W., Jr, Wang, B. C., Yoo, C. S. & Sax, M. (1983).
J. Mol. Biol. 167, 661-692. Grantham, R. (1974). Science, 185, 862-864. Gruetter, M. G., Gray, T. M.; Weawer, L. H., Alber, T.:
Wilson, K. & Matthews, B. W. (1987). J. Mol. Biol. 197, 315-329.
Hendrickson, W. A., Love, W. E. & Karle, J. (1973). J. Mol. BioZ. 74, 331-361.
Hopper, P., Harrison, S. C. & Sauer, R. T. (1984). J. Mol. Biol. 177, 701-713.
James, M. N. G. & Sielecki, A. R. (1983). J. Mol. Biol. 163, 299-361.
Jones, ‘I. A. & Liljas, L. (1984). J. Mol. BioZ. 177: 735-767.
Kabsch, W. & Sander, C. (1983). Biopolymers, 22, 2X- 2637.
Knowles, J. R. (1987). Science, 236, 1252-1258. Korn, 6. A. et Korn, T. M. (1968). Mathematicd
Handbook for Scientists and Engineers, pp. 10-l 1. McGraw-Hill Book Company, New York.
Ladner, R. C., Heidner, E. G. & Perutz, M. F. (1977). J. Mol. Biol. 114, 385-414.
Lascombe, M. B., Alzari, P. M., Boulot, G., Saludjian, P., Tougard, P., Berek, C., Haba, S., Rosen, E. M., Nisonoff, A. & Poljak, R. J. (1989). Proc. Nat. Acad. Sci., U.S.A. 86, 607-611.
Lesk, A. M. & Chothia, C. (1980). J. hfolol. BioZ. 136: 225-270.
Lesk, A. M. & Chothia, C. (1982). J. MoZ. Biol. 160, 325-342.
Lim, W. A. & Sauer, R. T. (1989). Nature (London], 339, 31-36.
Love, R. A. & Xtroud, R. M. (1986). Protein Eng. 1. 37-46.
Luo, M., Vriend, G., Kamer, G., Minor, I., Arnold, E., Rossmann, M. G., Boege, U., Scraba, D. G., Duke, G. M. & Palmenberg, A. C. (1987). Science, 235, 182-191.
Malcom, B. A., Wilson, K. P., Matthews, B. W., Kirsh, J. F. & Wilson, A. C. (1990). Nature (London), 345, 86-89.
Marquart, M., Deisenhofer, J., Huber, R. & Palm, W. (1980). J. Mol. Biol. 141: 369-391.
Marquart, M., Walter, J., Deisenhofer, J., Bode, W. 8: Huber, R. (1983). Acta Crystallogr. sect. B, 39. 480-490.
Matsuura, Y., Takano, T. & Dickerson, R. E. (1982). J. Mol. Biol. 156, 389-409.
IMyer, E., Cole, G.; Radhakrishnan, R. & Epp, 0. (1988). Acta Crystallogr. sect. B; 44, 26-38.
Moews, P. C. & Kretsinger, R. H. (1975). ./. Mol. Bioi. 91; 201-228.
Moult,, J., Sussman, F. & James, M. N. G. (1985). J. lwol. Biol. 182, 555-566.
Navia, M. A., Segal, D. M., Padlan, E. A., Davies, D. R.. Rao, N., Rudikoff, S. $ Potter, M. (1979). Proc. Nat. Acad. Sci., U.S.A. 76, 4071-4074.
Ochi, H., Hata, Y., Tanaka, Iv., Kakudo, M., Sakurai, T.; Aihara, S. & Morita, Y. (1983). J. Mol. BioZ. 164, 407-41s.
Paehler, A.; Banerjee, A., Dattagupta, J. K., Fujiwara, T., Lindner, K., Pal, G. P., Suck, D.. Weber, G. & Saenger, W. (1984). EMBO J. 3, 1311-1314.
Palau, J., Argos, P. t Puigdomenech, P. (1982). Int. J. Protein Pept. Res. 91, 394-401.
Pearl, I,. & Blundell, ‘I’. (1984). FEBS Letters, 174, 96-111.
Phillips, S. E. V. (1980). J. Mol. Biol. 142, 531-554. Read, R. J. & James, M. N. G. (1988). J. hfol. Biol. 200,
523-551. Read, R. J., Fujinaga, M., Sielecki, A. R. & James,
N. RI. G. (1983). Biochemistry, 22, 4420-4433. Remington, S. J., Woodbury, R. G. & Reynolds, R. A.
(1988). Biochemistry, 27, 809778105. Rossmann, M. G. & Argos, P. (1976). J. Mol. Biol. 105,
75-95. Rossmann: M. G. & Argos; P. (1977). J. MOE. BioE. 109.
99-129. Rossmann, M. G. & Argos, P. (1981). Annu. Rev. Biochem.
50, 497-532. Rossman, M. G.. Abad-Zapatero, C., Murthy, M. R,. N.,

“Safe” Residue Substitutions 729
Liljas, L., Jones, T. A. & Strandberg, B. (1983). J. Mol. Biol. 165, 711-736.
Salemme, F. R., Freer, S. T., Xuong, N. H., Alden, R. A. & Kraut, J. (1973). J. Biol. Chem. 248, 3910-3921.
Sali, A., Overington, J. P., Johnson, M. S. & Blundell, T. L. (1990). Trends Biochem. Sci. 15, 235240.
Satyshur, K. A., Sambhrao, S. T., Pyzalska, D., Drendel, W., Greaser, M. C Sundaralingan, M. (1988). J. Biol. Chem. 263, 16281647.
Steigemann, W. & Weber, E. (1979). J. Mol. Biol. 127, 309-338.
Suguna, K., Bott, R. R., Padlan, E. A., Subramanian, E., Sheriff, S., Cohen, G. H. & Davies, D. R. (1987). J. Mol. Biol. 196, 877-900.
Szebenyi, D. M. & Moffat, K. (1986). J. Biol. Chem. 261, 8761-8777.
Saul, F. A., Amzel, L.M. & Poljak, R. J. (1978). J. Biol. Chem. 253, 585-597.
Scouloudi, H. & Backer, E. N. (1978). J. Mol. Biol. 126, 637-660.
Takano, T. & Dickerson, R. E. (1980). Proc. Nat. Acad. Sci., U.S.A. 77, 6371-6375.
Tanaka, N., Yamane, T., Tsukihara, T., Ashida, T. & Kakudo, M. (1975). J. Biochem. 77, 147-162.
Timkovich, R. $ Dickerson, R. E. (1976). J. Biol. Chem.
251, 4033-4046. Segal, D. I.-.; Padlan, E. A., Cohen, G. H., Rudikoff, S.,
Potter, M. & Davies, D. R. (1974). Proc. Nut. Acad. Sci., U.S.A. 71, 4298-4302.
Shaw, W. V. (1987). Biochem. J. 246, 1-17. Sheriff, S., Silverton, E. W., Padlan, E. A., Cohen, G. H.,
Smith-Gill, S. J., Finzel, B. C. & Davies, D. R. (1987). Proc. Nat. Acad. Sci., U.S.A. 84, 8075-8079.
Silva, A. M. & Rossmann, M. G. (1985). Acta CrystaZZogr. sect. B, 41, 147-157.
Tsernoglou, D., Petsko, G. A. & Hudson, R. A. (1978). Mol. Pharmacol. 14, 710-716.
Tsukada, H. $ Blow, D. M. (1985). J. Mol. Biol. 184, 703-711.
Vainshtein, B. K., Arutyunyan, E. G., Kuranova, I. P.; Borisov, V. V., Sosfenov, N. I., Pavlovskii, A. G., Grebenko, A. I., Konareva, N. V. & Nekrasov, Y. V. (1977). Dokl. Biochem. (English translation), 233, 67-70.
Sprang, S., Standing, T., Fletterick, R. J., Stroud, R. M., Walkinshaw, M. D., Saenger, W. & Maelicke, A. (1980). Finer-Moore, J., Xuong, N. H., Hamlin, R., Proc. Nat. Acad. Sci., U.S.A. 77, 2400-2404. Rutter, W. J. $ Craik, C. S. (1987). Science, 237, Zvelebil, M. J. J. M. & Sternberg, M. J. E. (1988). Protein 905-909. Eng. 2, 127-138.
Edited by A. Fersht