Sugarcane Selection for Sucrose and Tonnage Using Economic...
7
FE476 Sugarcane Selection for Sucrose and Tonnage Using Economic Criteria 1 José Alvarez, Chris W. Deren, and Barry Glaz 2 1. This is EDIS document FE476, a publication of the Department of Food and Resource Economics, Florida Cooperative Extension Service, UF/IFAS, University of Florida, Gainesville, FL. Published May 2004. Reviewed August 2009. This publication is also part of the Florida Sugarcane Handbook, an electronic publication of the Department of Agronomy, University of Florida, Gainesville, FL. For more information, you may contact the editor of the Sugarcane Handbook, Ronald W. Rice ([email protected]).Visit the EDIS Web site at http://edis.ifas.ufl.edu. 2. José Alvarez, Professor, Department of Food and Resource Economics, Everglades Research and Education Center, Belle Glade, FL, Florida Cooperative Extension Service, UF/IFAS, University of Florida; Chris W. Deren, Director, Rice Research and Extension Center, University of Arkansas, Stuttgart, AR; Barry Glaz, Research Agronomist, United States Department of Agriculture, Agricultural Research Service, Sugarcane Field Station, Canal Point, FL. The Institute of Food and Agricultural Sciences (IFAS) is an Equal Opportunity Institution authorized to provide research, educational information and other services only to individuals and institutions that function with non-discrimination with respect to race, creed, color, religion, age, disability, sex, sexual orientation, marital status, national origin, political opinions or affiliations. U.S. Department of Agriculture, Cooperative Extension Service, University of Florida, IFAS, Florida A. & M. University Cooperative Extension Program, and Boards of County Commissioners Cooperating. Millie Ferrer-Chancy, Interim Dean Introduction Plant breeders select an array of traits or characteristics to select cultivars. The value of each trait varies in its contribution to the selection process: some characteristics are more important than others. Usually, the relative importance of simultaneously selected traits is determined primarily by the intuition of the breeder. Although the development of selection indices, which weigh characteristics for simultaneous selection, has been done more frequently in animal breeding, it has also been used in sugarcane (Miller, et al. 1978; Simmonds and Walker, 1986; Deren, et al. 1995). In sugarcane, the trait of primary concern is the yield of tons of sugar per acre (TSA), which is determined by the sucrose concentration (SC) of the cultivar and the yield of tons of sugarcane per acre (TCA). Sometimes, however, clones with high TCA have low SC and vice versa. This seems logical. If a plant is able to fix a certain amount of carbon, it can partition photosynthate into structural carbohydrates (the primary component of TCA after water), or it can produce sucrose. Increasing one would be at the expense of the other. A negative correlation between SC and TCA, however, has not been clearly demonstrated on populations of elite clones. Kang, et al. (1983) found a weak correlation but nevertheless concluded in a subsequent paper (Kang, et al., 1989) that it did not appear that the investment of photosynthate in fiber reduced that which was available for sucrose. Brown, et al. (1969) and Mariotti (1972) found the correlation between cane yield and sucrose concentration to be negligible. From these results, Hogarth (1987) concluded that the selection for one “would not have a disastrous effect on the other”; thus recognizing the existence of a moderate negative correlation between tonnage and sucrose. SC and TCA also contribute to TSA with different economic effects. Increasing TSA by raising TCA will increase production costs related to harvesting, transporting, and milling. Thus, the method used to boost TSA (through SC or TCA increases) will affect the economics of growing a cultivar and its subsequent value to the industry. Archival copy: for current recommendations see http://edis.ifas.ufl.edu or your local extension office.
Transcript of Sugarcane Selection for Sucrose and Tonnage Using Economic...

FE476
Sugarcane Selection for Sucrose and Tonnage Using Economic Criteria1
José Alvarez, Chris W. Deren, and Barry Glaz2
1. This is EDIS document FE476, a publication of the Department of Food and Resource Economics, Florida Cooperative Extension Service, UF/IFAS, University of Florida, Gainesville, FL. Published May 2004. Reviewed August 2009. This publication is also part of the Florida Sugarcane Handbook, an electronic publication of the Department of Agronomy, University of Florida, Gainesville, FL. For more information, you may contact the editor of the Sugarcane Handbook, Ronald W. Rice ([email protected]).Visit the EDIS Web site at http://edis.ifas.ufl.edu.
2. José Alvarez, Professor, Department of Food and Resource Economics, Everglades Research and Education Center, Belle Glade, FL, Florida Cooperative Extension Service, UF/IFAS, University of Florida; Chris W. Deren, Director, Rice Research and Extension Center, University of Arkansas, Stuttgart, AR; Barry Glaz, Research Agronomist, United States Department of Agriculture, Agricultural Research Service, Sugarcane Field Station, Canal Point, FL.
The Institute of Food and Agricultural Sciences (IFAS) is an Equal Opportunity Institution authorized to provide research, educational information and other services only to individuals and institutions that function with non-discrimination with respect to race, creed, color, religion, age, disability, sex, sexual orientation, marital status, national origin, political opinions or affiliations. U.S. Department of Agriculture, Cooperative Extension Service, University of Florida, IFAS, Florida A. & M. University Cooperative Extension Program, and Boards of County Commissioners Cooperating. Millie
Ferrer-Chancy, Interim Dean
Introduction
Plant breeders select an array of traits or characteristics to select cultivars. The value of each trait varies in its contribution to the selection process: some characteristics are more important than others. Usually, the relative importance of simultaneously selected traits is determined primarily by the intuition of the breeder. Although the development of selection indices, which weigh characteristics for simultaneous selection, has been done more frequently in animal breeding, it has also been used in sugarcane (Miller, et al. 1978; Simmonds and Walker, 1986; Deren, et al. 1995).
In sugarcane, the trait of primary concern is the yield of tons of sugar per acre (TSA), which is determined by the sucrose concentration (SC) of the cultivar and the yield of tons of sugarcane per acre (TCA). Sometimes, however, clones with high TCA have low SC and vice versa. This seems logical. If a plant is able to fix a certain amount of carbon, it can partition photosynthate into structural carbohydrates (the primary component of TCA after water), or it
can produce sucrose. Increasing one would be at the expense of the other.
A negative correlation between SC and TCA, however, has not been clearly demonstrated on populations of elite clones. Kang, et al. (1983) found a weak correlation but nevertheless concluded in a subsequent paper (Kang, et al., 1989) that it did not appear that the investment of photosynthate in fiber reduced that which was available for sucrose. Brown, et al. (1969) and Mariotti (1972) found the correlation between cane yield and sucrose concentration to be negligible. From these results, Hogarth (1987) concluded that the selection for one “would not have a disastrous effect on the other”; thus recognizing the existence of a moderate negative correlation between tonnage and sucrose.
SC and TCA also contribute to TSA with different economic effects. Increasing TSA by raising TCA will increase production costs related to harvesting, transporting, and milling. Thus, the method used to boost TSA (through SC or TCA increases) will affect the economics of growing a cultivar and its subsequent value to the industry.
Archival copy: for current recommendations see http://edis.ifas.ufl.edu or your local extension office.
Sugarcane Selection for Sucrose and Tonnage Using Economic Criteria 2
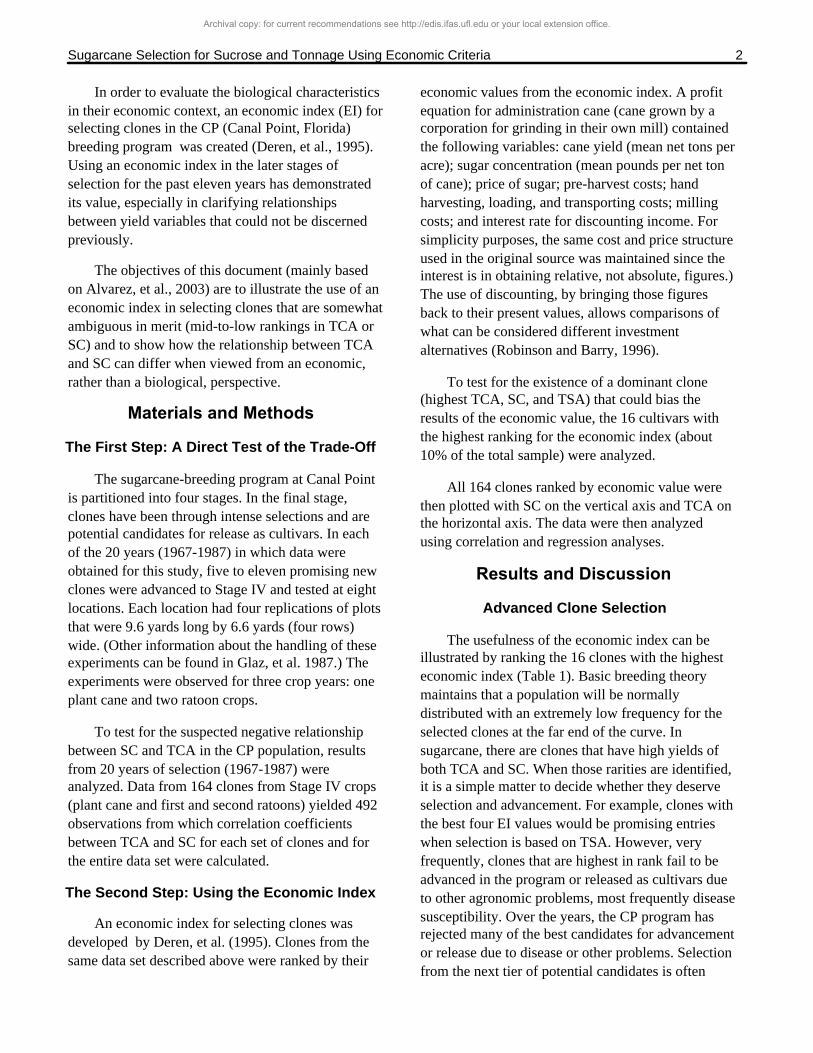
In order to evaluate the biological characteristics in their economic context, an economic index (EI) for selecting clones in the CP (Canal Point, Florida) breeding program was created (Deren, et al., 1995). Using an economic index in the later stages of selection for the past eleven years has demonstrated its value, especially in clarifying relationships between yield variables that could not be discerned previously.
The objectives of this document (mainly based on Alvarez, et al., 2003) are to illustrate the use of an economic index in selecting clones that are somewhat ambiguous in merit (mid-to-low rankings in TCA or SC) and to show how the relationship between TCA and SC can differ when viewed from an economic, rather than a biological, perspective.
Materials and Methods
The First Step: A Direct Test of the Trade-Off
The sugarcane-breeding program at Canal Point is partitioned into four stages. In the final stage, clones have been through intense selections and are potential candidates for release as cultivars. In each of the 20 years (1967-1987) in which data were obtained for this study, five to eleven promising new clones were advanced to Stage IV and tested at eight locations. Each location had four replications of plots that were 9.6 yards long by 6.6 yards (four rows) wide. (Other information about the handling of these experiments can be found in Glaz, et al. 1987.) The experiments were observed for three crop years: one plant cane and two ratoon crops.
To test for the suspected negative relationship between SC and TCA in the CP population, results from 20 years of selection (1967-1987) were analyzed. Data from 164 clones from Stage IV crops (plant cane and first and second ratoons) yielded 492 observations from which correlation coefficients between TCA and SC for each set of clones and for the entire data set were calculated.
The Second Step: Using the Economic Index
An economic index for selecting clones was developed by Deren, et al. (1995). Clones from the same data set described above were ranked by their
economic values from the economic index. A profit equation for administration cane (cane grown by a corporation for grinding in their own mill) contained the following variables: cane yield (mean net tons per acre); sugar concentration (mean pounds per net ton of cane); price of sugar; pre-harvest costs; hand harvesting, loading, and transporting costs; milling costs; and interest rate for discounting income. For simplicity purposes, the same cost and price structure used in the original source was maintained since the interest is in obtaining relative, not absolute, figures.) The use of discounting, by bringing those figures back to their present values, allows comparisons of what can be considered different investment alternatives (Robinson and Barry, 1996).
To test for the existence of a dominant clone (highest TCA, SC, and TSA) that could bias the results of the economic value, the 16 cultivars with the highest ranking for the economic index (about 10% of the total sample) were analyzed.
All 164 clones ranked by economic value were then plotted with SC on the vertical axis and TCA on the horizontal axis. The data were then analyzed using correlation and regression analyses.
Results and Discussion
Advanced Clone Selection
The usefulness of the economic index can be illustrated by ranking the 16 clones with the highest economic index (Table 1). Basic breeding theory maintains that a population will be normally distributed with an extremely low frequency for the selected clones at the far end of the curve. In sugarcane, there are clones that have high yields of both TCA and SC. When those rarities are identified, it is a simple matter to decide whether they deserve selection and advancement. For example, clones with the best four EI values would be promising entries when selection is based on TSA. However, very frequently, clones that are highest in rank fail to be advanced in the program or released as cultivars due to other agronomic problems, most frequently disease susceptibility. Over the years, the CP program has rejected many of the best candidates for advancement or release due to disease or other problems. Selection from the next tier of potential candidates is often
Archival copy: for current recommendations see http://edis.ifas.ufl.edu or your local extension office.
Sugarcane Selection for Sucrose and Tonnage Using Economic Criteria 3
much less clear. Clones with EI ranks of 5 and 6 would have ranked 13 and 16 in TSA, essentially eliminating them from further consideration. Similarly, the clone with a TSA rank of 6 would have merited consideration, but when viewed from the EI standpoint, it had an unacceptable ranking of 14. Thus, weighting clones based on economic values, rather than by TSA, results in a different array of clones being selected for advancement.
Correlating SC and TCA
The test for a correlation between TCA and SC in the CP breeding population did not demonstrate a consistent negative relationship. For example, Stage IV selections for some years had negative correlations between TCA and SC, yet other years did not (data not presented.) When the whole data set was analyzed, there was no significant negative correlation.
The implications of this result are encouraging in that they imply that selecting high SC clones does not preclude their having high cane yield. Kang, et al. (1983) concluded similarly that both traits could be selected simultaneously, and indeed breeders do this. However, different results may occur in a different, more variable population. Stage IV clones are rigidly selected for TCA and SC, so the variability for these traits in the population of combined Stage IV data may be lower than that of a population that has not had such intense selection pressure. In addition, the U.S. sugarcane breeding program (and very likely those worldwide) has a relatively narrow genetic base (Deren, 1995). It seems reasonable to assume that a widely diverse population of Saccharum parents (S. spontaneum, S. robustum, S. officinarum, and commercial clones) might show a negative correlation between sucrose and tonnage. Thus, these results must be interpreted with the caveat that plant breeders often invoke: conclusions regarding a population are for that population, and are not necessarily applicable to others. The results, however, are probably true for clones of most breeding programs.
No dominant variable was found among the yield parameters used in the index equation (Table 1). For example, when looking at the top-ranked cultivars, the close associations of the four parameters (economic ranking and yield rankings are
high) are found in CP 78-1247, which is EV1 (economic value, rank # 1), TCA7, SC2, and TSA2; and in CP 82-1172, which is EV3, TCA2, SC9, and TSA1. Most cultivars, however, show fluctuating economic and yield rankings. For example, CP 78-1599 is EV6, TCA16, SC1, and TSA16, while CP 65-357 is EV7, TCA1, SC16, and TSA3. Therefore, the economic ranking is independent of any particular parameter included in the formula.
The scatter diagram of the 164 cultivars with economic ranks plotted by SC and TCA provided a different perspective on the relationship of yield components than was obtained from simple correlations (Figure 1). One detectable trend was that cultivars tended to arrange in descending order of economic ranking from the upper right to the bottom left of the graph. That is, clones with the highest economic ranking fell on the upper right, while those with the lowest appeared on the bottom left of the diagram.
A second result was that any consecutively ranked subset of the clones showed a negative relationship between TCA and SC (Figure 2). To illustrate, we chose three groups. The first group (upper right) included EV1 through EV31; the second group (middle) included EV32 through EV135; and the third group (bottom left) contained EV136 through EV164.
The results of the statistical analyses are shown in Table 2. Consistent negative signs for the three correlation and regression (b) coefficients indicate the existence of the negative relationship. In Group 1, on average, 0.448 kilogram (kg) of sugar per tonne (0.896 pound per ton) is “sacrificed” for every additional net ton of cane obtained (Table 2). The numbers for Group 3 are very similar to those in Group 2: every net ton of cane gained is at the expense of 0.285 kilogram of sugar per tonne (0.57 pound per ton). Relatively high coefficients of determination (R2) were obtained for these data.
Conclusions
Since 1992, the Canal Point sugarcane breeding program has included the economic index as one of the variables for selecting clones. While no single variable will determine selection, the economic index
Archival copy: for current recommendations see http://edis.ifas.ufl.edu or your local extension office.

Sugarcane Selection for Sucrose and Tonnage Using Economic Criteria 4
Figure 1. Relationship between TCA and SC ranked by economic index.
Figure 2. Negative relationship between sucrose and tonnage found in group 1 (EV1-EV31).
Archival copy: for current recommendations see http://edis.ifas.ufl.edu or your local extension office.

Sugarcane Selection for Sucrose and Tonnage Using Economic Criteria 5
was found to be very useful in balancing the SC and TCA yield variables. In Florida, clones which have greater SC can be more profitable than clones which have greater sugar yield (TSA) but achieve it through greater tonnage (TCA). In short, some “sweeter” clones will be more profitable, even if their yield of sugar per acre is less.
The negative correlation between the TCA and SC identified in the second step of this analysis was due to the economic index. However, sugarcane is not grown for its biological traits; it is grown for profit, and the evaluation of its biological variables is based on how they enhance profits. Hence, although the use of the economic index may distort the biological relationship, it also clarifies it by allowing breeders to view the relationship according to its impact on profits.
References
Alvarez, J., C.W. Deren, and B. Glaz. 2003. Sugarcane Selection for Sucrose and Tonnage Using Economic Criteria. Proceedings of the Sugar Cane International Conference. November-December 6-10.
Brown, A.H.D., J. Daniels, J., and B.D.H. Latter. 1969. Quantitative Genetics of Sugarcane. II. Correlation Analysis of Continuous Characters in Relation to Hybrid Sugarcane Breeding. Theoretical and Applied Genetics 39:1-10.
Deren, C.W. 1995. Genetic Base of U.S. Mainland Sugarcane. Crop Science 35:1195-1199.
Deren, C.W., J. Alvarez, and B. Glaz. 1995. Use of Economic Criteria for Selecting Clones in a Sugarcane Breeding Program. Proceedings of the International Society of Sugar Cane Technology 21(2):437-447.
Glaz, B., J.D. Miller, P.Y.P. Tai, J.L. Dean, and O. Sosa, Jr. 1987. Evaluation of New Canal Point Sugarcane Clones, 1986-87 Harvest Season. Agricultural Research Service, United States Department of Agriculture, Washington, D.C. (September).
Hogarth, D.M. 1987. Genetics of Sugarcane, in Sugarcane Improvement Through Breeding, edited by D.J. Heinz, pp. 255-271. New York: Elsevier.
Kang, M.S., J.D. Miller, P.Y.P. Tai. 1983. Genetic and Phonotypic Path Analysis and Heritability in Sugarcane. Crop Science 23:643-647.
Kang, M.S., O. Sosa, O., and J.D. Miller. 1989. Path Analysis for Percent Fiber in Cane and Sugar Yield in Sugarcane. Crop Science 29:1481-1483.
Mariotti, J.A. 1972. Association among Yield and Quality Components in Sugarcane Hybrid Progenies. Proceedings of the International Society of Sugar Cane Technology 14:297
Miller, J.D., N.I. James, and P.M. Lyrenne. 1978. Selection Indices in Sugarcane. Crop Science 18:369-372.
Robison, L.J., and P. Barry. 1996. Present Value Models and Investment Analysis. Northport, AL: The Academic Page.
Simmonds, N.W., and D.I.T. Walker. 1986. An Economic Selection Index for Sugar Cane Breeding. Euphytica 35:311-317.
Archival copy: for current recommendations see http://edis.ifas.ufl.edu or your local extension office.

Sugarcane Selection for Sucrose and Tonnage Using Economic Criteria 6
Table 1. Comparisons of Canal Point (CP) sugarcane clones ranking highest for economic index (EI) and their respective values.
CP Clone Economic Index(EI)
Total Cane Per Acre
(TCA)
Sucrose Concentration
(SC)
Total Sugar Per Acre
(TSA)
$/acre Rank ton/acre Rank lb/ton Rank ton/acre Rank
78-1247 2618 1 52.182 7 248.6 2 6.49 2
78-1628 2422 2 51.335 11 243.2 3 6.24 4
82-1172 2327 3 55.928 2 250.8 9 6.52 1
68-1067 2255 4 52.137 8 233.8 8 6.15 7
78-1156 2214 5 48.703 14 240.8 5 5.86 13
78-1599 2212 6 43.485 16 253.8 1 5.50 16
65-357 2204 7 57.177 1 224.0 16 6.40 3
78-1610 2178 8 52.271 6 232.6 10 6.08 8
82-1592 2161 9 52.985 4 231.0 12 6.12 5
82-2043 2159 10 49.283 13 238.4 6 5.88 12
78-2114 2150 11 51.691 10 232.0 11 5.99 10
78-1263 2142 12 49.863 12 234.8 7 5.86 14
68-1026 2135 13 52.316 5 230.4 13 6.02 9
78-1140 2131 14 53.788 3 227.2 15 6.11 6
81-1254 2122 15 51.959 9 230.2 14 5.98 11
82-1575 2108 16 46.964 15 243.0 4 5.71 15
Archival copy: for current recommendations see http://edis.ifas.ufl.edu or your local extension office.

Sugarcane Selection for Sucrose and Tonnage Using Economic Criteria 7
Table 2. Statistical information, from the equations Y=a–bX, and other characteristics pertaining to the three groups identified in the sample.
Group 1(EV1 – EV31)
Group 2(EV32 – EV135)
Group 3(EV136 – EV164)
Item
Number of data points 31 103 29
Minimum value 100 95.7 91.3
Maximum value 128.1 126.9 112.4
Average 116.3 108.11 100.45
Median 116 107.8 100.3
Standard deviation 5.98 6.16 5.09
Correlation coefficient –0.88 –0.65 –0.74
P <0.01 <0.01 <0.01
R2 0.78 0.43 0.55
P <0.01 <0.01 <0.01
a coefficient 167.73 138.12 125.49
b coefficient –0.448 –0.293 –0.285
Economic Value
Maximum ($) 6,469 4,724 2,844
Minimum ($) 4,837 2,845 1,704
Economic Rank (Range) 1 – 31 32 – 135 136 – 164
Archival copy: for current recommendations see http://edis.ifas.ufl.edu or your local extension office.