Sue Easton Town & Regional Planning University of Sheffield.
19
Exploring the value of education within local housing markets: Sheffield, a case study Sue Easton Town & Regional Planning University of Sheffield
-
Upload
emmeline-austin -
Category
Documents
-
view
228 -
download
2
Transcript of Sue Easton Town & Regional Planning University of Sheffield.

Exploring the value of education within local
housing markets: Sheffield, a case study
Sue EastonTown & Regional PlanningUniversity of Sheffield

Intro to the project
Background
◦ The value of schools
◦ Accessibility and socioeconomic status
Research questions
Methods
Findings
Overview / structure

ESRC Secondary Data Analysis Initiative (18 months)
Pupil census and parental preference data shared by local authority under strict data-sharing contract
www.traveltoschoolproject.org.uk
Sheffield Travel to School Project

Leech and Campos (2001) average additional increase for good secondary school catchment in Coventry: £10,000 - £20,000 (16-20%) on the average house in July 2000.
Gibbons and Machin (2003) 1% increase in primary school performance (Key Stage 2) associated with a £90 increase in mortgage fees per child.
Cheshire and Sheppard (2004) relationship non-linear, differed between primary & secondary schools. £42,541 (33.5%) between best and worst primary schools in Reading (2000)
Background – Hedonic Models
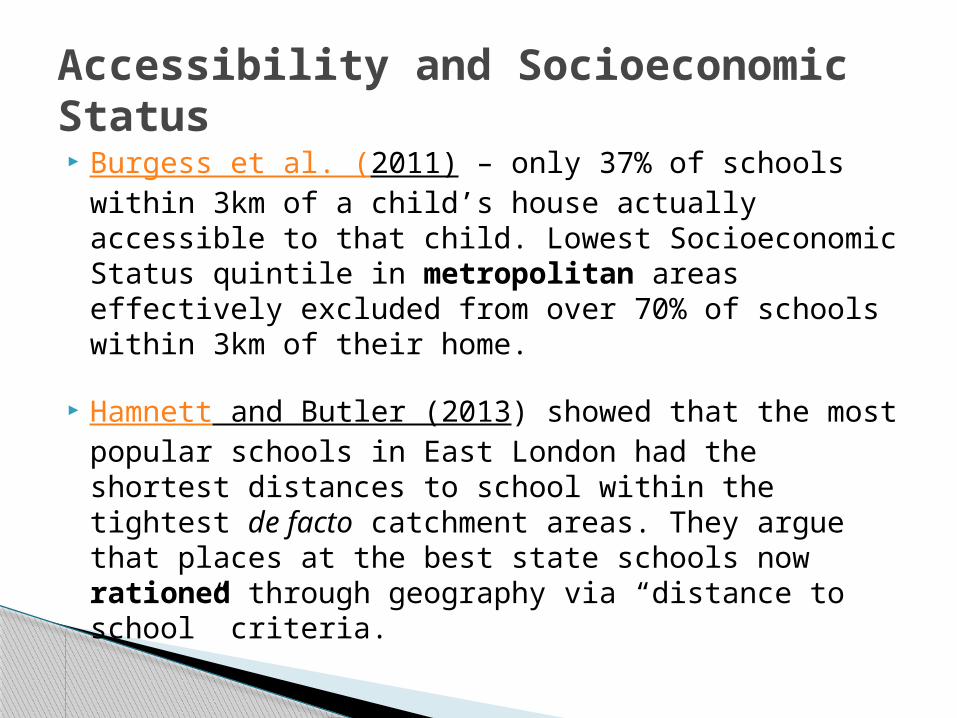
Burgess et al. (2011) – only 37% of schools within 3km of a child’s house actually accessible to that child. Lowest Socioeconomic Status quintile in metropolitan areas effectively excluded from over 70% of schools within 3km of their home.
Hamnett and Butler (2013) showed that the most popular schools in East London had the shortest distances to school within the tightest de facto catchment areas. They argue that places at the best state schools now rationed through geography via “distance to school” criteria.
Accessibility and Socioeconomic Status

How do local education markets in Sheffield interact with local housing markets?
What are the socioeconomic and spatial differences in de facto catchment areas for different types of schools (faith/secular, high and low-performing)?
Do the best (highest-performing) state schools have tighter, more homogeneous, higher socioeconimic local catchment areas?
Research Questions

Property Price index – HPI-adjusted, weighted◦ Based on Land Registry data 2007-2011 (4 years)
“De facto” catchment areas for schools◦ Based on network analysis of drive and walk times◦ From point data on pupil residential location
Geodemographic classification of Sheffield using census output areas
◦ Based on census 2011 data, property price index and urban form variables (building density etc)
Parental Preference Data – too “fluid” for analysis (administrative data).
Methods and Data

Property Sales 2010-11 (£)

Primary 65% “de facto” Catchment Areas
Legend
Buffered Smoothed 65% de facto Catchment Areas
Sheffield Local Authority District Boundary 2011

Neighbourhood Classification - 2011 Census
Legend
65% de facto Catchment Areas
No data
Working Class - lower income
Wealthy Rural
City Centre Living
Multicultural
Prosperous Suburbs
Pockets of Poverty
Middle Income Families

Correlation of 0.51 between mean 65% catchment property price and school performance on Key Stage 2 results (at age 11) for best state primary schools (p=0.000, N = 52)
Correlation of 0.88 mean 65% catchment property price (2010-11 data) and school performance (using Key Stage 4 – GCSEs) excluding the Catholic High School at top-performing secondary schools (p = 0.01, N=7).
Positive correlation between “core” standard distance and best-performing secondary schools on key stage results (0.75 at 5% significance). Weaker for primaries.
Inverse relationship between property price and residential density?
Results so far …
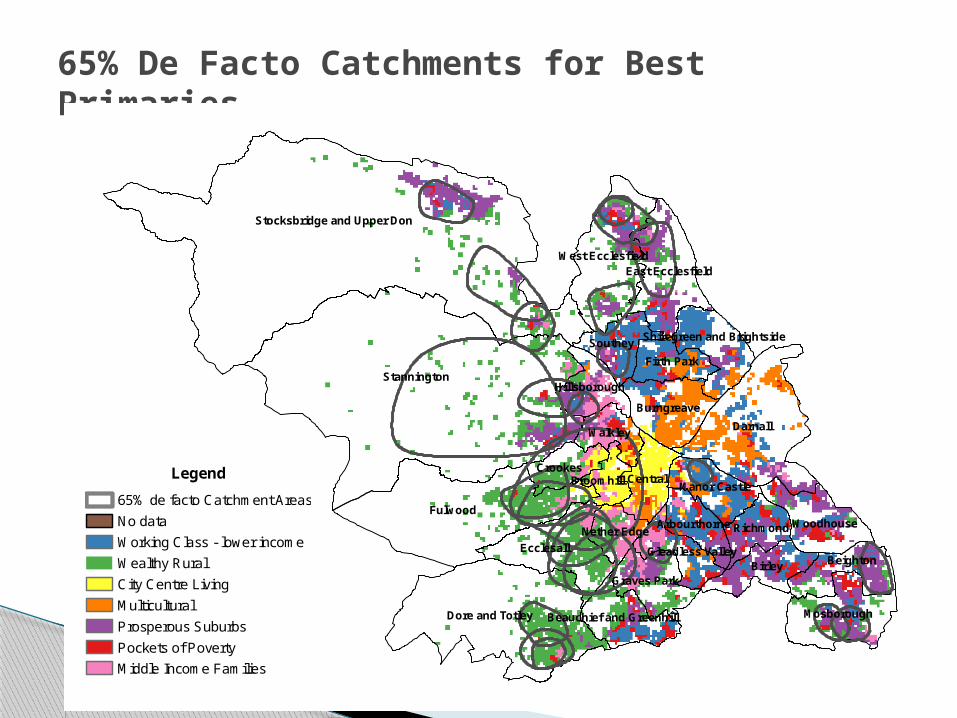
65% De Facto Catchments for Best Primaries
Stannington
Stocksbridge and Upper Don
Fulwood
Darnall
Dore and Totley
Ecclesall
Birley
Mosborough
Beighton
Burngreave
Woodhouse
Southey
Walkley
Crookes
Firth Park
Richmond
West Ecclesfield
Central
East Ecclesfield
Graves Park
Manor Castle
Hillsborough
Arbourthorne
Broomhill
Nether Edge
Gleadless Valley
Beauchief and Greenhill
Shiregreen and Brightside
Legend
65% de facto Catchment Areas
No data
Working Class - lower income
Wealthy Rural
City Centre Living
Multicultural
Prosperous Suburbs
Pockets of Poverty
Middle Income Families

Best-performing Primary Schools and Local “Neighbourhood” Classification
Legend
65% de facto Catchment Areas
No data
Working Class - lower income
Wealthy Rural
City Centre Living
Multicultural
Prosperous Suburbs
Pockets of Poverty
Middle Income Families
tr1etf
NOT SURE HOW DIFFERS FROM PREV SLIDE

Endogeneity – children of high-performing professionals advantaged from birth >> perform better academically >> cluster together and attend local schools in/near wealthier residential areas.
Definitely a relationship between property price and school performance on KS results – strongest at secondary level.
Distance-based over-subscription criteria exclude children from other residential areas from accessing the best state schools and associated peer group (thinking social capital). Also religious selection criteria.
Inverse relationship between residential population density and school performance based on Key Stage results.
Next steps – to test relationships between pupils in residential areas and schools in a cross-classified multilevel model.
Conclusions

Atypical Primary CatchmentsLegend
65% de facto Catchment Areas
No data
Working Class - lower income
Wealthy Rural
City Centre Living
Multicultural
Prosperous Suburbs
Pockets of Poverty
Middle Income Families
Tinsley Junior
91.5% BME-12 below Average for England KS2

Netherthorpe Primary – city central
Legend
65% de facto Catchment Areas
No data
Working Class - lower income
Wealthy Rural
City Centre Living
Multicultural
Prosperous Suburbs
Pockets of Poverty
Middle Income Families
-26 below mean for England (KS2); 34% FSM, 88% BME pupils

Department of Town & Regional PlanningUniversity of Sheffield
Contact Details:

Correlation between Mean Weighted Property Price for 65% Catchments & KS2 Primary Schools performing above mean for England
tr1etf
IS THIS DEFACTO CATCHMENTS? IF SO, SHOULD IT COME AFTER THE BIT WHICH IS ABOUT DERIVINg the de facto catchments?

Correlation between Mean 2010-11 Property Price for 65% Catchments & KS4 for Secondary Schools (performing above mean for England)
Correlation = 0.88 (p=0.01)