Sudan University of Science& Technology College of ...
124
ﺑﺴﻢ ﷲ اﻟﺮﺣﻤﻦ اﻟﺮﺣﯿﻢSudan University of Science& Technology College of Graduate Studies Evaluation and Implementation of Hazard Analysis and Critical Control Points System (HACCP) in Stirred Yoghurt Plant ﺗﻘﻮﯾ ﻢ وﺗﻄﺒﯿﻖ ﻧﻈﺎم ﺗﺤﻠﯿﻞ اﻟﻤﺨﺎطﺮ وﻣﺮاﻗﺒﺔ اﻟﻨﻘﺎط اﻟﺤﺮﺟﺔ ﻓﻲ ﻣﺼﻨﻊ اﻟﺰﺑﺎدي اﻟ ﻤ ﻤﺰ و جThesis Submitted to Sudan University of Science and Technology in Partial Fulfillment of the Requirements of the Degree of Master of Science in Food Science and Technology By Siddig Eltahir Mohammed Ali B.Sc in Food Science &Technology Sudan University of Science and Technology 2007 Supervisor Assistant Professor Dr. Barka Mohammed Kabier Barka Department of Food Science and Technology College of Agricultural studies, SUST July 2015
Transcript of Sudan University of Science& Technology College of ...

بسم الله الرحمن الرحیم
Sudan University of Science& Technology
College of Graduate Studies
Evaluation and Implementation of Hazard Analysis and Critical Control Points System (HACCP) in Stirred Yoghurt
Plant
الزبادي مصنع في م وتطبیق نظام تحلیل المخاطر ومراقبة النقاط الحرجةتقوی ج ومزمال
Thesis Submitted to Sudan University of Science and Technology in Partial Fulfillment of the
Requirements of the Degree of Master of Science in Food Science and Technology
By
Siddig Eltahir Mohammed Ali
B.Sc in Food Science &Technology
Sudan University of Science and Technology
2007
Supervisor
Assistant Professor Dr. Barka Mohammed Kabier Barka
Department of Food Science and Technology
College of Agricultural studies, SUST
July 2015

I
الآیـة
:قال تعالى
ا ( الِصً ا خَ نً َ مٍ لَبـ دَ َ ثٍ و ْ نِ فَـر ْ ي َ ْ بـ ن ِ ُطُونِهِ م ا فِي ب مَّ ِ ْ م م يكُ قِ ْ ةً نُس َ ر ْ بـ امِ لَعِ َ ع ْـ ْنَ ْ فِي الأ م نَّ لَكُ إِ َ و َ ين بِ ارِ لشَّ ِ ائِغًا ل .)سَ
صدق االله العظيم
)66(سورة النحل الآية

II
Dedication
To My
Family for their kind support and
encouragements,
Teachers
And all my Friends.

III
ACKNOWLEDGEMENTS I would like to express my thanks to my supervisor Dr. Barka Mohammed
Kabier Barka For helpful assistance, guidance, patience and keen supervision
during this work.
I wish to express my appreciation to members of CAPO Company of Milk Products
for their assisting and kind cooperation to make application of HACCP possible
and to all staff of Department of Food Sciences and Technology, College of
Agricultural Studies SUST.
Great thanks are extended to all for help and support during my study.

IV
List of Contents Title Page
No. I الآیـةDedication II Acknowledgements III List of contents IV List of tables VIII List of figures X Abstract XI XIII ملخص البحث
CHAPTER ONE Introduction 1
CHAPTER TWO LITERATURE REVIEW
2.1Milk 4 2.1.1 Nutritive value of milk 5 2.1.2 Microorganisms in milk 6 2.1.3 Spoilage microorganisms 6 2.1.4 Fermentative microorganisms 7 2.1.5 Pathogenic microorganisms 8 2.1.6Fermentation of milk 9 2.2 The therapeutic effect of fermented dairy products 10 2.3 The history of Zabadi in Sudan 12 2.3.1 Zabadi preparation 12 2.4 Yoghurt 12 2.4.1 Types of yoghurt 14 2.4.1.1 Legal standards 14 2.4.1.2Post-incubation processing 14 2.4.2Factors affect nutritional value of yoghurt 15 2.4.2.1 Lactose intolerance 15 2.4.2.2 Functional properties of milk fat 16 2.4.2.3Bioavailability of vitamins and minerals in yoghurt 16 2.5Preparation of traditional yoghurt 16 2.6Microbiological spoilage of yoghurt 17 2.7 Yoghurt raw materials 18 2.8 Homogenization 18 2.9 Heat treatment 19 2.10 Cooling of milk 19 2.11Fermentation of milk yoghurt 20

V
2.12 Striking of yoghurt 21 2.13Cooling of the coagulum 21 2.14 Intermediate storage of stirred yoghurt 23 2.15 Packaging 23 2.16Contamination during packaging 24 2.17 Chill storage 24 2.18 Distribution 25 2.19HACCP background 26 2.20 Benefits of HACCP 27 2.21 Pre-requisite programmers 27 2.22 Application of HACCP 29 2.22.1 Define terms of reference 29 2.22.2 Select HACCP team 30 2.22.3 Describe the product 31 2.22.4 Identify intended use 33 2.22.5 Construct a flow diagram 33 2.22.6 On-site confirmation of flow diagram 33 2.30 Principles of HACCP 34 2.23.1 listing of all hazards associated with each step and consideration of any control measure to eliminate or minimize hazard (principle 1)
34
2.23.1.1 Raw milk 34 2.23.1.2 Additives and supports 35 2.23.1.3 Environment 35 2.23.1.4 Packaging material 36 2.23.1.5 Cleaning 36 2.23.2 Establishment of critical control points (principle 2) 37 2.23.3Establishment of critical limits for each CCP (principle 3) 37 2.23.4Establishment of a monitoring system for a CCP (principle 4) 37 2.23.5Establishment of a corrective actions plan(principle 5) 38 2.23.6 Establishment of verification procedures (principle 6) 38 2.23.7Establishment of documentation (principle7) 39
CHAPTER THREE MATERALS AND METHODS
3-1 The study area 41 3-2 HACCP plan 41 3-3 Materials 43 3-4 Chemicals and reagents 43 3-5 Product description and intended use 44 3-6 Flow diagram of stirred yoghurt produced at CAPO milk company 45 3-7 Determination of the Critical Control Points 56

VI
3-8 Monitoring tests 47 3-8-1 Media preparation 47 3-8-2 Plate account agar 47 3-8-3 Potato dextrose agar 47 3-8-4 Violate red bile agar 47 3-8-5 EMB (Eosin Methylene Blue agar) 48 3-9 Serial dilution of samples 48 3-9-1Antibiotic test 48 3-9-2 Total bacterial count 48 3-9-3Total Coliform count 48 3-9-4 Yeast and Moulds 49 3-9-5 Swab rinse method 49 3-10 Chemical and physical analyses 49 3-10-1 Determination of total solids 49 3-10-2Titratable acidity 50 3-10-3 pH 50 3-10-4 Temperature 50 3-10-5 Viscosity 50 3-10-6 Butterfat 51 3-11 Statistical analysis 51
CHAPTER FOUR RESULTS AND DISSCUSION
4.1 Identification of possible hazards in stirred yoghurt 52 4.2 Control measures of hazards 52 4.3 Identification of control point and critical limits 52 4-4 Monitoring procedure 56 4.4.1 Physical quality of fresh milk 56 4.4.1.1 Temperature of fresh milk 56 4.4.1.2 pH of fresh milk 56 4.4.1.3 Titratable acidity (TA) of fresh milk 59 4.4.1.5 Fat content of fresh milk 59 4.4.1.6 Solids non Fat (SNF) 59 4.4.1.4 Specific Gravity (SG) of fresh milk 63 4.4.1.7 Total solids (TS) 63 4.4.2. Microbiological analysis 67 4.4.2.1 Coliform count 67 4-4-2-2 Total viable bacterial count (TVBC) 70 4-4-2-3 Lab pasteurization count mesophilic 73 4-4-2-4Lab pasteurization count thermophilic 73 4-4-3 During mixing process 77
VII
4-4-3-1 Titrtable acidity (TA) of milk yoghurt 77 4-4-3-2 Total solid (TS) content of milk yoghurt 77 4-4-3-3 Solids non fat (SNF) content of milk yoghurt 77 4-4-3-4 Fat content of milk yoghurt 77 4-4-3-5 Specific gravity (SG) of milk yoghurt 77 4-4-4 After pasteurization process 83 4-4-5 During fermentation process 88 4-4-6 Final product analysis 93 4-4-6-1 pH of final stirred yoghurt 93 4-4-6-2 Viscosity of final stirred yoghurt 93 4-4-6-3 Yeast and moulds 96 4.4.6.4 Temperature of final product 96 4.5 Corrective action 96
CHAPTER FIVE CONCLUSION AND RECOMMENDATIOS
5-1 Conclusions 99 5-2 Recommendations 100 References 101

VIII
List of Tables
Title Page No.
Table 4.1: HACCP plan for the management of the manufacture of stirred yoghurt
53
Table 4.2: Temperature of fresh milk samples collected from different Milk Collection Centers
57
Table 4.3:pH of fresh milk samples collected from different Milk Collection Centers
58
Table 4.4: Titarable Acidity (TA) of fresh milk samples collected from different Milk Collection Centers
60
Table 4.5: Specific Gravity (SG) of fresh milk samples collected from different Milk Collection Centers
61
Table 4.6: Fat content of fresh samples collected from different Milk Collection centers
62
Table 4.7: Solid Not Fat (SNF) of fresh milk collected from different Milk Collection Centers
65
Table 4.8: Total Solid content (TS) of fresh milk collected from different Milk Collection Centers
66
Table 4.9: Coliform bacterial count of different Milk samples collected from different Milk Collection Centers
69
Table 4.10: Total Viable bacterial count (TVBC) of different Milk samples collected from different Milk Collection Centers
72
Table 4.11: Total lab pasteurization count (LPC) for Mesophilic of different Milk samples collected from different Milk Collection Centers (MCCS)
74
Table 4.12: Total lab pasteurization count (LPC) for Thermophilic of different Milk samples Collected from different Milk collection Centers (MCCS)
75
Table 4.13: Total plate count (TPC) for swap surface and rinse water 76 Table 4.14: Titarable acidity (TA) of mixed milk during mixing process 78 Table 4.15: Total Solid (TS) of mixed milk during mixing process 79 Table 4.16: Solid Non Fat (SNF) of mixed milk during mixing process 80 Table 4.17: Fat content of mixed milk during mixing process 81 Table 4.18: Specific gravity (SG) of mixed milk during mixing process 82 Table 4.19: Specific gravity of milk after pasteurization process 84 Table 4.20: Solid Non Fat content (SNF) of milk after pasteurization process
85
Table 4.21: Total Solid content (TS) of milk after pasteurization process 86

IX
Table 4.22: Temperature of milk after pasteurization process 87 Table 4.23: Total Solid of stirred yoghurt during fermentation process 89 Table 4.24:pH of stirred yoghurt during fermentation process 90 Table 4.25: Viscosity of stirred yoghurt during fermentation process 91 Table 4.26: Cooling Temperature of stirred yoghurt during fermentation process
92
Table 4.27: pH of final stirred yoghurt 94 Table 4.28: Viscosity of final stirred yoghurt 95 Table 4.29: Yeast and moulds of final product 97 Table 4-30: Temperature of final stirred yoghurt 98

X
List of Figures
Title Page No. Figure (1): Flow diagram for the manufacture of stirred yoghurt. 46 Figure (2): Decision tree to identified CCPS. 47

XI
Abstract
This study was carried out to evaluate the Hazard Analysis and Critical Control
Point (HACCP) system implemented in stirred yoghurt processing line in CAPO
dairy products. HACCP plan was set, the critical control point (CCPS) were
identified based on the flow diagram of stirred yoghurt production line. The CCPS
including raw milk, after pasteurization process, during mixing, fermentation
process, packaging and distribution were defined. The study period of HACCP
implantation was in April, May, June and July (2014). Raw milk samples were
collected from milk collection centers (MCCs) including Alifoun, Tibna and
Sayegh. Control measures including, physio-chemical and microbial were
determined to samples, raw milk samples and samples collected from different
steps of stirred yoghurt production and final products. Critical limits, monitoring
procedures were set and the results obtained were statistically analysed. The results
obtained of store milk temperature from three MCCS during the study period
revealed significant (p<0.05) decrease in temperature. The pH was not significant
(p<0.05) difference during the study period (April- July) as well as titarable acidity
and specific gravity. While the fat and solid non fat content significantly (p<0.05)
increased in Alifoun MCC as well as samples were nilled of antibiotic during the
study period. The microbiological results indicated that Coliform bacterial count
(log10 cfu/ml) were significantly (p<0.05) decreased in Alifoun MCC compared
with Tibna and Sayegh MCC. The total bacterial count was significantly (p<0.05)
difference among the three MCCS. Lab Pasteurization Count (LPC) for mesophilic
and thermophilic (log10 cfu/ml) was significantly (p<0.05) low in Alifoun
compared with that of Tibna and Sayegh MCC.
During the mixing process the fat, solid non fat content, total solid content,
titarable acidity and specific gravity were not significantly (p<0.05) different

XII
during the study period. After the pasteurization process the specific gravity, solid
non fat and total solid content were not significant (p<0.05) difference during the
study period. During fermentation process the incubation temperature were not
significantly (p<0.05) difference as well as the pH value, viscosity and cooling
temperature. While the total solid content of fermented milk yoghurt was
significantly (p<0.05) deference. The pH of final stirred yoghurt was not
significantly (p<0.05) difference. Whereas the viscosity of final product was
significantly (p<0.05) difference as well as the final product was null of Yeast and
Moulds during the study period. Overall quality parameters defined during the
study were within the standard range of stirred yoghurt plant. Therefor, application
of the HACCP could contribute to safe and high quality stirred yoghurt.

XIII
ملخص البحث
المتبع في خط ) الھسب(أجریت ھذه الدراسة بغرض تقویم نظام تحلیل المخاطر والتحكم في النقاط الحرجة تضمنت النقاط الحرجة الحلیب الخام، البسترة، عملیھ . إنتاج الزبادي المزج بمصنع كابو لمنتجات الألبان
الخلط والتكوین، التخمیر، التعبئة والتوزیع كذلك تم تحدید نقاط التحكم، الحدود الحرجة، إجراءات الرقابة تم إجراء الدراسة خلال فترة زمنیة تضمنت .والأفعال التصحیحیة لكل النقاط الحرجة في مخطط التصنیع
م أجریت خلالھا اختبارات الخواص الفیزیوكیمیائیة 2014أبریل، مایو، یولیو ویونیو أربعة أشھر وھي ِبنة والصایغ والمایكرو بیولوجیة لعینات اللبن المتحصل علیھا من مراكز تجمیع الألبان وھي العیلفون، الت
المتحصل علیھا والتي یعتمد علیھا المصنع في إنتاج وتصنیع منتجاتھ خاصة الزبادي وتم تحلیل النتائج .إحصائیا
في درجة حرارة الحلیب بیمنا لم یكن ھنالك تأثیر معنوي P<0.05 أظھرت النتائج وجود زیادة معنويP<0.05 في رقم الـpH الحموضة والكثافة النوعیة مع وجود زیادة معنویة ،P<0.05 ،في محتوي الدھن
. ینات الحلیب الخام المتحصل علیھا من مركز العیلفونالماد الصلبة غیر الدھنیة والمواد الصلبة الكلیة في ع .كما أظھرت نتائج التحلیل خلو عینات الحلیب من المضادات الحیویة
في بكتیریا القولون لعینات P<0.05أظھرت التحالیل المایكروبیولوجیة للحلیب الخام وجود انخفاض معنويفي العد الكلي للبكتیریا P<0.05نالك اختلافات معنویة اللبن المتحصل علیھا من مركز العیلفون بینما كانت ھ
بین عینات اللبن المتحصل علیھا من مراكز تجمیع الألبان كما أظھرت الإختبارات المعملیة وجود إنخفاض لعینات اللبن المتحصل علیھا من مركز العیلفون Thermophilic والـMesophilic معنوي في بكتیریا الـ
.لتجمیع الألبان
في كل من محتوي P<0.05ظھرت نتائج التحلیل خلال عملیة الخلط والتكوین عدم وجود اختلافات معنویة أالدھن، المواد الصلبة غیر الدھنیة، المواد الصلبة الكلیة، الحموضة والكثافة النوعیة لخلیط اللبن المتحصل
ج التحلیل عدم وجود إختلافات معنویة بعد بسترة الحلیب أظھرت نتائ.علیھ من مراكز تجمیع الألبان الثلاثةP<0.05 في الكثافة النوعیة، المواد الصلبة غیر الدھنیة والمواد الصلبة الكلیة خلال فترة الدراسة.
واللزوجة pHفي درجة حرارة التحضین، الـ P<0.05خلال فترة التخمیر لم تكن ھنالك إختلافات معنویةأما المنتج النھائي فقد أظھرت النتائج . في المواد الصلبة الكلیة P<0.05بینما كانت ھنالك إختلافات معنویة
في اللزوجة مع خلو المنتج من P<0.05بینما كانت ھنالك زیادة معنویة pHعدم وجود علاقة معنویة في الـالمزج صفات الجودة الكلیة التي تم تحدیدھا أثناء الدراسة كانت في حدود مواصفة الزبادي. الأعفان والخمائر
یمكن أن یساھم في السلامة ) الھسب(لذلك تطبیق نظام تحلیل المخاطر والتحكم في النقاط الحرجة . بالمصنع .والجودة العالیة للزبادي المزج

1
CHAPTER ONE
INTRODUCTION
The growing awareness of the relationship between diet and health has lead to an
increased demand for quality food products that support health, above and beyond
providing basic and nutritional needs. Milk is a natural and highly nutritive and
balanced daily diet. It is one of the best sources of calcium and provides high
quality protein, vitamins and other minerals (Smit, 2005). The hygienic quality
problems of milk and milk products may arise from raw milk of diseased animals
(Murphy and Boor, 2000). Bacterial contamination of raw milk can originate from
different sources, including low quality raw milk, improper refrigeration and an
inadequate packaging system (Tokar and Teger, 2008).
Yoghurt is one of the most widely distributed dairy products. It is made from milk
yoghurt essentially has all the nutritional components of milk in different forms
with diverse local names is made throughout the world (Vedamuth, 1991; Tarakci
and Erdogan, 2003).
The natural yoghurt is characterized by a smooth and viscous gel like texture and
has a delicate walnutty flavor (Fuquay, 2011). The fermentation of lactose sugar by
lactic acid bacteria results in the production of lactic acid, carbon dioxide, acetic
acid, diacetyl, acetaldehyde and several other components giving a characteristic
flavor to yoghurt (Tamime and Robinson, 2004).
Yogurt quality is difficult to standardize because of many forms, varieties,
manufacturing methods, ingredients and consumer preferences that exist (Kroger et
al., 1989). Therefore, very careful processing is required for the production of safe
and good quality yoghurt to satisfy the highest expectations of the consumers.

2
Good agricultural practice (GAP) and good manufacturing practice (GMP)
together with HACCP program should meet the appropriate level of public health
protection. Good hygienic practices (GHP) should be applied throughout the
production and processing chain so that the milk product is safe and suitable for
their intended use. The GHP should be implemented following the Annex to the
Codex Recommended International Code of Practice– General Principles of Food
Hygiene (IDF/FAO, 2004).
During manufacturing there are certain stages where there is a potential for
microbiological and foreign object contamination that results in many problems
related to quality and safety of the products.
This could have a negative impact on the quality and image of the product. To
address these issues the implementation of a system based on technical and
scientific principles, such as HACCP system, is crucial.
Marketing of yoghurt and dairy products made of raw milk are the common futures
of dairy products in Sudan. Nowadays, many private dairy factories are invested in
yoghurt processing in Sudan such as Premier Milk Company, BEST Milk
Company and FAABY Milk Company. Among them CAPO milk company is one
of the most famous and the company had ISO certificate. However,
implementation of safety programs based on HACCP system at CAPO Milk
Company did not exist. Therefor, the present study is carried out with the
following objectives:
1. To establish a HACCP plane for implementation in yoghurt processing at
CAPO stirred yoghurt plant.
2. To define the microbiological and chemical risks associated with different
steps of stirred yoghurt processing at the plant.
3
3. To define the critical points based on expected chemical and microbiological
contamination during processing of stirred yoghurt.
4. To evaluate HACCP implementation on chemical, physical and microbial
quality of stirred yoghurt.

4
CHAPTER TWO
LITERATURE REVIEW 2.1 Milk
Milk has been defined as the normal secretion (excluding colostrums) which can
be gained by normal milking method from the lactating mammary gland of the
healthy normally fed cows. Milk can be considered as a three basic components
water, fat, and solid-non-fat (SNF). The organic matter in the non-fatty portion
consists mainly of the protein casein, albumin and globulin, lactose and citrates.
However, milk from individual cows may show a day-to-day variation. Such
fluctuation may be influenced by the mental and physical conditions of the animal.
Excitement, worry or discomfort is liable to have a diverse effect on both the
quantity and quality of milk produced (Johnson, 1986). Table 1 display the
chemical component of different mammal's milk.
Table (1): Chemical composition of cow's milk and other mammals.
Species Composition (%)
Water Fat Protein TS SNF Lactose Ash Human 87.43 3.75 1.63 12.57 8.82 6.89 0.21
Cow 87.20 3.70 3.50 12.80 9.10 9.40 0.70
Buffalo 82.76 7.38 3.60 17.24 9.82 5.48 0.78
Camel 87.61 5.38 2.98 12.39 7.01 3.26 0.70 Ewe 80.71 7.90 5.23 19.29 11.39 4.81 0.90
Goat 87.00 4.25 5.23 13.00 8.75 4.81 0.86
Mare 89.04 1.59 2.69 10.96 9.37 6.14 0.51
Source: Johnson (1980).

5
2.1.1 Nutritive value of milk
Milk is an excellent source of high biological value protein because it contains, in
varying amount, all essential amino acid that human body cannot synthesize and in
proportion, resembling amino acid requirement. Milk and milk product provide
significant amount of micronutrients; including calcium, b-group vitamins,
(particularly riboflavin B₁₂, also thiamin, niacin and vitamin B₆, vitamin a, iodine,
magnesium, phosphorus, potassium and zinc (Anita, 2001).
Although, the salts of milk are quantitatively minor constituents, they are of major
significance to its technological properties especially to the stability and properties
of the milk's protein system (Fox and weeny, 1998). Calcium from dairy products
has greater bio-availability than calcium from vegetables (Bordy, 1999). The
components of milk color are due to milk's natural pigment concentration; from
carotenoids, protein and riboflavin (Noziere et al., 2000b).
Milk lipids are considered to be one of outstanding milk constituents with respect
to presence of lipids classes, variety and number of identified fatty acid (Jensen et
al., 1991). Milk lipids include anti carcinogenic compounds such as conjugated
linoleic acid, sphingomyelin and butyric acid (Parodi, 1999).
Lactose (β-galactosyl-glucose) is the carbohydrate source in milk. It was probably
the first prebiotic compound that nature developed in order to support the healthy
growth of infants (Harju, 1991). Lactose cannot be absorbed unless being
hydrolyzed to monosacchariedes; glucose and galactose by intestinal lactase,
which declines early in life to the point of virtual absence in adulthood, making
them intolerant (Vesa, 1999). In populations with an old dairying tradition, lactose
malabsorption is more rare (Harju, 1991). The nutritional value of milk as a wholes
greater than the value of its individual nutrient because of its unique nutritional
balance (Wattiaux, 2000).

6
2.1.2 Microorganisms in milk
The ability of any microorganisms to grow in food products depend on a number
of limiting factors such as temperature, radix potential, pH, water activity, added
preservatives and competitive microflora (Gaze, 1992).
2.1.3 Spoilage microorganisms
During cold storage after milk collection, psycrotrophic bacteria population
dominate the microflora and their extracellular enzymes, mainly proteases and
lipases contribute to the spoilage of dairy products (Hantsis-Zacharov and Halpern,
2007). The numbers of psychrotrophs that develop after milk collection depend on
the storage temperature and time. Under sanitary condition ˂10% of the total
microflora is psychrotrophs in contrast to ˃75% under unsanitary condition
(Cousin, 1982).
The most common spoilage microorganisms of milk and dairy products are gram
negative rod shaped bacteria, gram positive spore forming bacteria, lactic acid
forming bacteria, yeast and moulds (IDF, 1994).
Psudomons spp. are the most important group of psychrotrophs associated with
spoilage. They may however, produce extracelluar enzymes, which are particularly
destructive, if high numbers are present (IDF, 1994). Psedomonas species are the
most common organisms in raw or pasteurized milk at the time of the spoilage
(Sorhaug and Stepaniak, 1997), and they constitute the predominant
microorganisms limiting the shelf life of processed fluid milk at 4°С (Gilmour and
Rowe, 1990). Also, lactic acid producing microorganisms (Streptococcus spp.,
Lactobacillus spp. And Leuconostoc spp.)spoil milk by fermenting lactose to
produce lactic acid (IDF, 1994).

7
The defects that can occur in milk due to microbial growth are off flavor, lipolysis
with development of rancidity, gas production, souring due to fermentation,
coagulation of milk protein, viscous or ropy texture and discoloration (Banwart,
1981).
2.1.4 Fermentative microorganisms
Eight main genera of lactic acid bacteria (LAB) each genus and species has
different characteristics but they are generally chained cocci or rod shaped gram
positive, non sporulating bacteria that produce lactic acid as a major or sole
product of fermentative metabolisms (Salminen and Wright, 1993). Lactic acid
bacteria ferment carbohydrates into energy and lactic acid (Jay, 2000).
Depending on the microorganisms, metabolic pathway differ, when glucose is the
main carbon source: homo-fermentative bacteria such as Lactobacillus and
Streptococcus yield two lactose form one glucose molecule, whereas the hetro-
fermentative bacteria such as Leuconostoc and Weissella, transform glucose
molecule into lactate, ethanol and carbon dioxide (Caplice and Fitzgerald, 1999;
Jay, 2000; Kuippers et al., 2000).
Lactic acid bacteria occur naturally in fermented food, they can produce small
organic compound that give the aroma and flavor to fermented product (Caplice
and Fitzgerald, 1999). Lactic acid bacteria and their metabolites have been shown
to play an important role in improving microbiological quality and shelf life of
many fermented food products and provide good example of biological
preservation (Zottola, 1994).
The presence of natural indigenous lactic acid bacteria derived from fermented
milk has a competitive exclusion of contamination and pathogen (Urano, 2003).
Pathogen inhibition by lactic bacteria may provide significant protection against

8
pathogenes, either through a natural competitive barrier against pathogens in
gastrointestinal tract or as a method of decontaminate bacteria toxic.
The use of bacteriocin producing microorganisms, such as lactic acid bacteria
(LAB) in the food industry is attractive because there is an increasing demand for
natural products and increasing concerns about food borne diseases (Cleveland et
al., 2001). Lactic acid bacteria have been used as flavoring and texturizing agents
as well as preservative in food for centuries, are now added as starters (Caplice and
Fitzgerald, 1999).
Lactic acid bacteria such as Lactobacilli, Lactococus lactis, and Streptococcus
thermophillus, inhibit food spoilage and pathogenic bacteria and preserve the
nutritive qualities of raw food materials for an extended shelf life (Heller, 2000;
O'sullivan et al.; 2002).
2.1.5 Pathogenic microorganisms
Pathogens involved in food borne outbreaks that associated with consumption of
milk include Salmonella, Listeria monocytogens, campylobacter, staphylococcus
aureus, Bacillus cereus and colostridum botulinum (Ryser, 1998).
The most common contagious mastitis pathogens are staphylococcus aureus,
streptococcus agalacitiae and Mycoplasma bovis, but some strain of streptococcus
ubreis may be transmitted by milk (Zadoks, 2003).
Other milk borne pathogens that have resulted in food poisoning among the human
population are yersinia enteropathogenic E. coli and salmonella (Shewmake and
Dillon, 1998).

9
2.1.6 Fermentation of milk
Acidification of milk by fermentation is one of the oldest methods of preserving
milk and imparting to it special favorable organoleptic qualities (Tamime and
Death, 1980).
Fermentation is the process leading to the anaerobic breakdown of carbohydrates.
Fermentation is an energy-yielding, oxidation-reduction process (Kosikowski,
1982).
The major sugar and citric acid fermentation in milk summarized by (Kosikowski,
1982) include:
- Lactic acid fermentation: The lactic acid fermentation is the most important
one in milk, for it is required in all instances.
- Propionic acid fermentation: In emmental, swiss and certain sweet curd and
ripened cheeses, the propionic acid fermentation leads to the typical cheese,
flavour.
- Citric acid fermentation: It is responsible for the delicate aromatic flavour of
buttermilk, sour cream, cream cheese and some cottage cheeses.
- Alcoholic fermentation: As in kefir and koumiss which contain 1- 3% ethyl
alcohol.
- Butyric acid fermentation: It generates large amount of carbon dioxide and
hydrogen gas in the product.
However, in Sudan there are four types of traditionally fermented dairy products:
rob, gariss, laban- gedim and mish. In addition, there are two quasi-indigenous
products, namely, Jibna Beida and zabadi (local name for yoghurt), (Dirar, 1993).
2.2 The therapeutic effect of fermented dairy products
The significant increase in the consumption of cultured dairy products during

10
recent years notably that of yoghurt, has been ascribed to their image as
wholesome high-protein convenient, healthy or low fat products.
Cultured products are digested more easily and therefore, are nutritious because the
proteins, carbohydrates and fat are predigested by culture bacteria in their
manufacture (Shahani and Chardan, 1979).
Death (1984) studied the most widely accepted therapeutic use of these cultured
products in the treatment and prophylaxis of gastrointestinal disorders. The
fermented milk aids in the regeneration of the natural flora through the creation of
a favorable growth environment, and with some products, their bacteria may also
colonize the gut.
Curiously, cultured milk products have been credited with the ability of alleviating both constipation and diarrhea (Death, 1984).
Fermented milk products make excellent foods, particularly for elderly people.
Extremists claim a longer life expectancy for the consumers where these foods are
staple. They point to the high percentage of centenarians in regions where
fermented milk products are consumed. Others see nothing more in fermented milk
products than good basic foods (Kosikowski, 1982).
Death (1984) showed that cultured products vary considerably and are dependent
on the following: method and extent of fortification, heat treatment, time and
temperature of incubation, content of additives such as fruit and stabilizers and the
conditions of storage.

11
Table (2): Different types of fermented milk products
Product Origin Starters used
Yoghurt Nomadic tribes of Eastern Europe
S. thermaphilus L. bulgaricus
Kefir
Caucasian Mountains
Saccharomyces kefir Torula kefir L. caucasicus Leuconostoc spp. Lactic acid streptococci
Koumis Russia L. bulgaricus Torula yeast
Acidophilus U.S.A. L. acidophilus Bulgarian buttermilk Bulgaria L. bulgaricus Cultured buttermilk
U.S.A.
Leuc. citrovorum Leuc. de frohicum L. lactis spp. lactis L. lactis ssp. Cremoris L. lactis gip. diacetylactis
Cultured cream
Lactic acid streptococci Leuconostoc bacteria
Source: Kosikowski (1982)
2.3 The History of Zabadi in Sudan
Zabadi is a kind of yoghurt which in the Sudan is made from Cow's milk, until the
1950s, zabadi was only known to the inhabitants of Khartoum and few relatively
large towns. There is little doubt that the part of zabadi making come to the Sudan
from Egypt through the mediation of such ethnic groups as Egyptians', Syrians,
Greeks and Turkish (Dirar, 1993).
2.3.1 Zabadi preparation
The milk is first boiled and after cooling it is inoculated with a previous batch of
zabadi. It's then incubated in a warm place in the house or kitchen, at varying room
temperature. The milk takes between 8-12 Hours to finally sour. Compare with

12
western yoghurt, zabadi is much sour and has a variable flavor, the product not
being standardized (Dirar, 1993).
From 1980 to the present, the market of zabadi in the capital has been dominated
by the product of big companies imported pure starter culture, consisting of strain
of streptococcus thermophilus and lactobacillus bulgaricus. The production of
these companies replaced the traditional zabadi in Khartoum and is already
spreading out to other nearby towns. This modern yoghurt is also referred to as
zabadi and the consumer does not seem to differentiate between the two products.
In fact the new zabadi is liked better for its heavier body and lower acidity.
Nevertheless, traditional zabadi dominates the markets of small towns in the
country (Dirar, 1993).
2.4 Yoghurt
Yogurt is a product made from heat treated milk that may be homogenized prior to
the addition of lactic acid bacteria (LAB) cultures containing Lactobacillus
bulgaricus and Streptococcus thermophilus (C.F.R.S, 2011). Similarly, Tamime et
al., (2002) defined yoghurt as a product of the lactic fermentation of milk by
addition of a starter culture, which results in a decrease of milk pH to less than or
equal to 4.6. Table 3, showed the variety names of yoghurt in different countries.
Yoghurt is more nutritious than many other fermented milk products because it
contains a high level of milk solids in addition to nutrients developed during the
fermentation process. Its name differs from one country to another. Different forms
of yoghurt are now available in the market like stirred, set, frozen and liquid
yoghurt (Saint and Souchon, 2008). The culinary art of yoghurt making originated
thousands of years ago. It is likely, however, that the origin of yoghurt was the
Middle East, and the evolution of this fermented product through the ages can be
attributed to the culinary skills of the nomadic people living in that part of the

13
world. Although modern large-scale production is designed to handle thousands of
liters per day, using highly sophisticated technology with mechanization and auto
mastication, the basic principles underlying the manufacturing process, have
altered little with time (Tamime and Robinson, 1999).
Table (3) The Varity names of yoghurt in different countries:
Traditional Country Jugurt Turkey Kissel Balkan Kefir Russia Busa Turkistan Lebel Some Arab countries
Zabady Sudan /Egypt Mast/Dough Iran
Dahi India Mazam Arminia Tiaodu Greece Cieddu Italy Giodu Sardinia Tahro Hungary
Source: Tamime and Death (1980).
2.4.1 Types of yoghurt
The types of yoghurt that are produced worldwide can be divided in to various
categories and sub-division is usually erected on the basis of:
2.4.1.1 Legal standards
Legal standard for yoghurt are mainly based on the chemical composition of the
product, i.e. percentage of fat content , solids non fat(SNF) or total solid(TS). A
minimum specification of SNF or TS is included by some countries, but the main
division is on the basis of fat content. According to FAO/WHO, yoghurt may
designated as full (above 3.0%), medium (3.0 – 0.5%) or low (0.5% or below) fat
(Sara, 2010).

14
2.4.1.2 Post-incubation processing
Varies types of modified yoghurt can be found in the market. Nonfat and low fat
yoghurts were introduced to meet consumer needs. During the past decade, many
attempts have been made to produce nonfat and low fat yogurts which are similar
in quality to full fat yogurt. Pasteurized yoghurt is processed by convectional
method of manufacture, but after fermentation, the yoghurt is heat treated in order
to extend the shelf life. Frozen yoghurt is prepared in convectional manner, but is
then deep-frozen to at least (20ºС). It may in addition require a higher than normal
level of sugar and stabilizers in order to maintain the integrity of the coagulum
during freezing. Dietetic yoghurt may include low calorie yoghurt, low lactose
yoghurt or vitamin/protein fortified yoghurt. Concentrated and dried yoghurt must
be mentioned where the former product has total solid of around 24% and the latter
type between 90-94% (Tamime and Robinson, 1999).
Industrially, yogurts can be largely divided into two types. Set style yoghurt is
made in retail containers giving a continuous undisturbed gel structure in the final
product (Tamime and Robinson, 1999). On the other hand, stirred yogurt has a
delicate protein gel structure that develops during fermentation (Benezech and
Maingonnat, 1994). In stirred yogurt manufacture, the gel is disrupted by stirring
before mixing with fruit and then it is packaged. Stirred yogurts should have a
smooth and viscous texture (Tamime and Robinson, 1999). In terms of rheology,
stirred yoghurt is a viscoelastic and pseudoplastic product (De Lorenzi, 1995).
Yoghurts come in a variety of textures (e.g. liquid, set, and smooth), fat contents
(e.g. luxury, low-liquid, virtually fat-free) and flavors (e.g. natural, fruit, cereal),
can be consumed as a snack or part of a meal, as a sweet or savory food, and are
available all year round. This versatility, together with their acceptance as a

15
healthy and nutritious food, has led to their widespread popularity across all
population subgroups (McKinley, 2005).
2.4.2 Factors effect nutritional value of yoghurt
Early(1998) suggested that the nutritional value of yoghurt is clearly depend upon
it’s composition, row materials used, ingredients added and the manufacture
process will have effects on vitamin, protein, fat and mineral matter.
2.4.2.1 Lactose Intolerance
Lactose, the main carbohydrate found in milk and dairy products, is a disaccharide
sugar composed of two monosaccharides, glucose and galactose, joined together
by a condensation reaction. It can be hydrolysed in the body by the enzyme lactase
(β-galactosidase) and the resultant simple sugars can then be absorbed in the small
intestine and used as fuel by the body (BNF, 2002).
Lactose intolerance user can digest a sour milk product much better than plain
milk; the lowered lactose content of sour milk is easily digested by activity of the
yoghurt bacteria as well as the stimulation of lactose activity of the intestinal
mucsa by yoghurt. Alternatively the depletion of the stomach content in the
duodenum may be related to consumption of milk, thereby the contact time of
lactose hydrolyzing enzyme with the substrate would be extended, resulting in
better digestion of lactose (Walstra, 2006).
2.4.2.2 Functional properties of milk fat
Conjugated linoleic acid (CLA), a type of essential fatty acid found almost
exclusively in the fat of dairy products, can be obtained only through the diet
because it is not produced by the human body. CLA has been shown to be a
powerful natural anti-carcinogen that also can reduce the risk for cardiovascular
disease, help fight inflammation, reduce body fat especially abdominal fat lower

16
cholesterol and triglycerides, increase metabolism, lower insulin resistance and
enhance the immune system (Walstra, 2006).
2.4.2.3 Bioavailability of Vitamins and Minerals in yoghurt
Vitamins and minerals naturally found in milk are better assimilated by the human
body when in the form of yogurt. This is due to the fermentation process involving
Lactobacillus bulgaricus, L. acidophilus and Streptococcus thermophilus, among
other types of probiotic bacteria. Yogurt is a good source of calcium, phosphorus,
iodine and vitamin B2. It is also a prime source of protein, conjugated linoleic acid
(CLA), vitamin B12, tryptophan (an essential amino acid), potassium, vitamin B5,
zinc and molybdenum (a necessary mineral).
2.5 Preparation of Traditional yogurt
Although, yoghurt was accidentally discovered in ancient times through natural
processes, yoghurt manufacturing procedures are now highly developed. Before
yoghurt bacteria were discovered, no one knew what caused milk to coagulate.
Yoghurt was traditionally made from boiled milk inoculated with yoghurt from the
previous day. Inoculated milk and keeping overnight at room temperature (Tamime
and Robinson, 1985).
2.6 Microbiological spoilage of yoghurt
Yoghurt spoilage associated with yeasts and moulds and the latter in particular
often have their origin in the microbial population of the surrounding air. The
control of the atmosphere within the factory environment will depend on the level
of air cleanliness. It is important, to know that plants designed to induce air flow
through a filling room or production area can also act as a source of contamination
(Tamime and Robinson, 1985).

17
Packaging materials stored adjacent to the filling line and the unnecessary
movement of personnel can also cause problems in plant. Although yeasts and
moulds of atmospheric origin can be important threat, especially at certain times of
the year, it is the product contact surfaces of the plant that usually pose the greatest
threat to product safety (Tamime and Robinson, 1999).
Different methods and/or techniques have been devised to monitor the hygiene of
dairy equipment surfaces, to produce high quality products, and at the sometime
ensuring compliance with legal requirements. It is essential that values for a
typical, high standard of hygiene to be established for a given plant based on
microbiological test (Mostert and Jooste, 2002).
Enumeration of total counts of bacteria, coliforms, yeasts and moulds are the most
common microbiological examinations carried out to assess the bacteriological
contamination of plant surfaces.
The types of micro-organisms present reflect to some extent, the standard of plant
hygiene(Tamime and Robinson, 1999). Selective and differential culture media
may also be used to test specifically for given groups of organisms although a
given method may not remove all the organisms. However it's consistently used in
specific areas to provide valuable information. The most commonly methods for
surface assessment are outlined by Mostert and Jooste (2002) and include the
swab/ swab-rinse, surface rinse, agar flooding and agar contact plate methods.
2.7 Yoghurt Raw materials
The first stage of yoghurt manufacture is to combine all the ingredients which are
included in the fermentation base material. Solids-non-fat and total solid levels will
vary dependent upon the type of yoghurt to be manufactured, as well as the
inclusion of other ingredients such as sugar, skimmed milk powder, water and

18
cream. Dry ingredients require sufficient time for hydration and de-aeration and
these ingredients are milk powder, stabilizer, and sugar (Early, 1998).
Yogurt was traditionally made from milk with no added ingredients. To improve
yoghurt texture, milk or skim milk is fortified with other materials such as nonfat
dry milk (NDM), whey protein concentrate (WPC) and some other dairy or plant-
based ingredients. Different sources of milk are commercially in yoghurt
production used including: cow, mare, ass, goat, buffalo, yak, ewe, reindeer and
camel (Tamime and Robinson, 1985).
2.8 Homogenization
Homogenization is the breaking down of fat into smaller globules which prevents
the formation of a cream. Homogenization improves the consistency and viscosity
of yoghurt, thus a greater stability to syneresis can be obtained (Tamime and
Robinson, 1985). Furthermore, homogenization of yoghurt mix breaks up
powdered ingredients resulting in uniform distribution of the ingredients
(Vedamuthu, 1991). According to Schmidt and Bledsoe (1995), homogenization
has an adverse impact on yoghurt with a lower fat content, because it increases
syneresis or reduces water holding capacity due to empty spaces between casein
matrices, and lack of native milk fat globule membrane (FGM). In higher fat
yoghurts clusters of fat globules can fill up these spaces, thus syneresis can be
minimized.
2.9 Heat treatment of yoghurt
The objectives of heat treatment of yoghurt mix are to kill pathogenic
microorganisms, minimize spoilage microorganisms and inactivate lipase and
hence prevent lipolysis (Rasic and Kurmann, 1978).

19
Yoghurt mix is normally heated at a higher temperature and longer time than
normal pasteurization, ranging from 90 to 95ºC for 5 to 10 min, to help improve
product consistency through whey protein denaturation (Tamime and Robinson,
1985). The degree of denaturation depends on the intensity of heat applied. Low
TS yoghurt may require more whey protein denaturation than high TS yoghurt
(Rasic and Kurmann, 1978). Whey proteins which participate in casein aggregation
in yoghurt are α- lactalbumin (α-LA) and β-lactoglobulin (β-LG). The former has a
denaturation temperature of 62°C and the latter, 78ºC (Wong, 1988). The effect of
heat on protein is a two-staged process (Early, 1998). Firstly, the structure is
altered, causing denaturation and secondly, aggregation takes place followed by
coagulation. This is dependent upon degree and duration of heating. Pasteurization
temperatures (80–95ºC), Sterilization temperatures (115–120ºC) or UHT
temperatures (135–140ºC) have also been used to heat treat yoghurt milk.
2.10 Cooling of milk
After heat treatment the milk is required to be cooled to a suitable temperature
prior to inoculation. In most cases this will be carried out in the regenerative
section of the plate heat exchanger. Yoghurt, manufactured in a batch tank or
churn, can simply be allowed to cool via cold water 30 jackets or tank (effectively
in a water bath) (Early, 1998). The inoculation temperature for short set method
will approximate to 42ºC. This temperature can be lowered if an extended
incubation period is required (approximately30– 32ºC). Allowances need to be
made for incubation tank wall temperature, cold starter addition and latent heat
effects and, therefore, the actual cooling temperature is measured on exiting
cooling (regeneration) section, is likely to be 1–2ºC higher than required,
dependent upon volume, agitation system, distance travelled, etc. For short set
incubation it is critical to achieve an accurate inoculation temperature since too
high a temperature can inhibit and ultimately kill starter culture micro-organisms

20
and too low temperature will result in unnecessary extension of fermentation time
(Early, 1998).
2.11 Fermentation
In modern automated plants, stirred type and set type yoghurts are often produced
concurrently. As has already been indicated, the short set method of incubation of
yoghurt milk, using traditional starter organisms such as Streptococcus salivarius
sub sp. thermophilus and Lactobacillus delbrueckii subsp. bulgaricus, will require
the incubation temperature environment for the microorganisms to metabolize
synergistically. There should be no agitation during incubation. The yoghurt curd
or “coagulum” begins to form as more lactic acid is produced as the iso-electric
point of casein (pH 4.6 – 4.7) is approached. A “solidity” of the gel will begin to
be seen at approximately pH 5.6. Since the protein is most insoluble at its iso-
electric point and has lowest water binding properties, the yoghurt gel is very
sensitive at this pH. In the case of stirred manufacture, the point at which
incubation is stopped is dependent upon a number of factors, such as volume of
fermentation vessel and therefore time taken to empty the tank, final pH required
and time taken to completely arrest further acidity development. This last point is
particularly important in batch (churn) manufacture and with reference to the
partial cooling technique employed in continuous manufacture where coagulum
may be filtered through a fine mesh screen prior to fruiting, filling and secondary
cooling in retail container. Fermentation will be arrested at approximately pH 4.2–
4.4, sometimes even lower pH 3.8–4.0 (Early, 1998).
2.12 Striking
This step applies only to stirred and liquid/drinking type yoghurt and is essentially
the operated to break the warm gel/curd and re-incorporat the whey. Slow speed
paddle agitation (e.g.2 - 4 rpm) for approximately 5 - 10 minutes is usually

21
sufficient to obtain a homogeneous mix. Agitation also tends to inhibit the culture
activity and slows the rate of acidity development (Early, 1998).
2.13 Cooling of the coagulum
Cooling the coagulum commences directly after the fermented yoghurt reaches the
desired acidity. The desired acidity will be dependent upon type of yoghurt being
produced, method of cooling, time taken to empty fermentation vessel and desired
final acidity. This will take place at approximately pH 4.5- 4.6. Cooling is achieved
in stirred/liquid yoghurt by pumping the yoghurt via a gentle action positive
displacement pump, through a plate or tubular cooler in order to achieve a
temperature which is low enough to retard starter culture activity. The capacities of
pump and cooler are dimensioned in order that a large fermentation tank will take
approximately 20 minutes to be emptied in order to maintain uniform product
quality (Early, 1998).
Localized protein precipitation often referred to as ‘nodulation’ can be a major
characteristic fault in stirred or liquid yoghurt. There has been significant research
into the cause of nodulation in an attempt to prevent its development or reduce the
degree of nodulation. Increased ratio of lactobacilli to streptococci in the culture
addition, too high a temperature of incubation, excessive pH development and high
inoculation levels have all been cited as examples reason for modulation.
One physical method of eliminating this problem is to pass fermented yoghurt
through a fine screen in order to break up the ‘nodules’ and produce a smooth
consistent product. This operation can be done when the yoghurt base is cooled.
However, this can result in whey release and loss of viscosity in the final product.
This is why some manufacturers conduct two-stage cooling. By passing partially
cooled-yoghurt at approximately 20-25°C through the screen, any physical
damage, including wheying off and reduction in viscosity can be healed to a large

22
extent by reforming of the coagulum on final cooling in the retail container. Care
needs to be taken, however, in allowing for some acidity increase if the yoghurt is
only partially cooled for as long as it stays at this temperature before it is finally
chilled (Early, 1998).
Yoghurt coagulum is broken by the treatment it receives in the pump and cooler.
The mechanical treatment will decrease the viscosity but in a well-designed plant,
the yoghurt viscosity will increase again after some hours in the chill store. It is
vitally important that tanks, pipes and heat exchangers are designed with
consideration to the total permitted mechanical treatment of yoghurt. Cooling
temperatures vary and are dependent upon the:
- Composition of yoghurt and its inherent ability to withstand cold mechanical
handling.
- Filling capability of the process.
- Duration of intermediate storage.
- Efficiency of refrigeration plant.
- Cooling capability after post-filling, i.e. chill room temperature, air
circulation, etc.
Traditional continuous manufacture involves single stage cooling to 8 - 10°C,
holding in intermediate tanks and then blending with fruit preparation. The
stabilization requirements for these manufacture extremes are very different and
attention must be paid to stabilizer activity in order for the stabilizer to be effective
and avoid any quality problems. In the case of set yoghurt, cooling takes place
inside the retail container and is generally started before the final pH is reached.
Care must be taken when transferring the retail containers from the incubation
room to the chill store because of the fragility of the coagulum at this point. The
main problem to be avoided is ‘wheying off’ or syneresis and any unnecessary

23
physical movement which will encourage this problem. On cooling, the curd
becomes much firmer and if the yoghurt is formulated correctly, surface whey will
be re-absorbed after 24 hours chilled storage (Early, 1998).
2.14 Intermediate storage of stirred yoghurt
Intermediate storage is often necessary due to yoghurt production rate and filling
rate incompatibility. It is also a necessary requirement to have cooled yoghurt
available to fruit, so production should have the capacity to hold cooled yoghurt as
a stock. However, it is important that these stocks are not too great and that storage
times are shorter than 24 hours and, ideally much less than this, nominally, a few
hours. Ideally a temperature of 8- 10°C is optimal, depending upon storage time.
Intermediate storage should be as short as possible since physical changes take
place that can affect final yoghurt quality. The product may release whey that is
difficult to re-incorporate, resulting in loss of yield. Viscosity and body will
develop that will largely be lost when the yoghurt is disturbed again. The ability of
the yoghurt to bind whey will be reduced by cold disturbance (Early, 1998).
2.15 Packaging
Primary packaging will include glass polyethylene, polypropylene, polystyrene,
polyvinyl chloride, polyvinylidene chloride, plastic sachets and paper cartons.
Aluminum foil is widely used to seal yoghurt containers. Due to the acidity of
yoghurt and the requirement for the foil to be heat sealed to the plastic container,
the aluminum foil is normally coated with a layer of plastic. Individual packages
may be further collated into packs of four, six, twelve etc. and the most popular
secondary packaging is either cardboard in the form of an outer sleeve or tray or
semi rigid plastic crates. Cardboard trays can be over wrapped with heat seal
material. Current EEC labeling regulations (1984 Food Labeling Regulations)

24
require that all pre-packed foods exhibit nature of food, ingredients list, name of
manufacturer, packer or seller and expiry (Early, 1998).
2.16Contamination of yoghurt during packaging
Despite all the possible sites in the processing chain at which bacteria can be
introduced, the step that has the greatest influence on the keeping quality of heat-
treated dairy products is the filling operation.
The new generation of packaging machines incorporates features such as exclusion
of air from the filler (by using bellows instead of pistons) and carton sterilization
by UV light and hydrogen peroxide. Real contamination may also occur at the
filling stage from condensation formed on the machines as well as from smearing
of products by moving parts of filling valves (Nriagu and Simmons, 1990).
Packaging material, such as properly prepared plastic and laminated plastic
materials, are not considered an important source of bacteria (Lück, 1981).
2.17 Chill storage of yoghurt
Yoghurt which has not been subjected to any form of heat treatment via
pasteurization, sterilization or UHT processes; in its final product form needs to be
kept cold until it reaches the customer. This includes the majority of yogurts which
will have a shelf life of approximately15-21 days. Temperature variation will
affect texture, viscosity, syneresis as well as improving the environment for
potential food spoilage and food poisoning micro-organisms. Exposure to higher
temperatures than recommended below can increase biochemical reactions such as
fat oxidation, hydration of protein constituents in yoghurt, slight dehydration of
exposed yoghurt surface and changes in color of fruit (Early, 1998). Chill storage
should be between 2 and 5°C, with no rise above 10°C at intermediary stages in
distribution, i.e. palletized transport, non-refrigerated stockholding, and retail
cabinet exposure. Although classified as a ‘low-risk food’, attention requires to be

25
paid to good manufacturing practice and temperature control legislation has to be
adhered to (Early, 1998).
2.18 Distribution of yoghurt
Quality assurance principles should extend to monitoring food products throughout
the distribution chain. Although the final yoghurt is likely to be stored for only a
short period of time prior to distribution to customers’ premises, any identified
hazards such as rodent/insect infestation, exposure to temperature increase,
potential for physical damage etc., need to be monitored and preventative action
taken where appropriate. During the first 24 to 48 hours of cold storage,
improvements in the physical characteristics take place, mainly as a result of
hydration and/or stabilization of the casein micelles. If practically possible, it
would therefore be an advantage to retain yoghurt in chill storage for at least 24
hours before commencing distribution (Early, 1998).
In recent years it became increasingly important, for various reasons, to manage
and control all the elements of food manufacturing processes. One approach in this
regard, that is well established and implemented world-wide is the HACCP system
(Tamime et al., 2002).
2.19 HACCP background
The HACCP system offers a structured approach to the control of hazards in food
processing and, properly applied, identifies areas of concern and appropriate
control measures before product failure is experienced. The application of HACCP
is systematic because structured hazard analysis and implementation are provided.
The process is also logical in that each processor understands it own operation and
is able to assess controlling the specific process optimally (Jervis, 2002).

26
The origins of HACCP are traced to the 1960’s and the United States of America
when the Pillsbury Company, the United States Army Laboratories at Natick, and
the National Aeronautics and Space Administration collaborated to develop the
system as a means of managing safe food production for manned space flights. The
outcome was the HACCP concept, which has been adopted and developed to its
current status as the food safety management tool recommended by the Codex
Alimentarius Commission to a devise on consumer protection under Sanitary and
Phytosanitary Measures (1994) agreed at the Uruguay round of GATT
negotiations. As such, HACCP is a reference point in international trade disputes,
and it is increasingly enshrined in national legislation.
The HACCP procedure is generally targeted at food safety management
(pathogenic microorganisms and their toxins), but, as an approach in the context of
broader quality management, it can be effectively applied to microbiological
spoilage, foreign-body contaminations or pesticide contamination. It is preferable
to conduct a HACCP program with a narrow scope (a ksingle pathogen or possibly
pathogens) rather than attempt to cover an extended list of hazard areas when
documentation will become complex. However, an experienced team might choose
to cover the whole spectrum of hazard areas, depending on:
(a) The resources available to produce and maintain a composite HACCP plan.
(b) The way in which it is to be incorporated into the local quality plan and quality
system (Jervis, 2002).
2.20 Benefits of HACCP
The key benefits of HACCP in the food and dairy industry are many, and can be
summarized as follows:

27
- HACCP has the potential to identify all hazards in the manufacturing
process so that controls can be established to assure food safety/quality.
- HACCP is a systematic approach relevant to all stages of food processing
covering agriculture and horticultural practices, harvesting, processing,
product distribution, and customer practices.
- HACCP is the preferred risk management tool in total quality management.
- HACCP focuses technical resources on critical parts of the process and
provides a cost-effective control of food-borne hazards.
- HACCP facilitates the move from retrospective end-product testing to a
preventative quality assurance approach enabling the manufacturer to get it
right the first time and reduce reject waste.
- HACCP recognized and promoted by international bodies (such as the
Codex Alimentarius Commission) as the system of choice for ensuring food
safety and is becoming enshrined in national legislation. Proactive
application in the food industry will facilitate compliance with developing
legislation and demonstrates a diligent approach to food safety (Jervis,
2002).
2.21 Pre-requisite programmes
Pre-requisite programmes such as GAP, GMP and GHP must be working
effectively within a commodity system before HACCP is applied. If these pre-
requisite programmes are not functioning effectively then the introduction of
HACCP will be complicated, resulting in a cumbersome, over-documented system
(FAO and IAEA, 2001).
Good agricultural practices primary in food production should be managed to
ensure that food is safe and wholesome for the consumer. Farmers should control
production so that contamination of the crop, proliferation of pests, and diseases of

28
animals and plants, do not compromise food safety. Good Agricultural Practices
(GAP), including Good Hygienic Practices (GHP) where appropriate, should be
adopted to make sure that the harvested commodity will not present a food hazard
to the consumer (FAO and IAEA, 2001).
Good manufacturing practices showed establishment design and facilities. The
structure and location of a processing plant needs to be considered in relation to the
nature of operations and risks associated with them (FAO and IAEA, 2001).
Effective control of operation should be in place to reduce the risk of contamination of the commodity or food supply such that it is safe and fit for purpose:
- Adequate time, temperature or humidity controls - Food grade packaging
- Potable water supplies
- Maintenance of equipment (FAO and IAEA, 2001).
Maintenance and sanitation procedures and work instructions should exist to
demonstrate an adequate level of maintenance of an establishment as well as
efficient practices for cleaning, waste management, and pest control (FAO and
IAEA, 2001). Personnel hygiene measures need to be in place to ensure that food
handlers do not contaminate food. This objective can be attained by maintaining an
appropriate level of personal cleanliness and following guidelines for personal
hygiene (FAO and IAEA, 2001).
Transportation method should be such that measures are taken to prevent any
contamination or deterioration of the commodity (FAO and IAEA, 2001). Food
handlers should be trained in personal hygiene, as well as in the specific operation
with which they are working, to a level commensurate with their duties (FAO and
IAEA, 2001). Product information and consumer awareness should be
accompanied by adequate information to ensure that personnel at the next stage in

29
the food chain will handle, store, process, prepare and display the product safely
(FAO and IAEA, 2001).
2.22 Application of HACCP
This detail what needs to be done at each of the HACCP stages, and it refers to
generic flow diagrams and HACCP plan records that have been produced in order
to illustrate the points made. It is essential that each HACCP study be based on the
specific process and product details, and generic plans should never be adopted as
a shortcut to save time and resources. The different sequential stages are as follows
(Jervis, 2002).
2.22.1 Definition terms of reference
Terms of reference should clearly define the scope of the intended HACCP study and address the following points:
- The product to be considered. - The process site and, if relevant, the process line within that site. It is not
advisable to group together apparently similar products and processes where
what might be minor variations in formulation and/or process conditions
could significantly change the preservation characteristics of the product.
- What the study will cover- biological, chemical, or physical hazards (or
combinations of these)- and whether the study will be limited to food safety
considerations or cover broader quality issues (i.e., spoilage). The study will
proceed more quickly if the terms of reference are limited to biological food
safety issues, or even the consideration of one pathogen relevant to the food.
- The point in the process at which safety or other quality attributes are to
meet: at point of manufacture or at point of consumption?

30
2.22.2 Selecta HACCP team
It is important that senior management in the company be made aware of the
resources necessary to carry out an effective HACCP study (personal time,
appropriate meeting room, secretarial support, and the need to consult outside
resources for information) and are committed to providing these resources. The
time required to complete the study will depend on the complexity of the process
and the terms of reference agreed as Stage 1. If resources cannot be assured to
meet the study defined in Stage 1, then the study should not be progressed.
HACCP requires a multidisciplinary approach, and the HACCP team should
include the following skills:
- A quality assurance/quality control specialist who understands the hazards
and risks for the product and process under study. Depending on the study
terms of reference, this might involve a microbiologist or chemist; and, if
this resource is not available in-company, consultation with an eternal
resource might be necessary to obtain information relating to
microbiological risk and hazards.
- A production specialist to contribute details of what actually happens on the
production line throughout all shift patterns.
- An engineer to provide information on:
(a)The operating characteristics of the process equipment under study.
(b) The hygienic design of equipment and buildings.
- Others co-opted onto the team as necessary. These might include specialist
equipment operators, hygiene manager, ingredient and packaging buyers,
and distribution managers. It might also be appropriate to consider co-opting
specialist technicians from companies to which various scheduled
maintenance and calibration functions are contracted (e.g., temperature

31
measurement equipment, pasteurizer plate and jacketed silo integrity, clean-
in place systems).
An individual experienced in HACCP should be nominated as chairman to be
responsible for managing the study. The chairman should have received training in
the principles of HACCP and be experienced in HACCP team work. While
HACCP team members will be selected for their specialist knowledge, it is
important that they will also have a working knowledge of the HACCP procedure
so that they can contribute effectively to the study. Team members may need some
training before commencement of the study, and this can be provided either
internally by the HACCP team or externally.
It is important that a HACCP team member or co-opted person is identified to keep
notes as the work progresses and from which both the HACCP plan and the
HACCP study notes can be derived. HACCP study notes should record
background information and the basis for conclusions reached in sufficient detail to
be helpful when the HACCP plan is reviewed. The HACCP study notes might also
be used as background information in trouble-shooting in the event of product
failure or inadequate outcome from the verification program (Hoolasi, 2005).
2.22.3 Description of the product
The product under study should be fully described. This stage often tends to be
inadequately covered, but diligent attention to detail here is crucial to the
identification of hazards. The product description should be considered against the
following headings and recorded as HACCP study notes:
Composition: All factors that might influence the preservative characteristics of
the food should be recorded. Basic compositional data should be noted including
that on solids/moisture levels, fat levels, type of preservative, if used, etc.

32
Compositional data should also be recorded for any additives used, particularly
where these are supplied as fresh, hydrated materials.
Processing: All relevant processing parameters should be recorded. They should
be validated as giving the required effect with respect to micro-organisms of
concern and the appropriate operating conditions recorded at this stage in a
HACCP study.
Packaging system: The type of packaging should be noted. This note will include
differentiation between shrink wrapping, vacuum packing, and sealed plastic tub
packing. Aseptic or ultra clean packaging regimes should also be noted where
appropriate. In the context of dairy products, it is useful to record the conditions of
storage of intermediate stages of production. The degree of exposure to the process
plant environment during filling should also be recorded.
Storage and distribution conditions: The storage temperature regimes (ambient,
chilled, and frozen) throughout the product shelf life should be recorded where
possible, and this should include anticipated variations (e.g., retail display,
customer’s shopping bag, and home storage conditions).
Required shelf life: The total shelf-life requirement together with “life after
opening” where appropriate, should be recorded.
Instruction of use: Dairy products are usually consumed without further
processing (heating), so that this section should record instructions given with
regard to refrigerated storage (where appropriate) and ‘use within’ times, after
opening, together with overall “use by or best before” dates(Hoolsi, 2005).
2.22.4 Intended use identification
The consumer target group for the product should be noted, different consumer
groups may have varying susceptibilities to the potential hazards (Carol, 2012).

33
2.22.5 Construction of flow diagram
The purpose of a flow diagram in a HACCP study is to elicit a thorough
examination of the process, which is recorded in a way that assists and directs
subsequent stages. There is no specified format to be used in HACCP flow
diagrams, but they should sequentially set out all steps in the process together with
relevant technical data. Consideration should be given to the following:
- The sequence of all process steps within the scope or the study including
rework/recycle loops.
- Interaction of services (e.g., cooling water, air, compressed air, clean-in-
place systems).
- Temperature/time history for all raw materials, intermediate products, and
final products within the scope of the study, together with microbiological
and analytical data with appropriate floor plans and equipment.
- Equipment design with particular attention to ease of cleaning and presence
of void spaces that might accumulate contamination.
- Personnel and hygiene disciplines.
2.22.6 On-site confirmation of flow diagram
The flow diagram produced should be confirmed, on site, by the HACCP team.
Points to be confirmed are that any effect of shift patterns and weekend working
are included on the flow diagram, together with circumstances of any reclaim or
rework activity that might be introduced from time to time. If the HACCP study is
being applied to a proposed new process line/product, flow diagram confirmation
will not be possible. In this case the HACCP plan can be completed, but it must be
subject to review as the line/product is finalized (Hoolasi, 2005).

34
2.30 Principles of HACCP
In theory, the only way of ensuring that every package of yoghurt from a given
production line is safe, from a chemical or microbiological standpoint, is to test
every package. Clearly, such a suggestion is totally impractical, so that instead, a
representative group of packages is withdrawn against a sampling plan appropriate
for the product and the history of the plant. However, whilst this approach is
essential to confirm that preset standards of hygiene are being met and that
potential contaminants are at a low level or absent, the procedure can never prevent
some spoiled packages from reaching the consumer. Consequently, the emphasis
within quality assurance has turned to the avoidance of problems, a concept that
forms the basis of HACCP. In particular, the system identifies seven aspects of
production that merit constant attention and these aspects are enshrined in seven
principles (Tamime and Robinson, 1999).
2.23.1 Listing of all hazards associated with each step and consideration of
any control measure to eliminate or minimize hazard (principle 1)
2.23.1.1 Raw milk
The presence of chemical contaminants in milk can be traced to feeding practices
(aflatoxins, nitrates), animal husbandry practices (pesticides), veterinary therapy
(antibiotics), pollution (lead, radioactive elements) or accidents. These factors must
be controlled at the farm level by the farmers, their associations or cooperatives,
agricultural services and inspection agencies.
Microbiological hazards include the classical zoonotic agents in certain regions of
the world, or the more common contaminants such as salmonella, campylobacter,
listeria, E. coli Staphylococcus aureus, Bacillus cereus etc. Moulds, viruses and
parasites are of less or no concern. Almost all potential microbiological hazards
can be eliminated with a heat treatment (pasteurization or sterilization). B. cereusis

35
an exception; however, illness due to this organism is unlikely to be caused by the
normal use of dairy products (Christiansson, 1993).
2.23.1.2 Additives and supports
The use of fruits and other ingredients in products such as ice-cream, yoghurt and
white cheeses is common nowadays. They should be carefully looked at, because
dairy people may be unfamiliar with their microbiology and chemistry, and
because they are often added after pasteurization. Fermentation is not very
effective in reducing potential microbiological hazards. Proper selection of the
suppliers (based on their application of the HACCP system) and careful choice of
purchasing specifications is therefore very important.
2.23.1.3 Environment of dairy lines
The environment of the dairy lines is an important potential source of hazards. A
line is rarely a closed operation, i.e. with a continuous barrier between product and
line environment from pasteurization until packing. Consequently, the potential
hazards in the line and in environment need to be listed. Salmonellosis, staphylo-
enterotoxicosis and listeriosis epidemiologically linked to dairy products.
However, since the production technologies vary widely, the causative
microorganisms are potential hazards only in some dairy lines. Listeriais not
commonly found in dry, warm environments (Cox, et al., 1989) Staphylococci can
be found, but are rarely a potential hazard (Kleiss, et al., 1994). Preventive
measures are, in all these cases, included in Codes of Good Manufacturing
Practices (IDF, 1994). In critical environments, specific measures may be
necessary to control potential hazards. It is worth mentioning here that a HACCP
system is effective only in lines where good manufacturing practices (GMP) are
followed.

36
2.23.1.4 Packaging material
Other hazards which are less important, but should not be overlooked, are physical
hazards and the hazards related to packaging material. The possibility of the
presence of physical hazards can, of course, never be excluded. Its occurrence is
unlikely because of the hygienic way in which milk is handled. Packaging material
should not be a source of hazards, although returnable glass, as environment-
friendly material, may pose some problems. For each of the hazards concluded to
be significant in the hazard analysis, the HACCP team should identify control
measures that will eliminate the hazard or reduce it to an acceptable level. There
may be more than one control measure required to control a hazard. In other cases,
one control measure at a single point can control more than one hazard (e.g.,
pasteurization eliminates all vegetative pathogens and spoilage micro-organisms).
2.23.1.5 Cleaning
One control measure can be relevant to several process steps where a hazard is
repeated (e.g., application of CIP cleaning or environmental cleaning to control
recontamination). Where no control measure can be identified to control a hazard,
redesign or modification of the process or product formulation may need to be
considered. A final point to note is that in identifying control measures in a
HACCP study on an established product and process, the team should not restrict
consideration to measures already in place but should be prepared to propose other
control measures that might be appropriate.
2.23.2 Establishment of critical control points (principle 2)
The objective of determine CCPs is to systematically assess the hazards and related
control measures identified by considering each process step (as recorded in the
flow diagram) in turn and reaching a conclusion on its “CCP” status before moving
on to the next process step- that is, to identify process steps at which control can be

37
applied and which are essential to prevent or eliminate a hazard or reduce it to an
acceptable level. It is useful to be guided by a CCP decision tree as shown in
Figure 1.
2.23.3Establishment of critical limits for each CCP (principle 3)
A critical limit is a criterion that separates acceptability from unacceptability at
each CCP. It should be measurable in real time (while the process is running) and
might include measurements of temperature/time/pH or acidity, moisture, the
phosphates test for pasteurized milk, ATP methodology to assess cleaning
efficiency, or other observations. A critical limit might be mandatory (e.g.,
pasteurization temperature and time) or based on data collected under good
manufacturing practice where a specific target level and tolerances are set
(Hoolis,2005).
2.23.4 Establishment of a monitoring system for a CCP (principle 4)
Monitoring involves a planned sequence of observations or measurements against
critical limits to assess whether a CCP is under control. Ideally, monitoring should
identify a trend toward a critical limit maximum or minimum so that corrective
action can be taken before the process is out of control and, in any event, should
aim to identify violation of critical limits as soon as possible to minimize the
amount of embargoed/rejected product. Monitoring can be on-line with automated
corrective action (e.g., flow diversion systems on pasteurizers), or they can be off-
line when corrective action might involve the rejection of any product implicated.
Physical and chemical measurements are preferred to microbiological testing
because they can be completed rapidly and often is indicative of conditions that
control the microbiology of the product (e.g., phosphatase test on pasteurized
milk). All record and documented associated with monitoring CCPs must be

38
signed by the person (s) doing the monitoring and by responsible reviewing
official(s) of the company (WHO, 2008).
2.23.5 Establishment of a corrective action plan(principle 5)
This specifies the action(s) necessary when monitoring shows a potential or actual
loss of control at a CCP. The action(s) will aim to bring the process back into
control before critical limits are reached (e.g., a temperature drift from a target of
5ºC to near the tolerance value of 7ºC will call for an engineer to adjust the
refrigerator plant), or it will specify the disposal of product that has breached a
critical limit. Monitoring requirements and corrective action plans should be
considered together by the HACCP team, and a clear decision should be reached
and recorded on responsibilities for corrective actions(Hoolasi, 2005).
2.23.6 Establishment of verification procedures (principle 6)
Verification applies methods, procedures, product tests, and evaluations other than
monitoring, to determine compliance with the HACCP plan. It demonstrates that
the HACCP plan and its application are consistently controlling the process so that
product meets the food safety or quality requirements. The HACCP team should
specify methods and frequency of verification procedures which might include the
following:
- Microbiological examination of intermediate and final product samples.
- Review of complaints from consumers or regulatory bodies and outcomes of
investigations into these complaints, if they were substantiated, indicating
that the HACCP plan did not completely control the process.
- Auditing all monitoring and corrective actions records to establish whether
the HACCP plan is fully implemented and demonstrates control.

39
- Review of validation records and, if appropriate, the application of more
searching tests at selected CCPs to confirm the efficacy of the control
measure.
- Another important aspect of verification is initial validation of the HACCP
plan to determine that the plan is scientifically and technically sound that all
hazard have been identified and that if the HACCP plan is properly
implemented these hazard will be effectively controlled.
2.23.7 Establishment of documentation (principle7)
The complexity and quality of documentation necessary will depend on the size
and type of operation. The key point is that the manufacturer must be able to
demonstrate that the seven principles of HACCP have been correctly applied. To
be effective, HACCP must be fully integrated into the unit quality systems as an
element of total quality management.
The following documentation should be issued as controlled documents:
- The finalized HACCP plan. Process steps assessed as not being CCP’s
should also have critical limits, monitoring procedures, and corrective
actions identified on the HACCP plan, and they can be designated as
control points that contribute to good manufacturing practice.
- Guidelines, procedures and work instructions/records sheets.
Guidelines on good hygienic practice (GHP) are an essential element of the
documentation required. Any issues specific to the HACCP study that are missing
can be covered either by amendment of the guidelines or by inclusion in the
HACCP plan.

40
Procedures cover the following:
- Training for hygiene and operation.
- Personnel hygiene and sickness reporting.
- On-site food services.

41
CHAPTER THREE
MATERIALS AND METHODS
3.1 The study area This study was conducted in DAL Dairy Factory is the name for Blue Nile Dairy’s
with new manufacturing facility and offices. The original plant was in Soba (just
outside Khartoum) constructed in 1996. As the business grew, it was expanded to
meet the demands of the market for delicious tasting, natural dairy products.
Eventually, in 2009, the old plant reached its expanded capacity and plans
designed for the future. A much larger manufacturing facility was therefore
envisioned and in early 2009 an agreement was signed with Tetra Pak of
Sweden to build a new dairy plant.
The new plant (CAPO) was opened in September 2010. It is situated in Bahri
Industrial Area (North Khartoum). CAPO is Sudan's favourite dairy brand,
producing a wide range of tasty and nutritious products, such as yoghurt, fresh and
long life milk, cream and mish. Its own a dairy farm and milk collection centers
(MCCS) for their dairy processing. The raw milk was brought from the farms
through a cooled bulk tank, transferred into the holding tank, and then milk was
pasteurized at 72°C for 15 seconds using HTST plate heat exchanger pasteurizer.
3.2 HACCP plan
Theoretically, the way of ensuring that every package of yoghurt from a given
production line is safe from chemical or microbiological stand point and it is very
difficult to test every package. However whilst this approach is essential
contaminant are at low level or absent. This can never prevent some spoiled
packages from reaching the consumer. The HACCP system aims to identify
specific hazard that, if they arose could adversely affect the safety of stirred

42
yoghurt and to put in place a procedure that will either prevent a hazard arising or
will be able to control the situation in a manner that reduce the risk to the
consumer. In HACCP plan the system identified different aspect of production that
merit constant attention and these aspects are applied practically
First:
Any potential hazard associated with stirred yoghurt production from the growth/
collection of row material through the manufacturing and final product has been
identified.
Second:
The precise points in the above sequence that can be controlled in order to
eliminate a hazard or minimize the risk to public health were defined during stirred
yoghurt production then the step in the process is regarded as critical control point
(CCP). If no major risk is involved, the step identified as critical point (CP).
Third:
Targets have been established in order to claim control over stirred yoghurt
process e.g. total count on product control surface (CCP) or the viscosity of stirred
yoghurt with agreed tolerance (CP).
Fourth:
A monitoring system has been established to record these particular facets of
stirred yoghurt production are under control.
Fifth:
In the case of the (CCP) or (CP) during stirred yoghurt production is not under
control, the corrective action should be implemented immediately.

43
Sixth:
All results during stirred yoghurt production have been kept for documentation. In
addition to the details of all potential, e.g. times/temperatures and microbiological
parameter, but also the responsibilities of the process.
3.3 Materials
Samples were collected at different stage of stirred yoghurt processing as follows:
1- Fresh milk samples: Samples were collected from raw fresh milk
supplied to the factory from each (MCCS)including Alifoun, Tibna and
sayegh replicated every 5 days in four Months (April ̶ July) in cleaned
and steriled bottles for physiochemical and microbial tests.
2- After pasteurization stage: Samples from the milk tanks were collected
immediately after pasteurization replicated every 5 days in four
Months (April - July) in cleaned and steriled bottles for chemical tests.
3- During mixing process: Samples from mixed milk were collected for chemical tests.
4- During fermentation process: Samples were collected from fermented
milk in cleaned and steriled bottles for chemical tests.
5- Final product: 4samples of stirred yoghurt were collected and stored at
refrigeration prior to analysis.
3.4 Chemicals and reagents
- Sulfuric acid (H2SO4 conc., density 1.815 and 1.86gml/ml) (BDH).
- Amyl alcohol (MERCK) Catalyst tables from BDH Laboratory reagents-
BDH Chemicals Ltd Poole England.
- Sodium hydroxide (NaOH) (Scharlau-SO0420). - Phenolphthalein (BDH Chemicals Ltd Poole England).

44
3.5 Product description and intended use
The description of stirred yoghurt in CAPO milk company and the intended use are shown in table (4).
Table (4) product description of stirred yoghurt and the intended use of it: Process/ Product type name Description
1- Product name(s) Plain stirred yoghurt 2- Composition Whole fresh milk; Whole milk powder; skimmed milk
powder; bacterial culture and pectin. 3- Importance product
characteristics pH
4- How it is be use Direct consumption 5- Packaging Plastic cup and foil sealed 6- Shelf life 10 days 7- Where it well be sold Retailers 8- Legal requirement Fat – Total solid 9- Special storage and
distribution control Refrigeratored at ≤ 10˚C

45
3.6 Flow diagram of stirred yoghurt produced at CAPO dairy Company
The manufacturing steps of yoghurt are shown in figure (1). All stages starting
from raw material to end product are presented.
Figure (1): Flow diagram for the manufacture of stirred yoghurt at CAPO dairy Company.
Raw milk silo - CCP
Homogenization
Pasteurization - CCP
Loading milk for mixing tank
Powder mixing
Storage tank
Pasteurization and Homogenization process - CCP
Cooling down to maturation temperature & ferment addition - CCP
Maturation and curd breaking transfer
Cooling down, smoothing and transfer to storage tank
Packing
Storage - CP
Distribution - CP

46
3.7 Determination of the Critical Control Points The CCPS throughout stirred yoghurt production were identified according to the HACCP decision tree recommended by codex (2003) shown in figure (2).
Figure (2) Decision tree to identified CCPS Source: Codex (2003).
Q1 Do control measures exist for the identified hazard?
YES NO
Q1a Is control at this step necessary for safety?
NO
YES
Modified step or process
Not a CCP Stop
Q2 Is the process specified designed to eliminate or reduce the likely occurrence of the hazard to an acceptable level? YES
NO
Q3 Could contamination with identified hazard occur in excess of acceptable level or could this increase to unacceptable level?
YES NO Not a CCP Stop
Q4 Will a subsequent step eliminate identified hazard or reduce likely occurrence to acceptable level?
YES NO Critical control point (CCP)
Not a CCP Stop

47
3.8 Monitoring tests
Total of seven hundred and eighty four analyses were performed physically,
chemically and microbiologically. The fresh milk was collected from milk
collection centers (MCCS) Alifoun, Tibna and Sayegh. The authoritative milk
supply centers. The milk was received in factory via aseptically container truck
daily and physiochemical analyses were immediately carried out under aseptic
condition.
Samples were taken at different stages during yoghurt manufacturing process for
analyses. For microbiological analysis samples were taken aseptically, kept at 1 –
5˚C and analyzed within one hour.
3.8.1 Media preparation
All media were prepared following the instruction and advance of the manufacture.
3.8.2 Plate account agar
Plate account agar was prepared by dissolved 23.5gm of the media (powder) in
1000ml distilled water. Heated to boiling and sterilized by autoclaving at 121°С for
15 min.
3.8.3 Potato dextrose agar
39gm of powder were dissolved in 1000ml distilled water. Heated to boiling and
sterilized by autoclaving at 121°С for 15min.
3.8.4 Violate red bile agar
41.53gm of powder were dissolved in1000ml distilled water, sterilized in an
autoclave at 121°C for 15 min, cooled to 45°C.

48
3.8.5 EMB (Eosin Methylene Blue agar)
36gm of powder were dissolved in 1000ml distilled water, sterilized in an
autoclave at 121°C for 15 min and Overheating was avoided.
3.9 Serial dilution of samples
One ml of each milk sample and1gm of yoghurt sample was weighed aseptically
and added to test tube containing 9ml of sterile diluents and well mixed to give
using sterile pipette 1ml of the last dilution was transferred to test tube ;¹־10
containing 9ml of sterile diluents and well mixed to give 10²־ in the same way
continued to the prepare other serial dilution (Harrigan, 1998).
3.9.1Antibiotic test
Trisensor is a new and completely unique rapid test in a dipstick format for multi-
antibiotic detection in one single operation. It is a receptor assay allowing the
detection of every ß-lactam, Tetracycline and Sulfonamide in milk. This unique
test is extremely user-friendly, fully automated, reliable and takes only 6 minutes
to get the result at 40°C ± 3°C.
3.9.2 Total bacterial count
One ml of each serial dilution was transferred aseptically in to sterile Petri dishes.
15ml of plate count agar were added. The inoculums was mixed with medium and
allowed to solidify. The plates were then incubated at 37˚C for 24 hrs. Plates were
examined and the colonies on every plate were counted then the total viable count
was determined as colony forming unit per ml (cfu/ml) (Harrigan 1998).
3.9.3Total Coliform count
One ml from each sample serial dilution was transferred aseptically in to sterile
Petri dishes. 15ml of violate red bile agar were added to the Petri dishes. The

49
inoculums was mixed with medium and were allowed to solidify. The plates were
then incubated at 37˚C for 48hrs. Colonies with dark red showed appositive test
(Harrigan, 1998).
3.9.4 Yeast and Moulds
One ml from each serial dilution was transferred aseptically in to sterile Petri
dishes. 15ml of potato dextrose agar were added to Petri dish. The inoculums was
mixed with medium and allowed to solidify. The plates were then incubated at
25°С for 72 hrs. The colonies were counted to determine the viable count of yeast
and moulds (Harrigan, 1998).
3.9.5 Swab rinse method
This method was used for the assessment of effective cleaning of milk contact
surfaces e.g. milk transferring pipes, milk valves, filling machine, and milk silos by
transferring the swab in to Petri dish containing plate count agar (Mostert and
Jooste, 2002).
3.10 Chemical and physical analyses
3.10.1 Determination of Total solids
Total solids is consists especially from fat, protein, lactose and minerals. There are
some methods to determine the total solids but the most popular and the easiest in
the use is the equation according to the use of fat content and solids non fat of the
milk or yoghurt. The solids non fat were determine by using the lactometer.
- Milk was well homogenized and transferred to the measurable cylinder and
immersed the lactometer use in the milk.
- The lactometer number in the surface of the milk was recorded and added
for the reading number 0.5(surface tension).

50
- The temperature of the sample was obtained by the thermometer and
standardized the lactometer reading by (+) or (-) 0.2 for any plus or minus of
sample temperature which the lactometer was designed to read according to
it (15.5 ±5˚c).
The total solid were calculated according to the following formula:
S.N.F = 0.3 × Fat +
(Babkoak equation).
T.S content = S.N.F + Fat
Were:
S.N.F ≡ Solids Non Fat.
T.S ≡ Total Solids.
3.10.2Titratable acidity
Titratable acidity was determined according to AOAC (1990) method. Ten
milliters of each samples were placed in a white porcelain dish and four drops of
phenolphthalein indicator were added. Titration was carried out using 0.1N NaOH
until a faint pink color appeared. The titration figure was divided by ten to get the
percentage of lactic acid(1 milliter of 0.1N NaOH sodium hydroxide = 0.009gm of
lactic acid).
3.10.3 pH
The pH was directly measured using a jenway 3510 pH meter at room temperature.
3.10.4 Temperature
The temperature was directly measured by a Digital Thermometer WT-1 WT-1B.
3.10.5 Viscosity
Viscosity was directly determined by the use of the digital Visco Lab – Alpha.

51
3.10.6 Butterfat
The fat content was determined by Gerber method according to AOAC
(1990) method as follows:
Ten ml of sulfuric acid (density 1.815gm/ml at 20°C) was poured into a clean
Gerber tube, followed by the addition of 10 ml of milk sample. Then 1ml of
amyl alcohol and distilled water at 20°C was added. The tubes were
thoroughly mixed till no white particles were seen. The tubes were
centrifuged at 1100 revolution per minute (rpm) for 5 minutes. The tubes
were then transferred to water bath at 65°C for 3 minutes. The fat content
was immediately read.
3.11 Statistical analysis
One way ANOVA test was performed to examine significant difference between
normally distributed data. Tukeyʼs –test was used to perform multiple comparisons
between mean within each specific parameter. Probability level of less than 0.05
was considered significant (p<0.05). All data were analyzed using MINITAB
statistical software for window (2006).

52
CHAPTER FOUR
RESULTS AND DISSCUSION 4.1 Identification of possible hazards in stirred yoghurt
The hazards (microbial, chemical and physical) during steps of stirred yoghurt are
presented in Table (4.1).
4.2 Control measures of hazards
The control measures during processing of stirred yoghurt are presented in Table
(4.1).
4.3 Identification of control point and critical limits
The critical control point was established according to decision tree and divided to
CP (critical point) and CCP (critical control point), also critical control point
included GMP (Good manufacturing practices) according to stirred yoghurt
production step. While critical limits include the parameters limits such as pH >
6.1%, solid non fat >11.2, fat content > 3.0%, antibiotic (negative) and milk
cooling temperature < 5°С Table (4.1).
4.4 Monitoring procedure
4.4.1 Physical quality of fresh milk
4.4.1.1 Temperature of fresh milk
The exposure of milk to high temperature during transportation may favor the
growth of pathogens and the production of heat resistance toxins. There for, this
stage is a CCP because the reception test stands for an acceptance test.

53
The temperature of fresh milk samples collected from milk collection centers
(MCCS) including: Alifoun, Tibna and Sayegh during the study period (April,
May, June and July) are show in Table (4.2).
Statistical analysis showed that there was significant different (p<0.05) in
temperature of Alifoun MCC in May 5.4°С as compared with Tibna and Sayegh
MCC. There was no significant (p<0.05) different between different MCC during
April, June and July, except in May milk from Alifoun differ (Table 4.2). The
differences might be due to variation in the milk handling equipments, milk
handling techniques and lack of cooling system. Nevertheless overall results are in
agreement with that reported by Tamime and Ropenson (1999) who stated that the
temperature of milk in collection center is 0 – 10°С±1°С temperature tolerance.
The pH of fresh milk in MCCS (Alifoun, Tibna and Sayegh) was found to be in the
range of 6.6 to 6.7.as shown in Table (4.3). During the study period (April – July)
there was no significant (p<0.05) different in pH of all different MCCS. These
results are in agreed with Hoolasi (2005) who stated that the pH of raw milk is
6.73. While FAO (1999) reported that the pH of fresh caw milk has a pH value that
ranges from 6.6 to 6.8.

54
Table 4.1: Shows the possible hazards during the manufacturing stirred yoghurt:
Process step Hazards Control measures
Control point
Critical limits Monitoring procedures Corrective action
Raw milk (Received milk)
Presence of micro-organisms.
Microbiological analysis. pH.
CP CP
6 log10 cfu/ml 5 log10 cfu/ml
Coliform 4.10±0.20log10cful/ml TVBC 4.77±0.45 log10 cfu/ml pH 6.71%
Not required
Chemical
Fat content. Total solid content.
CP CP
> 3.0% > 11.2%
3.91 % 12.74 – 13.82%
Not required
Raw milk (Released: tests)
Microbial hazard (Antibiotics)
Antibiotic release test.
CCP
Negative
Negative
Not required
Physical hazard (Foreign material)
.In-line filter. Inspect tanker Before offloading. Quality of Gaskets.
CCP
No damaged gaskets
Raw milk procedure
Daily tanker inspections
Raw milk (Cooling)
Microbial Temperature CP < 10°C Measured temperature 5.4 –8.18 °C
Not required
Raw milk (Silo release)
Microbial
Temperature
CP
Milk to be kept at minimum of 3°C. Within parameters
Measured temperature 5.4 –8.18 °C
Re cooling.
Homogenization Chemical risk Cleaning GMP Good quality and homogenous
Checked for homogeneity Not required

55
Process step Hazards Control measures
Control point
Critical limits Monitoring procedures
Pasteurization Microbial Temperature and time
CCP 95 °C, 10 mint Visual on PC display10 mint
Pasteurization (Transfer of milk to holding tank)
Microbial Microbiological analysis.
CCP 2.3 log10 cfu/ml LPC Mesophilic 1.cfu/ml LPC Thermophiliclog10 cfu/ml
Loading milk for mixing
Microbial Microbiological analysis.
GMP
5 log10 cfu/ml TVBC 4.46- 5.23 log
Powder mixing Physical foreign Material chemical
Production and process control. TS SNF
GMP CP CP
Wash not more than 24 h before. 14 – 15%. 12%.
Visual on PC display 15%. 12.11%
Storage tank Microbial Cleaning GMP Wash not more than 24 h before
Visual on PC display
Pasteurization And homogenization process
Microbial Time and temperature
CCP 95 °C 10 mint Visual on PC display10 mint
Cooling down to maturation temperature and ferment addition
Microbial Time and temperature
CCP 43 - 45°C 3 – 5 hr.
43 °C.

56
Process step Hazards Control measures
Control point
Critical limits Monitoring procedures
Maturation and breaking of curd
Microbial chemical
Cleaning pH
GMP CP
Wash not more than 24 before. 4.2 – 4.4%
Visual on PC display 4.4%
Cooling down, smoothing with filter and transfer to storage tank
Microbial Temperature
CP < 20 ºC 19 ºC.
Packing Microbial Cleaning GMP Wash 24 h before
Visual on PC display
Storage physical Microbial
Temperature Viscosity Yeast and mould
CP
< 10ºC 24 h 46.60–57.83 mPas. Negative
8.85 ºC. 53.17 – 59.68 mPas. Negative
Distribution Microbial Temperature CP < 10ºC 8.85 ºC.

57
4.4.1.2 pH of fresh milk
Table 4.2: Temperature of fresh milk samples collected from different Milk Collection Centers
Temperatures С°
Month Sayegh Tibna Alifoun
7.45 ± 0.78AB 7.81± 1.40A
B 6.90 ± 0.58AB April
7.64 ± 0.69AE 7.61 ± 0.90A
E 5.4±0.60BC May
7.41 ± 0.81AF 8.18 ± 0.76A
F 7.71 ± 0.56AF June
7.07 ± 1.45AG 7.28 ± 1.49A
G 7.05 ± 1.24AG July
* Values are mean ± SD for replicate independent runs. * Values that bearing different superscript letters in the same column are significantly different at P< 0.05. * Values that bearing different subscript letters in the same rows are significantly different at P< 0.05.

58
Table 4.3: pH of fresh milk samples collected from different Milk Collection Centers
pH
Month Sayegh Tibna Alifoun
6.69±0.02AB 6.71± 0.02A
B 6.71 ± 0.01AB April
6.71±0.02AE 6.66± 0.02A
E 6.71 ± 0.03AC May
6.70±0.05AF 6.69± 0.02A
F 6.71± 0.35AF June
6.68±0.02AG 6.68±0.07A
G 6.68± 0.04AG July
* Values are mean ± SD for replicate independent runs. * Values that bearing same superscript letters in the same column are no significantly different at
P< 0.05.
* Values that bearing different subscript letters in the same rows are significantly different at P< 0.05.

59
4.4.1.3 Titratable acidity (TA) of fresh milk
Table (4.4) shows the Titratable acidity of the three MCCs during the study period.
There was no significant (p>0.05) difference in TA of milk collected from different
(MCCS) Alifoun, Tibna and Sayegh. The TA ranged between 0.15 – 0.154% in all
samples (Table 4.4).
These finding are within the range reported by O'' Connor (1994) who stated that
the normal fresh milk has an apparent acidity of 0.14 to 0.16% as lactic acid.
4.4.1.4 Specific gravity (SG) of fresh milk
Referring to results presented in Table (4.5), There was no significant (p<0.05)
difference in SG of milk collected from MCCS.
Tamime (2009) stated that specific gravity of normal milk ranges from 1.027 –
1.035 g per ml with a mean value of 1.032 g per ml. Therefor the results of SG of
milk samples collected from the three MCCS fall within the ranges of Tamime
(2009) finding as show in Table 4.5.
4.4.1.5 Fat content of fresh milk
Table (4.6) shows the fat content of raw milk collected from different MCCS
during the study period. Statistical analysis showed no significant (p<0.05)
difference in fat of milk samples collected in each MCCS. However, there was
significantly (p<0.05) different in fat of Alifoun collection center in May and July
as compared to Tibna and Sayegh MCCS (Table 4.6). This difference might be due
to variability among the breeds of cows, within a bread and stage of lactation and
feeding.
The average of fat content of milk samples from Alifoun, Tibna and Sayegh during
study was 3.97±0.17, 3.86±0.1 and 3.86±0.13% respectively. According to
European Union quality standard for unprocessed whole milk fat content should
not be less than 3.5% (Tamime, 2009).Consequently the average fat content of
milk in this study is within the range of defined standard.

60
Table 4.4: Titarable Acidity (TA) of fresh milk samples collected from milk
Collection Centers
TA%
Month Sayegh Tibna Alifoun
0.152±0.03AB 0.150±0.03A
B 0.151±0.03AB April
0.151±0.03AC 0.154±0.02A
C 0.152±0.03AC May
0.153±0.04AD 0.153±0.04A
D 0.152±0.04AD June
0.152±0.03AE 0.150±0.02A
E 0.151±0.02AE July
* Values are mean ± SD for replicate independent runs.
* Values that bearing same superscript letter in the same column are not significantly different at
P<0.05.
* Values that bearing same subscript letter in the same rows are not insignificantly different at
P< 0.05.

61
Table 4.5: Specific Gravity (SG) of fresh milk samples collected from different
Milk Collection Centers
SG
Month Sayegh Tibna Alifoun
1.03±0.06AB 1.03±0.05A
B 1.030±0.08AB April
1.029±0.05AC 1.029±0.05A
C 1.030±0.06AC May
1.03±0.08AE 1.03±0.06A
E 1.029±0.05AE June
1.03±0.02AF 1.03±0.02A
F 1.028±0.03AF July
* Values are mean ± SD for replicate independent runs.
* Values that bearing same superscript letter in the same column are not significantly different at
P< 0.05.
* Values that bearing same subscript letter in the same rows are not significantly different at P<
0.05.

62
Table 4.6: Fat content of fresh samples collected from different Milk
Collection Centers
Fat%
Month Sayegh Tibna Alifoun
3.92±0.05AB 3.91±0.10A
B 3.94±0.25AB April
3.90±0.15AD 3.86±0.04A
D 4.14±0.16AC May
3.83±0.20AF 3.79±0.11A
F 4.02±0.18AE June
3.96±0.15AS 3.91±0.15A
S 4.13±0.10AH July
*Values are mean ± SD for replicate independent runs.
* Values that bearing same superscript letter in the same column are insignificantly different at
P< 0.05.
* Values that bearing different subscript letter in the same rows are significantly different at P<
0.05.

63
4.4.1.6 Solids non fat (SNF)
In the current study, statistical analysis showed insignificant (p<0.05) difference in
the SNF milk samples collected from each collection centers during the study
period (Table 4.7).
SNF content of milk samples which were collected from Alifoun center in May
(9.17±0.10%) and June (9.50±0.18%) were significantly (p>0.05) higher than
samples which were collected from Tibna and Sayegh. The difference observed in
SNF content of milk could be due to difference in the feeding practices, season,
milking methods and lactation period exerted (suman et al, 1998). While there was
no significant (p<0.05) difference among milk samples collected within each MCC
during April and July (Table 4.7).
The average SNF content of milk samples collected from Alifoun, Tibna and
Sayegh was 9.22±0.6, 8.98±0.50 and 8.98±0.65% respectively. According to
European Union quality standards for unprocessed whole milk, Solid-not fat
content should not be less than 8.5% (Tamime, 2009). Accordingly, the pooled
average SNF content 9.06% observed from the three different milk collection
centers were within the recommended standard.
4.4.1.7 Total Solids (TS)
The nutritional as well as economic value of milk is directly associated with its
solids content. The higher the solid content, the better its nutritional value and
greater the milk product yield (Shearer et al., 2003).
The data in Table 4.7showed no significant (p<0.05) difference in the total solids
(TS) content among milk samples collected from milk collection centers, (Tibna
and Sayegh) throughout the study period, except in July. However there was
significant (p<0.05) difference in TS of milk collected from Alifoun, as compared

64
with that of Tibna and Sayegh collection centers during the study period. On the
other hand, TS of milk samples collected from different collection center differ
significantly (p<0.05) during the study period (Table 4.8).The variation could be
due to difference in breed, feeding and management practices which have
important effects on milk composition and quality (O'' Connor, 1994).
Total solids content of milk samples collected from Alifoun was significantly
(p<0.05) high than samples collected from Tibna and Sayegh during May, June
and July, except in April samples from sayegh center was the highest total solid.
The average total solids content of milk samples collected from Alifoun, Tibna and
Sayegh milk collection centers was 13.9±0.34, 13.08±0.24, 13.12±0.3 and
13.15±0.25% in April, June and July respectively. European Union established
quality standards for total solids content of cow milk is not less than 12.5%
(FAO/WHO, 2007). Therefor, the average total solids content of milk samples in
the present study was within the recommended standard.

65
Table 4.7: Solid Not Fat (SNF) of fresh milk collected from different Milk
Collection Centers
SNF%
Month Sayegh Tibna Alifoun
9.11±0.18AB 9.03±0.08A
B 9.17±0.19AB April
9.00±0.10AD 9.03±0.06A
D 9.17±0.10AC May
8.90±0.23AF 9.01±0.12A
F 9.50±0.18AE June
8.91±0.14AG 8.85±0.24A
G 9.07±0.18AG July
* Values are mean ± SD for replicate independent runs.
* Values that bearing same superscript letter in the same column are insignificantly different at
P< 0.05.
* Values that bearing different subscript letter in the same rows are significantly different at P<
0.05.
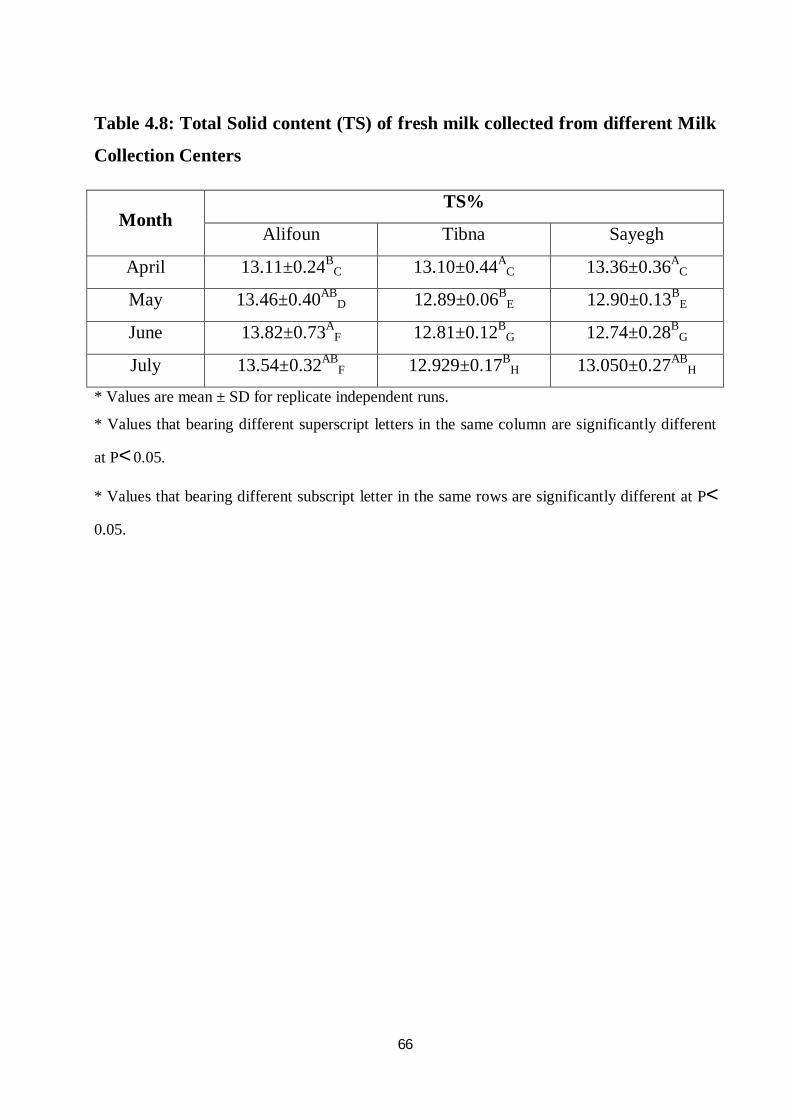
66
Table 4.8: Total Solid content (TS) of fresh milk collected from different Milk
Collection Centers
TS%
Month Sayegh Tibna Alifoun
13.36±0.36AC 13.10±0.44A
C 13.11±0.24BC April
12.90±0.13BE 12.89±0.06B
E 13.46±0.40ABD May
12.74±0.28BG 12.81±0.12B
G 13.82±0.73AF June
13.050±0.27ABH 12.929±0.17B
H 13.54±0.32ABF July
* Values are mean ± SD for replicate independent runs.
* Values that bearing different superscript letters in the same column are significantly different
at P< 0.05.
* Values that bearing different subscript letter in the same rows are significantly different at P<
0.05.

67
4.4.2. Microbiological Analysis
All microbial counts were presented as colony forming units per ml (log cfu/ml) of
milk samples.
4.4.2.1 Coliform count
Table(4.9) displayed total Coliform bacteria count of raw milk collected from
different collection centers MCCS (Alifoun, Tibna and Sayegh) during the study
period in April, May, June and July 2014.
The acceptable limits of Coliform counts in milk should be less than 100 cell/ml (2
log/ml) as stated by Shojaei and Yadollahi (2008). However, Muhammed et al.
(2009) reported higher Coliform count in hot season. Statistical analysis of our
results showed that there was no significant (p<0.05) difference in samples
collected from each MCC during the study period (Table 4.8). Nevertheless,
samples collected from Alifoun milk collection center was significantly (p<0.05)
different as compared to samples collected from Tibna and Sayegh center during
the study period (April – July). The coliform count obtained in this study is in
agreement with that reported by Fekadu (1994) who found coliform counts of
3.8 – 4.0 log10 cfu/ml. Zelalem and Bernard (2006) obtained higher coliform count
of 6.57 log10cfu/ml for cows’ milk collected from different producers. The higher
coliform count explained by the initial contamination of the milk samples either
from the cows, the milkers, milk containers and the milking environment. Thus,
extension services and training of farmers in milk handling practices are required
to improve the quality of raw milk. In addition, the high number of coliform count
indirectly revealed the farms were not properly mange due to poor personal
hygiene practices throughout the milking process. Furthermore, the contaminated
utensils especially the milking churns, teats cup or any utensils that intact with raw
milk might influence the microbial quality of raw milk along the chain. Coliform
count regularly in excess of 100 cfu/ml is considered by some authorities as

68
evidence of unsatisfactory production hygiene. Sporadic high coliform count may
also be a consequence of unrecognized coliform mastitis, mostly caused by E.Coli.
The coliform micro-organisms are found also on the surface of the under washed
or moisture milking equipment (Barmley, 1990).
The existing results showed that the microbial quality of raw milk obtained from
Alifoun MCC was high as compared with Tibna and Sayegh MCC during the
study period (Table 4.9).

69
Table 4.9: Coliform bacterial count of different Milk samples collected from
milk Collection Centers
Coliform (log10 cfu/ml)
Month Sayegh Tibna Alifoun
4.48±0.09AC 4.56±0.15A
C 3.26±0.45AB April
4.51±0.15AE 4.61±0.04A
E 3.02±0.14AD May
4.56±0.04AG 4.63±0.05A
G 3.35±0.67AF June
4.42±0.11AK 4.60±0.10A
K 3.29±0.65AH July
* Values are mean ± SD for replicate independent runs.
* Values that bearing same superscript letter in the same column are insignificantly different at
P< 0.05.
* Values that bearing different subscript letter in the same rows are significantly different at
P< 0.05.

70
4.4.2.2 Total viable bacterial count (TVBC)
Table (4.10) illustrated total viable count of raw milk samples collected from
different MCCS (Alifoun, Tibna and Sayegh) during the study period in April,
May, June and July 2014. Statistical analyses did not reveal any significant
(p<0.05) difference in TVBC of milk samples collected from Tibna and Sayegh
centers except in June. While the milk samples collected from Alifoun center was
significantly (p<0.05) different from samples collected from Tibna and Sayegh
center, except in April. Total viable count of raw milk samples collected from each
center (Alifoun, Tibna and Sayegh) within the study period were significantly
(p<0.05) different.
TVBC of milk samples collected from Alifoun in April (4.7±0.11 log10 cfu/ml) and
June (4.75±0.16 log10 cfu/ml) were similar and that in July and May significantly
(p<0.05) different. While milk samples collected from Tibna center in May
(5.06±0.12 log10 cfu/ml) and July (5.23±0.34 log10 cfu/ml) are reached the highest
TVBC among MCCS during the study period. Milk samples collected from Sayegh
center showed the high TVBC reading in May 5.04±0.07 log10 cfu/ml. The higher
TVBC of milk may be due to in efficiency of cooling system and cross microbial
contamination. According to the Regulative EU (Regulation 853, 2004) the
average total number of micro-organisms should not exceed 100.000 per ml (5
log10 cfu/ml) of raw cow’s milk from primary production. To avoid the increase of
the number of micro organisms the European Regulative 853 (2004) recommends
that immediately after milking, milk must be held in a clean designed place
equipped well to avoid contamination. The milk must be cooled immediately to not
more than 8 °C in the case of daily collection, or not more than 6 °C if collection is
not daily. During transport the cold chain must be maintained and on arrival at the
establishment of destination, the temperature of the milk must not be more that
10°C (Regulation EC 853, 2004).

71
Fekadu (1994) reported that the minimum and maximum total bacterial count of
raw cows’ milk to be 6 to 8.8 log10cfu/ml. The results of raw milk samples
collected from the three different sources were less than the ranges stated by
Fekadu (1994) finding as shown in (Table 4.10).

72
Table 4.10: Total Viable bacterial count (TVBC) of different Milk samples
collected from milk Collection Centers
TVBC (log10cfu/ml)
Month Sayegh Tibna Alifoun
4.88±0.27BCE 4.98±0.44BC
E 4.72±0.11ABE April
5.04±0.07AF 5.06±0.12C
F 4.60±0.06BG May
4.63±0.45CK 5.23±0.34C
R 4.75±0.16ABK June
4.42±0.11BS 4.46±0.43B
S 4.83±0.23AN July
*Values are mean ± SD for replicate independent runs.
* Values that bearing different superscript letters in the same column are insignificantly different
at P< 0.05.
* Values that bearing different subscript letters in the same rows are significantly different at
P< 0.05.
73
4.4.2.3 Mesophilic bacteria lab pasteurization count
Table (4.11) show Lab pasteurization count (Mesophilic bacteria) of milk samples collected from different MCCS during the study period April – July 2014.
Statistical analysis of results showed no significant (p<0.05) difference in
Mesophilic bacteria of milk samples collected from each specific MCC whiten the
study period. While Mesophilic bacteria from Alifoun center was significantly
(p<0.05) differences compared to Tibna and Sayegh centers in April, May and
June. Mesophilic bacteria of milk sample from Alifoun was lower than Tibna and
Sayegh MCCS (Table 4.11).
According to the national sanitary standards, the acceptable amount of total
Mesophilic bacteria count in pasteurized milk is less than 4.699 log cfu/ml (Berry
2004). There for, the Mesophilic bacteria results of raw milk samples collected
from three MCCS (1.08 – 1.59 log10 cfu/ml) was less than that reported by Berry
(2004) finding (4.699 log10 cfu/ml).
4.4.2.4 Thermophilic bacteria lab pasteurization count
Table (4.12) presented Lab pasteurization count (Thermophilic bacteria) of milk
samples collected from different MCCS during the study period April – July 2014.
There was no significant (p<0.05) difference the Thermophilic bacteria of milk
samples collected from each specific MCC within the study period (Table 4.11).
Despite the fact that there is significant (p<0.05) difference in Thermophilic
bacteria of milk samples collected from different MCCS (Alifoun, Tibna and
Sayegh) within each month of study. Thermopilic bacteria of milk samples
collected from Tibna and Sayegh MCCS was high than that from Alifoun. There
for, Alifoun milk collection present the best center on milk microbial quality. One
the other hand swap total plat count for surfaces and manufacture unit was negative
throughout the study period (Table 4.13)

74
Table 4.11: Total lab pasteurization count (LPC) for Mesophilic bacteria of
different milk samples collected from milk collection centers (MCCS)
LPC mesophilic (log10 cfu/ml)
Month Sayegh Tibna Alifoun
1.57±0.26AD 1.71±0.21A
D 1.33±0.20AC April
1.57±0.15AF 1.59±0.12A
F 1.32±0.21AE May
1.58±0.10AH 1.64±0.17A
H 1.20±0.14AG June
1.78±0.25AK 1.66±0.24A
K 1.08±0.29AK July
* Values are mean ± SD for replicate independent runs.
* Values that bearing same superscript letter in the same column are insignificantly different at
P< 0.05.
* Values that bearing different subscript letter in the same rows are significantly different at P<
0.05.

75
Table 4.12: Total lab pasteurization count (LPC) for Thermophilic bacteria of
different milk samples collected from milk collection centers (MCCS)
LPC Thermophilic (log10 cfu/ml)
Month Sayegh Tibna Alifoun
1.17±0.37AC 1.33±0.16A
D 1.07±0.24AC April
1.23±0.09AG 1.28±0.06A
G 1.00±0.11AF May
1.24±0.11AH 1.34±0.17A
B 0.92±0.56AH June
1.37±0.13AK 1.22±0.17A
K 0.53±0.45AM July
* Values are mean ± SD for replicate independent runs.
* Values that bearing same superscript letter in the same column are insignificantly different at
P< 0.05.
* Values that bearing different subscript letter in the same rows are significantly different at P<
0.05.

76
Table 4.13: Total plate count (TPC) for swap surface and rinse water
Month
TPC (cfu/ml) Rinse water surfaces
April -ve -ve
May
-ve -ve
June -ve -ve
July
-ve
-ve

77
4.4.3 During mixing process
4.4.3.1 Titarable acidity (TA) of milk yoghurt
Table (4.14) showed Titarable acidity of milk yoghurt during mixing process. The
TA during mixing throughout the study period ranged between 0.21 – 0.22%.
There were no significant (p>0.05) difference in TA of samples collected from
each specific month during the study period.
4.4.3.2 Total solid (TS) content of milk yoghurt
Table (4.15) presented the total solid of mixed milk yoghurt during the study
period. The TS during mixing throughout the study period ranged between 15.15 –
15.25%. Statistical analysis did not revealed significant (p<0.05) different in total
solids of samples at mixing stage in each specific month of the study period (Table
4.15). These results were similar to Tamime and Robinson (1999) who stated that
milk solids contents of many commercial yoghurt products ranged between 14 –
15%.
4.4.3.3 Solids non fat (SNF) content of milk yoghurt
SNF during mixing throughout the study period ranged between 12.11 – 12.21%.
The solids non fat did not differ significantly (p>0.05) during mixing stage in each
month of the study period (Table 4.16).
4.4.3.4 Fat content of milk yoghurt
Table (4.17) showed fat content of milk yoghurt during mixing process. Statistical
analysis did not indicate any significant (p>0.05) difference during mixing stage in
each month throughout the study period.
4.4.3.5 Specific gravity (SG) of milk yoghurt
Specific gravity of milk yoghurt explain did not show significant (p<0.05) different
during mixing process in each month throughout the study period (Table 4.18).

78
Table 4.14: Titarable acidity (TA) of mixed milk during mixing process
TA% Month
0.22±0.03A April
0.22±0.2A May
0.22±0.02A June
0.21±0.02A July
*Values are mean ± SD for replicate independent runs.
* Values that bearing same superscript letter in the same column are not significantly different at
P< 0.05.

79
Table 4.15: Total Solid (TS) of mixed milk during mixing process
TS% Month
15.15±0.08A April
15.15±0.15A May
15.2±0.14A June
15.25±0.07A July * Values are mean ± SD for replicate independent runs.
* Values that bearing same superscript letter in the same column are not significantly different at
P< 0.05.

80
Table 4.16: Solid Non Fat (SNF) of mixed milk during mixing process
SNF% Month
12.11±0.07A April
12.11±0.11A May
12.17±0.14A June
12.21±0.07A July * Values are mean ± SD for replicate independent runs.
* Values that bearing same superscript letter in the same column are not significantly different at
P< 0.05.

81
Table 4.17: Fat content of mixed milk during mixing process
Fat% Month
3.04± 0.07A April
3.04± 0.05A May
3.02± 0.05A June
3.06± 0.08A July * Values are mean ± SD for replicate independent runs.
* Values that bearing same superscript letter in the same column are not significantly different at
P< 0.05.

82
Table 4.18: Specific gravity (SG) of mixed milk during mixing process
SG Month
1.043± 0.02A April
1.042± 0.03A May
1.040± 0.04A June
1.042± 0.01A July * Values are mean ± SD for replicate independent runs.
* Values that bearing same superscript letter in the same column are not significantly different at
P< 0.05.

83
4.4.4 After pasteurization process
The pasteurization process is important step as it plays a role in the destruction and
/or changes in the physic-chemical properties of the milk constituents and
fermentation temperature will impact on the physical characteristics and sensory
properties of the end product (Hoolasi, 2005).
Specific gravity, Solid non fat, total solid and overall temperatures after
pasteurization process are shown in Table 4.19, 4.20, 4.21 and 4.22 respectively.
Statistical analysis did not revealed any significant (p<0.05) difference in specific
gravity, solid non fat, total solid content and overall temperature after
pasteurization stage in each specific month throughout the study period in April ̶
July 2015.
4.4.5 During fermentation process
Total solid content, pH, viscosity and cooling temperature are shown in Tables
4.23, 4.24, 4.25 and 4.26 respectively.
Statistical analysis showed significant (p<0.05) difference in total solids during
study period. The average total solids content of stirred yoghurt was 16.50. These
results are in line with findings of Muhammad et al. (2005) who reported that the
highest range of total solids in yoghurt to reach17.1%, due to addition of skimmed
milk powder during the mixing of milk yoghurt. According to Soukoulis et al.,
(2007) the addition of skim milk powder tends to improve the textural quality and
decrease the vulnerability of yoghurt to syneresis. Whereas the pH, viscosity and
cooling temperature of stirred yoghurt during fermentation process was not
significantly (p>0.05) difference during the study period (Table 4.23, 4.24 and
4.25). These results were in agreement with Tamime and Robinson (1999), who
reported that when yoghurt have reached the desired pH of 4.6,it is partially
cooled to 20°C before fruit or flavoring ingredients are added.
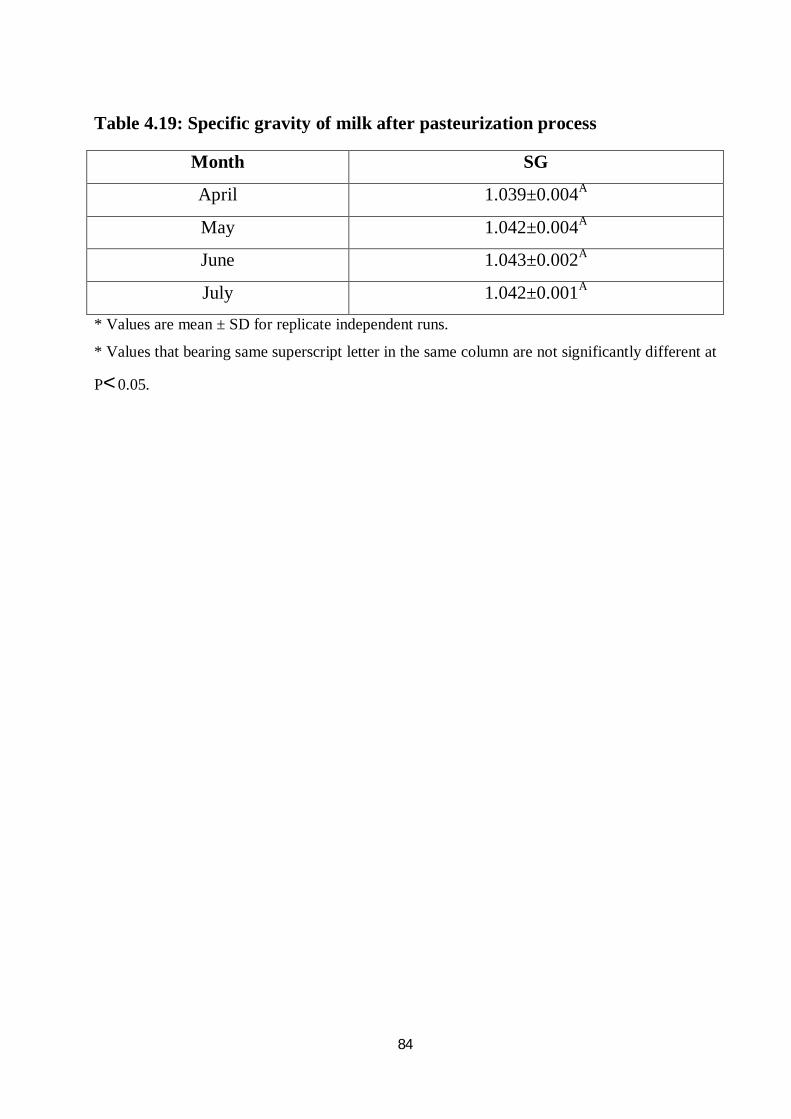
84
Table 4.19: Specific gravity of milk after pasteurization process
SG Month
1.039±0.004A April
1.042±0.004A May
1.043±0.002A June
1.042±0.001A July
* Values are mean ± SD for replicate independent runs.
* Values that bearing same superscript letter in the same column are not significantly different at
P< 0.05.

85
Table 4.20: Solid Non Fat content (SNF) of milk after pasteurization process
SNF% Month
12.13± 0.06A April
12.15± 0.11A May
12.22± 0.12A June
12.11± 0.03A July * Values are mean ± SD for replicate independent runs.
* Values that bearing same superscript letter in the same column are not significantly different at
P< 0.05.

86
Table 4.21: Total Solid content (TS) of milk after pasteurization process
TS% Month
15.16±0.03A April
15.20±0.15A May
15.26±0.11A June
15.17±0.08A July * Values are mean ± SD for replicate independent runs.
* Values that bearing same superscript letter in the same column are not significantly different at
P< 0.05.

87
Table 4.22: Temperature of milk after pasteurization process
Temperature С° Month
43.0±0.57A April
42.4±0.53A May
42.8±0.69A June
43.0±0.81A July * Values are mean ± SD for replicate independent runs.
* Values that bearing same superscript letter in the same column are not significantly different at
P< 0.05.

88
Table 4.23: Total Solid of stirred yoghurt during fermentation process
TS% Month
17.48±2.03A April
17.08±1.90AB May
16.31±1.20AB June
15.16±0.12B July * Values are mean ± SD for replicate independent runs.
* Values that bearing different superscript letters in the same column are significantly different
at P< 0.05.

89
Table 4.24:pH of stirred yoghurt during fermentation process
pH Month
4.6±0.032A April
4.6±0.030A May
4.9±0.77A June
4.6±0.033A July * Values are mean ± SD for replicate independent runs.
* Values that bearing same superscript letter in the same column are not significantly different at
P< 0.05.

90
Table 4.25: Viscosity of stirred yoghurt during fermentation process
Viscosity mPas Month
30.2±8.12A April
29.6±4.01A May
33.0±4.3A June
32.4±2.95A July * Values are mean ± SD for replicate independent runs.
* Values that bearing same superscript letter in the same column are not significantly different at
P< 0.05.

91
Table 4.26: Cooling Temperature of stirred yoghurt during fermentation
process
Temperature С° Month
19.85±1.46A April
19.00±1.00A May
20.7±1.97A June
19.57±1.93A July
* Values are mean ± SD for replicate independent runs.
* Values that bearing same superscript letter in the same column are significantly different at P<
0.05.

92
4.4.6 Analysis of final product
4.4.6.1 pH of final stirred yoghurt
Table (4.27) showed the pH of final stirred yoghurt product. Statistical analysis did
not showed significant (p>0.05) difference in pH of final product during the study
period in April – July. These results were in agreement with Early (1998), who
declared that fermentation will be arrested at approximately pH 4.2 – 4.4, or even
at lower pH of 3.8 – 4.0.
4.4.6.2 Viscosity of final stirred yoghurt
Table (4.28) showed the viscosity of final stirred yoghurt during the study period.
Statistical analysis showed significant (p<0.05) increasely. The highest score of
viscosity was in July (59.68±1.77 mPas (millipascal seconds) followed by June,
May and then April in descending order.
Viscosity values of stirred yoghurt ranged from 57.83 mPas after 30 sec. to 46.60
mPas after 120 sec. Viscosity decreased by 11.23 mPas during shearing. Denin et
al (2002) concluded that the hydrophilic properties of acid casein gel is produced
from milk heat treated at 90ºC and tends to increase during storage, which has
positive influence on the viscosity of stirred yoghurt.
4.4.6.3 Yeast and moulds
Table (4.29) shows that yeast and moulds of samples collected from CAPO stirred
yoghurt during each month of the study period. Total yeast and moulds in stirred
yoghurt were to be nill. Abdelrazig (2008) stated that the yeast and mould were
found to be nill, but Abdall (1997) reported that 100cfu/ml of yeast and mould has
been given the good quality.

93
4.4.6.4 Temperature of final product
Table (4.30) shows the temperature of final stirred yoghurt. Statistical analysis
showed no significant (p>0.05) difference in temperature of final stirred yoghurt in
each month during the study period, which ranged between 8.14 – 8.85°C This
result was in agreement with Early, (1998) who stated that a temperature of 8 –
10°C is optimal, depending upon storage time. Intermediate storage should be as
short as possible since physical changes take place can affect the final yoghurt
quality.
4.5 Corrective action
As shown in Table 4.1 and based on critical limits and monitoring procedure no
correction action require to modify the process.

94
Table 4.27: pH of final stirred yoghurt
pH Month
4.43± 0.04A April
4.42± 0.06A May
4.43± 0.02A June
4.43± 0.04A July * Values are mean ± SD for replicate independent runs.
* Values that bearing same superscript letter in the same column are not significantly different at
P< 0.05.

95
Table 4.28: Viscosity of final stirred yoghurt
Viscosity( mPas) Month
53.17±4.19B April
56.92±5.64AB May
58.65±3.48AB June
59.68±1.77A July * Values are mean ± SD for replicate independent runs.
* mPas (millipascal seconds). 1mPas = 1CP.
* Values that bearing different superscript letters in the same column are significantly different
at P< 0.05.

96
Table 4.29: Yeast and moulds of final product
Yeast and mould cfu/ml Month
-ve April
-ve May
-ve June
-ve July

97
Table 4.30: Temperature of final stirred yoghurt
Temperature °С Month
8.85±1.34A April
8.42±2.76A May
8.14±1.77A June
8.85±1.57A July * Values are mean ± SD for replicate independent runs.
* Values that bearing same superscript letter in the same column are not significantly different at
P< 0.05.

98
CHAPTER FIVE
CONCLUSION AND RECOMMENDATIOS
5.1 Conclusions
The findings of the present study evaluate implementation of HACCP in stirred
yoghurt plant in Capo Company during the study period. Sample was successfully
collected to indicate proper control during application of HACCP in the production
line. All results recorded during monitoring step (physical, chemical and
microbiological) did not deviate from standard values of each specific quality
parameter (Raw milk pH 6.6%, TA 0.151%, fat 3.9%, SG 1.030% and TVBC 4.72
log10cfu/ml. During mixing step TS 15.5%, SNF 12.11%. After pasteurization SG
1.039%, SNF 12.11% and TS 15.16%. During fermentation pH 4.6%, viscosity
30.2 mPas and Temperature 43°С. Final stirred yoghurt pH 4.43%, viscosity
ranged between 53.17 ̶ 59.68 mPas, negative yeast and mould and cooling
temperature 8.14°С.
According to microbial results the tested samples which collected from Alifoun
MCC showed best results during the study period. This may be attributed to the
applied proper sanitation and good manufacturing practice (GMP).

99
5.2 Recommendations
From this study it can be recommended that:
1. The application of HACCP system and identifying critical points is
important and should be a comprehensively exercised and approached on a
scientific basis in dairy food factories.
2. In the case of stirred yoghurt manufacturer, the quality of raw milk can be
improved by the implementation of HACCP at farm level (milk suppliers to
the company).
3. Adequate sanitary measures should be taken at stage from production of raw
milk to processing of stirred yoghurt especially during collection of raw
milk from Tibna and Sayegh MCCS. These measures include proper
handling of the cow, personnel hygiene, use of hygienic milking and
processing equipments.
4. Ongoing education, training and motivation of all personnel on HACCP
principles are essential, especially when employee turnover is high. The
implementation process should be undertaken as any other project in the
company such as the installation of a new production line, the launch of a
new product, and others.
5. A suggestion for future research in stirred yoghurt production is to be
established, in detail for best investment in Sudan.

100
References: Abdall, H.A (1997). Effect of addition on the composition and sensory
characteristic of yoghurt. M.Sc. Thesis. Khartoum University, Sudan.
Abdelrazig, E.B. (2008). Quality assurance of different type of yoghurt in state
markets. M.Sc. Thesis. Sudan University of Science and Technology,
Sudan.
Ahamed, T.k. (1987). The production of mudalgona cheese from enlfrent milk
sources. M.Sc. Thesis University of Khartoum. Sudan.
Anita, S.W. (2001). The role of milk in the British diet. International Journal of
Dairy Technology. 54: pp 1 - 30.
Banwart, G.J. (1981). Basic food Microbiology.2ⁿᵈ edition, Avi. Publishing Co.,
New York, U.S.A., pp 112-135.
Benezech. T, and Maingonnat J.F, (1994). Characterization of the rheological
properties of yogurt. Journal of Food Engineering.21 volume (4): pp 447
– 472.
BNF, (2002). Enzyme defects and food intolerance. In Adverse Reactions to
Food, Buttriss J, ed. Oxford: Blackwell Science. pp 104–111.
Bordy, T. (1999).Inorganic nutrients. Nutritional Biochemistry. 2ⁿᵈedition.
Academic Press. San Diego., pp 761-794.
Bramley, A.J. and McKinnon, C.H. (1990).The Microbiology of Raw Milk. In:
Dairy Microbiology, I, (Ed.: Robinson, R.K.). London, New York,
Elsevier Applied Science, p 171.
Caplice, E. and Fitzgerald, G.F (1999). Food Fermentation: role of microorganisms
in food production and preservation. International Journal of Food
Microbiology. 50: pp 131-149.
101
Carol A. Wallace, (2012). A text for level 3 HACCP courses and a reference for
implementation of HACCAP. 3ed edition. Published by HIGHFIELD. CO.
UK LIMITED. pp 5-6.
Christiansson, A., (1993). The toxicology of Bacillus cereus. International Food
Safety News, volume 2: pp 2-5.
Clevel and, J.; Montville, T.J.; Nies, I.F. and Chikinads, M.I. (2001). Bacteriocins:
Safe natural antimicrobial or Food preservation. International Journal of
Food Microbiology. 71: pp 1-20.
Code of Federal Regulations. (2011). Title 21, Chapter 1, Subchapter B, Part 131,
subpart b, 131.203: Low fat yogurt.
Codex Alimentarius. (2003). Food Hygiene Basic Texts, 3rd Edition.
Cousin, M.A (1982). Presence and activity of psychrotrophic microorganisms in
milk and dairy products: a review. Journal of Food protection, 45: pp 175-
207.
Cox, L.J., Kleiss, T., Cordier, J.-L., Cordellans, C., Konkel, P., Pedrazzini, C.,
Beumer, R. and Siehenga, A. (1989) Listeria spp. in food processing,
non-food and domestic environments. Food Microbial, volume 6: pp 49-
61.
De Lorenzi L, Pricl S, Torriano G. (1995). Rheological behaviour of low fat and
full-fat stirred yogurt. International Dairy Journal 5: pp 661-671.
Death, C.H. (1984).Yoghurt and cultured products. Journal. Dairy Technology,
39(3): pp 111-113.
Denin - Djurd jević , J., Maćej , O., Jovanović , S. (2002).The influence of dry
matter, applied heat treatment and storage period on the viscosity of
stirred yogurt. J. Agric. Sci. Volume 47 (2), pp189-204.

102
Dirar, H.A. (1993). Gariss. Dairy Products. In: The indigenous fermented foods of
the Sudan and Nutrition. A Study in African food and Nutrition. First
edition, University Pres, Cambridge.
Early, R.E. (1998).Technology of Dairy Products, 2nd edition. London: Blackie
Academic and Professional, Chapter 4, p. 124.
Elmardi, M.M.M (1988). A study on fermented milk (Roub). M.Sc. Thesis.
University of Khartoum. Sudan.
FAO (Food and Agriculture Organization of the United Nation). (1999). The
technology of traditional milk products in developing countries. FAO
Animal production and Health Paper 85.Food and Agricultural
organization of United Nation, Rome, Italy. pp 333.
FAO and IAEA(2001). Food and Agriculture Organization and International
Atomic Energy Agency (2001). Manual on the application of the HACCP
system in Mycotoxin prevention and control .Food and Agriculture
Organization of the United Nation, Rome.
FAO/WHO (Food and Agriculture Organization of United Nation/World Health
Organization).(2007). Milk and milk products.1stedition, FAO/WHO of
United Nation. Rome, Italy.
Fekadu Beyene,(1994). Present situation and future aspects of milk production,
milk handling and processing of dairy products in Southern Ethiopia.
Food production strategies and limitations: The case of Aneno, Bulbula
and Dongora in Southern Ethiopia. PhD. Thesis, Department of Food
Science. Agricultural University of Norway, Norway.

103
Fox, P.F. and Mc Sweeney, P.L.H. (1998). Dairy Chemistry and Biochemistry.
Blackie Academic and professional imprint of Champan and Hall,
London.
Fuquay, J. W., P. F. Fox and P. L. H. Mc Sweeney, (2011).Encyclopedia of Dairy
Sciences. 2nd edition, Academic Press imprint of Elsevier, London, UK.
Gaze, J.E. (1992). The importance and control of Colstridium botulinum in
processed food. British Food Journal. 94(1): pp 8-15.
Gilmour, A. and Rowe, M.T. (1990). Microorganisms associated with milk.
International Dairy microbiology, 2ⁿᵈedition.by Robinson, R.K. Elsevier
Applied Science, London., pp: 37-47.
Hantsis-Zaharov, E and Halpern, M. (2007). Culturable psychrotrophic bacterial
communities in raw milk and their proteolytic and lipolytic traits. Appl.
Environ. Micro, 73(22): pp 7162-7168.
Harju,M. (1991). Lactose, its derivatives and their hydrolysis. Journal of Dairy
Science, 49: pp 1-47.
Harrigan,W.F.(1998). Labrotary methods in food microbiology, 3rd edition,
Academic press, Sandiego and London.
Heller, K.J. (2001). Probiotic bacteria in fermented food: product characteristics
and starter organism. American Journal of Clinical Nutrition 73: pp 374-
379.
Hillerton J.E., Berry E.A. (2004). Quality of the Milk Supply: European
Regulations Versus Practice. Institute for Animal Health, Compton.
Hoolasi, K. (2005). A HACCP study on yoghurt manufacture. M.Sc. Thesis.
Durban institute of technology. South Africa.
IDF (International Dairy Federation). (1994). Recommendations for the hygienic
manufacture of milk and milk based products. Bull. International Dairy
Federation, 292: p 41.

104
IDF, (1994).Recommendation for the hygienic manufacture of milk and milk
based-products. International Dairy foods. Bull. No. 292. Brussels,
Belgium.
IDF/FAO (2004). Guide to good dairy farming practice. A joint publication of the
International Dairy Federation and the Food and Agriculture Organization
of the United Nations, Rome, Italy, p.1.
International Dairy Federation (1997). Determination of Fat Content, Standard
152A, Brussels: International Dairy Federation.
Jay, J.M (2000). Fermentation and fermented dairy products. Modern Food
Microbiology, 6thedition.Aspen publishers, Gaithersburg, U.S.A.
Jensen, R.G,; Ferris, A.M. and Lammi-Keefe, C.J (1991). The composition of milk
fat. Journal of Dairy Science, 74: pp 3228-3243
Jervis, D. (2002). Application of process control. In: Dairy Microbiology
Handbook, 3rd edition. R.K. Robinson (edition). New York: Wiley-
Interscience, pp. 593–654.
Johnson, H.A. (1980). The composition of milk In: Fundamentals of Dairy
chemistry, 2ⁿᵈedition.,Webb, A.VI. publishing Col., west port
connection., U.S.A.
Johnson, H.A. (1986). Modern Food Microbiology, 3ʳᵈ edition. Van Nostrand
Reinhold Company, New Yourk.
Kasthurie, Hoolasi, (2005).A HACCP study on yoghurt manufacture. M.Sc. Thesis
in Department of Operations & Quality Management in the Faculty of
Commerce at the Durban Institute of Technology.
Kleiss, T., van Schothorst, M., Cordier, J.-L. and Untermann, F. (1994).
Staphylococci in a whey powder plant environment: an ecological
survives as a contribution to HACCP studies. Food Control, 5: pp 196-
199.

105
Kosikowski, F. (1982).Cheese and fermentation Foods, 2ndedition. Kosikowski and
Associates, New York. U.S.A.
Kroger, M., Kurmann, J. A., and Rasic, J. L. (1989).Fermented milks- past,
present, and future. Food Technology, volume 43:pp 92-99.
Kuippers, O.P.; Buist, G. and Kok, J. (2000).Current strategies for improving food
bacteria. Research of Micro, 151: pp 815-822.
Lück, H. (1981). Quality Control in the Dairy Industry. In: R.K. Robinson,
(edition). Dairy Microbiology, the Microbiology of Milk Products. Vol. 2.
London: Applied Science, pp. 279–324.
McKinley, MC. (2005). The nutrition and health benefits of yoghurt. Review.
Society of Dairy Technology 58: pp. 1–12.
Mostert, J.F. and Jooste, P.J. (2002).Quality control in the dairy industry. In: R.K
Robinson, (edition). Dairy Microbiology Handbook, 3rd edition. New
York: Wiley-Interscience, pp. 663-669.
Muhammad, B.F., M.M. Abubakar and E.O. Oyawoye, (2005).Effects of culture
concentration and inoculation temperature on physicochemical, microbial
and organoleptic properties of yogurt. Nig. Food J., Volume 23: pp156-
165.
Muhammed K, Altaf I, Hanif A, Anjum A, Tipu M. (2009). Monitoring of
Hygenic status of Raw milk marketed in Lahore City, Pakistan. J. Animal
Plant Science. Volume19 (2): pp 74-77.
Murphy, S.C. and Boor, K.J.(2000). Trouble shooting sources and causes of high
bacterial counts in raw milk. Dairy Food and Environmental Sanitation,
20(8):606-611.
NACMF (National Advisory Committee on Microbiological Criteria for Foods).
1997. Hazard Analysis and Critical Control Point principles and

106
Application Guidelines. Journal of Food Protection. Volume 61. pp 762-
775.
Noziere, P; Graulet, B; Lucas, A, Martin, B; Graulet, P. and Doreau, M. (2000b).
Carotenoids for ruminants: from forages to dairy products. Amim. Feed
Sciences and Technology. 131: pp 418-500.
Nriagu, J.O. and Simmons, M.S. (1990).Food Contamination from Environmental
Sources, 1st edition. Wiley- Interscience, pp. 410-415.
O.M.A. Mohamed, M.M.E. Fatima,(2011). The impact of applying some hygienic
practices on raw milk quality in Khartoum State, Sudan, Res. J. Agric &
Biol. Sci. Volume 7(2), pp 169-173.
O''Connor C B.(1994).Rural Dairy Technology. ILRI training manual No.1.
International Livestock Research Institute (ILRI), Addis Ababa, Ethiopia.
p133.
O'sullivan, L.; Ross, R.P. and Hill, C. (2002). Review: potential of bacteriocin
producing lactic acid bacteria for improvements in food safety and
quality. Journal of Biochemical. Volum 84: pp 593-604.
Parodi, P.W (1999).Conjugated linoleic acid and other anticarcinogenic agents of
bovine milk fat. Journal of Dairy Science,. 82: pp 1339-1349.
Rasic, J. L., and Kurmann, J. A. (1978). Yoghurt: Scientific Grounds, Technology,
Manufacture and Preparation. Technical Dairy Publishing House, Berne,
Switzerland.
Regulation (EC) No.853/2004 of the European Parliament and of the Council of
29.April 2004 laying down specific hygiene roles for food and animal
origin. Officinal Journal of the European Communities. I.226/ pp 22–82.

107
Ryser, E.T (1998). Puplic heath concerns. In: applied Dairy Microbiology, by
Marth, E.H. and Steel, J.L Edition. Marcel Dekker, Inc., New York. pp
263-403.
Saint-Eve, A., C. Levy, M. Le Moigne, Ducruet and I. Souchon, (2008). Quality
changes in yoghurt during storage in different packaging materials. Food
Chemistry, 110: pp. 285-293.
Salminen, S. and A.V. Wrigh. (1993). Lactic acid bacteria. Marcel Dekker Inc. pp
200 – 201.
Sara abd elrahman Hassan (2010). Evaluation of hazard analysis and critical
control point (HACCAP) system implementation in yoghurt manufacture.
M.Sc. Thesis Sudan University of science and Technology. Sudan.
Schmidt, K., and Bledsoe, K. (1995). Effects of homogenization pressure on
physical and sensory characteristics of low fat yogurt. Cult. Dairy
Production. Journal. 30:pp. 7-10.
Shahhani, M.K. and Chardan, K.C. (1979).Nutritional and healthful aspects of
culture and culture-containing dairy food. Journal. Dairy science., 62(10):
pp 1685-1694.
Shearer, J.K.; Bachman, K.C and Boosinger, J. (2003). The production of quality
milk: A review. Institute of Food Agriculture Sciences, University of
Florida, U.S.A.
Shewmake, R.A and Dillon, B. (1998).Food poisoning; causes, remedies and
preservation. Postgard Med., 103(6): pp 125-129.
Shojaei ZA, Yadollahi A. (2008). Physiochemical and Microbiological Quality of
raw milk, Pasteurized and UHT milks in Shops. Asian J. Sci. Res.,
Volume 1(5): pp 532-538.
Smit, G. (2005). Dairy processing improving quality. Future Trends. pp. 69-230.

108
Sorhaug, T. and Stepaniak, L. (1997). Psychrotrophs and their enzymes in milk
dairy product: quality aspects. Trends in Food Science and Technology. 8:
pp 35-41.
Soukoulis, C., P. Panagiotidis, R. Koureli and C. Tzia, (2007).Industrial yogurt
manufacture, monitoring of fermentation process and improvement of
final product quality. Journal of Dairy Science, Volume 90(6): pp 2641-
2654.
Suman CL, Sexena MM, Pandey HS, Dubey PC, Rajendra S and Sanyal MK.
(1998). Some factors affecting milk constituents yield of Murrah buffalo.
India Vet. J., Volume 75(2). PP 176-177.
Sutherland, A.D. (1993) Toxin production by Bacillus cereusin dairy products. J.
Dairy Res. 60: pp 569-574.
Tamime A.Y. (2009). Milk processing and quality management. Society of Dairy
technology. United kindom.
Tamime, A. Y. and K. Robinson (2004).Yoghurt Science and Technology.
Published by Institute of Applied Science.
Tamime, A. Y. and R. K. Robinson. 1999. Yoghurt: Science and Technology. 2nd
edition.CRC Press, Boca Raton, FL.
Tamime, A. Y. and Robinson.(1999). Yoghurt Science and Technology.
Cambridge: Wood head Publishing Ltd.
Tamime, A. Y., and Robinson, R. K. (1985). Yoghurt: Science and Technology.
Pergamon Press Ltd., Oxford, UK.
Tamime, A.Y. and H.C. Death. (1980). Yoghurt: Technology and biochemistry.
Journal of Food Protection. Volume 43: pp 939-977.

109
Tamime, A.Y. and Robinson, R.K. (1999).Yoghurt Science and Technology.
2ndedition. Cambridge: Wood head Publishing, U.K, pp 1-572.
Tamime, A.Y., Robinson, R.K. and Wszolek, M. (2002).Microbiology of
Fermented Milks. In: R.K. Robinson, (edition.). Dairy Microbiology
Handbook, 3rd edition. New York: Wiley-Interscience, U.A.S. pp. 367-
430.
Tarakci, Z. and Erdogan, K. (2003).Physical, chemical, microbiological and
sensory characteristics of some fruit-flavored yogurt. Y.Y.U. Vet. Derg,
14: pp 10-14.
Torkar, K.G and Teger, S.G. (2008) .The Microbiological quality of raw milk after
introducing the two day’s milk collecting system. Acta Agri. Slovenica.
92(1): 61-74.
Urano, I.S. (2003). In-vitro probiotic properties of indigenous dadih lactic acid
bacteria. Asian-Aus. Journal of Animal Science. 16: pp 10-15.
Vedamuthu, E. R. (1991). The yogurt story-past, present and future. I. Dairy Food
Environ. San. 11: pp 202-203.
Vesa, T.H. (1999). Many factors affect symptoms of lactose intolerance. Marcel
Dekker Journals Food rev. International. 15: pp 235-247.
Walstra, P. Wonters, J.T.M. and Guerts, T.J. (2006). Dairy technology. 2nd edn.
CRC press (Taylor and Francis Group), Boca Raton.
Wattiaux, M.A (2000). Milk composition and nutritional value. A report. Babcock
institute for international Dairy Research and Development. University of
Wisconsin, Madison. U.S.A.
Wong, N. P., Jenness, R., Keeney, M., and Marth, E. H. (1988).Fundamentals of
Dairy Chemistry, 3rd edition. Van No strand Reinhold Co. Inc., New
York, U.S.A.

110
Zadoks, R. (2003). Streptococcus uberis; environmental or contagious pathogen, in
processing. 42nd Annual Meeting of Nation Mastitis Council Incorporated.
Natl. Mast. Coun. Madison U.S.A.
Zelalem Yilma and Bernard Faye,(2006). Handling and microbial load of cow’s
milk and irgo- fermented milk collected from different shops and
producers in central highlands of Ethiopia. Ethiopian Journal of Animal
Production. Volume 6(2): pp 67-82.
Zottola, E.A.; Yezzi, T.L.; Ajao, D.B. and Roberts, R.F (1994).Utilization of
chedder cheese containing Nisin as an antimicrobial agents in other foods.
International Journal of Food Microbiology, 24: pp 227-238.