![MA251 Computer Organization and Architecture [3-0-0-6] · PDF fileMA251 Computer Organization and Architecture [3-0-0-6] Lecture 5: Decoder, Demultiplexer, Encoder, and Multiplexer..](https://static.fdocuments.in/doc/165x107/5ab3de307f8b9aea528eaf52/ma251-computer-organization-and-architecture-3-0-0-6-computer-organization-and.jpg)
SuccessMaker Admin Guide -...
100
Administrator Guide SuccessMaker ® 10
Transcript of SuccessMaker Admin Guide -...

Administrator Guide
SuccessMaker® 10

August, 2017
Copyright © 2007–2017 Pearson Education, Inc. or one or more of its direct or indirect affiliates. All rights reserved.
This publication is protected by copyright, and permission should be obtained from the publisher prior to any prohibited reproduction, storage in a retrieval system, or transmission in any form or by any means, electronic, mechanical, photocopying, recording, or likewise. For information regarding permissions, write to Pearson Curriculum Group Rights & Permissions, One Lake Street, Upper Saddle River, New Jersey 07458.
SuccessMaker is a registered trademark of Pearson Education, Inc. or one or more of its direct or indirect affiliates.
Other trademarks are the property of their respective owners.

SuccessMaker Administrator Guide
Table of Contents Support ..................................................................................................................................................................... 3
My Pearson Training Registration ......................................................................................................................... 3 Learning Management System ................................................................................................................................ 5
Signing In to SuccessMaker .................................................................................................................................. 5 Online Assistance .................................................................................................................................................. 6 Announcements ..................................................................................................................................................... 7 Administrator Home Page ...................................................................................................................................... 8 Organizations ......................................................................................................................................................... 8
Managing Licenses .......................................................................................................................................... 9 Editing Data Settings ..................................................................................................................................... 10 Editing School Organization Details .............................................................................................................. 11
Managing the District Holiday Schedule ............................................................................................................. 11 Adding Holidays and breaks .......................................................................................................................... 12 Removing Holidays and Breaks .................................................................................................................... 12
Users ..................................................................................................................................................................... 13 Transferring Students .................................................................................................................................... 13 Adding New Groups ....................................................................................................................................... 14 Adding Users to a Group ............................................................................................................................... 14 Removing Groups .......................................................................................................................................... 14 User Types ..................................................................................................................................................... 15 Adding New Users ......................................................................................................................................... 18 Deleting a Student .......................................................................................................................................... 19
System Database Set-up ..................................................................................................................................... 20 Import files ...................................................................................................................................................... 21 Setting Up the CSV Files Using External Data ............................................................................................. 22 Import Process ............................................................................................................................................... 25 Verification of Import Records ....................................................................................................................... 27
Messages ............................................................................................................................................................. 30 Administrative Reports ......................................................................................................................................... 31
Tasks Prior to Teacher Orientation ..................................................................................................................... 31 Running Administrative Reports .......................................................................................................................... 32 Areas of Difficulty Report ..................................................................................................................................... 33 Cumulative Performance Reports ....................................................................................................................... 40 Last Session Report ............................................................................................................................................. 49 Prescriptive Scheduling Reports ......................................................................................................................... 54 Prescriptive Scheduling – Aggregate .................................................................................................................. 59 Prescriptive Scheduling - Aggregate by Teacher ............................................................................................... 62 Student Performance Report ............................................................................................................................... 67 System Enrollment and Usage Report ................................................................................................................ 76

SuccessMaker Administrator Guide 3
Support
My Pearson Training.com provides on-demand training through product tutorials and interactive webinars, as well as a library of resources including training guides, step sets, implementation ideas and more. Schedule live, virtual training sessions for access to product experts. Live chat provides instant access to these experts.
Pearson K12 Curriculum and Assessment Support site provides online support for all preK-12 software from Pearson. Visit often to view product information, FAQs, and downloads.
You must be registered to gain access to My Pearson Training and Pearson K12 Curriculum and Assessment Support site. You will need your customer number.
Your Customer Number: _____________________________________
My Pearson Training Registration To register for My Pearson Training:
1. In a browser, navigate to mypearsontraining.com OR from your SuccessMaker login page,click My Pearson Training.
2. In the My Pearson Training home page, click Register in the right portion of the window.
3. Complete the Register New User Account form.
4. Enter your customer number and press the search icon .
5. Click Create User Account when the form is completed. You should receive confirmation ofyour registration within 24 hours.
K12 and Assessment Support Site Registration 1. Open an internet browser. Go to https://pearsonnacommunity.force.com/support/s/
2. Select LOGIN.
3. Select Register.
4. Read the information and complete the form.
5. Select Submit.

SuccessMaker Administrator Guide 4
Contact Guide The following information will assist you in contacting Pearson for product support, customer service, or sales information.
Product Support
Product Support is the first point of contact for questions and information concerning Pearson products. Live Chat, email, and telephone support are available on Pearson K12 Curriculum and Assessment Support site.
Hours: Mon-Fri 8:00 AM to 8:00 PM EST Telephone: 888-977-7100, Option 1
Customer Service
Contact Customer Service for information on contracts, support renewals, billing, order or shipment status, and other customer issues.
Telephone: 888-977-7100, Option 2
SuccessMaker Administrator Guide 5
Learning Management System
Pearson System Terminal is the tool that SuccessMaker System Administrators, District Administrators, and Site Facilitators use to manage the Learning Management System (LMS).
Signing In to SuccessMaker Signing in to the Learning Management System (LMS) requires a username and password. You should have received a System Administrator username and password from Pearson. If you cannot locate it, call Product Support at (888) 977-7100, Option 1. You can also contact your Educational Specialist.
To sign in to SuccessMaker:
1. Write your username and password in the spaces provided below:
Username: _________________ Password: ____________________
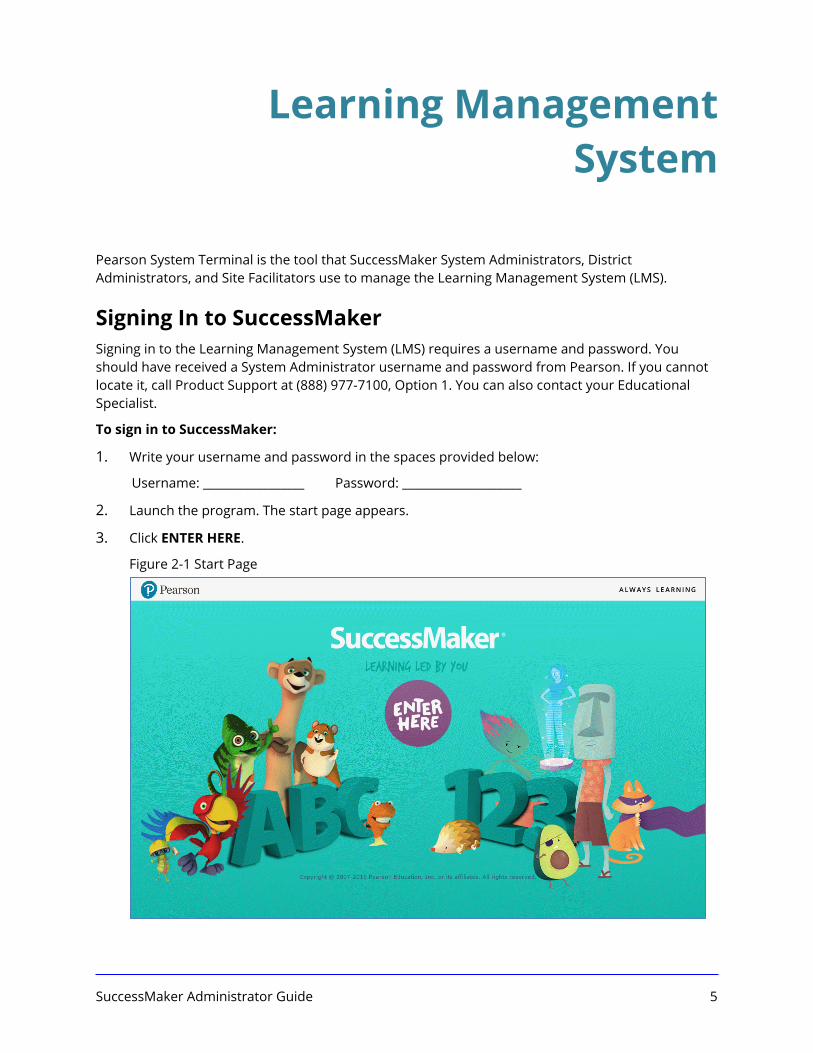
2. Launch the program. The start page appears.
3. Click ENTER HERE.
Figure 2-1 Start Page

SuccessMaker Administrator Guide 6
4. Enter the Username and Password supplied by your Educational Specialist, and then click Sign In.
Figure 2-2 Sign In
Online Assistance Help, or the Online Assistance, provides useful information and step-by-step instructions. Generally, the Help button can be found in the upper-right corner or at the bottom of a SuccessMaker window. This document frequently refers to the Online Assistance.
Online Assistance offers the following features to help you find the information you need:
• Contents: View and drill-down through the contents
• Index: View indexed keywords in alphabetical order
• Search: Search by keyword
• Glossary: Find definitions of key terms
• Pearson logo: See copyright information or visit the Pearson website
To access training or support from My Pearson Training or K12 Curriculum and Assessment Support, click the respective link under the Sign In button. If you need to call Product Support (888-977-7100) for assistance, have your SuccessMaker version information available by clicking the SuccessMaker Version Info link.

SuccessMaker Administrator Guide 7
Figure 2-3 Online Assistance
Announcements The Announcements button/link on the Administrator interface provides access to real-time SuccessMaker information. The SuccessMaker team will use this feature to communicate important information about upcoming feature releases, software updates, and issues with third-party software. Figure 2-4 Announcements
SuccessMaker Administrator Guide 8
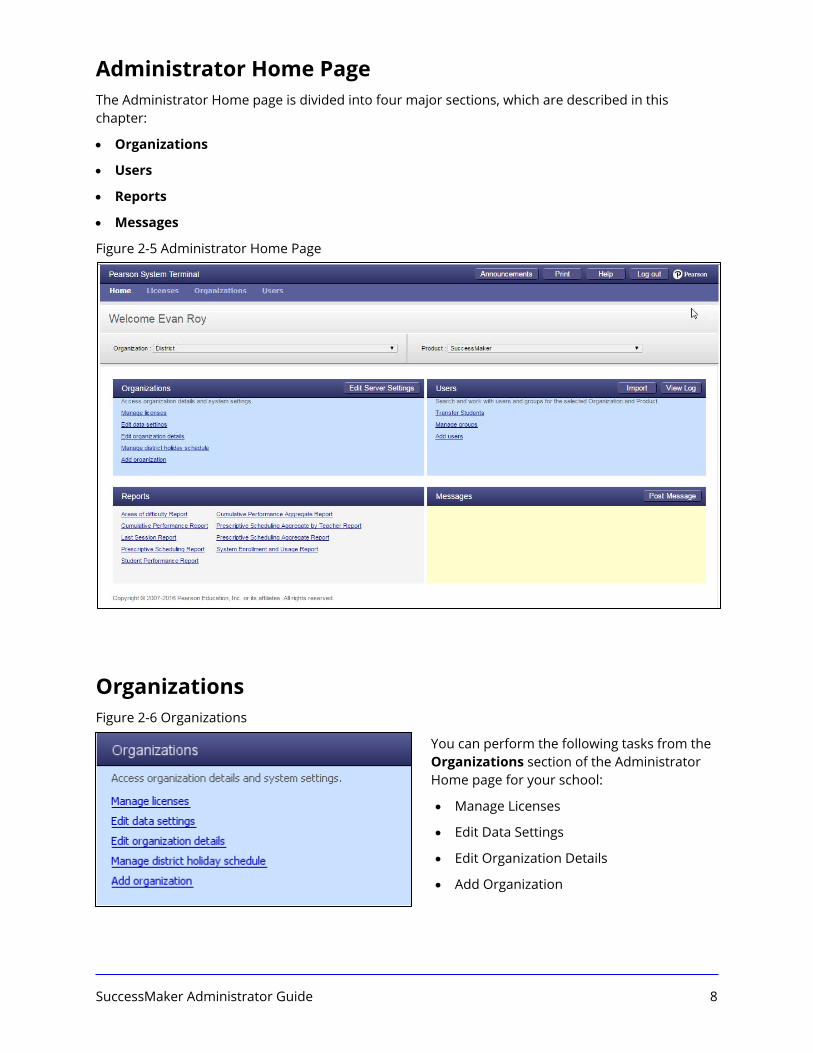
Administrator Home Page The Administrator Home page is divided into four major sections, which are described in this chapter:
• Organizations
• Users
• Reports
• Messages
Figure 2-5 Administrator Home Page
Organizations Figure 2-6 Organizations
You can perform the following tasks from the Organizations section of the Administrator Home page for your school:
• Manage Licenses
• Edit Data Settings
• Edit Organization Details
• Add Organization

SuccessMaker Administrator Guide 9
Managing Licenses License Management includes adding, deleting, and transferring licenses. A license is considered in use only when a student is running the course.
Write the number of licenses your organization has: Math: _________ Reading: ________
Licenses Tab The License Management window under the Licenses tab (Fig 2-7) displays the following columns:
• License
• Exp. Date – Expiration date
• # Seats – Number of available concurrent users
• # In Use – Number of licenses currently in use
• # Denials (Last 7 Days) – Number of users unable to log in during the last seven days
• Options – License transfer and removal functions
Figure 2-7 Licenses Tab (partial)
Transferring Licenses Occasionally, licenses need to be shared between organizations. This feature enables you to transfer these licenses easily.
To transfer a license:
1. In the License Management and Utilization window, click Transfer for the license you want to transfer. The Transfer License (Fig 2-8) window appears.
2. Enter the number of users that you want to transfer.
3. Select the organization to which you want to transfer the licenses, and then click OK.

SuccessMaker Administrator Guide 10
Figure 2-8 Transfer License
Editing Data Settings
Proficiency Scale Data Settings The proficiency scale settings establish how performance data appears. Figure 2-9 shows recommended proficiency scale settings. Changing the default settings is not recommended.
Figure 2-9 Default Proficiency Scale Settings (partial)
Changing Other Data Settings Your Educational Specialist will help you determine the best settings for your implementation.
To establish the recommended settings:
1. Confirm No is selected for Require student demographic data (Fig 2-10).

SuccessMaker Administrator Guide 11
2. Click Yes for Capture research data. For more details, select What is the Research Data Option?
3. Click Save, and then click Exit Edit Organization.
Important: The Edit Server Settings feature is for Pearson Engineer use ONLY.
Figure 2-10 Other Data Settings (partial)
Editing School Organization Details To change the school organization details:
1. Click the Details tab.
2. Edit the school organization data boxes, and then click Save.
Figure 2-11 Edit School Organization (partial)
Managing the District Holiday Schedule The Manage district holiday schedule link opens the Holiday Scheduler (Fig 2-12). This scheduler gives you the ability to add and remove holidays and breaks for the schools in your district. It provides the option to enter a brief description of the new holiday or break and displays a cumulative list of those scheduled, excluding weekends. Since the Prescriptive Scheduling Reports suite's calculations are based on school days, adding the district's holidays ensures the calculations more accurately reflect current student progress and target forecasts.

SuccessMaker Administrator Guide 12
Figure 2-12 Holiday Scheduler
Adding Holidays and breaks To add holidays and breaks to the scheduler:
1. Log on to the Pearson System Terminal interface.
2. On the Home page, locate the drop-down menu next to Organization. Then, select District.
3. Click Manage district holiday schedule.
4. In the Select Start Date field, type the start date or use the calendar to select it.
Note: Some browsers may prevent the use of the calendar. If your calendar is disabled, type the date in the Select Start Date field.
5. In the Select End Date, field, type the end date or use the use the calendar to select it.
Note: Some browsers may prevent the use of the calendar. If your calendar is disabled, type the date in the Select End Date field.
6. Type a description.
7. Click Add Holidays.
Removing Holidays and Breaks To remove holidays and breaks from the district scheduler:
1. Log on to the Pearson System Terminal interface.
2. On the Home page, locate the drop-down menu next to Organization. Then, select District.
3. Click Manage district holiday schedule.
4. In the Select Start Date field, type the start date of the holiday/break you want to remove use the calendar to select it.
Note: Some browsers may prevent the use of the calendar. If your calendar is disabled, type the date in the Select Start Date field.

SuccessMaker Administrator Guide 13
5. In the Select End Date, field, type the end date of the holiday/break you want to remove or use the use the calendar to select it.
Note: Some browsers may prevent the use of the calendar. If your calendar is disabled, type the date in the Select End Date field.
6. Click Remove Holidays.
Users Figure 2-13 Users
You can perform the following tasks from the Users section (Fig 2-13) of the System Administrator Home page:
• Transfer Students
• Manage Groups
• Add Users
Transferring Students A Pearson Administrator, System Administrator, or District Administrator can transfer one or more students from one organization to another.
To transfer a student:
1. Log on to the Pearson System Terminal interface.
2. On the Home page, select the organization. If transferring students from more than one school, do not select an organization on the Home page.
3. In the Users pane, click Transfer Students.
4. To choose students from a list, select their grade and All Active Students in the display field of the window named Step 1 of 3: Search Students to Transfer. Click Next.
Table 2-1 Field Descriptions
Field Description
School Select a school.
Search Grade Select a grade.
Search Users Enter a user name or user ID.
5. In the Step 2 of 3: Select to Transfer window, select the check box for each student to be transferred, and then click Next. The Step 3 of 3 Select Destination window displays information about the number of students you selected to transfer.
6. Select a school in Transfer to, and then click Transfer. The Transfer Successful window displays the list of all students who were transferred.

SuccessMaker Administrator Guide 14
Adding New Groups To add a new group:
1. On the Home page, select the organization from the Organization list.
2. Click Manage groups in the Users section to search for groups in an organization.
3. Click Add Group.
4. In Name, enter a descriptive name for the group, such as the teacher’s name, course, and grade.
The recommended naming convention is: zero, grade, dash, teacher name; for example, 04-Smith
Write the naming convention for your Group names below: ________________________________________________________
5. Click Save. The Group Added to window appears.
6. To add more groups, click Add Another Group and repeat steps 4-5.
Figure 2-14 Add New Groups
Adding Users to a Group After you add a user to an organization, you can add the user to a group.
To add users to a group:
1. From the Administrator Home page, click Manage Groups in the Users pane.
2. To locate the group, select the organization, grade, and group. Click Go.
3. Select the check box for one or more groups, and then click the Add User to Groups button. The Select Users to Add to Groups window appears.
4. In the list of users, select the check box for one or more users, and then click the Add Selected Users button.
Removing Groups If you have permission, you can permanently remove a group from an organization.
To remove a group:
1. From the Administrator Home page, click Manage Groups in the Users pane.
2. In the Groups window, select the organization, grade, and group, and then click Go.
SuccessMaker Administrator Guide 15
3. Select the check box for the group, and then click Remove. The group is permanently deleted from the management system.
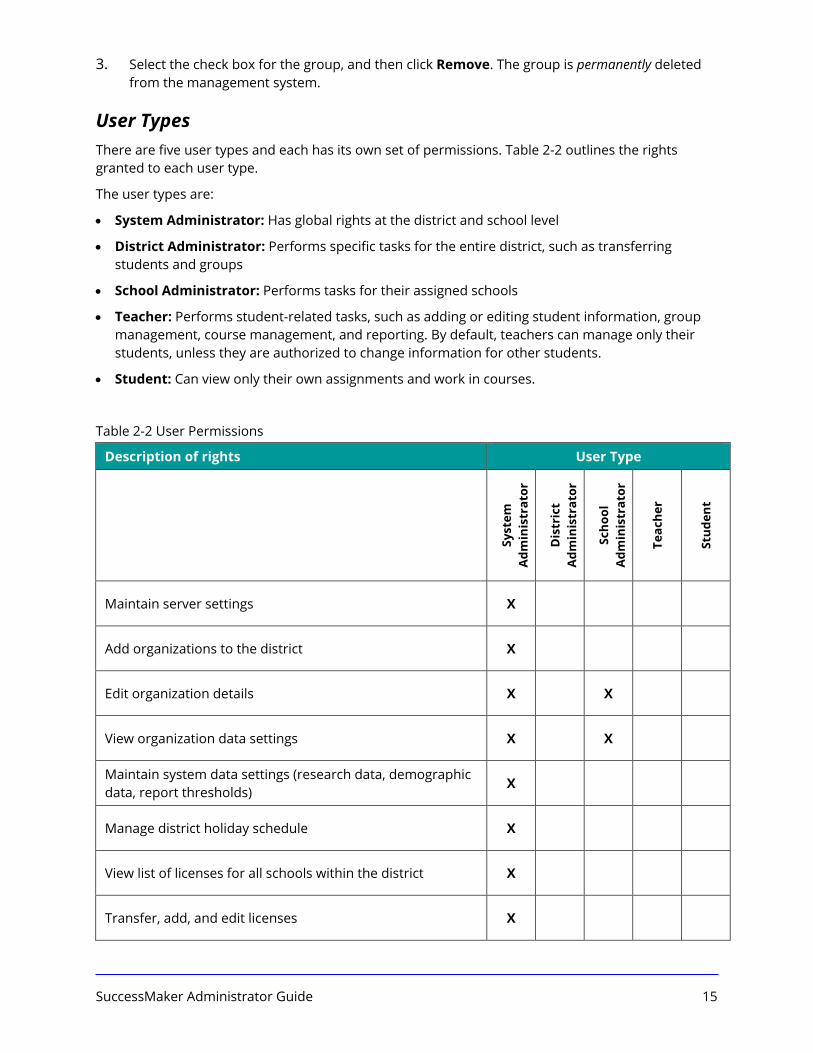
User Types There are five user types and each has its own set of permissions. Table 2-2 outlines the rights granted to each user type.
The user types are:
• System Administrator: Has global rights at the district and school level
• District Administrator: Performs specific tasks for the entire district, such as transferring students and groups
• School Administrator: Performs tasks for their assigned schools
• Teacher: Performs student-related tasks, such as adding or editing student information, group management, course management, and reporting. By default, teachers can manage only their students, unless they are authorized to change information for other students.
• Student: Can view only their own assignments and work in courses.
Table 2-2 User Permissions
Description of rights User Type
Sy
stem
A
dmin
istr
ator
Dis
tric
t A
dmin
istr
ator
Scho
ol
Adm
inis
trat
or
Teac
her
Stud
ent
Maintain server settings X
Add organizations to the district X
Edit organization details X X
View organization data settings X X
Maintain system data settings (research data, demographic data, report thresholds)
X
Manage district holiday schedule X
View list of licenses for all schools within the district X
Transfer, add, and edit licenses X

SuccessMaker Administrator Guide 16
Description of rights User Type
View and maintain data and user rights for same level users and lower
X X X
View and maintain data for student users only X X
Reassign a School Administrator to any school within the district
X
Add a student belonging to any teacher or group X X
Delete one or more user accounts, including all reporting data
X X
Delete one or more teacher user accounts X X
Delete one or more System Administrator, School Administrator, or District Administrator accounts
X
Reassign a student to any other teacher within the same school
X X
Transfer students from any school in the district to another school (one school at a time)
X X
Import teachers X
Import students X X X
View log files of the imported students X X X
Post messages X X X
Manage student user names and passwords X X X
Add student groups X X X
View student groups X X X X
Modify student groups X X X
Delete student groups X
Assign groups to teachers within the district X

SuccessMaker Administrator Guide 17
Description of rights User Type
Assign groups to teachers within the school X X
Change the owner of a group X X X
View a group profile X X X
Assign courses to students and groups X
Add group assignments X
View, edit, activate, or deactivate group assignments X
View group assignments X X X X
View student assignments X X X
View a course list X
Edit course settings X
Customize a course by concept X
Customize a course by standard X
View a learning object X
View course and fluency details X
Assess, save, and delete student fluency files X
Manage student fluency files and file settings X X
Save fluency files to disk or remove files X
Access Print Partners X
View standards X

SuccessMaker Administrator Guide 18
Description of rights User Type
View Goal Monitoring details X
View Student Performance Details and Standards Performance Details
X
Generate reports X X X X
Generate aggregate reports X X
Export data X X X X
Access LMS Online Assistance X X X X
View the Assignment List X
Launch assignments X
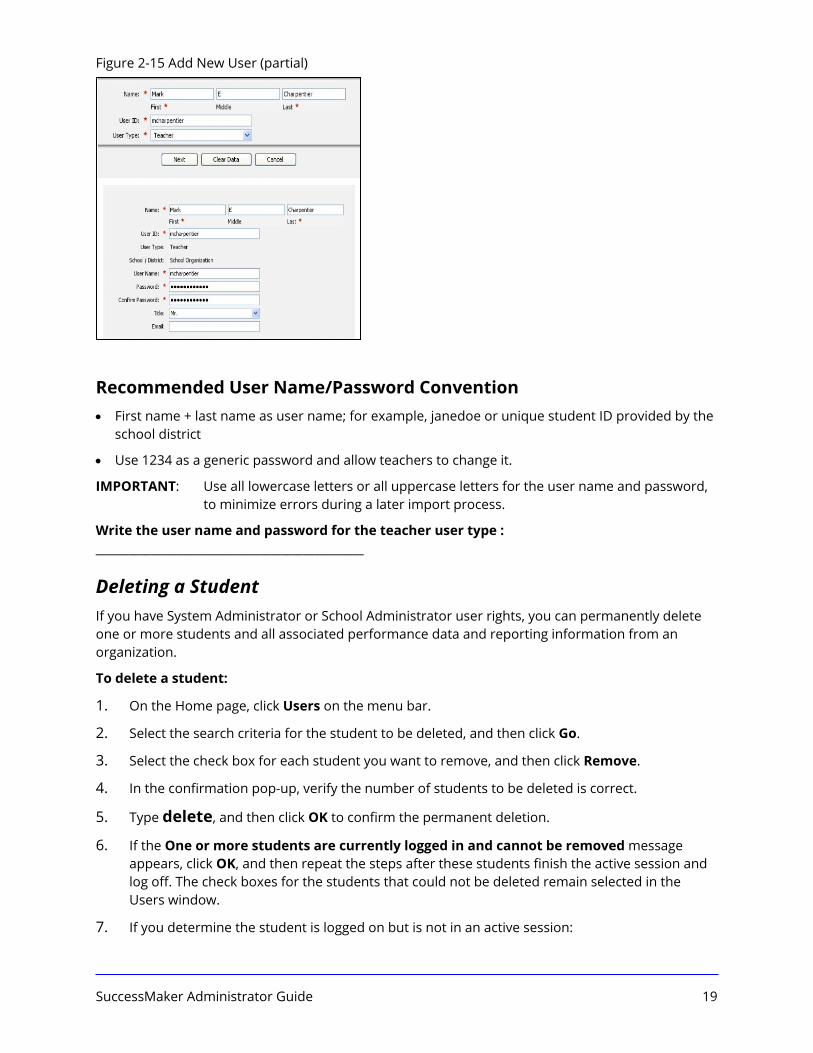
Adding New Users To add a new user:
1. On the Administrator Home page, select the organization from the Organization list, and then click Add users in the Users pane.
2. Complete the required fields, and select the Student, Teacher, System Administrator, or School Administrator role for this user from the User Type list. Click Next.
3. Enter user data in all required fields, including a unique User Name. User names and passwords are case-sensitive and can be 3-20 characters in length. Using all lowercase letters in each user name is recommended.
4. Click Save.
5. To add more users, click Add another user and repeat steps 2–4. When you finish adding users, click Exit Add Users to view a list of all users in the organization.
SuccessMaker Administrator Guide 19
Figure 2-15 Add New User (partial)
Recommended User Name/Password Convention • First name + last name as user name; for example, janedoe or unique student ID provided by the
school district
• Use 1234 as a generic password and allow teachers to change it.
IMPORTANT: Use all lowercase letters or all uppercase letters for the user name and password, to minimize errors during a later import process.
Write the user name and password for the teacher user type : _________________________________________________
Deleting a Student If you have System Administrator or School Administrator user rights, you can permanently delete one or more students and all associated performance data and reporting information from an organization.
To delete a student:
1. On the Home page, click Users on the menu bar.
2. Select the search criteria for the student to be deleted, and then click Go.
3. Select the check box for each student you want to remove, and then click Remove.
4. In the confirmation pop-up, verify the number of students to be deleted is correct.
5. Type delete, and then click OK to confirm the permanent deletion.
6. If the One or more students are currently logged in and cannot be removed message appears, click OK, and then repeat the steps after these students finish the active session and log off. The check boxes for the students that could not be deleted remain selected in the Users window.
7. If you determine the student is logged on but is not in an active session:
SuccessMaker Administrator Guide 20
a. Reset the student’s password in the Profile tab.
b. Log off the SuccessMaker product.
c. Log back on to the SuccessMaker product using the student’s user name and reset password. Log off to close the student’s session.
d. Log back on to the SuccessMaker product as an Administrator, and repeat Steps 1–6 to delete the student’s profile.
System Database Set-up Importing data negates the need to register each teacher or student individually in the Learning Management System. Administrators can use the Import feature to import teacher and student data from the school or district Student Information System (SIS) or to run the End-of-Year Import and Rollover process after upgrading to the latest version of SuccessMaker. District or system administrators can choose to complete the import and end-of-year rollover process on either the school or district level.
There are three import types:
1. Teacher import using external data
2. Student import using external data
3. End-of-Year Import and Rollover using LMS data from the previous year or a combination of external data and previous data.
If you want to assign students to teachers during an import:
• Import that uses external data only: you MUST import the teachers first and then import a student file in which they are associated to their new teacher
• End-of-Year Import and Rollover: you must use teacher and student files created from external data in which the students are associated to their new teacher
NOTE: In some school settings, such as middle schools, you may choose to import students without their being assigned to teachers, and then manually group the students. If you are not sure, contact your Educational Specialist for recommendations.
SuccessMaker Administrator Guide 21
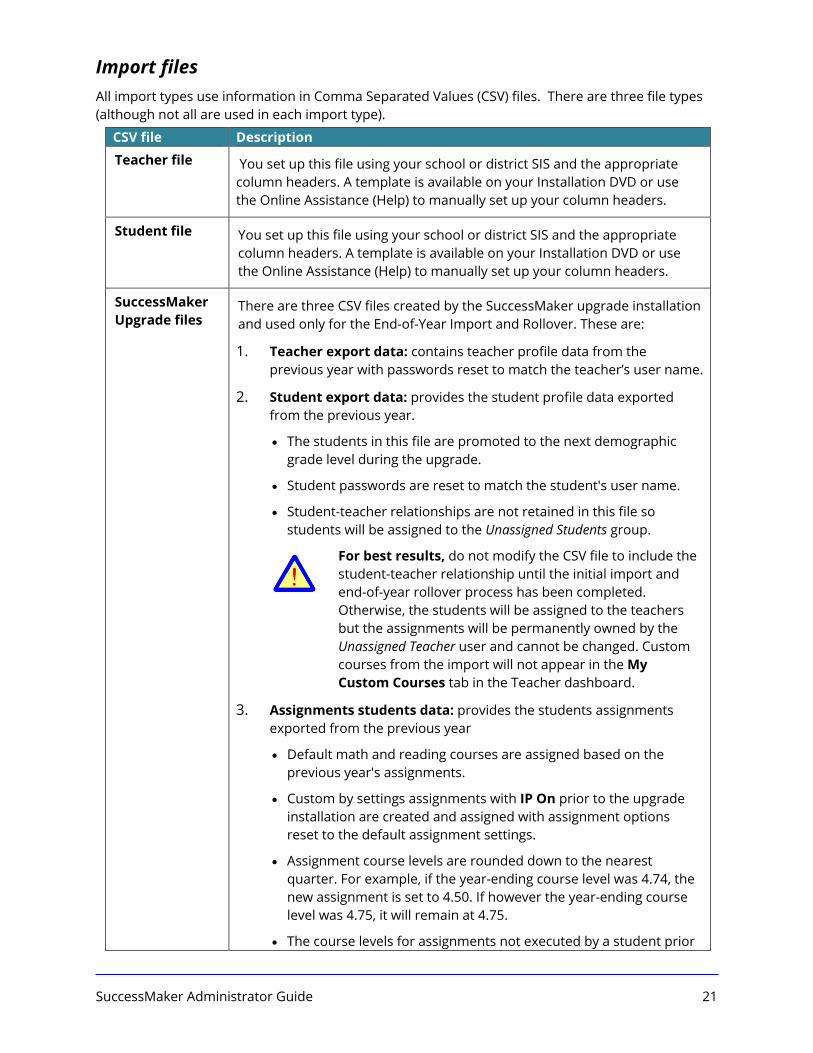
Import files All import types use information in Comma Separated Values (CSV) files. There are three file types (although not all are used in each import type).
CSV file Description
Teacher file You set up this file using your school or district SIS and the appropriate column headers. A template is available on your Installation DVD or use the Online Assistance (Help) to manually set up your column headers.
Student file You set up this file using your school or district SIS and the appropriate column headers. A template is available on your Installation DVD or use the Online Assistance (Help) to manually set up your column headers.
SuccessMaker Upgrade files
There are three CSV files created by the SuccessMaker upgrade installation and used only for the End-of-Year Import and Rollover. These are:
1. Teacher export data: contains teacher profile data from the previous year with passwords reset to match the teacher’s user name.
2. Student export data: provides the student profile data exported from the previous year.
• The students in this file are promoted to the next demographic grade level during the upgrade.
• Student passwords are reset to match the student's user name.
• Student-teacher relationships are not retained in this file so students will be assigned to the Unassigned Students group.
For best results, do not modify the CSV file to include the student-teacher relationship until the initial import and end-of-year rollover process has been completed. Otherwise, the students will be assigned to the teachers but the assignments will be permanently owned by the Unassigned Teacher user and cannot be changed. Custom courses from the import will not appear in the My Custom Courses tab in the Teacher dashboard.
3. Assignments students data: provides the students assignments exported from the previous year
• Default math and reading courses are assigned based on the previous year's assignments.
• Custom by settings assignments with IP On prior to the upgrade installation are created and assigned with assignment options reset to the default assignment settings.
• Assignment course levels are rounded down to the nearest quarter. For example, if the year-ending course level was 4.74, the new assignment is set to 4.50. If however the year-ending course level was 4.75, it will remain at 4.75.
• The course levels for assignments not executed by a student prior

SuccessMaker Administrator Guide 22
CSV file Description to the upgrade are set to the students' new demographic grade level.
• Assignments from the rollover are owned by the Unassigned Teacher user. The custom courses from the rollover do not appear in the My Custom Courses tab in the Teacher dashboard, but are accessible through the School Course Repository tab. AFTER completing the initial end-of-year import and rollover, see step 11 in the End-of-Year Rollover Import Process steps to establish the student-teacher relationship and set the correct assignment ownership.
The assignments_students_data.csv should NOT be edited in any way.
•
Setting Up the CSV Files Using External Data To set up the import fields, you will need in your CSV files or the templates located on your installation DVD or the online assistance located in the System Administrator interface.
If you are performing any import process at the DISTRICT level, you will need to include the Organization ID for each school in the CSV file. The Organization ID can be found in the organization’s profile within the LMS. For more information, refer to the Online Assistance (Help).
Minimum Data Fields for Teacher Import • Teacher’s user name: This name needs to be determined before the import and must be unique
for each teacher in the organization. See Recommended User Name/Password Naming Convention for naming recommendations or ask your Educational Specialist.
• Teacher’s first name and last name: First names and last names should be in separate columns.
• Teacher’s user ID: Because the user ID must be unique, schools typically use the user name for this field.
• Teacher’s password: This password does not need to be unique, but for security reasons, we recommend that it is. Teachers can change their own passwords in the management system, so an option is to assign all teachers a universal password and have them change it once they log in.
If the CSV file contains an invalid entry for grade level, for example, g8 or gradeeight, the students will be imported with a grade level of Not Specified. 8 or Grade 8 are examples of valid entries. See the Online Assistance (Help) for more information.
Data fields must be in the order shown in Figure 2-16 or in the File Import templates.

SuccessMaker Administrator Guide 23
Figure 2-16 Minimum Data Fields for Teacher Import
Minimum Data Mapping Requirements for Student Import To import students, the CSV file’s data fields must meet the following requirements:
• The header names match the LMS data field names.
• The data file contains a header row that defines the data sequence.
• The data file contains records with fields separated by a comma.
• The data file contains only student data.
• The data file contains at least the minimum data elements required for import.
• If you plan to assign students to teachers using the import, you must:
• Include the teachers’ user names. These names must exactly match the teacher’s user names in your teacher import CSV file.
• Include the column headers “teacherfirstname” and “teacherlastname” in your CSV file. It is not necessary for data to be included in these columns.
Minimum Data Fields for Student Import Username: The user name must be unique, requires at least three characters, and is case-sensitive. Student’s first name and last name: First names and last names should be in separate columns. Student ID: The unique identifier assigned to a student by the school district. Student Grade Level: The chronological grade level of the student.
If the CSV file contains an invalid entry for grade level, for example, g8 or gradeeight, the students will be imported with a grade level of Not Specified. 8 or Grade 8 are examples of valid entries. See the Online Assistance (Help) for more information.
Password: Requires at least three characters and is case-sensitive. It does not have to be unique.
If the password column in the CSV file is blank, the password will be set to match the username field.
Data fields must be in the order shown in Figure 2-17 or in the File Import templates. See the Online Assistance for additional data fields.

SuccessMaker Administrator Guide 24
Figure 2-17 Minimum Data Fields for Student Import
Data Fields for Assigning Students to Teachers Using the Import
For best results when using the End-of-Year Import and Rollover, do not modify the CSV file to include the student-teacher relationship until the initial import and end-of-year rollover process has been completed. If you rollover custom by settings courses, the students will be assigned to the teachers but the assignments will be permanently owned by the Unassigned Teacher user and cannot be changed. Custom courses from the import will not appear in the My Custom Courses tab in the Teacher dashboard. If you have any reservations as to whether you should associate teachers with students at the time of the import, refer to the Online Assistance, contact your Educational Specialist, chat with a Training Specialist on My Pearson Training.com, or call Product Support at 888-977-7100 prior to performing the End-of-Year Import and Rollover.
Confirm that teachers are imported prior to the student file and use the following additional fields to associate students with teachers: Teacher User Name, Teacher First Name, and Teacher Last Name.
Figure 2-18 Minimum Data Fields for Student Import that Assigns Students to Teachers
Write the convention for the STUDENT username, password, and identification (ID):
Recommended Convention: The student’s district/school ID number is strongly recommended for both (use for user ID, too).

SuccessMaker Administrator Guide 25
Import Process
Importing Teachers BEFORE importing teachers into the system, verify the CSV file’s data fields meet the following requirements:
• Header names match the LMS data field names.
• File contains a header row that defines the data sequence.
• File contains records with fields separated by a comma.
• File contains only teacher data.
• File contains at least the minimum data elements required for import.
• Confirm the following CSV minimum data requirements are met in the CSV file format:
• User Name (user name of teacher)
• First Name (first name of teacher)
• User Last Name (last name of teacher)
• User ID (teacher’s ID)
To import or append teachers:
1. Verify the following:
• The CSV file is accessible from the computer where the import process is initiated.
• You have administrative rights to browse the folders to locate the CSV file and import teacher information.
2. On your Home page, select the school organization and product where you want to import the teacher information. Ensure the teacher belongs to the organization selected on the home page.
3. Click the Import button in the Users pane.
4. In the Import window, browse and select the CSV file to be imported, and then click Open. The CSV file is imported.
Importing Students
If you want to assign students to teachers using the Import Function, you MUST import the teachers first.
To import students:
1. Before you start the import process, verify the following:
• The CSV file contains the required minimum data, including the header row, and adheres to the formatting requirements.
• The CSV file is accessible from the computer where the import process is initiated.
• You have administrative rights to browse the folders to locate the CSV file and import student information.

SuccessMaker Administrator Guide 26
• The teacher already exists in the LMS prior to importing students for that teacher's user name; otherwise, the students will be assigned to the Unassigned Group.
2. From the Administrator Home page, select the organization from the Organization list, and then click Import.
3. Navigate to find the location of the import CSV file, and click Open. The CSV file is imported.
Importing Teachers, Students, and Assignments with End-of-Year Rollover If importing teachers, students, and assignments, you can process them at the same time. If importing separately, import teacher, then student, and then courses/assignments.
The steps below enroll students as Unassigned.
• If you used the default courses as your main course in the prior year and you wish to associate students with teachers simultaneously, create teacher and student CSV files using external data from your SIS. For steps, see Setting Up the CSV files using External Data.
• If you used custom by settings courses as your main courses during the prior year, it is best to establish the teacher relationship AFTER the rollover process is complete by following the procedures listed below.
1. Before you begin, verify the following:
• The CSV files are accessible from the computer where the import process will be initiated.
• You have administrative rights to browse the folders to locate the CSV files.
2. On the Home page, confirm or select the organization for the import and rollover.
• If you select District, the CSV files must contain a valid organization ID for each student and teacher record.
• If you select a school and the CSV files contain data for other schools, the records for the other schools will fail to import.
3. Click the Import button in the Users pane.
4. In the Import window, click Browse to the right of Teacher File, and then select the teacher CSV file to be imported.
5. Click Browse to the right of Student File, and select the student CSV file to be imported.
6. Select the highest grade level you want to import in Grade Level. For example, if you want to import only students in grades K-8, select grade 8. Students in the CSV file at grade level 9 and above will not be imported.
If a student above the selected grade level already exists in the system, the student will not be deleted from the system, and any data fields that differ from the student's record in the system will be updated.

SuccessMaker Administrator Guide 27
7. To import the previous year's assignments, click Browse to the right of Course File, and then select the assignments_students_data.csv file.
8. Click Go.
9. When the import and rollover process is complete, the progress notification window disappears and an Import Results window appears.
10. Click OK to close the Import Results window, and then click View Log in the Users pane to view details of the import. See Verification of Import Records for more information on the Import File Log.
11. After completing the import and end-of-year import and rollover process, you can use the Import feature again to update the students records as follows:
• If you used the original, unedited student_export_data.csv to import your students, you can now run a second student import using the Student_Minimum_withTeacher.csv template or a custom CSV to establish the student-teacher relationship and the correct assignment ownership. See Importing Students for more information. After this second import, students and their assignments will belong to the teacher designated in the second import.
• To change student passwords from their user names to your preferred password, run a second student import using a custom CSV or the Student_Minimum_withTeacher.csv template with the student password data. See Importing Students for more information.
Verification of Import Records After completing the import, verify the student information was successfully imported.
To verify the import in the LMS:
1. Click View Log in the Users pane. The Import File Log window appears.
2. If more than one Job ID is listed, check the Date/Time Started column to ensure that you are looking at the correct log.
Table 2-3 Verifying Import Records
Field Description
Job ID Job identification number; for example, 12
Source File The name of the CSV file used for the import.
Type Teacher, Student, Course
Status Job status; for example, Complete, Incomplete – Errors, or Partial Complete
Date/Time Started Date or time when the job started
Uploaded By Username who initiated the import job
Records Uploaded Number of records uploaded.
Options Remove option deletes unneeded logs. Use caution, because the

SuccessMaker Administrator Guide 28
Field Description log is deleted immediately.
View Details option displays the details for an Error or Incomplete Import.
3. Was the import successful?
• If the import process succeeded, the status is Complete. Click Exit Log.
• If the import process failed, the status is Incomplete - Errors. See Determining Reasons for Import Failures in the Online Assistance.
4. Verify students are in the system. Select a few names from the CSV file that was just imported.
5. On the Home page, select the organization and product where you imported the students.
6. Click Users on the menu bar, type the user name in Search Users, and then click Search.
7. Find the account in the list and verify the data matches the CSV file.
If an imported student could not be assigned to a teacher, the student is placed in the Unassigned group which is viewable by Administrators only.
Assigning Imported Students to a Teacher (if not performed during the import or End-of-Year Import and Rollover)
BEFORE completing these steps, confirm Teachers have already been entered into the organization either manually or using any Import or Rollover function.
To assign imported students to a teacher:
1. From the Administrator Home page, select the organization from the Organization list.
2. Click Manage Groups in the Users section.
3. In the All Groups list, select Unassigned Students. Click Go.
4. Use the check boxes to select the students belonging to a teacher.
5. Select Assign Students to a Teacher.
6. Select the teacher name from the list.
7. Select Assign to Teacher.
Adding Imported Students to a Group
BEFORE completing these steps, confirm that the groups have already been entered into the organization.
To add imported students to a group:
1. From the Administrator Home page, select the organization from the Organization list.

SuccessMaker Administrator Guide 29
2. Click Manage Groups in the Users section. Figure 2-19 Manage Groups (partial)
3. Select All Groups in the list.
4. Double-click on the name of the appropriate group.
5. In Edit Group, click the Users tab, and then click Add Users to Groups.
6. In the Display: All Teachers list, select the appropriate teacher.
7. In Display: All Grades, select the appropriate grade, and then click Search.
8. Using the check boxes, select the students you want to add to the group. You can select the entire list by selecting the check box at the top of the column.
9. Click the Add Selected Users button.
Figure 2-20 Add Students (partial)
Online Assistance provides more information on this subject. Click Help > Importing Students or Teachers in the Contents tab.

SuccessMaker Administrator Guide 30
Messages Figure 2-21 Messages
Messages can be posted internally to Administrators, System Administrators, and District Administrators only.
To post a message:
1. On the Home page, click the Post Message button. The Post Messages From window appears. 2. Select the user type in Send New Message To. By default, messages are sent to all
Administrators. 3. Type the text in Message. 4. Click the Post Message button. The message notification appears in the Messages pane of
each recipient's Home page. 5. To post another message, click the Add New Message for Posting button, and follow the
instructions from Step 3. When you are finished sending messages, close the Post Message From window.
To remove a message:
1. On the Home page, click the Post Message button. The Post Messages From window appears. 2. Under the User Type and Date Sent section, click the Remove Message button for that
message.

SuccessMaker Administrator Guide 31
Administrative Reports
The Learning Management System helps you analyze student performance by generating reports on skills and standards for individual students and groups. You can view reports from the Administrator Home page.
Figure 3-1 Reports
Administrative Reports are pre-defined reports that can be customized by setting parameters and saving them as a Favorite report.
You can save a report as a PDF file or CSV file.
In addition to individual and group reports, three aggregate report options are available:
• Prescriptive Scheduling
• Prescriptive Scheduling by Teacher
• Cumulative Performance
Tasks Prior to Teacher Orientation Before any SuccessMaker orientation can be provided to Teachers, the System Administrator MUST complete the following tasks:
1. Perform the teacher and student imports.
2. Run the System Enrollment and Usage report and have it available during the teachers’ initial training so that they can identify their user names, groups, and students.
Directions for these tasks are outlined in this guide.

SuccessMaker Administrator Guide 32
Running Administrative Reports To run administrative reports:
1. On the Home page, select a school, and then click on the report name in the Reports pane. 2. Select report options on the Report Options screen and then click Go. To reset the report
options to the default settings and close the screen without saving the changes, click Cancel. 3. In the Report Viewer, select from the following options in the tool bar:
• Export Data: Exports report data in the format of the data export, including the CSV.
• Export Report: Exports selected report pages in the selected format
• Print Report: Prints selected report pages in the selected formats, including HTML and PDF
Figure 3-2 Sample Report Options (from System Enrollment and Usage Report)

SuccessMaker Administrator Guide 33
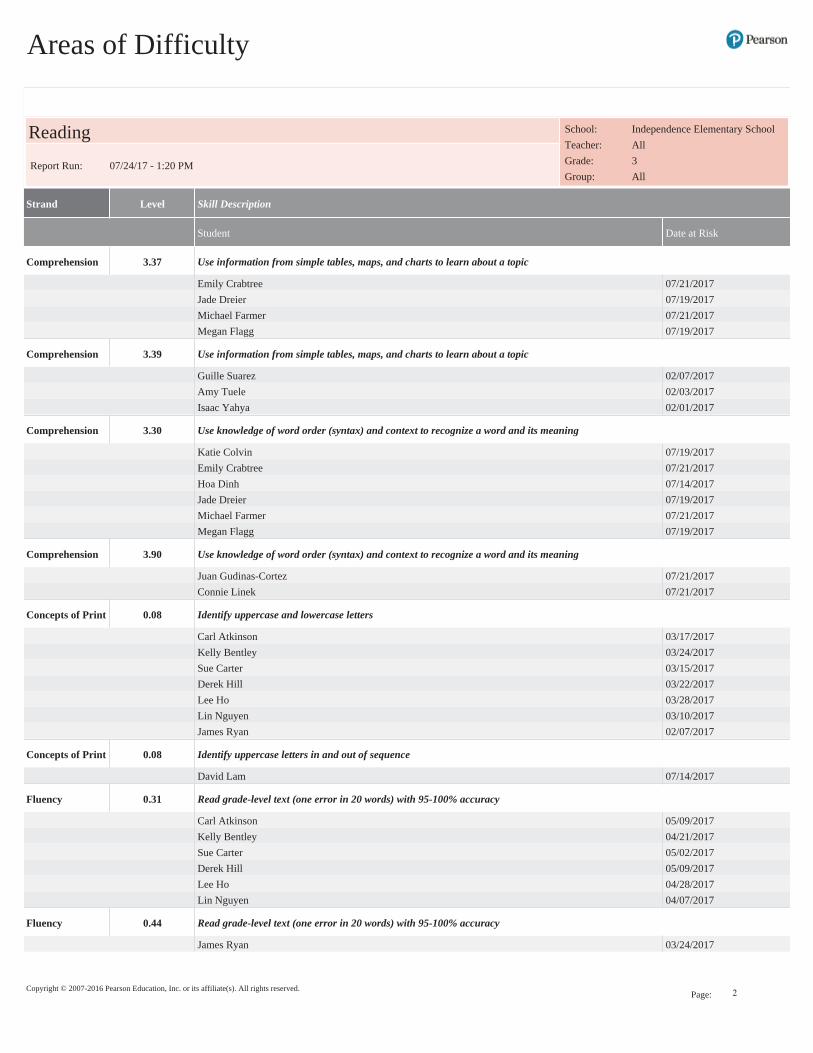
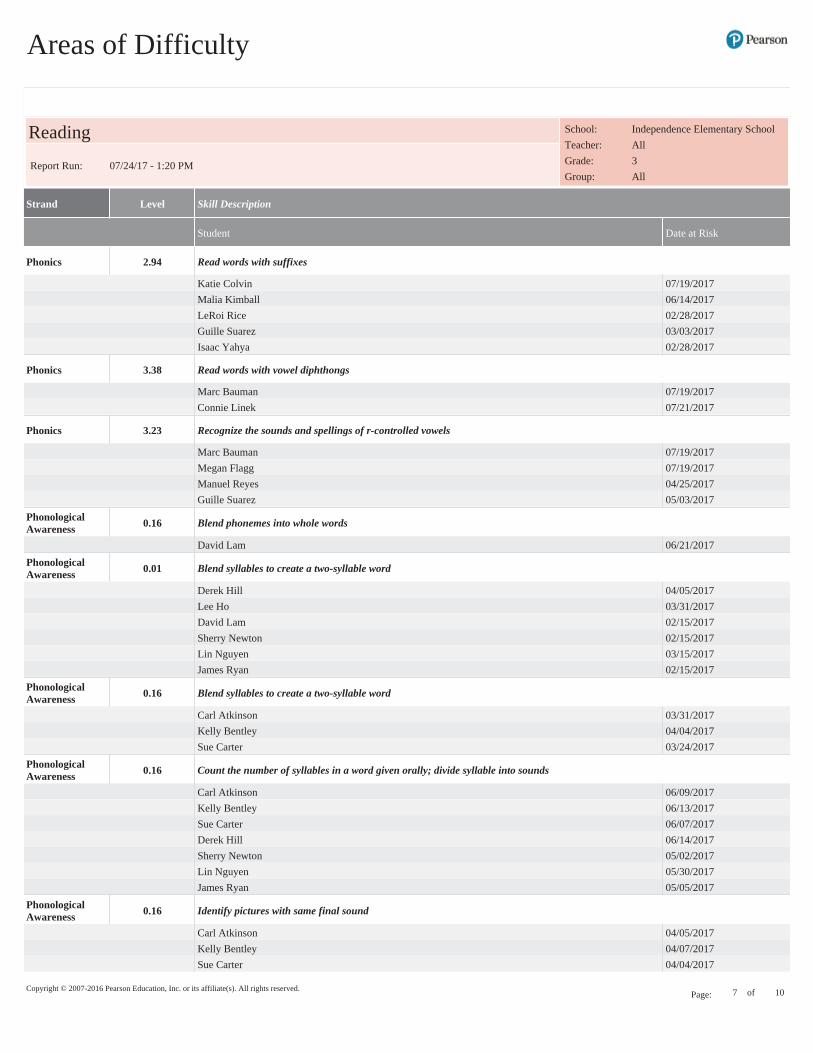
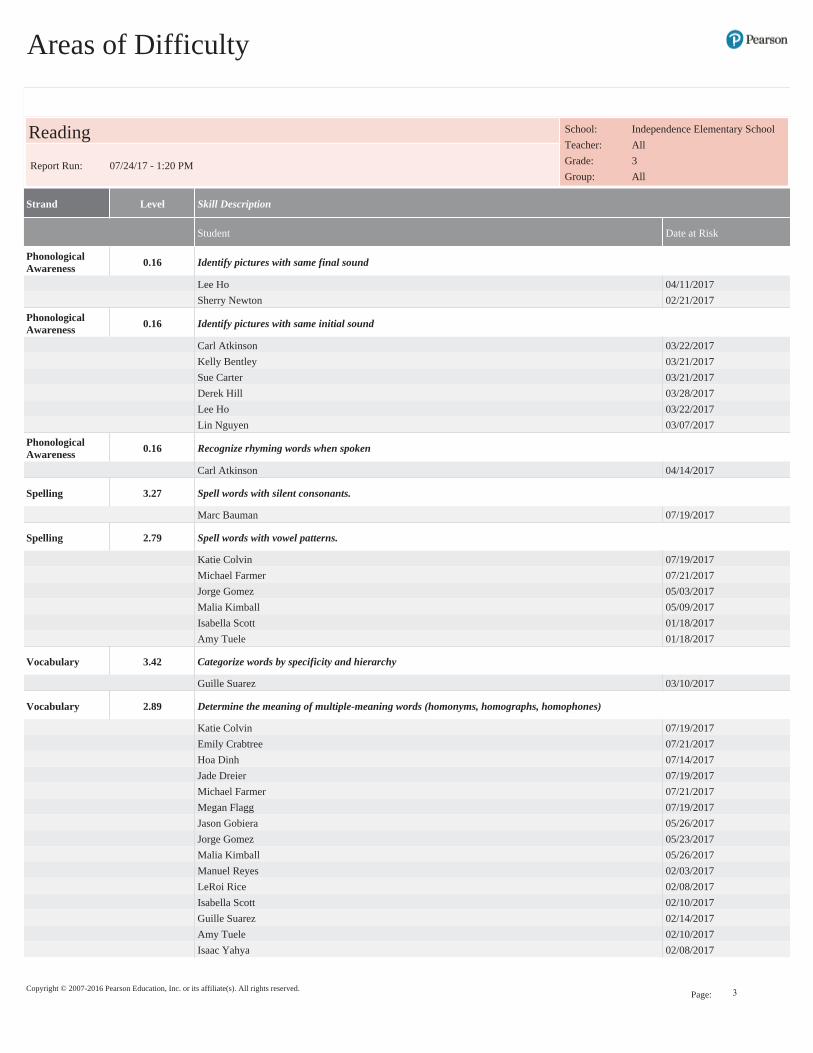
Areas of Difficulty Report The Areas of Difficulty Report lists the skills in Math and Reading courses with which the selected groups of students are having difficulty. The report groups students by these skills to allow the teacher to determine which students require assistance and/or intervention. System Administrators can also filter the data according to demographic criteria if this is specified in the students’ profiles. Running the Areas of Difficulty Report weekly is recommended, but it can be run as often as necessary.
The information on this report includes the abbreviation of the strand name, the strand level in which a particular skill is not mastered, a description of the skill in which student is having difficulty, and date in which the skill was determined as not mastered.
The Areas of Difficulty report will be generated only for default and edit by settings courses. It will not be generated for Custom by Concept and Custom by Standard courses.
Areas of Difficulty Report - Administrator Options Table 3-1 Administrator Options for the Areas of Difficulty Report
Options Selections
Student Selection Summary
View the number of groups and students selected for the report.
Choose Subject Select Math or Reading course assignments.
Course Selection Select one or more courses to include in the report. Course selection is limited to Default and Custom by Settings for Math and Reading. Course subject selection is required before running the report.
Additional Grouping Select how the student information is grouped in the report.
Remove page breaks
Select the check box to remove page breaks from the report.
Sort Select how the information is sorted in the report.
Display Select how the student name is displayed in the Student column of the report.
Mask student display
Select the check box to disguise student names on the report. Clear the check box to display student names.
Dates At Risk Select the number of weeks for the date calculations of when the skill was evaluated as At Risk. Default Since IP selection will include entire course history for each student.
Select Students By:
School Select one or more schools.
Teacher Select one or more teachers assigned for the course.

SuccessMaker Administrator Guide 34
Options Selections
Grade Select one or more grade levels.
Group Select one or more student groups.
Student Select one or more students.
Filter by Demographics: To filter results by demographic options, click Yes and scroll to the end of the screen to view all choices. All is the default selection for all demographic fields.
Disability Status Filters: All, Yes, No, Not Specified
English Lang. Proficiency
Filters: All, English, English Language Learner, Not Specified
Gender Filters: All, Female, Male, Not Specified
Migrant Status Filters: All, Migrant, Non-migrant, Not Specified
Race/ Ethnicity Filters: All, African American, Asian/Pacific Islander, Caucasian, Hispanic/Latino, Native American/Alaskan, Other, Not Specified
Socioeconomic Status
Filters: All, Economically disadvantaged, Not economically disadvantaged, Not Specified
Special Services Filters: 504 Plan, Gifted/Talented, IEP, No Special Services, Other
Areas of Difficulty Report – Administrator Results The Areas of Difficulty Report output consists of four parts: header, summary, body of report, and legend.
Header The report header includes:
• Report Title
• Course Name
• Report Run Date and Time
• School
• Teacher
• Grade
• Group
Body of Report The body of the report includes the following information:

SuccessMaker Administrator Guide 35
• Strand: Name of the strand.
• Level: The strand level in which a specific skill is not mastered.
• Skill Description: Description of the skill with which the student is having difficulty.
• Student: Student’s first and last name, and either the Student ID or the Student Username based on the option selected in the Report Options screen.
• Date At Risk: Date when the skill was assessed as Not Mastered.
Summary • The Summary fields include the following information:
• Total Skills At Risk: Total number of distinct skills presented in this report.
• Total Students At Risk: Total number of distinct students presented in this report.
Options The Options section provides a summary of the Report Options screen selections chosen for this report.
If the report is run for Groups, the results will be sorted by Group first, by Strand, and then Strand Level. If run for Students, the results will be sorted by Strand first, then Strand Level.

Areas of Difficulty
Copyright © 2007-2016 Pearson Education, Inc. or its affiliate(s). All rights reserved.Page: 1
Math School: Independence Elementary SchoolTeacher: AllGrade: 3Group: All
Report Run: 07/24/17 - 1:16 PM
Strand Level Skill Description
Student Date at Risk
Addition 1.10 SMMA_LO_00015 - Add 1 to a number (sums 1 to 10).
Mateo Salazar 05/24/2017Destin Scroggins 07/07/2017Tyree Winters 04/18/2017
Addition 1.15 SMMA_LO_00017 - Add doubles (sums 2 to 18).
Michael Farmer 12/20/2016Mateo Salazar 04/12/2017Destin Scroggins 02/24/2017Tyree Winters 03/07/2017
Addition 3.10 SMMA_LO_00087 - Add three addends (student choice, one- and two-digit addends, sums 20 to 99, no regrouping).
Emily Crabtree 05/17/2017Hoa Dinh 02/14/2017Derek Hill 03/01/2017David Lam 06/07/2017
Addition 1.00 SMMA_LO_00012 - Add two addends (sums 6 to 10).
Michael Farmer 03/03/2017
Addition 1.12 SMMA_LO_00016 - Add two addends in words (one-digit addends, sums 6 to 10).
Michael Farmer 04/11/2017Mateo Salazar 01/25/2017Destin Scroggins 05/19/2017Tyree Winters 05/23/2017
Addition 1.17 SMMA_LO_00020 - Add two consecutive addends (one-digit addends, sums 1 to 17).
Michael Farmer 06/06/2017
Addition 2.00 SMMA_LO_00025 - Add two multiples of 10 (student choice, sums 20 to 90).
Carl Atkinson 05/19/2017
Addition 2.05 SMMA_LO_00044 - Add two multiples of 10 displayed horizontally (sums 20 to 90).
Rosa Fernandez-Rivera 02/21/2017Shaneequa Forsythe 03/21/2017Laci Gill 04/21/2017
Addition 1.05 SMMA_LO_00014 - Add using basic math facts (addends 0 to 5, sums 1 to 5).
Mateo Salazar 05/17/2017Destin Scroggins 04/14/2017Tyree Winters 04/04/2017
Decimal 3.00 SMMA_LO_00180 - Identify the number of dollars and dimes that represent a given amount ($1.10 to $3.50).
Lin Nguyen 05/03/2017
Equation 3.00 SMMA_LO_00334 - Compare sums (two-digit addends, multiples of 10).
Jade Dreier 05/31/2017

Areas of Difficulty
Copyright © 2007-2016 Pearson Education, Inc. or its affiliate(s). All rights reserved.Page: 2
Math School: Independence Elementary SchoolTeacher: AllGrade: 3Group: All
Report Run: 07/24/17 - 1:16 PM
Strand Level Skill Description
Student Date at Risk
NumberConcepts 3.10 SMMA_LO_01026 - Identify the greatest or least number (three-digit).
Lee Ho 01/04/2017Lin Nguyen 07/18/2017
NumberConcepts 3.00 SMMA_LO_01023 - Identify whole numbers on a number line that satisfy the inequality (0 to 10).
Jade Dreier 03/08/2017Probability & Statistics 3.00 SMMA_LO_01665 - Given a graphical representation of two spinners, count all the possible outcomes for spinning each spinner once.
David Lam 05/16/2017
Speed Games 3.00 SMMA_SG_00300 - Practice addition using basic facts; sums less than or equal to 15.
Derek Hill 06/02/2017Amy Tuele 05/03/2017
Speed Games 3.10 SMMA_SG_00310 - Practice addition using basic facts; sums less than or equal to 15.
David Lam 03/07/2017
Speed Games 3.20 SMMA_SG_00320 - Practice subtraction using basic facts; minuends, subtrahends less than or equal to 12.
Connie Linek 06/27/2017
Subtraction 3.05 SMMA_LO_01456 - Subtract (student choice, minuends 110 to 199, two-digit subtrahends, no regrouping).
Lin Nguyen 02/17/2017
Subtraction 1.12 SMMA_LO_01421 - Subtract 1 from a number (minuends 1 to 9).
Michael Farmer 03/22/2017Destin Scroggins 06/30/2017Tyree Winters 06/13/2017
Subtraction 1.05 SMMA_LO_01424 - Subtract a number from 10 (subtrahends 1 to 9).
Mateo Salazar 02/01/2017Destin Scroggins 03/10/2017Tyree Winters 02/21/2017
Subtraction 2.10 SMMA_LO_01438 - Subtract multiples of 10 (minuends 20 to 90, subtrahends 10 to 80, horizontal presentation).
Laci Gill 06/16/2017
Subtraction 2.05 SMMA_LO_01437 - Subtract multiples of 10 (student choice, minuends 20 to 90, subtrahends 10 to 80).
Rosa Fernandez-Rivera 01/17/2017Shaneequa Forsythe 03/28/2017Laci Gill 06/23/2017
Subtraction 2.00 SMMA_LO_01426 - Subtract two multiples of 10 (student choice, minuends 20 to 90, subtrahends 10 to 80).
Shaneequa Forsythe 02/21/2017
Subtraction 1.10 SMMA_LO_01420 - Subtract using basic math facts (differences are 0).
Michael Farmer 05/17/2017Mateo Salazar 02/08/2017

Areas of Difficulty
Copyright © 2007-2016 Pearson Education, Inc. or its affiliate(s). All rights reserved.Page: 3
Math School: Independence Elementary SchoolTeacher: AllGrade: 3Group: All
Report Run: 07/24/17 - 1:16 PM
Strand Level Skill Description
Student Date at Risk
Subtraction 1.10 SMMA_LO_01420 - Subtract using basic math facts (differences are 0).
Destin Scroggins 06/02/2017Tyree Winters 05/30/2017
Subtraction 1.15 SMMA_LO_01419 - Subtract using basic math facts (minuends 1 to 9).
Tyree Winters 01/10/2017
Subtraction 1.00 SMMA_LO_01418 - Subtract using basic math facts (minuends 6 to 9).
Michael Farmer 07/12/2017
Subtraction 1.17 SMMA_LO_01429 - Subtract using basic math facts displayed horizontally (minuends 10 to 14, subtrahends 1 to 9).
Mateo Salazar 03/15/2017Destin Scroggins 01/13/2017
Word Problems 3.00 SMMA_LO_01564 - Make a picture to solve a partitive division problem (dividends to 20).
Hoa Dinh 03/21/2017Megan Flagg 03/21/2017
Word Problems 2.05 SMMA_LO_01551 - Make a picture to solve a two-step problem in context (addition and subtraction).
Laci Gill 07/07/2017
Total Skills At Risk 60Total Students At Risk 22
*Options: No additional groupingSort by StrandShow all dates at riskDemographic filters not used1 Grade selectedAll Groups selected

Areas of Difficulty
Copyright © 2007-2016 Pearson Education, Inc. or its affiliate(s). All rights reserved.Page: 1
Reading School: Independence Elementary SchoolTeacher: AllGrade: 3Group: All
Report Run: 07/24/17 - 1:20 PM
Strand Level Skill Description
Student Date at Risk
Comprehension 3.92 Answer how questions
Juan Gudinas-Cortez 07/21/2017Maria Gutierrez 07/21/2017Connie Linek 07/21/2017
Comprehension 0.46 Answer literal questions, including who, where, when, and what
David Lam 04/26/2017Sherry Newton 04/26/2017James Ryan 05/02/2017
Comprehension 3.90 Answer literal questions, including who, where, when, and what
Juan Gudinas-Cortez 07/21/2017
Comprehension 0.35 Answer questions about characters
Carl Atkinson 05/12/2017Kelly Bentley 05/05/2017Sue Carter 04/18/2017Derek Hill 04/25/2017Lee Ho 05/09/2017
Comprehension 0.40 Answer questions about characters
Lin Nguyen 04/12/2017
Comprehension 0.55 Answer questions about characters
David Lam 03/29/2017James Ryan 04/04/2017
Comprehension 3.20 Answer questions about main characters, setting, theme, and plot
Katie Colvin 07/19/2017Emily Crabtree 07/21/2017Hoa Dinh 07/14/2017Jade Dreier 07/19/2017Michael Farmer 07/21/2017Megan Flagg 07/19/2017Manuel Reyes 04/04/2017LeRoi Rice 04/07/2017Isabella Scott 04/11/2017Guille Suarez 04/12/2017Amy Tuele 04/11/2017Isaac Yahya 04/07/2017
Comprehension 0.46 Answer questions about plot
Sherry Newton 04/04/2017James Ryan 04/07/2017
Comprehension 3.68 Determine point of view
Juan Gudinas-Cortez 07/21/2017
Areas of Difficulty
Copyright © 2007-2016 Pearson Education, Inc. or its affiliate(s). All rights reserved.Page: 2
Reading School: Independence Elementary SchoolTeacher: AllGrade: 3Group: All
Report Run: 07/24/17 - 1:20 PM
Strand Level Skill Description
Student Date at Risk
Comprehension 3.37 Use information from simple tables, maps, and charts to learn about a topic
Emily Crabtree 07/21/2017Jade Dreier 07/19/2017Michael Farmer 07/21/2017Megan Flagg 07/19/2017
Comprehension 3.39 Use information from simple tables, maps, and charts to learn about a topic
Guille Suarez 02/07/2017Amy Tuele 02/03/2017Isaac Yahya 02/01/2017
Comprehension 3.30 Use knowledge of word order (syntax) and context to recognize a word and its meaning
Katie Colvin 07/19/2017Emily Crabtree 07/21/2017Hoa Dinh 07/14/2017Jade Dreier 07/19/2017Michael Farmer 07/21/2017Megan Flagg 07/19/2017
Comprehension 3.90 Use knowledge of word order (syntax) and context to recognize a word and its meaning
Juan Gudinas-Cortez 07/21/2017Connie Linek 07/21/2017
Concepts of Print 0.08 Identify uppercase and lowercase letters
Carl Atkinson 03/17/2017Kelly Bentley 03/24/2017Sue Carter 03/15/2017Derek Hill 03/22/2017Lee Ho 03/28/2017Lin Nguyen 03/10/2017James Ryan 02/07/2017
Concepts of Print 0.08 Identify uppercase letters in and out of sequence
David Lam 07/14/2017
Fluency 0.31 Read grade-level text (one error in 20 words) with 95-100% accuracy
Carl Atkinson 05/09/2017Kelly Bentley 04/21/2017Sue Carter 05/02/2017Derek Hill 05/09/2017Lee Ho 04/28/2017Lin Nguyen 04/07/2017
Fluency 0.44 Read grade-level text (one error in 20 words) with 95-100% accuracy
James Ryan 03/24/2017
Areas of Difficulty
Copyright © 2007-2016 Pearson Education, Inc. or its affiliate(s). All rights reserved.Page: 7 of 10
Reading School: Independence Elementary SchoolTeacher: AllGrade: 3Group: All
Report Run: 07/24/17 - 1:20 PM
Strand Level Skill Description
Student Date at Risk
Phonics 2.94 Read words with suffixes
Katie Colvin 07/19/2017Malia Kimball 06/14/2017LeRoi Rice 02/28/2017Guille Suarez 03/03/2017Isaac Yahya 02/28/2017
Phonics 3.38 Read words with vowel diphthongs
Marc Bauman 07/19/2017Connie Linek 07/21/2017
Phonics 3.23 Recognize the sounds and spellings of r-controlled vowels
Marc Bauman 07/19/2017Megan Flagg 07/19/2017Manuel Reyes 04/25/2017Guille Suarez 05/03/2017
PhonologicalAwareness 0.16 Blend phonemes into whole words
David Lam 06/21/2017PhonologicalAwareness 0.01 Blend syllables to create a two-syllable word
Derek Hill 04/05/2017Lee Ho 03/31/2017David Lam 02/15/2017Sherry Newton 02/15/2017Lin Nguyen 03/15/2017James Ryan 02/15/2017
PhonologicalAwareness 0.16 Blend syllables to create a two-syllable word
Carl Atkinson 03/31/2017Kelly Bentley 04/04/2017Sue Carter 03/24/2017
PhonologicalAwareness 0.16 Count the number of syllables in a word given orally; divide syllable into sounds
Carl Atkinson 06/09/2017Kelly Bentley 06/13/2017Sue Carter 06/07/2017Derek Hill 06/14/2017Sherry Newton 05/02/2017Lin Nguyen 05/30/2017James Ryan 05/05/2017
PhonologicalAwareness 0.16 Identify pictures with same final sound
Carl Atkinson 04/05/2017Kelly Bentley 04/07/2017Sue Carter 04/04/2017
Areas of Difficulty
Copyright © 2007-2016 Pearson Education, Inc. or its affiliate(s). All rights reserved.Page: 3
Reading School: Independence Elementary SchoolTeacher: AllGrade: 3Group: All
Report Run: 07/24/17 - 1:20 PM
Strand Level Skill Description
Student Date at Risk
PhonologicalAwareness 0.16 Identify pictures with same final sound
Lee Ho 04/11/2017Sherry Newton 02/21/2017
PhonologicalAwareness 0.16 Identify pictures with same initial sound
Carl Atkinson 03/22/2017Kelly Bentley 03/21/2017Sue Carter 03/21/2017Derek Hill 03/28/2017Lee Ho 03/22/2017Lin Nguyen 03/07/2017
PhonologicalAwareness 0.16 Recognize rhyming words when spoken
Carl Atkinson 04/14/2017
Spelling 3.27 Spell words with silent consonants.
Marc Bauman 07/19/2017
Spelling 2.79 Spell words with vowel patterns.
Katie Colvin 07/19/2017Michael Farmer 07/21/2017Jorge Gomez 05/03/2017Malia Kimball 05/09/2017Isabella Scott 01/18/2017Amy Tuele 01/18/2017
Vocabulary 3.42 Categorize words by specificity and hierarchy
Guille Suarez 03/10/2017
Vocabulary 2.89 Determine the meaning of multiple-meaning words (homonyms, homographs, homophones)
Katie Colvin 07/19/2017Emily Crabtree 07/21/2017Hoa Dinh 07/14/2017Jade Dreier 07/19/2017Michael Farmer 07/21/2017Megan Flagg 07/19/2017Jason Gobiera 05/26/2017Jorge Gomez 05/23/2017Malia Kimball 05/26/2017Manuel Reyes 02/03/2017LeRoi Rice 02/08/2017Isabella Scott 02/10/2017Guille Suarez 02/14/2017Amy Tuele 02/10/2017Isaac Yahya 02/08/2017

Areas of Difficulty
Copyright © 2007-2016 Pearson Education, Inc. or its affiliate(s). All rights reserved.Page: 4
Reading School: Independence Elementary SchoolTeacher: AllGrade: 3Group: All
Report Run: 07/24/17 - 1:20 PM
Strand Level Skill Description
Student Date at Risk
Vocabulary 0.36 Recognize sight words and high-frequency words
Carl Atkinson 04/19/2017Kelly Bentley 05/02/2017Lee Ho 05/12/2017
Vocabulary 0.54 Recognize sight words and high-frequency words
Sherry Newton 03/29/2017
Vocabulary 0.04 Sort pictures into categories
Lee Ho 04/05/2017David Lam 02/10/2017Sherry Newton 02/10/2017Lin Nguyen 03/21/2017
Vocabulary 0.10 Sort pictures into categories
Carl Atkinson 03/28/2017Kelly Bentley 03/29/2017Sue Carter 03/29/2017
Vocabulary 3.84 Use context to determine the meaning of academic and domain specific vocabulary
Maria Gutierrez 07/21/2017
Vocabulary 3.42 Use resources to learn new words: dictionaries
Marc Bauman 07/19/2017Juan Gudinas-Cortez 07/21/2017Maria Gutierrez 07/21/2017Connie Linek 07/21/2017
Total Skills At Risk 48Total Students At Risk 28
*Options: No additional groupingSort by StrandShow all dates at riskDemographic filters not used1 Grade selectedAll Groups selected

SuccessMaker Administrator Guide 40
Cumulative Performance Reports The Cumulative Performance and Cumulative Performance Aggregate Reports show information about a student’s or group’s performance and progress. In the Cumulative Performance report, information includes students’ current course level, performance in the exercises, the total time spent in sessions for individual students, and the average time spent for the group. System Administrators can also filter the data according to demographic criteria if this is specified in the students’ profiles. Running the Cumulative Performance Report weekly is recommended, but you can run it as often as necessary.
The Cumulative Performance Aggregate Report provides School Administrators with a snapshot regarding the fidelity of the implementation and shows where adjustments in scheduling and performance need to be made. In the Cumulative Performance Aggregate report, information includes the mean current course level, mean performance in the exercises, and the mean total time spent in sessions for the group. System Administrators can also filter the data according to demographic criteria if this is specified in the students’ profiles. This report can be run as needed
Cumulative Performance Report - Administrator Options Table 3-2 Administrator Options for the Cumulative Performance Report
Options Selections
Student Selection Summary
View the number of groups and students selected for the report.
Choose Subject Select Math or Reading course assignments.
Course Selection Select one or more courses to include in the report. Course subject selection is required before running the report.
Additional Grouping Select how the student information is grouped in the report.
Remove Page Breaks
Select the check box to remove page breaks from report.
Sort Select how the information is sorted in the report.
Display Select how the student name is displayed in the Student column
Mask student display
Select the check box to disguise student names on the report. Clear the check box to display student names.
Show student performance for
Select All Dates or specify a date range using the Selected Date Range calendar.
Select Students by
School Select a school.
Teacher Select one or more teachers assigned for the course.
Grade Select one or more grade levels.

SuccessMaker Administrator Guide 41
Options Selections
Group Select one or more student groups.
Student Select one or more students.
Filter by Demographics: To filter results by demographic options, click Yes and scroll to the end of the screen to view all choices. All is the default selection for all demographic fields.
Disability Status Filters: All, Yes, No, Not Specified
English Language Proficiency
Filters: All, English, English Language Learner, Not Specified
Gender Filters: All, Female, Male, Not Specified
Migrant Status Filters: All, Migrant, Non-migrant, Not Specified
Race/ Ethnicity Filters: All, African American, Asian/Pacific Islander, Caucasian, Hispanic or Latino, Native American/Alaskan Native, Other, Not Specified
Socioeconomic Status
Filters: All, Economically disadvantaged, Not economically disadvantaged, Not Specified
Special Services Filters: 504 Plan, Gifted/Talented, IEP, No Special Services, Other
Cumulative Performance Report - Administrator Results
Header The information at the top of the report includes:
• Report Title
• Assigned Course Name
• Report Dates
• Report Run Date and Time
• School
• Teacher
• Grade
• Group

SuccessMaker Administrator Guide 42
Body of Report The body of the report includes the following information:
• Student: First name, middle name, and last name of student (for example, John Q. Doe), sorted by last name.
Level Data • Assigned Course Level: Course level assigned to the student.
• Current Course Level: Course level at which student is working in the course. If in IP, the field displays In IP.
• IP Level: Course level at the end of IP.
• Gain: Measure of the student’s exposure to content that is indexed in terms of level. Gain is calculated as the difference between the student’s current course level and the student’s placement level. During the IP process, the Gain Since IP field displays In IP.
Level Data (using the Select Date Range report option)
• Assigned Course Level: Course level assigned to the student.
• End Date Level: Course level at which the student is working at the end of the selected date range. If in IP at the time, the field displays In IP.
• Start Date Level: Course level at which the student is working at the start of the selected date range. If in IP at the time, the field displays In IP. If IP has occurred within the selected date range, (IP) displays with the IP Level.
• Gain (within date range): Measure of the student’s exposure to content that is indexed in terms of level. Gain is calculated as the difference between the student’s End Date and Start Date course levels. If both End Date Level and Start Date Level show In IP, the Gain column displays In IP as well.
Usage
• Time Spent: Time the student has spent in the course. During IP, the field displays In IP.
• Total Sessions: Total number of sessions the student has taken.
Instructional Performance
• Exercises Correct: Total number of exercises the student has answered correctly. Once IP is complete, IP performance results are not included in this figure. In Reading, this figure includes all content except Independent Practice and Pre-Requisites.
• Exercises Attempted: Total number of exercises the student has attempted. Once IP is complete, IP performance results are not included in this figure. In Reading, this includes all content except Independent Practice and Pre-Requisites.
• Exercises Percent Correct: Percentage of exercises the student answered correctly. Once IP is complete, IP performance results are not included in this figure.

SuccessMaker Administrator Guide 43
Mastery
• Skills Assessed: Total number of skills with a status other than In Progress, as determined by Motion for Math and Reading.
• Skills Mastered: Total number of skills mastered. If a date range is specified, the value is NA.
• Skills Percent Mastered: Percentage of skills the student mastered against the number of skills completed or judged in the assigned course. If a date range is specified, the value is NA.
• AP (Acceptable Performance): For Math, AP is achieved when 90% or more of the judged skills are mastered. For Reading, AP is achieved when 75% or more of the judged skills are mastered. If a date range is specified, the value is NA.
Summary Data The Summary Data fields include the following information summarized by assignment:
• Mean: Average of all selected students for whom actual data is displayed in the report, excluding Session Date. Any row with (- -) is not included in this calculation.
• Standard Deviation: Standard deviation of all selected students in the report, excluding Date. Any row with (- -) is not included in this calculation.
• % of Students with AP: Percentage of students with AP for whom actual data is displayed in the report.
Options The Options section provides a summary of the Report Options screen selections chosen for this report.
Legend The legend at the bottom of the report includes a brief description of the abbreviations and symbols that appear in the report data.

SuccessMaker Administrator Guide 44
Cumulative Performance Report - Aggregate Options Table 3-3 Aggregate Options for the Cumulative Performance Report
Options Selections
Student Selection Summary
View the number of groups and students selected for the report.
Choose Subject Select Math or Reading course assignments.
Course Selection Select one or more courses to include in the report. Course subject selection is required before running the report.
Additional Grouping Select how the student information is grouped in the report.
Remove Page Breaks
Select the check box to remove page breaks from report.
Sort Select how the information is sorted in the report.
Select Schools Select one or more schools
Filter by Demographics: To filter results by demographic options, click Yes and scroll to the end of the screen to view all choices. All is the default selection for all demographic fields.
Disability Status Filters: All, Yes, No, Not Specified
English Language Proficiency
Filters: All, English, English Language Learner, Not Specified
Gender Filters: All, Female, Male, Not Specified
Migrant Status Filters: All, Migrant, Non-migrant, Not Specified
Race/ Ethnicity Filters: All, African American, Asian/Pacific Islander, Caucasian, Hispanic or Latino, Native American/Alaskan Native, Other, Not Specified
Socioeconomic Status
Filters: All, Economically disadvantaged, Not economically disadvantaged, Not Specified
Special Services Filters: 504 Plan, Gifted/Talented, IEP, No Special Services, Other
Cumulative Performance Report - Aggregate Results
Header The information at the top of the report includes:
• Report Title
• Assigned Course Name

SuccessMaker Administrator Guide 45
• Report Run Date and Time
• District
• Grade
Body of Report The body of the report includes the following information:
• School (# of Students): The school name and the number of students included in the report.
Level Data (Mean) • Current Course Level: Mean course level for all assigned students in each school.
• IP Level: Mean course level at the end of IP.
• Gain: Measure of the school’s exposure to content that is indexed in terms of level. Mean gain is calculated as the difference between the school’s mean current course level and the school’s mean placement level.
Usage (Mean) • Time Spent: Mean time the school has spent in the course.
• Total Sessions: Mean total number of sessions taken by all the assigned students in the school.
Instructional Performance • Exercises Correct: Mean total number of exercises answered correctly by all the assigned
students in the school. Once IP is complete, IP performance results are not included in this figure. In Reading, this figure includes all content except Independent Practice and Pre-Requisites.
• Exercises Attempted: Mean total number of exercises attempted by all the assigned students in the school. Once IP is complete, IP performance results are not included in this figure. In Reading, this includes all content except Independent Practice and Pre-Requisites.
• Exercises Percent Correct: Mean percentage of exercises answered correctly by all the assigned students in the school. Once IP is complete, IP performance results are not included in this figure.
Mastery • Skills Assessed: Mean total number of skills with a status other than In Progress, as determined
by Motion for Math and Reading.
• Skills Mastered: Mean total number of skills mastered. If a date range is specified, the value is NA.
• Skills Percent Mastered: Mean percentage of skills mastered by all the assigned students in the school against the number of skills completed or judged in the assigned course.
• Percent Students with AP: For Math, Acceptable Performance (AP) is achieved when 90% or more of the judged skills are mastered. For Reading, AP is achieved when 75% or more of the judged skills are mastered.

SuccessMaker Administrator Guide 46
Summary Data The Summary Data fields include the following information summarized by assignment:
• Mean: Average of all selected students for whom actual data is displayed in the report. Any row with (- -) is not included in this calculation.
• Standard Deviation: Standard deviation of all selected students in the report. Any row with (- -) is not included in this calculation.
Options The Options section provides a summary of the Report Options screen selections chosen for this report.
Legend The legend at the bottom of the report includes a brief description of the abbreviations and symbols that appear in the report data.

Cumulative Performance
Copyright © 2007-2016 Pearson Education, Inc. or its affiliate(s). All rights reserved.Page: 1 of 2
Math School: Independence Elementary School
Teacher: All
Grade: 3
Group: All
Report Dates: All assigned start dates
Report Run: 07/24/17 - 01:25 PM
Student
Level Data Usage Instructional Performance Mastery
AssignedCourseLevel
Current Course Level
IP Level Gain TimeSpent
TotalSessions
(minimum of 1
assessment)
ExercisesCorrect
ExercisesAttempted
ExercisesPercentCorrect
SkillsAssessed
SkillsMastered
SkillsPercent
MasteredAP
Carl Atkinson 3 2.1 2.02 0.08 14:22 44 231 483 48% 7 5 71%
Marc Bauman 3 3.99 3.54 0.45 13:32 42 471 509 93% 93 93 100% •
Kelly Bentley 3 2.08 2.02 0.06 14:23 44 226 476 47% 8 7 88%
Sue Carter 3 2.09 2.01 0.08 14:09 44 228 478 48% 6 6 100% •
Katie Colvin 3 3.23 3.02 0.21 21:32 66 522 838 62% 38 36 95% •
Emily Crabtree 3 3.23 3.02 0.21 21:28 66 525 843 62% 34 32 94% •
Hoa Dinh 3 3.29 3.02 0.27 29:34 91 740 1157 64% 48 42 88%
Jade Dreier 3 3.24 3.03 0.21 21:25 66 524 839 62% 31 28 90% •
Michael Farmer 3 1.3 1.00 0.30 32:04 98 716 1130 63% 42 33 79%
Rosa Fernandez-Rivera 3 2.21 2.01 0.20 31:44 97 630 1189 53% 34 24 71%
Megan Flagg 3 3.28 3.03 0.25 29:24 91 752 1174 64% 49 46 94% •
Shaneequa Forsythe 3 2.27 2.01 0.26 31:32 97 631 1194 53% 33 23 70%
Laci Gill 3 2.27 2.03 0.24 31:34 97 645 1210 53% 32 21 66%
Jason Gobiera 3 3.96 3.53 0.43 13:28 42 472 510 93% 87 87 100% •
Jorge Gomez 3 3.96 3.51 0.45 13:46 42 469 507 93% 89 89 100% •
Juan Gudinas-Cortez 3 3.17 3.04 0.13 13:07 40 311 484 64% 26 26 100% •
Maria Gutierrez 3 3.22 3.03 0.19 12:58 40 298 469 64% 30 29 97% •
Derek Hill 3 3.32 3.03 0.29 29:39 91 753 1173 64% 52 46 88%
Lee Ho 3 3.37 3.05 0.32 29:46 91 751 1174 64% 59 56 95% •
Malia Kimball 3 3.99 3.51 0.48 13:31 42 470 508 93% 92 92 100% •
Demarion Kirby 3 In IP In IP In IP 0:39 2 28 40 70% In IP In IP In IP
Anthony Koulouris 3 In IP In IP In IP 0:38 2 28 40 70% In IP In IP In IP
David Lam 3 3.28 3.02 0.26 21:36 66 525 841 62% 38 35 92% •
Connie Linek 3 3.19 3.04 0.15 13:04 40 299 470 64% 29 28 97% •

Cumulative Performance
Copyright © 2007-2016 Pearson Education, Inc. or its affiliate(s). All rights reserved.Page: 2 of 2
Math School: Independence Elementary School
Teacher: All
Grade: 3
Group: All
Report Dates: All assigned start dates
Report Run: 07/24/17 - 01:25 PM
Student
Level Data Usage Instructional Performance Mastery
AssignedCourseLevel
Current Course Level
IP Level Gain TimeSpent
TotalSessions
(minimum of 1
assessment)
ExercisesCorrect
ExercisesAttempted
ExercisesPercentCorrect
SkillsAssessed
SkillsMastered
SkillsPercent
MasteredAP
Sherry Newton 3 3.2 3.03 0.17 21:37 66 513 830 62% 37 37 100% •
Lin Nguyen 3 3.36 3.02 0.34 29:30 91 759 1174 65% 65 61 94% •
Jesus Ortiz 3 In IP In IP In IP 0:38 2 28 40 70% In IP In IP In IP
Manuel Reyes 3 3.98 3.51 0.47 13:45 42 467 505 92% 93 93 100% •
LeRoi Rice 3 3.97 3.54 0.43 13:39 42 471 509 93% 92 92 100% •
James Ryan 3 3.21 3.02 0.19 21:19 66 520 835 62% 35 33 94% •
Mateo Salazar 2 1.28 1.06 0.22 31:32 97 595 1138 52% 22 11 50%
Isabella Scott 3 3.99 3.53 0.46 13:25 42 469 507 93% 92 92 100% •
Destin Scroggins 2 1.25 1.06 0.19 31:27 97 589 1137 52% 23 9 39%
Guille Suarez 3 3.19 3.01 0.18 12:54 40 302 475 64% 27 27 100% •
Amy Tuele 3 3.2 3.01 0.19 12:55 40 309 481 64% 30 29 97% •
Tyree Winters 2 1.24 1.06 0.18 31:23 97 582 1132 51% 21 7 33%
Isaac Yahya 3 3.2 3.03 0.17 12:57 40 311 484 64% 29 29 100% •
Mean - 37 Students 2.92 2.97 2.72 0.26 19:21 59.54 463.78 729.27 66.41% 44.79 41.29 87.71%
Standard Deviation 0.28 0.85 0.78 0.12 9:26 28.96 205.44 361.18 14.31% 27.08 28.89 17.89%
% of Students with AP: 62.16%
*Options: No additional grouping (grouped by course only)
Demographic filters not used
1 School selected
All Teachers selected
1 Grade selected
All Groups selected
Legend: AP Acceptable Performance (90% Skills Mastered)
In IP Student still in Initial Placement
NA Data does not apply. Some courses and settings may not report data for all columns
-- Data has not been reported yet
• Skills Percent Mastered meets acceptable performance (AP)
Notes: Instructional Performance data does not include Initial Placement performance after the student has placed (data resets). When run by date range, Initial Placement results are included if they fall within the date range.

Cumulative Performance
Copyright © 2007-2016 Pearson Education, Inc. or its affiliate(s). All rights reserved.Page: 1 of 2
Reading School: Independence Elementary School
Teacher: All
Grade: 3
Group: All
Report Dates: All assigned start dates
Report Run: 07/24/17 - 01:26 PM
Student
Level Data Usage Instructional Performance Mastery
AssignedCourseLevel
Current Course Level
IP Level Gain TimeSpent
TotalSessions
(minimum of 1
assessment)
ExercisesCorrect
ExercisesAttempted
ExercisesPercentCorrect
SkillsAssessed
SkillsMastered
SkillsPercent
MasteredAP
Carl Atkinson 3 0.36 0.00 0.36 21:45 67 608 1139 53% 15 3 20%
Marc Bauman 3 3.43 3.00 0.43 12:58 40 428 630 68% 22 18 82% •
Kelly Bentley 3 0.36 0.00 0.36 21:46 67 588 1095 54% 14 1 7%
Sue Carter 3 0.36 0.00 0.36 21:46 67 580 1065 54% 14 4 29%
Katie Colvin 3 3.38 2.75 0.63 21:16 65 617 941 66% 26 15 58%
Emily Crabtree 3 3.38 2.75 0.63 21:20 65 617 941 66% 26 16 62%
Hoa Dinh 3 3.38 2.75 0.63 21:05 65 617 941 66% 26 18 69%
Jade Dreier 3 3.38 2.75 0.63 21:10 65 617 941 66% 26 15 58%
Michael Farmer 3 3.38 2.75 0.63 21:12 65 617 941 66% 26 16 62%
Rosa Fernandez-Rivera 3 4.49 4.00 0.49 12:59 40 649 689 94% 31 31 100% •
Megan Flagg 3 3.38 2.75 0.63 21:11 65 617 941 66% 26 15 58%
Shaneequa Forsythe 3 4.49 4.00 0.49 12:56 40 649 689 94% 31 31 100% •
Laci Gill 3 4.49 4.00 0.49 12:58 40 649 689 94% 31 31 100% •
Jason Gobiera 3 3.1 2.75 0.35 12:58 40 337 492 68% 17 16 94% •
Jorge Gomez 3 3.1 2.75 0.35 13:05 40 337 492 68% 17 14 82% •
Juan Gudinas-Cortez 3 3.96 3.00 0.96 29:38 91 1078 1596 68% 43 36 84% •
Maria Gutierrez 3 3.96 3.00 0.96 29:22 91 1078 1596 68% 43 35 81% •
Derek Hill 3 0.36 0.00 0.36 21:11 65 613 1031 59% 15 5 33%
Lee Ho 3 0.4 0.00 0.40 21:16 65 624 1050 59% 16 5 31%
Malia Kimball 3 3.1 2.75 0.35 13:00 40 337 492 68% 17 12 71%
Demarion Kirby 3 In IP In IP In IP 0:40 2 14 20 70% In IP In IP In IP
Anthony Koulouris 3 In IP In IP In IP 0:40 2 14 20 70% In IP In IP In IP
David Lam 3 0.55 0.00 0.55 29:36 91 903 1501 60% 21 8 38%
Connie Linek 3 3.96 3.00 0.96 29:40 91 1078 1596 68% 43 36 84% •
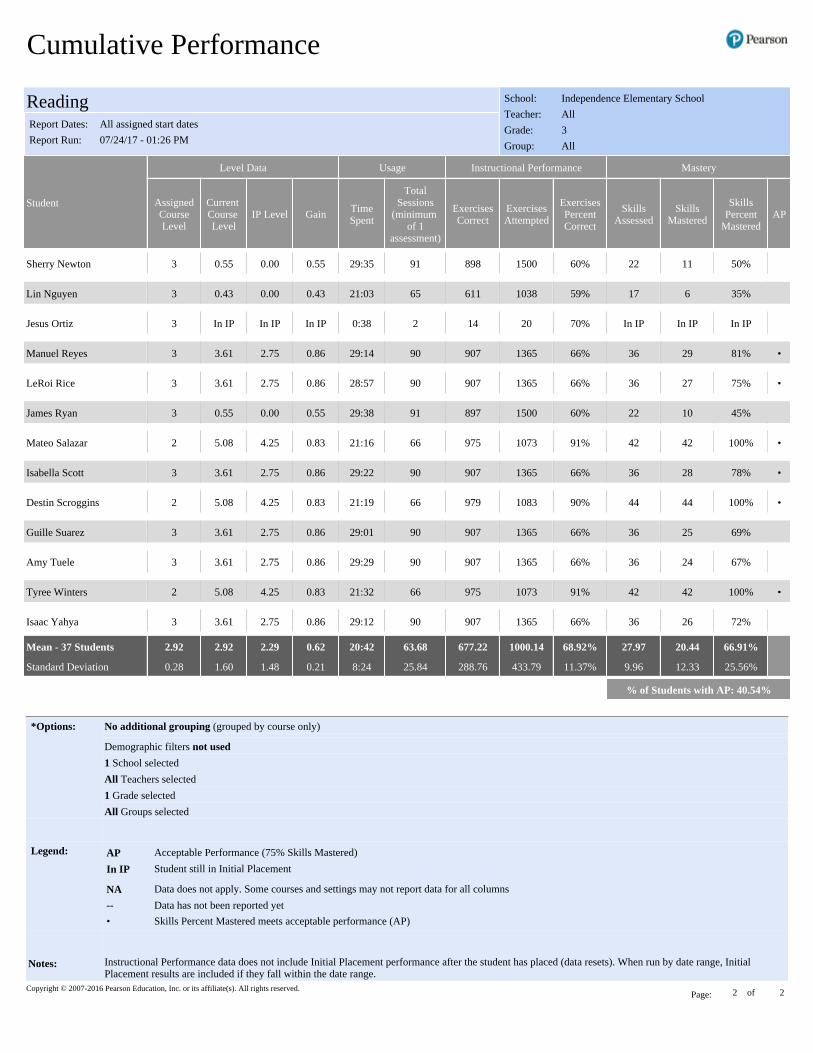
Cumulative Performance
Copyright © 2007-2016 Pearson Education, Inc. or its affiliate(s). All rights reserved.Page: 2 of 2
Reading School: Independence Elementary School
Teacher: All
Grade: 3
Group: All
Report Dates: All assigned start dates
Report Run: 07/24/17 - 01:26 PM
Student
Level Data Usage Instructional Performance Mastery
AssignedCourseLevel
Current Course Level
IP Level Gain TimeSpent
TotalSessions
(minimum of 1
assessment)
ExercisesCorrect
ExercisesAttempted
ExercisesPercentCorrect
SkillsAssessed
SkillsMastered
SkillsPercent
MasteredAP
Sherry Newton 3 0.55 0.00 0.55 29:35 91 898 1500 60% 22 11 50%
Lin Nguyen 3 0.43 0.00 0.43 21:03 65 611 1038 59% 17 6 35%
Jesus Ortiz 3 In IP In IP In IP 0:38 2 14 20 70% In IP In IP In IP
Manuel Reyes 3 3.61 2.75 0.86 29:14 90 907 1365 66% 36 29 81% •
LeRoi Rice 3 3.61 2.75 0.86 28:57 90 907 1365 66% 36 27 75% •
James Ryan 3 0.55 0.00 0.55 29:38 91 897 1500 60% 22 10 45%
Mateo Salazar 2 5.08 4.25 0.83 21:16 66 975 1073 91% 42 42 100% •
Isabella Scott 3 3.61 2.75 0.86 29:22 90 907 1365 66% 36 28 78% •
Destin Scroggins 2 5.08 4.25 0.83 21:19 66 979 1083 90% 44 44 100% •
Guille Suarez 3 3.61 2.75 0.86 29:01 90 907 1365 66% 36 25 69%
Amy Tuele 3 3.61 2.75 0.86 29:29 90 907 1365 66% 36 24 67%
Tyree Winters 2 5.08 4.25 0.83 21:32 66 975 1073 91% 42 42 100% •
Isaac Yahya 3 3.61 2.75 0.86 29:12 90 907 1365 66% 36 26 72%
Mean - 37 Students 2.92 2.92 2.29 0.62 20:42 63.68 677.22 1000.14 68.92% 27.97 20.44 66.91%
Standard Deviation 0.28 1.60 1.48 0.21 8:24 25.84 288.76 433.79 11.37% 9.96 12.33 25.56%
% of Students with AP: 40.54%
*Options: No additional grouping (grouped by course only)
Demographic filters not used
1 School selected
All Teachers selected
1 Grade selected
All Groups selected
Legend: AP Acceptable Performance (75% Skills Mastered)
In IP Student still in Initial Placement
NA Data does not apply. Some courses and settings may not report data for all columns
-- Data has not been reported yet
• Skills Percent Mastered meets acceptable performance (AP)
Notes: Instructional Performance data does not include Initial Placement performance after the student has placed (data resets). When run by date range, Initial Placement results are included if they fall within the date range.

Cumulative Performance - Aggregate
Copyright © 2007-2016 Pearson Education, Inc. or its affiliate(s). All rights reserved.Page: 1
Math District: DistrictGrade: 3Report Run: 07/24/17 - 01:29 PM
School (# of Students)
Level Data (Mean) Usage (Mean) Instructional Performance (Mean) Mastery (Mean)
CurrentCourseLevel
IPLevel Gain Time
Spent
TotalSessions
(minimum of 1assessment)
ExercisesCorrect
ExercisesAttempted
ExercisesPercentCorrect
SkillsAssessed
SkillsMastered
SkillsPercent
Mastered
PercentStudentsWith AP
Independence Elementary School (37) 2.97 2.72 0.26 19:21 60 464 729 66% 45 41 88% 62%
Main Street Elementary School (30) 2.97 2.71 0.26 19:60 62 481 753 67% 46 43 87% 63%
Mean - 2 Schools 2.97 2.72 0.26 19:40 61.00 472.50 741.00 66.50% 45.50 42.00 87.50% 62.50%
Standard Deviation 0.00 0.01 0.00 0:28 1.41 12.02 16.97 0.71% 0.71 1.41 0.71% 0.71%

Cumulative Performance - Aggregate
Copyright © 2007-2016 Pearson Education, Inc. or its affiliate(s). All rights reserved.Page: 1
Reading District: DistrictGrade: 3Report Run: 07/24/17 - 01:30 PM
School (# of Students)
Level Data (Mean) Usage (Mean) Instructional Performance (Mean) Mastery (Mean)
CurrentCourseLevel
IPLevel Gain Time
Spent
TotalSessions
(minimum of 1assessment)
ExercisesCorrect
ExercisesAttempted
ExercisesPercentCorrect
SkillsAssessed
SkillsMastered
SkillsPercent
Mastered
PercentStudentsWith AP
Independence Elementary School (37) 2.92 2.29 0.62 20:42 64 677 1000 69% 28 20 67% 41%
Main Street Elementary School (30) 2.96 2.34 0.62 20:42 64 677 993 69% 28 21 68% 40%
Mean - 2 Schools 2.94 2.32 0.62 20:42 64.00 677.00 996.50 69.00% 28.00 20.50 67.50% 40.50%
Standard Deviation 0.03 0.04 0.00 0:00 0.00 0.00 4.95 0.00% 0.00 0.71 0.71% 0.71%
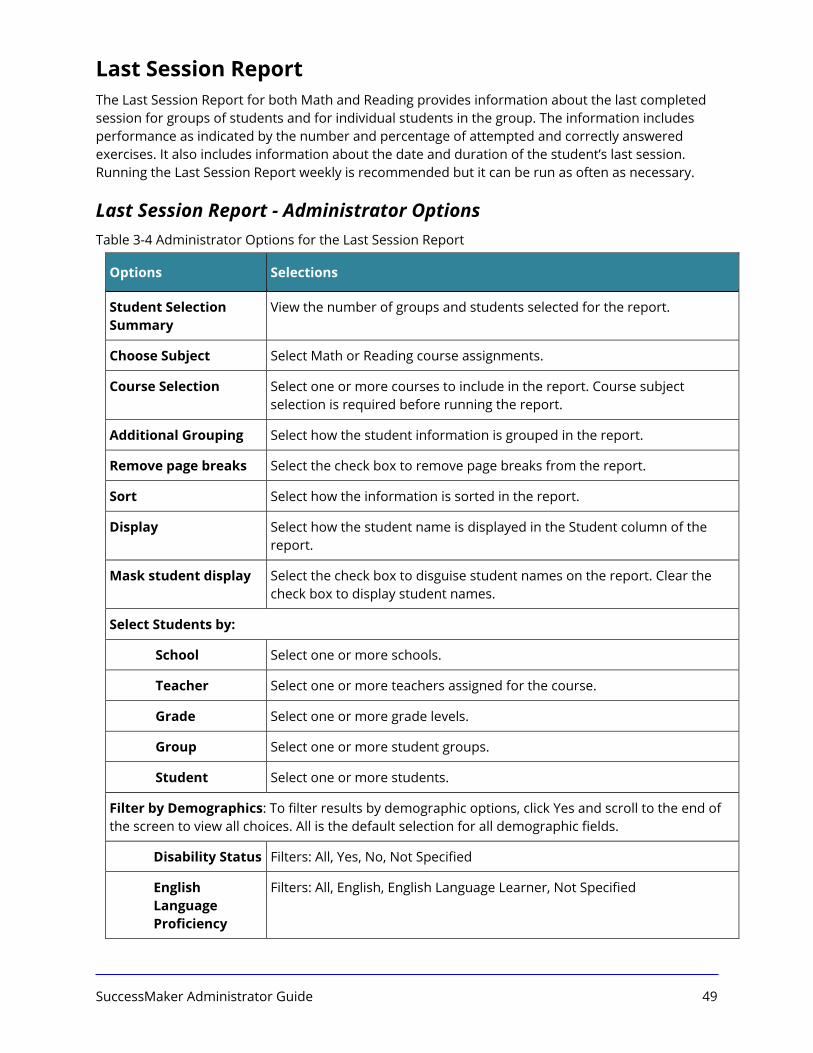
SuccessMaker Administrator Guide 49
Last Session Report The Last Session Report for both Math and Reading provides information about the last completed session for groups of students and for individual students in the group. The information includes performance as indicated by the number and percentage of attempted and correctly answered exercises. It also includes information about the date and duration of the student’s last session. Running the Last Session Report weekly is recommended but it can be run as often as necessary.
Last Session Report - Administrator Options Table 3-4 Administrator Options for the Last Session Report
Options Selections
Student Selection Summary
View the number of groups and students selected for the report.
Choose Subject Select Math or Reading course assignments.
Course Selection Select one or more courses to include in the report. Course subject selection is required before running the report.
Additional Grouping Select how the student information is grouped in the report.
Remove page breaks Select the check box to remove page breaks from the report.
Sort Select how the information is sorted in the report.
Display Select how the student name is displayed in the Student column of the report.
Mask student display Select the check box to disguise student names on the report. Clear the check box to display student names.
Select Students by:
School Select one or more schools.
Teacher Select one or more teachers assigned for the course.
Grade Select one or more grade levels.
Group Select one or more student groups.
Student Select one or more students.
Filter by Demographics: To filter results by demographic options, click Yes and scroll to the end of the screen to view all choices. All is the default selection for all demographic fields.
Disability Status Filters: All, Yes, No, Not Specified
English Language Proficiency
Filters: All, English, English Language Learner, Not Specified

SuccessMaker Administrator Guide 50
Options Selections
Gender Filters: All, Female, Male, Not Specified
Migrant Status Filters: All, Migrant, Non-migrant, Not Specified
Race/ Ethnicity Filters: All, African American, Asian/Pacific Islander, Caucasian, Hispanic or Latino, Native American/Alaskan Native, Other, Not Specified
Socioeconomic Status
Filters: All, Economically disadvantaged, Not economically disadvantaged, Not Specified
Special Services Filters: 504 Plan, Gifted/Talented, IEP, No Special Services, Other
Last Session Report - Administrator Results
Header • Report Title
• Assigned Course Name
• Report Run Date and Time
• School
• Teacher
• Grade
• Group
Body of Report The body of the report includes the following information:
• Student: First and last name student name, Student ID, or student user name, based on option selected in the Report Options screen.
• Level
• Current Course Level: Current average level of all active strands in the course. Current Course Level is an indicator of where a student is working in the course. If in IP, field displays “In IP.”
• Raw Performance
• Exercises Correct: Total number of exercises the student has answered correctly in the last session. In Reading, this figure includes all content except Independent Practice and Pre-requisites.
• Exercises Attempted: Total number of exercises the student has attempted in the last session. In Reading, this figure includes all content except Independent Practice and Pre-requisites.
• Exercises Percent Correct: Percentage of exercises the student answered correctly in the last session. In Reading, this figure includes all content except Independent Practice and Pre-requisites.

SuccessMaker Administrator Guide 51
• Exercises Correct / Attempted
• Instructional (Reading): Number of attempts for all instructional-level content in the session, excluding Independent Practice, Pre-requisites, and Initial Placement content. The column displays the correct answers above the number of attempts and is sorted by the number of correct answers. If fluency was part of the reading session, an (F) indicator is displayed with the instructional data.
• Independent Practice (Reading): Number of attempts for all Independent Practice content in the session. The column displays the correct answers above the number of attempts.
• Remediation (Reading): Number of attempts for all pre-requisite content in the session. The column displays the correct answers above the number of attempts.
• Usage
• Help Used: Number of times Show Answer (Math) or Help (Reading) was accessed.
• Time Spent: Total Time the student spent in the course during the last session. Early exits will be noted with an asterisk (*).
• Total Sessions: Total number of sessions for the assigned course.
• Session Date: Date of last session.
Summary Data The Summary Data fields include the following information:
• Mean: Average of all selected students for whom actual data is displayed in the report, excluding session date. Any column with (--) is not included in this calculation.
• Standard Deviation: Standard deviation of all selected students in the report, excluding session date. Any column with (--) is not included in this calculation.
Options and Legend • The Options section provides a summary of the Report Options screen selections chosen for this
report. The legend at the bottom of the report includes a brief description of the abbreviations and symbols that appear in the report date.

Last Session
Copyright © 2007-2016 Pearson Education, Inc. or its affiliate(s). All rights reserved.Page: 1 of 2
Math School: Independence Elementary School
Teacher: All
Grade: 3
Group: All
Report Run:
07/24/17 - 01:34 PM
Student
Level Raw Performance Usage
CurrentCourseLevel
ExercisesCorrect
ExercisesAttempted
ExercisesPercentCorrect
HelpUsed
TimeSpent
Total Sessions(minimum of 1
assignment)
SessionDate
Carl Atkinson 2.1 6 12 50% 3 0:17* 44 07/18/17
Marc Bauman 3.99 13 14 93% 2 0:18* 42 07/21/17
Kelly Bentley 2.08 7 14 50% 5 0:19* 44 07/19/17
Sue Carter 2.09 7 14 50% 4 0:17* 44 07/14/17
Katie Colvin 3.23 9 14 64% 1 0:20 66 07/19/17
Emily Crabtree 3.23 8 13 62% 0 0:20 66 07/21/17
Hoa Dinh 3.29 9 13 69% 2 0:20 91 07/21/17
Jade Dreier 3.24 9 14 64% 0 0:18* 66 07/19/17
Michael Farmer 1.3 8 12 67% 1 0:20 98 07/21/17
Rosa Fernandez-Rivera 2.21 8 13 62% 1 0:19* 97 07/14/17
Megan Flagg 3.28 9 13 69% 0 0:20 91 07/21/17
Shaneequa Forsythe 2.27 7 12 58% 1 0:20 97 07/19/17
Laci Gill 2.27 7 12 58% 2 0:20 97 07/14/17
Jason Gobiera 3.96 13 14 93% 2 0:19* 42 07/19/17
Jorge Gomez 3.96 13 14 93% 1 0:20 42 07/21/17
Juan Gudinas-Cortez 3.17 10 14 71% 0 0:20 40 07/19/17
Maria Gutierrez 3.22 10 14 71% 1 0:17* 40 07/21/17
Derek Hill 3.32 7 11 64% 2 0:19* 91 07/18/17
Lee Ho 3.37 8 12 67% 0 0:17* 91 07/19/17
Malia Kimball 3.99 13 14 93% 0 0:18* 42 07/18/17
Demarion Kirby In IP 14 20 70% 2 0:19* 2 07/14/17
Anthony Koulouris In IP 14 20 70% 0 0:20 2 07/21/17
David Lam 3.28 8 13 62% 2 0:20 66 07/21/17
Connie Linek 3.19 10 14 71% 1 0:20 40 07/21/17
Sherry Newton 3.2 7 12 58% 1 0:20 66 07/21/17
Lin Nguyen 3.36 8 12 67% 1 0:18* 91 07/18/17
Jesus Ortiz In IP 14 20 70% 1 0:18* 2 07/18/17
Manuel Reyes 3.98 13 14 93% 1 0:20 42 07/19/17
LeRoi Rice 3.97 13 14 93% 1 0:19* 42 07/18/17
James Ryan 3.21 9 14 64% 1 0:20 66 07/21/17
Mateo Salazar 1.28 8 12 67% 1 0:20* 97 07/21/17
Isabella Scott 3.99 13 14 93% 0 0:20 42 07/21/17
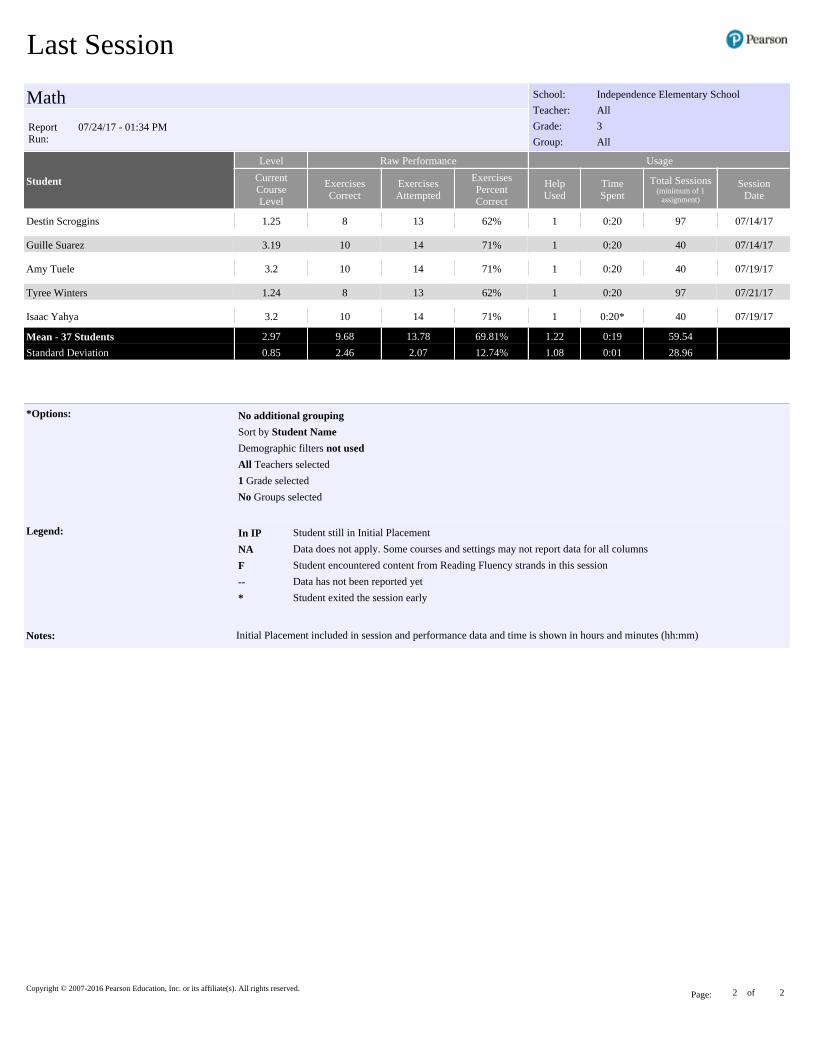
Last Session
Copyright © 2007-2016 Pearson Education, Inc. or its affiliate(s). All rights reserved.Page: 2 of 2
Math School: Independence Elementary School
Teacher: All
Grade: 3
Group: All
Report Run:
07/24/17 - 01:34 PM
Student
Level Raw Performance Usage
CurrentCourseLevel
ExercisesCorrect
ExercisesAttempted
ExercisesPercentCorrect
HelpUsed
TimeSpent
Total Sessions(minimum of 1
assignment)
SessionDate
Destin Scroggins 1.25 8 13 62% 1 0:20 97 07/14/17
Guille Suarez 3.19 10 14 71% 1 0:20 40 07/14/17
Amy Tuele 3.2 10 14 71% 1 0:20 40 07/19/17
Tyree Winters 1.24 8 13 62% 1 0:20 97 07/21/17
Isaac Yahya 3.2 10 14 71% 1 0:20* 40 07/19/17
Mean - 37 Students 2.97 9.68 13.78 69.81% 1.22 0:19 59.54
Standard Deviation 0.85 2.46 2.07 12.74% 1.08 0:01 28.96
*Options: No additional grouping
Sort by Student Name
Demographic filters not used
All Teachers selected
1 Grade selected
No Groups selected
Legend: In IP Student still in Initial Placement
NA Data does not apply. Some courses and settings may not report data for all columns
F Student encountered content from Reading Fluency strands in this session
-- Data has not been reported yet
* Student exited the session early
Notes: Initial Placement included in session and performance data and time is shown in hours and minutes (hh:mm)

Last Session
Copyright © 2007-2016 Pearson Education, Inc. or its affiliate(s). All rights reserved.Page: 1 of 2
Reading School: Independence Elementary School
Teacher: All
Grade: 3
Group: AllReport Run: 07/24/17 - 01:35 PM
Student
Level Raw Performance Exercises Correct / Attempted Usage
CurrentCourseLevel
ExercisesCorrect
ExercisesAttempted
ExercisesPercentCorrect
InstructionalIndependent
Practice RemediationHelpUsed
TimeSpent
Total Sessions
(minimum of 1assignment)
SessionDate
Carl Atkinson 0.36 9 15 60% 9 / 15 -- / -- -- / -- 3 0:20 67 07/21/17
Marc Bauman 3.43 12 16 75% 12 / 16 -- / -- -- / -- 1 0:20 40 07/21/17
Kelly Bentley 0.36 9 15 60% 9 / 15 -- / -- -- / -- 5 0:18* 67 07/21/17
Sue Carter 0.36 10 17 59% 10 / 17 -- / -- -- / -- 5 0:20 67 07/21/17
Katie Colvin 3.38 12 19 63% 12 / 19 -- / -- -- / -- 2 0:20 65 07/19/17
Emily Crabtree 3.38 12 19 63% 12 / 19 -- / -- -- / -- 1 0:18* 65 07/18/17
Hoa Dinh 3.38 12 19 63% 12 / 19 -- / -- -- / -- 1 0:20* 65 07/21/17
Jade Dreier 3.38 12 19 63% 12 / 19 -- / -- -- / -- 0 0:18* 65 07/21/17
Michael Farmer 3.38 12 19 63% 12 / 19 -- / -- -- / -- 1 0:20 65 07/21/17
Rosa Fernandez-Rivera 4.49 4 5 80% -- / -- (F) 4 / 5 -- / -- 0 0:20 40 07/19/17
Megan Flagg 3.38 12 19 63% 12 / 19 -- / -- -- / -- 0 0:20 65 07/21/17
Shaneequa Forsythe 4.49 4 5 80% -- / -- (F) 4 / 5 -- / -- 0 0:20* 40 07/21/17
Laci Gill 4.49 4 5 80% -- / -- (F) 4 / 5 -- / -- 1 0:20 40 07/21/17
Jason Gobiera 3.1 8 11 73% -- / -- 8 / 11 -- / -- 2 0:17* 40 07/19/17
Jorge Gomez 3.1 8 11 73% -- / -- 8 / 11 -- / -- 0 0:20* 40 07/19/17
Juan Gudinas-Cortez 3.96 24 34 71% 24 / 34 -- / -- -- / -- 2 0:20 91 07/19/17
Maria Gutierrez 3.96 24 34 71% 24 / 34 -- / -- -- / -- 0 0:20 91 07/21/17
Derek Hill 0.36 10 15 67% 10 / 15 -- / -- -- / -- 2 0:19* 65 07/21/17
Lee Ho 0.4 11 17 65% 11 / 17 -- / -- -- / -- 1 0:20 65 07/18/17
Malia Kimball 3.1 8 11 73% -- / -- 8 / 11 -- / -- 0 0:17* 40 07/21/17
Demarion Kirby In IP 7 10 70% 7 / 10 -- / -- -- / -- 1 0:20 2 07/19/17
Anthony Koulouris In IP 7 10 70% 7 / 10 -- / -- -- / -- 2 0:20 2 07/21/17
David Lam 0.55 15 23 65% 15 / 23 -- / -- -- / -- 0 0:20 91 07/18/17
Connie Linek 3.96 24 34 71% 24 / 34 -- / -- -- / -- 2 0:19* 91 07/21/17
Sherry Newton 0.55 7 11 64% 7 / 11 (F) -- / -- -- / -- 2 0:19* 91 07/21/17
Lin Nguyen 0.43 12 18 67% 12 / 18 -- / -- -- / -- 1 0:20 65 07/21/17
Jesus Ortiz In IP 7 10 70% 7 / 10 -- / -- -- / -- 1 0:18* 2 07/19/17
Manuel Reyes 3.61 11 16 69% 3 / 5 8 / 11 -- / -- 0 0:20 90 07/21/17
LeRoi Rice 3.61 11 16 69% 3 / 5 8 / 11 -- / -- 1 0:20 90 07/21/17
James Ryan 0.55 7 11 64% 7 / 11 (F) -- / -- -- / -- 1 0:19* 91 07/19/17
Mateo Salazar 5.08 19 22 86% 19 / 22 -- / -- -- / -- 1 0:20 66 07/14/17
Isabella Scott 3.61 11 16 69% 3 / 5 8 / 11 -- / -- 1 0:19* 90 07/19/17

Last Session
Copyright © 2007-2016 Pearson Education, Inc. or its affiliate(s). All rights reserved.Page: 2 of 2
Reading School: Independence Elementary School
Teacher: All
Grade: 3
Group: AllReport Run: 07/24/17 - 01:35 PM
Student
Level Raw Performance Exercises Correct / Attempted Usage
CurrentCourseLevel
ExercisesCorrect
ExercisesAttempted
ExercisesPercentCorrect
InstructionalIndependent
Practice RemediationHelpUsed
TimeSpent
Total Sessions
(minimum of 1assignment)
SessionDate
Destin Scroggins 5.08 19 22 86% 19 / 22 -- / -- -- / -- 2 0:17* 66 07/21/17
Guille Suarez 3.61 11 16 69% 3 / 5 8 / 11 -- / -- 2 0:20 90 07/18/17
Amy Tuele 3.61 11 16 69% 3 / 5 8 / 11 -- / -- 0 0:20 90 07/19/17
Tyree Winters 5.08 19 22 86% 19 / 22 -- / -- -- / -- 2 0:18* 66 07/19/17
Isaac Yahya 3.61 11 16 69% 3 / 5 8 / 11 -- / -- 1 0:18* 90 07/21/17
Mean - 37 Students 2.92 11.51 16.59 69.68% 11.03 / 16.13 7 / 9.5 NA 1.27 0:19 63.68
Standard Deviation 1.60 5.21 7.02 7.23% 6.32 / 8.32 1.81 / 2.71 NA 1.22 0:01 25.84
*Options: No additional grouping
Sort by Student Name
Demographic filters not used
All Teachers selected
1 Grade selected
No Groups selected
Legend: In IP Student still in Initial Placement
NA Data does not apply. Some courses and settings may not report data for all columns
F Student encountered content from Reading Fluency strands in this session
-- Data has not been reported yet
* Student exited the session early
Notes: Initial Placement included in session and performance data and time is shown in hours and minutes (hh:mm)

SuccessMaker Administrator Guide 54
Prescriptive Scheduling Reports The Prescriptive Scheduling, Prescriptive Scheduling Aggregate, and Prescriptive Scheduling Aggregate by Teacher are forecasting tools that enable you to monitor student progress and adjust schedules to reach performance goals. By specifying a time frame and a target level for each grade, the report can provide projections of where the student will be at the targeted date and, based on the student's current rate, the additional amount of time in the course for the student to achieve the target level.
System Administrators can also filter the data according to demographic criteria if this is specified in the students’ profiles.
Forecasting algorithms in the Prescriptive Scheduling reports require students to follow their regular, predictable schedule for the previous four weeks prior to the report being run for the most accurate interpretation of the reported data. This means the report should not be run immediately following a long break between student sessions such as winter break or spring break. For the most accurate data after a break, please wait 20 school days after returning to regular sessions before running the report.
Prescriptive Scheduling Report – Administrator Options Table 3-5 Administrator Options for the Prescriptive Scheduling Report
Options Selections
Student Selection Summary
View the number of groups, students, schools, teachers, and grades selected for the report.
Choose Subject Use the down arrow to select Math Courses or Reading Courses. You must select a subject before you can choose a course. After choosing a subject, the Selection Summary displays 1 School, All Teachers, All Grades, All Groups but is dynamically-updated as selections are made in the Select Students by section.
Course Selection Select a course. The default math or reading courses are the only courses that can be used to run the Prescriptive Scheduling Report.
Set Target Date by Specify the amount of time the student has to reach the forecasted level either by selecting a number of weeks using Weeks from today or by choosing a Specific date using the calendar.
Set Target Level per Grade
Set the levels the students are to achieve for each available grade. Levels are calculated using the enrolled grade for each student.
Remove page breaks (per level)
Select the check box to remove page breaks from the report.
Sort Select how the information is sorted in the report.
Display Select how the student name is displayed in the Student column of the report.

SuccessMaker Administrator Guide 55
Options Selections
Mask student display Select the check box to disguise student names on the report. Clear the check box to display student names.
Select Students by:
School Select a school.
Teacher Select one or more teachers assigned for the course.
Grade Select one or more grade levels.
Group Select one or more student groups.
Student Select one or more students.
Filter by Demographics: To filter results by demographic options, click Yes and scroll to the end of the screen to view all choices. All is the default selection for all demographic fields. The Demographic filters are not used at this time.
Disability Status Filters: All, Yes, No, Not Specified
English Language Proficiency
Filters: All, English, English Language Learner, Not Specified
Gender Filters: All, Female, Male, Not Specified
Migrant Status Filters: All, Migrant, Non-migrant, Not Specified
Race/ Ethnicity Filters: All, African American, Asian/Pacific Islander, Caucasian, Hispanic or Latino, Native American/Alaskan Native, Other, Not Specified
Socioeconomic Status
Filters: All, Economically disadvantaged, Not economically disadvantaged, Not Specified
Special Services Filters: 504 Plan, Gifted/Talented, IEP, No Special Services, Other
Prescriptive Scheduling – Administrator Results The report output consists of five parts: header, body of report, summary data, options, and legend.
Header The information at the top of the report includes:
• Report Title
• Assigned Course Name
• Target Level
• Target Date
• School Days to Target

SuccessMaker Administrator Guide 56
• Report Run: Date and Time
• School
• Teacher
• Grade
• Group
Body of Report The body of the report includes the following information:
• Student: First and last name of the student, student ID or student user name, based on the option selected on the Report Options screen.
• Performance Data
• Current Course Level: Level at which the student is presently working in the course. If the student is in IP (Initial Placement), the first level of entry into a course, this field displays In IP.
• IP Level: Course level at the end of IP.
• Start Level: If the IP setting is Off, this column displays the level at which the student started working in the course. If the IP setting is On, this column does not display.
• Time Since IP: Calculation of total time spent since IP completion.
• Time: If the IP setting is Off, this column displays the time the student has spent in the course. If the IP setting is On, this column does not display.
• Skills Percent Mastered: Percentage of the most recent 20 skills judged for mastery. If less than 20 skills have mastery status, this field displays (- -).
• Current Rate
• Session Length Setting: Session length setting for the student assignment.
• Average Min/Day: Average number of minutes spent per day, based on the most recent 20 school days of activity, including the day the report is generated. (This calculation includes any sessions completed on weekends and district-designated holidays within the 20-school-day date range.)
• Current Learning Rate: Rate at which the student is making gains in the course. This field displays one of the following rates:
• Baseline: All students are classified with a baseline until they have approximately seven hours of course work after IP completion and the learning rate can be accurately calculated.
• Low: Below average learning rate
• Medium: Average learning rate
• High: Above average learning rate
• Current Forecast
• Time: The projected amount of time the student will spend in the course given a) their average minutes per day and b) the number of d remaining (Time = a*b).

SuccessMaker Administrator Guide 57
• Level: Projected course level for the student at the end date based on the Current Learning Rate.
• Prescription
• Add’l Sessions to Target: Based on the Session length Setting, the number of additional sessions (rounded up) needed to complete the Add'l Time to Target.
• Add'l Time to Target: Based on the current level, the additional amount of time needed to reach the Target Level.
• Add'l Min/Day to Target: Additional number of minutes recommended for increasing the student's current Average Min/Day in order to reach the Target Level by the Target Date. EXAMPLE: If a student is currently averaging 10 minutes per school day in the Average Min/Day column and the Add'l Min/Day to Target column recommends increasing the current rate by an additional 5 minutes per school day, the student needs to spend 15 minutes per school day in order to reach the Target Level by the Target Date.
• Summary Data
The Summary Data fields include the following information summarized by assignment:
• Mean: Average of all selected students for whom actual data is display in the report, excluding Session Date. Any column with (- -) is not included in this calculation.
• Standard Deviation: Standard deviation of all selected students in the report, excluding Date. Any column with (- -) is not included in this calculation.
Options The Options section provides a summary of the Report Options screen selections chosen for this report.
Legend The legend at the bottom of the report includes a brief description of the abbreviations and symbols that appear in the report data.

Prescriptive Scheduling
Copyright © 2007-2016 Pearson Education, Inc. or its affiliate(s). All rights reserved. Page: 1 of 2
Math School: Independence Elementary School
Target Level: 3.90Target Date: 03/30/18 School Days to Target: 179Report Run: 07/24/17 - 01:41 PM
Teacher: All
Grade: 3
Group: All
Student
Performance Data Current Rate Current Forecast Prescription
CurrentCourseLevel
IPLevel
TimeSince IP
SkillsPercent
Mastered
SessionLengthSetting
AverageMin/Day
CurrentLearning
RateTime Level
Add'lSessionsto Target
Add'l Timeto Target
Add'lMin/Day
toTarget
Carl Atkinson 2.10 2.02 11:44 71% 0:20 0:09 low 27:51 2.45 593 197:23 67
Marc Bauman 3.99 3.54 11:36 100% 0:20 0:11 medium 33:06 5.16 • • • • • •
Kelly Bentley 2.08 2.02 11:48 88% 0:20 0:10 low 30:50 2.48 587 195:38 66
Sue Carter 2.09 2.01 11:34 100% 0:20 0:08 low 24:35 2.40 607 202:03 68
Katie Colvin 3.23 3.02 20:15 95% 0:20 0:10 low 30:33 3.58 94 31:19 11
Emily Crabtree 3.23 3.02 20:09 94% 0:20 0:11 low 33:15 3.62 86 28:37 10
Hoa Dinh 3.29 3.02 28:14 88% 0:20 0:11 low 33:06 3.69 70 23:09 8
Jade Dreier 3.24 3.03 20:06 90% 0:20 0:10 low 30:16 3.59 92 30:30 11
Michael Farmer 1.30 1.00 28:24 79% 0:20 0:11 low 33:06 1.99 920 306:28 103
Rosa Fernandez-Rivera 2.21 2.01 29:09 71% 0:20 0:08 low 25:17 2.51 578 192:21 65
Megan Flagg 3.28 3.03 28:06 94% 0:20 0:11 low 33:15 3.61 105 34:51 12
Shaneequa Forsythe 2.27 2.01 28:52 70% 0:20 0:10 low 31:15 2.61 542 180:24 61
Laci Gill 2.27 2.03 29:03 66% 0:20 0:08 low 24:26 2.55 559 186:03 63
Jason Gobiera 3.96 3.53 11:35 100% 0:20 0:10 medium 30:07 4.95 • • • • • •
Jorge Gomez 3.96 3.51 11:47 100% 0:20 0:11 medium 33:40 5.12 • • • • • •
Juan Gudinas-Cortez 3.17 3.04 11:51 100% 0:20 0:10 low 30:24 3.53 111 36:56 13
Maria Gutierrez 3.22 3.03 11:38 97% 0:20 0:11 low 31:49 3.78 32 10:36 4
Derek Hill 3.32 3.03 28:19 88% 0:20 0:09 low 27:51 3.65 78 26:00 9
Lee Ho 3.37 3.05 28:26 95% 0:20 0:10 low 29:41 3.73 61 20:07 7
Malia Kimball 3.99 3.51 11:38 100% 0:20 0:09 high 28:08 5.05 • • • • • •
Demarion Kirby In IP In IP In IP In IP 0:20 In IP In IP In IP In IP In IP In IP In IP
Anthony Koulouris In IP In IP In IP In IP 0:20 In IP In IP In IP In IP In IP In IP In IP
David Lam 3.28 3.02 20:19 92% 0:20 0:11 low 33:40 3.77 42 13:59 5
Connie Linek 3.19 3.04 11:48 97% 0:20 0:11 low 33:49 3.63 75 24:55 9

Prescriptive Scheduling
Copyright © 2007-2016 Pearson Education, Inc. or its affiliate(s). All rights reserved. Page: 2 of 2
Math School: Independence Elementary School
Target Level: 3.90Target Date: 03/30/18 School Days to Target: 179Report Run: 07/24/17 - 01:41 PM
Teacher: All
Grade: 3
Group: All
Student
Performance Data Current Rate Current Forecast Prescription
CurrentCourseLevel
IPLevel
TimeSince IP
SkillsPercent
Mastered
SessionLengthSetting
AverageMin/Day
CurrentLearning
RateTime Level
Add'lSessionsto Target
Add'l Timeto Target
Add'lMin/Day
toTarget
Sherry Newton 3.20 3.03 20:17 100% 0:20 0:11 low 33:57 3.53 131 43:28 15
Lin Nguyen 3.36 3.02 28:12 94% 0:20 0:09 low 27:00 3.72 56 18:34 7
Jesus Ortiz In IP In IP In IP In IP 0:20 In IP In IP In IP In IP In IP In IP In IP
Manuel Reyes 3.98 3.51 11:45 100% 0:20 0:10 high 30:33 5.09 • • • • • •
LeRoi Rice 3.97 3.54 11:42 100% 0:20 0:09 medium 27:17 4.88 • • • • • •
James Ryan 3.21 3.02 20:03 94% 0:20 0:11 low 33:06 3.53 130 43:19 15
Mateo Salazar 1.28 1.06 28:59 50% 0:20 0:11 low 32:40 1.99 908 302:37 102
Isabella Scott 3.99 3.53 11:31 100% 0:20 0:11 high 31:32 5.14 • • • • • •
Destin Scroggins 1.25 1.06 28:52 39% 0:20 0:08 low 24:52 1.86 935 311:23 105
Guille Suarez 3.19 3.01 11:34 100% 0:20 0:08 low 25:09 3.58 68 22:31 8
Amy Tuele 3.20 3.01 11:40 97% 0:20 0:10 low 30:41 3.72 44 14:40 5
Tyree Winters 1.24 1.06 28:45 33% 0:20 0:11 low 33:06 1.98 911 303:28 102
Isaac Yahya 3.20 3.03 11:37 100% 0:20 0:10 low 30:33 3.68 55 18:17 7
Mean - 37 Students 2.97 2.72 19:09 87.64% 0:20 0:10 NA 30:18 3.53 313.70 104:26 35.00
Standard Deviation: 0.85 0.78 7:44 17.86% 0:00 0:01 NA 3:01 1.00 330.55 110:08 37.00
Options: Grouped by Grade with page breaks onSort by Student NameDemographic filters not usedAll Teachers selectedAll Grades selectedAll Groups selected
Legend: In IP Student still in Initial PlacementTOP Student projected to top out of the course-- Data has not been reported• Target Level expected to be reached in the days remaining (at current rate)• • Target level already achieved

Prescriptive Scheduling
Copyright © 2007-2016 Pearson Education, Inc. or its affiliate(s). All rights reserved. Page: 1 of 3
Reading School: Independence Elementary School
Target Level: 3.90
Target Date: 03/30/18 School Days to Target: 179
Report Run: 07/24/17 - 01:43 PM
Teacher: All
Grade: 3
Group: All
Student
Performance Data Current Rate Current Forecast Prescription
CurrentCourseLevel
IPLevel
TimeSince IP
SkillsPercent
Mastered
SessionLengthSetting
AverageMin/Day
CurrentLearning
RateTime Level
Add'l Sessionsto Target
Add'l Timeto Target
Add'lMin/Day
toTarget
Carl Atkinson 0.36 0.00 18:32 20% 0:20 0:11 low 33:23 1.01 -- -- --
Marc Bauman 3.43 3.00 11:58 82% 0:20 0:11 low 33:23 4.61 • • •
Kelly Bentley 0.36 0.00 17:51 7% 0:20 0:11 low 33:15 1.10 -- -- --
Sue Carter 0.36 0.00 17:32 29% 0:20 0:11 low 33:40 1.11 -- -- --
Katie Colvin 3.38 2.75 20:36 58% 0:20 0:10 low 30:33 4.30 • • •
Emily Crabtree 3.38 2.75 20:40 62% 0:20 0:09 low 28:08 4.22 • • •
Hoa Dinh 3.38 2.75 20:25 69% 0:20 0:11 low 32:58 4.39 • • •
Jade Dreier 3.38 2.75 20:30 58% 0:20 0:11 low 32:32 4.38 • • •
Michael Farmer 3.38 2.75 20:32 62% 0:20 0:11 low 33:23 4.41 • • •
Rosa Fernandez-Rivera 4.49 4.00 11:42 100% 0:20 0:10 medium 30:33 5.75 • • • • • •
Megan Flagg 3.38 2.75 20:31 58% 0:20 0:11 low 33:32 4.41 • • •
Shaneequa Forsythe 4.49 4.00 11:38 100% 0:20 0:11 medium 32:40 5.84 • • • • • •
Laci Gill 4.49 4.00 11:39 100% 0:20 0:11 medium 32:58 5.86 • • • • • •
Jason Gobiera 3.10 2.75 12:18 94% 0:20 0:10 low 29:41 3.95 • • 0
Jorge Gomez 3.10 2.75 12:25 82% 0:20 0:10 low 30:33 3.95 • • 0
Juan Gudinas-Cortez 3.96 3.00 28:45 84% 0:20 0:10 low 30:33 4.97 • • • • • •
Maria Gutierrez 3.96 3.00 28:25 81% 0:20 0:11 low 33:06 5.06 • • • • • •
Derek Hill 0.36 0.00 17:21 33% 0:20 0:11 low 33:49 1.11 -- -- --
Lee Ho 0.40 0.00 17:40 31% 0:20 0:09 low 27:42 1.07 -- -- --
Malia Kimball 3.10 2.75 12:21 71% 0:20 0:11 low 33:23 4.06 • • •
Demarion Kirby In IP In IP In IP In IP 0:20 In IP In IP In IP In IP In IP In IP In IP
Anthony Koulouris In IP In IP In IP In IP 0:20 In IP In IP In IP In IP In IP In IP In IP
David Lam 0.55 0.00 25:43 38% 0:20 0:09 low 27:34 1.16 -- -- --
Connie Linek 3.96 3.00 28:43 84% 0:20 0:11 low 33:23 5.07 • • • • • •

Prescriptive Scheduling
Copyright © 2007-2016 Pearson Education, Inc. or its affiliate(s). All rights reserved. Page: 2 of 3
Reading School: Independence Elementary School
Target Level: 3.90
Target Date: 03/30/18 School Days to Target: 179
Report Run: 07/24/17 - 01:43 PM
Teacher: All
Grade: 3
Group: All
Student
Performance Data Current Rate Current Forecast Prescription
CurrentCourseLevel
IPLevel
TimeSince IP
SkillsPercent
Mastered
SessionLengthSetting
AverageMin/Day
CurrentLearning
RateTime Level
Add'l Sessionsto Target
Add'l Timeto Target
Add'lMin/Day
toTarget
Sherry Newton 0.55 0.00 25:40 50% 0:20 0:11 low 33:40 1.29 -- -- --
Lin Nguyen 0.43 0.00 17:27 35% 0:20 0:11 low 33:40 1.29 -- -- --
Jesus Ortiz In IP In IP In IP In IP 0:20 In IP In IP In IP In IP In IP In IP In IP
Manuel Reyes 3.61 2.75 28:39 81% 0:20 0:11 low 33:23 4.61 • • •
LeRoi Rice 3.61 2.75 28:17 75% 0:20 0:11 low 31:58 4.57 • • •
James Ryan 0.55 0.00 25:38 45% 0:20 0:10 low 29:50 1.21 -- -- --
Mateo Salazar 5.08 4.25 18:41 100% 0:20 0:08 medium 24:35 6.16 • • • • • •
Isabella Scott 3.61 2.75 28:42 78% 0:20 0:10 low 30:58 4.54 • • •
Destin Scroggins 5.08 4.25 18:50 100% 0:20 0:11 medium 32:58 6.51 • • • • • •
Guille Suarez 3.61 2.75 28:21 69% 0:20 0:09 low 27:42 4.43 • • •
Amy Tuele 3.61 2.75 28:49 67% 0:20 0:10 low 30:41 4.53 • • •
Tyree Winters 5.08 4.25 18:52 100% 0:20 0:10 medium 30:41 6.41 • • • • • •
Isaac Yahya 3.61 2.75 28:32 72% 0:20 0:11 low 33:15 4.61 • • •
Mean - 37 Students 2.92 2.29 20:43 66.88% 0:20 0:11 NA 31:35 3.88 NA NA NA
Standard Deviation: 1.60 1.48 6:06 25.52% 0:00 0:01 NA 2:19 1.79 NA NA NA
Options: Grouped by Grade with page breaks on
Sort by Student Name
Demographic filters not used
All Teachers selected
All Grades selected
All Groups selected
Legend: In IP Student still in Initial Placement
TOP Student projected to top out of the course
-- Data has not been reported
• Target Level expected to be reached in the days remaining (at current rate)
• • Target level already achieved

Prescriptive Scheduling
Copyright © 2007-2016 Pearson Education, Inc. or its affiliate(s). All rights reserved. Page: 3 of 3
Notes: Baseline, Low, Medium, High Learning Rate is an estimate of the amount of courseware a student has consumed (will display Baseline until the
student has completed 7 hours in the course)
Add'l Min/Day to Target shows the additional number of minutes the student needs to increase their current rate in order to reach the target level by the target date.

SuccessMaker Administrator Guide 59
Prescriptive Scheduling – Aggregate The Prescriptive Scheduling Aggregate Report is a forecasting tool that enables districts to monitor progress for an entire school and adjust schedules to reach performance goals. By specifying a time frame and a target level for each grade within a school, the report can provide projections of where the school will be at the targeted date and, based on the current rate, the additional amount of time in the course for the school to achieve the target level. District Administrators can generate the report for multiple schools.
Forecasting algorithms in the Prescriptive Scheduling reports require students to follow their regular, predictable schedule for the previous four weeks prior to the report being run for the most accurate interpretation of the reported data. This means the report should not be run immediately following a long break between student sessions such as winter break or spring break. For the most accurate data after a break, please wait 20 school days after returning to regular sessions before running the report.
Prescriptive Scheduling Report – Aggregate Options Table 3-6 Aggregate Options for the Prescriptive Scheduling Report
Options Selections
Student Selection Summary
View the number of groups, students, schools, teachers, and grades selected for the report.
Course Selection Select a course. The default math or reading courses are the only courses that can be used to run the Prescriptive Scheduling Report.
Set Target Date by Specify the amount of time the student has to reach the forecasted level either by selecting a number of weeks using Weeks from today or by choosing a Specific date using the calendar.
Set Target Level per Grade
Set the levels the students are to achieve for each available grade. Levels are calculated using the enrolled grade for each student.
Remove page breaks (per level)
Select the check box to remove page breaks from the report.
Sort Select how the information is sorted in the report.
Select School Select one or more schools
Filter by Demographics: To filter results by demographic options, click Yes and scroll to the end of the screen to view all choices. All is the default selection for all demographic fields. The Demographic filters are not used at this time.
Disability Status Filters: All, Yes, No, Not Specified

SuccessMaker Administrator Guide 60
Options Selections
English Language Proficiency
Filters: All, English, English Language Learner, Not Specified
Gender Filters: All, Female, Male, Not Specified
Migrant Status Filters: All, Migrant, Non-migrant, Not Specified
Race/ Ethnicity Filters: All, African American, Asian/Pacific Islander, Caucasian, Hispanic or Latino, Native American/Alaskan Native, Other, Not Specified
Socioeconomic Status
Filters: All, Economically disadvantaged, Not economically disadvantaged, Not Specified
Special Services Filters: 504 Plan, Gifted/Talented, IEP, No Special Services, Other
Prescriptive Scheduling – Aggregate Results The report output consists of five parts: header, body of report, summary data, options, and legend.
Header The information at the top of the report includes:
• Report Title
• Assigned Course Name
• Target Level
• Target Date
• School Days to Target
• Report Run: Date and Time
• District
• School
• Grade
Body of Report The body of the report includes the following information:
• School
• Population
• Students Included: Number of students included in the report
• Students Not Included: Students for which the report cannot generate projection data, including students in IP, students without gain, and students more than 3.0 levels below target.
• Performance Data

SuccessMaker Administrator Guide 61
• Current Course Level (Mean): Mean level at which the included students are presently working in the course.
• IP Level (Mean): Mean IP level for the included students.
• Start Level (Mean): If the IP setting is Off, this column displays the mean course level at which the included students started working. If the IP setting is On, this column does not display.
• Time Since IP (Mean): Mean time spent in the course since IP completion for the included students.
• Time (Mean): If the IP setting is Off, this column displays the mean time spent in the course by the included students. If the IP setting is On, this column does not display.
• Percent Students with AP: Number of students in the school with AP divided by the total number of included students in the school
• Percent Students at Target Level: Number of included students in the school who are at or above the Target Level divided by the total number of included students.
• Projections
• Projected End Level (Mean): Mean of the projected course levels for all included students at the end date.
• Percent Students to Achieve Target Level: Number of included students projected to reach target level divided by total number of included students.
• Prescription
• Average Add'l Min/Day to Target (Students Projected Below Target): Based on the most recent 20 school days of activity, the average number of additional minutes recommended for increasing the students' current rates in order to reach the school's Target Level by the Target Date.
Summary Data The Summary Data fields include the following information summarized by assignment:
• Mean: Average of all selected students for whom actual data is display in the report. Any column with (- -) is not included in this calculation.
• Standard Deviation: Standard deviation of all selected students in the report. Any column with (- -) is not included in this calculation.
Options and Legend The Options section provides a summary of the Report Options screen selections chosen for this report. The legend at the bottom of the report includes a brief description of the abbreviations and symbols that appear in the report data.

SuccessMaker Administrator Guide 62
School Days to Target: 141 Target Level: 3.90 Target Date: 03/13/18 Report Run: 08/10/17
School Days to Target: 141 Target Level: 4.90 Target Date: 03/13/18 Report Run: 08/10/17
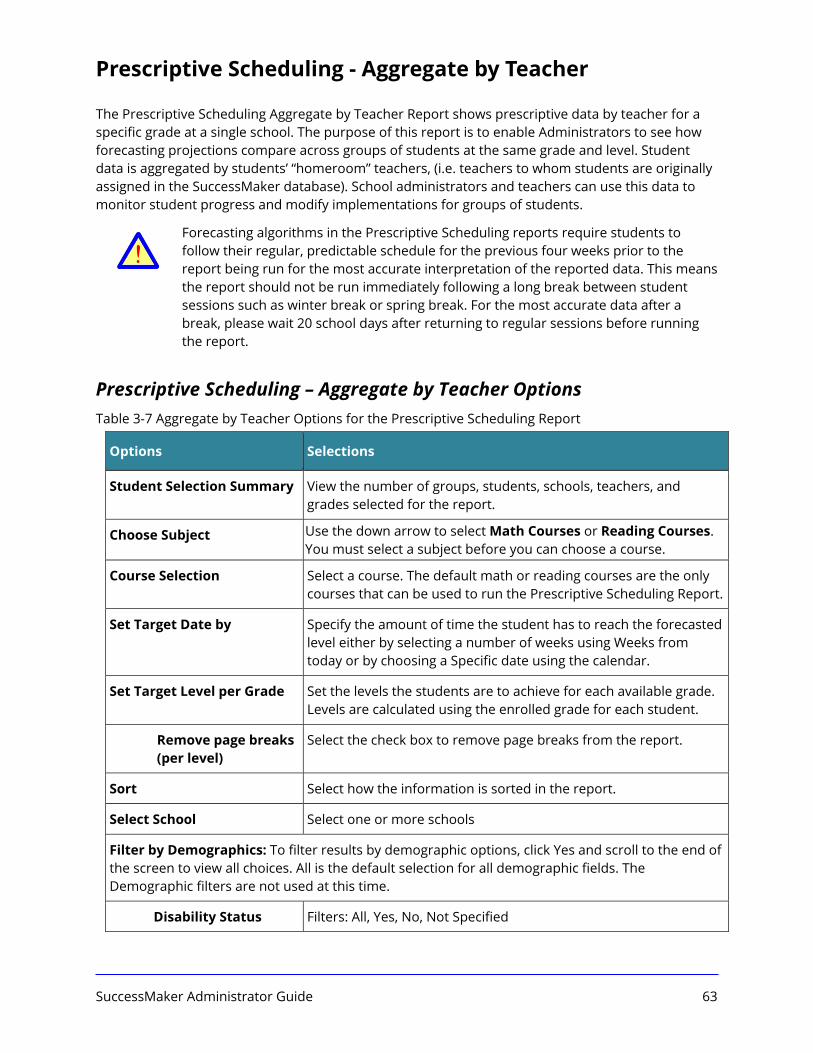
SuccessMaker Administrator Guide 63
Prescriptive Scheduling - Aggregate by Teacher
The Prescriptive Scheduling Aggregate by Teacher Report shows prescriptive data by teacher for a specific grade at a single school. The purpose of this report is to enable Administrators to see how forecasting projections compare across groups of students at the same grade and level. Student data is aggregated by students’ “homeroom” teachers, (i.e. teachers to whom students are originally assigned in the SuccessMaker database). School administrators and teachers can use this data to monitor student progress and modify implementations for groups of students.
Forecasting algorithms in the Prescriptive Scheduling reports require students to follow their regular, predictable schedule for the previous four weeks prior to the report being run for the most accurate interpretation of the reported data. This means the report should not be run immediately following a long break between student sessions such as winter break or spring break. For the most accurate data after a break, please wait 20 school days after returning to regular sessions before running the report.
Prescriptive Scheduling – Aggregate by Teacher Options Table 3-7 Aggregate by Teacher Options for the Prescriptive Scheduling Report
Options Selections
Student Selection Summary View the number of groups, students, schools, teachers, and grades selected for the report.
Choose Subject Use the down arrow to select Math Courses or Reading Courses. You must select a subject before you can choose a course.
Course Selection Select a course. The default math or reading courses are the only courses that can be used to run the Prescriptive Scheduling Report.
Set Target Date by Specify the amount of time the student has to reach the forecasted level either by selecting a number of weeks using Weeks from today or by choosing a Specific date using the calendar.
Set Target Level per Grade Set the levels the students are to achieve for each available grade. Levels are calculated using the enrolled grade for each student.
Remove page breaks (per level)
Select the check box to remove page breaks from the report.
Sort Select how the information is sorted in the report.
Select School Select one or more schools
Filter by Demographics: To filter results by demographic options, click Yes and scroll to the end of the screen to view all choices. All is the default selection for all demographic fields. The Demographic filters are not used at this time.
Disability Status Filters: All, Yes, No, Not Specified

SuccessMaker Administrator Guide 64
Options Selections
English Language Proficiency
Filters: All, English, English Language Learner, Not Specified
Gender Filters: All, Female, Male, Not Specified
Migrant Status Filters: All, Migrant, Non-migrant, Not Specified
Race/ Ethnicity Filters: All, African American, Asian/Pacific Islander, Caucasian, Hispanic or Latino, Native American/Alaskan Native, Other, Not Specified
Socioeconomic Status Filters: All, Economically disadvantaged, Not economically disadvantaged, Not Specified
Special Services Filters: 504 Plan, Gifted/Talented, IEP, No Special Services, Other
Prescriptive Scheduling – Aggregate by Teacher Results The report output consists of five parts: header, body of report, summary data, options, and legend.
Header The information at the top of the report includes:
• Report Title
• Assigned Course Name
• Target Level
• Target Date
• School Days to Target
• Report Run: Date and Time
• District
• School
• Grade
Body of Report The body of the report includes the following information:
• Teachers: First and last name of teacher (e.g., Jane Doe), sorted by last name.
• Population
• Students Included: Number of students for the teacher included in the report
• Students Not Included: The number of students for the teacher who are still in IP,have no gain (0.00) post IP, or who are three or more levels below target (such as afifth grade student with a Current Course Level of 2.95).
• Performance Data

SuccessMaker Administrator Guide 65
• Current Course Level (Mean): The average level at which the students in thathomeroom are presently working in the course.
• IP Level (Mean): The average IP level for that homeroom teacher.
• Start Level (Mean): If the IP setting is Off, this column displays the mean course levelat which the included students started working. If the IP setting is On, this columndoes not display.
• Time Since IP (Mean): The average time spent in the course since IP completion forthe included students for that homeroom teacher.
• Time (Mean): If the IP setting is Off, this column displays the mean time spent in thecourse by the included students. If the IP setting is On, this column does not display.
• Percent Students with AP: The percentage of students for that homeroom teacherwho have Acceptable Performance (AP) status.
• Percent Students at Target Level: The percentage of students for that homeroomteacher who are at the Target level.
• Projections
• Projected End Level (Mean): The average projected level the students will haveachieved at the Target Date.
• Percent Students to Achieve Target Level: The projected percentage of studentswho will have reached the target level at the target date.
• Prescription
• Average Add'l Min/Day to Target (Students Projected Below Target): Based on themost recent 20 school days of activity, the average number of additional minutesrecommended for increasing the students' current rates in order to reach the school'sTarget Level by the Target Date.
Summary Data The Summary Data fields include the following information summarized by assignment:
• Mean: Average of all selected students for whom actual data is display in the report. Any columnwith (- -) is not included in this calculation.
• Standard Deviation: Standard deviation of all selected students in the report. Any column with (--) is not included in this calculation.
Options and Legend The Options section provides a summary of the Report Options screen selections chosen for this report. The legend at the bottom of the report includes a brief description of the abbreviations and symbols that appear in the report data.

Prescriptive Scheduling Aggregate
Copyright © 2007-2016 Pearson Education, Inc. or its affiliate(s). All rights reserved. Page: 1 of 1
MathTarget Level: 3.90
Target Date: 03/30/18 School Days to Target: 175
Report Run: 07/28/17 - 08:14 AM
District: District
School: Independence Elementary School
Grade: 3
Teacher
Population Performance Data Current Forecast Prescription
StudentsIncluded
StudentsNot
Included
CurrentCourseLevel
(Mean)
IPLevel (Mean)
TimeSince IP (Mean)
PercentStudentsWith AP
PercentStudentsat Target
Level
ProjectedEnd Level
(Mean)
Percent Students to
AchieveTarget Level
Average Add'l Min/Day to Target
(Students Projected Below Target)
Mrs. Megan Cadina 11 1 3.01 2.75 19:23 64% 18% 3.56 18% 31
Mr. Philip McLain 11 1 3 2.76 19:25 73% 18% 3.51 18% 33
Ms. Audrey Stall 12 1 2.92 2.65 18:46 67% 25% 3.49 25% 44
Mean - 3 Teachers 11.33 1.00 2.98 2.72 19:11 68.00% 20.33% 3.52 20.33% 36.00
Standard Deviation 0.58 0.00 0.05 0.06 0:22 4.58% 4.04% 0.04 4.04% 7.00
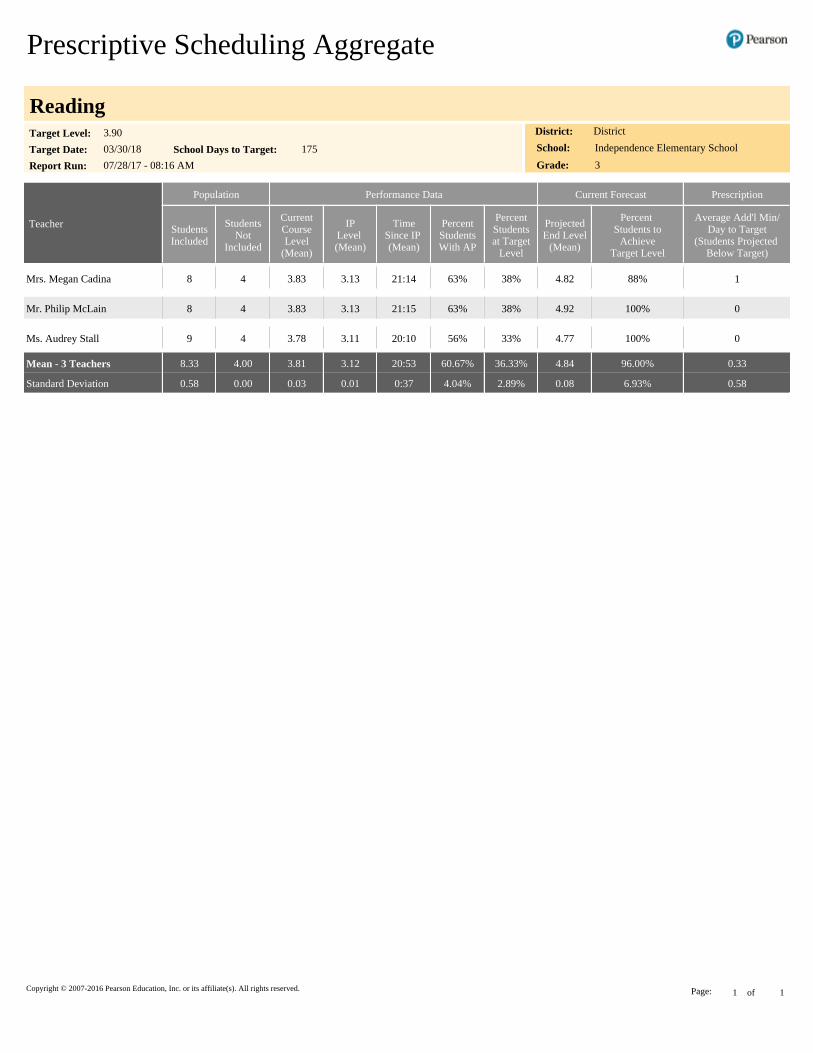
Prescriptive Scheduling Aggregate
Copyright © 2007-2016 Pearson Education, Inc. or its affiliate(s). All rights reserved. Page: 1 of 1
ReadingTarget Level: 3.90
Target Date: 03/30/18 School Days to Target: 175
Report Run: 07/28/17 - 08:16 AM
District: District
School: Independence Elementary School
Grade: 3
Teacher
Population Performance Data Current Forecast Prescription
StudentsIncluded
StudentsNot
Included
CurrentCourseLevel
(Mean)
IPLevel (Mean)
TimeSince IP (Mean)
PercentStudentsWith AP
PercentStudentsat Target
Level
ProjectedEnd Level
(Mean)
Percent Students to
AchieveTarget Level
Average Add'l Min/Day to Target
(Students Projected Below Target)
Mrs. Megan Cadina 8 4 3.83 3.13 21:14 63% 38% 4.82 88% 1
Mr. Philip McLain 8 4 3.83 3.13 21:15 63% 38% 4.92 100% 0
Ms. Audrey Stall 9 4 3.78 3.11 20:10 56% 33% 4.77 100% 0
Mean - 3 Teachers 8.33 4.00 3.81 3.12 20:53 60.67% 36.33% 4.84 96.00% 0.33
Standard Deviation 0.58 0.00 0.03 0.01 0:37 4.04% 2.89% 0.08 6.93% 0.58

SuccessMaker Administrator Guide 67
Student Performance Report The Student Performance Report provides detailed information about student performance and progress in a course. The report includes cumulative and recent performance information in both Math and Reading, and identifies specific areas of difficulty in a course. This report also provides information about the student’s use of the Help resource and the number of time-outs. Running the Student Performance Report weekly is recommended, but it can be run as often as necessary.
Student Performance Report – Administrator Options Table 3-8 Administrator Options for the Student Performance Report
Options Selections
Student Selection Summary
View the number of groups and students selected for the report
Student Selection Summary
View the number of groups and students selected for the report.
Choose Subject Select Math or Reading course assignments.
Course Selection Select one or more courses to include in the report. Course selection is limited to Default and Custom by Settings for Math and Reading. Course subject selection is required before running the report.
Display Select how the student name is displayed in the Student column of the report.
Mask student display Select the check box to disguise student names on the report. Clear the check box to display student names.
Student Data Options: Select the sections to include in the report. At least one Yes selection is required; otherwise, the Go button is disabled.
Include Performance Summary
Click Yes to display or No to hide the Performance Summary.
Include Performance by Strand
Click Yes to display or No to hide Performance by Strand.
Include Areas of Difficulty
Click Yes to display or No to hide Areas of Difficulty.
Recent History Data Select the number of weeks of student history data to display in the report.
Select Students by:
School Select one or more schools.

SuccessMaker Administrator Guide 68
Options Selections
Teacher Select one or more teachers assigned for the course.
Grade Select one or more grade levels.
Group Select one or more student groups.
Student Select one or more students.
Student Performance Report – Teacher and Administrator Results The Student Performance Report output is based on the report options selected.
Header The information at the top of the report includes:
• Report Title
• Student Name
• Course Name
• Report Run Date and Time
• School
• Teacher
• Grade
• Group
Body of Report The body of the report could include the following information:
Summary IP Performance Summary
• IP Level: Course level at the end of IP.
• IP Correct: Total number of exercises the student answered correctly for IP.
• IP Attempted: Total number of exercises student attempted for IP
• IP Percent Correct: Percentage of exercises the student answered correctly out of number of exercises attempted for IP
• IP Time Spent: Total time student spent in IP
• Placed: Date the student exited IP and was placed in the course
Performance Summary • Level Data

SuccessMaker Administrator Guide 69
• Assigned Course Level: Course level assigned to the student
• Current Course Level: Course level at which student is working in the course. If in IP, the field displays In IP.
• IP Level: Course level at the end of IP
• Gain: Measure of the student’s exposure to content that is indexed in terms of level. Gain is calculated as the difference between the student’s current course level and the student’s placement level. During the IP process, the Gain Since IP field displays In IP.
• Instructional Performance
• Exercises Correct: Total number of exercises the student answered correctly for the course since IP was completed.
• Exercises Attempted: Total number of exercises the student has attempted since IP was completed. In Reading, this includes all content except Independent Practice and Pre-Requisites.
• Exercises Percent Correct: Percentage of exercises the student answered correctly since IP was completed.
• Mastery
• Computation Retention Index (CRI) (Math): Percentage of computation skills answered correctly when presented in review
• Retention Index (RI) (Reading): Percentage of retention exercises answered correctly when presented in review
• Skills Mastered: Number of skill objectives achieving a Mastery Status of ”Mastered” within the assigned course
• Skills Assessed: Total number of skills since IP was completed with a status other than In Progress, as determined by Motion for Math and Reading
• Skills Percent Mastered: Percentage of skills the student mastered against the number of skills assessed in the assigned course. If a date range is specified, the value is NA.
• Support
• Tutorial Used (Math): Total number of times Math tutorials were used across all sessions, including IP
• Help Used, Audio Repeats Used, Report Card Views, Glossary Used: Total number of times these support features were used across all sessions, including IP
• Usage
• Time Spent: Total time student spent in the course since the completion of IP across all sessions. During IP process, field displays In IP.
• Total Sessions: Total number of sessions the student has taken, including IP.
• Average Session Time: Average amount of time student spent in each session,

SuccessMaker Administrator Guide 70
including IP.
Performance by Strand - Cumulative (Reading) • Strand: Name of the strand.
• Strand Level: Student's current level in the strand.
• Exercises Correct: Total number of exercises answered correctly in each strand.
• Exercises Attempted: Total number of reading exercises student attempted.
• Exercises Percent Correct: Percentage of exercises answered correctly in each strand.
Performance by Strand - Cumulative (Math) • Strand: Name of the strand.
• Strand Level: Student's current level in the strand.
• Skills Mastered: Number of skill objectives achieving a Mastery Status of ”Mastered” within the strand.
• Skills Assessed: Number of skill objectives attempted with the strand.
• Percent Skills Mastered: Percentage of skills the student mastered against the number of skills completed in the strand.
Areas of Difficulty (Math) • Skills in Delayed Presentation: If the student is struggling with the content of a lesson,
SuccessMaker’s adaptive agent makes a decision to place an activity in delayed presentation. This means that motion withholds the presentation of content that is too challenging. The content is presented again later after the student has had the opportunity to receive instruction elsewhere or acquire the skill through maturation while the delayed activity is on hold.
For skills in Computation strands, the skill is immediately presented the next time the strand is chosen. If not mastered in Delayed Presentation, the status of the Computational strand skill is set to Not Mastered.
• Skills in Delayed Presentation 2: Skills from the Application strands that were not mastered during Delayed Presentation. If not mastered in Delayed Presentation 2, the status of the Application strand skill is set to Not Mastered.
• Skills Not Mastered: Lists the most recent skills that have not been mastered and the dates they were last attempted. The range is defined by the Recent History Data setting on the Report Options screen.
• Strand: Name of the Math strand with the specific skill objective at risk.
• Level: Course level of the skill.
• Skill Description: Learning objective identifications (LO IDs) and description of the skills that the student has not mastered.
• Date at Risk: Date the skill status was set.
Areas of Difficulty (Reading) This section provides details based on the date range selected on the Report Options screen.

SuccessMaker Administrator Guide 71
• Skills At Risk: If the student is struggling with the content of a lesson, SuccessMaker’s adaptiveagent makes a decision to place an activity in delayed presentation. This means that motionwithholds the presentation of content that is too challenging. The content is presented againlater after the student has had the opportunity to receive instruction elsewhere or acquire theskill through maturation while the delayed activity is on hold.
• Skills Not Mastered: Information about the skills that have not been mastered.
• Strand: Name of the strand for the Reading skill at risk.
• Level: Course level at which the skill was set to At Risk status.
• Skill Description: Description of the skill at risk.
• Date at Risk: Date the skill status was determined to be not mastered.
Other Performance (Independent Practice and Remediation) • Exercises Correct: Total number of exercises answered correctly in each phase.
• Exercises Attempts: Total number of reading exercises the student attempted in each phase.
• Exercises Percent Correct: Percentage of exercises answered correctly in each phase.
Legend The legend at the bottom of the report includes a brief description of the abbreviations and symbols that appear in the report data.

Student Performance
Copyright © 2007-2016 Pearson Education, Inc. or its affiliate(s). All rights reserved.Page: 1 of 2
Lin NguyenMath School: Independence Elementary School
Teacher: Ms. Audrey Stall
Grade: 3
Group: AllReport Run: 07/28/17 08:21 AM
IP Level: 3.02 IP Correct: 42 IP Attempted: 60 IP Percent Correct: 70% IP Time Spent: 1:16 Placed: 12/30/16
Performance Summary
Level Data Instructional Performance Mastery
AssignedCourseLevel
CurrentCourseLevel
IPLevel Gain
ExercisesCorrect
ExercisesAttempted
ExercisesPercentCorrect
ComputationRetention
Index(CRI)
SkillsMastered
SkillsAssessed
SkillsPercent
Mastered
Cumulative - Since IP 3.00 3.36 3.02 0.34 759 1174 65% 60% 61 65 94%
Support Usage
Help Used Audio RepeatsUsed
Report CardViews
Glossary Used Time Spent Total Sessions(mimimum of 1 assessment)
AverageSession Time
Cumulative - Including IP 25 69 42 29 29:38 91 0:20
Performance by Strand - Cumulative
Computation Strands
Strand StrandLevel
SkillsMastered
SkillsAssessed
PercentSkills
Mastered
Addition 3.30 7 7 100%
Decimal 3.25 0 1 0%
Division 3.75 3 3 100%
Equation 3.25 3 3 100%
Fraction 3.25 5 6 83%
Multiplication 3.30 5 5 100%
Speed Games 3.60 4 4 100%
Subtraction 3.30 5 6 83%
Totals 32 35 91%
Application Strands
Strand StrandLevel
SkillsMastered
SkillsAssessed
PercentSkills
Mastered
Applications 3.30 7 7 100%
Geometry 3.25 -- -- --
Measurement 3.35 9 9 100%
Number Concepts 3.12 2 3 67%
Performance Tasks -- -- -- --
Probability & Statistics 3.75 3 3 100%
Problem Solving 3.30 3 3 100%
Word Problems 3.30 5 5 100%
Totals 29 30 97%

Student Performance
Copyright © 2007-2016 Pearson Education, Inc. or its affiliate(s). All rights reserved.Page: 2 of 2
Areas of Difficulty - Since IP
Skills in delayed presentation
Strand Level Skill Description Date at Risk
Geometry 3.00 SMMA_LO_00606 - Identify congruent figures on a geoboard. 03/08/17
Number Concepts 3.20SMMA_LO_01027 - Identify a number that is between two numbers, or before, after, or closer to a number (101 to 999). 05/23/17
Problem Solving 3.25 SMMA_LO_01246 - Identify a picture that represents a multiplication problem (basic facts). 06/09/17
Word Problems 3.25SMMA_LO_01547 - Solve a problem by identifying the time 1 to 2 hours after a given time (not crossing 12 o'clock). 01/31/17
Skills in delayed presentation 2
Strand Level Skill Description Date at Risk
Number Concepts 3.15 SMMA_LO_02037 - Apply the Associative Property of Multiplication as a strategy to multiply whole numbers. 04/14/17
Number Concepts 3.12 SMMA_LO_02036 - Apply the Commutative Property of Multiplication as a strategy to multiply and divide whole numbers.
06/28/17
Skills not mastered
Strand Level Skill Description Date at Risk
Decimal 3.00 SMMA_LO_00180 - Identify the number of dollars and dimes that represent a given amount ($1.10 to $3.50). 05/03/17
Fraction 3.10 SMMA_LO_00406 - Identify the set of shapes that represents a fraction (halves, thirds, fourths). 03/28/17
Number Concepts 3.10 SMMA_LO_01026 - Identify the greatest or least number (three-digit). 07/18/17
Subtraction 3.05 SMMA_LO_01456 - Subtract (student choice, minuends 110 to 199, two-digit subtrahends, no regrouping). 02/17/17
Legend: IP Initial PlacementNA Not ApplicableTOP Topped outCRI Computation Retention Index-- Data not available‡ Strand is on but level not yet reached
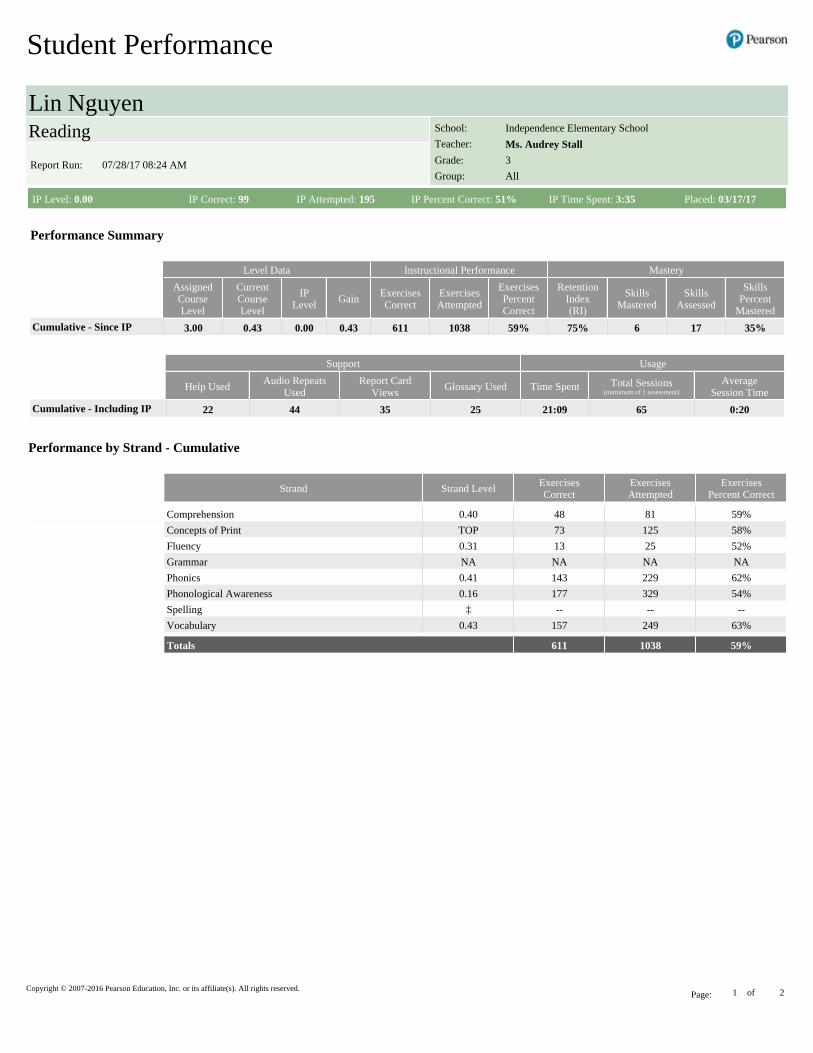
Student Performance
Copyright © 2007-2016 Pearson Education, Inc. or its affiliate(s). All rights reserved.Page: 1 of 2
Lin NguyenReading School: Independence Elementary School
Teacher: Ms. Audrey Stall
Grade: 3
Group: AllReport Run: 07/28/17 08:24 AM
IP Level: 0.00 IP Correct: 99 IP Attempted: 195 IP Percent Correct: 51% IP Time Spent: 3:35 Placed: 03/17/17
Performance Summary
Level Data Instructional Performance Mastery
AssignedCourseLevel
CurrentCourseLevel
IPLevel Gain
ExercisesCorrect
ExercisesAttempted
ExercisesPercentCorrect
RetentionIndex(RI)
SkillsMastered
SkillsAssessed
SkillsPercent
Mastered
Cumulative - Since IP 3.00 0.43 0.00 0.43 611 1038 59% 75% 6 17 35%
Support Usage
Help Used Audio RepeatsUsed
Report CardViews
Glossary Used Time Spent Total Sessions(mimimum of 1 assessment)
AverageSession Time
Cumulative - Including IP 22 44 35 25 21:09 65 0:20
Performance by Strand - Cumulative
Strand Strand LevelExercisesCorrect
ExercisesAttempted
ExercisesPercent Correct
Comprehension 0.40 48 81 59%
Concepts of Print TOP 73 125 58%
Fluency 0.31 13 25 52%
Grammar NA NA NA NA
Phonics 0.41 143 229 62%
Phonological Awareness 0.16 177 329 54%
Spelling ‡ -- -- --
Vocabulary 0.43 157 249 63%
Totals 611 1038 59%

Student Performance
Copyright © 2007-2016 Pearson Education, Inc. or its affiliate(s). All rights reserved.Page: 2 of 2
Areas of Difficulty - Since IP
Skills at risk
Strand Level Skill Description Date at Risk
Comprehension 0.35 Retell a story to include characters 05/24/17
Comprehension 0.40 Answer questions about characters 04/12/17
Skills not mastered
Strand Level Skill Description Date at Risk
Comprehension 0.35 Retell a story to include important events 06/07/17
Concepts of Print 0.08 Identify uppercase and lowercase letters 03/10/17
Fluency 0.31 Read grade-level text (one error in 20 words) with 95-100% accuracy 04/07/17
Phonics 0.41 Identify sound-letter associations for alphabet (26 letters, 44 sounds) 05/19/17
Phonological Awareness 0.16 Count the number of syllables in a word given orally; divide syllable into sounds 05/30/17
Phonological Awareness 0.16 Identify pictures with same initial sound 03/07/17
Phonological Awareness 0.01 Blend syllables to create a two-syllable word 03/15/17
Vocabulary 0.04 Sort pictures into categories 03/21/17
Vocabulary 0.36 Know the meaning of grade-level content words 04/18/17
Other Performance (scores do not affect mastery status)
Independent Practice Remediation
Exercises Correct Exercises attempted Exercises PercentCorrect
Exercises Correct Exercises Attempted Exercises PercentCorrect
Cumulative 396 564 70% 400 613 65%
Legend: IP Initial PlacementNA Not ApplicableTOP Topped outRI Retention Index-- Data not available‡ Strand is on but level not yet reachedReading Comprehension Level Based on National Assessment of Educational Progress (NAEP) descriptions, RCL defines the Initial Placement level for each student. The levels are: Advanced, Proficient, Basic and Below Basic

SuccessMaker Administrator Guide 76
System Enrollment and Usage Report The System Enrollment and Usage Report provides student enrollment information and high-level usage statistics for Math, Reading, and custom courses. The information includes the total amount of time spent for all Math, Reading, and custom courses, total number of sessions, average session time, and the date of the last session.
Before teachers are provided with an orientation to SuccessMaker, the System Administrator must have completed the teacher and student imports.
The System Administrator must have the System Enrollment and Usage report available during the teachers’ initial training so that they can identify their user names, groups, and students.
System Enrollment and Usage Report - Administrator Options Table 3-9 Administrator Options for the System Enrollment and Usage Report
Options Selections
Student Selection Summary View the number of schools, teachers, grades, groups and students selected for the report.
Course Selection Select one or more courses to include in the report. Course subject selection is required before running the report.
Additional Grouping Select how the student information is grouped in the report.
Remove Page Breaks Select the check box to remove page breaks from report.
Sort Select how the information is sorted in the report.
Mask student display Select the check box to disguise student names on the report. Clear the check box to display student names.
Select Students by
School Select a school.
Teacher Select one or more teachers assigned for the course.
Grade Select one or more grade levels.
Group Select one or more student groups.
Student Select one or more students.
Filter by Demographics: To filter results by demographic options, click Yes and scroll to the end of the screen to view all choices. All is the default selection for all demographic fields.
Disability Status Filters: All, Yes, No, Not Specified
English Lang. Proficiency Filters: All, English, English Lang. Learner, Not Specified
Gender Filters: All, Female, Male, Not Specified

SuccessMaker Administrator Guide 77
Options Selections
Migrant Status Filters: All, Migrant, Non-migrant, Not Specified
Race/ Ethnicity Filters: All, African American, Asian/Pacific Islander, Caucasian, Hispanic/Latino, Native American/Alaskan, Other, Not Specified
Socioeconomic Status Filters: All, Economically disadvantaged, Not economically disadvantaged, Not Specified
Special Services Filters: 504 Plan, Gifted/Talented, IEP, No Special Services, Other
System Enrollment and Usage Report - Administrator Results
Header The information at the top of the report includes:
• Report Title
• Assigned Course Name
• Report Run Date and Time
• School
• Teacher
• Grade
• Group
Body of Report The body of the report includes the following information:
• Student: First name and last name of student.
• Student Information
• Username (login): Unique name used by the student to log on to the courseware.
• Student ID: Unique identifier assigned to each student.
• Enrollment & Time Spent
• SM Math: Total amount of time student spent in Math assignments.
• SM Reading: Total amount of time student spent on Reading assignments.
• Custom Courses: Total amount of time student spent on custom courses.
• Usage
• Total Time Spent: Total amount of time the student has spent in selected courses, including IP.
• Total Sessions (minimum of 1 assignment): Total number of sessions the student has

SuccessMaker Administrator Guide 78
taken.
• Average Session Time: Average amount of time student spent in all selected courses.
• Last Session Date: Date of the student's last session.
Summary Data The Summary Data fields include the following information summarized by assignment:
• Mean: Average of all selected students for whom actual data is displayed in the report
• Standard Deviation: Standard deviation of all selected students in the report
Options The Options section provides a summary of the Report Options screen selections chosen for the report.
Legend The legend at the bottom of the report includes the brief description of the abbreviations and symbols that appear in the report data.

System Enrollment and Usage
Copyright © 2007-2016 Pearson Education, Inc. or its affiliate(s). All rights reserved.Page: 1 of 5
All Courses School: Independence Elementary School
Teacher: All
Grade: All
Group: AllReport Run: 07/24/17 - 02:06 PM
Student Information Enrollment & Time Spent Usage
Student Username(login)
Student ID SM Math
SMReading
CustomCourses
TotalTimeSpent
Total Sessions
(minimum of 1
assignment)
AverageSessionTime
LastSession
Date
Courtney Acker stucatg stucatg 23:22 21:01 44:23 136 0:20 7/21/17Shelly Adamas stuas stuas 30:19 21:29 51:48 159 0:20 7/21/17Karina Arnold stuka stuka 23:02 21:28 44:30 137 0:19 7/21/17Carl Atkinson stucamc stucamc 14:22 21:45 4:33 40:40 125 0:20 7/21/17Neha Balan stunbsw stunbsw 8:39 21:26 30:05 93 0:19 7/19/17Wendy Bales stuwb stuwb 29:24 13:03 42:27 131 0:19 7/21/17Aubriella Barrymore stuab stuab 22:59 21:05 44:04 136 0:19 7/19/17Marc Bauman stumb stumb 13:32 12:58 26:30 82 0:19 7/21/17Kelly Bentley stukb stukb 14:23 21:46 3:51 40:00 123 0:20 7/21/17Caroline Blake stucbem stucbem 30:07 21:09 51:16 159 0:19 7/21/17Denny Blaum studbnv studbnv 0:40 0:40 1:20 4 0:20 7/21/17Tyson Bridges stutbtg stutbtg 22:07 13:30 35:37 109 0:20 7/21/17Sonya Broderick stusbed stusbed 30:12 29:20 59:32 183 0:20 7/21/17Janet Broome stujbsb stujbsb 0:39 0:40 1:19 4 0:20 7/21/17Isabel Burnett stuibec stuibec 30:10 21:30 51:40 159 0:19 7/21/17Jason Byler stujbem stujbem 14:04 21:00 4:09 39:13 122 0:19 7/21/17Mercedes Carley stumcrs stumcrs 0:37 0:40 1:17 4 0:19 7/21/17Xavier Carruthers stuxced stuxced 29:37 12:09 41:46 129 0:19 7/21/17Sue Carter stuscpm stuscpm 14:09 21:46 4:11 40:06 124 0:19 7/21/17Renita Castro sturcsb sturcsb 29:30 21:38 8:46 59:54 185 0:19 7/21/17Amare Cavalli stuacsb stuacsb 29:36 21:59 51:35 158 0:20 7/21/17Christina Clark stuccec stuccec 14:12 21:09 4:30 39:51 123 0:19 7/21/17Benjamin Coleman stubcdh stubcdh 14:53 29:14 44:07 136 0:19 7/21/17Hunter Collins stuhcem stuhcem 29:28 21:04 50:32 156 0:19 7/19/17Katie Colvin stukcmc stukcmc 21:32 21:16 42:48 131 0:20 7/19/17Emily Crabtree stuecpm stuecpm 21:28 21:20 42:48 131 0:20 7/21/17Brian Croft stubcec stubcec 29:40 21:04 50:44 156 0:20 7/21/17Eva Crossman stuecsw stuecsw 23:31 21:47 45:18 140 0:19 7/21/17Jorge Cruz stujcdh stujcdh 23:26 21:02 4:35 49:03 151 0:19 7/21/17Camilla Cummings stucctg stucctg 23:37 29:54 53:31 165 0:19 7/21/17Grace D'Souza stugded stugded 21:10 21:00 42:10 131 0:19 7/21/17Amelia Dantini stuadtg stuadtg 23:39 20:48 44:27 136 0:20 7/21/17Travis Dantini stutded stutded 23:07 20:46 43:53 135 0:20 7/21/17Tony DeMartino stutd stutd 29:11 12:48 41:59 131 0:19 7/21/17Selena Degracia stusdmr stusdmr 29:39 12:51 4:33 47:03 145 0:19 7/19/17Vanna Degracia stuvded stuvded 0:40 0:40 1:20 4 0:20 7/21/17James DelSanto stujdem stujdem 23:05 20:55 4:35 48:35 150 0:19 7/21/17Jayden Denney stujdsb stujdsb 23:25 21:00 8:22 52:47 163 0:19 7/21/17Hoa Dinh stuhdpm stuhdpm 29:34 21:05 50:39 156 0:19 7/21/17Max Downey stumdsw stumdsw 0:38 0:39 1:17 4 0:19 7/21/17Jade Dreier stujdas stujdas 21:25 21:10 42:35 131 0:20 7/21/17Michael Elam stumeec stumeec 22:57 21:05 3:53 47:55 148 0:19 7/21/17Jared Fagan stujfsw stujfsw 31:39 13:01 4:29 49:09 151 0:20 7/21/17Michael Farmer stumf stumf 32:04 21:12 53:16 163 0:20 7/21/17Tayshaun Faulkner stutfem stutfem 31:48 13:01 44:49 138 0:19 7/21/17Carmen Felicitas stucfdh stucfdh 0:40 0:40 1:20 4 0:20 7/19/17Brandy Ferguson stubfec stubfec 29:18 12:56 42:14 131 0:19 7/21/17Juanita Fernandez stujf stujf 15:21 29:04 44:25 137 0:19 7/21/17Rosa Fernandez-Rivera sturfpm sturfpm 31:44 12:59 44:43 137 0:20 7/19/17Megan Flagg stumfmc stumfmc 29:24 21:11 50:35 156 0:19 7/21/17Lana Fornace stulfrs stulfrs 21:28 29:50 51:18 158 0:19 7/19/17Shaneequa Forsythe stusf stusf 31:32 12:56 44:28 137 0:19 7/21/17

System Enrollment and Usage
Copyright © 2007-2016 Pearson Education, Inc. or its affiliate(s). All rights reserved.Page: 2 of 5
All Courses School: Independence Elementary School
Teacher: All
Grade: All
Group: AllReport Run: 07/24/17 - 02:06 PM
Student Information Enrollment & Time Spent Usage
Student Username(login)
Student ID SM Math
SMReading
CustomCourses
TotalTimeSpent
Total Sessions
(minimum of 1
assignment)
AverageSessionTime
LastSession
Date
Abraham Freeman stuarmr stuarmr 0:37 0:40 1:17 4 0:19 7/19/17Mason Fulton stumfnv stumfnv 23:29 21:08 44:37 137 0:20 7/19/17Jason Gadotti stujg stujg 14:10 21:25 3:57 39:32 122 0:19 7/21/17Angel Gaines stuagnv stuagnv 14:24 21:35 35:59 110 0:20 7/19/17Laci Gill stulgmc stulgmc 31:34 12:58 44:32 137 0:20 7/21/17Marcos Gillespy stumgtg stumgtg 29:27 29:07 58:34 181 0:19 7/19/17Jason Gobiera stujgpm stujgpm 13:28 12:58 26:26 82 0:19 7/19/17Elijah Goldsmith stuegsb stuegsb 12:56 21:08 34:04 105 0:19 7/21/17Jorge Gomez stujgmc stujgmc 13:46 13:05 26:51 82 0:20 7/21/17Caleb Grullon stucgrs stucgrs 21:27 21:11 42:38 131 0:20 7/21/17Juan Gudinas-Cortez stujgcpm stujgcpm 13:07 29:38 42:45 131 0:20 7/19/17Hans Gupta stuhgrs stuhgrs 13:44 12:40 4:10 30:34 94 0:20 7/21/17Maria Gutierrez stumgmc stumgmc 12:58 29:22 3:57 46:17 143 0:19 7/21/17Jonelle Harrison stujhem stujhem 30:07 13:02 43:09 133 0:19 7/21/17Felecia Hartwell stufhec stufhec 30:05 13:03 43:08 133 0:19 7/21/17Lulu Hatten stulhnv stulhnv 30:19 22:08 52:27 161 0:20 7/21/17Ava Hawthorne stuahtg stuahtg 0:37 0:40 1:17 4 0:19 7/21/17Liza Hecht stulhrs stulhrs 31:48 21:39 53:27 164 0:20 7/21/17Brock Henderson stubhsb stubhsb 29:43 12:58 8:45 51:26 158 0:20 7/21/17Thomas Higgins stuthec stuthec 13:07 29:36 42:43 131 0:20 7/21/17Lamar Higgs stulhsw stulhsw 31:58 13:05 45:03 138 0:20 7/21/17Derek Hill studhmc studhmc 29:39 21:11 50:50 156 0:20 7/21/17Lee Ho stulhpm stulhpm 29:46 21:16 4:17 55:19 169 0:20 7/19/17Tran Ho stuth stuth 14:54 29:38 44:32 137 0:20 7/21/17Jacob Hopper stujh stujh 13:07 29:07 42:14 130 0:19 7/21/17Boris Iksander stubied stubied 22:06 12:56 35:02 108 0:19 7/21/17Quincy Jackson stuqjdh stuqjdh 30:09 21:35 51:44 159 0:20 7/19/17Javier Jiminez stujjsb stujjsb 12:55 29:37 8:26 50:58 157 0:19 7/21/17Cassaundra Johnson stucj stucj 14:21 21:28 4:15 40:04 123 0:20 7/18/17Kassandra Johnson stukjsb stukjsb 29:33 29:30 59:03 181 0:20 7/18/17Linh Jun stuljec stuljec 21:16 29:56 4:15 55:27 171 0:19 7/21/17Badri Kapoor stubkem stubkem 12:53 29:39 3:54 46:26 143 0:19 7/21/17Ladonna Kawliche stulked stulked 29:27 29:35 59:02 182 0:19 7/21/17Carla Kennedy stucknv stucknv 29:21 20:41 50:02 155 0:19 7/21/17Abhishek Khan stuaksw stuaksw 23:20 21:04 44:24 137 0:19 7/18/17Malia Kimball stumk stumk 13:31 13:00 26:31 82 0:19 7/21/17Demarion Kirby studkpm studkpm 0:39 0:40 1:19 4 0:20 7/19/17Todd Klancke stutkrs stutkrs 21:51 29:13 51:04 158 0:19 7/21/17Audrey Koblick stuaktg stuaktg 22:03 12:15 34:18 106 0:19 7/21/17Nadia Koliopulos stunk stunk 13:39 12:39 26:18 81 0:19 7/19/17Anthony Koulouris stuakmc stuakmc 0:38 0:40 1:18 4 0:20 7/21/17Leah Kushner stulknv stulknv 22:08 13:18 35:26 109 0:20 7/21/17David Lam studlmc studlmc 21:36 29:36 51:12 157 0:20 7/21/17Cameron Larrabee stuclsb stuclsb 30:16 12:34 8:32 51:22 158 0:20 7/21/17Jason Lazard stujlsb stujlsb 21:21 21:05 4:13 46:39 144 0:19 7/21/17Ioki Lee stuilsw stuilsw 12:52 29:43 42:35 131 0:20 7/21/17Isabel Lentz stuiled stuiled 12:56 13:05 26:01 80 0:20 7/21/17Connie Linek stuclas stuclas 13:04 29:40 42:44 131 0:20 7/21/17Maka Lo stumlsb stumlsb 22:08 29:11 4:32 55:51 172 0:19 7/21/17Armando Lopez stualsw stualsw 22:51 29:49 4:16 56:56 176 0:19 7/19/17Susan Marshall stusm stusm 31:36 21:28 53:04 163 0:20 7/21/17Jet Martell stujmem stujmem 0:40 0:40 1:20 4 0:20 7/21/17

System Enrollment and Usage
Copyright © 2007-2016 Pearson Education, Inc. or its affiliate(s). All rights reserved.Page: 3 of 5
All Courses School: Independence Elementary School
Teacher: All
Grade: All
Group: AllReport Run: 07/24/17 - 02:06 PM
Student Information Enrollment & Time Spent Usage
Student Username(login)
Student ID SM Math
SMReading
CustomCourses
TotalTimeSpent
Total Sessions
(minimum of 1
assignment)
AverageSessionTime
LastSession
Date
Eduardo Martinez stuemdh stuemdh 13:00 29:42 3:55 46:37 143 0:20 7/19/17Kin Masashiro stukmsb stukmsb 21:25 29:51 8:07 59:23 183 0:19 7/21/17Roberto Mastroantonio sturmrs sturmrs 13:07 29:18 4:30 46:55 144 0:20 7/21/17Gregg Maxey stugmem stugmem 29:25 21:21 50:46 157 0:19 7/21/17Heather McCann stuhmsw stuhmsw 8:46 29:24 38:10 117 0:20 7/21/17Desiree McCombs studmtg studmtg 31:33 29:40 61:13 188 0:20 7/21/17Luke McDermott stulm stulm 31:38 29:40 61:18 189 0:19 7/21/17Melissa Meyers stummrs stummrs 31:40 12:53 44:33 137 0:20 7/21/17Hayden Moody stuhmsb stuhmsb 31:39 21:19 8:53 61:51 190 0:20 7/21/17Nina Morales stunmem stunmem 23:30 29:53 53:23 165 0:19 7/19/17Mia Morgenstein stumm stumm 21:33 29:17 50:50 156 0:20 7/21/17Blake Murray stubmrs stubmrs 31:33 21:21 52:54 163 0:19 7/21/17Cody Newton stucn stucn 13:45 13:10 26:55 83 0:19 7/21/17Sherry Newton stusnpm stusnpm 21:37 29:35 51:12 157 0:20 7/21/17Lin Nguyen stuln stuln 29:30 21:03 4:33 55:06 170 0:19 7/21/17Jon Nicholson stujn stujn 30:19 21:21 51:40 159 0:19 7/21/17Caleb Nixon stucnsb stucnsb 14:54 29:11 8:09 52:14 161 0:19 7/21/17Erin O'Brian stueosb stueosb 14:07 21:22 8:33 44:02 136 0:19 7/21/17Jonathan O'Neal stujosb stujosb 21:27 21:08 8:45 51:20 158 0:19 7/21/17Abigail Odom stuaosb stuaosb 22:52 13:02 8:07 44:01 136 0:19 7/21/17Kimora Oh stukosb stukosb 0:40 0:38 1:18 4 0:20 7/21/17Jesus Ortiz stujo stujo 0:38 0:38 1:16 4 0:19 7/19/17Dionna Parker studpsw2 studpsw2 23:06 21:19 44:25 136 0:20 7/21/17Demetrius Paspalakis studpsw studpsw 8:48 21:24 3:53 34:05 105 0:19 7/19/17Anand Patel stuapdh stuapdh 31:35 21:28 53:03 163 0:20 7/21/17Preema Patel stupp stupp 31:21 12:58 4:31 48:50 151 0:19 7/21/17Saanjh Patel stuspec stuspec 29:34 21:21 4:33 55:28 171 0:19 7/21/17Juanita Pena stujpsb stujpsb 14:09 21:35 8:41 44:25 137 0:19 7/21/17Tuyen Phan stutpem stutpem 22:08 29:06 51:14 158 0:19 7/21/17Maxim Praskova stump stump 15:26 29:23 3:57 48:46 149 0:20 7/21/17Shari Raimondo stusred stusred 31:29 29:08 60:37 187 0:19 7/21/17Kane Rasmussen stukrmr stukrmr 30:25 21:29 51:54 159 0:20 7/21/17Nara Ravi stunrsw stunrsw 14:25 21:04 4:18 39:47 122 0:20 7/21/17Nathan Reed stunrrs stunrrs 23:03 21:06 44:09 136 0:19 7/21/17Manuel Reyes stumrmc stumrmc 13:45 29:14 42:59 132 0:20 7/21/17LeRoi Rice stulrpm stulrpm 13:39 28:57 42:36 132 0:19 7/21/17Nigel Rich stunred stunred 14:18 21:30 35:48 110 0:20 7/21/17Ana Rivera stuardh stuardh 14:26 21:11 3:55 39:32 121 0:20 7/21/17Carlos Rivera stucrsb stucrsb 21:25 12:45 4:00 38:10 117 0:20 7/21/17Bonnie Roberts stubrtg stubrtg 15:14 12:30 27:44 85 0:20 7/18/17Russell Roberts sturr sturr 21:33 30:03 51:36 158 0:20 7/21/17Diondre Robinson studrsb studrsb 31:43 29:17 8:12 69:12 213 0:19 7/21/17Marisol Rubin stumrtg stumrtg 13:43 28:57 42:40 131 0:20 7/19/17Kevin Russo stukrdh stukrdh 21:24 30:06 51:30 158 0:20 7/21/17Amy Rutherford stuartg stuartg 23:03 21:25 44:28 137 0:19 7/21/17James Ryan stujr stujr 21:19 29:38 50:57 157 0:19 7/21/17Koa Saenz stuksdh stuksdh 29:36 12:59 42:35 131 0:20 7/19/17Dimitri Sakaleros studsem studsem 31:37 21:26 4:11 57:14 176 0:20 7/21/17Mateo Salazar stumspm stumspm 31:32 21:16 4:32 57:20 177 0:19 7/21/17Robin Sastry stursdh stursdh 22:00 29:05 51:05 158 0:19 7/21/17Isabella Scott stuis stuis 13:25 29:22 42:47 132 0:19 7/21/17Luke Scott stulsec stulsec 0:40 0:40 1:20 4 0:20 7/21/17

System Enrollment and Usage
Copyright © 2007-2016 Pearson Education, Inc. or its affiliate(s). All rights reserved.Page: 4 of 5
All Courses School: Independence Elementary School
Teacher: All
Grade: All
Group: AllReport Run: 07/24/17 - 02:06 PM
Student Information Enrollment & Time Spent Usage
Student Username(login)
Student ID SM Math
SMReading
CustomCourses
TotalTimeSpent
Total Sessions
(minimum of 1
assignment)
AverageSessionTime
LastSession
Date
Destin Scroggins studsmc studsmc 31:27 21:19 3:53 56:39 175 0:19 7/21/17Hannah Sebastian stuhsmr stuhsmr 21:32 21:14 42:46 131 0:20 7/21/17Marta Seide stumssb stumssb 21:33 29:52 51:25 158 0:20 7/21/17Maya Shafaat stumsnv stumsnv 29:31 13:03 42:34 131 0:19 7/21/17Gazi Sharif stugs stugs 31:34 29:20 60:54 187 0:20 7/21/17Sameer Singh stuss stuss 22:07 29:08 51:15 158 0:19 7/21/17Ebony Slade stuesdh stuesdh 30:17 13:05 43:22 133 0:20 7/21/17Madison Smith stumssw stumssw 8:54 12:59 21:53 67 0:20 7/21/17Miley Stall stums stums 29:39 12:54 42:33 131 0:19 7/21/17Byron Stewart stubsed stubsed 29:41 29:12 58:53 181 0:20 7/19/17Garland Student 1 garland1 garland1 -- -- -- -- -- --Grandbury Student 1 grandbury1 grandbury1 -- -- -- -- -- --Paradise Valley Student 1 pv1 pv1 -- -- -- -- --Garland Student 2 garland2 garland2 -- -- -- -- -- --Grandbury Student 2 grandbury2 grandbury2 -- -- -- -- -- --Paradise Valley Student 2 pv2 pv2 -- -- -- -- --Garland Student 3 garland3 garland3 -- -- -- -- -- --Grandbury Student 3 grandbury3 grandbury3 -- -- -- -- -- --Paradise Valley Student 3 pv3 pv3 -- -- -- -- --Garland Student 4 garland4 garland4 -- -- -- -- -- --Grandbury Student 4 grandbury4 grandbury4 -- -- -- -- -- --Paradise Valley Student 4 pv4 pv4 -- -- -- -- --Garland Student 5 garland5 garland5 -- -- -- -- -- --Grandbury Student 5 grandbury5 grandbury5 -- -- -- -- -- --Paradise Valley Student 5 pv5 pv5 -- -- -- -- --Garland Student 6 garland6 garland6 -- -- -- -- -- --Grandbury Student 6 grandbury6 grandbury6 -- -- -- -- -- --Paradise Valley Student 6 pv6 pv6 -- -- -- -- --Garland Student 7 garland7 garland7 -- -- -- -- -- --Grandbury Student 7 grandbury7 grandbury7 -- -- -- -- -- --Paradise Valley Student 7 pv7 pv7 -- -- -- -- --Garland Student 8 garland8 garland8 -- -- -- -- -- --Grandbury Student 8 grandbury8 grandbury8 -- -- -- -- -- --Paradise Valley Student 8 pv8 pv8 -- -- -- -- --Demo Student bmckay4 bmckay4 -- -- -- -- -- --Demo Student camato4 camato4 -- -- -- -- -- --Demo Student cfox4 cfox4 -- -- -- -- -- --Demo Student cgabriel4 cgabriel4 -- -- -- -- -- --Demo Student cmiller4 cmiller4 -- -- -- -- -- --Demo Student ebryant4 ebryant4 -- -- -- -- -- --Demo Student gsprayberry4 gsprayberry4 -- -- -- -- -- --Demo Student jcoe4 jcoe4 -- -- -- -- -- --Demo Student jwallis4 jwallis4 -- -- -- -- -- --Demo Student ldovalina4 ldovalina4 -- -- -- -- -- --Demo Student mflinn4 mflinn4 -- -- -- -- -- --Demo Student mhailu4 mhailu4 -- -- -- -- -- --Demo Student mmoreno4 mmoreno4 -- -- -- -- -- --Demo Student tbreaux4 tbreaux4 -- -- -- -- -- --Demo Student txagm4 txagm4 -- -- -- -- -- --Garland Student K garlandk garlandk -- -- -- -- -- --Grandbury Student K grandburyk grandburyk -- -- -- -- -- --Paradise Valley Student K pvk pvk -- -- -- -- --

System Enrollment and Usage
Copyright © 2007-2016 Pearson Education, Inc. or its affiliate(s). All rights reserved.Page: 5 of 5
All Courses School: Independence Elementary School
Teacher: All
Grade: All
Group: AllReport Run: 07/24/17 - 02:06 PM
Student Information Enrollment & Time Spent Usage
Student Username(login)
Student ID SM Math
SMReading
CustomCourses
TotalTimeSpent
Total Sessions
(minimum of 1
assignment)
AverageSessionTime
LastSession
Date
Guille Suarez stugsmc stugsmc 12:54 29:01 41:55 130 0:19 7/18/17Raz Taylor sturtdh sturtdh 29:19 21:22 50:41 157 0:19 7/21/17Reshay Taylor sturtsb sturtsb 31:57 12:57 8:28 53:22 164 0:20 7/21/17Jayden Thompson stujtec stujtec 22:00 29:09 51:09 158 0:19 7/21/17Raquel Thompson sturttg sturttg 22:03 21:02 43:05 133 0:19 7/21/17Conner Toub stuctmr stuctmr 29:46 21:53 3:54 55:33 170 0:20 7/19/17Danielle Tripp studt studt 13:02 29:40 42:42 131 0:20 7/19/17Amy Tuele stuatpm stuatpm 12:55 29:29 42:24 130 0:20 7/19/17Madeline Tyler stumtsw stumtsw 21:30 21:08 42:38 131 0:20 7/19/17Leon Vallario stulvrs stulvrs 13:00 29:35 4:12 46:47 144 0:19 7/21/17Hector Vargas stuhvsb stuhvsb 12:59 21:01 8:27 42:27 131 0:19 7/19/17Bao Vo stubvtg stubvtg 14:24 12:43 27:07 83 0:20 7/21/17Hua Vo stuhved stuhved 21:31 21:15 42:46 131 0:20 7/21/17Jamal Warner stujw stujw 31:30 30:23 61:53 190 0:20 7/19/17Jerome Watkins stujwrs stujwrs 30:07 21:17 51:24 159 0:19 7/21/17Steven Welch stuswdh stuswdh 22:52 21:00 4:11 48:03 149 0:19 7/21/17Jamal White stujwrs2 stujwrs2 29:49 13:04 42:53 131 0:20 7/21/17Chaunte Williams stucwsb stucwsb 21:25 12:44 8:09 42:18 130 0:20 7/19/17Harris Williams stuhw stuhw 22:59 13:04 4:08 40:11 124 0:19 7/21/17Larissa Williams stulwsw stulwsw 12:53 12:45 25:38 79 0:19 7/21/17Tameka Wilson stutwsw stutwsw 31:40 21:08 52:48 163 0:19 7/21/17Tyree Winters stutwas stutwas 31:23 21:32 4:13 57:08 176 0:19 7/21/17Dwayne Womack studwmr studwmr 23:16 21:13 44:29 136 0:20 7/19/17Brayden Woods stubwec stubwec 31:34 21:26 53:00 163 0:20 7/21/17Isaac Yahya stuiyas stuiyas 12:57 29:12 42:09 130 0:19 7/21/17Alyssa Young stuaytg stuaytg 31:34 28:51 60:25 186 0:19 7/21/17Mina Zahedi stumzsw stumzsw 0:35 0:38 1:13 4 0:18 7/21/17Jasmine Zak stujzrs stujzrs 14:17 21:27 3:51 39:35 122 0:19 7/21/17Ahmed Zulfigar stuazsb stuazsb 31:41 21:06 52:47 163 0:19 7/21/17
Mean - 237 Students 21:04 20:12 5:27 42:49 131.79 0:19
Standard Deviation 9:06 8:10 1:58 14:32 44.73 0:00
*Options: All Courses Merged
Additional grouping by with page breaks (to save paper, turn page breaks off)
Sort by Student
Demographic filters not used
All Teachers selected
All Grades selected
All Groups selected
Legend: -- Course assigned, but data yet to be recorded (blank cell indicates unassigned course)
Times shown include Initial Placement (IP)