F - Residences Presenting Residential Projects in Balewadi Pune
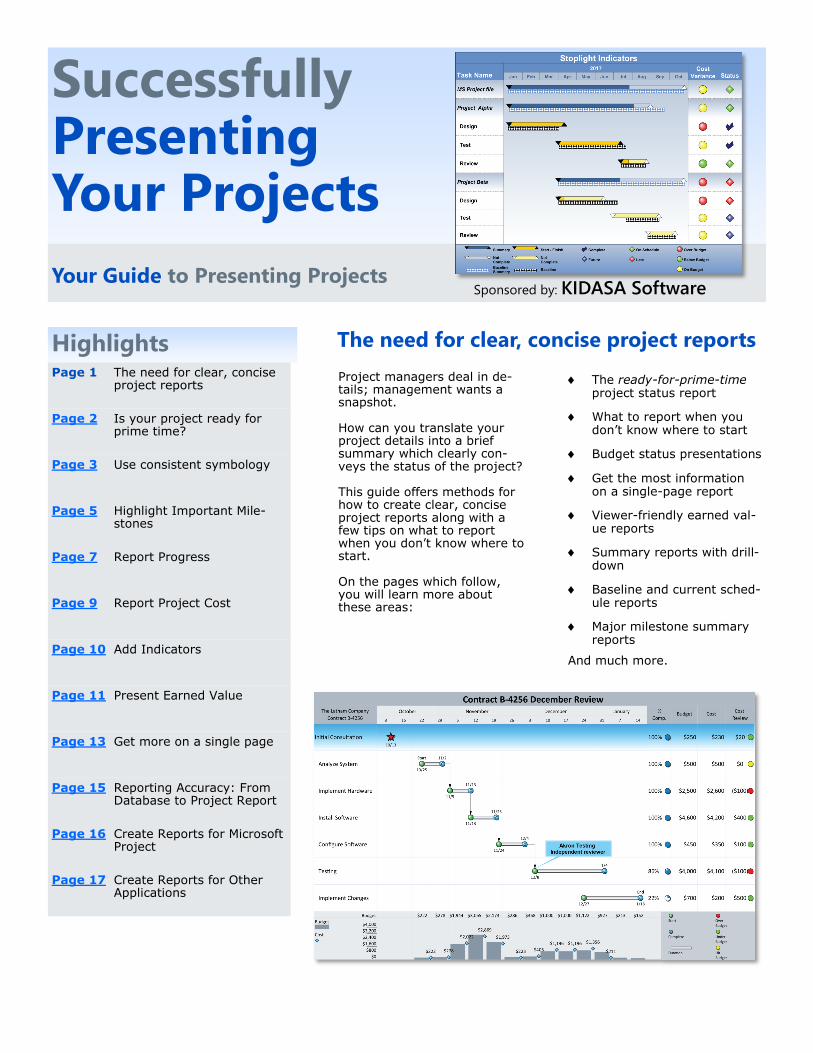
Project managers deal in de-tails; management wants a snapshot. How can you translate your project details into a brief summary which clearly con-veys the status of the project? This guide offers methods for how to create clear, concise project reports along with a few tips on what to report when you don’t know where to start. On the pages which follow, you will learn more about these areas:
Highlights The need for clear, concise project reports
The ready-for-prime-time project status report
What to report when you don’t know where to start
Budget status presentations
Get the most information on a single-page report
Viewer-friendly earned val-ue reports
Summary reports with drill-down
Baseline and current sched-ule reports
Major milestone summary reports
And much more.
Successfully Presenting Your Projects
Your Guide to Presenting Projects Sponsored by: KIDASA Software
Page 1 The need for clear, concise project reports
Page 2 Is your project ready for prime time?
Page 3 Use consistent symbology
Page 5 Highlight Important Mile-stones
Page 7 Report Progress
Page 9 Report Project Cost
Page 10 Add Indicators
Page 11 Present Earned Value
Page 13 Get more on a single page
Page 15 Reporting Accuracy: From Database to Project Report
Page 16 Create Reports for Microsoft Project
Page 17 Create Reports for Other Applications
©2017 KIDASA Software, Inc. www.kidasa.com Page 2
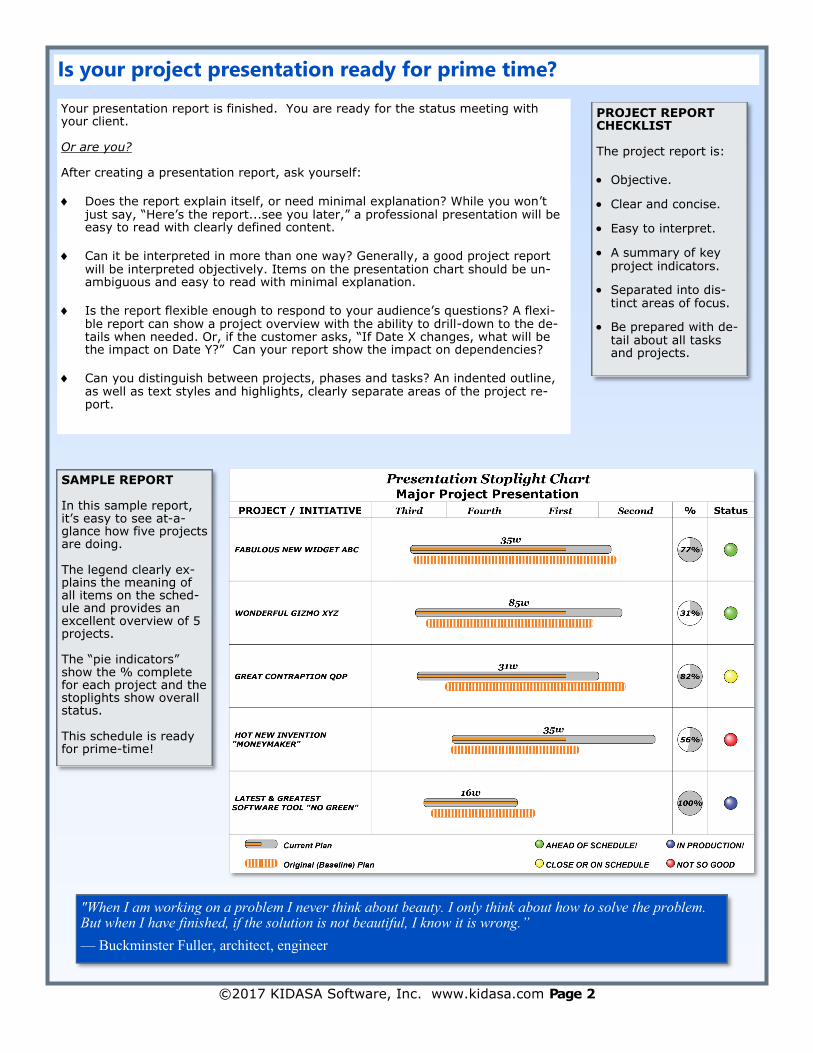
Your presentation report is finished. You are ready for the status meeting with your client. Or are you? After creating a presentation report, ask yourself:
Does the report explain itself, or need minimal explanation? While you won’t just say, “Here’s the report...see you later,” a professional presentation will be easy to read with clearly defined content.
Can it be interpreted in more than one way? Generally, a good project report will be interpreted objectively. Items on the presentation chart should be un-ambiguous and easy to read with minimal explanation.
Is the report flexible enough to respond to your audience’s questions? A flexi-ble report can show a project overview with the ability to drill-down to the de-tails when needed. Or, if the customer asks, “If Date X changes, what will be the impact on Date Y?” Can your report show the impact on dependencies?
Can you distinguish between projects, phases and tasks? An indented outline, as well as text styles and highlights, clearly separate areas of the project re-port.
Is your project presentation ready for prime time?
PROJECT REPORT CHECKLIST The project report is:
Objective.
Clear and concise.
Easy to interpret.
A summary of key project indicators.
Separated into dis-tinct areas of focus.
Be prepared with de-tail about all tasks and projects.
SAMPLE REPORT In this sample report, it’s easy to see at-a-glance how five projects are doing. The legend clearly ex-plains the meaning of all items on the sched-ule and provides an excellent overview of 5 projects. The “pie indicators” show the % complete for each project and the stoplights show overall status. This schedule is ready for prime-time!
"When I am working on a problem I never think about beauty. I only think about how to solve the problem. But when I have finished, if the solution is not beautiful, I know it is wrong.”
— Buckminster Fuller, architect, engineer
©2017 KIDASA Software, Inc. www.kidasa.com Page 3
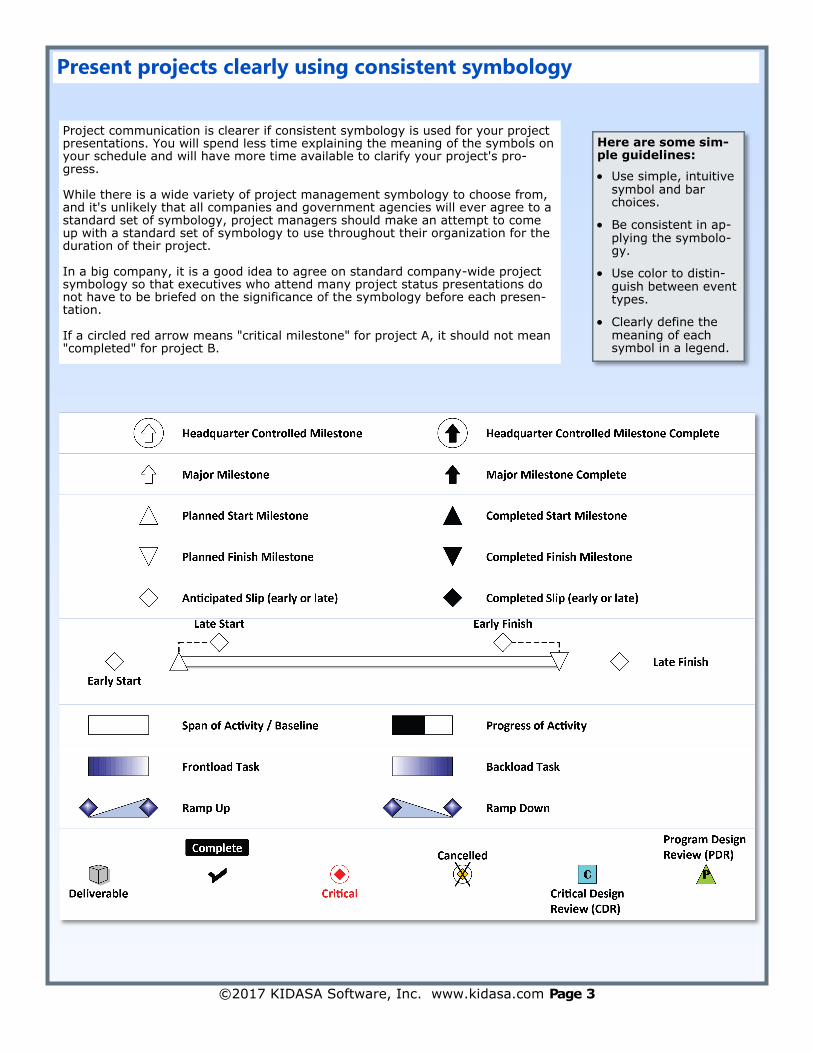
Present projects clearly using consistent symbology
Project communication is clearer if consistent symbology is used for your project presentations. You will spend less time explaining the meaning of the symbols on your schedule and will have more time available to clarify your project's pro-gress. While there is a wide variety of project management symbology to choose from, and it's unlikely that all companies and government agencies will ever agree to a standard set of symbology, project managers should make an attempt to come up with a standard set of symbology to use throughout their organization for the duration of their project. In a big company, it is a good idea to agree on standard company-wide project symbology so that executives who attend many project status presentations do not have to be briefed on the significance of the symbology before each presen-tation. If a circled red arrow means "critical milestone" for project A, it should not mean "completed" for project B.
Here are some sim-ple guidelines:
Use simple, intuitive symbol and bar choices.
Be consistent in ap-plying the symbolo-gy.
Use color to distin-guish between event types.
Clearly define the meaning of each symbol in a legend.

©2017 KIDASA Software, Inc. www.kidasa.com Page 4
Present projects clearly using consistent symbology
Scenario: Multiple Projects presented on one page. Strategy:
Show as much as possible in a condensed form.
Use well known acronyms to conserve space.
Keep the chart clutter-free for ease of presentation. Verbally present details.
In this case, since there is no legend, it is important that the audience be familiar with the acronyms.
Scenario: Your management or your customer wants to see current project status compared to the
original project plan.
Strategy:
Show how each task is doing compared to the original plan. Compare the current plan bar to the baseline bar.
Show the percent complete based on the amount of shading.

©2017 KIDASA Software, Inc. www.kidasa.com Page 5
Highlight important milestones
Your project has 30,000 tasks and you are called on to make a project presentation. Obviously, passing out a 90 page report to meeting attendees isn’t a great idea. However, depending on your project, you might be able to distill it down to a one-page chart similar to the one below:
Here are some ideas to highlight key milestones on a presentation chart:
Use shapes which convey special meaning:
Frontloaded Task
Ramp Up Ramp Down
Deliverable Critical Cancelled
Slipped
CompletedLaunch
Date
C Critical Design Review
PProgramDesignReview
LAUNCH
SHIP
HQ MOVES TO TEXAS
Frontloaded Task
Ramp Up Ramp Down
Deliverable Critical Cancelled
Slipped
CompletedLaunch
Date
C Critical Design Review
PProgramDesignReview
LAUNCH
SHIP
HQ MOVES TO TEXAS
Frontloaded Task
Ramp Up Ramp Down
Deliverable Critical Cancelled
Slipped
CompletedLaunch
Date
C Critical Design Review
PProgramDesignReview
LAUNCH
SHIP
HQ MOVES TO TEXAS
Change the color: Add a marking:
Use a pointer:
Frontloaded TaskRamp Up Ramp Down
Deliverable Critical Cancelled
Slipped
CompletedLaunch
Date
C Critical Design Review
KEY MILESTONE PProgramDesignReview
LAUNCH
SHIP
HQ MOVES TO TEXAS
Move major milestones to summary row:
Change the size:
LAUNCH
SHIP
HQ MOVES TO TEXAS
©2017 KIDASA Software, Inc. www.kidasa.com Page 6
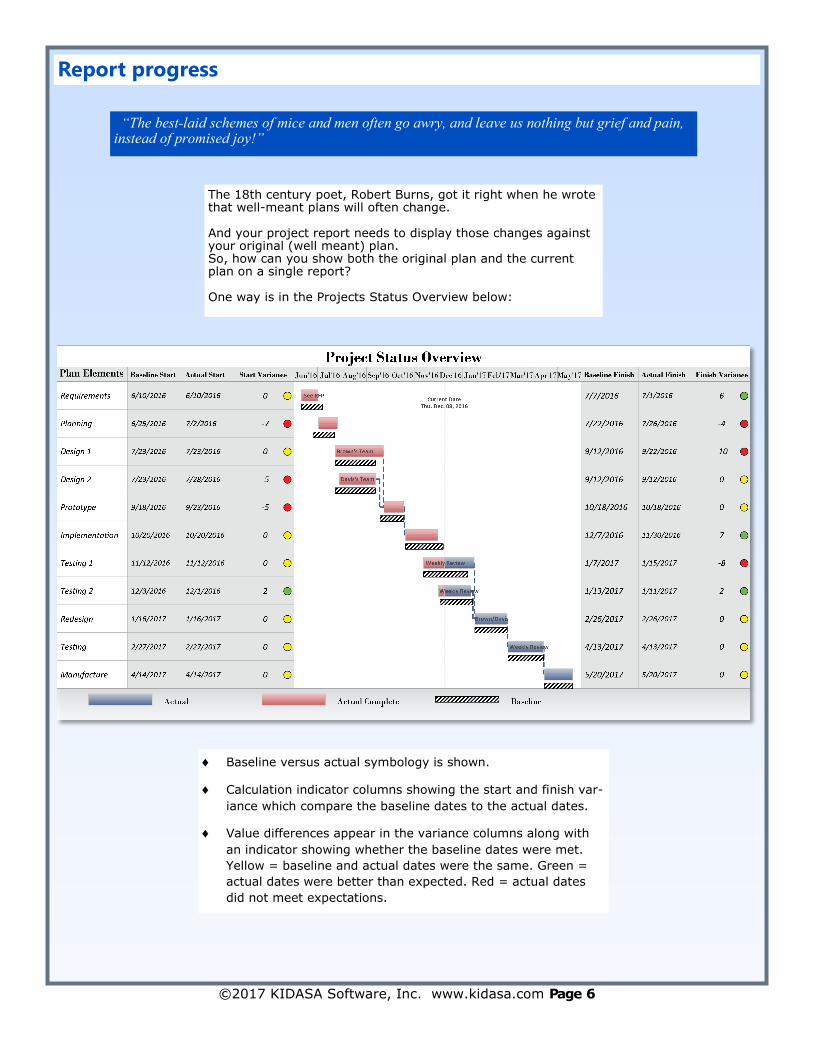
The 18th century poet, Robert Burns, got it right when he wrote that well-meant plans will often change. And your project report needs to display those changes against your original (well meant) plan. So, how can you show both the original plan and the current plan on a single report? One way is in the Projects Status Overview below:
Report progress
“The best-laid schemes of mice and men often go awry, and leave us nothing but grief and pain, instead of promised joy!”
Baseline versus actual symbology is shown.
Calculation indicator columns showing the start and finish var-
iance which compare the baseline dates to the actual dates.
Value differences appear in the variance columns along with
an indicator showing whether the baseline dates were met.
Yellow = baseline and actual dates were the same. Green =
actual dates were better than expected. Red = actual dates
did not meet expectations.
©2017 KIDASA Software, Inc. www.kidasa.com Page 7
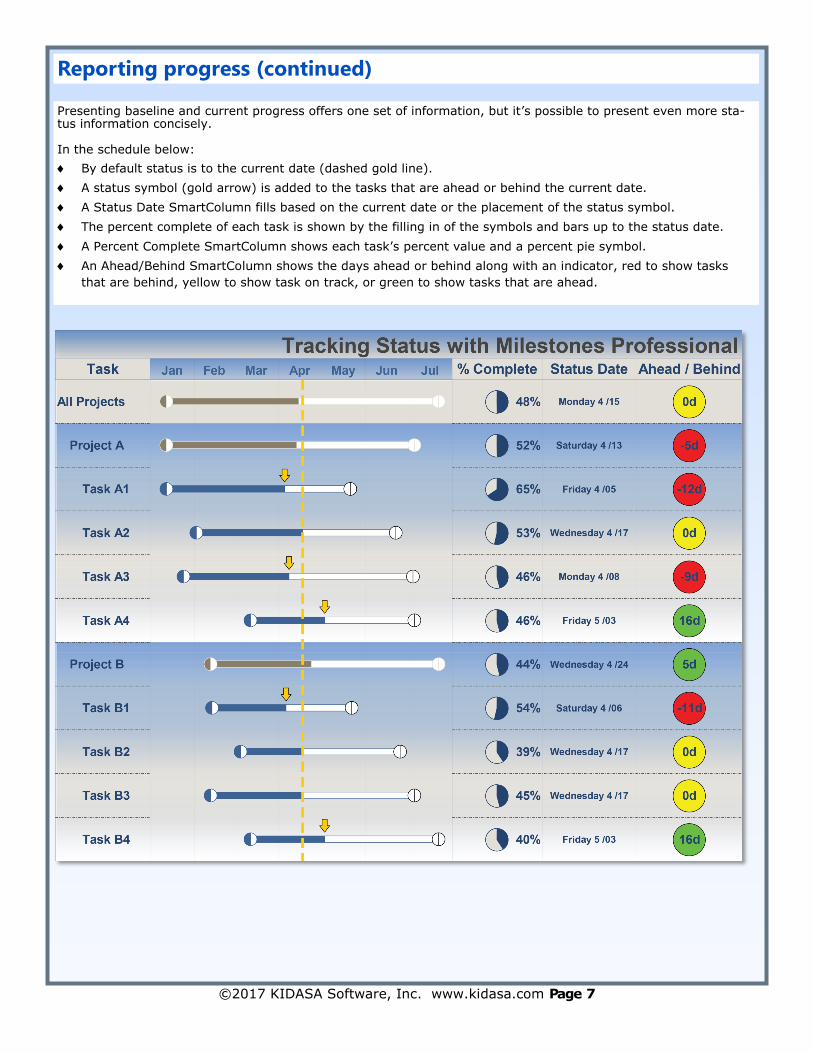
Presenting baseline and current progress offers one set of information, but it’s possible to present even more sta-tus information concisely. In the schedule below:
By default status is to the current date (dashed gold line).
A status symbol (gold arrow) is added to the tasks that are ahead or behind the current date.
A Status Date SmartColumn fills based on the current date or the placement of the status symbol.
The percent complete of each task is shown by the filling in of the symbols and bars up to the status date.
A Percent Complete SmartColumn shows each task’s percent value and a percent pie symbol.
An Ahead/Behind SmartColumn shows the days ahead or behind along with an indicator, red to show tasks
that are behind, yellow to show task on track, or green to show tasks that are ahead.
Reporting progress (continued)
©2017 KIDASA Software, Inc. www.kidasa.com Page 8
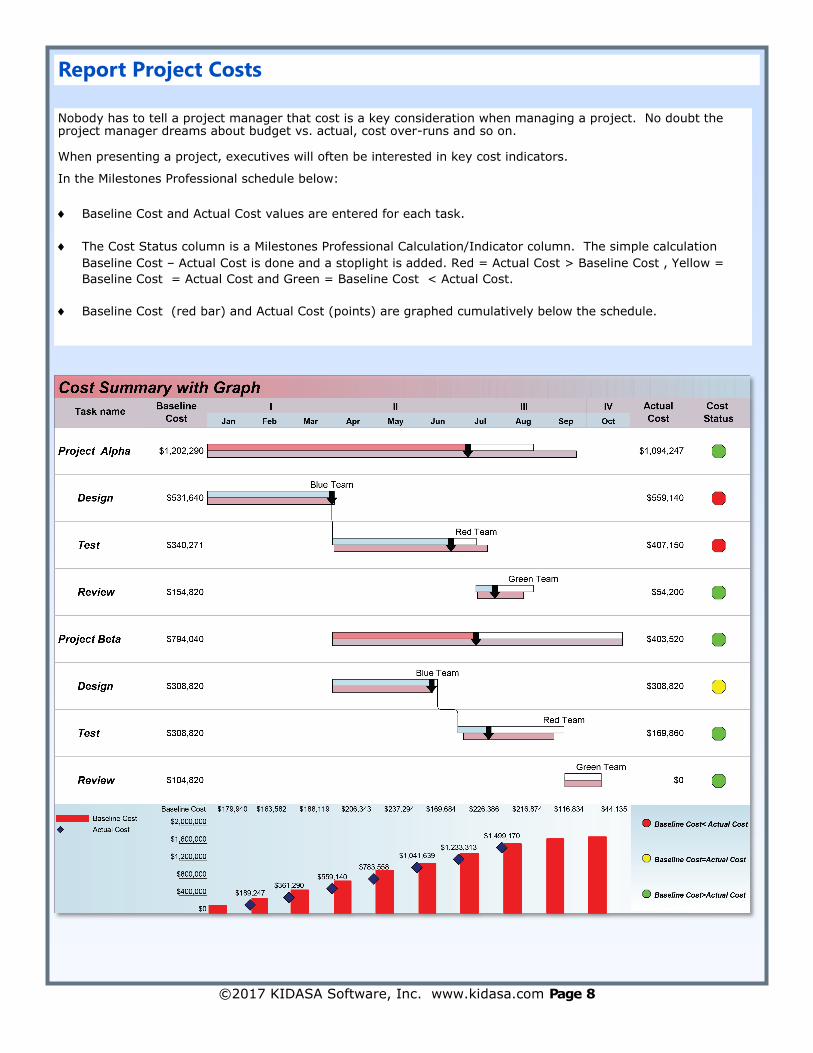
Nobody has to tell a project manager that cost is a key consideration when managing a project. No doubt the project manager dreams about budget vs. actual, cost over-runs and so on. When presenting a project, executives will often be interested in key cost indicators.
In the Milestones Professional schedule below:
Baseline Cost and Actual Cost values are entered for each task.
The Cost Status column is a Milestones Professional Calculation/Indicator column. The simple calculation
Baseline Cost – Actual Cost is done and a stoplight is added. Red = Actual Cost > Baseline Cost , Yellow =
Baseline Cost = Actual Cost and Green = Baseline Cost < Actual Cost.
Baseline Cost (red bar) and Actual Cost (points) are graphed cumulatively below the schedule.
Report Project Costs
©2017 KIDASA Software, Inc. www.kidasa.com Page 9
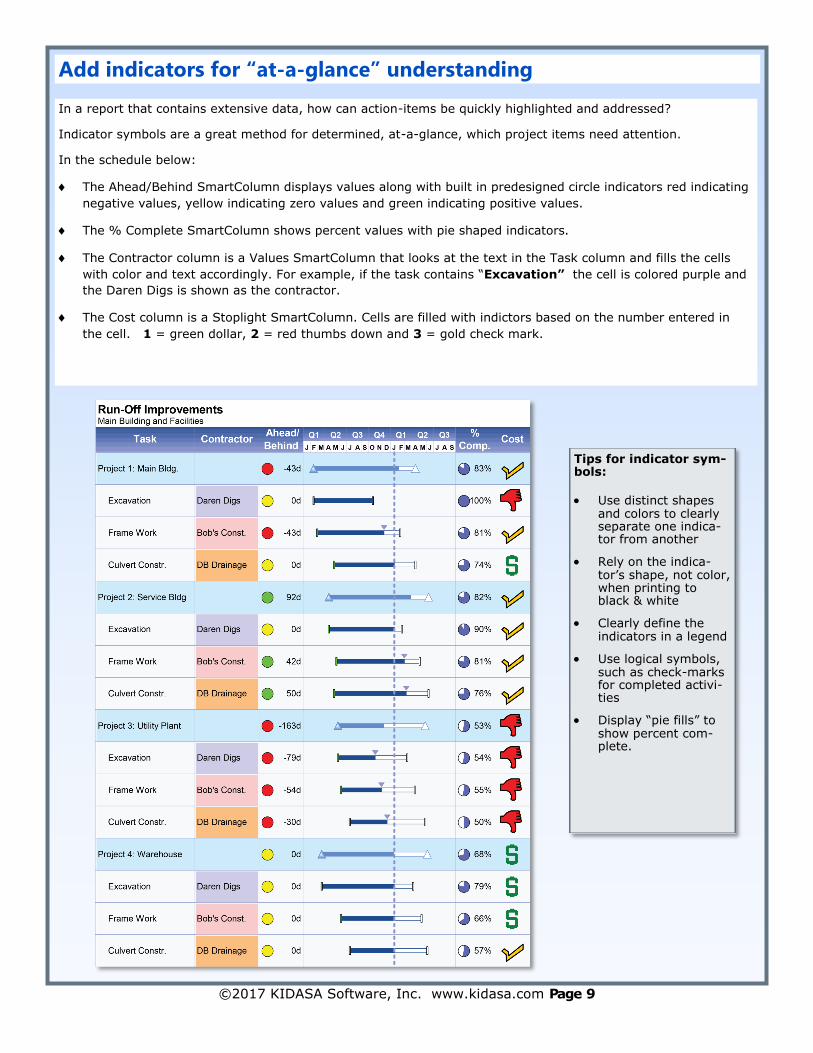
In a report that contains extensive data, how can action-items be quickly highlighted and addressed? Indicator symbols are a great method for determined, at-a-glance, which project items need attention. In the schedule below:
The Ahead/Behind SmartColumn displays values along with built in predesigned circle indicators red indicating
negative values, yellow indicating zero values and green indicating positive values.
The % Complete SmartColumn shows percent values with pie shaped indicators.
The Contractor column is a Values SmartColumn that looks at the text in the Task column and fills the cells
with color and text accordingly. For example, if the task contains “Excavation” the cell is colored purple and
the Daren Digs is shown as the contractor.
The Cost column is a Stoplight SmartColumn. Cells are filled with indictors based on the number entered in
the cell. 1 = green dollar, 2 = red thumbs down and 3 = gold check mark.
Tips for indicator sym-bols:
Use distinct shapes and colors to clearly separate one indica-tor from another
Rely on the indica-tor’s shape, not color, when printing to black & white
Clearly define the indicators in a legend
Use logical symbols, such as check-marks for completed activi-ties
Display “pie fills” to show percent com-plete.
Add indicators for “at-a-glance” understanding
©2017 KIDASA Software, Inc. www.kidasa.com Page 10
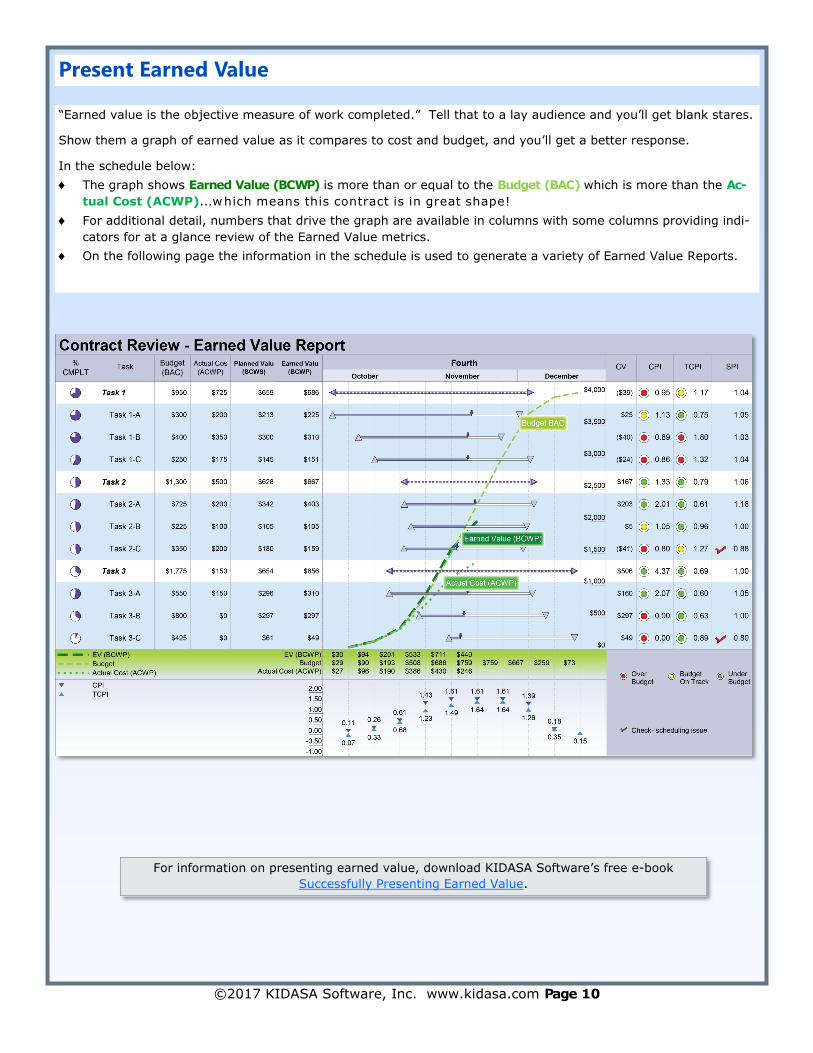
“Earned value is the objective measure of work completed.” Tell that to a lay audience and you’ll get blank stares. Show them a graph of earned value as it compares to cost and budget, and you’ll get a better response. In the schedule below:
The graph shows Earned Value (BCWP) is more than or equal to the Budget (BAC) which is more than the Ac-
tual Cost (ACWP)...which means this contract is in great shape!
For additional detail, numbers that drive the graph are available in columns with some columns providing indi-
cators for at a glance review of the Earned Value metrics.
On the following page the information in the schedule is used to generate a variety of Earned Value Reports.
For information on presenting earned value, download KIDASA Software’s free e-book
Successfully Presenting Earned Value.
Present Earned Value
©2017 KIDASA Software, Inc. www.kidasa.com Page 11
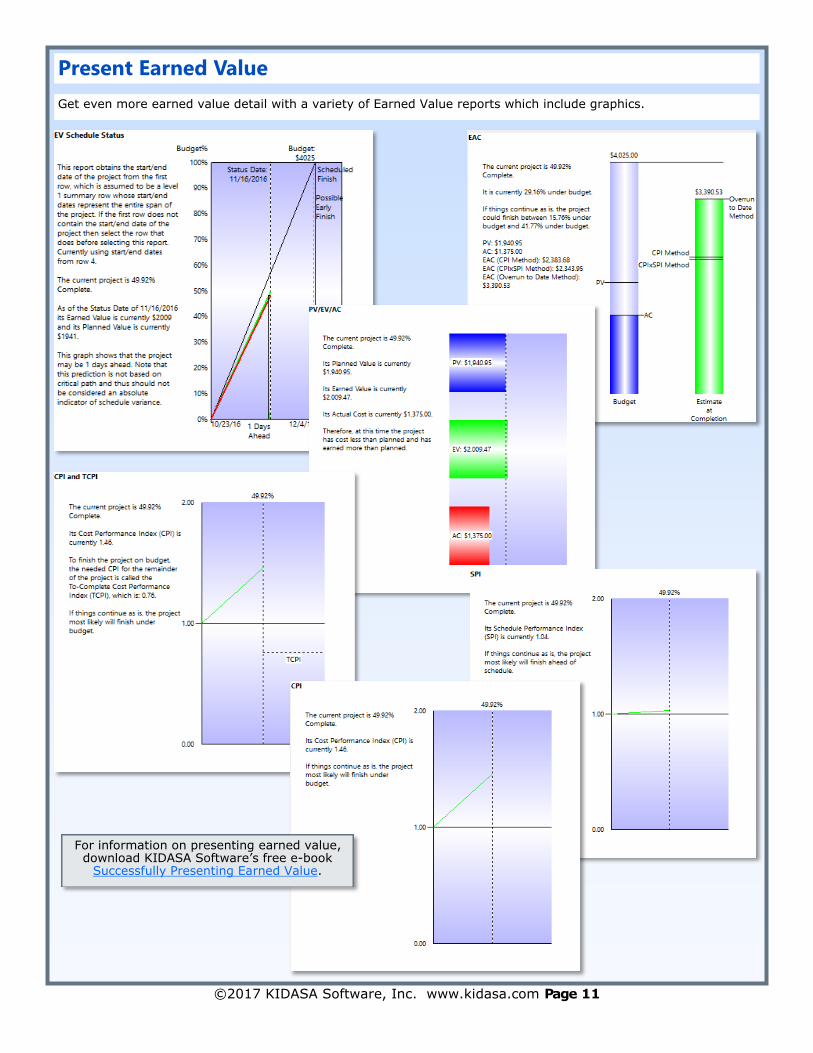
Get even more earned value detail with a variety of Earned Value reports which include graphics.
Present Earned Value
For information on presenting earned value, download KIDASA Software’s free e-book
Successfully Presenting Earned Value.
©2017 KIDASA Software, Inc. www.kidasa.com Page 12
Here are a few tips on meeting a single page challenge:
Include multiple mile-stones and task bars per line
Color-code repetitive tasks, defined in a legend
Embed detailed infor-mation in the mile-stones or cells
Before printing, hide unnecessary columns to conserve space
Abbreviate text, espe-cially using well-known acronyms
Only display summary activities with key dates
Use presentation soft-ware that lets you “drill-down” to details. That way, your top level schedules can be clean and concise.
Get more on a single page
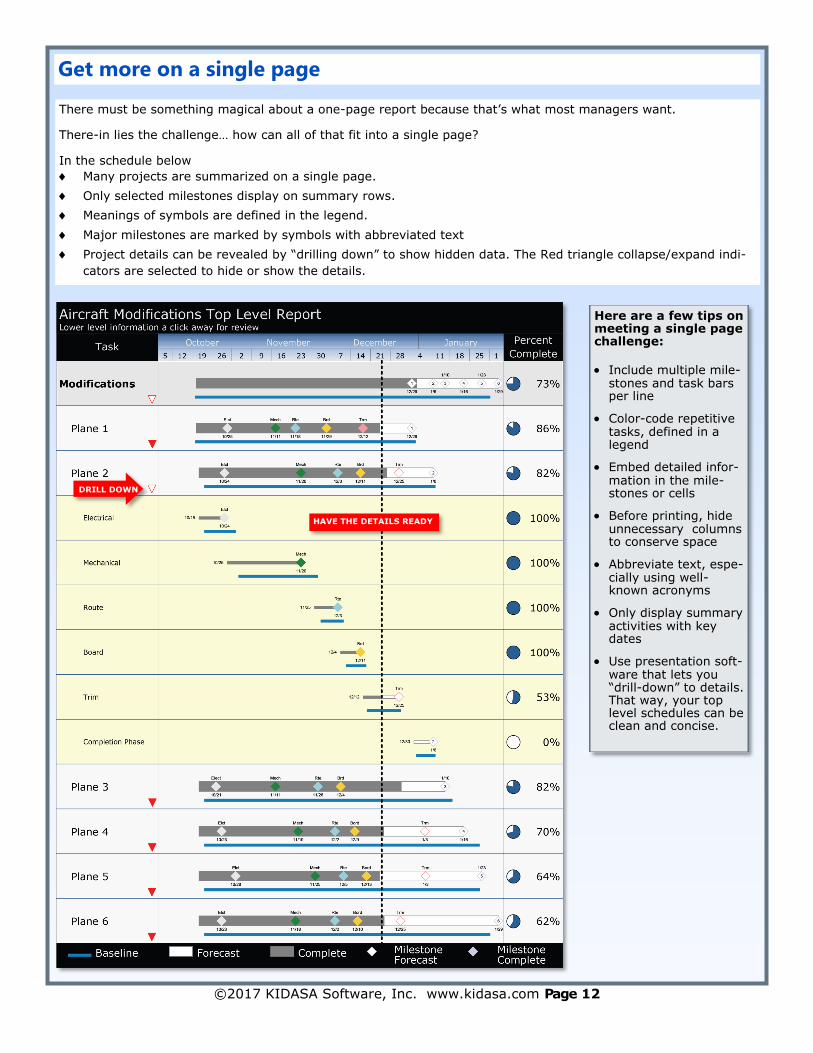
There must be something magical about a one-page report because that’s what most managers want. There-in lies the challenge… how can all of that fit into a single page? In the schedule below
Many projects are summarized on a single page.
Only selected milestones display on summary rows.
Meanings of symbols are defined in the legend.
Major milestones are marked by symbols with abbreviated text
Project details can be revealed by “drilling down” to show hidden data. The Red triangle collapse/expand indi-
cators are selected to hide or show the details.
HAVE THE DETAILS READY
DRILL DOWN
©2017 KIDASA Software, Inc. www.kidasa.com Page 13
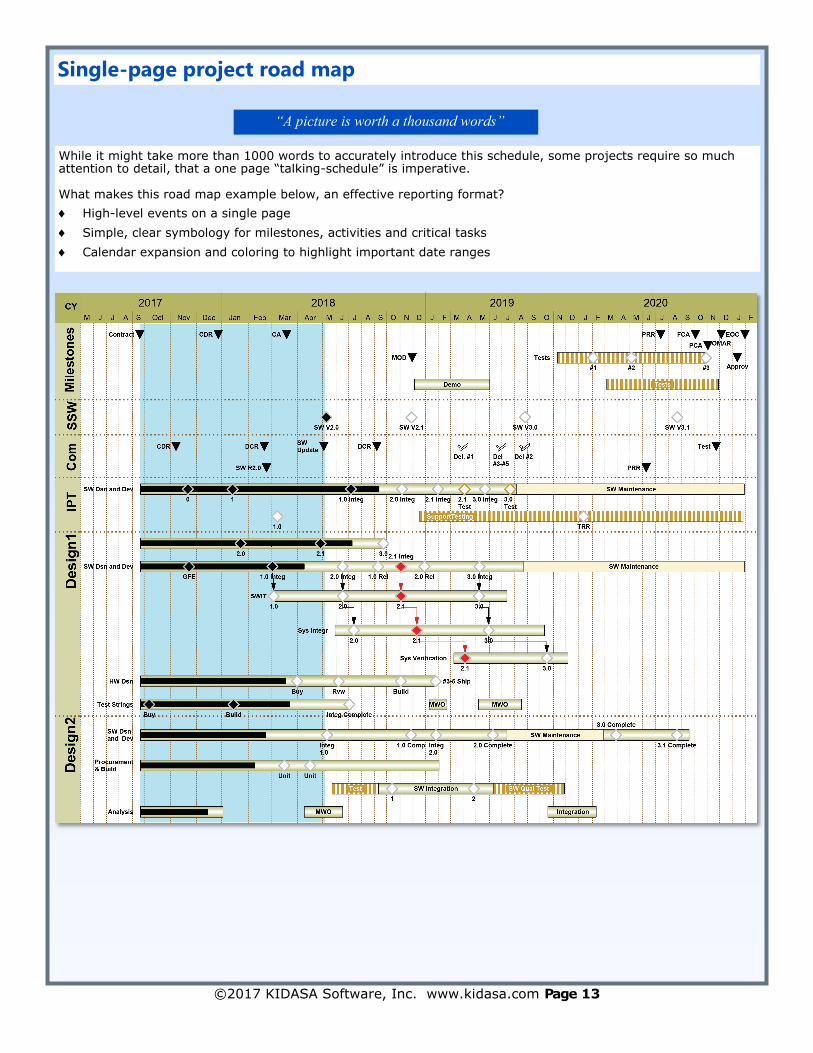
While it might take more than 1000 words to accurately introduce this schedule, some projects require so much attention to detail, that a one page “talking-schedule” is imperative. What makes this road map example below, an effective reporting format?
High-level events on a single page
Simple, clear symbology for milestones, activities and critical tasks
Calendar expansion and coloring to highlight important date ranges
Single-page project road map
“A picture is worth a thousand words”
©2017 KIDASA Software, Inc. www.kidasa.com Page 14
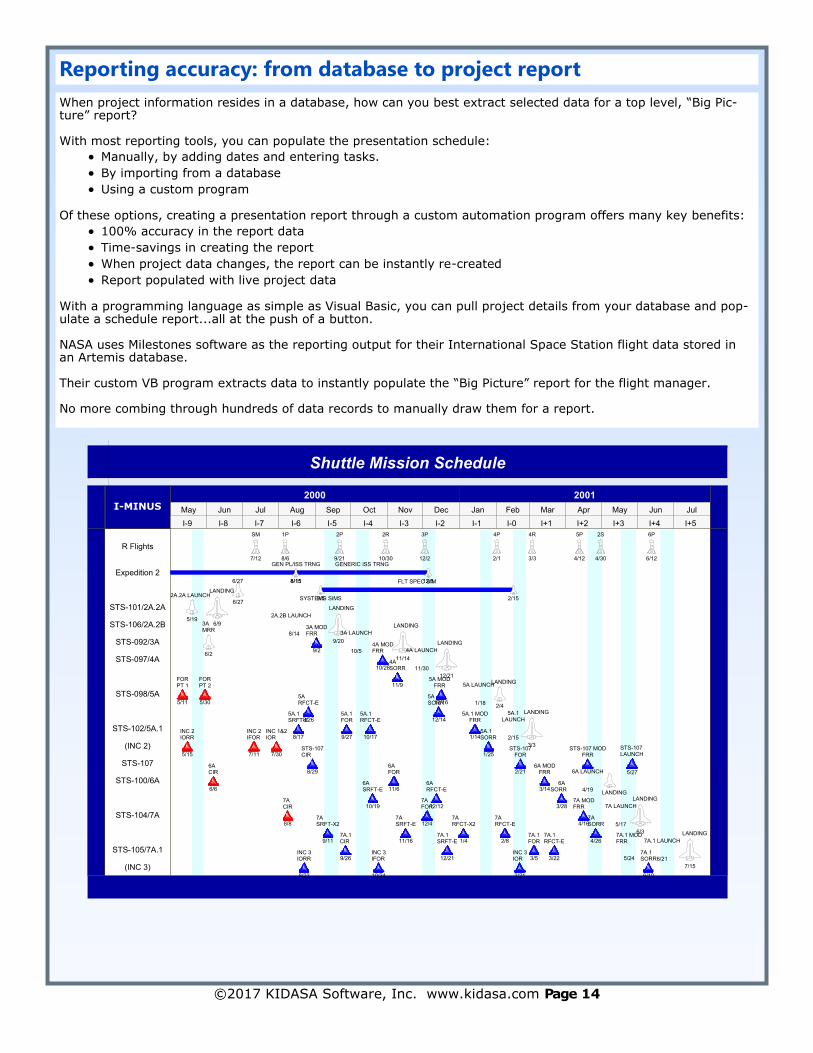
Reporting accuracy: from database to project report
2000 2001
May Jun Jul Aug Sep Oct Nov Dec Jan Feb Mar Apr May Jun Jul
I-9 I-8 I-7 I-6 I-5 I-4 I-3 I-2 I-1 I-0 I+1 I+2 I+3 I+4 I+5
Shuttle Mission Schedule
I-MINUS
R Flights
Expedition 2
STS-101/2A.2A
STS-106/2A.2B
STS-092/3A
STS-097/4A
STS-098/5A
STS-102/5A.1
(INC 2)
STS-107
STS-100/6A
STS-104/7A
STS-105/7A.1
(INC 3)
7/12
SM
8/6
1P
9/21
2P
10/30
2R
12/2
3P
2/1
4P
3/3
4R
4/12
5P
4/30
2S
6/12
6P
6/27 8/15
GEN PL/ISS TRNG
8/15
GENERIC ISS TRNG
12/5
6/27SYSTEMS SIMS9/5
FLT SPEC SIM
2/15
5/19
2A.2A LAUNCH
6/9
LANDING
8/14
2A.2B LAUNCH
9/20
LANDING
6/2
3AMRR
9/2
3A MODFRR
10/5
3A LAUNCH
11/14
LANDING
10/28
4A MODFRR
11/30
4A LAUNCH
12/21
LANDING
11/9
4ASORR
5/11
FORPT 1
5/30
FORPT 2
12/16
5A MOD FRR
1/18
5A LAUNCH
2/4
LANDING
8/26
5ARFCT-E
12/14
5ASORR
8/17
5A.1SRFT-E
9/27
5A.1FOR
10/17
5A.1RFCT-E
1/14
5A.1 MODFRR
2/15
5A.1LAUNCH
3/3
LANDING
5/15
INC 2IORR
7/11
INC 2IFOR
7/30
INC 1&2IOR
1/25
5A.1SORR
8/29
STS-107CIR
2/21
STS-107FOR
STS-107 MODFRR
5/27
STS-107 LAUNCH
6/6
6ACIR
11/6
6AFOR
3/14
6A MODFRR
4/19
6A LAUNCH
LANDING
10/19
6ASRFT-E
12/12
6ARFCT-E
3/28
6ASORR
8/8
7ACIR
12/4
7AFOR
4/16
7A MODFRR
5/17
7A LAUNCH
6/3
LANDING
9/11
7ASRFT-X2
11/16
7ASRFT-E
1/4
7ARFCT-X2
2/8
7ARFCT-E
4/26
7ASORR
9/26
7A.1CIR
12/21
7A.1SRFT-E
3/5
7A.1FOR
3/22
7A.1RFCT-E
5/24
7A.1 MODFRR
6/21
7A.1 LAUNCH
7/15
LANDING
8/22
INC 3IORR
10/24
INC 3IFOR
2/21
INC 3IOR
6/10
7A.1SORR
When project information resides in a database, how can you best extract selected data for a top level, “Big Pic-ture” report? With most reporting tools, you can populate the presentation schedule:
Manually, by adding dates and entering tasks.
By importing from a database
Using a custom program Of these options, creating a presentation report through a custom automation program offers many key benefits:
100% accuracy in the report data
Time-savings in creating the report
When project data changes, the report can be instantly re-created
Report populated with live project data With a programming language as simple as Visual Basic, you can pull project details from your database and pop-ulate a schedule report...all at the push of a button. NASA uses Milestones software as the reporting output for their International Space Station flight data stored in an Artemis database. Their custom VB program extracts data to instantly populate the “Big Picture” report for the flight manager. No more combing through hundreds of data records to manually draw them for a report.
©2017 KIDASA Software, Inc. www.kidasa.com Page 15
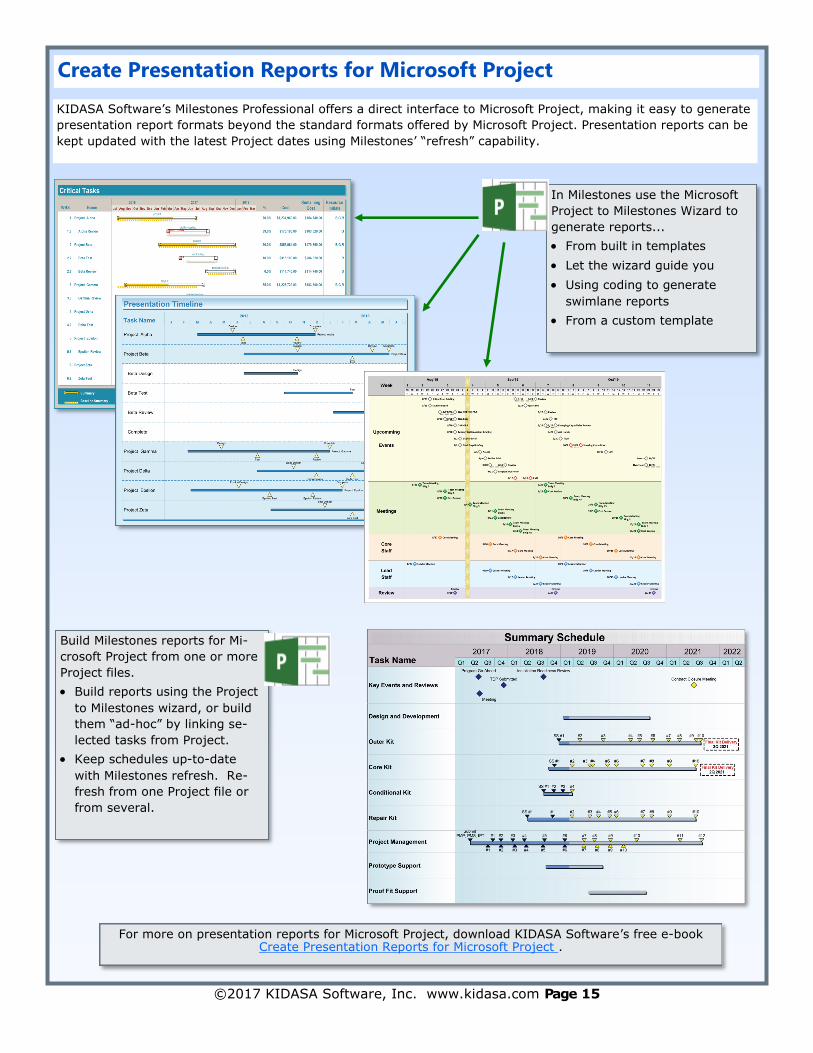
Create Presentation Reports for Microsoft Project
KIDASA Software’s Milestones Professional offers a direct interface to Microsoft Project, making it easy to generate
presentation report formats beyond the standard formats offered by Microsoft Project. Presentation reports can be
kept updated with the latest Project dates using Milestones’ “refresh” capability.
For more on presentation reports for Microsoft Project, download KIDASA Software’s free e-book Create Presentation Reports for Microsoft Project .
In Milestones use the Microsoft
Project to Milestones Wizard to
generate reports...
From built in templates
Let the wizard guide you
Using coding to generate
swimlane reports
From a custom template
Build Milestones reports for Mi-
crosoft Project from one or more
Project files.
Build reports using the Project
to Milestones wizard, or build
them “ad-hoc” by linking se-
lected tasks from Project.
Keep schedules up-to-date
with Milestones refresh. Re-
fresh from one Project file or
from several.
©2017 KIDASA Software, Inc. www.kidasa.com Page 16
Create Presentation Reports from Excel data
KIDASA Software’s Milestones Professional Smart Import feature is designed to generate a Milestones schedule
from data of any application, like Excel, that can copy data to the Windows Clipboard. Reports can be updated
(“refreshed”) when Excel dates change.
Create Presentation Reports for other Applications
Create Presentation Reports from Primavera data
Transform Primavera schedules into executive level presentation reports with Milestones Professional. Then Re-fresh the Milestones report when the Primavera information has changed.
Create Presentation Reports from Outlook tasks and calendar appointments
KIDASA Software’s Milestones Professional offers a direct interface to Outlook, making it easy to generate presen-tation reports.
Features:
Use “Smart Import” to
bring in Excel fields.
By using “Smart” col-
umn headings, Mile-
stones knows just what
to do!
“Refresh” schedules
from Excel to keep them
up to date.
Features:
A variety of report
templates.
Customize the reports
with available Outlook
fields to add as columns.
Customize the reports
with available Outlook
fields to add as symbol
text or notes.
Features:
Primavera infor-
mation must be saved
as an XML:MS Project
Schema file
Update presentation
schedules when Pri-
mavera dates change
with Milestones refresh.
©2017 KIDASA Software, Inc. www.kidasa.com Page 17
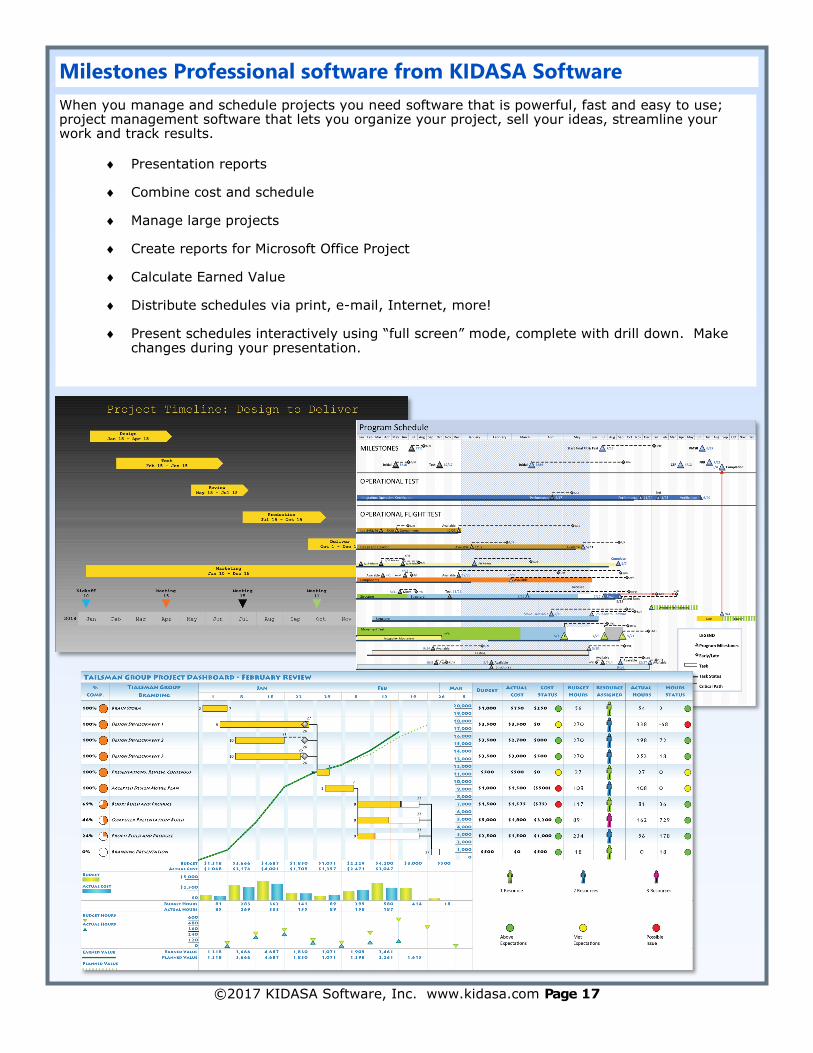
Milestones Professional software from KIDASA Software
When you manage and schedule projects you need software that is powerful, fast and easy to use; project management software that lets you organize your project, sell your ideas, streamline your work and track results.
Presentation reports
Combine cost and schedule
Manage large projects
Create reports for Microsoft Office Project
Calculate Earned Value
Distribute schedules via print, e-mail, Internet, more!
Present schedules interactively using “full screen” mode, complete with drill down. Make changes during your presentation.