Success starts in grade 1: The importance of school · PDF fileDesign subtest taken from the...
12
Volume 4, Fascicle 2, December 2007 By Jean-Pascal Lemelin and Michel Boivin 1 About the QLSCD (1998-2010) This fascicle is based on data from the Québec Longitudinal Study of Child Development (QLSCD 1998-2010), conducted by the Institut de la statistique du Québec in collaboration with a host of partners (see the last page of this fascicle). The objective of this study is to understand the determinants and choices that characterize early childhood and that act as precursors that predispose children to success or failure once they are in the school system. The population targeted initially by the QLSCD was made up of all children (singleton births only) born to mothers residing in Québec in 1997-1998, excepting those with mothers then residing in the administrative regions (as defined by the Ministry of Health and Social Services) of Northern Québec, the Cri territories, and the Inuit territories, as well as on Indian reserves. Some children were also excluded because of limiting factors related to the survey base or because of serious health problems. The initial sample suitable for longitudinal follow-up was made up of 2,120 children. These children were followed annually from around age 5 months to about 8 years of age, and are currently being followed up biannually until 12 years of age. At the time of the 2002 survey round, the timing of the data collection was modified so that all children are seen in the spring, which is the point at which they are also assessed by the school system. It should be emphasized here that this marks the first time that such a large sample of Québec-born children has been followed so thoroughly through early childhood. The QLSCD is structured around a number of data collection instruments used to gather information about individual children, about the person most knowledgeable about them (PMK), about her/his spouse/partner (if applicable), and about non-residential biological parents (if applicable). At each data collection, the target child is invited to participate in one or more activities that make it possible to assess the child’s development. Beginning with the 2004 survey round, teachers were also asked to answer questionnaires discussing various aspects of the child’s development and his/her academic adjustment. Additional information about the survey methodology and data sources may be found on the QLSCD web site, also known as “I am, I’ll be”, at: www.iamillbe.stat.gouv.qc.ca . School readiness refers to a number of skills, particularly cognitive, linguistic, socioemotional, and behavioural, as well as to the core knowledge that facilitates learning and adjustment among children when they start school (Forget-Dubois et al., in press). The existing literature reports that the level of school readiness among children is closely linked to performance and adjustment to school later on. For example, children with lower levels of school readiness at school entry are more likely to experience difficulty in school, as well as problems related to behaviour and social skills (Connell and Prinz, 2002; NICHD, 1999). These problems are closely related to various indices of social maladjustment that may occur later in a child's school career, such as rejection and victimization by peers (Guay, Boivin and Hodges, 1999). Understandably, considerable importance must be assigned to ensuring that children are thoroughly prepared when they begin school. Still, appropriately adapting prevention programs requires a thorough knowledge of the origins and the risk factors of school adjustment problems, as well as the mechanisms by which they develop. Studying the relationships among psychosocial risk factors, school readiness, and school success thus takes on indisputable importance. The main objective of this fascicle is to examine the predictive association between school readiness and school performance at the beginning of primary school. To this end, we will use two measures of school readiness: the Early Development Instrument (EDI) (Janus and Offord, 2007), based on teacher ratings of the degree of pupil readiness, and the Lollipop Test (Chew, 1989), which is intended to evaluate certain kinds of core knowledge and basic cognitive aptitudes directly with child subjects. A secondary objective consists of verifying whether the EDI, which is widely used across Canada (Janus and Offord, 2000), is comparable to the Lollipop for predicting children's performance in school. We will also be seeking to identify the predictive capability of these two evaluation tools, once we have considered other language and cognitive measures that are frequently used to predict school performance, namely, the Peabody Picture Vocabulary Test – Revised (PPVT - R) (Dunn, Thériault-Whalen and Dunn, 1993) and the Block Design subtest taken from the Wechsler Preschool and Primary Scale of Intelligence – Revised (WPPSI-R; Wechsler, 1989). Finally, we will be Success starts in grade 1: The importance of school readiness
Transcript of Success starts in grade 1: The importance of school · PDF fileDesign subtest taken from the...
Volume 4, Fascicle 2, December 2007
By Jean-Pascal Lemelin and Michel Boivin1
About the QLSCD (1998-2010)
This fascicle is based on data from the Québec Longitudinal Study of Child Development (QLSCD 1998-2010), conducted by the Institut de la statistique du Québec in collaboration with a host of partners (see the last page of this fascicle). The objective of this study is to understand the determinants and choices that characterize early childhood and that act as precursors that predispose children to success or failure once they are in the school system. The population targeted initially by the QLSCD was made up of all children (singleton births only) born to mothers residing in Québec in 1997-1998, excepting those with mothers then residing in the administrative regions (as defined by the Ministry of Health and Social Services) of Northern Québec, the Cri territories, and the Inuit territories, as well as on Indian reserves. Some children were also excluded because of limiting factors related to the survey base or because of serious health problems. The initial sample suitable for longitudinal follow-up was made up of 2,120 children. These children were followed annually from around age 5 months to about 8 years of age, and are currently being followed up biannually until 12 years of age. At the time of the 2002 survey round, the timing of the data collection was modified so that all children are seen in the spring, which is the point at which they are also assessed by the school system. It should be emphasized here that this marks the first time that such a large sample of Québec-born children has been followed so thoroughly through early childhood. The QLSCD is structured around a number of data collection instruments used to gather information about individual children, about the person most knowledgeable about them (PMK), about her/his spouse/partner (if applicable), and about non-residential biological parents (if applicable). At each data collection, the target child is invited to participate in one or more activities that make it possible to assess the child’s development. Beginning with the 2004 survey round, teachers were also asked to answer questionnaires discussing various aspects of the child’s development and his/her academic adjustment. Additional information about the survey methodology and data sources may be found on the QLSCD web site, also known as “I am, I’ll be”, at: www.iamillbe.stat.gouv.qc.ca.
School readiness refers to a number of skills, particularly cognitive, linguistic, socioemotional, and behavioural, as well as to the core knowledge that facilitates learning and adjustment among children when they start school (Forget-Dubois et al., in press). The existing literature reports that the level
of school readiness among children is closely linked to performance and adjustment to school later on. For example, children with lower levels of school readiness at school entry are more likely to experience difficulty in school, as well as problems related to behaviour and social skills (Connell and Prinz, 2002; NICHD, 1999). These problems are closely related to various indices of social maladjustment that may occur later in a child's school career, such as rejection and victimization by peers (Guay, Boivin and Hodges, 1999). Understandably, considerable importance must be assigned to ensuring that children are thoroughly prepared when they begin school. Still, appropriately adapting prevention programs requires a thorough knowledge of the origins and the risk factors of school adjustment problems, as well as the mechanisms by which they develop. Studying the relationships among psychosocial risk factors, school readiness, and school success thus takes on indisputable importance.
The main objective of this fascicle is to examine the predictive association between school readiness and school performance at the beginning of primary school. To this end, we will use two measures of school readiness: the Early Development Instrument (EDI) (Janus and Offord, 2007), based on teacher ratings of the degree of pupil readiness, and the Lollipop Test (Chew, 1989), which is intended to evaluate certain kinds of core knowledge and basic cognitive aptitudes directly with child subjects. A secondary objective consists of verifying whether the EDI, which is widely used across Canada (Janus and Offord, 2000), is comparable to the Lollipop for predicting children's performance in school. We will also be seeking to identify the predictive capability of these two evaluation tools, once we have considered other language and cognitive measures that are frequently used to predict school performance, namely, the Peabody Picture Vocabulary Test – Revised (PPVT - R) (Dunn, Thériault-Whalen and Dunn, 1993) and the Block Design subtest taken from the Wechsler Preschool and Primary Scale of Intelligence – Revised (WPPSI-R; Wechsler, 1989). Finally, we will be
Success starts in grade 1: The importance of school readiness
Volume 4, Fascicle 2, December 2007 - Page 2
Evaluating school readiness levels in kindergarten and school performance in grade 1
taking a look at the relationships among the socioeconomic environments in which the children grew up, their school readiness levels, and their academic performance in grade 1.
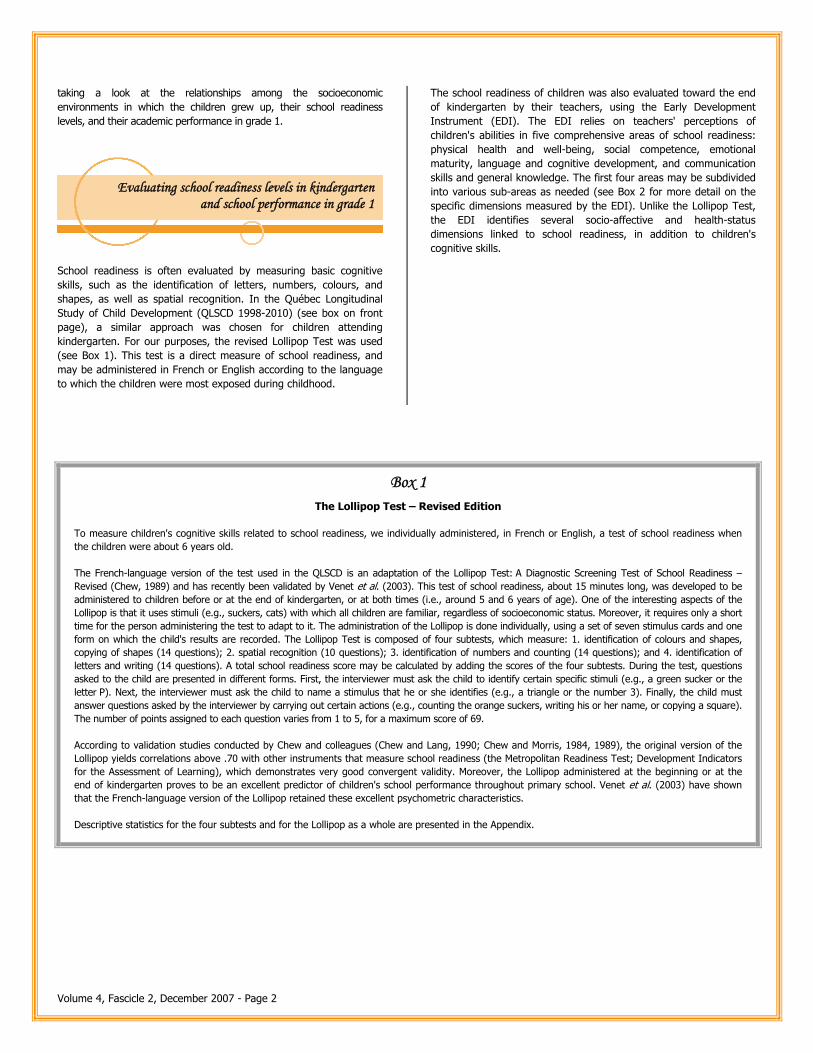
School readiness is often evaluated by measuring basic cognitive skills, such as the identification of letters, numbers, colours, and shapes, as well as spatial recognition. In the Québec Longitudinal Study of Child Development (QLSCD 1998-2010) (see box on front page), a similar approach was chosen for children attending kindergarten. For our purposes, the revised Lollipop Test was used (see Box 1). This test is a direct measure of school readiness, and may be administered in French or English according to the language to which the children were most exposed during childhood.
The school readiness of children was also evaluated toward the end of kindergarten by their teachers, using the Early Development Instrument (EDI). The EDI relies on teachers' perceptions of children's abilities in five comprehensive areas of school readiness: physical health and well-being, social competence, emotional maturity, language and cognitive development, and communication skills and general knowledge. The first four areas may be subdivided into various sub-areas as needed (see Box 2 for more detail on the specific dimensions measured by the EDI). Unlike the Lollipop Test, the EDI identifies several socio-affective and health-status dimensions linked to school readiness, in addition to children's cognitive skills.
Box 1 The Lollipop Test – Revised Edition
To measure children's cognitive skills related to school readiness, we individually administered, in French or English, a test of school readiness when the children were about 6 years old. The French-language version of the test used in the QLSCD is an adaptation of the Lollipop Test: A Diagnostic Screening Test of School Readiness – Revised (Chew, 1989) and has recently been validated by Venet et al. (2003). This test of school readiness, about 15 minutes long, was developed to be administered to children before or at the end of kindergarten, or at both times (i.e., around 5 and 6 years of age). One of the interesting aspects of the Lollipop is that it uses stimuli (e.g., suckers, cats) with which all children are familiar, regardless of socioeconomic status. Moreover, it requires only a short time for the person administering the test to adapt to it. The administration of the Lollipop is done individually, using a set of seven stimulus cards and one form on which the child's results are recorded. The Lollipop Test is composed of four subtests, which measure: 1. identification of colours and shapes, copying of shapes (14 questions); 2. spatial recognition (10 questions); 3. identification of numbers and counting (14 questions); and 4. identification of letters and writing (14 questions). A total school readiness score may be calculated by adding the scores of the four subtests. During the test, questions asked to the child are presented in different forms. First, the interviewer must ask the child to identify certain specific stimuli (e.g., a green sucker or the letter P). Next, the interviewer must ask the child to name a stimulus that he or she identifies (e.g., a triangle or the number 3). Finally, the child must answer questions asked by the interviewer by carrying out certain actions (e.g., counting the orange suckers, writing his or her name, or copying a square). The number of points assigned to each question varies from 1 to 5, for a maximum score of 69. According to validation studies conducted by Chew and colleagues (Chew and Lang, 1990; Chew and Morris, 1984, 1989), the original version of the Lollipop yields correlations above .70 with other instruments that measure school readiness (the Metropolitan Readiness Test; Development Indicators for the Assessment of Learning), which demonstrates very good convergent validity. Moreover, the Lollipop administered at the beginning or at the end of kindergarten proves to be an excellent predictor of children's school performance throughout primary school. Venet et al. (2003) have shown that the French-language version of the Lollipop retained these excellent psychometric characteristics. Descriptive statistics for the four subtests and for the Lollipop as a whole are presented in the Appendix.
Volume 4, Fascicle 2, December 2007 - Page 3
Box 2 Early Development Instrument – EDI
The EDI (Janus and Offord, 2007) is a questionnaire containing 104 items that was developed to obtain an evaluation of children's readiness for school from their teachers. In the QLSCD, an abridged version of 94 items was used. The EDI measures five areas of school readiness: physical health and well-being; social competence; emotional maturity; language and cognitive development; and communication skills and general knowledge. The first four areas include 15 sub-areas: physical health and well-being is subdivided into three sub-areas (gross and fine motor skills; physical readiness for school day; physical independence); social competence includes four sub-areas (responsibility and respect; approaches to learning; overall social competence; readiness to explore new things); emotional maturity is composed of four sub-areas (prosocial behaviour; hyperactivity and inattention; anxious and fearful behaviour; aggressive behaviour); and finally, language and cognitive development may also be subdivided into four sub-areas (basic numeracy; basic literacy; advanced literacy; interest in literacy/numeracy and capacity to memorize). The communication skills and general knowledge area measures children’s skills such as the ability to tell a story, to communicate needs to an adult or to peers, and to use their native language effectively. EDI items are evaluated on various scales: some appear in a yes/no format and others are evaluated on Likert-type scales of three or five points. Following the recommendations of Janus and Offord (2007), the items are then recoded on a scale of 0 to 10. This allows combining the items in order to calculate overall scores for all five areas. The original EDI was developed in English. The French-language version was obtained by using an inverse-translation procedure (see Vallerand, 1989). Descriptive statistics for the five EDI scales are presented in the Appendix.
In addition to these measures, the QLSCD has collected information on the quality of receptive vocabulary and on non-verbal cognitive skills among participating children, at the end of kindergarten. These areas were evaluated with the help of the Peabody Picture Vocabulary Test – Revised (PPVT - R) and the Block Design subtest of the Wechsler Preschool and Primary Scale of Intelligence – Revised (WPPSI-R) (see Box 3 for a more detailed description of the PPVT - R and the Block Design subtest). These two instruments are often used as indicators of the level of school readiness and as
predictors of later academic performance. Yet they identify only very general factors of school readiness and cannot account for its multidimensional nature. In this fascicle, receptive vocabulary and non-verbal cognitive skills will nevertheless be taken into account in order to clarify the predictive power of the two instruments (EDI and Lollipop) we used to measure early school readiness. We might add here that school performance in reading, writing, and arithmetic was rated by teachers at the end of grade 1 (see Box 4).
Box 3 The PPVT – R and the Block Design subtest
Peabody Picture Vocabulary Test – Revised (PPVT - R)
The PPVT - R (Dunn, Thériault-Whalen and Dunn, 1993), given individually in English or in French, measures receptive vocabulary in children (see Desrosiers and Ducharme, 2006). This is a test that is frequently used in research and in clinical settings, and that, in earlier studies, served as both predictive variable and school performance measure (La Paro and Pianta, 2000). In this test, the child must identify the picture that corresponds to the word the interviewer pronounces by choosing from among four pictures. The test includes 170 groups of pictures in increasing order of difficulty. The total score corresponds to the sum of correct answers given by the child before an end-of-test criterion is reached. Block Design subtest of the Wechsler Preschool and Primary Scale of Intelligence – Revised (WPPSI-R) (Wechsler, 1989)
This subtest from the non-verbal scale of the WPPSI-R measures a child's non-verbal cognitive skills. Among all the subtests of this scale, it is the one that correlates the most strongly with the overall IQ score. The subtest is composed of 14 models that the child must copy using blocks. The test is halted after three consecutive failures. Bonus points may be obtained for rapid completion. Raw scores vary from 0 to 42. The raw scores are then converted into (standardized) weighted scores based on the exact age of the child.
Volume 4, Fascicle 2, December 2007 - Page 4
Girls start school better prepared than boys2
12.6413.22 12.94
13.82 14.22 14.03
15.75 16.06 15.91
13.79
15.2114.52
0
5
10
15
20
25
Boys Girls Total
Subtest 1 – Identification of
colours and shapes, copying of shapes
Subtest 2 –Spatial recognition
Subtest 3 – Identification of numbers and
counting
Subtest 4 – Identification of
letters and writing
Mea
nsc
ore
8.668.97 8.82
8.108.79
8.45
7.05
7.927.50 7.42
7.96 7.70 7.658.19
7.93
0
2
4
6
8
10
12Boys Girls Total
Physical healthand well-being
Socialcompetence
Emotional maturity
Language and cognitive
development
Communication skills and general
knowledge
Mea
nsc
ore
Box 4 Measuring school performance in grade 1
School performance was assessed using teacher ratings of children’s performance in three categories (reading, writing, and mathematics). For each of these categories, teachers had to compare this performance of each child to the average performance of his/her schoolmates on a 5-point Likert scale, where 1 indicated "Clearly under average", 3 indicated "Average", and 5 indicated "Clearly above average". A total school performance score was used in the analyses by calculating the average of the three evaluations. This method of school performance evaluation has been recognized as valid and highly correlated with other types of school performance measures, such as report cards (Mattanah et al., 2005; Vitaro et al., 2001; Walker et al., 2004). Descriptive statistics for school performance are presented in the Appendix.
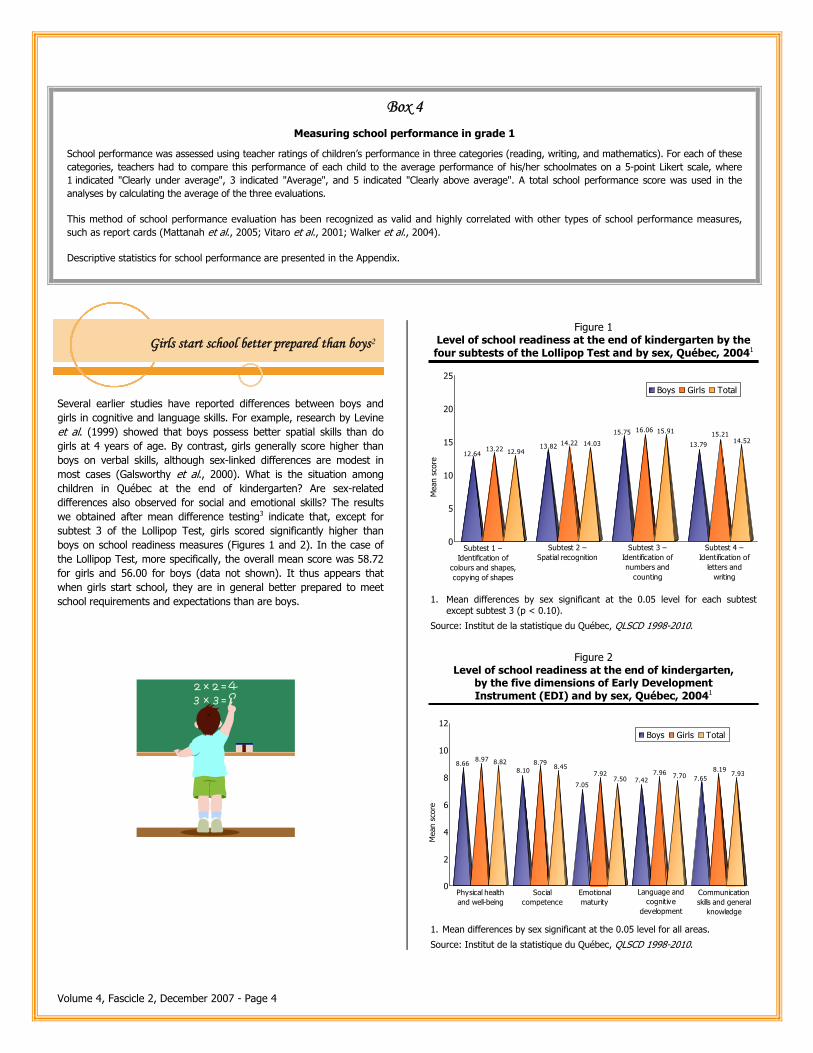
Several earlier studies have reported differences between boys and girls in cognitive and language skills. For example, research by Levine et al. (1999) showed that boys possess better spatial skills than do girls at 4 years of age. By contrast, girls generally score higher than boys on verbal skills, although sex-linked differences are modest in most cases (Galsworthy et al., 2000). What is the situation among children in Québec at the end of kindergarten? Are sex-related differences also observed for social and emotional skills? The results we obtained after mean difference testing3 indicate that, except for subtest 3 of the Lollipop Test, girls scored significantly higher than boys on school readiness measures (Figures 1 and 2). In the case of the Lollipop Test, more specifically, the overall mean score was 58.72 for girls and 56.00 for boys (data not shown). It thus appears that when girls start school, they are in general better prepared to meet school requirements and expectations than are boys.
Figure 1 Level of school readiness at the end of kindergarten by the four subtests of the Lollipop Test and by sex, Québec, 20041
1. Mean differences by sex significant at the 0.05 level for each subtest except subtest 3 (p < 0.10).
Source: Institut de la statistique du Québec, QLSCD 1998-2010.
Figure 2 Level of school readiness at the end of kindergarten,
by the five dimensions of Early Development Instrument (EDI) and by sex, Québec, 20041
1. Mean differences by sex significant at the 0.05 level for all areas.
Source: Institut de la statistique du Québec, QLSCD 1998-2010.
Volume 4, Fascicle 2, December 2007 - Page 5
School readiness level is associated with school performance in grade 1
The social and emotional
dimensions of school readiness did not
appear to be linked in any significant way to grade-1
school performance.
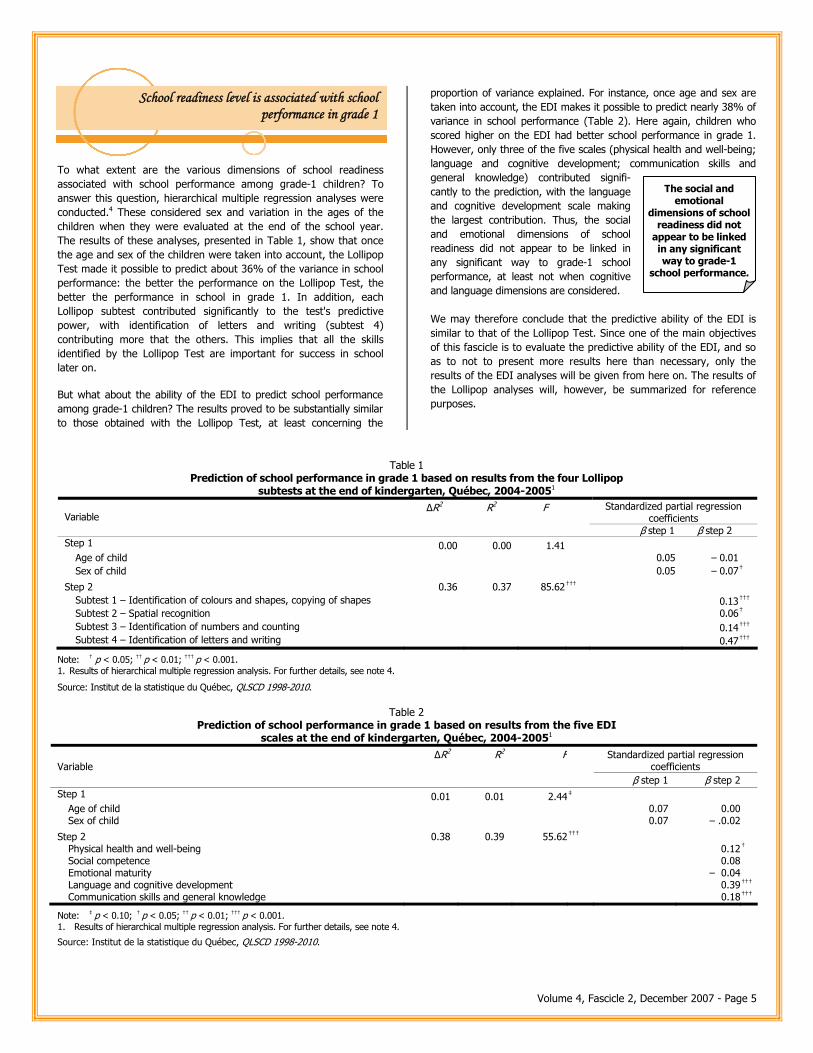
To what extent are the various dimensions of school readiness associated with school performance among grade-1 children? To answer this question, hierarchical multiple regression analyses were conducted.4 These considered sex and variation in the ages of the children when they were evaluated at the end of the school year. The results of these analyses, presented in Table 1, show that once the age and sex of the children were taken into account, the Lollipop Test made it possible to predict about 36% of the variance in school performance: the better the performance on the Lollipop Test, the better the performance in school in grade 1. In addition, each Lollipop subtest contributed significantly to the test's predictive power, with identification of letters and writing (subtest 4) contributing more that the others. This implies that all the skills identified by the Lollipop Test are important for success in school later on. But what about the ability of the EDI to predict school performance among grade-1 children? The results proved to be substantially similar to those obtained with the Lollipop Test, at least concerning the
proportion of variance explained. For instance, once age and sex are taken into account, the EDI makes it possible to predict nearly 38% of variance in school performance (Table 2). Here again, children who scored higher on the EDI had better school performance in grade 1. However, only three of the five scales (physical health and well-being; language and cognitive development; communication skills and general knowledge) contributed signifi-cantly to the prediction, with the language and cognitive development scale making the largest contribution. Thus, the social and emotional dimensions of school readiness did not appear to be linked in any significant way to grade-1 school performance, at least not when cognitive and language dimensions are considered. We may therefore conclude that the predictive ability of the EDI is similar to that of the Lollipop Test. Since one of the main objectives of this fascicle is to evaluate the predictive ability of the EDI, and so as to not to present more results here than necessary, only the results of the EDI analyses will be given from here on. The results of the Lollipop analyses will, however, be summarized for reference purposes.
Table 1 Prediction of school performance in grade 1 based on results from the four Lollipop
subtests at the end of kindergarten, Québec, 2004-20051 Standardized partial regression
coefficients Variable ΔR2 R2 F
β step 1 β step 2 Step 1 0.00 0.00 1.41
Age of child 0.05 – 0.01 Sex of child 0.05 – 0.07†
Step 2 0.36 0.37 85.62††† Subtest 1 – Identification of colours and shapes, copying of shapes 0.13††† Subtest 2 – Spatial recognition 0.06† Subtest 3 – Identification of numbers and counting 0.14††† Subtest 4 – Identification of letters and writing 0.47†††
Note: † p < 0.05; †† p < 0.01; ††† p < 0.001. 1. Results of hierarchical multiple regression analysis. For further details, see note 4.
Source: Institut de la statistique du Québec, QLSCD 1998-2010.
Table 2 Prediction of school performance in grade 1 based on results from the five EDI
scales at the end of kindergarten, Québec, 2004-20051
Standardized partial regression coefficients Variable
ΔR2 R2 F
β step 1 β step 2 Step 1 0.01 0.01 2.44‡
Age of child 0.07 0.00 Sex of child 0.07 – .0.02
Step 2 0.38 0.39 55.62††† Physical health and well-being 0.12† Social competence 0.08 Emotional maturity – 0.04 Language and cognitive development 0.39††† Communication skills and general knowledge 0.18†††
Note: ‡ p < 0.10; † p < 0.05; †† p < 0.01; ††† p < 0.001. 1. Results of hierarchical multiple regression analysis. For further details, see note 4.
Source: Institut de la statistique du Québec, QLSCD 1998-2010.
Volume 4, Fascicle 2, December 2007 - Page 6
The level of school readiness predicts school performance over and above non-verbal cognitive skills or language abilities
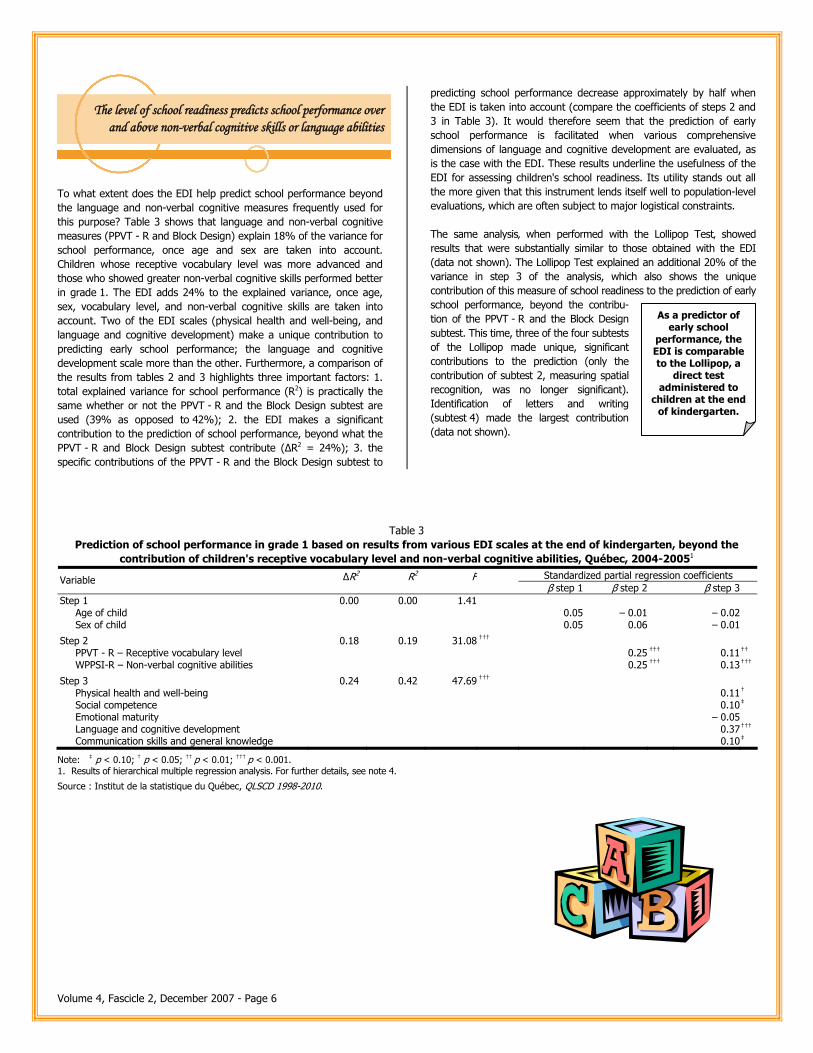
To what extent does the EDI help predict school performance beyond the language and non-verbal cognitive measures frequently used for this purpose? Table 3 shows that language and non-verbal cognitive measures (PPVT - R and Block Design) explain 18% of the variance for school performance, once age and sex are taken into account. Children whose receptive vocabulary level was more advanced and those who showed greater non-verbal cognitive skills performed better in grade 1. The EDI adds 24% to the explained variance, once age, sex, vocabulary level, and non-verbal cognitive skills are taken into account. Two of the EDI scales (physical health and well-being, and language and cognitive development) make a unique contribution to predicting early school performance; the language and cognitive development scale more than the other. Furthermore, a comparison of the results from tables 2 and 3 highlights three important factors: 1. total explained variance for school performance (R2) is practically the same whether or not the PPVT - R and the Block Design subtest are used (39% as opposed to 42%); 2. the EDI makes a significant contribution to the prediction of school performance, beyond what the PPVT - R and Block Design subtest contribute (ΔR2 = 24%); 3. the specific contributions of the PPVT - R and the Block Design subtest to
predicting school performance decrease approximately by half when the EDI is taken into account (compare the coefficients of steps 2 and 3 in Table 3). It would therefore seem that the prediction of early school performance is facilitated when various comprehensive dimensions of language and cognitive development are evaluated, as is the case with the EDI. These results underline the usefulness of the EDI for assessing children's school readiness. Its utility stands out all the more given that this instrument lends itself well to population-level evaluations, which are often subject to major logistical constraints. The same analysis‚ when performed with the Lollipop Test‚ showed results that were substantially similar to those obtained with the EDI (data not shown). The Lollipop Test explained an additional 20% of the variance in step 3 of the analysis, which also shows the unique contribution of this measure of school readiness to the prediction of early school performance, beyond the contribu-tion of the PPVT - R and the Block Design subtest. This time, three of the four subtests of the Lollipop made unique, significant contributions to the prediction (only the contribution of subtest 2, measuring spatial recognition, was no longer significant). Identification of letters and writing (subtest 4) made the largest contribution (data not shown).
Table 3 Prediction of school performance in grade 1 based on results from various EDI scales at the end of kindergarten, beyond the
contribution of children's receptive vocabulary level and non-verbal cognitive abilities, Québec, 2004-20051 Standardized partial regression coefficients Variable ΔR2 R2 F β step 1 β step 2 β step 3
Step 1 0.00 0.00 1.41 Age of child 0.05 – 0.01 – 0.02 Sex of child 0.05 0.06 – 0.01
Step 2 0.18 0.19 31.08 ††† PPVT - R – Receptive vocabulary level 0.25 ††† 0.11†† WPPSI-R – Non-verbal cognitive abilities 0.25 ††† 0.13†††
Step 3 0.24 0.42 47.69 ††† Physical health and well-being 0.11† Social competence 0.10‡ Emotional maturity – 0.05 Language and cognitive development 0.37††† Communication skills and general knowledge 0.10‡
Note: ‡ p < 0.10; † p < 0.05; †† p < 0.01; ††† p < 0.001. 1. Results of hierarchical multiple regression analysis. For further details, see note 4.
Source : Institut de la statistique du Québec, QLSCD 1998-2010.
As a predictor of early school
performance, the EDI is comparable to the Lollipop, a
direct test administered to
children at the end of kindergarten.
Volume 4, Fascicle 2, December 2007 - Page 7
School readiness levels vary according to socioeconomic setting
6.987.44
7.798.13
0
1
2
3
4
5
6
7
8
9
No HSD HSD PSD UD
Maternal educational attainment2
Mea
nsc
ore
a,bc
a,db,c,d
7.87
6.99
0
1
2
3
4
5
6
7
8
9
10
No Yes
Low-income household
Mea
nsc
ore
2.77
3.373.53
3.80
0
1
2
3
4
No HSD HSD PSD UD
Maternal educational attainment3
a,b,c
a,db,e
c,d,e
Mea
nsc
ore
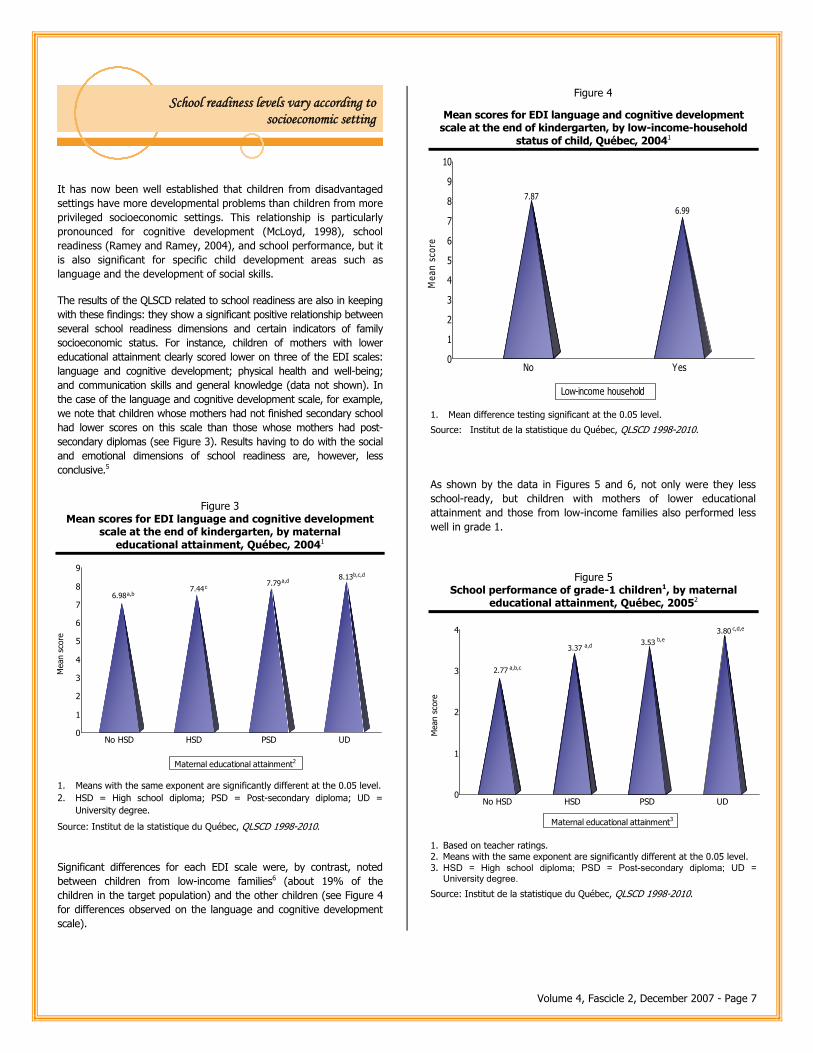
It has now been well established that children from disadvantaged settings have more developmental problems than children from more privileged socioeconomic settings. This relationship is particularly pronounced for cognitive development (McLoyd, 1998), school readiness (Ramey and Ramey, 2004), and school performance, but it is also significant for specific child development areas such as language and the development of social skills. The results of the QLSCD related to school readiness are also in keeping with these findings: they show a significant positive relationship between several school readiness dimensions and certain indicators of family socioeconomic status. For instance, children of mothers with lower educational attainment clearly scored lower on three of the EDI scales: language and cognitive development; physical health and well-being; and communication skills and general knowledge (data not shown). In the case of the language and cognitive development scale, for example, we note that children whose mothers had not finished secondary school had lower scores on this scale than those whose mothers had post-secondary diplomas (see Figure 3). Results having to do with the social and emotional dimensions of school readiness are, however, less conclusive.5
Figure 3 Mean scores for EDI language and cognitive development
scale at the end of kindergarten, by maternal educational attainment, Québec, 20041
1. Means with the same exponent are significantly different at the 0.05 level. 2. HSD = High school diploma; PSD = Post-secondary diploma; UD =
University degree.
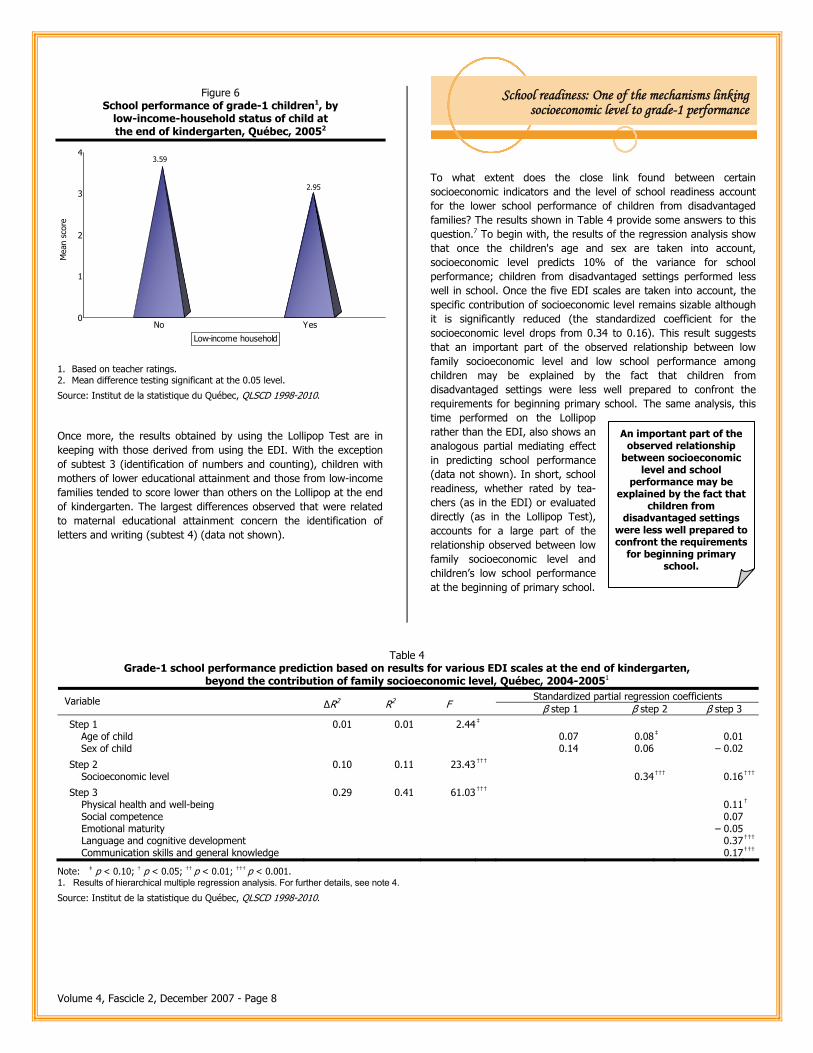
Source: Institut de la statistique du Québec, QLSCD 1998-2010. Significant differences for each EDI scale were, by contrast, noted between children from low-income families6 (about 19% of the children in the target population) and the other children (see Figure 4 for differences observed on the language and cognitive development scale).
Figure 4
Mean scores for EDI language and cognitive development scale at the end of kindergarten, by low-income-household
status of child, Québec, 20041
1. Mean difference testing significant at the 0.05 level.
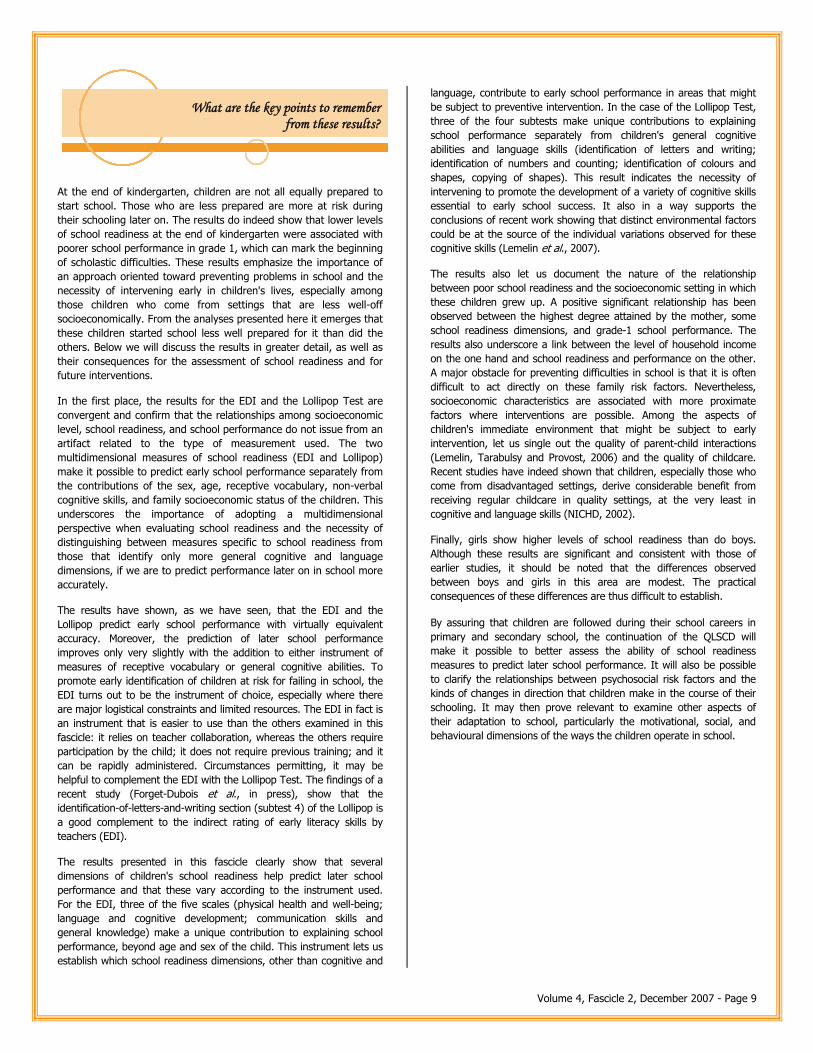
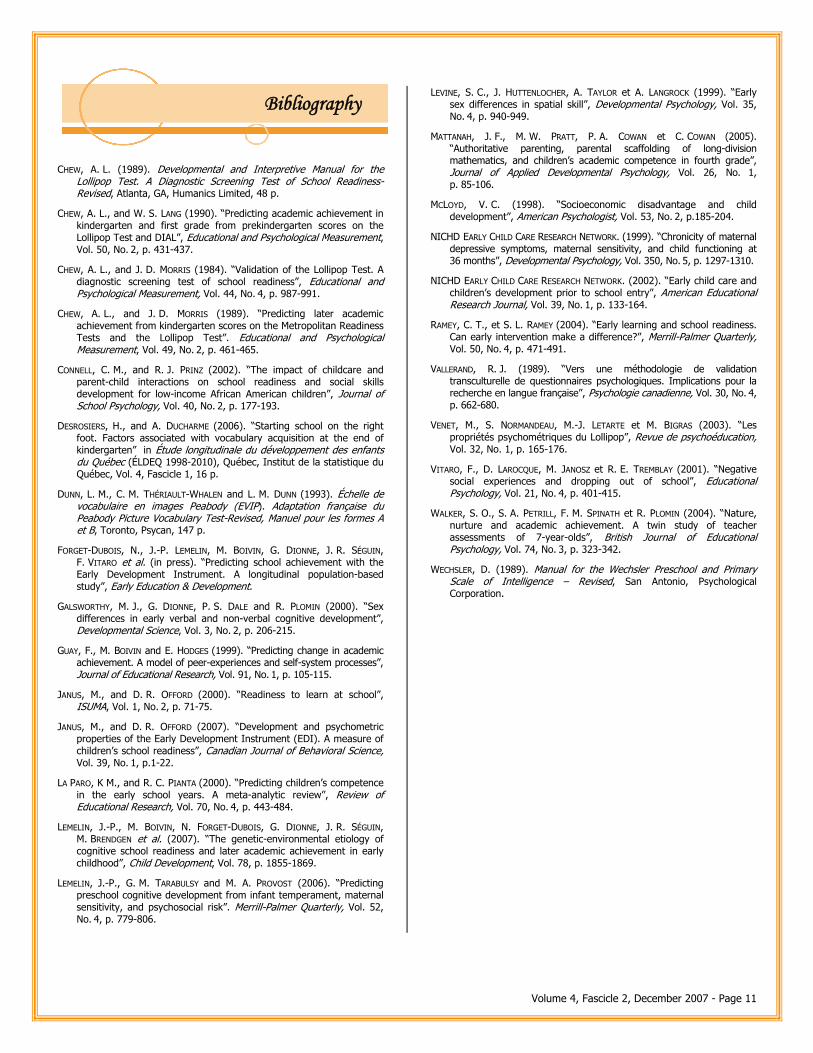
Source: Institut de la statistique du Québec, QLSCD 1998-2010. As shown by the data in Figures 5 and 6, not only were they less school-ready, but children with mothers of lower educational attainment and those from low-income families also performed less well in grade 1.
Figure 5 School performance of grade-1 children1, by maternal
educational attainment, Québec, 20052
1. Based on teacher ratings. 2. Means with the same exponent are significantly different at the 0.05 level. 3. HSD = High school diploma; PSD = Post-secondary diploma; UD =
University degree. Source: Institut de la statistique du Québec, QLSCD 1998-2010.
Volume 4, Fascicle 2, December 2007 - Page 8
School readiness: One of the mechanisms linking socioeconomic level to grade-1 performance
3.59
2.95
0
1
2
3
4
No Yes
Low-income household
Mea
nsc
ore
Figure 6 School performance of grade-1 children1, by
low-income-household status of child at the end of kindergarten, Québec, 20052
1. Based on teacher ratings. 2. Mean difference testing significant at the 0.05 level.
Source: Institut de la statistique du Québec, QLSCD 1998-2010. Once more, the results obtained by using the Lollipop Test are in keeping with those derived from using the EDI. With the exception of subtest 3 (identification of numbers and counting), children with mothers of lower educational attainment and those from low-income families tended to score lower than others on the Lollipop at the end of kindergarten. The largest differences observed that were related to maternal educational attainment concern the identification of letters and writing (subtest 4) (data not shown).
To what extent does the close link found between certain socioeconomic indicators and the level of school readiness account for the lower school performance of children from disadvantaged families? The results shown in Table 4 provide some answers to this question.7 To begin with, the results of the regression analysis show that once the children's age and sex are taken into account, socioeconomic level predicts 10% of the variance for school performance; children from disadvantaged settings performed less well in school. Once the five EDI scales are taken into account, the specific contribution of socioeconomic level remains sizable although it is significantly reduced (the standardized coefficient for the socioeconomic level drops from 0.34 to 0.16). This result suggests that an important part of the observed relationship between low family socioeconomic level and low school performance among children may be explained by the fact that children from disadvantaged settings were less well prepared to confront the requirements for beginning primary school. The same analysis, this time performed on the Lollipop rather than the EDI, also shows an analogous partial mediating effect in predicting school performance (data not shown). In short, school readiness, whether rated by tea-chers (as in the EDI) or evaluated directly (as in the Lollipop Test), accounts for a large part of the relationship observed between low family socioeconomic level and children’s low school performance at the beginning of primary school.
Table 4 Grade-1 school performance prediction based on results for various EDI scales at the end of kindergarten,
beyond the contribution of family socioeconomic level, Québec, 2004-20051 Standardized partial regression coefficients Variable ΔR2 R2 F β step 1 β step 2 β step 3
Step 1 0.01 0.01 2.44‡ Age of child 0.07 0.08‡ 0.01 Sex of child 0.14 0.06 – 0.02
Step 2 0.10 0.11 23.43††† Socioeconomic level 0.34††† 0.16†††
Step 3 0.29 0.41 61.03††† Physical health and well-being 0.11† Social competence 0.07 Emotional maturity – 0.05 Language and cognitive development 0.37†††
Communication skills and general knowledge 0.17†††
Note: ‡ p < 0.10; † p < 0.05; †† p < 0.01; ††† p < 0.001. 1. Results of hierarchical multiple regression analysis. For further details, see note 4. Source: Institut de la statistique du Québec, QLSCD 1998-2010.
An important part of the observed relationship
between socioeconomic level and school
performance may be explained by the fact that
children from disadvantaged settings
were less well prepared to confront the requirements
for beginning primary school.
Volume 4, Fascicle 2, December 2007 - Page 9
What are the key points to remember from these results?
At the end of kindergarten, children are not all equally prepared to start school. Those who are less prepared are more at risk during their schooling later on. The results do indeed show that lower levels of school readiness at the end of kindergarten were associated with poorer school performance in grade 1, which can mark the beginning of scholastic difficulties. These results emphasize the importance of an approach oriented toward preventing problems in school and the necessity of intervening early in children's lives, especially among those children who come from settings that are less well-off socioeconomically. From the analyses presented here it emerges that these children started school less well prepared for it than did the others. Below we will discuss the results in greater detail, as well as their consequences for the assessment of school readiness and for future interventions.
In the first place, the results for the EDI and the Lollipop Test are convergent and confirm that the relationships among socioeconomic level, school readiness, and school performance do not issue from an artifact related to the type of measurement used. The two multidimensional measures of school readiness (EDI and Lollipop) make it possible to predict early school performance separately from the contributions of the sex, age, receptive vocabulary, non-verbal cognitive skills, and family socioeconomic status of the children. This underscores the importance of adopting a multidimensional perspective when evaluating school readiness and the necessity of distinguishing between measures specific to school readiness from those that identify only more general cognitive and language dimensions, if we are to predict performance later on in school more accurately.
The results have shown, as we have seen, that the EDI and the Lollipop predict early school performance with virtually equivalent accuracy. Moreover, the prediction of later school performance improves only very slightly with the addition to either instrument of measures of receptive vocabulary or general cognitive abilities. To promote early identification of children at risk for failing in school, the EDI turns out to be the instrument of choice, especially where there are major logistical constraints and limited resources. The EDI in fact is an instrument that is easier to use than the others examined in this fascicle: it relies on teacher collaboration, whereas the others require participation by the child; it does not require previous training; and it can be rapidly administered. Circumstances permitting, it may be helpful to complement the EDI with the Lollipop Test. The findings of a recent study (Forget-Dubois et al., in press), show that the identification-of-letters-and-writing section (subtest 4) of the Lollipop is a good complement to the indirect rating of early literacy skills by teachers (EDI).
The results presented in this fascicle clearly show that several dimensions of children's school readiness help predict later school performance and that these vary according to the instrument used. For the EDI, three of the five scales (physical health and well-being; language and cognitive development; communication skills and general knowledge) make a unique contribution to explaining school performance, beyond age and sex of the child. This instrument lets us establish which school readiness dimensions, other than cognitive and
language, contribute to early school performance in areas that might be subject to preventive intervention. In the case of the Lollipop Test, three of the four subtests make unique contributions to explaining school performance separately from children's general cognitive abilities and language skills (identification of letters and writing; identification of numbers and counting; identification of colours and shapes, copying of shapes). This result indicates the necessity of intervening to promote the development of a variety of cognitive skills essential to early school success. It also in a way supports the conclusions of recent work showing that distinct environmental factors could be at the source of the individual variations observed for these cognitive skills (Lemelin et al., 2007).
The results also let us document the nature of the relationship between poor school readiness and the socioeconomic setting in which these children grew up. A positive significant relationship has been observed between the highest degree attained by the mother, some school readiness dimensions, and grade-1 school performance. The results also underscore a link between the level of household income on the one hand and school readiness and performance on the other. A major obstacle for preventing difficulties in school is that it is often difficult to act directly on these family risk factors. Nevertheless, socioeconomic characteristics are associated with more proximate factors where interventions are possible. Among the aspects of children's immediate environment that might be subject to early intervention, let us single out the quality of parent-child interactions (Lemelin, Tarabulsy and Provost, 2006) and the quality of childcare. Recent studies have indeed shown that children, especially those who come from disadvantaged settings, derive considerable benefit from receiving regular childcare in quality settings, at the very least in cognitive and language skills (NICHD, 2002).
Finally, girls show higher levels of school readiness than do boys. Although these results are significant and consistent with those of earlier studies, it should be noted that the differences observed between boys and girls in this area are modest. The practical consequences of these differences are thus difficult to establish. By assuring that children are followed during their school careers in primary and secondary school, the continuation of the QLSCD will make it possible to better assess the ability of school readiness measures to predict later school performance. It will also be possible to clarify the relationships between psychosocial risk factors and the kinds of changes in direction that children make in the course of their schooling. It may then prove relevant to examine other aspects of their adaptation to school, particularly the motivational, social, and behavioural dimensions of the ways the children operate in school.

Volume 4, Fascicle 2, December 2007 - Page 10
Appendix
Notes
Table A.1 Descriptive statistics pertaining to school readiness and school performance variables, Québec, 2004-2005
n1 Mean Standard Error Minimum Maximum School performance 1302 3.47 0.04 1 5
Total score – Lollipop 1195 57.39 0.28 17 69 Subtest 1 – Identification of colours and shapes, copying of shapes 1195 12.94 0.07 5 17 Subtest 2 – Spatial recognition 1196 14.03 0.08 3 17 Subtest 3 – Identification of numbers and counting 1195 15.91 0.07 2 17 Subtest 4 – Identification of letters and writing 1195 14.52 0.16 0 18
Early Development Instrument (EDI) Physical health and well-being 964 8.82 0.04 3.13 10 Social competence 963 8.45 0.06 1 10 Emotional maturity 964 7.50 0.06 1.98 10 Language and cognitive development 953 7.70 0.07 0.88 10 Communication skills and general knowledge 963 7.93 0.07 0.63 10
1. Unweighted.
Source: Institut de la statistique du Québec, QLSCD 1998-2010.
1. Jean-Pascal Lemelin and Michel Boivin are, respectively, a postdoctoral researcher and a full professor in the School of Psychology at Laval University. They are also members of the Groupe de recherche sur l’inadaptation psychosociale chez l’enfant (GRIP, or the Research Unit on Children's Psychosocial Maladjustment). The production of this fascicle was made possible by a postdoctoral fellowship awarded to Jean-Pascal Lemelin by the Social Sciences and Humanities Research Council (SSHRC).
2. All data presented in this fascicle are weighted and accordingly have been adjusted in such a way as to allow generalizing results to the children making up the target population of the QLSCD. Our estimates, moreover, took into account the complex sample design of the survey.
3. Data for most of the scales presented in this fascicle do not fit the normal distribution. Here and later on in this report, when mean difference testing is applied, association tests have been done using the chi-square test to confirm results, by categorizing the scaled variables into three relatively equal categories (terciles). The analyses generally confirmed the results obtained through mean difference testing. In those cases where a chi-square test result is significant at the 0.10 level instead of at the 0.05 level, we have elected to call it a tendency.
4. This kind of analysis is designed to determine whether a particular variable (or group of variables) can explain a significant portion of the variance in the dependent variable, which in this case is school performance in grade 1. In Tables 1 through 4 of this fascicle, ΔR2 may be interpreted as the proportion of the variation in the dependent variable explained by the variables for each step, whereas R2 represents the proportion of the variance explained by all steps together. The statistic F determines the statistical significance of the model being considered. The betas or standardized partial regression coefficients were independent of the scale of measurement. They indicate the relative contribution of the variables to the prediction.
5. Results for chi-square tests performed on these scales, as complements to mean difference testing, did not prove significant at the 0.10 level (see note 3).
6. According to pre-tax low-income cut-offs established by Statistics Canada by size of family and size of residential region for 2003.
7. Here we have chosen to use a composite measure of family socioeconomic status as an index of psychosocial risk for analyzing mediating effects for two reasons: 1. It is an index derived from a set of sociodemographic variables (i.e., household income, education level, and the prestige of parental occupations) that reflect psychosocial risk levels; 2. Mediation analyses require using continuous quantitative variables, which is not the case for the other indicators examined earlier (maternal educational attainment and household income level). For more information about how this index was constructed, refer to the technical documentation on the web site of the QLSCD at: www.jesuisjeserai.stat.gouv.qc.ca/pdf/doc_tech/volet_2006/E9Variables_deriveesE1_E9.pdf.
Volume 4, Fascicle 2, December 2007 - Page 11
Bibliography CHEW, A. L. (1989). Developmental and Interpretive Manual for the
Lollipop Test. A Diagnostic Screening Test of School Readiness-Revised, Atlanta, GA, Humanics Limited, 48 p.
CHEW, A. L., and W. S. LANG (1990). “Predicting academic achievement in kindergarten and first grade from prekindergarten scores on the Lollipop Test and DIAL”, Educational and Psychological Measurement, Vol. 50, No. 2, p. 431-437.
CHEW, A. L., and J. D. MORRIS (1984). “Validation of the Lollipop Test. A diagnostic screening test of school readiness”, Educational and Psychological Measurement, Vol. 44, No. 4, p. 987-991.
CHEW, A. L., and J. D. MORRIS (1989). “Predicting later academic achievement from kindergarten scores on the Metropolitan Readiness Tests and the Lollipop Test”. Educational and Psychological Measurement, Vol. 49, No. 2, p. 461-465.
CONNELL, C. M., and R. J. PRINZ (2002). “The impact of childcare and parent-child interactions on school readiness and social skills development for low-income African American children”, Journal of School Psychology, Vol. 40, No. 2, p. 177-193.
DESROSIERS, H., and A. DUCHARME (2006). “Starting school on the right foot. Factors associated with vocabulary acquisition at the end of kindergarten” in Étude longitudinale du développement des enfants du Québec (ÉLDEQ 1998-2010), Québec, Institut de la statistique du Québec, Vol. 4, Fascicle 1, 16 p.
DUNN, L. M., C. M. THÉRIAULT-WHALEN and L. M. DUNN (1993). Échelle de vocabulaire en images Peabody (EVIP). Adaptation française du Peabody Picture Vocabulary Test-Revised, Manuel pour les formes A et B, Toronto, Psycan, 147 p.
FORGET-DUBOIS, N., J.-P. LEMELIN, M. BOIVIN, G. DIONNE, J. R. SÉGUIN, F. VITARO et al. (in press). “Predicting school achievement with the Early Development Instrument. A longitudinal population-based study”, Early Education & Development.
GALSWORTHY, M. J., G. DIONNE, P. S. DALE and R. PLOMIN (2000). “Sex differences in early verbal and non-verbal cognitive development”, Developmental Science, Vol. 3, No. 2, p. 206-215.
GUAY, F., M. BOIVIN and E. HODGES (1999). “Predicting change in academic achievement. A model of peer-experiences and self-system processes”, Journal of Educational Research, Vol. 91, No. 1, p. 105-115.
JANUS, M., and D. R. OFFORD (2000). “Readiness to learn at school”, ISUMA, Vol. 1, No. 2, p. 71-75.
JANUS, M., and D. R. OFFORD (2007). “Development and psychometric properties of the Early Development Instrument (EDI). A measure of children’s school readiness”, Canadian Journal of Behavioral Science, Vol. 39, No. 1, p.1-22.
LA PARO, K M., and R. C. PIANTA (2000). “Predicting children’s competence in the early school years. A meta-analytic review”, Review of Educational Research, Vol. 70, No. 4, p. 443-484.
LEMELIN, J.-P., M. BOIVIN, N. FORGET-DUBOIS, G. DIONNE, J. R. SÉGUIN, M. BRENDGEN et al. (2007). “The genetic-environmental etiology of cognitive school readiness and later academic achievement in early childhood”, Child Development, Vol. 78, p. 1855-1869.
LEMELIN, J.-P., G. M. TARABULSY and M. A. PROVOST (2006). “Predicting preschool cognitive development from infant temperament, maternal sensitivity, and psychosocial risk”. Merrill-Palmer Quarterly, Vol. 52, No. 4, p. 779-806.
LEVINE, S. C., J. HUTTENLOCHER, A. TAYLOR et A. LANGROCK (1999). “Early sex differences in spatial skill”, Developmental Psychology, Vol. 35, No. 4, p. 940-949.
MATTANAH, J. F., M. W. PRATT, P. A. COWAN et C. COWAN (2005). “Authoritative parenting, parental scaffolding of long-division mathematics, and children’s academic competence in fourth grade”, Journal of Applied Developmental Psychology, Vol. 26, No. 1, p. 85-106.
MCLOYD, V. C. (1998). “Socioeconomic disadvantage and child development”, American Psychologist, Vol. 53, No. 2, p.185-204.
NICHD EARLY CHILD CARE RESEARCH NETWORK. (1999). “Chronicity of maternal depressive symptoms, maternal sensitivity, and child functioning at 36 months”, Developmental Psychology, Vol. 350, No. 5, p. 1297-1310.
NICHD EARLY CHILD CARE RESEARCH NETWORK. (2002). “Early child care and children’s development prior to school entry”, American Educational Research Journal, Vol. 39, No. 1, p. 133-164.
RAMEY, C. T., et S. L. RAMEY (2004). “Early learning and school readiness. Can early intervention make a difference?”, Merrill-Palmer Quarterly, Vol. 50, No. 4, p. 471-491.
VALLERAND, R. J. (1989). “Vers une méthodologie de validation transculturelle de questionnaires psychologiques. Implications pour la recherche en langue française”, Psychologie canadienne, Vol. 30, No. 4, p. 662-680.
VENET, M., S. NORMANDEAU, M.-J. LETARTE et M. BIGRAS (2003). “Les propriétés psychométriques du Lollipop”, Revue de psychoéducation, Vol. 32, No. 1, p. 165-176.
VITARO, F., D. LAROCQUE, M. JANOSZ et R. E. TREMBLAY (2001). “Negative social experiences and dropping out of school”, Educational Psychology, Vol. 21, No. 4, p. 401-415.
WALKER, S. O., S. A. PETRILL, F. M. SPINATH et R. PLOMIN (2004). “Nature, nurture and academic achievement. A twin study of teacher assessments of 7-year-olds”, British Journal of Educational Psychology, Vol. 74, No. 3, p. 323-342.
WECHSLER, D. (1989). Manual for the Wechsler Preschool and Primary Scale of Intelligence – Revised, San Antonio, Psychological Corporation.

Volume 4, Fascicle 2, December 2007 - Page 12
The Québec Longitudinal Study of Child Development (QLSCD 1998-2010) is under the supervision of:
Bertrand Perron, Coordinator Richard E. Tremblay, Scientific Director
This fascicle along with other publications from the Québec Longitudinal Study of Child Development (QLSCD 1998-2010) are available on web site of the QLSCD (www.iamillbe.stat.gouv.qc.ca) by clicking on the heading button “Publications”.
The coordinator of the study may be reached at (514) 873-4749 or 1 877 677-2087 (toll free).
Suggested citation: LEMELIN, Jean-Pascal, and Michel BOIVIN (2007). “Success starts in Grade 1: The importance of school readiness”, in Québec Longitudinal Study of Child Development (QLSCD 1998-2010), Québec, Institut de la statistique du Québec, Vol. 4, Fascicle 2. With the collaboration of Nathalie Plante and Hadi Eid, Institut de la statistique du Québec. Editor: Hélène Desrosiers, Institut de la statistique du Québec. This fascicle, translated into English by Robert Sullivan, is also available in French under the title « Mieux réussir dès la première année : l'importance de la préparation à l'école », dans Étude longitudinale du développement des enfants du Québec (ÉLDEQ 1998-2010), Québec, Institut de la statistique du Québec, vol. 4, fascicule 2.
The partners and sponsors of the QLSCD 1998-2010 are:
Ministère de la Santé et des Services sociaux du Québec (MSSS) et ses organismes affiliés / Québec Ministry of Health and Social Services and its affiliated organizations
Ministère de la Famille et des Aînés (MFA) / Ministry of Families and Seniors Canadian Institutes of Health Research (CIHR) Social Sciences and Humanities Research Council of Canada (SSHRC) Fonds québécois de la recherche sur la société et la culture (FQRSC) / Québec Fund for Research on Society and
Culture Fonds québécois de la recherche sur la nature et les technologies (FQRNT) / Québec Fund for Research on Nature
and Technology Fonds de la recherche en santé du Québec (FRSQ) / Québec Health Research Fund Fondation Lucie et André Chagnon/Lucie and André Chagnon Foundation Molson Foundation Ministère du Développement économique, de l’Innovation et de l’Exportation (MDEIE), Valorisation-Recherche
Québec (VRQ)/ Ministry of Economic Development, Innovation and Export Trade Human Resources and Social Development Canada (HRSDC) Canadian Institute for Advanced Research (CIAR) Health Canada National Science Foundation (NSF, USA) Groupe de recherche sur l’inadaptation psychosociale chez l’enfant (GRIP) / Research Unit on Children’s
Psychosocial Maladjustment (Université de Montréal, Université Laval, McGill University)
© Gouvernement du Québec
ISBN 978-2-550-51419-0 (printed version) ISBN 978-2-550-51420-6 (on-line version)