Substitution of Copper - Copper Council 9 - Jacobsen.pdf · Source: Dimensions: Dubbel, Taschenbuch...
25
1 Substitution of Copper IWCC Joint Meeting 2013 Tokyo, May 13, 2013
Transcript of Substitution of Copper - Copper Council 9 - Jacobsen.pdf · Source: Dimensions: Dubbel, Taschenbuch...

1
Substitution
of Copper
IWCC Joint Meeting 2013
Tokyo, May 13, 2013

2
Legal Disclaimer IWCC Joint Meeting 2013
The purpose of this presentation is to guide programs
benefiting the copper industry and to provide attendees
with information to make independent business decisions.

3
Substitution of Copper
1. Dimensions of substitution
2. Drivers of substitution
3. Quantitative effects of
substitution
4. Applications under
substitution
5. Options for copper

4 Source: Altrogge: Investition; Wöhe; Betriebswirtschaftslehre
On an industrial scale, most substitutes or services are imperfect
A substitute
What exactly is a substitute?
» is a product or service that satisfies the need that another product or service
already fulfills
» must share at least one particular relationship with the good or service to be
substituted
» can be perfect or imperfect depending on the customer’s satisfaction
» will often stay, even if the driver of substitution has lost importance in the
meantime

5
Complementary goods:
Perfect substitute goods:
Cobb-Douglas function
Leontief function
Imperfect substitute goods:
Asymptote
Due to its unique properties, copper does not have a perfect substitute
Substitute goods or complementary goods?

6
Change in
environment
Stakeholders see substitution differently and position themselves individually
Change in
environment
Realizing Evaluating
and analyzing
Identifying
solutions Commissioning
Improving and
developing
Mines and
captive smelters
Custom
smelters
Fabricators OEMs Manufac-
turers
Consumers
In our industry, substitution takes some time

7
… by which material/system?
» Aluminum
» Plastic
» Superconductors
» Composites
» UCC/Nano composites
» Zinc
» Steel
» Silver
» Gold
» Miniaturization
… in which product group?
» Wires and cables
» Strips and foils
» Sheets and plates
» Sections and bars
» Industrial tubes
» Sanitary tubes
… for which reason?
» Price level
» Price volatility
» Physical properties
» System integration
» Regulations and
standards
» Short-term availability
» Strategic long-term
availability
» Recycling
» Image
But copper could also benefit from new applications to a certain extent
Substitution of copper
Substitution of copper is the result of many trends

8
Substitution of Copper
1. Dimensions of substitution
2. Drivers of substitution
3. Quantitative effects of
substitution
4. Applications under
substitution
5. Options for copper

9
The technical line of defense for copper is
strong, but not invincible
Cu Al Δ
Melting point tsm °C 1083 660 +64 %
Melting heat q kJ/kg 205 397 -48 %
Thermal conductivity λ W/m K 384 220 +75 %
Thermal expansion α 10-6/K 16.8 23.8 -29 %
Thermic capacity c kJ/kg K 0.383 0.896 -57 %
Electrical conductivity κ MS/m 59.1 36.7 +61 %
Density ρ kg/dm³ 8.92 2.7 +330 %
Young’s modulus E GPa 123 71 +73 %
Tensile strength Rm MPa ~235 ~75 +313 %
Elongation A % ~45 ~25 +80 %
Bending fatigue cycles - 500 300 +66 %
Creep modulus Ec GPa high low ~ 80 %
From the technical side, “only” its high density puts pressure on copper
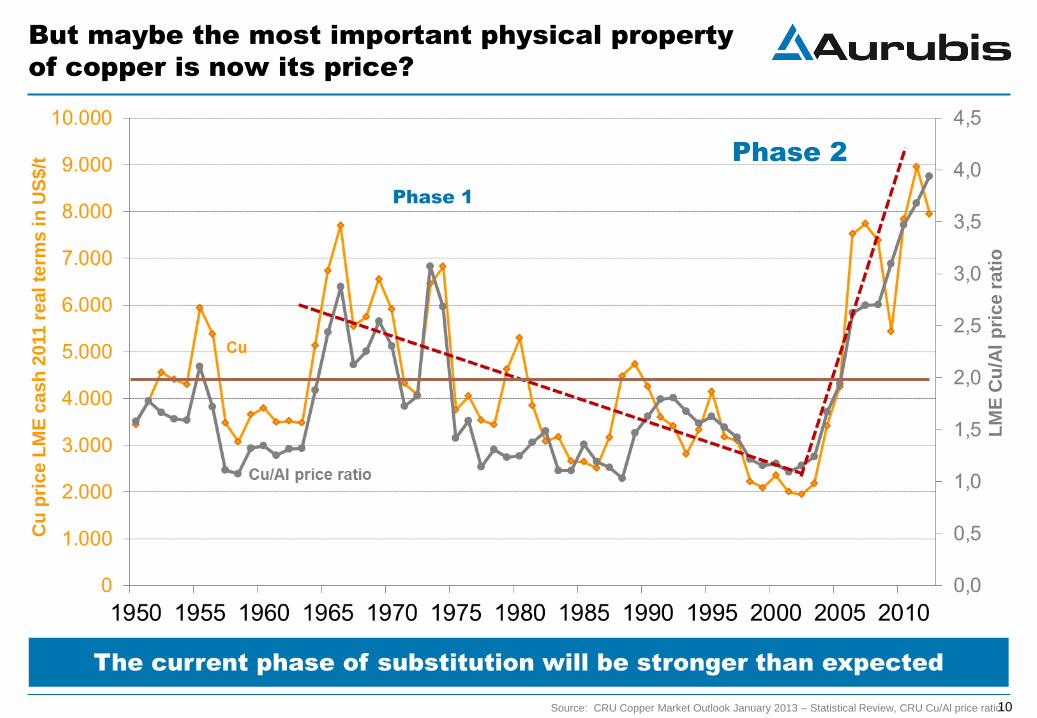
But maybe the most important physical property
of copper is now its price?
10 Source: CRU Copper Market Outlook January 2013 – Statistical Review, CRU Cu/Al price ratio
LM
E C
u/A
l p
ric
e r
ati
o
Cu
pri
ce
LM
E c
as
h 2
011
re
al te
rms
in
US
$/t
The current phase of substitution will be stronger than expected
Phase 1
Phase 2

11
Combination of price, density and conductivity pushes
the current substitution of copper by aluminum
Conductors made of copper are seven times more expensive today. Higher
costs for processing and insulating of aluminum wire do not fully compensate
Source: Dimensions: Dubbel, Taschenbuch für den Maschinenbau; Cu/Al prices: Fast Markets, March 27, 2013
Price Premium
$ 7,590/t + $ 86/t = $ 7,676/t
Value of Cu conductor: $ 10.30
Price Premium
$ 1,904/t + $ 300/t = $ 2,204/t
Value of Al conductor: $ 1.49
A = 2.5 mm²
l = 100 m
mCond = 0.675 kg
A = 1.5 mm²
l = 100 m
mCond = 1.34 kg
Example: Constant load at a current of I = 16 A, ambient temperature: T = 25 °C
Cu Al

12 Source: Scandinavian Copper Development Association, 2013
Moreover, the community is paying more attention:
Is copper antimicrobial or toxic?
» The ecolabel “Nordic Swan” defined “house criteria”: Copper roofs are not approved for
houses, apartment buildings and preschool buildings
» The new environmental program of Stockholm (Sweden, 0.9 mill. residents) does not
allow the installation of copper roofs, facades and tubes if viable alternatives exist.
» The major European landmark project “Royal Seaport” in Stockholm with
10,000 homes and 32,000 workplaces does not allow copper tubes or roofs either.
» Gothenburg (Sweden, 0.5 mill. residents) has set up a similar program setting the
standards for environmentally friendly buildings.
» Malmö (Sweden, 0.3 mill. residents) follows with programs for ecological buildings,
which do not allow the participants to install copper roofs, facades or tubes.
Even if all existing legislative limits are met, copper is facing a ban

13
Substitution of Copper
1. Dimensions of substitution
2. Drivers of substitution
3. Quantitative effects of
substitution
4. Applications under
substitution
5. Options for copper

Global refined copper output has not been
able to follow global GDP growth since 2005
14
Global production (in mill. t/y)
Copper wire rod as a dominant “first use” has developed even more weakly
Source: CRU Copper Market Outlook January 2013 World copper refinery production, CRU Wire and Cable Quarterly – Production of Copper Wire Rod 2008, 2010, 2012
CAGR refined copper: 2.9 %
CAGR copper wire rod: 2.3 % CAGR GDP growth: 3.7 %

In contrast, global refined aluminum output has
grown much more strongly
15
Since 2005 aluminum wire rod has grown five times faster than copper wire rod
Source: CRU World Primary Aluminum Production , CRU Wire and Cable Quarterly Oct 12 and Jan 13 – Production of Aluminum wirerod
CAGR refined aluminum: 5.5 %
CAGR aluminum wire rod: 10.9 % CAGR GDP growth: 3.7 %
Global production (in mill. t/y)

The cumulated substitution effect is significant
In the last 10 years the netted annual losses have added up to 4.3 mill. t/y
Source: Aurubis Intelligence, International Copper Association, Brook Hunt /Wood Mackenzie, CRU 16
Volume (in kt)

17
Asia is going to be the center of gravity; Western markets are stagnating
Copper wire rod demand (in mill. t/y)
Source: CRU Wire and Cable Quarterly, Industry Market Outlook, Jan 2013; Aurubis estimation - Asia = Japan, S. Korea, Taiwan, China, ASEAN
CAGR World Asia
2008 – 2012 1.5 % 5.0 %
2008 – 2015e 2.6 % 4.5 %
2008 – 2018e 2.8 % 4.5 %
2008 – 2025e 3.0 % 4.5 %
Stable growth of copper wire rod markets expected

18
Aluminum wire rod will probably catch up to copper around 2022
Aluminum wire rod demand (in mill. t/y)
Aluminum wire rod demand is speeding up and
moving to the Far East at the same time
Source: CRU Wire and Cable Quarterly, Industry Market Outlook, Jan 2013, Cu/Al price ratio; Aurubis estimation, Asia = Japan, S. Korea, Taiwan, China, ASEAN
CAGR World Asia
2008 – 2012 11.9 % 19.5 %
2008 – 2015e 9.7 % 14.0 %
2008 – 2018e 9.9 % 14.0 %
2008 – 2025e 10.4 % 14.0 %

19
Substitution of Copper
1. Dimensions of substitution
2. Drivers of substitution
3. Quantitative effects of
substitution
4. Applications under
substitution
5. Options for copper

20
Application Risk of substitution Trend
Energy cable LV (< 1 kV) very high nearly saturated
MV (1-66 kV) very high increasing
HV (66-220 kV) high increasing
XHV (220-380 kV) medium starting
Building wire low to medium increasing
Heat/flame-resistant cable very low -
Submarine energy cable low flat
Magnet wire medium increasing
Transformers high increasing
Motors and generators high increasing
Cable for vehicle harnesses high increasing
Civil aviation harnesses medium increasing
Cables/harnesses for military applications low flat
Telecommunications/network cable very high nearly saturated
Local Area Network cable low slowly increasing
Other special cable low flat
Cablemakers are working on substitutes to fulfill their customers’ demand
Many copper wire rod applications are at risk

» The German energy supplier RWE is installing a 10 kV HTSC cable in Essen
(Germany) to replace a 110 kV copper cable. With a length of more than 1 km, this is
the largest HTSC project worldwide.
» This new 10 kV HTSC cable transports five times as much energy (P= 40 MW) than the
substituted 110 kV copper cable using the same cable ducts. Energy losses are
negligible.
» The accompanying current limiters also utilize HTSC.
» Cooling by liquid nitrogen to -200 °C.
» Improved connections to conventional cables.
» 110kV/10kV relay stations not necessary any more.
» Total CAPEX ~ € 13.5 mill.
» HTSC cables are still 2.5 times more expensive than copper cables; break-even
expected 2020 at the latest.
21
10-15 % lower total HTSC system costs in comparison to copper cables
AmpaCity superconductor replacing copper cables

22
Substitution of Copper
1. Dimensions of substitution
2. Drivers of substitution
3. Quantitative effects of
substitution
4. Applications under
substitution
5. Options for copper

23
Copper industry has to reinvent its industrial logic along the whole value chain
“Duck and cover” Arrange
and start to defend
Actively search for
and develop new
applications
» No integrated approach
in a “fragmented
industry”
» Stand-alone measures
to survive, e.g. cost
saving programs
» Waiting for better times,
which will not come
again
» Reduce working capital
» Consolidate portfolio and
footprint, M+A activities
» Coordinate steps to look for
new applications
» Join and align forces,
strengthen associations
» Avoid perception of scarcity
» Understand the logics of
OEMs and manufacturers
in buyer’s markets
» Structured and integrated
product development in
long-term approach
» Increase R&D efforts
» Offer sustainable solutions
featuring strong USP and
societal benefit
Sulking and complaining is not a solution

24
...but if copper does not actively join these trends, its substitution will continue
2012 2025
Growing Energy Scarcity
Changes in Energy Transfer and Distribution
Decentralization of Energy Production
New Propulsion Technologies
Continuing Urbanization
Backshoring
Rebalancing of Global Financial Markets
Growing Global Middle Class
»World population continues to grow:
1950: 2.6 billion
2013: 7.1 billion
2035: 8.5 billion
2050: 9.3 billion (=> stagnation)
»Urbanization will proceed: In 2035
65 % of population will live in cities
»Townspeople need more
infrastructure and especially
conductivity per capita
»Growing middle class means rising
living standards
»Recycling and sustainability will
become more important
Global megatrends offer opportunities …

25
Thank you!
Questions welcome
IWCC Joint Meeting 2013