substances from water in residential areas around uorine ...
15
Page 1/15 Occurrence and health risk assessment of peruorinated substances from water in residential areas around uorine chemical industry, China Jiaxi Tang Liaoning Technical University Yongle Zhu Liaoning Technical University Yu Li Liaoning Technical University Biao Xiang Liaoning Technical University Ting Tan Liaoning Technical University Linyou Lv Liaoning Academy of Agricultural Sciences Qing Luo ( [email protected] ) Shenyang University Research Article Keywords: Per- and polyuoroalkyl substances, peruorooctanoic acid, concentration, distribution, risk quotient, health risk assessment Posted Date: August 10th, 2021 DOI: https://doi.org/10.21203/rs.3.rs-749717/v1 License: This work is licensed under a Creative Commons Attribution 4.0 International License. Read Full License
Transcript of substances from water in residential areas around uorine ...

Page 1/15
Occurrence and health risk assessment of per�uorinatedsubstances from water in residential areas around �uorinechemical industry, ChinaJiaxi Tang
Liaoning Technical UniversityYongle Zhu
Liaoning Technical UniversityYu Li
Liaoning Technical UniversityBiao Xiang
Liaoning Technical UniversityTing Tan
Liaoning Technical UniversityLinyou Lv
Liaoning Academy of Agricultural SciencesQing Luo ( [email protected] )
Shenyang University
Research Article
Keywords: Per- and poly�uoroalkyl substances, per�uorooctanoic acid, concentration, distribution, risk quotient, health risk assessment
Posted Date: August 10th, 2021
DOI: https://doi.org/10.21203/rs.3.rs-749717/v1
License: This work is licensed under a Creative Commons Attribution 4.0 International License. Read Full License
Page 2/15
AbstractTo identify the contamination status and assess the health risk of per- and poly�uoroalkyl substances (PFASs) in surface and groundwater are of great signi�cance recently. Eighteen individual PFASs were analyzed in thirty-three surface/ground water samples from�uorine industry in one period of park-A (park A) and two periods of park B. All the short chain PFASs (C < 8) and chlorinatedpoly�uorinated ether sulfonate acid (F-53B) in the park A and B were detected with 100%. The �rst three detected substances ofper�uorobutane sulfonate (PFBS), per�uorobutanoic acid (PFBA) and per�uorooctanoic acid (PFOA) were the predominant substances.The contamination status in wet season (WS) is stronger than in dry season (DS) in park B. Total concentration of PFASs(∑PFASs) inpark A presented the increasing tendency following the groundwater �ow direction whereas this rule was limited to re�ect in all periodsof park B. Applying different relative source contribution (RSC) of 100% and 20% to assess this risk of different aged group bodies fromPFASs, the result was that all PFASs (4 ≤ C ≤ 7 or 9 ≤ C ≤ 12) while per�uorooctane sulfonate (PFOS) and PFOA (C = 8) were identi�edto the low risk quotient (RQ) contribution. Mixed RQmix value mainly relies on the PFOA and PFOS with a larger contribution rate of 80–90%. All assessed cases (Case 1, Case2, Case3 and Case4) to all aged groups reveal the infants were to be vulnerable to PFASsin�uence, followed by the children, teenagers and adults, respectively.
1. IntroductionPer- and poly�uoroalkyl substances (PFASs) are a class of arti�cial compounds with a unique stability, surface activity, thermalstability, amphiphilic nature and have been used in various aspects of industry and household products, including surfactants, surfaceprotectors, pesticides, lubricants, and performance chemicals(Gomez-Canela et al. 2012, Lee et al. 2020, Ssebugere et al. 2020, Xu et al.2021). Synchronously with the industrial production and human implication in daily life, this persistent organic pollutant of PFASs havebeen detected in multiple environmental media, such as air(Zhao et al. 2020), soil(Shigei et al. 2020, Zhang et al. 2020), waterbody(Gagliano et al. 2020, Yang et al. 2011, Zheng et al. 2020), plants(Zhang et al. 2020), animals(Ahrens et al. 2016, Ahrens et al.2010, Zhao et al. 2011) and even human blood serum(Xie et al. 2021). PFASs were divided into short and long chain according to thedifferent chain length (C<8 or C≥8), then per�uoroalkyl sulfonates (PFSAs) and per�uoroalkyl carboxylates (PFCAs) were classi�ed bydifferent functional groups of -SO3H and -COOH(Ahrens et al. 2010, Awad et al. 2011, Lindstrom et al. 2011). Although PFASs and itsderivatives have many good properties and stabilities, an increasingly crucial concern of ecological in�uence and health issue has beenimplemented in the early 2000s, mainly based on two common individual-PFASs both per�uorooctanoic acid (PFOA) andper�uorooctane sulfonate (PFOS). Noticeably, PFOA, its salts and the related compounds were o�cially added in Annex B of POPs in2019 (UNEP, 2019). As regulatory restrictions of long-chain PFASs were established, new alternatives of short-chain individual-PFASsand related derivatives were continually detected. These substances with long term accumulation in environment will incur body organsto suffer a vary of diseases e.g. respiratory tract, kidney, skin, reproductive and even potentially cancer-causing(Fu et al. 2014, Li et al.2020b, Xie et al. 2021). In addition, according to the related studies in recent years, the concentration of PFASs in environmentalmedium were hard to degrade by microbes or bacteria, and bio- degrade by plants. The consequence may cause that PFASs will exist inenvironmental system and then enter into food web, seriously affect the human health.
The ground and surface water are the most precious resource due to the fact that human usually regard it as drinking source or makeuse of it to irrigate vegetables and fruits. But in recent years, a large scale of aqueous environment is heavily affected by PFASs, and itsconcentration in waterbody environment poses the risk to human health(Gobelius et al. 2018). Different PFASs sources were frequentlyidenti�ed in which industrial production of �uorine-containing have the largest distribution e.g. �uorine chemical industry, �uorineproducts manufacturing, �re protection, etc. Then related to previous studies, Gobelius et al (2018) found PFASs concentrations from41 groundwater samples were detected with the highest ∑PFASs concentration (6,400 ng L-1), associated with these areas of�re�ghting training sites including air �elds and military areas. Meanwhile, irrigation water samples of 21 PFASs in 2019 were detectedthat the maximum concentrations of 369.9 ng·L-1 around �uorine chemical park in Jiangsu province, China(Gagliano et al. 2020).Traditional wastewater equipment is di�cult to completely removal the PFASs and consequently, released into receiving environment,which is a concern for the possible presence of these compounds in water used for the potable supply production(Gagliano et al.2020, Xie et al. 2021). PFASs in water body will be ingested resulting from its abundant stability and environmental persistence.Especially, short-chain compounds enormously strengthen many learner’s attention, due to their use as an alternative to long-chainones, and their high mobility in aquatic environment(Gobelius et al. 2018, Pan et al. 2019, Qi et al. 2016).
Two parks in Fuxin (Liaoning province, China) are famous deriving from rich mineral conditions and resources (calcium �uoride, CaF2)where one park has been abandoned and another one is on service now. The intensive industries have generated local PFASs
Page 3/15
contamination in relatively serve contamination degree, so the number of researches have also been implemented to focus on thisarea(Bao et al. 2020, Chen et al. 2018). But the surface and the ground water are only limited to study pollution status andconcentration analysis without assessing water body risk to local residents, especially in groundwater as drinking source. Localresidents frequently regard polluted water as drinking source though the industrial area was away from residential area, but water �owwill accelerate the migration of PFASs. Thus, the health risk assessment basing on different aged groups is indispensable to evaluatethe in�uence of PFASs in ground water to local residents. Importantly, individual and mixed risk of PFASs including short and longchain can provide the accurate value to measure the risk degree and single out priority pollutants for prevention and control.
Thus, the objective of our study is to (1) identify PFASs concentration and pro�le in the surface and ground water. (2) de�nite PFASsspatial distribution around regional area of two parks. (3) assess the individual and mixed of risk from short and long chain PFASs inground water to the local residents. Through our study, it is expected to provide theoretical basis and scienti�c guidance of PFASspollution for local policies departments or makers.
2. Materials And Methods2.1 Chemicals and regants
All the chemicals and standards were of chromatographically pure grade. The target PFAS analytes were purchased from AbsoluteStandards (Hamden, CT, USA), including poly�uorinated ether sulfonate acid (F-53B), 13 PFCAs of per�uorobutanoic acid (PFBA),per�uoropentanoic acid (PFPeA), per�uorohexanoic acid (PFHxA), per�uoroheptanoic acid (PFHpA), PFOA, per�uorononanoic acid(PFNA), per�uorodecanoic acid (PFDA), per�uoroundecanoic acid (PFUdA), per�uorododecanoic acid (PFDoA), per�uorotridecanoicacid (PFTrDA), per�uorotetradecanoic acid (PFTeDA), per�uorohexadecanoic acid (PFHxDA) and per�uorooctadecanoic acid (PFODA),4 PFSAs of per�uorobutane sulfonate (PFBS), per�uorohexane sulfonate (PFHxS), PFOS and per�uorodecane sulfonate (PFDS).Standard information and the selection of target compounds are given in the supporting information (SI).
2.2 Sample collection and analysis
All water sampling works were carried out in September (wet season, WS) and November (dry season, DS) of 2019 in the two parks ofFuxin, China. However, a number of times (WS) in park A was only collected due to the relocation and departure of local residents.Thirty-three samples were collected in park A and park B of DS and WS. The surface water samples mainly come from local river (Xiriver tributaries) and pond, and the ground water samples were collected from resident’s well. The ground water samples at a depth of7-10 m and surface samples at a depth of 10-20cm were collected by using 1.5 L methanol-rinsed polyethylene (PE) bottles withpolypropylene (PP) screw caps. All water samples were stored by portable refrigerator ( ~5℃) and avoided light. Watersample pretreatment methods mainly come from Chen et al (2018) and Bao et al (2019). Oasis WAX cartridges (500 mg, 6 mL, Waters,USA) were applied to extract PFASs and extracts of the groundwater and the surface water samples were analyzed via highperformance liquid chromatography triple quadrupole mass spectrometer (HPLC–MS/MS). The WAX SPE cartridges were conditionedwith 5 mL methanol containing 0.1% ammonium hydroxide, 5 mL methanol and 5 mL Milli-Q water. Then, the water samples wereloaded onto the cartridges at a rate of 1 drop/s. The cartridges were washed with 5 mL of 2.5 mM acetic acid/ ammonium acetate(pH=4), and then centrifuged for 10 min at 3000 rpm to remove residual water. The ionizable compounds were eluted with 5 mLmethanol and 5 mL methanol containing 0.1% ammonium hydroxide. The eluent was concentrated under nitrogen and dissolved with1ml acetonitrile for instrumental analysis (Bao et al. 2020, Cao et al. 2019, Chen et al. 2018).
2.3 QA/QC
The �eld blank to eliminate the concentration in�uencing from sampling bottle and series of laboratory Milli-Q water were added intothe sampling bottle in order to determine this free blank. Procedural blanks were identi�ed to every batch of samples and it will not bedetected (nd) or lower than the limits of quanti�cation (LOQs) in order to ensure data accuracy and method availability. LOQ werede�ned as the minimum injection volume of reproducible measurement peak area within ±20% of repeated injection. The LOD and LOQfor each PFASs were given in SI. The PFASs concentrations were identi�ed to a concentration series of 0, 0.01, 0.1, 1, 5, 10, 50, 100, and500 μg·L-1 to draw the standard curve (R2>0.99). In addition, the IS was added to each sample to assess accuracy by the recovery of theanalytes, and recoveries acceptable range needs to be less than 20%.
2.4 Statistical analysis
Page 4/15
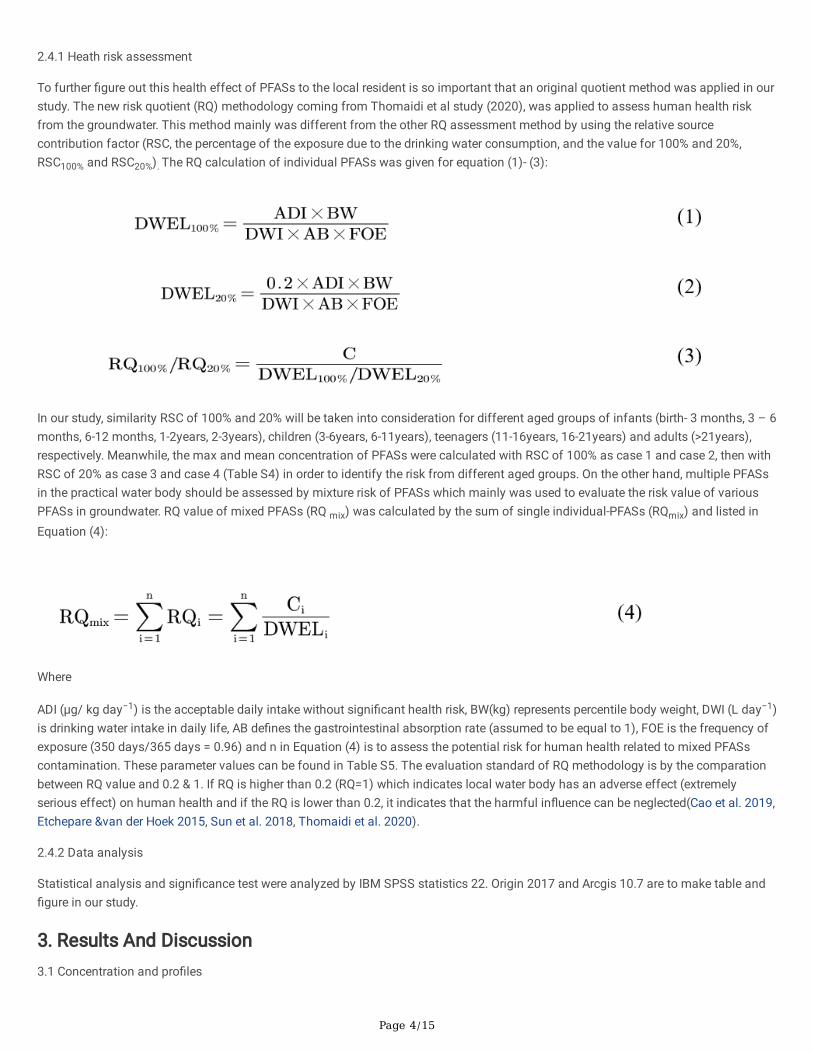
2.4.1 Heath risk assessment
To further �gure out this health effect of PFASs to the local resident is so important that an original quotient method was applied in ourstudy. The new risk quotient (RQ) methodology coming from Thomaidi et al study (2020), was applied to assess human health riskfrom the groundwater. This method mainly was different from the other RQ assessment method by using the relative sourcecontribution factor (RSC, the percentage of the exposure due to the drinking water consumption, and the value for 100% and 20%,RSC100% and RSC20%). The RQ calculation of individual PFASs was given for equation (1)- (3):
In our study, similarity RSC of 100% and 20% will be taken into consideration for different aged groups of infants (birth- 3 months, 3 – 6months, 6-12 months, 1-2years, 2-3years), children (3-6years, 6-11years), teenagers (11-16years, 16-21years) and adults (>21years),respectively. Meanwhile, the max and mean concentration of PFASs were calculated with RSC of 100% as case 1 and case 2, then withRSC of 20% as case 3 and case 4 (Table S4) in order to identify the risk from different aged groups. On the other hand, multiple PFASsin the practical water body should be assessed by mixture risk of PFASs which mainly was used to evaluate the risk value of variousPFASs in groundwater. RQ value of mixed PFASs (RQ mix) was calculated by the sum of single individual-PFASs (RQmix) and listed inEquation (4):
Where
ADI (μg/ kg day−1) is the acceptable daily intake without signi�cant health risk, BW(kg) represents percentile body weight, DWI (L day−1)is drinking water intake in daily life, AB de�nes the gastrointestinal absorption rate (assumed to be equal to 1), FOE is the frequency ofexposure (350 days/365 days = 0.96) and n in Equation (4) is to assess the potential risk for human health related to mixed PFASscontamination. These parameter values can be found in Table S5. The evaluation standard of RQ methodology is by the comparationbetween RQ value and 0.2 & 1. If RQ is higher than 0.2 (RQ=1) which indicates local water body has an adverse effect (extremelyserious effect) on human health and if the RQ is lower than 0.2, it indicates that the harmful in�uence can be neglected(Cao et al. 2019,Etchepare &van der Hoek 2015, Sun et al. 2018, Thomaidi et al. 2020).
2.4.2 Data analysis
Statistical analysis and signi�cance test were analyzed by IBM SPSS statistics 22. Origin 2017 and Arcgis 10.7 are to make table and�gure in our study.
3. Results And Discussion3.1 Concentration and pro�les

Page 5/15
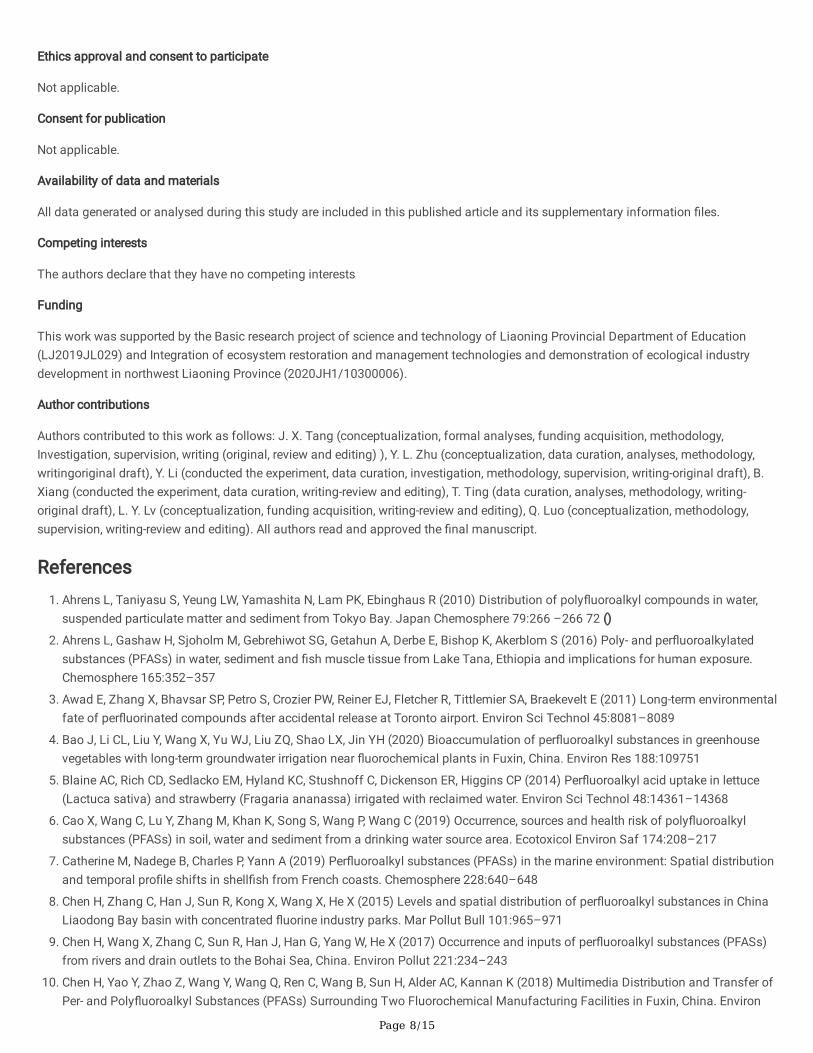
Eighteen individual PFASs all were analyzed in park A and B (Fig. 2). All the short chain PFASs (C<8) and F-53B in park A and B all weredetected with the rate of 100%. Generally, the contamination status of PFASs in park A was higher than park B. Due to the industrialproduction of two parks, the total concentration of PFASs (∑PFASs) and the main individual-PFASs concentration exceeds otherregions of Taihu lake(Ma et al. 2018), West lake(Lu et al. 2018), Jiaozhou bay (Han et al. 2020)and Bohai sea(Chen et al. 2017) (TableS6). In addition, comparing with other drinking water sources of central eastern China, mainly detected substances (PFBA, PFHxA andPFOA) and ∑PFASs were lower than our studies area(Lu et al. 2018). Some previous studies revealed serious contamination degree inlocal area. The range of ∑PFASs(15 target substances) in 2018 was 87-18,000 ng·L-1, and PFBA was 16-12,000 ng·L-1, followed byPFBS (4-5,800 ng·L-1) and PFOA with (16-1,400 ng·L-1), respectively(Chen et al. 2018). Then, Bao et al (2020) detected groundwater aslocal irrigation source that ∑PFASs(10 target substances) has exceed 35 µg L-1, the mainly detected PFASs concentrations of PFBS(32.40 µg L-1) and PFOA (2.47 µg L-1) (Bao et al. 2020)(Table S2).
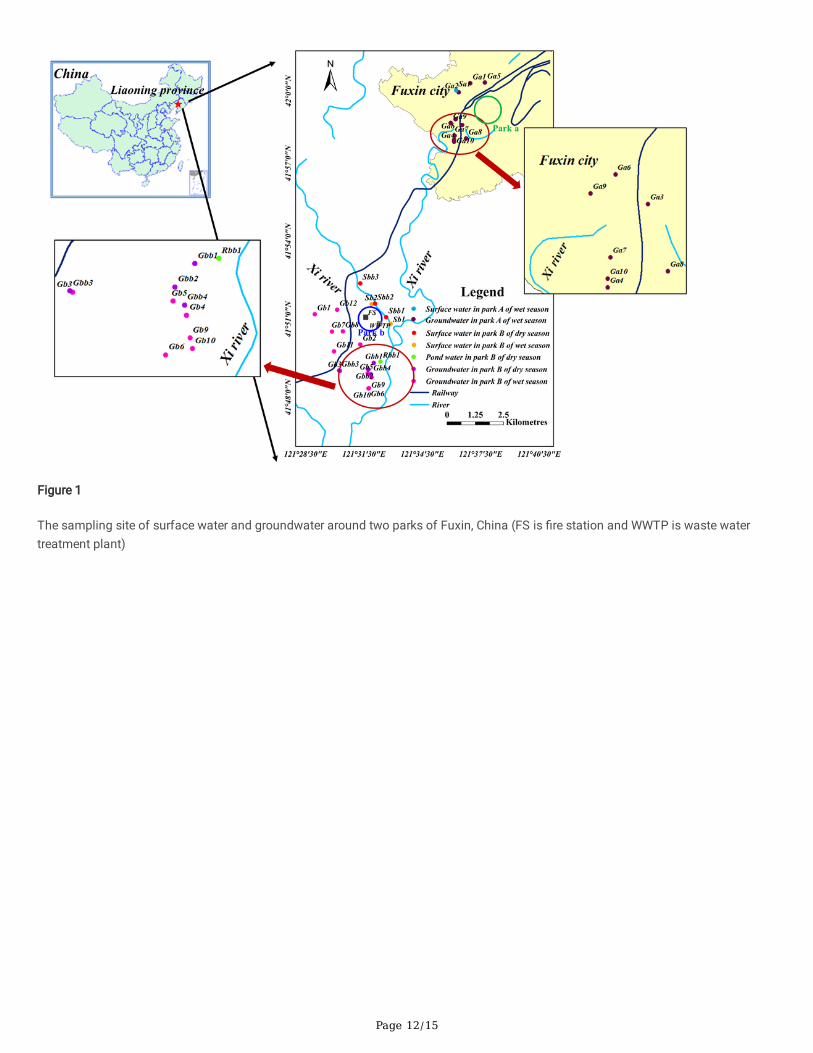
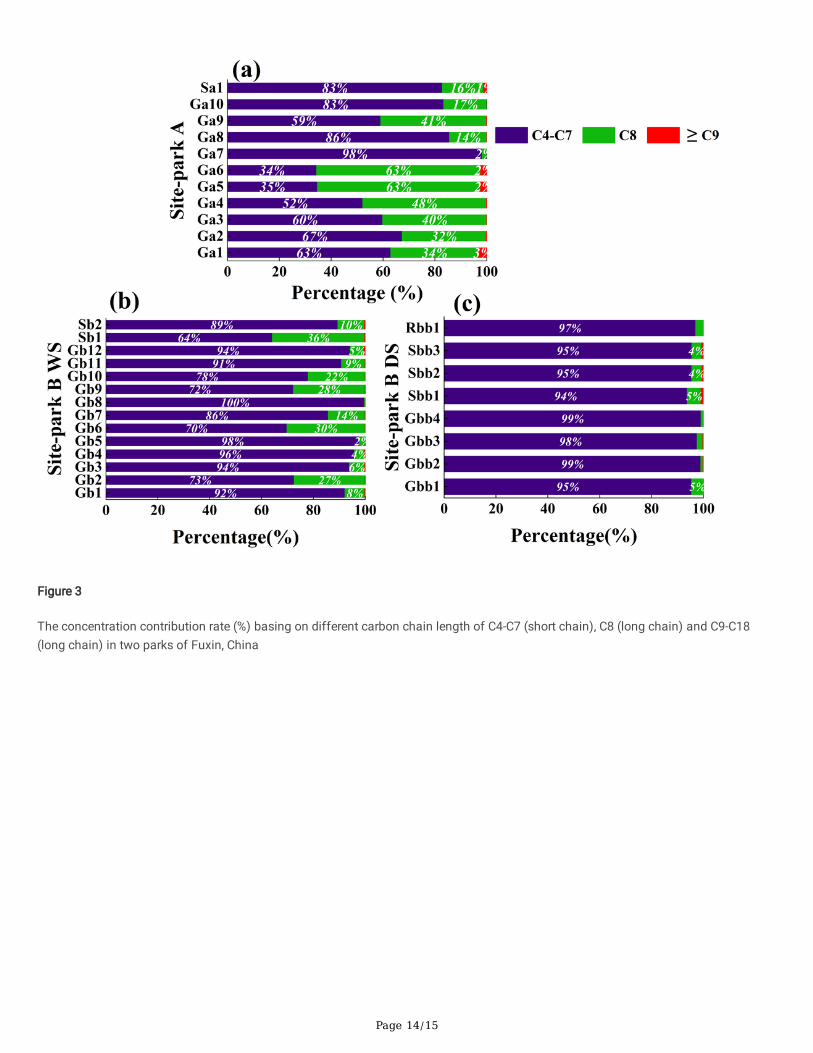
In park A, ∑PFASs varies from 72.49 ng·L-1 in Ga7 to 68,142.16 ng·L-1 in Ga10 and the mean concentration degree was 9,104.03 ng·L-1.Although park A has been forbade to carry out industrial production and lacks out obvious point pollution for a long time, PFASs weredetected with the high concentration due to itself environmental accumulation and stability of persistent organic pollutant (POPs)(Naileet al. 2013, Nascimento et al. 2018, Ojemaye &Petrik 2019). Short chain PFASs concentration was obviously stronger than long chainPFASs. The highest mean concentration of PFBS was detected with 8,734.27 ng·L-1, followed by PFOA(1,563.13 ng·L-1), PFBA(400.41ng·L-1), PFHxA(136.09 ng·L-1) and PFHxS(106.87 ng·L-1), respectively (Table 1). The larger concentration contribution of C4-C7(16%-63%) and C8 (34%-83%) were stronger than C>8 PFASs (≤3%) (Fig 3a). Raining activity in surface and ground system play animportant impact on the migration of PFASs(Ahrens et al. 2016, Xu et al. 2021). The ground water �ow and surface water supply willcause the increasing of PFASs concentration in super�cial aquifer while along with time variation, a mass of storm runoff will dilutehigh PFASs concentration(Li et al. 2020a). PFSAs with functional groups of -SO3H in surface and groundwater emerge a largerconcentration ratio (51%-80%) more than PFCAs with -COOH (20%-49%). In especial, PFSAs in Ga2 with 80% concentration contributionwhereas PFCAs only accounts for 20% (Fig. S1a).
In park B, the PFASs contamination status in groundwater of WS is far stronger than in DS. The mean concentration was calculatedwith 801.68 and 714.64 ng·L-1 in WS and DS, respectively. The mean concentration of surface water was analyzed with 136.39 ng·L-1 inWS whereas mean concentration has reached 1,257.60 ng·L-1 in DS. Similarly, PFBS, PFBA and PFOA were also the mainly detectedsubstances in surface and ground water of WS or DS (Table 1). The serve contamination of short chain PFASs in recent years resultsfrom their vast using as long chain alternatives. As Bao et al study indicated that PFBA, PFPeA and PFHxA were used to be thealternatives of PFOA and PFBS is the main substitute of PFOS(Bao et al. 2020). This sampling site of Rbb1 locates on the agriculturalarea, detected with serious individual concentration and ∑PFASs due to long term reception place from agricultural activities, evenpesticides and fertilizers using (Fig.1, Fig. 2c and Table S7). Surface water will accelerate the migration of pollutants, and especially thesupply also carries PFASs into groundwater(Chiavola et al. 2020, Feng et al. 2020). The PFOS substitute of F-53B was detected withlow contamination degree, whereas concentration in surface water was higher in the groundwater. What in mentioned that long chainPFASs (C≥10) that PFDS, PFUdA, PFDoA, PFTeDA, PFTrDA and PFODA were detected certain concentration in all water body of DSwithout appearing in WS (nd). C4-C7 and C8 of PFASs show higher concentration contribution than C9 of PFASs in the surface andground water of WS and DS. There was a difference that concentration rate of C4-C7 PFASs in DS (range of 64%-98%) was far lowerthan in WS (range of 95%-98%) (Fig. 3b,c). Time difference was better re�ected on short chain PFASs than long chain PFASs. Thereason was that short chain PFASs with greater hydrophobicity and lower lipophilicity will tend to be affected by season variation whilelong chain PFASs were adsorbed by organic matter and the suspended material in sediment(Ahrens et al. 2016, Gagliano et al. 2020, Xuet al. 2021, Zheng et al. 2020). For function groups, the concentration contribution of PFSAs was far than PFCAs in park B (Fig. S1b).Chemical groups between -SO3H and -COOH make PFASs in water possess the environmental behavior abundantly(Gobelius et al.2018).
In our study, PFASs concentration have closely negative relationship with chain length in park A and B (Fig. S2). PFASs with uniquephysicochemical structure tend to dissolve in water body and migrate with a long distance. In addition, the functional groups are alsoan important factor(Liu et al. 2019). Functional groups difference between PFSAs and PFCAs are limited to affect by the water loadvariation in different term (Fig S1). Although other non-point sources may contribute to PFASs in surface and groundwater, the parkproduction is the major contamination source. In addition, industrial emission in different time also affects PFASs pro�les by dischargeof sewage because traditional equipment is hard to removal effectively.
3.2 Spatial distribution

Page 6/15
The source of PFASs in the groundwater may be assumed to two pathways. One was that industrial waste water was directlydischarged into groundwater system and another was the ground pollutant source by some environmental behavior of the surfacerunoff, surface water recharge and rainwater deposition, which will carry PFASs and its precursors into groundwater(Ahrens et al.2010, Bao et al. 2020, Blaine et al. 2014, Cao et al. 2019, Chen et al. 2015, Miranda et al. 2021). The spatial distribution of the pollutantsis not only related to its chemical properties and structures but also the environmental factor and geographical condition should betaken into consideration(Catherine et al. 2019, Chen et al. 2015, Choi et al. 2011, Gao et al. 2020). Especially in intensive industry region,river direction, groundwater �ow direction and agricultural activities, all closely affect the distribution of PFASs. In park A, mainlydetected substances of individual PFASs and ∑PFASs show an increasing tendency along with the groundwater �ow direction (Fig.S3). This result indicates that the groundwater �ow direction is the key element to the PFASs polluted distribution. In addition, themainly detected individual-PFASs of PFBA, PFBS, PFHpA, PFHxA, PFHxS, PFPeA and PFOA is the same with the tendency of ∑PFASs(Fig. S3). Different industrial types are the critical reason of causing PFASs distribution but PFASs in water body was also in�uenced bythe upstream waterbody(Lee et al. 2020). Although industrial process is the main source, the groundwater �ow direction also possessesa signi�cant function to PFASs distribution and migration in park A. Other studies evidenced that the PFASs not only comes from thepoint source but also attributes to water mass migration(Lee et al. 2020).
In park B, this distribution of PFASs concentration was limited to be re�ected, and the dominating detected substances and ∑PFASsalso lack out obviously increasing or decreasing concentration tendency along with the groundwater �ow direction. The concentrationof PFASs in the downstream water is slightly higher than the upstream along with the groundwater �ow direction but this tendency islargely weak (Fig S4). Some sites show abnormal concentration due to the location distribution of the waste water treatment plant(WWTP) and �re station (FS). These places all in�uence the spatial distribution of PFASs. Current biotreatment in WWTP can removeparts of PFNA, PFHxA, and PFPeA but has limited ability to treat other PFASs(Knutsen et al. 2019, Xu et al. 2021). In addition, FS asimportant pollution point has been widely reported. Graetz et al. stated that the past �re�ghting water additives were found to containthe PFASs that could persist in the environment resulting in the potential adverse effects to the biota(Graetz et al. 2020). Importantly, aFS in the park B is the most polluted sources. Daily training and drills will widely release the PFASs precursors into theenvironment (Gobelius et al. 2017, Graetz et al. 2020). Different areas were polluted by the point and the non-point source of PFASs and�nally these substances entering into the groundwater system, even migrate to other places(Li et al. 2020a, Li et al. 2020b). PFASsdistribution was hard to reveal the increasing and decreasing tendency due to tremendously industrial emission with different states ofthe waste air and water in park B. The industrial process and the production possess a strong effect on the distribution of PFASs farthan geographical factor.
3.3 Health risk assessment
Environmental pollutants will enter into and �nally accumulate in the human body by direct drinking(Gobelius et al. 2018). In our study,the groundwater as main drinking source is a serve exposure to local residents. The short chain PFASs were mainly detected in twoparks whereas part of PFASs lacks out related evaluation messages, still all individual PFASs is hard to assess the health risk. Hence,combining with the mainly detected substances and available toxicity data, PFBA(C4), PFHpA(C7), PFHxA(C6), PFHxS(C6), PFOA(C8),PFOS(C8), PFNA(C9), PFUdA(C11) and PFDoA(C12) were assessed, respectively.
3.3.1 Individual PFASs (C≤8)
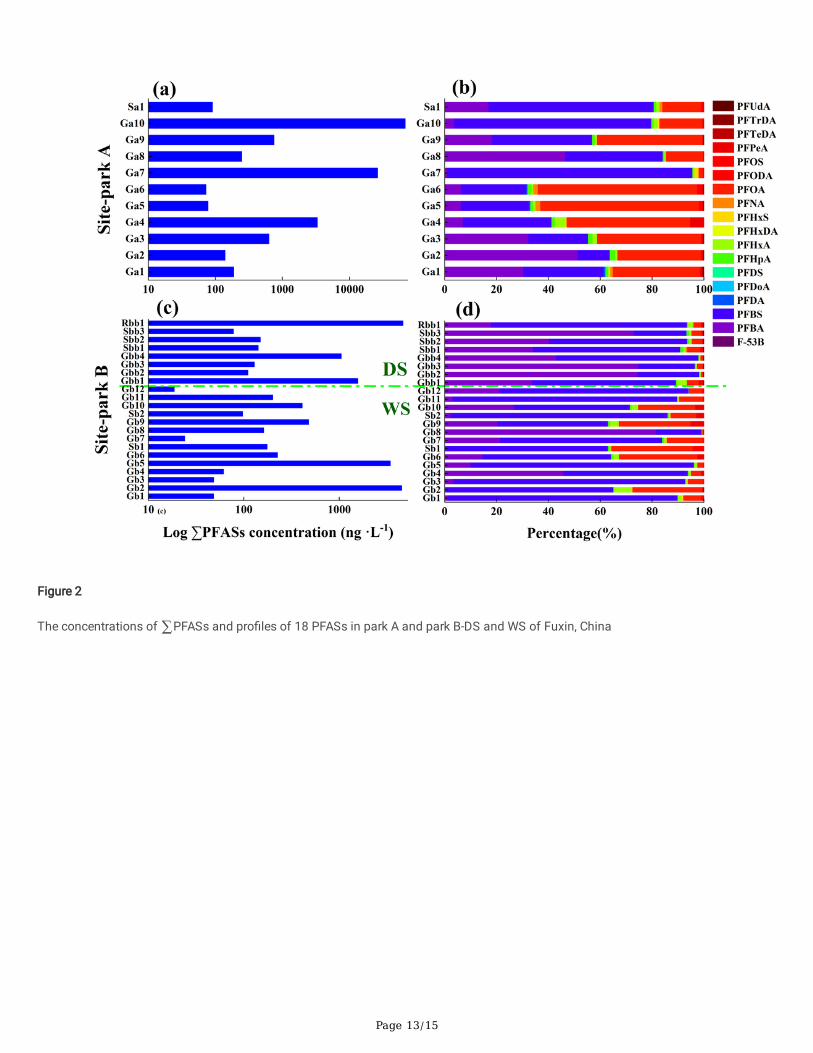
Along with the increasing of the aged groups, the RQ value show a decreasing tendency in park A and park B-WS and DS. This revealsthat PFASs risk have a more remarkable in�uence on the infants and the children than the teenagers and the adults. RQ100%/20% valuehas a positive relationship with PFASs concentration in the water body and the negative relationship with DWEL. In park A, the highestDWEL value appears in PFBS (17,820,547.09 - 3,270,348.84 L·day-1), followed by PFHpA and PFHxA (654,069.01 – 3,564,109.42 L·day-
1), respectively. But these three substances lack out determining the highest health risk whereas PFOA possesses a largest RQ value,followed by PFOS (Table S8). RQ100%/20% value of all assessed substances in park A is higher than park B and especially part of theRQ100%/20% value in park A has exceeded 1(Table S8). The RQ100%/20% value of PFBA, PFHpA, PFHxA and PFHxS in case 1-4 were in thereasonable range and this demonstrates that the max and the mean concentration of four substances is limited to exceed the RQreference line of 0.2 and 1. Short chain PFASs (C≤7) in groundwater is hard to constitute the health risk to local residents. But PFOAand PFOS in part of sampling sites exceeding RQ=0.2, even RQ=1, has given rise to harm human body in case 1-4. The RQ100%/20%
value of PFOA in case 1 and case 3 were in the range of 0.26-1.44 and 1.32-7.20 for aged groups, and the range of 0.23-0.64 for birth -6years in case 4 (Fig. 4a). What counts is that total PFASs contamination degree is hard to pose health risk in case 2 for all agedgroups. Causally, the water �ow is the main impact to take away PFASs for the part of sampling sites with high concentration and this
Page 7/15
will dilute PFASs concentration, even decrease the toxic effect(Hongkachok et al. 2018, Ikkere et al. 2018, Jin et al. 2015). The ADI valuedifference between PFOS (0.15 μg/ kg day−1) and PFOA (1.5 μg/ kg day−1) has exceeded 1 orders of magnitude. However, theconcentration of PFOS is 1-2 magnitude lower than PFOA which causes the RQ100%/20% value of PFOS is hard to exceed PFOA. TheRQ100%/20% value of PFOS in case 1-2 and 4 was di�cult to exceed RQ=0.2 expect for case 3, which is similar to PFOA. For differentperiods in park B, the degree of RQ100%/20% value in WS is higher in DS due to the high concentration was detected in WS (Fig 4b,c andTable S8). Based on all terms of different aged groups except the case 3, only PFOA in WS exceeds the control line of RQ=0.2 but is notexceed RQ=1. The range of RQ20% value for PFOA in case 3 was 0.22-0.62 that the max value of 0.62 for birth-3 months and the mixvalue of 0.22 for 3-6 years (Fig 4b,c). Many studies have revealed that PFASs can harm human body but different types of PFASs havevarious effect mechanisms(Graetz et al. 2020, He et al. 2018, Li et al. 2019, Miranda et al. 2021). Local residents regard the pollutedwater as drinking source, having larger exposure opportunity of touching these toxic substances.
3.3.2 Individual PFASs (C>8)
Long chain PFASs(C>8) were detected with lower concentration than short chain PFASs, which means the low concentration was alsorelated to lower RQ value. Three individual-PFASs of PFNA(C9), PFUdA (C11) and PFDoA(C12) were assessed. The result reveal thatthree long chain PFASs is hard to pose potential risk to the local residents. The range of RQ value is that the negligible (ng)- 0.002, ng-0.0001 and ng-0.006 for PFNA, PFUdA and PFDoA, respectively (Table S8). These max RQ100%/20% value from three long chain PFASswere lower than 0.2 while the magnitude difference ranges from 1 to 3. Then in our study, extreme conditions are considered to performoperations to initially assess the risk to the human health. The group of birth-3 months can be easily affected by short chain PFASs inenvironmental media. If three assessed substances will cause health risk basing on the line of RQ=0.2, the concentration of 5.37, 6.53and 0.13 ng·L-1 for PFNA, PFUdA and PFDoA were calculated, respectively. There was a huge difference of 1-2 magnitudes between thepredicted and actual concentration. Thus, the long chain PFASs for assessed substances were di�cult to threaten the human body.
3.3.3 Mixed risk of PFASs
The mixed risk assessment was increasingly concerned due to the different individual PFASs existing in the environmental media. Butthe related assessing method is limited to develop resulting from the complex mechanism in current environment system. The mostserious situation appears in the park A of RQmix (4≤C≤12) =8.07 for birth-3 months (Table S6). ∑PFASs (4≤C≤7) and ∑PFASs(9≤C≤12) were hard to reach the line of RQ=0.2, and RQmix of these substances were limited to exceed that RQ=1 (Table S7). Expect forPFOS and PFOA, all PFASs (4≤C≤7 or 9≤C≤12) were analyzed with lower RQ contribution. Especially, the risk of the individual PFASswith low RQ value without exceeding RQ=0.2, then the RQmix value was hard to possess the risk to all aged groups. In this process,PFOS and PFOA risk values determine the crucial factor to the size of RQmix. In other words, if the risk from PFOS and PFOA can beeffectively impaired, the RQmix of all the individual-PFASs will deeply decrease. Mixed RQmix value mainly relies on the PFOA and PFOScontribution rate (80%-90%). This indicates that PFOA and PFOS should be taken into consideration and listed as priority control.Notably, RQmix value from the group of teenagers (16-21 years) appears a small spike relative to two adjacent groups both 11-16 yearsand >21 years. In comparison with the infant and child, teenager group is the third group which is in�uenced by PFASs due to theweight and drinking intake.
4. ConclusionEighteen individual PFASs were analyzed in surface water and groundwater, then the concentration pro�les, spatial distribution and thehealth risk assessment for different aged groups was studied in two different parks. PFBS, PFBA and PFOA were the predominantsubstances in surface and ground water, meanwhile, ∑PFASs in park A was higher than in park B. Water loads in different periods havea crucial impact on PFASs concentration and pro�les variation. PFSAs and PFCAs also appear negative concentration trend in WS orDS. In addition, ∑PFASs and part of high concentration substances(PFBA, PFBS, PFHpA, PFHxA, PFHxS, PFOA and PFPeA) appear theincreasing tendency along with the groundwater �ow direction in park A. However, due to the in�uence of industrial process andemission, the concentration trend was limited to re�ect in park B. Health risk assessment result was that short and long chain PFASsexcept for the PFOS and PFOA were hard to possess the serious risk to the local resident based on the line of RQ=0.2. The serioushealth risk from PFOS and PFOA were found with a larger contribution to the mixed RQmix value. All assessed cases to all aged groupsreveal the infants were vulnerable to the PFASs in�uence, followed by the children, teenagers and adults, respectively.
Declarations
Page 8/15
Ethics approval and consent to participate
Not applicable.
Consent for publication
Not applicable.
Availability of data and materials
All data generated or analysed during this study are included in this published article and its supplementary information �les.
Competing interests
The authors declare that they have no competing interests
Funding
This work was supported by the Basic research project of science and technology of Liaoning Provincial Department of Education(LJ2019JL029) and Integration of ecosystem restoration and management technologies and demonstration of ecological industrydevelopment in northwest Liaoning Province (2020JH1/10300006).
Author contributions
Authors contributed to this work as follows: J. X. Tang (conceptualization, formal analyses, funding acquisition, methodology,Investigation, supervision, writing (original, review and editing) ), Y. L. Zhu (conceptualization, data curation, analyses, methodology,writingoriginal draft), Y. Li (conducted the experiment, data curation, investigation, methodology, supervision, writing-original draft), B.Xiang (conducted the experiment, data curation, writing-review and editing), T. Ting (data curation, analyses, methodology, writing-original draft), L. Y. Lv (conceptualization, funding acquisition, writing-review and editing), Q. Luo (conceptualization, methodology,supervision, writing-review and editing). All authors read and approved the �nal manuscript.
References1. Ahrens L, Taniyasu S, Yeung LW, Yamashita N, Lam PK, Ebinghaus R (2010) Distribution of poly�uoroalkyl compounds in water,
suspended particulate matter and sediment from Tokyo Bay. Japan Chemosphere 79:266 –266 72 ()
2. Ahrens L, Gashaw H, Sjoholm M, Gebrehiwot SG, Getahun A, Derbe E, Bishop K, Akerblom S (2016) Poly- and per�uoroalkylatedsubstances (PFASs) in water, sediment and �sh muscle tissue from Lake Tana, Ethiopia and implications for human exposure.Chemosphere 165:352–357
3. Awad E, Zhang X, Bhavsar SP, Petro S, Crozier PW, Reiner EJ, Fletcher R, Tittlemier SA, Braekevelt E (2011) Long-term environmentalfate of per�uorinated compounds after accidental release at Toronto airport. Environ Sci Technol 45:8081–8089
4. Bao J, Li CL, Liu Y, Wang X, Yu WJ, Liu ZQ, Shao LX, Jin YH (2020) Bioaccumulation of per�uoroalkyl substances in greenhousevegetables with long-term groundwater irrigation near �uorochemical plants in Fuxin, China. Environ Res 188:109751
5. Blaine AC, Rich CD, Sedlacko EM, Hyland KC, Stushnoff C, Dickenson ER, Higgins CP (2014) Per�uoroalkyl acid uptake in lettuce(Lactuca sativa) and strawberry (Fragaria ananassa) irrigated with reclaimed water. Environ Sci Technol 48:14361–14368
�. Cao X, Wang C, Lu Y, Zhang M, Khan K, Song S, Wang P, Wang C (2019) Occurrence, sources and health risk of poly�uoroalkylsubstances (PFASs) in soil, water and sediment from a drinking water source area. Ecotoxicol Environ Saf 174:208–217
7. Catherine M, Nadege B, Charles P, Yann A (2019) Per�uoroalkyl substances (PFASs) in the marine environment: Spatial distributionand temporal pro�le shifts in shell�sh from French coasts. Chemosphere 228:640–648
�. Chen H, Zhang C, Han J, Sun R, Kong X, Wang X, He X (2015) Levels and spatial distribution of per�uoroalkyl substances in ChinaLiaodong Bay basin with concentrated �uorine industry parks. Mar Pollut Bull 101:965–971
9. Chen H, Wang X, Zhang C, Sun R, Han J, Han G, Yang W, He X (2017) Occurrence and inputs of per�uoroalkyl substances (PFASs)from rivers and drain outlets to the Bohai Sea, China. Environ Pollut 221:234–243
10. Chen H, Yao Y, Zhao Z, Wang Y, Wang Q, Ren C, Wang B, Sun H, Alder AC, Kannan K (2018) Multimedia Distribution and Transfer ofPer- and Poly�uoroalkyl Substances (PFASs) Surrounding Two Fluorochemical Manufacturing Facilities in Fuxin, China. Environ

Page 9/15
Sci Technol 52:8263–8271
11. Chiavola A, Di Marcantonio C, Boni MR, Biagioli S, Frugis A, Cecchini G (2020) Experimental investigation on the per�uorooctanoicand per�uorooctane sulfonic acids fate and behaviour in the activated sludge reactor. Process Saf Environ Prot 134:406–415
12. Choi HG, Moon HB, Choi M, Yu J (2011) Monitoring of organic contaminants in sediments from the Korean coast: Spatialdistribution and temporal trends (2001–2007). Mar Pollut Bull 62:1352–1361
13. Etchepare R, van der Hoek JP (2015) Health risk assessment of organic micropollutants in greywater for potable reuse. Water Res72:186–198
14. Feng X, Ye M, Li Y, Zhou J, Sun B, Zhu Y, Zhu L (2020) Potential sources and sediment-pore water partitioning behaviors ofemerging per/poly�uoroalkyl substances in the South Yellow Sea. J Hazard Mater 389:122124
15. Fu Y, Wang T, Wang P, Fu Q, Lu Y (2014) Effects of age, gender and region on serum concentrations of per�uorinated compounds ingeneral population of Henan. China Chemosphere 110:104–110
1�. Gagliano E, Sgroi M, Falciglia PP, Vagliasindi FGA, Roccaro P (2020) Removal of poly- and per�uoroalkyl substances (PFAS) fromwater by adsorption: Role of PFAS chain length, effect of organic matter and challenges in adsorbent regeneration. Water Res171:115381
17. Gao L, Liu J, Bao K, Chen N, Meng B (2020) Multicompartment occurrence and partitioning of alternative and legacy per- andpoly�uoroalkyl substances in an impacted river in China. Science of The Total Environment 729
1�. Gobelius L, Lewis J, Ahrens L (2017) Plant Uptake of Per- and Poly�uoroalkyl Substances at a Contaminated Fire Training Facilityto Evaluate the Phytoremediation Potential of Various Plant Species. Environ Sci Technol 51:12602–12610
19. Gobelius L, Hedlund J, Durig W, Troger R, Lilja K, Wiberg K, Ahrens L (2018) Per- and Poly�uoroalkyl Substances in SwedishGroundwater and Surface Water: Implications for Environmental Quality Standards and Drinking Water Guidelines. Environ SciTechnol 52:4340–4349
20. Gomez-Canela C, Barth JA, Lacorte S (2012) Occurrence and fate of per�uorinated compounds in sewage sludge from Spain andGermany. Environ Sci Pollut Res Int 19:4109–4119
21. Graetz S, Ji M, Hunter S, Sibley PK, Prosser RS (2020) Deterministic risk assessment of �re�ghting water additives to aquaticorganisms. Ecotoxicology 29:1377–1389
22. Han T, Gao L, Chen J, He X, Wang B (2020) Spatiotemporal variations, sources and health risk assessment of per�uoroalkylsubstances in a temperate bay adjacent to metropolis, North China. Environmental Pollution 265
23. He X, Li A, Wang S, Chen H, Yang Z (2018) Per�uorinated substance assessment in sediments of a large-scale reservoir inDanjiangkou, China. Environ Monit Assess 190:66
24. Hongkachok C, Boontanon SK, Boontanon N, Fujii S, Tanaka S, Suzuki Y (2018) Levels of per�uorinated compounds (PFCs) ingroundwater around improper municipal and industrial waste disposal sites in Thailand and health risk assessment. Water SciTechnol 2017, 457–466
25. Ikkere LE, Perkons I, Sire J, Pugajeva I, Bartkevics V (2018) Occurrence of polybrominated diphenyl ethers, per�uorinatedcompounds, and nonsteroidal anti-in�ammatory drugs in freshwater mussels from Latvia. Chemosphere 213:507–516
2�. Jin H, Zhang Y, Zhu L, Martin JW (2015) Isomer pro�les of per�uoroalkyl substances in water and soil surrounding a chinese�uorochemical manufacturing park. Environ Sci Technol 49:4946–4954
27. Knutsen H, Maehlum T, Haarstad K, Slinde GA, Arp HPH (2019) Leachate emissions of short- and long-chain per- and poly�uoralkylsubstances (PFASs) from various Norwegian land�lls. Environ Sci Process Impacts 21:1970–1979
2�. Lee YM, Lee JY, Kim MK, Yang H, Lee JE, Son Y, Kho Y, Choi K, Zoh KD (2020) Concentration and distribution of per- andpoly�uoroalkyl substances (PFAS) in the Asan Lake area of South Korea. J Hazard Mater 381:120909
29. Li BB, Hu LX, Yang YY, Wang TT, Liu C, Ying GG (2020a) Contamination pro�les and health risks of PFASs in groundwater of theMaozhou River basin. Environ Pollut 260:113996
30. Li P, Oyang X, Zhao Y, Tu T, Tian X, Li L, Zhao Y, Li J, Xiao Z (2019) Occurrence of per�uorinated compounds in agriculturalenvironment, vegetables, and fruits in regions in�uenced by a �uorine-chemical industrial park in China. Chemosphere 225:659–667
31. Li Y, Barregard L, Xu Y, Scott K, Pineda D, Lindh CH, Jakobsson K, Fletcher T (2020b) Associations between per�uoroalkylsubstances and serum lipids in a Swedish adult population with contaminated drinking water. Environmental Health 19

Page 10/15
32. Lindstrom AB, Strynar MJ, Delinsky AD, Nakayama SF, McMillan L, Libelo EL, Neill M, Thomas L (2011) Application of WWTPBiosolids and Resulting Per�uorinated Compound Contamination of Surface and Well Water in Decatur, Alabama, USA.Environmental Science & Technology 45, 8015–8021
33. Liu L, Liu Y, Gao B, Ji R, Li C, Wang S (2019) Removal of per�uorooctanoic acid (PFOA) and per�uorooctane sulfonate (PFOS) fromwater by carbonaceous nanomaterials: A review. Critical Reviews in Environmental Science Technology 50:2379–2414
34. Lu Z, Lu R, Zheng H, Yan J, Song L, Wang J, Yang H, Cai M (2018) Risk exposure assessment of per- and poly�uoroalkylsubstances (PFASs) in drinking water and atmosphere in central eastern China. Environ Sci Pollut Res Int 25:9311–9320
35. Ma X, Shan G, Chen M, Zhao J, Zhu L (2018) Riverine inputs and source tracing of per�uoroalkyl substances (PFASs) in TaihuLake, China. Science of The Total Environment 612:18–25
3�. Miranda DA, Benskin JP, Awad R, Lepoint G, Leonel J, Hatje V (2021) Bioaccumulation of Per- and poly�uoroalkyl substances(PFASs) in a tropical estuarine food web. Sci Total Environ 754:142146
37. Naile JE, Khim JS, Hong S, Park J, Kwon BO, Ryu JS, Hwang JH, Jones PD, Giesy JP (2013) Distributions and bioconcentrationcharacteristics of per�uorinated compounds in environmental samples collected from the west coast of Korea. Chemosphere90:387–394
3�. Nascimento RA, Nunoo DBO, Bizkarguenaga E, Schultes L, Zabaleta I, Benskin JP, Spanó S, Leonel J (2018) Sul�uramid use inBrazilian agriculture: A source of per- and poly�uoroalkyl substances (PFASs) to the environment. Environ Pollut 242:1436–1443
39. Ojemaye CY, Petrik L (2019) Occurrences, levels and risk assessment studies of emerging pollutants (pharmaceuticals,per�uoroalkyl and endocrine disrupting compounds) in �sh samples from Kalk Bay harbour, South Africa. Environ Pollut 252:562–572
40. Pan CG, Yu KF, Wang YH, Zhang W, Zhang J, Guo J (2019) Per�uoroalkyl substances in the riverine and coastal water of the BeibuGulf, South China: Spatiotemporal distribution and source identi�cation. Sci Total Environ 660:297–305
41. Qi Y, Huo S, Hu S, Xi B, Su J, Tang Z (2016) Identi�cation, characterization, and human health risk assessment of per�uorinatedcompounds in groundwater from a suburb of Tianjin, China. Environmental Earth Sciences 75
42. Shigei M, Ahrens L, Hazaymeh A, Dalahmeh SS (2020) Per- and poly�uoroalkyl substances in water and soil in wastewater-irrigated farmland in Jordan. Sci Total Environ 716:137057
43. Ssebugere P, Sillanpaa M, Matovu H, Wang Z, Schramm KW, Omwoma S, Wanasolo W, Ngeno EC, Odongo S (2020) Environmentallevels and human body burdens of per- and poly-�uoroalkyl substances in Africa: A critical review. Sci Total Environ 739:139913
44. Sun R, Wu M, Tang L, Li J, Qian Z, Han T, Xu G (2018) Per�uorinated compounds in surface waters of Shanghai, China: Sourceanalysis and risk assessment. Ecotoxicol Environ Saf 149:88–95
45. Thomaidi VS, Tsahouridou A, Matsoukas C, Stasinakis AS, Petreas M, Kalantzi OI (2020) Risk assessment of PFASs in drinkingwater using a probabilistic risk quotient methodology. Sci Total Environ 712:136485
4�. UNEP (2019) Draft risk management evaluation per�uorohexane sulfonic acid (PFHxS), its salts and PFHxS-related compounds
47. http://chm.pops.int/TheConvention/POPsReviewCommittee/Meetings/POPRC15/Overview/tabid/8052/Default.aspx
4�. Xie L-N, Wang X-C, Dong X-J, Su L-Q, Zhu H-J, Wang C, Zhang D-P, Liu F-Y, Hou S-S, Dong B, Shan G-Q, Zhang X, Zhu Y (2021)Concentration, spatial distribution, and health risk assessment of PFASs in serum of teenagers, tap water and soil near a Chinese�uorochemical industrial plant. Environment International 146
49. Xu C, Liu Z, Song X, Ding X, Ding D (2021) Legacy and emerging per- and poly�uoroalkyl substances (PFASs) in multi-mediaaround a land�ll in China: Implications for the usage of PFASs alternatives. Sci Total Environ 751:141767
50. Yang L, Zhu L, Liu Z (2011) Occurrence and partition of per�uorinated compounds in water and sediment from Liao River andTaihu Lake, China. Chemosphere 83, 806 – 14
51. Zhang DQ, Wang M, He Q, Niu X, Liang Y (2020) Distribution of per�uoroalkyl substances (PFASs) in aquatic plant-based systems:From soil adsorption and plant uptake to effects on microbial community. Environ Pollut 257:113575
52. Zhao YG, Wan HT, Law AY, Wei X, Huang YQ, Giesy JP, Wong MH, Wong CK (2011) Risk assessment for human consumption ofper�uorinated compound-contaminated freshwater and marine �sh from Hong Kong and Xiamen. Chemosphere 85:277–283
53. Zhao Z, Cheng X, Hua X, Jiang B, Tian C, Tang J, Li Q, Sun H, Lin T, Liao Y, Zhang G (2020) Emerging and legacy per- andpoly�uoroalkyl substances in water, sediment, and air of the Bohai Sea and its surrounding rivers. Environ Pollut 263:114391
54. Zheng P, Liu M, Yin H, Shen L, Wang Y, Wu Q (2020) Analysis of 58 poly-/per�uoroalkyl substances and their occurrence in surfacewater in a high-technology industrial park. Environ Pollut 267:115381

Page 11/15
Substances park A park B DS park B WS
Surfacewater(n=1)
Groundwater(n=10) Surfacewater(n=2)
Groundwater(n=12) Surfacewater(n=4)
Groundwater(n=4)
F-53B 0.35 0.01-0.40 (0.09) 0.04-0.06(0.05)
Nd-0.06(0.01) 0.02-0.03(0.02) Nd-0.02(0.01)
PFBA 15.02 1.14-2501.4(400.41)
0.49-2.29(1.39)
0.69-345.21(65.78) 48.47-837.04(250.64)
82.44-527.74(289.68)
PFBS 57.76 17.07-51818.61(8734.27)
81.20-110.11(95.86)
13.63-2956.38(559.67)
15.90-3522.40(924.61)
28.46-874.23(376.10)
PFDA 0.02 nd-1.54(0.41) nd-0.05(0.03) nd-0.04(0.01) 0.04-0.13(0.09) 0.02-0.04(0.03)
PFDoA 0.00 nd-0.62(0.08) nd-0.03(0.01) nd 0.03-0.06(0.04) 0.03-0.04(0.035)
PFDS 0.00 nd-0.05(0.01) nd nd nd nd
PFHpA 0.84 1.10-681.07(94.28) 0.51-0.95(0.73)
nd-15.65(2.46) 0.83-16.76(5.04) 0.08-8.38(2.80)
PFHxA 1.18 0.47-936.32(136.09)
0.45-0.93(0.69)
nd-30.943(31.80) 0.48-97.73(25.26)
0.62-57.17(16.14)
PFHxDA 0.00 Nd-0.42(0.06) nd nd 0.02-0.03(0.025) nd
PFHxS 0.00 nd-539.60(106.87) nd-0.13(0.07) 0.1-9.22(0.96) 0.07-1.45(0.76) nd
PFNA 0.96 nd-5.29(1.22) 0.32-0.40(0.36)
nd-0.23(0.02) 0.15-0.69(0.46) nd-0.07(0.035)
PFOA 13.46 35.34-11305.65(1563.13)
9.38-55.01(32.19)
0.52-1208.24(134.11)
2.89-137.93(38.42)
0.85-72.70(21.56)
PFODA 0.15 nd-0.75(0.16) nd nd-0.16(0.09) 0.07-0.12(0.09) 0.05-0.11(0.08)
PFOS 0.87 0.18-55.17(12.28) 0.56-7.53(4.04)
nd-29.64(2.54) 0.05-0.62(0.32) nd-0.04(0.02)
PFPeA 0.00 037-313.35(58.86) nd-2.33(1.17) nd-24.02(4.21) 0.35-46.76(12.16)
0.11-29.52(8.15)
PFTeDA 0.03 Nd-0.53(0.07) nd nd 0.03-0.05(0.04) 0.02-0.03(0.025)
PFTrDA 0.00 Nd-0.29(0.04) nd nd 0.06-0.11(0.08) 0.04-0.05(0.045)
PFUdA 0.00 Nd-0.54(0.07) nd nd 0.12-0.21(0.16) 0.08-0.10(0.09)
TablesTable 1. The max and mean concentration of PFASs in water body of park A and park B (ng·L-1)
nd is not detected.
Figures
Page 12/15
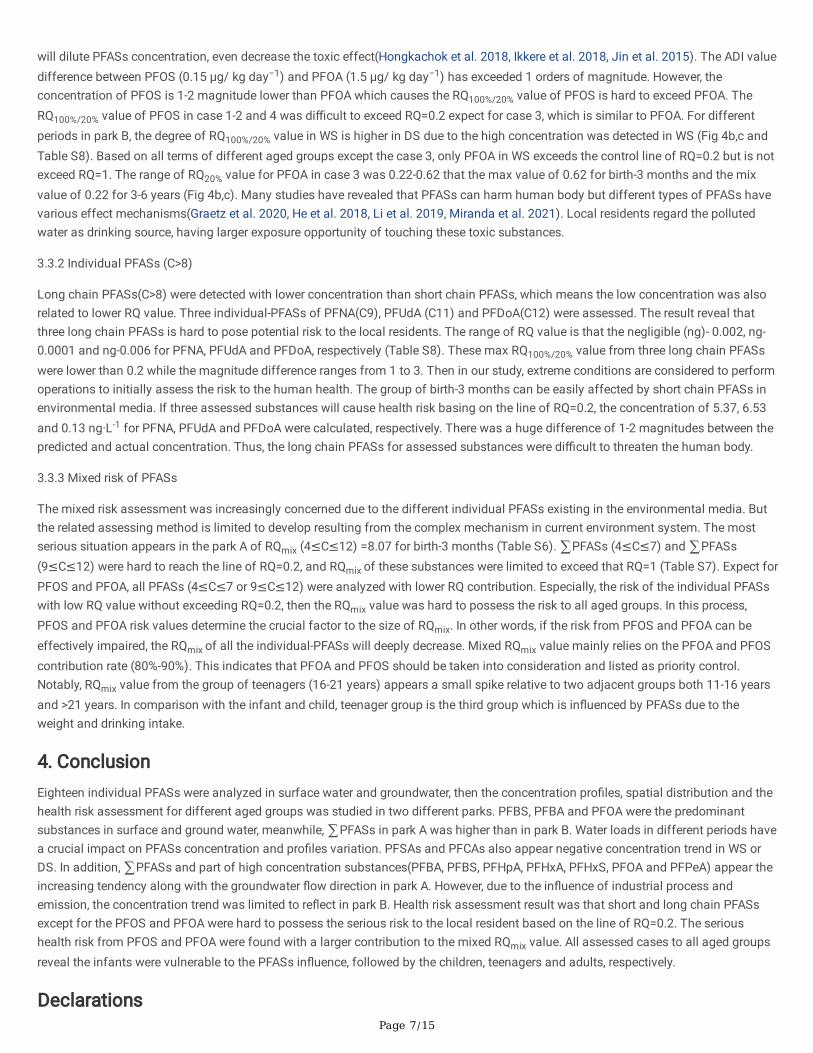
Figure 1
The sampling site of surface water and groundwater around two parks of Fuxin, China (FS is �re station and WWTP is waste watertreatment plant)
Page 13/15
Figure 2
The concentrations of ∑PFASs and pro�les of 18 PFASs in park A and park B-DS and WS of Fuxin, China
Page 14/15
Figure 3
The concentration contribution rate (%) basing on different carbon chain length of C4-C7 (short chain), C8 (long chain) and C9-C18(long chain) in two parks of Fuxin, China

Page 15/15
Figure 4
The RQ value of PFOA and PFOS in case 1-4 from park A and park B-WS and DS of Fuxin, China (case 1: the max concentration ofRSC100%, case 2: the mean concentration of RSC100%, case 3: the max concentration of RSC20% and case 4: the mean concentrationof RSC20%)
Supplementary Files
This is a list of supplementary �les associated with this preprint. Click to download.
Supportinginformation.doc