Substance Abuse Shiawassee, Michigan
96
Shiawassee County Community Health Assessment 2012
-
Upload
recoveryrestart2 -
Category
Health & Medicine
-
view
12 -
download
1
Transcript of Substance Abuse Shiawassee, Michigan

Shiawassee
County Community
Health Assessment
2012
Shiawassee
Community
Health Needs
Assessment
Team
Shiawassee United Way
Shiawassee Regional
Education Service District
Shiawassee County Health Department
826 West King Street, Owosso Ml 48867, 989-729-4724, www.Memorial Healthcare.org
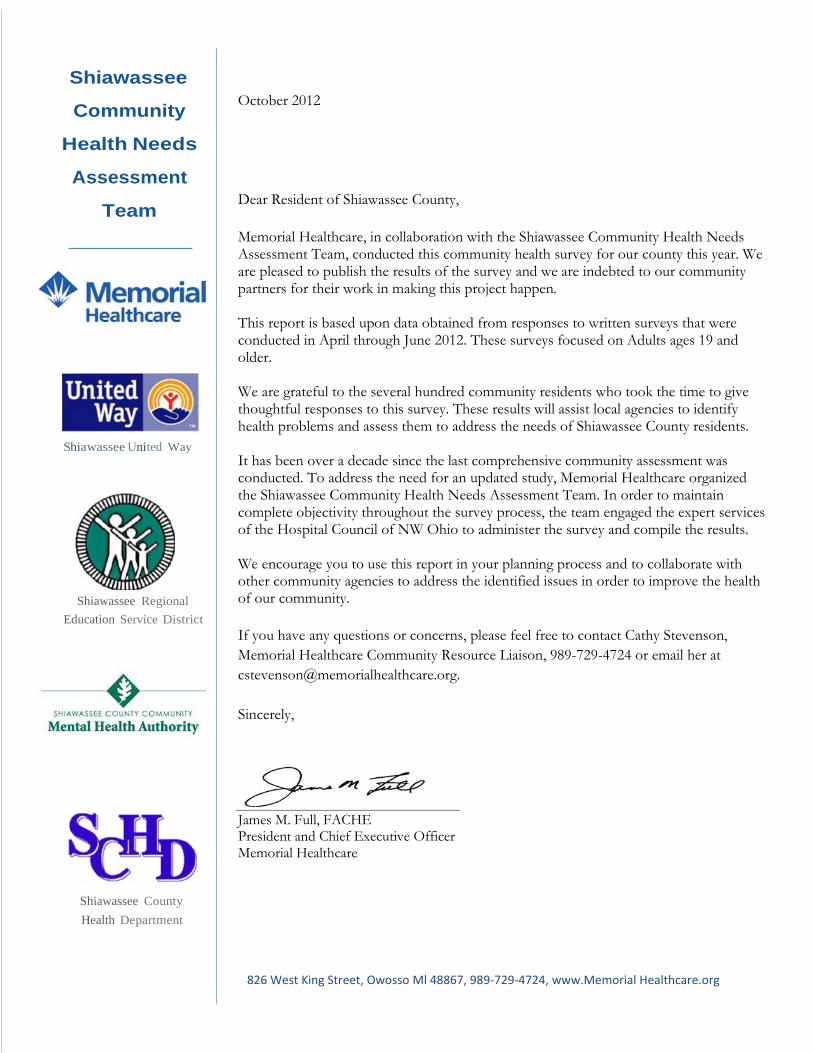
October 2012 Dear Resident of Shiawassee County, Memorial Healthcare, in collaboration with the Shiawassee Community Health Needs Assessment Team, conducted this community health survey for our county this year. We are pleased to publish the results of the survey and we are indebted to our community partners for their work in making this project happen. This report is based upon data obtained from responses to written surveys that were conducted in April through June 2012. These surveys focused on Adults ages 19 and older. We are grateful to the several hundred community residents who took the time to give thoughtful responses to this survey. These results will assist local agencies to identify health problems and assess them to address the needs of Shiawassee County residents. It has been over a decade since the last comprehensive community assessment was conducted. To address the need for an updated study, Memorial Healthcare organized the Shiawassee Community Health Needs Assessment Team. In order to maintain complete objectivity throughout the survey process, the team engaged the expert services of the Hospital Council of NW Ohio to administer the survey and compile the results. We encourage you to use this report in your planning process and to collaborate with other community agencies to address the identified issues in order to improve the health of our community. If you have any questions or concerns, please feel free to contact Cathy Stevenson, Memorial Healthcare Community Resource Liaison, 989-729-4724 or email her at [email protected]. Sincerely,
James M. Full, FACHE President and Chief Executive Officer Memorial Healthcare
AAcckknnoowwlleeddggeemmeennttss
Funding for the Shiawassee County Health Assessment Provided by:
Memorial Healthcare
Shiawassee United Way Shiawassee County Community Mental Health Authority
Shiawassee County Health Department Shiawassee Community Foundation
Member Organizations of the Shiawassee Community Health Needs Assessment Team:
Memorial Healthcare
Shiawassee United Way Shiawassee County Community Mental Health Authority
Shiawassee County Health Department Shiawassee Regional Education Service District
Contact Information
Catherine A. Stevenson Community Resource Liaison
Memorial Healthcare 826 West King Street
Owosso MI 48867 Direct Line (989) 729-4724

AAcckknnoowwlleeddggeemmeennttss
Planning Committee of the Shiawassee Community Health Needs Assessment:
Access Alliance
Alvin M. Bentley Foundation Baker College Workforce Investment Team
Career Alliance – Michigan Works! Catholic Charities City of Owosso
Community Members Durand Area Schools
Health Delivery, Inc., Shiawassee Community Health Center Memorial Healthcare
Memorial Healthcare Foundation Michigan Department of Human Services
Owosso Public Schools Respite Volunteers of Shiawassee County
SafeCenter Shiawassee Area Transportation Agency
Shiawassee Child Advocacy Center Shiawassee Community Foundation
Shiawassee Council Against Child Abuse Shiawassee Council on Aging
Shiawassee County Community Mental Health Authority Shiawassee County Health Department
Shiawassee County Juvenile Court Shiawassee County Sheriff’s Department Shiawassee Family YMCA – Live Healthy
Shiawassee Great Start Initiative Shiawassee Health & Human Services Council
Shiawassee Homeless Coalition Shiawassee Ministerial Representatives
Shiawassee Regional Chamber of Commerce Shiawassee Regional Education School District
Shiawassee United Way SRESD Workforce Investment Team
SVRC Industries Inc., Michigan Works! Transportation Solutions
Valley Area Agency on Aging

AAcckknnoowwlleeddggeemmeennttss
Project Management, Secondary Data, Data Collection, and Report
Development
Hospital Council of Northwest Ohio Britney L. Ward, MPH, Assistant Director of Health Planning
Margaret Wielinski, MPH, Health Improvement Data Specialist Michelle Von Lehmden, Health Assessment Coordinator
Patrick Trejchel, MPH, Community Improvement & Preparedness Coordinator Shari Gorski, Administrative Assistant
Natalie Dugan, Graduate Assistant, University of Toledo
Data Collection & Analysis
James H. Price, Ph.D., MPH, Professor Emeritus of Health Education, University of Toledo
Joseph A. Dake, Ph.D., MPH, Professor and Chair of Health Education, University of Toledo
Timothy R. Jordan, Ph.D., M.Ed., Professor of Health Education, University of Toledo

TTaabbllee ooff CCoonntteennttss
Executive Summary Section 1-Pages 1-9
Trend Summary Section 2-Pages 1-2
ADULT HEALTH (AGES 19 & OVER)
Health Perceptions Section 3-Pages 1-2
Health Care Coverage Section 4-Pages 1-3
Health Care Access Section 5-Pages 1-2
Cardiovascular Health Section 6-Pages 1-5
Cancer Section 7-Pages 1-4
Diabetes Section 8-Pages 1-4
Arthritis Section 9-Pages 1-2
Asthma and Other Respiratory Disease Section 10-Pages 1-2
Weight Status Section 11-Pages 1-2
Tobacco Use Section 12-Pages 1-5
Alcohol Consumption Section 13-Pages 1-5
Marijuana and Other Drug Use Section 14-Pages 1-2
Women’s Health Section 15-Pages 1-5
Men’s Health Section 16-Pages 1-4
Preventive Medicine & Health Screenings Section 17-Page 1
Sexual Behavior & Pregnancy Outcomes Section 18-Pages 1-7
Quality of Life and Safety Section 19-Page 1
Social Context and Safety Section 20-Page 1
Mental Health and Suicide Section 21-Pages 1-2
Oral Health Section 22-Pages 1-2
APPENDICES
Health Assessment Information Sources Appendix i – Pages 1-4
List of Acronyms and Terms Appendix ii – Pages 1-2
Weighting Methods Appendix iii – Pages 1-3
Health Survey Demographics Appendix iv – Page 1
Demographics Appendix v – Pages 1-8

Section 1- Page 1
Shiawassee County Community Assessment
Executive Summary
his executive summary provides an overview of health-related data for Shiawassee County adults (19 years of age and older) who participated in a county-wide health assessment survey during 2012. The findings are based on self-administered surveys using a structured questionnaire. The questions were
modeled after the survey instrument used by the Centers for Disease Control and Prevention for their national and state Behavioral Risk Factor Surveillance System (BRFSS). The Hospital Council of Northwest Ohio collected the data, guided the health assessment process and integrated sources of primary and secondary data into the final report.
Primary Data Collection Methods Design This community health assessment was cross-sectional in nature and included a written survey of adults within Shiawassee County. From the beginning, community leaders were actively engaged in the planning process and helped define the content, scope, and sequence of the study. Active engagement of community members throughout the planning process is regarded as an important step in completing a valid needs assessment. Instrument Development One adult survey instrument was designed and pilot tested for this study. As a first step in the design process, health education researchers from the University of Toledo and staff members from the Hospital Council of NW Ohio met to discuss potential sources of valid and reliable survey items that would be appropriate for assessing the health status and health needs of adults. The investigators decided to derive the majority of the adult survey items from the BRFSS. This decision was based on being able to compare local data with state and national data. The Project Coordinator from the Hospital Council of NW Ohio conducted a series of meetings with the planning committee from Shiawassee County. During these meetings, banks of potential survey questions from the BRFSS were reviewed and discussed. Based on input from the Shiawassee County planning committee, the Project Coordinator composed a draft survey containing 119 items for the adult survey. The draft was reviewed and approved by health education researchers at the University of Toledo. Sampling Adults ages 19 and over living in Shiawassee County were used as the sampling frame for the adult survey. Since U.S. Census Bureau age categories do not correspond exactly to this age parameter, the investigators calculated the population of those 18 years and over living in Shiawassee County. There were 53,589 persons ages 18 and over living in Shiawassee County. The investigators conducted a power analysis to determine what sample size was needed to ensure a 95% confidence level with a corresponding confidence interval of 5% (i.e., we can be 95% sure that the “true” population responses are within a 5% margin of error of the survey findings.) A sample size of at least 382 responding adults was needed to ensure this level of confidence. The response rate for the mailing was 43% (n=428). This return rate and sample size means that the responses in the health assessment should be representative of the entire county.
T

Section 1 – Page 2
Primary Data Collection Methods The random sample of mailing addresses of adults from Shiawassee County was obtained from American Clearinghouse in Louisville, KY. Procedure Prior to mailing the survey to adults, an advance letter was mailed to 1,000 adults in Shiawassee County. This advance letter was personalized, printed on Shiawassee County Health Needs Assessment Team stationery and was signed by James Full, President and CEO, Memorial Healthcare, and George Pichette, Health Director, Shiawassee County Health Department. The letter introduced the county health assessment project and informed the readers that they may be randomly selected to receive the survey. The letter also explained that the respondents’ confidentiality would be protected and encouraged the readers to complete and return the survey promptly if they were selected.
Two weeks following the advance letter, a three-wave mailing procedure was implemented to maximize the survey return rate. The initial mailing included a personalized hand signed cover letter (on Shiawassee County Health Needs Assessment Team stationery) describing the purpose of the study; a questionnaire printed on colored paper; a self-addressed stamped return envelope; and a $2 incentive. Approximately two weeks after the first mailing, a second wave mailing included another personalized cover letter encouraging them to reply, another copy of the questionnaire on colored paper, and another reply envelope. A third wave postcard was sent two weeks after the second wave mailing. Surveys returned as undeliverable were not replaced with another potential respondent. Data Analysis
Individual responses were anonymous and confidential. Only group data are available. All data were analyzed by health education researchers at the University of Toledo using SPSS 17.0. Crosstabs were used to calculate descriptive statistics for the data presented in this report. To be representative of Shiawassee County, the adult data collected was weighted by age, gender, race, and income using 2010 census data. Multiple weightings were created based on this information to account for different types of analyses. For more information on how the weightings were created and applied, see Appendix iii. Limitations
As with all county assessments, it is important to consider the findings in light of all possible limitations. First, the Shiawassee County adult assessment had an acceptable response rate (43%). However, if any important differences existed between the respondents and the non-respondents regarding the questions asked, this would represent a threat to the external validity of the results (the generalizability of the results to the population of Shiawassee County). If there were little to no differences between respondents and non-respondents, then this would not be a limitation.
Second, it is important to note that, although several questions were asked using the same wording as the CDC questionnaire, the adult data collection method differed. CDC adult data were collected using a set of questions from the total question bank and adults were asked the questions over the telephone rather than as a mail survey.

Section 1 – Page 3
Shiawassee County Executive Summary
Health Perceptions In 2012, over half (57%) of Shiawassee County adults rated their health status as excellent or very good. Conversely, 13% of adults, increasing to 37% of those with annual incomes less than $25,000, described their health as fair or poor.
*Respondents were asked: “Would you say that in general your health is excellent, very good, good, fair or poor?”
Health Care Coverage The 2012 health assessment data has identified that 14% of Shiawassee County adults were without health care coverage. Those most likely to be uninsured were adults ages 30-59 and those with an income level under $25,000. In Shiawassee County, 15.4% of residents live below the poverty level. (Source U.S. Census, American Community Survey 5 Year Estimates, 2005-2009)
0%
20%
40%
60%
80%
100%
Total Males Females Under 30 30-59years
60 & Over Income<$25K
Income$25K Plus
57% 51% 62% 66%
53% 50%
30%
65%
30% 31%
30% 26% 33% 31%
33%
28%
13% 18% 8% 8% 14% 19%
37%
7%
Shiawassee County Adult Health Perceptions*
Excellent/Very Good Good Fair/Poor
0%
10%
20%
30%
40%
50%
Total Male Female Under 30 30-59years
60 & Over Income<$25K
Income$25K Plus
14% 17%
11%
18% 20%
5%
46%
5%
Uninsured Shiawassee County Adults

Section 1 – Page 4
Shiawassee County Executive Summary
Health Care Access The 2012 health assessment project identified that 58% of Shiawassee County adults had visited a doctor for a routine checkup within the last year. 57% reported they had one particular doctor or healthcare provider they went to for routine medical care.
Cardiovascular Health Heart disease (24%) and stroke (5%) accounted for 29% of all Shiawassee County adult deaths in 2010 (Source: MDCH,
Vital Statistics 2010). The 2012 Shiawassee County health assessment found that 4% of adults had a heart attack and 2% had a stroke at some time in their life. More than one-fourth (29%) of Shiawassee County adults have been diagnosed with high blood pressure, 37% have high blood cholesterol, 19% were smokers, and 33% were obese, four known risk factors for heart disease and stroke.
Cancer Michigan Department of Community Health statistics indicate that from 2001-2010, a total of 1,487 Shiawassee County residents died from cancer, the second leading cause of death in the county. The 2012 health assessment project has identified that 12% of Shiawassee County adults were diagnosed with cancer at some time in their life. The American Cancer Society advises that reducing tobacco use, increasing cancer education and awareness, healthy diet and exercise habits, and early detection may reduce overall cancer deaths.
Diabetes In 2012, 11% of Shiawassee County adults had been diagnosed with diabetes.
Arthritis According to the Shiawassee County survey data, 33% of Shiawassee County adults were diagnosed with arthritis. According to the 2011 BRFSS, 31% of Michigan adults and 24% of U.S. adults were told they have arthritis.
Shiawassee County Leading Types of Death
2010 Total Deaths: 711 1. Heart Diseases (24% of all deaths) 2. Cancers (22%) 3. Chronic Lower Respiratory Diseases (9%) 4. Stroke (5%) 5. Accidents, Unintentional Injuries (5%)
(Source: MDCH, Vital Statistics 2010)
Shiawassee County Incidence of Cancer, 2011
All Types: 252 cases 1. Lung and Bronchus: 47 cases (19%) 2. Breast: 41 cases (16%) 3. Prostate: 39 cases (15%) 4. Colon and Rectum: 15 cases (6%) 5. Non-Hodgkin’s Lymphoma: 14 cases (6%) 6. Bladder: 7 cases (3%)
(Source: Memorial Healthcare, Cancer Program, Community Needs Assessment, August 2012)
Diabetes Facts
Diabetes was the 7th leading cause of death in Shiawassee County in 2010.
Diabetes was the 7th leading cause of death in Michigan in 2010.
From 2008 to 2010, Diabetes had an age-adjusted mortality rate of 29.3 for both males and females in Shiawassee County
(Source: MDCH, Vital Statistics, 2010 and Mortality Trends)

Section 1 – Page 5
Shiawassee County Executive Summary Asthma According to the Shiawassee County survey data, 16% of Shiawassee County adults had been diagnosed with asthma.
Adult Weight Status
The 2012 Health Assessment project identified that 69% of Shiawassee County adults were overweight or obese based on BMI. The 2011 BRFSS indicates that 31% of Michigan and 28% of U.S. adults were obese by BMI. One-third (33%) of Shiawassee County adults were obese. Half (50%) of adults were trying to lose weight. 20% of adults had not been participating in any physical activities or exercise in the past week.
(Percentages may not equal 100% due to the exclusion of data for those who were classified as underweight)
Adult Tobacco Use In 2012, 19% of Shiawassee County adults were current smokers and 24% were considered former smokers. In 2011, the American Cancer Society (ACS) stated that tobacco use was the most preventable cause of disease and early death in the world, accounting for approximately 5.4 million premature deaths each year. ACS estimated that tobacco use would be linked to approximately one in five deaths in the U.S. (Source: Cancer Facts & Figures, American Cancer Society, 2011)
0%
20%
40%
60%
80%
100%
Total Male Female Under 30 30-59 Years 60 & Over Income <$25K
Income$25K Plus
30% 15%
45% 48%
26% 26% 29% 30%
36% 49%
23% 32%
35% 40% 34% 34%
33% 35% 31% 18%
38% 32% 35% 35%
Shiawassee County Adult BMI Classifications
Normal Overweight Obese

Section 1 – Page 6
Shiawassee County Executive Summary
Respondents were asked: “Have you smoked at least 100 cigarettes in your entire life?
If yes, do you now smoke cigarettes every day, some days or not at all?”
Adult Alcohol Consumption In 2012, half (50%) of the Shiawassee County adults had at least one alcoholic drink in the past month. In 2012, the health assessment indicated that 13% of Shiawassee County adults were considered frequent drinkers (drank an average of three or more days per week, per CDC guidelines). 41% of adults who drank had five or more drinks on one occasion (binge drinking) in the past month. Eight percent of adults drove after having perhaps too much to drink.
*Based on adults who have drunk alcohol in the past month. Binge drinking is defined as having five or more drinks on an occasion (for males) or four
or more drinks on an occasion (for females).
0%
20%
40%
60%
80%
100%
Total Male Female Under 30 30-59 Years 60 & Over Income<$25K
Income$25K Plus
19% 22% 15% 27%
19% 12% 28%
16%
24% 28% 21%
10% 23% 39% 24%
24%
57% 50%
64% 63% 58% 49% 48% 60%
Shiawassee County Adult Smoking Behaviors
Current smoker Former smoker Never smoked
0%
20%
40%
60%
80%
Total Males Females Under 30 30-59Years
60 & Over Income<$25K
Income$25K Plus
41% 41% 42% 43% 45%
22%
46% 41%
Shiawassee County Adult Drinkers Who Binge Drank in Past Month*

Section 1 – Page 7
Shiawassee County Executive Summary Adult Marijuana and Other Drug Use
In 2012, 9% of Shiawassee County adults had used marijuana during the past 6 months, and 9% of adults misused medications.
Women’s Health In 2012, three-fifths (60%) of Shiawassee County women over the age of 40 reported having a mammogram in the past year. 55% of Shiawassee County women have had a clinical breast exam and 44% have had a Pap smear to detect cancer of the cervix in the past year. The health assessment determined that almost one-quarter (24%) of women had high blood pressure, 29% had high blood cholesterol, 31% were obese, and 15% were identified as smokers, known risk factors for cardiovascular diseases.
0%
5%
10%
15%
20%
25%
Total Male Female Under 30 30-59Years
60 & Over Income<$25K
Income$25K Plus
9% 8% 9%
18%
9%
2%
12%
9%
Shiawassee County Adult Marijuana Use in Past 6 Months

Section 1 – Page 8
Shiawassee County Executive Summary
Men’s Health In 2012, more than half (52%) of Shiawassee County males over the age of 50 had a Prostate-Specific Antigen (PSA) test in the past year. 54% of males over the age of 50 had a digital rectal exam in the past year. Major cardiovascular diseases (heart disease and stroke) accounted for 34% and cancers accounted for 25% of all male deaths in Shiawassee County in 2009. The health assessment determined that 7% of men had a heart attack, and 1% had a stroke at some time in their life. Over one-third (35%) of men had been diagnosed with high blood pressure, 46% had high blood cholesterol, and 22% were identified as smokers, which, along with obesity (35%), are known risk factors for cardiovascular diseases.
0%
25%
50%
75%
100%
Total Under 40 40 & Older Income <$25K Income >$25K
39%
2%
60%
24%
42%
55% 55% 56%
36%
61%
44%
61%
37% 34%
49%
Shiawassee County Women's Health Exams Within the Past Year
Mammogram Breast Exam Pap Smear
0%
25%
50%
75%
Total Under 50 50 & Older Income <$25K Income >$25K
35%
12%
52%
23%
37% 38%
13%
54%
31%
41%
Shiawassee County Men's Health Exams Within the Past Year
Prostate-Specific Antigen Digital Rectal

Section 1 – Page 9
Shiawassee County Executive Summary Preventive Medicine and Health Screenings 57% of adults over 50 had received a colonoscopy or sigmoidoscopy in the past 5 years. 26% of adults have received a pneumonia shot in their lifetime. Adult Sexual Behavior & Pregnancy Outcomes In 2012, nearly three-fourths (71%) of Shiawassee County adults had sexual intercourse. Six percent of adults had more than one partner. Even though young people aged 15-24 represent only 25% of the sexually experienced population, they acquire nearly half of all STDs (Source: CDC, STDs in Adolescents and Young Adults, 2009 STD Surveillance). Quality of Life Nearly one-quarter (24%) Shiawassee County adults in 2012 reported they were limited in some way because of a physical, mental or emotional problem. Social Context and Safety The health assessment identified that about 1 in 14 (7%) adults were abused in the past year. 12% of adults received assistance for food in the past year. Adult Mental Health and Suicide In 2012, 3% of Shiawassee County adults considered attempting suicide. 9% of adults felt so sad or hopeless nearly every day for two or more weeks that they stopped doing usual activities. Oral Health The 2012 health assessment project has determined that almost two-thirds (65%) of Shiawassee County adults had visited a dentist or dental clinic in the past year. The 2010 BRFSS reported that 70% of U.S. adults and 73% of Michigan adults had visited a dentist or dental clinic in the previous twelve months.

Section 2- Page 1
Shiawassee County Trend Summary
Adult Variables Shiawassee
County 2012
Michigan 2011
U.S. 2011
Health Status Rated health as excellent or very good 57% 50% 51% Rated general health as fair or poor 13% 17% 17% Average days that physical health not good in past month 3.1 3.6* 3.7* Average days that mental health not good in past month 3.5 3.7* 3.5* Average days that poor physical or mental health kept them
from doing their usual activities in past month 2.4 2.3* 2.3*
Health Care Access/Coverage Has health care coverage 86% 85% 82%
Arthritis, Asthma, & Diabetes Has been diagnosed with arthritis 33% 31% 24% Has ever been diagnosed with asthma 19% 15% 14% Has been diagnosed with diabetes 11% 11% 10%
Cardiovascular Health Had angina 5% 5% 4% Had a heart attack 4% 5% 4% Had a stroke 2% 3% 3% Has been diagnosed with high blood pressure 29% 34% 31% Has been diagnosed with high blood cholesterol 37% 42% 38% Had blood cholesterol checked within the past 5 years 82% 77% 76%
Weight Status Overweight 36% 34% 36% Obese 33% 31% 28%
Alcohol Consumption Had at least one alcoholic beverage in past month 50% 58% 57% Binged in past month (5 or more drinks in a couple of hours
on an occasion) 20% 20% 18%
Tobacco Use Current smoker (currently smoke some or all days) 19% 23% 21% Former smoker (smoked 100 cigarettes in lifetime & now do
not smoke) 24% 26% 25% N/A= not available
*2010 BRFSS data

Section 2 – Page 2
Shiawassee County Trend Summary
Adult Variables Shiawassee
County 2012
Michigan 2011
U.S. 2011
Preventive Health Age 65 & over had a pneumonia vaccine in lifetime 66% 67% 70% Age 50 & over had a colonoscopy/sigmoidoscopy in the past
5 years 57% 57%* 53%*
Age 40 & over had a clinical breast exam in the past two years 78% 78%* 75%*
Age 40 & over had a mammogram in the past two years 77% 78%* 75%* Had a pap smear in the past three years 79% 82%* 81%* Age 40 & over had a PSA test in within the past 2 years 59% 55%* 53%*
Quality of Life & Social Context Limited in some way because of physical, mental or
emotional problem 24% 26% 24%
Oral Health Adults who have visited the dentist in the past year 65% 73%* 70%* Adults who had one or more permanent teeth removed 39% 41%* 44%* Adults 65 years and older who had all of their permanent
teeth removed 20% 13%* 17%*
N/A= not available *2010 BRFSS data
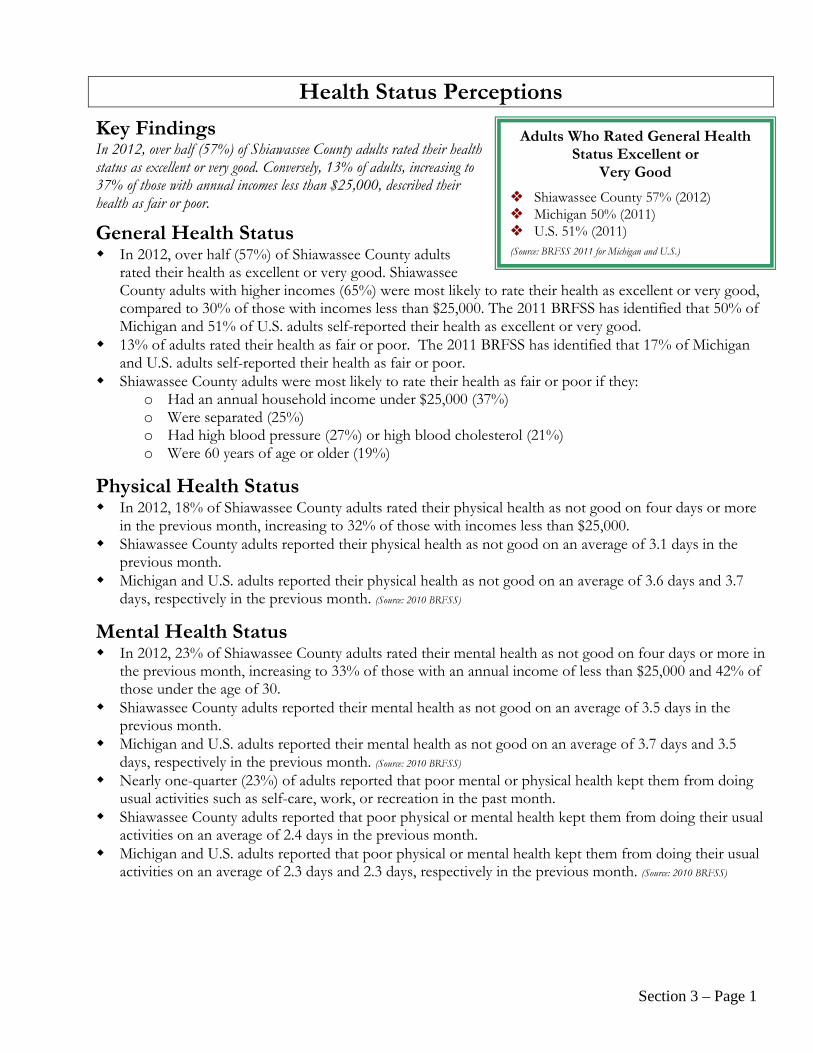
Section 3 – Page 1
Health Status Perceptions
Key Findings In 2012, over half (57%) of Shiawassee County adults rated their health status as excellent or very good. Conversely, 13% of adults, increasing to 37% of those with annual incomes less than $25,000, described their health as fair or poor.
General Health Status In 2012, over half (57%) of Shiawassee County adults
rated their health as excellent or very good. Shiawassee County adults with higher incomes (65%) were most likely to rate their health as excellent or very good, compared to 30% of those with incomes less than $25,000. The 2011 BRFSS has identified that 50% of Michigan and 51% of U.S. adults self-reported their health as excellent or very good.
13% of adults rated their health as fair or poor. The 2011 BRFSS has identified that 17% of Michigan and U.S. adults self-reported their health as fair or poor.
Shiawassee County adults were most likely to rate their health as fair or poor if they: o Had an annual household income under $25,000 (37%) o Were separated (25%) o Had high blood pressure (27%) or high blood cholesterol (21%) o Were 60 years of age or older (19%)
Physical Health Status In 2012, 18% of Shiawassee County adults rated their physical health as not good on four days or more
in the previous month, increasing to 32% of those with incomes less than $25,000. Shiawassee County adults reported their physical health as not good on an average of 3.1 days in the
previous month. Michigan and U.S. adults reported their physical health as not good on an average of 3.6 days and 3.7
days, respectively in the previous month. (Source: 2010 BRFSS)
Mental Health Status In 2012, 23% of Shiawassee County adults rated their mental health as not good on four days or more in
the previous month, increasing to 33% of those with an annual income of less than $25,000 and 42% of those under the age of 30.
Shiawassee County adults reported their mental health as not good on an average of 3.5 days in the previous month.
Michigan and U.S. adults reported their mental health as not good on an average of 3.7 days and 3.5 days, respectively in the previous month. (Source: 2010 BRFSS)
Nearly one-quarter (23%) of adults reported that poor mental or physical health kept them from doing usual activities such as self-care, work, or recreation in the past month.
Shiawassee County adults reported that poor physical or mental health kept them from doing their usual activities on an average of 2.4 days in the previous month.
Michigan and U.S. adults reported that poor physical or mental health kept them from doing their usual activities on an average of 2.3 days and 2.3 days, respectively in the previous month. (Source: 2010 BRFSS)
Adults Who Rated General Health Status Excellent or
Very Good
Shiawassee County 57% (2012) Michigan 50% (2011) U.S. 51% (2011)
(Source: BRFSS 2011 for Michigan and U.S.)

Section 3 – Page 2
Health Status Perceptions The following graph shows the percentage of Shiawassee County adults who described their personal health status as excellent/very good, good, and fair/poor. Examples of how to interpret the information include: 57% of all Shiawassee County adults, 66% of those under age 30, and 50% of those ages 60 and older rated their health as excellent or very good. The table shows the percentage of adults with poor physical and mental health in the past 30 days.
*Respondents were asked: “Would you say that in general your health is excellent, very good, good, fair or poor?”
Health Status No Days 1-3 Days 4-5 Days 6-7 Days 8 or More Days
Physical Health Not Good in Past 30 Days* Males 66% 8% 5% 1% 10%
Females 69% 7% 7% 1% 12% Total 67% 8% 6% 1% 11%
Mental Health Not Good in Past 30 Days* Males 75% 4% 2% 1% 14%
Females 48% 14% 10% 1% 14% Total 62% 9% 6% 1% 14%
*Totals may not equal 100% as some respondents answered “Don’t know/Not sure”.
2012 Adult Comparisons
Shiawassee County
2012
Michigan 2011
U.S. 2011
Rated health as excellent or very good 57% 50% 51% Rated health as fair or poor 13% 17% 17%
Average days that physical health not good in past month 3.1 3.6* 3.7* Average days that mental health not good in past month 3.5 3.7* 3.5*
Average days that poor physical or mental health kept them from doing their usual activities in past month 2.4 2.3* 2.3*
* 2010 BRFSS data
0%
20%
40%
60%
80%
100%
Total Males Females Under 30 30-59years
60 & Over Income<$25K
Income$25K Plus
57% 51% 62% 66%
53% 50%
30%
65%
30% 31%
30% 26% 33% 31%
33%
28%
13% 18% 8% 8% 14% 19%
37%
7% Shiawassee County Adult Health Perceptions*
Excellent/Very Good Good Fair/Poor

Section 4 – Page 1
Health Care Coverage
Key Findings The 2012 health assessment data has identified that 14% of Shiawassee County adults were without health care coverage. Those most likely to be uninsured were adults ages 39-59 and those with an income level under $25,000. In Shiawassee County, 15.4% of residents live below the poverty level. (Source U.S. Census, American Community Survey 5 Year Estimates, 2005-2009)
General Health Coverage In 2012, 86% Shiawassee County
adults had health care coverage, leaving 14% who were uninsured. The 2011 BRFSS reports uninsured prevalence rates for Michigan (15%) and the U.S. (18%).
14% of adults were without healthcare coverage, increasing to 20% of those ages 30-59 and 46% of those with incomes less than $25,000.
19% of adults with children did not have healthcare coverage, compared to 12% of those who did not have children living in their household.
7% of Shiawassee County adults reported their health care coverage kept them from seeing doctors and using health facilities in Shiawassee County.
The following types of health care coverage were used: employer (42%), someone else’s employer (20%), Medicare (10%), multiple-including private sources (10%), self-paid plan (7%), Medicaid or medical assistance (4%), multiple-including government sources (4%), military/CHAMPUS/TriCare/VA (2%), and other (1%).
Shiawassee County adult health care coverage included the following: medical (100%), prescription coverage (89%), their spouse (77%), immunizations (74%), dental (74%), preventive care (71%), vision (68%), mental health (67%), their children (62%), alcohol or substance abuse treatment (43%), home care (38%), skilled nursing (31%), and hospice (28%).
The top five reasons uninsured adults gave for being without health care coverage were: 1. They could not afford to pay the insurance premiums (52%) 2. They lost their job or changed employers (34%) 3. Their employer does not/stopped offering coverage (27%) 4. They lost Medicaid eligibility (18%) 5. They became a part-time/temporary employee (13%) (Percentages do not equal 100% because respondents could select more than one reason)
2012 Adult Comparisons
Shiawassee County
2012
Michigan 2011
U.S. 2011
Uninsured 14% 15% 18%
Shiawassee County Medicaid Health Plan Enrollees
Residents
Enrolled in Medicaid
Health Plans of Enrollees
Shiawassee County
April 2012
8,709
Health Plus Partners Inc.
McLaren Health Plan Meridian Health Plan of MI
PHP Family Care
Shiawassee County
April 2011
8,817
Health Plan of Michigan Health Plus Partners Inc.
McLaren Health Plan PHP of Mid-Michigan-
Family Care (Source: MDCH, Health Care Coverage, Medicaid and Center for Medicare & Medicaid Services, http://www.medicaid.gov/Medicaid-CHIP-Program-Information/By-State/michigan.html)

Section 4 – Page 2
Health Care Coverage The following graph shows the percentages of Shiawassee County adults who were uninsured by demographic characteristics. Examples of how to interpret the information in the first graph include: 14% of all Shiawassee County adults were uninsured, 46% of adults with an income less than $25,000 reported being uninsured and 18% of those under age 30 lacked health care coverage. The pie chart shows sources of Shiawassee County adults’ health care coverage.
0%
10%
20%
30%
40%
50%
Total Male Female Under 30 30-59 years 60 & Over Income<$25K
Income$25K Plus
14% 17%
11%
18% 20%
5%
46%
5%
Uninsured Shiawassee County Adults
Employer 42%
Medicare 10%
Medicaid 4%
Self-purchased 7% Others
1%
Someone Else's Employer
20%
Multiple-including private
10%
Multiple-including government
4%
Military/VA 2%
Source of Health Coverage for Shiawassee County Adults

Section 4 – Page 3
Health Care Coverage
Shiawassee County Medicaid and Medicare Enrollees
As of April 2012, there were approximately 8,709 Shiawassee County residents enrolled in Medicaid. As of March 2011, there were approximately 12,840 people enrolled in Medicare in Shiawassee County.
(Source: Michigan Department of Community Health; Kaiser Family Foundation, Medicaid Health and Prescription Drug Plan Tracker, March 2011)
Medicaid Payments, FY 2009
Michigan Enrollees
Michigan Expenditures*
U.S. Enrollees
U.S. Expenditures*
By Enrollment Group Children 21% $2,137,525,758 21% $71,111,551,676 Adults 16% $1,587,905,813 14% $47,382,742,690 Disabled 42% $4,209,000,195 43% $147,331,691,737 Aged 21% $2,087,554,675 23% $80,660,323,951
TOTAL 100% $10,021,986,441 100% $346,488,974,182
By Enrollee **(Average payment) Children 21% $1,926 21% $2,313 Adults 16% $3,625 14% $2,926 Disabled 42% $12,642 43% $15,453 Aged 21% $15,139 23% $13,186
*Spending includes both state and federal payments to Medicaid. The payment amounts from the source data reflect payments for services during federal fiscal year 2009, based on date of payment. **The average (mean) level of payments across all Medicaid enrollees does not include disproportionate share hospital payments (DSH). (Source: Kaiser Family Foundation, Michigan State Health Facts, Medicaid 2009)
Healthy People 2020 Access to Quality Health Services
Objective Shiawassee County 2012
Michigan 2011
U.S. 2011
Healthy People 2020
Target AHS-1.1: Persons under age of 65 years with health care insurance
85% age 20-24 95% age 25-34 74% age 35-44 78% age 45-54 89% age 55-64
76% age 18-24 76% age 25-34 81% age 35-44 86% age 45-54 89% age 55-64
75% age 18-24 73% age 25-34 80% age 35-44 84% age 45-54 87% age 55-64
100%
(Source: Healthy People 2020 Objectives, 2011 BRFSS, 2012 Shiawassee County Assessment)
A Guide to Michigan Medicaid Health Plans All Medicaid health plans cover medically-necessary services such as:
Ambulance Immunizations (shots) Doctor visits Lab and x-ray Emergency care Medical supplies Family planning Medicine Health checkups for children and adults Mental health Hearing and speech Physical and occupational therapy Home health care Prenatal care and delivery Hospice care Surgery Hospital care Vision
All Medicaid health plans are required to provide the services listed above. Some of these services are limited. Your doctor or health plan can tell you what Medicaid covers.
(Source: Michigan Department of Community Health (MDCH), published January 2012)

Section 5 – Page 1
Health Care Access
Key Findings The 2012 health assessment project identified that 58% of Shiawassee County adults had visited a doctor for a routine checkup within the last year. 57% reported they had one particular doctor or healthcare provider they went to for routine medical care.
Health Care Access 58% of Shiawassee County adults have visited
their doctor for a routine checkup within the past year; 75% have visited their doctor within the past two years; 86% have visited their doctor within the past 5 years; and 2% have never visited their doctor for a routine checkup.
In 2012, 20% of adults could not see a doctor when needed at some time in the past year due to cost, increasing to 51% of those with incomes less than $25,000.
5% of parents had wanted to see a doctor for their child’s healthcare needs but were unable to, increasing to 14% of parents with incomes less than $25,000.
57% of Shiawassee County adults reported they had one particular doctor or healthcare professional they go to for routine medical care, decreasing to 44% of those with incomes less than $25,000. 26% of adults had more than one particular doctor or healthcare professional they go to for routine medical care, and 17% did not have one at all.
When adults were sick or need advice about their health, they usually went to the following: a doctor’s office (67%), no usual place (6%), urgent care center (4%), public health clinic or community health center (1%), hospital outpatient department (1%), hospital emergency room (1%), alternative therapies (<1%), chiropractor (<1%), and some other place (2%). 16% of adults went to multiple places, including a doctor’s office.
63% of Shiawassee County adults chose to go outside of Shiawassee County for health care services in the past year. The top 5 services they sought outside of Shiawassee County were: dental services (27%), primary care (26%), specialty care (21%), obstetrics/gynecology (12%), and cardiac care (7%).
Shiawassee County adults had the following problems when they needed health care in the past year: did not have enough money for health care or insurance (14%), could not get appointments when they wanted them (7%), could not find a doctor they were comfortable with (6%), had to change doctors because of their healthcare plan (3%), could not find a doctor to take them as a patient (3%), were too embarrassed to seek help (3%), were too busy to get the healthcare they needed (2%), did not get health services because they were concerned about confidentiality (2%), healthcare plan did not allow them to see any doctors in Shiawassee County (1%), did not have transportation (1%), did not get health services because of discrimination (1%), did not have childcare (<1%), and some other problem that kept them from getting healthcare (2%).
The following might prevent Shiawassee County adults from seeing a doctor if they were sick, injured, or needed some kind of health care: cost (33%), no insurance (19%), hours not convenient (10%), difficult to get an appointment (10%), worried they might find something wrong (8%), could not get time off work (7%), frightened of the procedure or doctor (5%), do not trust or believe doctors (4%), difficult to find/no transportation (3%), and some other reason (5%).
Shiawassee County adults had the following transportation problems when they needed health care: could not afford gas (6%), no driver’s license (4%), no car (3%), disabled (2%), car did not work (1%), no car insurance (1%), and other car issues/expenses (2%).
Shiawassee County Health Care Statistics
In 2010, 14.0% of all Shiawassee County residents were uninsured.
As of April 2012, there were 13,796 residents in Shiawassee County that were eligible for Medicaid.
As of April 2012, there were 1,135 residents (406 adults and 729 children) in Shiawassee County that were receiving FIP (Family Independence Program).
(Source: Michigan Department of Community Health, http://www.michigan.gov/mdch & Green Book Report of Key Program Statistics, April 2012, State of Michigan, Department of Human Services, obtained from: http://www.michigan.gov/documents/dhs/2012_04_GreenBook_385868_7.pdf)

Section 5 – Page 2
Health Care Access
During the past year, Shiawassee adults did not get a prescription from their doctor filled because: they could not afford to pay the out-of-pocket expenses (16%), they had no insurance (11%), they did not think they needed it (5%), their co-pays were too high (5%), there was no generic equivalent of what was prescribed (4%), their deductibles were too high (2%), and they were taking too many medications (2%), their premiums were too high (1%), they had a high health savings account (HSA) deductible (1%), no transportation (1%), and they opted out of prescription coverage because they could not afford it (<1%). 73% of adults reported having all of their prescriptions filled.
Shiawassee County adults did not receive the following major care or preventive care due to cost: medications (10%), colonoscopy (9%), pap smear (7%), mammogram (7%), weight-loss program (7%), surgery (4%), PSA test (3%), and smoking cessation (2%).
Shiawassee County adults preferred to get their health/healthcare services information from: their doctor (77%), a friend or family member (19%), the Internet (18%), newspaper articles or radio/television news stories (7%), advertisings or mailings from hospitals/clinics/doctor’s offices (7%), Facebook (2%), text messages (1%), and other methods (2%).
25% of Shiawassee veterans had applied for VA benefits. Reasons for not applying for VA benefits included: not eligible (63%), did not know location of Shiawassee County Veterans Services office (11%), and time constraints (1%).
Availability of Services 18% of Shiawassee County adults had looked for a program to help with depression, anxiety, or some other
mental health problem for either themselves or a loved one. Reasons for not looking for such a program included: not needed (71%), had not thought of it (4%), could not afford to go (4%), co-pay/deductible too high (2%), did not feel the services they had received were good (2%), did not know how to find a program (1%), stigma of seeking mental health services (1%), other priorities (1%), fear (1%), could not get to the office/clinic (<1%), and other reasons (5%).
10% of Shiawassee County adults had looked for a program to assist in care for the elderly or disabled adult (either in-home or out-of-home) for either themselves or a loved one. Of those who looked, 27% looked for an assisted living program, 22% looked for out-of-home placement, 13% looked for in-home care, 9% looked for day care, 7% looked for a disabled adult program, and 22% looked for multiple types of care.
Shiawassee County Adults Able to Access Assistance Programs/Services Types of Programs
(% of all adults who looked for the programs)
Shiawassee County adults who have looked but have NOT found a specific program
Shiawassee County adults who have looked and have found a
specific program Depression, Anxiety or
Mental Health (18% of all adults looked)
24% 76%
Drug Abuse (2% of all adults looked) 10% 90%
Healthy People 2020 Access to Quality Health Services
Objective
Shiawassee County 2012
Healthy People 2020 Target
AHS-5.1: Persons who report a usual primary care provider 57% 95%
*U.S. baseline is age-adjusted to the 2000 population standard (Sources: Health People 2020 Objectives, 2012 Shiawassee County Assessment)

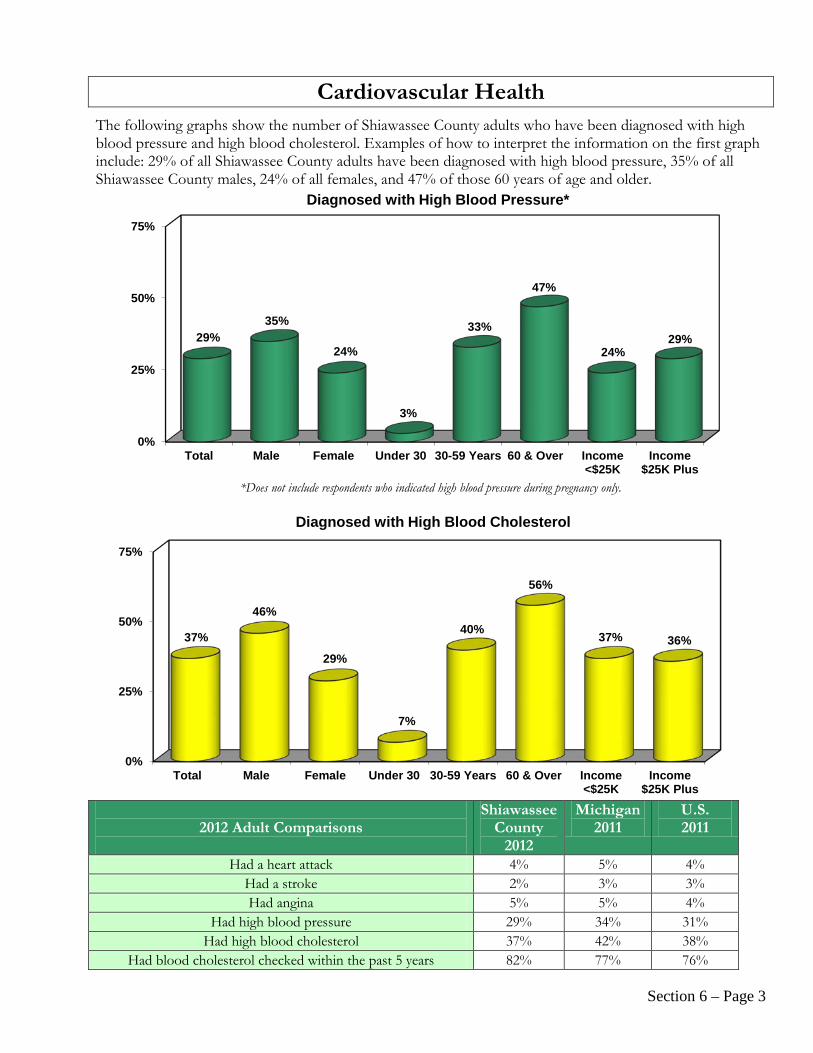
Section 6 – Page 1
Cardiovascular Health
Key Findings Heart disease (24%) and stroke (5%) accounted for 29% of all Shiawassee County adult deaths in 2010 (Source: MDCH, Vital Statistics 2010). The 2012 Shiawassee County health assessment found that 4% of adults had a heart attack and 2% had a stroke at some time in their life. More than one-fourth (29%) of Shiawassee County adults have been diagnosed with high blood pressure, 37% have high blood cholesterol, and 33% were obese, three known risk factors for heart disease and stroke.
Heart Disease and Stroke ♦ In 2012, 4% of Shiawassee County adults reported they
had a heart attack or myocardial infarction, increasing to 10% of those over the age of 60.
♦ 5% of Michigan and 4% of U.S. adults reported they had a heart attack or myocardial infarction in 2011(Source: 2011 BRFSS).
♦ 2% of Shiawassee County adults reported having had a stroke, increasing to 3% of those over the age of 60.
♦ 3% of Michigan and U.S. adults reported having had a stroke in 2011 (Source: 2011 BRFSS).
♦ 5% of adults reported they had angina or coronary heart disease, increasing to 15% of those over the age of 60.
♦ 5% of Michigan and 4% of U.S. adults reported having had angina or coronary heart disease in 2011 (Source: 2011 BRFSS).
High Blood Pressure (Hypertension) ♦ More than one-fourth (29%) of Shiawassee County adults had been diagnosed with high blood pressure. The
2011 BRFSS reports hypertension prevalence rates of 34% for Michigan and 31% for the U.S. ♦ 9% of adults were told they were pre-hypertensive/borderline high. ♦ 68% of Shiawassee County adults have had their blood pressure taken by a doctor, nurse, or other health
professional within the past six months. 81% have had their blood pressure taken within the past year and 89% have had their blood pressure taken within the past two years.
♦ Shiawassee County adults diagnosed with high blood pressure were more likely to: o Have rated their health as fair or poor (56%) o Be age 60 years or older (47%) o Have been obese (43%)
High Blood Cholesterol ♦ More than one-third (37%) of adults had been diagnosed with high blood cholesterol. The 2011 BRFSS reported
that 42% of Michigan adults and 38% of U.S. adults have been told they have high blood cholesterol. ♦ Three-fifths (60%) of adults had their blood cholesterol checked in the past year. Over four-fifths (82%) of
adults had their blood cholesterol checked within the past 5 years. The 2011 BRFSS reported 77% of Michigan adults and 76% of U.S. adults had theirs checked within the past 5 years.
♦ Shiawassee County adults with high blood cholesterol were more likely to: o Have rated their health as fair or poor (56%) o Be age 60 years or older (56%) o Be male (46%) o Have been overweight or obese (44%)
Shiawassee County Leading Types of Death
2010 Total Deaths: 711
1. Heart Diseases (24% of all deaths) 2. Cancers (22%) 3. Chronic Lower Respiratory Diseases (9%) 4. Stroke (5%) 5. Accidents, Unintentional Injuries (5%)
(Source: MDCH, Vital Statistics 2010)
Michigan Leading Types of Death
2010 Total Deaths: 88,058
1. Heart Disease (27% of all deaths) 2. Cancers (23%) 3. Chronic Lower Respiratory Diseases (6%) 4. Stroke (5%) 5. Accidents, Unintentional Injuries (4%)
(Source: MDCH, Vital Statistics 2010)

Section 6 – Page 2
Cardiovascular Health
The following graph demonstrates the percentage of Shiawassee County adults who had major risk factors for developing cardiovascular disease (CVD). (Source: 2012 Shiawassee County Health Assessment)
Risk Factors for Cardiovascular Disease That Can Be Modified or Treated: Cholesterol – As blood cholesterol rises, so does risk of coronary heart disease. When other risk factors (such as high blood pressure and tobacco smoke) are present, this risk increases even more. A person's cholesterol level is also affected by age, sex, heredity and diet. High Blood Pressure – High blood pressure increases the heart's workload, causing the heart to thicken and become stiffer and causes the heart not to work properly. It also increases your risk of stroke, heart attack, kidney failure and congestive heart failure. When high blood pressure exists with obesity, smoking, high blood cholesterol levels or diabetes, the risk of heart attack or stroke increases several times. Obesity and Overweight – People who have excess body fat — especially at the waist — are more likely to develop heart disease and stroke even if they have no other risk factors. Excess weight increases the heart's work. It also raises blood pressure and blood cholesterol and triglyceride levels, and lowers HDL ("good") cholesterol levels. Many obese and overweight people may have difficulty losing weight. But by losing even as few as 10 pounds, you can lower your heart disease risk. Smoking – Smokers' risk of developing coronary heart disease is 2-4 times that of nonsmokers. People who smoke a pack of cigarettes a day have more than twice the risk of heart attack than people who’ve never smoked. People who smoke cigars or pipes seem to have a higher risk of death from coronary heart disease (and possibly stroke) but their risk isn't as great as cigarette smokers. Exposure to other people's smoke increases the risk of heart disease even for nonsmokers.
Physical Inactivity – An inactive lifestyle is a risk factor for coronary heart disease. Regular, moderate-to-vigorous physical activity helps prevent heart and blood vessel disease. However, even moderate-intensity activities help if done regularly and long term. Physical activity can help control blood cholesterol, diabetes and obesity, as well as help lower blood pressure in some people. Diabetes Mellitus – Diabetes seriously increases your risk of developing cardiovascular disease. Even when glucose levels are under control, diabetes increases the risk of heart disease and stroke, but the risks are even greater if blood sugar is not well controlled. At least 65% of people with diabetes die of some form of heart or blood vessel disease. (Source: American Heart Association, Risk Factors for Coronary Heart Disease, 6-20-11)
0%
25%
50%
High BloodCholesterol
Obesity High BloodPressure
Sedentary Smoking Diabetes
37% 33%
29%
20% 19%
11%
Shiawassee County Adults with CVD Risk Factors
Section 6 – Page 3
Cardiovascular Health
The following graphs show the number of Shiawassee County adults who have been diagnosed with high blood pressure and high blood cholesterol. Examples of how to interpret the information on the first graph include: 29% of all Shiawassee County adults have been diagnosed with high blood pressure, 35% of all Shiawassee County males, 24% of all females, and 47% of those 60 years of age and older.
*Does not include respondents who indicated high blood pressure during pregnancy only.
2012 Adult Comparisons
Shiawassee County
2012
Michigan 2011
U.S. 2011
Had a heart attack 4% 5% 4% Had a stroke 2% 3% 3% Had angina 5% 5% 4%
Had high blood pressure 29% 34% 31% Had high blood cholesterol 37% 42% 38%
Had blood cholesterol checked within the past 5 years 82% 77% 76%
0%
25%
50%
75%
Total Male Female Under 30 30-59 Years 60 & Over Income<$25K
Income$25K Plus
29% 35%
24%
3%
33%
47%
24% 29%
Diagnosed with High Blood Pressure*
0%
25%
50%
75%
Total Male Female Under 30 30-59 Years 60 & Over Income<$25K
Income$25K Plus
37%
46%
29%
7%
40%
56%
37% 36%
Diagnosed with High Blood Cholesterol

Section 6 – Page 4
Cardiovascular Health The following graphs show the Shiawassee County and Michigan age-adjusted mortality rates per 100,000 population for heart disease and stroke by gender and race/ethnicity.
• The 2012 assessment shows that heart attacks are 2 times more prevalent than strokes in Shiawassee County.
• When age differences are accounted for, the statistics indicate that from 2008-2010, the Shiawassee County heart disease mortality rate was greater than the figure for the state, the U.S., and the Healthy People 2020 target.
• The Shiawassee County age-adjusted stroke mortality rate for 2008-2010 was greater than the Michigan rate, the U.S. rate, and the Healthy People 2020 target.
• Disparities exist for heart disease mortality rates by gender in Shiawassee County.
(Source: 2012 Shiawassee Health Assessment and 2011 BRFSS)
*The Healthy People 2020 Target objective for Coronary Heart Disease is reported for heart attack mortality. (Source: MDCH, Vital Statistics, Healthy People 2020)
0%
5%
10%
Angina Heart Attack Stroke
5% 4%
2%
5% 5%
3%
Cardiovascular Disease Prevalence
Shiawassee 2012 Michigan 2011
0
50
100
150
200
250
300
350
Heart Attack Stroke
215
47
208
40
187
41
101
34
Rat
e pe
r 100
,000
pop
ulat
ion
Age-Adjusted Heart Disease and Stroke Mortality Rates
Shiawassee 2008-2010 Michigan 2008-2010 U.S. 2008 HP 2020 Target*

Section 6 – Page 5
Cardiovascular Health
(Source: MDCH, Vital Statistics, 2010)
Healthy People 2020 Objectives High Blood Pressure
Objective Shiawassee County Survey Population
Baseline 2012
U.S. Baseline* Healthy People 2020 Target
HDS-4 Increase the portion of adults who have had their blood
pressure measured within the preceding 2 years and can state whether it was normal or high
89% 91%
Adults age 18 and up (2008)
93%
HDS-5: Reduce proportion of adults with hypertension 29%
31% Adults age 18 and up
(2011) 27%
Blood Cholesterol Objective Shiawassee County
Survey Population Baseline 2012
U.S. Baseline* Healthy People 2020 Target
HDS-6: Increase proportion of adults who had their blood
cholesterol checked within the preceding 5 years
82% 76%
Adults age 18 & up (2011)
82%
HDS-7: Decrease proportion of adults with high total blood
cholesterol (TBC) 37%
38% Adults age 2- & up with
TBC>240 mg/dl (2011)
14%
*All U.S. figures age-adjusted to 2000 population standard. (Source: Healthy People 2020, 2011 BRFSS, & 2012 Shiawassee County Assessment)
0
100
200
300
400
500
209 273
154
Rat
e pe
r 100
,000
pop
ulat
ion
Age-Adjusted Heart Disease Mortality Rates by Gender, 2010
Shiawassee Total Shiawassee Males Shiawassee Females
1Have smoked over 100 cigarettes in lifetime and currently smoke some or all days. Section 7 – Page 1
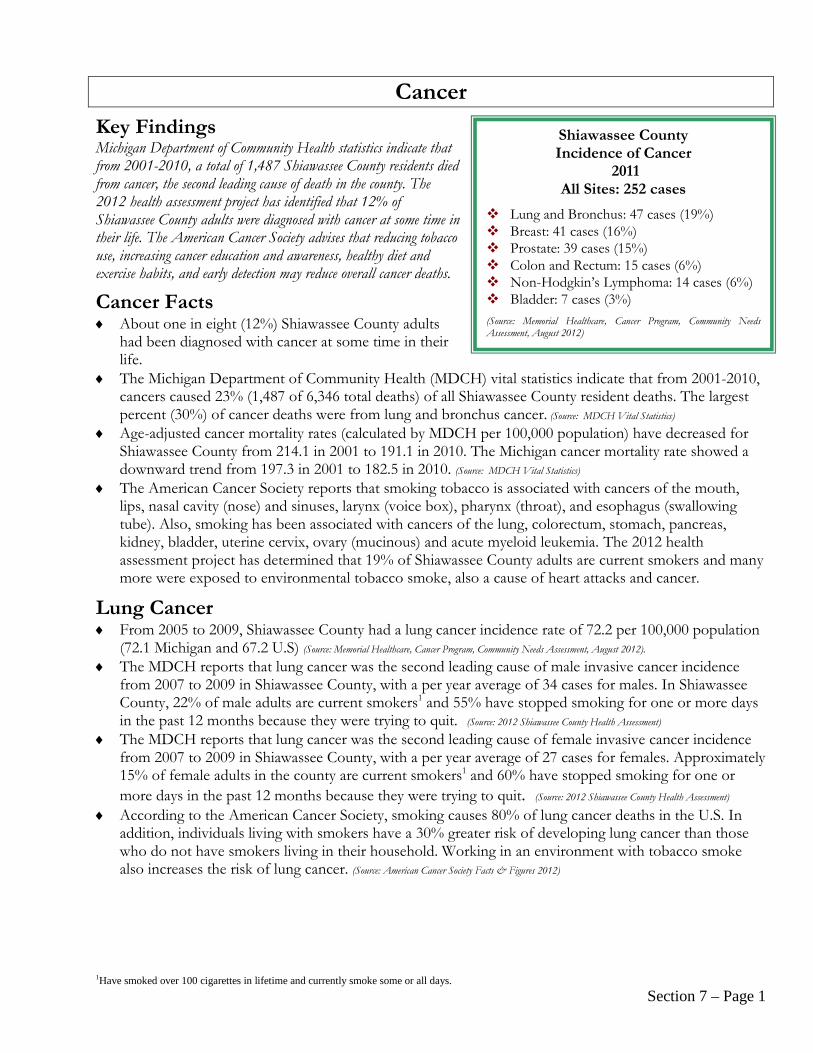
Cancer
Key Findings Michigan Department of Community Health statistics indicate that from 2001-2010, a total of 1,487 Shiawassee County residents died from cancer, the second leading cause of death in the county. The 2012 health assessment project has identified that 12% of Shiawassee County adults were diagnosed with cancer at some time in their life. The American Cancer Society advises that reducing tobacco use, increasing cancer education and awareness, healthy diet and exercise habits, and early detection may reduce overall cancer deaths.
Cancer Facts ♦ About one in eight (12%) Shiawassee County adults
had been diagnosed with cancer at some time in their life.
♦ The Michigan Department of Community Health (MDCH) vital statistics indicate that from 2001-2010, cancers caused 23% (1,487 of 6,346 total deaths) of all Shiawassee County resident deaths. The largest percent (30%) of cancer deaths were from lung and bronchus cancer. (Source: MDCH Vital Statistics)
♦ Age-adjusted cancer mortality rates (calculated by MDCH per 100,000 population) have decreased for Shiawassee County from 214.1 in 2001 to 191.1 in 2010. The Michigan cancer mortality rate showed a downward trend from 197.3 in 2001 to 182.5 in 2010. (Source: MDCH Vital Statistics)
♦ The American Cancer Society reports that smoking tobacco is associated with cancers of the mouth, lips, nasal cavity (nose) and sinuses, larynx (voice box), pharynx (throat), and esophagus (swallowing tube). Also, smoking has been associated with cancers of the lung, colorectum, stomach, pancreas, kidney, bladder, uterine cervix, ovary (mucinous) and acute myeloid leukemia. The 2012 health assessment project has determined that 19% of Shiawassee County adults are current smokers and many more were exposed to environmental tobacco smoke, also a cause of heart attacks and cancer.
Lung Cancer ♦ From 2005 to 2009, Shiawassee County had a lung cancer incidence rate of 72.2 per 100,000 population
(72.1 Michigan and 67.2 U.S) (Source: Memorial Healthcare, Cancer Program, Community Needs Assessment, August 2012). ♦ The MDCH reports that lung cancer was the second leading cause of male invasive cancer incidence
from 2007 to 2009 in Shiawassee County, with a per year average of 34 cases for males. In Shiawassee County, 22% of male adults are current smokers1 and 55% have stopped smoking for one or more days in the past 12 months because they were trying to quit. (Source: 2012 Shiawassee County Health Assessment)
♦ The MDCH reports that lung cancer was the second leading cause of female invasive cancer incidence from 2007 to 2009 in Shiawassee County, with a per year average of 27 cases for females. Approximately 15% of female adults in the county are current smokers1 and 60% have stopped smoking for one or more days in the past 12 months because they were trying to quit. (Source: 2012 Shiawassee County Health Assessment)
♦ According to the American Cancer Society, smoking causes 80% of lung cancer deaths in the U.S. In addition, individuals living with smokers have a 30% greater risk of developing lung cancer than those who do not have smokers living in their household. Working in an environment with tobacco smoke also increases the risk of lung cancer. (Source: American Cancer Society Facts & Figures 2012)
Shiawassee County Incidence of Cancer
2011 All Sites: 252 cases
Lung and Bronchus: 47 cases (19%) Breast: 41 cases (16%) Prostate: 39 cases (15%) Colon and Rectum: 15 cases (6%) Non-Hodgkin’s Lymphoma: 14 cases (6%) Bladder: 7 cases (3%)
(Source: Memorial Healthcare, Cancer Program, Community Needs Assessment, August 2012)

Section 7 – Page 2
Cancer Breast Cancer ♦ From 2005 to 2009, Shiawassee County had a breast cancer incidence rate of 116.5 per 100,000
population (120.3 Michigan and 122.0 U.S.) (Source: Memorial Healthcare, Cancer Program, Community Needs Assessment, August 2012).
♦ In Shiawassee County, breast cancer was the leading cause of female invasive cancer incidence from 2007 to 2009, with an average of 53 cases per year. (Source: MDCH Vital Statistics, Cancer Index)
♦ In 2012, 55% of Shiawassee County females reported having had a clinical breast examination in the past year.
♦ 60% of Shiawassee County females over the age of 40 had a mammogram in the past year. ♦ If detected early, the 5-year survival rate for breast cancer is 90%. (Source: American Cancer Society Facts & Figures 2012) ♦ For women in their 20s and 30s, a clinical breast exam should be done at least once every 3 years.
Mammograms for women in their 20s and 30s are based upon increased risk (e.g., family history, past breast cancer) and physician recommendation. Otherwise, annual mammography is recommended, beginning at age 40. (Source: American Cancer Society Facts & Figures 2012)
Colon and Rectum Cancer ♦ From 2005 to 2009, Shiawassee County had a colon cancer incidence rate of 52.8 per 100,000
population (46.2 for both Michigan and U.S.) (Source: Memorial Healthcare, Cancer Program, Community Needs Assessment, August 2012).
♦ In Shiawassee County, colorectal cancer was the third leading cause of male and female invasive cancer incidence from 2007 to 2009, with a per year average of 23 new invasive cancer cases for females and 23 for males. (Source: MDCH Vital Statistics, Cancer Index)
♦ The American Cancer Society recognizes any cancer involving the esophagus, stomach, small intestine, colon, rectum, anus (anal canal & anorectum), liver, gallbladder or pancreas as a digestive cancer
♦ The American Cancer Society reports several risk factors for colorectal cancer including: age; personal or family history of colorectal cancer, polyps, or inflammatory bowel disease; obesity; physical inactivity; a diet high in red or processed meat; alcohol use; long-term smoking; and possibly very low intake of fruits and vegetables.
♦ In the U.S., most cases of colon cancers occur in individuals over the age of 50. Because of this, the American Cancer Society suggests that every person over the age of 50 have regular colon cancer screenings. In 2012, 57% of Shiawassee County adults over the age of 50 reported having been screened for colorectal cancers within the past 5 years.
Prostate Cancer ♦ From 2005 to 2009, Shiawassee County had a prostate cancer incidence rate of 177.2 per 100,000
population (166.5 Michigan and 151.4 U.S.) (Source: Memorial Healthcare, Cancer Program, Community Needs Assessment, August 2012).
♦ In Shiawassee County, prostate cancer was the leading cause of male invasive cancer incidence from 2007 to 2009, with an average of 71 cases per year and an age-adjusted rate of 186.1 per 100,000 population. (Source: MDCH Vital Statistics, Cancer Index)
♦ 52% of Shiawassee County males over the age of 50 had a PSA test in the past year. ♦ The Michigan Department of Community Health statistics indicate that prostate cancer caused 42 male
cancer deaths from 2001-2010 in Shiawassee County. ♦ African American men are twice as likely as white American men to develop prostate cancer and are
more likely to die of prostate cancer. In addition, about 60% of prostate cancers occur in men over the age of 65, and 97% occur in men 50 and older. Other risk factors include strong familial predisposition, diet high in processed meat or dairy foods, and obesity. Prostate cancer is more common in North America and Northwestern Europe than in Asia and South America. (Source: Cancer Facts & Figures 2012, The American Cancer Society)

Section 7 – Page 3
Cancer Shiawassee County, Lenawee County & Michigan Cancer Deaths
2001-2010
Type of Cancer
Shiawassee County
Number of Cancer Deaths
Lenawee County
Number of Cancer Deaths
Michigan Number of
Cancer Deaths
Primary Sites Trachea, Lung & Bronchus 451 586 58,080
Colon, Rectum & Anus 124 187 18,701 Breast 103 142 14,541
Prostate 42 128 9,609
Total All Sites 1,487 2,067 199,922 (Source: MDCH, Cancer Statistics, updated 8-24-12)
Cancer Incidence Rates, 2005-2009*
Cancer Site Shiawassee County**
Michigan United States
Prostate 177.2 166.5 151.4 Breast 116.5 120.3 122.0 Lung 72.2 72.1 67.2 Colon 52.8 46.2 46.2 Bladder 28.0 24.2 21.1 Non-Hodgkin’s Lymphoma 19.2 20.9 19.3 All Sites 497.1 485.4 465.0
*Age-adjusted rates/100,000 population, 2000 standard **Shiawassee County exceeded the State and National Incidence Rates for Prostate, Lung, Colon, Bladder, and all Sites.
(Source: Memorial Healthcare, Cancer Program, Community Needs Assessment, August 2012)
2012 Cancer Estimations In 2012, about 1,638,910 new cancer cases are expected to be diagnosed. About 577,190 Americans are expected to die of cancer in 2012. In Michigan, 57,790 new cases of cancer are expected. Michigan female, new breast cancer cases are expected to be 7,710. 173,200 cancer deaths will be caused by tobacco use. 14% of all new cancer cases in Michigan are expected to be from lung & bronchus cancers. About 9% of all new cancer cases in Michigan are expected to be from colon & rectum cancers. Michigan male, new prostate cancer cases are expected to be 9,450. In the U.S., 29% of male and 26% of female estimated cancer deaths are expected to be from lung &
bronchus cancers. (Source: American Cancer Society, Facts and Figures 2012)

Section 7 – Page 4
Cancer The following graph shows the Shiawassee County, Michigan and U.S. age-adjusted mortality rates (per 100,000 population, 2000 standard) for all types of cancer in comparison to the Healthy People 2020 objective, and cancer as a percentage of total deaths in Shiawassee County by gender. The graph indicates: ♦ When age differences are accounted for, Shiawassee County had a lower cancer mortality rate than the
Michigan rate, the national rate and the Healthy People 2020 target objective.
*Age-adjusted rates/100,000 population, 2000 standard
(Source: Michigan Department of Community Health, Vital Records & Health Statistics Section, updated 8-24-2012; U.S. Mortality Files, National Center for Health Statistics, CDC; Healthy People 2020)
Healthy People 2020 Breast Cancer Screening
Objective Shiawassee County
2012
Michigan 2010
U.S. 2010
Healthy People 2020
Target C-17: Increase the proportion of women who receive a mammogram in the past two years (of women 40 and over)
77% 78% 75% 81%
(Sources: Healthy People 2020 Objectives, 2010 BRFSS, 2012 Assessment)
0
50
100
150
200
250
156 182 173 161
Healthy People 2020 Objective and Age-Adjusted Mortality Rates for All Cancers*
Shiawassee 2008-2010 Michigan 2008-2010 U.S. 2009 HP 2020 Target
Breast Cancer Screening
Types of Screening:
Mammogram – an X-ray of the breast. Mammogram is the best way to find breast cancer. Clinical breast exam – an examination by a doctor or nurse, who uses his or her hands to feel for lumps or
other changes Breast self-exam – when you check your own breasts for lumps, changes in size or shape of the breast, or any
other changes in the breast or underarm.
(Source: CDC, Breast Cancer, 11-3-2011)
Section 8- Page 1
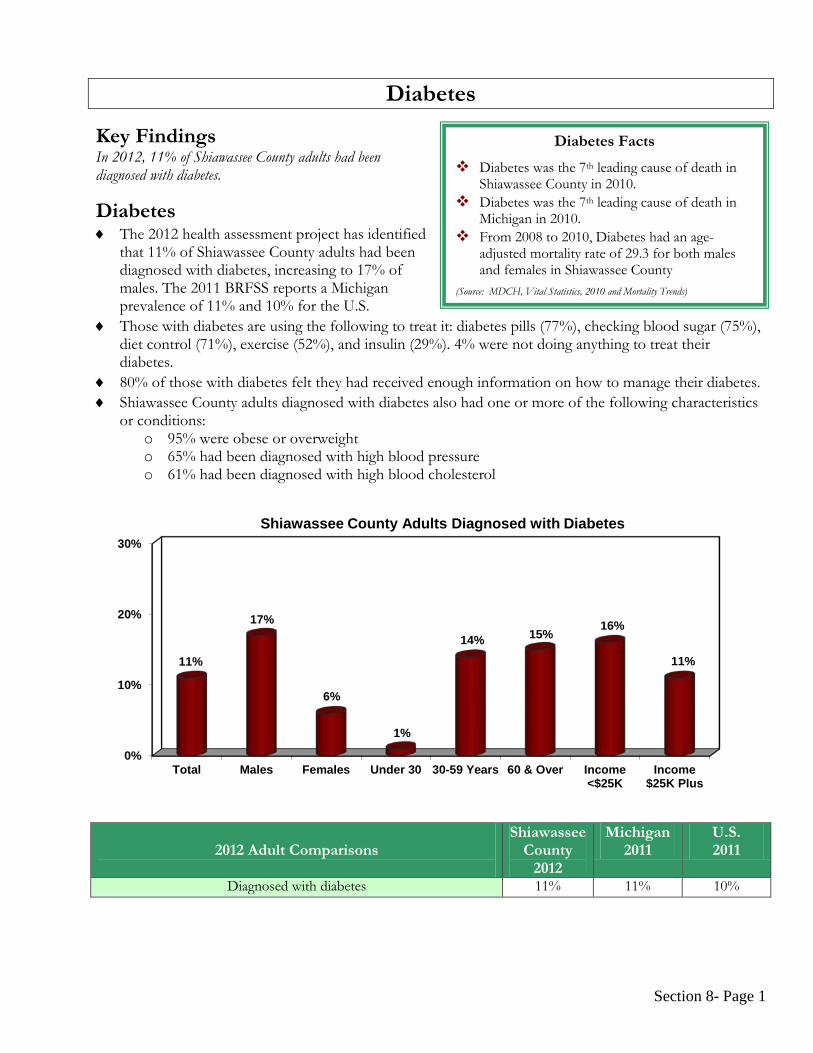
Diabetes
Key Findings In 2012, 11% of Shiawassee County adults had been diagnosed with diabetes.
Diabetes ♦ The 2012 health assessment project has identified
that 11% of Shiawassee County adults had been diagnosed with diabetes, increasing to 17% of males. The 2011 BRFSS reports a Michigan prevalence of 11% and 10% for the U.S.
♦ Those with diabetes are using the following to treat it: diabetes pills (77%), checking blood sugar (75%), diet control (71%), exercise (52%), and insulin (29%). 4% were not doing anything to treat their diabetes.
♦ 80% of those with diabetes felt they had received enough information on how to manage their diabetes. ♦ Shiawassee County adults diagnosed with diabetes also had one or more of the following characteristics
or conditions: o 95% were obese or overweight o 65% had been diagnosed with high blood pressure o 61% had been diagnosed with high blood cholesterol
2012 Adult Comparisons
Shiawassee County
2012
Michigan 2011
U.S. 2011
Diagnosed with diabetes 11% 11% 10%
Diabetes Facts
Diabetes was the 7th leading cause of death in Shiawassee County in 2010.
Diabetes was the 7th leading cause of death in Michigan in 2010.
From 2008 to 2010, Diabetes had an age-adjusted mortality rate of 29.3 for both males and females in Shiawassee County
(Source: MDCH, Vital Statistics, 2010 and Mortality Trends)
0%
10%
20%
30%
Total Males Females Under 30 30-59 Years 60 & Over Income<$25K
Income$25K Plus
11%
17%
6%
1%
14% 15% 16%
11%
Shiawassee County Adults Diagnosed with Diabetes

Section 8- Page 2
Diabetes Diabetes Complications
The complications associated with type 2 diabetes are numerous and serious including: Heart disease and stroke – 2 of 3 people with diabetes die from heart disease or stroke; Kidney disease caused by uncontrolled high blood pressure, uncontrolled blood sugar, and/or
genetics; Glaucoma – diabetics are 40% more likely to suffer from glaucoma, which can develop into blindness; Cataracts – diabetics are 60% more likely to develop cataracts; cataracts can also lead to the
development of glaucoma; Retinopathy – nonproliferative retinopathy does not cause loss of sight but can develop into
proliferative retinopathy which causes loss of vision. Those with type 1 diabetes almost always develop nonproliferative retinopathy as do most people with type 2 diabetes; proliferative retinopathy is rare;
Neuropathy is nerve damage to the feet that results in loss of feeling. It is one of the most common complications of diabetes. Poor blood flow or changes in the shape feet and toes may also cause problems. There are many forms of neuropathy but it is important to know that it can be very painful and disabling; however, for early neuropathy, symptoms can disappear with tight control of blood sugar, weight loss toward an ideal weight, and regular exercise;
Various foot complications are experienced more commonly with people who have diabetes. Some of these foot complications include neuropathy, extremely dry skin, calluses that can develop into foot ulcers that do not heal quickly, poor circulation, and amputation. Amputation of the foot or leg is more common, usually as a result of decreased circulation, neuropathy, and/or slowly healing wounds;
Skin Complications – Some of the many skin complications that diabetics are more likely to experience are fungal infections, bacterial infections, atherosclerosis (thickening of the arteries), diabetic dermopathy (harmless patches of light brown, scaly skin), necrobiosis lipoidica diabeticorum (NLD – red skin patches that can be itchy and painful that can break open into sores and need treatment), etc.; and,
Gastroparesis occurs as a result of neuropathy where the nerves to the stomach are damaged and stop working. Multiple complications can result from the stomach taking too long to empty its contents ranging from uncontrolled blood sugar to complete blockage from the stomach to the small intestine.
Well controlled diabetes can greatly reduce the complications of diabetes, but diabetics will still have a shortened life span. (Source: American Diabetes Association, All about Diabetes, Type 2 Diabetes, Complications)

Section 8- Page 3
Diabetes Adult Diabetes Screening Standards Type 1 diabetes is usually diagnosed in children and young adults, and was previously known as juvenile diabetes. In type 1 diabetes, the body does not produce insulin. Type 2 diabetes is the most common form of diabetes. In type 2 diabetes, either the body does not produce enough insulin or the cells ignore the insulin, most likely because the insulin is defective.
The American Diabetes Association maintains that community screening is not recommended since there is not sufficient evidence that community screening for type 2 diabetes is cost-effective, as well as the potential harm caused by lack of continuous care following diagnosis; therefore, screening should be based upon clinical judgment and patient preference. Health care provider type 2 diabetes screening standards for adults are as follows:
Every three years for those age 45 and over, especially for those with a Body Mass Index (BMI) of 25 or greater;
Testing can be done more frequently for those at younger ages who are overweight and have one or more of the risk factors listed in the box on page 1;
Patients who experience one or more of the known symptoms for diabetes (e.g. frequent urination, excessive thirst, extreme hunger, unusual weight loss, increased fatigue, irritability, blurry vision, etc.);
Patients who have a family history of type 2 diabetes; Patients who belong to certain race/ethnic groups (specifically, African American, American Indian,
Pacific Islander, or Hispanic American/Latino); Patients who have signs of or conditions associated with insulin resistance (e.g., high blood pressure,
abnormal cholesterol, polycystic ovary syndrome, etc.); and, As deemed necessary by the health care professional.
Youth Diabetes Screening Standards The incidence of type 2 diabetes in children and adolescents has been shown to be increasing. Consistent with screening recommendations for adults, only children and youth at substantial risk for the presence or the development of type 2 diabetes should be tested. The American Diabetes Association recommends that overweight youths(defined as BMI greater than 85th percentile for age and sex, weight for height greater than 85th percentile, or weight greater than 120% of ideal for height) with any two of the risk factors listed below be screened: Have a family history of type 2 diabetes in first- and second-degree relatives; Belong to a certain race/ethnic group (Native Americans, African-Americans, Hispanic Americans,
Asians/South Pacific Islanders); Have signs of insulin resistance or conditions associated with insulin resistance (acanthosis nigricans,
hypertension, dyslipidemia, polycystic ovary syndrome).
Testing should be done every 2 years starting at age 10 years or at the onset of puberty if it occurs at a younger age.
For more information about diabetes, please visit the American Diabetes Association’s website at www.diabetes.org. (Source: American Diabetes Association, Diabetes Care, Screening for Type 2 Diabetes, 2011)

Section 8- Page 4
Diabetes The following graphs show age-adjusted mortality rates from diabetes for Shiawassee County and Michigan residents with comparison to the Healthy People 2020 target objective. ♦ Shiawassee County’s age-adjusted diabetes mortality rate decreased from 2002 to 2010. ♦ From 2008 to 2010, both Shiawassee County and Michigan’s age-adjusted diabetes mortality rates were
less than half of the national rate and both met the Healthy People 2020 target objective.
(Source: MDCH, Vital Statistics, updated May 2012)
(Source: MDCH, Vital Statistics, updated May 2012, and Healthy People 2020, CDC)
0
10
20
30
40
50
2002-2004 2005-2007 2008-2010
32 26
29 27 26 24
Rat
e pe
r 100
,000
Pop
ulat
ion
Diabetes Age-Adjusted Mortality Rates
Shiawassee Michigan
0
20
40
60
80
29 24
78
66
Rat
e pe
r 100
,000
pop
ulat
ion
Healthy People 2020 Objective and Age-adjusted Mortality Rates for Diabetes
Shiawassee 2008-2010 Michigan 2007-2009 U.S. 2009 HP 2020 Target
Section 9- Page 1
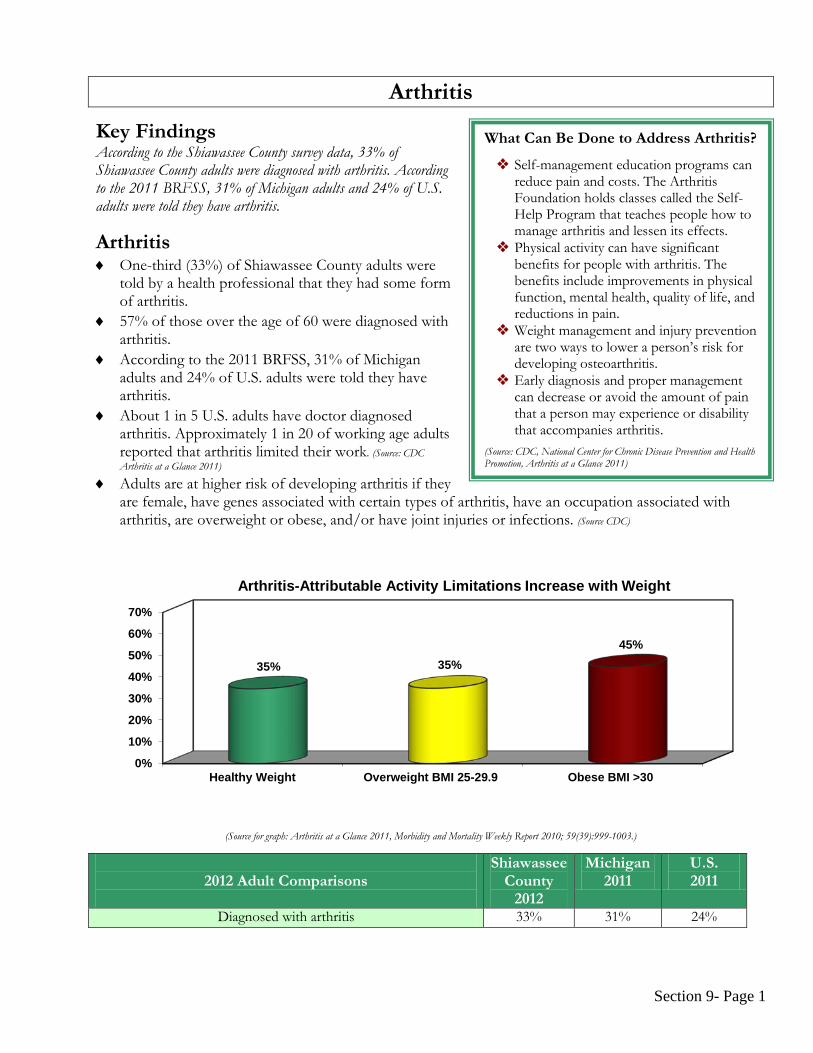
Arthritis
Key Findings According to the Shiawassee County survey data, 33% of Shiawassee County adults were diagnosed with arthritis. According to the 2011 BRFSS, 31% of Michigan adults and 24% of U.S. adults were told they have arthritis.
Arthritis ♦ One-third (33%) of Shiawassee County adults were
told by a health professional that they had some form of arthritis.
♦ 57% of those over the age of 60 were diagnosed with arthritis.
♦ According to the 2011 BRFSS, 31% of Michigan adults and 24% of U.S. adults were told they have arthritis.
♦ About 1 in 5 U.S. adults have doctor diagnosed arthritis. Approximately 1 in 20 of working age adults reported that arthritis limited their work. (Source: CDC Arthritis at a Glance 2011)
♦ Adults are at higher risk of developing arthritis if they are female, have genes associated with certain types of arthritis, have an occupation associated with arthritis, are overweight or obese, and/or have joint injuries or infections. (Source CDC)
(Source for graph: Arthritis at a Glance 2011, Morbidity and Mortality Weekly Report 2010; 59(39):999-1003.)
0%
10%
20%
30%
40%
50%
60%
70%
Healthy Weight Overweight BMI 25-29.9 Obese BMI >30
35% 35% 45%
Arthritis-Attributable Activity Limitations Increase with Weight
2012 Adult Comparisons
Shiawassee County
2012
Michigan 2011
U.S. 2011
Diagnosed with arthritis 33% 31% 24%
What Can Be Done to Address Arthritis?
Self-management education programs can reduce pain and costs. The Arthritis Foundation holds classes called the Self-Help Program that teaches people how to manage arthritis and lessen its effects.
Physical activity can have significant benefits for people with arthritis. The benefits include improvements in physical function, mental health, quality of life, and reductions in pain.
Weight management and injury prevention are two ways to lower a person’s risk for developing osteoarthritis.
Early diagnosis and proper management can decrease or avoid the amount of pain that a person may experience or disability that accompanies arthritis.
(Source: CDC, National Center for Chronic Disease Prevention and Health Promotion, Arthritis at a Glance 2011)
Section 9- Page 2
Arthritis
Arthritis: Key Public Health Messages Early diagnosis of arthritis and self-management activities can help people decrease their pain, improve function, and stay productive. Key self-management activities include the following:
• Learn Arthritis Management Strategies –Learning techniques to reduce pain and limitations can be beneficial to people with arthritis. Self-management education, such as the Arthritis Self-Management Program (ASMP), or the Chronic Disease Self-Management Program (CDSMP) help you develop the skills and confidence to manage your arthritis on a day to day basis.
• Be Active –Research has shown that physical activity decreases pain, improves function, and delays disability. Make sure you get at least 30 minutes of moderate physical activity at least 5 days a week. You can get activity in 10-minute intervals.
• Watch your weight –The prevalence of arthritis increases with increasing weight. Research suggests that maintaining a healthy weight reduces the risk of developing arthritis and may decrease disease progression. A loss of just 11 pounds can decrease the occurrence (incidence) of new knee osteoarthritis and a modest weight loss can help reduce pain and disability.
• See your doctor –Although there is no cure for most types of arthritis, early diagnosis and appropriate management is important, especially for inflammatory types of arthritis. For example, early use of disease-modifying drugs can affect the course of rheumatoid arthritis. If you have symptoms of arthritis, see your doctor and begin appropriate management of your condition.
• Protect your joints –Joint injury can lead to osteoarthritis. People who experience sports or occupational injuries or have jobs with repetitive motions like repeated knee bending have more osteoarthritis. Avoid joint injury to reduce your risk of developing osteoarthritis.
(Source: Centers for Disease Control and Prevention, Arthritis: Key Public Health Messages, www.cdc.gov/arthritis/basics/key.htm, updated September 2011)

Section 10- Page 1
Asthma and Other Respiratory Disease
Key Findings According to the Shiawassee County survey data, 16% of Shiawassee County adults had been diagnosed with asthma. Asthma and Other Respiratory Disease ♦ In 2012, 16% of Shiawassee County adults had been
diagnosed with asthma, increasing to 21% of those under the age of 30 and 26% of those with annual incomes less than $25,000.
♦ 15% of Michigan and 14% of U.S. adults have ever been diagnosed with asthma. (Source: 2011 BRFSS)
♦ There are several important factors that may trigger an asthma attack. Some of these triggers are secondhand smoke, dust mites, outdoor air pollution, cockroach allergens, pets, mold, infections linked to the flu, colds, and respiratory viruses. (Source: CDC- National Center for Environmental Health, 2011)
♦ Chronic lower respiratory disease was the 3rd leading cause of death in Shiawassee County and Michigan in 2010. (Source: Michigan Department of Community Health)
2012 Adult Comparisons
Shiawassee County
2012
Michigan 2011
U.S. 2011
Had been diagnosed with asthma 16% 15% 14%
Chronic Respiratory Conditions Asthma is a chronic lung disease that
inflames and narrows airways. It can cause recurring periods of wheezing, chest tightness, shortness of breath and coughing.
Chronic bronchitis is a condition where the bronchial tubes (the tubes that carry air to your lungs) become inflamed. Bronchitis can cause wheezing, chest pain or discomfort, a low fever, shortness of breath and a cough that brings up mucus. Smoking is the main cause of chronic bronchitis.
Chronic Obstructive Pulmonary Disorder (COPD) is a disease that over time makes it harder to breathe. COPD can cause large amounts of mucus, wheezing, shortness of breath, chest tightness, and other symptoms. Smoking is the main cause of COPD.
(Source: National Heart, Lung, Blood Institute, 2011)
0%
10%
20%
30%
Total Males Females Under 30 30-59 Years 60 & Over Income<$25K
Income$25K Plus
16% 13%
19% 21%
17% 15%
26%
14%
Shiawassee County Adults Diagnosed with Asthma

Section 10- Page 2
Asthma and Other Respiratory Disease The following graphs demonstrate the lifetime and current prevalence rates of asthma by gender for Michigan and U.S. residents.
(Source: 2011 BRFSS)
0%
5%
10%
15%
20%
25%
30%
Males Females
12.8% 16.8%
11.6% 15.6%
Adult Lifetime Asthma Prevalence Rates By Gender
Michigan Lifetime U.S. Lifetime
0%
5%
10%
15%
Males Females
8.2%
12.6%
6.8%
11.1%
Adult Current Asthma Prevalence Rates By Gender
Michigan Current U.S. Current
Asthma in Michigan 2010 Environmental allergens and irritants found in both indoor and outdoor environments can trigger pre-existing asthma and, with certain exposures, cause the development of asthma. Goal six of the Asthma Initiative of Michigan (AIM) is to: Reduce Exposure To Environmental Factors That Cause And/Or Exacerbate Asthma.
Objectives from AIM Goal 6 include to: o Decrease exposure to outdoor air pollutants associated with asthma exacerbations including exposure to
mobile source diesel emissions and specific criteria air pollutants, including particulate matter less than or equal to 2.5 micrometers and ozone
o Increase the capacity of people with asthma to identify, avoid, and reduce exposures in homes, schools, and childcare settings, and work places that exacerbate pre-existing asthma or cause the development of asthma
o Reduce secondhand smoke exposure and promote tobacco cessation for people with asthma and parents of children with asthma who smoke.
(Source: Asthma Initiative of Michigan, partnership with Michigan Department of Community Health and The American Lung Association of Michigan, 2010, http://www.michigan.gov/documents/mdch/AsthmaInitiativeofMichigan_Strategic_Plan6-06_269864_7.pdf)
Section 11 – Page 1
Adult Weight Status
Key Findings The 2012 Health Assessment project identified that 69% of Shiawassee County adults were overweight or obese based on BMI. The 2011 BRFSS indicates that 31% of Michigan and 28% of U.S. adults were obese by BMI. One-third (33%) of Shiawassee County adults were obese. Half (50%) of adults were trying to lose weight. 20% of adults had not been participating in any physical activities or exercise in the past week.
Adult Weight Status ♦ In 2012, the health assessment indicated that
more than two-thirds (69%) of Shiawassee County adults were either overweight (36%) or obese (33%) by Body Mass Index (BMI). This puts them at elevated risk for developing a variety of diseases (see below).
♦ Half (50%) of adults were trying to lose weight, 34% were trying to maintain their current weight or keep from gaining weight, and 1% were trying to gain weight.
♦ 59% of adults described themselves as being either slightly or very overweight. 33% described themselves as about the right weight, and 8% described themselves as being slightly or very underweight.
♦ Shiawassee County adults did the following to lose weight or keep from gaining weight: ate less food, fewer calories, or foods low in fat (58%), exercised (54%), ate a low-carb diet (15%), smoked cigarettes (3%), used a weight loss program (2%), participated in a prescribed dietary or fitness program (1%), took prescribed medications (1%), went without eating 24 or more hours (1%), vomited or took laxatives (1%), and took diet pills, powders or liquids without a doctor’s advice (<1%).
♦ On an average day, adults spent time doing the following: 2.6 hours watching television, 1.3 hours on the computer outside of work, 0.9 hours on their cell phone, and 0.2 hours playing video games.
Physical Activity ♦ In Shiawassee County, 60% of adults were engaging in physical activity for at least 30 minutes 3 or more days
per week. 34% of adults were exercising 5 or more days per week. One-fifth (20%) of adults were not participating in any physical activity in the past week, including 5% who were unable to exercise.
♦ Shiawassee County adults gave the following reasons for not exercising: time (22%), pain/discomfort (16%), weather (9%), could not afford a gym membership (5%), no sidewalks (4%), did not know what activity to do (2%), no walking or biking trails (2%), no gym available (1%), safety (1%), doctor advised them not to exercise (1%), no child care (<1%), and other reasons (15%).
♦ The CDC recommends that adults participate in moderate exercise for at least 2 hours and 30 minutes every week or vigorous exercise for at least 1 hour and 15 minutes every week. Whether participating in moderate or vigorous exercise, CDC also recommends muscle-strengthening activities that work all major muscle groups on 2 or more days per week. (Source: CDC, Physical Activity for Everyone)
Nutrition ♦ In 2012, 13% of Shiawassee County adults ate 5 or more servings of fruits and vegetables per day. 81% ate 1
to 4 servings per day. The American Cancer Society recommends that adults eat 5-9 servings of fruits and vegetables per day to reduce the risk of cancer and to maintain good health. The 2009 BRFSS reported that only 23% of Michigan and U.S. adults were eating the recommended number of servings of fruits and vegetables.
♦ 69% of adults read food labels or consider nutritional content when choosing the foods they eat. ♦ Adults ate out in a restaurant or brought home take-out food an average of 2.2 times per week.
Defining the Terms
Obesity: An excessively high amount of body fat compared to lean body mass.
Body Mass Index (BMI): The contrasting measurement/ relationship of weight to height. CDC uses this measurement to determine overweight and obesity.
Underweight: Adults with a BMI less than 18.5. Normal: Adults with a BMI of 18.5 to 24.9. Overweight: Adults with a BMI of 25 to 29.9. Obese: Adults with a BMI of 30 or greater. (Source: CDC)
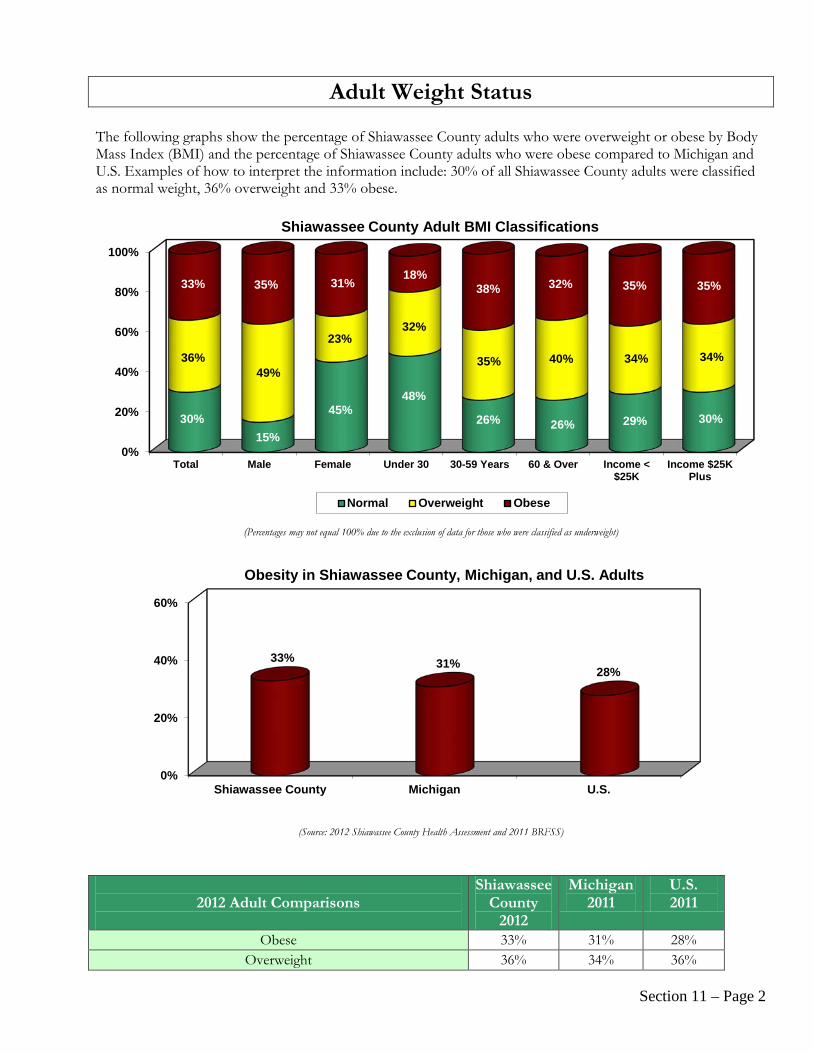
Section 11 – Page 2
Adult Weight Status The following graphs show the percentage of Shiawassee County adults who were overweight or obese by Body Mass Index (BMI) and the percentage of Shiawassee County adults who were obese compared to Michigan and U.S. Examples of how to interpret the information include: 30% of all Shiawassee County adults were classified as normal weight, 36% overweight and 33% obese.
(Percentages may not equal 100% due to the exclusion of data for those who were classified as underweight)
(Source: 2012 Shiawassee County Health Assessment and 2011 BRFSS)
0%
20%
40%
60%
80%
100%
Total Male Female Under 30 30-59 Years 60 & Over Income <$25K
Income $25KPlus
30% 15%
45% 48%
26% 26% 29% 30%
36% 49%
23% 32%
35% 40% 34% 34%
33% 35% 31% 18%
38% 32% 35% 35%
Shiawassee County Adult BMI Classifications
Normal Overweight Obese
2012 Adult Comparisons
Shiawassee County
2012
Michigan 2011
U.S. 2011
Obese 33% 31% 28% Overweight 36% 34% 36%
0%
20%
40%
60%
Shiawassee County Michigan U.S.
33% 31% 28%
Obesity in Shiawassee County, Michigan, and U.S. Adults
Section 12- Page 1
Adult Tobacco Use
Key Findings In 2012, 19% of Shiawassee County adults were current smokers and 24% were considered former smokers. In 2011, the American Cancer Society (ACS) stated that tobacco use was the most preventable cause of disease and early death in the world, accounting for approximately 5.4 million premature deaths each year. ACS estimated that tobacco use would be linked to approximately one in five deaths in the U.S. (Source: Cancer Facts & Figures, American Cancer Society, 2011)
Adult Tobacco Use Behaviors ♦ The 2012 health assessment identified that
nearly one-fifth (19%) of Shiawassee County adults were current smokers (those who indicated smoking at least 100 cigarettes in their lifetime and currently smoke some or all days). The 2011 BRFSS reported current smoker prevalence rates of 23% for Michigan and 21% for the U.S.
♦ Nearly one-quarter (24%) of Shiawassee County adults indicated that they were former smokers (smoked 100 cigarettes in their lifetime and now do not smoke). The 2011 BRFSS reported former smoker prevalence rates of 26% for Michigan and 25% for the U.S.
♦ Shiawassee County adult smokers were more likely to: o Have been divorced (45%) o Have rated their general health as poor (38%) o Have incomes less than $25,000 (28%) o Have been under 30 years of age (27%) o Have one or more child under the age of 18 (25%) o Have been male (22%)
♦ 57% of the current smokers responded that they had stopped smoking for at least one day in the past year because they were trying to quit smoking.
♦ Shiawassee County adults used the following tobacco products in the past year: cigarettes (25%), cigars (5%), chewing tobacco (4%), little cigars (3%), black and milds (3%), e-cigarettes (3%), swishers (2%), snuff (2%), flavored cigarettes (1%), cigarillos (1%), hookah (1%), snus (<1%), and bidis (<1%).
♦ Shiawassee County adults had the following rules about smoking in their home: no one is allowed to smoke inside their home at any time (82%), there are no rules about smoking (7%), smoking is allowed in some places at some times (6%), and smoking is allowed anywhere (4%).
♦ 96% of adults felt that any tobacco use is harmful to their health.
2012 Adult Comparisons
Shiawassee County
2012
Michigan 2011
U.S. 2011
Current smoker 19% 23% 21% Former smoker 24% 26% 25%
Tobacco Use and Health Tobacco use is the most preventable cause of death in
the U.S. and in the world 87% of all lung cancers deaths and at least 30% of all
cancer deaths in the U.S. can be attributed to smoking. When compared to non-smokers, the risk of
developing lung cancer is 23 times higher in male smokers and 13 times higher in female smokers.
Tobacco use is also associated with at least 20 types of cancer such as cervical, mouth, pharyngeal, esophageal, pancreatic, kidney and bladder.
Tobacco use contributes to heart disease, stroke, bronchitis, emphysema, COPD, chronic sinusitis, severity of colds, pneumonia and low birth weight in infants.
(Source: Cancer Facts & Figures, American Cancer Society, 2011)

Section 12- Page 2
Adult Tobacco Use The following graph shows the percentage of Shiawassee County adults who used tobacco. Examples of how to interpret the information include: 19% of all Shiawassee County adults were current smokers, 24% of all adults were former smokers, and 57% had never smoked.
Respondents were asked: “Have you smoked at least 100 cigarettes in your entire life?
If yes, do you now smoke cigarettes everyday, some days or not at all?”
0%
20%
40%
60%
80%
100%
Total Male Female Under 30 30-59 Years 60 & Over Income<$25K
Income$25K Plus
19% 22% 15% 27%
19% 12% 28%
16%
24% 28%
21% 10% 23% 39%
24%
24%
57% 50%
64% 63% 58% 49%
48% 60%
Shiawassee County Adult Smoking Behaviors
Current smoker Former smoker Never smoked
Smoking and Tobacco Facts Tobacco use is the most preventable cause of death in the U.S. Approximately 49,000 deaths per year in the U.S. are from secondhand smoke exposure. Typically, smokers die 13 to 14 years earlier than non-smokers. In 2009, cigarette smoking was highest in prevalence in adults among American Indians/Native Americans
(23%), followed by whites (22.1%), African Americans (21.3%), Hispanics (14.5%), and Asians (12.0%). Smoking costs over $193 billion in lost productivity ($97 billion) and health care expenses ($96 billion) per year. In 2006, the cigarette industry spent more than $34 million per day on advertising and promotional expenses. (Source: CDC: Fast Facts on Smoking and Tobacco Use, accessed from http://www.cdc.gov/tobacco/data_statistics/fact_sheets/fast_facts/index.htm)
Costs of Tobacco Use The average price for a pack of cigarettes in the United States is $5.98. If a pack-a-day smoker spent approximately $6/pack, they would spend: $42/week, $168/month, or
$2,190/year. 19% of Shiawassee County adults indicated they were smokers. That is approximately 10,182 adults. If 10,182 adults spent $1,456/year, then $22,298,580 is spent a year on cigarettes in Shiawassee County.
(Source: Campaign for Tobacco-Free Kids, State Cigarette Excise Tax Rates & Rankings, accessed from: http://www.tobaccofreekids.org/research/factsheets/pdf/0097.pdf and 2012 Shiawassee County Health Assessment)
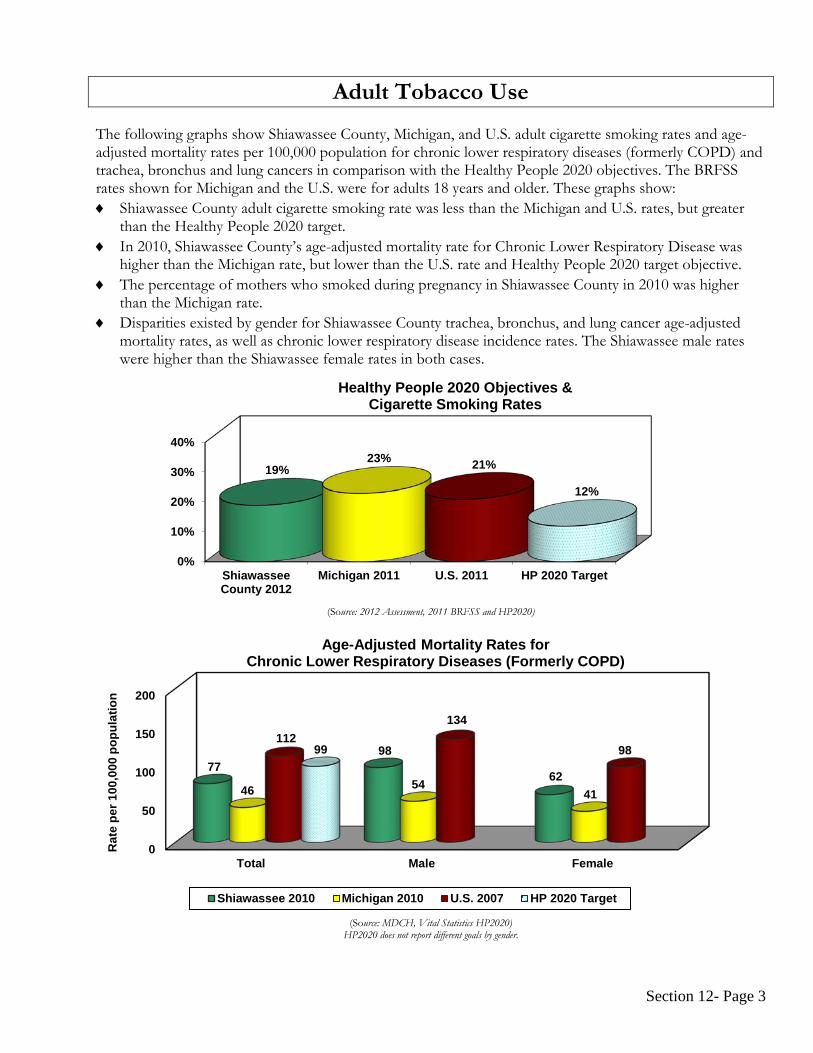
Section 12- Page 3
Adult Tobacco Use The following graphs show Shiawassee County, Michigan, and U.S. adult cigarette smoking rates and age-adjusted mortality rates per 100,000 population for chronic lower respiratory diseases (formerly COPD) and trachea, bronchus and lung cancers in comparison with the Healthy People 2020 objectives. The BRFSS rates shown for Michigan and the U.S. were for adults 18 years and older. These graphs show: ♦ Shiawassee County adult cigarette smoking rate was less than the Michigan and U.S. rates, but greater
than the Healthy People 2020 target. ♦ In 2010, Shiawassee County’s age-adjusted mortality rate for Chronic Lower Respiratory Disease was
higher than the Michigan rate, but lower than the U.S. rate and Healthy People 2020 target objective. ♦ The percentage of mothers who smoked during pregnancy in Shiawassee County in 2010 was higher
than the Michigan rate. ♦ Disparities existed by gender for Shiawassee County trachea, bronchus, and lung cancer age-adjusted
mortality rates, as well as chronic lower respiratory disease incidence rates. The Shiawassee male rates were higher than the Shiawassee female rates in both cases.
(Source: 2012 Assessment, 2011 BRFSS and HP2020)
(Source: MDCH, Vital Statistics HP2020)
HP2020 does not report different goals by gender.
0%
10%
20%
30%
40%
ShiawasseeCounty 2012
Michigan 2011 U.S. 2011 HP 2020 Target
19% 23% 21%
12%
Healthy People 2020 Objectives & Cigarette Smoking Rates
0
50
100
150
200
Total Male Female
77 98
62 46 54
41
112 134
98 99
Rat
e pe
r 100
,000
pop
ulat
ion
Age-Adjusted Mortality Rates for Chronic Lower Respiratory Diseases (Formerly COPD)
Shiawassee 2010 Michigan 2010 U.S. 2007 HP 2020 Target

Section 12- Page 4
Adult Tobacco Use
*Healthy People 2020 Target and U.S. 2007 data are for lung cancer only
(Source: Healthy People 2020, Memorial Healthcare, Cancer Program)
(Source: MDCH Information updated 8-24-12)
0%
10%
20%
30%
40%
50%
Shiawassee Mothers Michigan Mothers
28%
18%
Births to Mothers Who Smoked During Pregnancy, 2010
020406080
100 72 72
51 46
Rat
e pe
r 100
,000
pop
ulat
ion
Age-Adjusted Mortality Rates for Trachea, Bronchus & Lung Cancer
Shiawassee 2005-2009 Michigan 2005-2009 U.S. 2007* HP 2020 Target*
020406080
100120 91
62
Rat
e pe
r 100
,000
pop
ulat
ion
Age-Adjusted Incidence Rates by Gender for Lung Cancer
Shiawassee Males 2007-2009 Shiawassee Females 2007-2009
(Source: MDCH Births, Natality, 2010)

Section 12- Page 5
Adult Tobacco Use
Flavored Cigar Smoking among U.S. Adults
Cigars contain the same toxic and cancer-causing chemicals found in cigarettes; they are not a safe alternative to cigarettes. Health consequences of regular cigar smoking can include cancers of the lung, larynx, oral cavity, and esophagus. Those who inhale cigar smoke and who smoke multiple cigars a day are also at increased risk for developing heart disease and COPD.
From 2009-2010, 6.6% of adults in the U.S. smoke cigars and 2.8% smoke flavored cigars. Nearly 43% of all adult cigar smokers in the U.S. report using flavored cigars. More than 57% of cigar smokers in the 18-24 year-old age group, say they smoke flavored cigars. Flavored cigar smoking was more common among those with a Graduate Equivalency Degree (GED)
(65%), and those with annual household income under $20,000 (52%). Flavored cigar use was higher among Hispanic cigar smokers (62%); higher among female cigar smokers
(61%); and higher among Lesbian, Gay, Bisexual, Transgendered (LGBT) cigar smokers (67%).
(Source: Nicotine & Tobacco Research, “Flavored Cigar Smoking Among U.S. Adults: Findings From the 2009-2010 National Adult Tobacco Survey,” published August 27, 2012)

Section 13 – Page 1
Adult Alcohol Consumption
Key Findings In 2012, half (50%) of the Shiawassee County adults had at least one alcoholic drink in the past month. In 2012, the health assessment indicated that 13% of Shiawassee County adults were considered frequent drinkers (drank an average of three or more days per week, per CDC guidelines). 41% of adults who drank had five or more drinks on one occasion (binge drinking) in the past month. Eight percent of adults drove after having perhaps too much to drink.
Adult Alcohol Consumption In 2012, half (50%) of the Shiawassee County
adults had at least one alcoholic drink in the past month, increasing to 64% of those under the age of 30. The 2011 BRFSS reported current drinker prevalence rates of 58% for Michigan and 57% for the U.S.
About one in eight (13%) adults were considered frequent drinkers (drank on an average of three or more days per week).
Of those who drank, Shiawassee County adults drank 2.9 drinks on average, increasing to 4.0 drinks for those under the age of 30.
41% of those who drink reported they had five or more alcoholic drinks on an occasion in the last month and would be considered binge drinkers by definition (See box above).
Of all adults, 20% were considered binge drinkers. The 2011 BRFSS reported binge drinking rates of 20% for Michigan and 18% for the U.S.
8% of adults reported driving after having perhaps too much to drink. Shiawassee County adults experienced the following in the past six months: drank more than they
expected (15%), spent a lot of time drinking (8%), drank more to get the same effect (3%), tried to quit or cut down but could not (2%), gave up other activities to drink (2%), drank to ease withdrawal symptoms (2%), and continued to drink despite problems caused by drinking (1%).
Shiawassee adults disapproved of youth doing the following: drinking alcohol and driving (99%), riding in a vehicle with someone who had been drinking alcohol (99%), binge drinking (99%), consuming alcohol and driving a child (99%), drinking alcohol (98%), and parents allowing or giving alcohol to minors in their home (97%).
Binge Drinking Dangers
Binge drinking is defined as five or more drinks for a male and 4 or more drinks for a female on one occasion or in a short period of time.
The prevalence of males binge drinking is higher than the prevalence of females binge drinking.
Approximately 75% of the alcohol consumed in the U.S. is in the form of binge drinks.
The highest proportion age group to binge drink is in the 18-20 year old group at 51%.
Most people who binge drink are not alcohol dependent.
Unintentional injuries, violence, alcohol poisoning, hypertension, sexually transmitted diseases, cardiovascular diseases, sexual dysfunction and unintentional pregnancy are a few of the adverse health effects of binge drinking.
(Source: CDC, National Center for Chronic Disease Prevention and Health Promotion, Binge Drinking, 12-17-10)
Caffeinated Alcoholic Beverages
Drinkers who consume alcohol mixed with energy drinks are 3 times more likely to binge drink than drinkers who do not report mixing alcohol with energy drinks.
Drinkers who consume alcohol with energy drinks are about twice as likely as drinkers who do not report mixing to report being taken advantage of sexually, to report taking advantage of someone else sexually, and to report riding with a driver who was under the influence of alcohol.
Currently, more than 25 brands of caffeinated alcoholic beverages are sold in retail alcohol outlets, including convenience stores.
(Source: CDC, Alcohol and Public Health, Fact Sheets, Caffeinated Alcoholic Beverages, July 2010, http://www.cdc.gov/alcohol/fact-sheets/cab.htm)

Section 13 – Page 2
Adult Alcohol Consumption The following graphs show the percentage of Shiawassee County adults consuming alcohol and the amount consumed on average. Examples of how to interpret the information shown on the first graph include: 46% of all Shiawassee County adults did not drink alcohol, 43% of Shiawassee County males did not drink and 52% of adult females reported they did not drink.
Percentages may not equal 100% as some respondents answered “don’t know”
0%
20%
40%
60%
80%
100%
Total Male Female Under 30 30-59Years
60 & Over Income<$25K
Income$25K Plus
46% 43% 52%
26% 47%
60% 61%
40%
11% 10%
11%
19%
10%
8% 7%
12%
39% 46% 33%
45%
39% 31% 26%
45%
Average Number of Days Drinking Alcohol in the Past Month
Did not drink any 1-2 days 3 or more days
0
1
2
3
4
5
Total Males Females Under 30 30-59Years
60 & Over Income<$25K
Income$25K Plus
2.9 3.1
2.6
4.0
2.8
2.1
3.0 2.9
Adults Average Number of Drinks Consumed Per Occasion
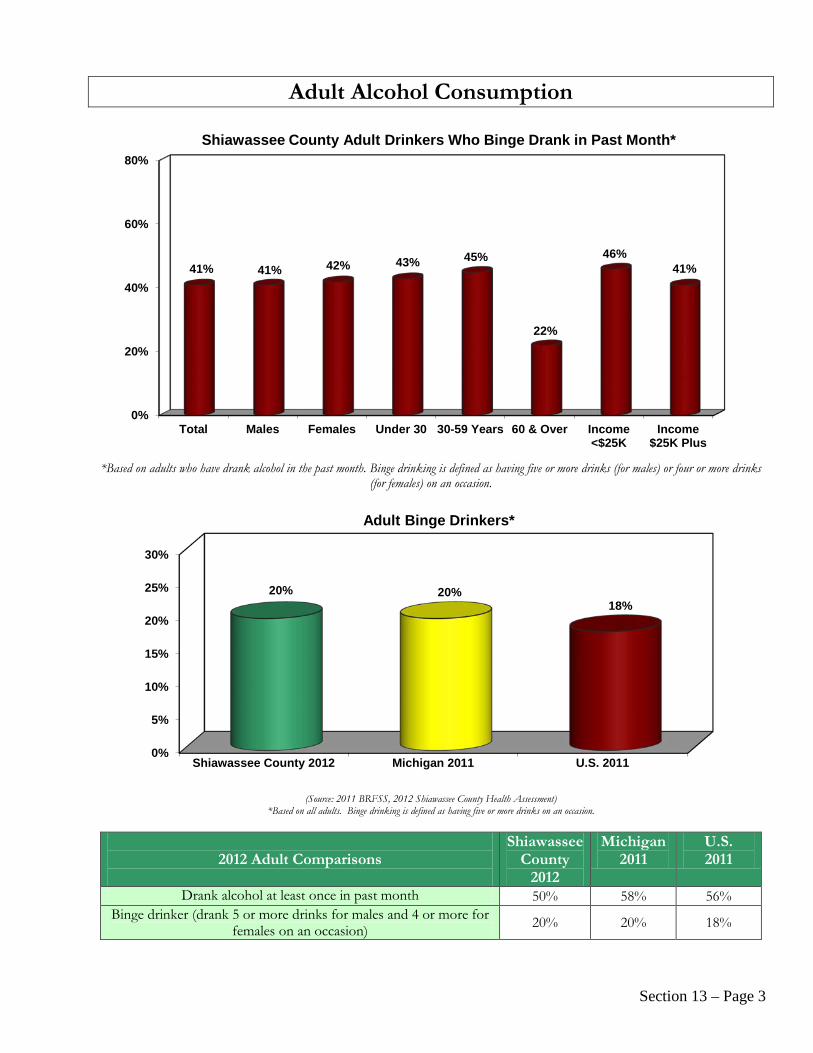
Section 13 – Page 3
Adult Alcohol Consumption
*Based on adults who have drank alcohol in the past month. Binge drinking is defined as having five or more drinks (for males) or four or more drinks (for females) on an occasion.
(Source: 2011 BRFSS, 2012 Shiawassee County Health Assessment) *Based on all adults. Binge drinking is defined as having five or more drinks on an occasion.
2012 Adult Comparisons
Shiawassee County
2012
Michigan 2011
U.S. 2011
Drank alcohol at least once in past month 50% 58% 56% Binge drinker (drank 5 or more drinks for males and 4 or more for
females on an occasion) 20% 20% 18%
0%
20%
40%
60%
80%
Total Males Females Under 30 30-59 Years 60 & Over Income<$25K
Income$25K Plus
41% 41% 42% 43% 45%
22%
46% 41%
Shiawassee County Adult Drinkers Who Binge Drank in Past Month*
0%
5%
10%
15%
20%
25%
30%
Shiawassee County 2012 Michigan 2011 U.S. 2011
20% 20% 18%
Adult Binge Drinkers*

Section 13 – Page 4
Motor Vehicle Accidents The following graphs show Shiawassee County and Michigan age-adjusted motor vehicle accident mortality rates per 100,000 population. The graphs show: ♦ The 2004-2008 annual average, age-adjusted transport fatality rate for Shiawassee County was below the
state rate for the same time period. In 2009, the Shiawassee rate was lower than the state rate. ♦ In Shiawassee, the number of motor vehicle deaths decreased from 2006 to 2010.
*Note – annual average reported from 2004-2008
(Source: MDCH, Vital Statistics, updated 1-24-2011)
(Source: Michigan Office of Highway Safety Planning, 2010)
0
5
10
15
20
25
30
*2004-2008 2009
12 10
16
21
Rat
e pe
r 1,0
00 P
opul
atio
n
Shiawassee County and Michigan, Age-Adjusted Transport Fatality Rate All Ages, Both Sexes, Annual Average 2004-2008 and 2009
Shiawassee Michigan
0
5
10
15
20
2006 2007 2008 2009 2010
13
10 8
6 4
No.
of r
epor
ted
deat
hs
Shiawassee County Number Motor Vehicle Deaths 2006 to 2010 N= 41
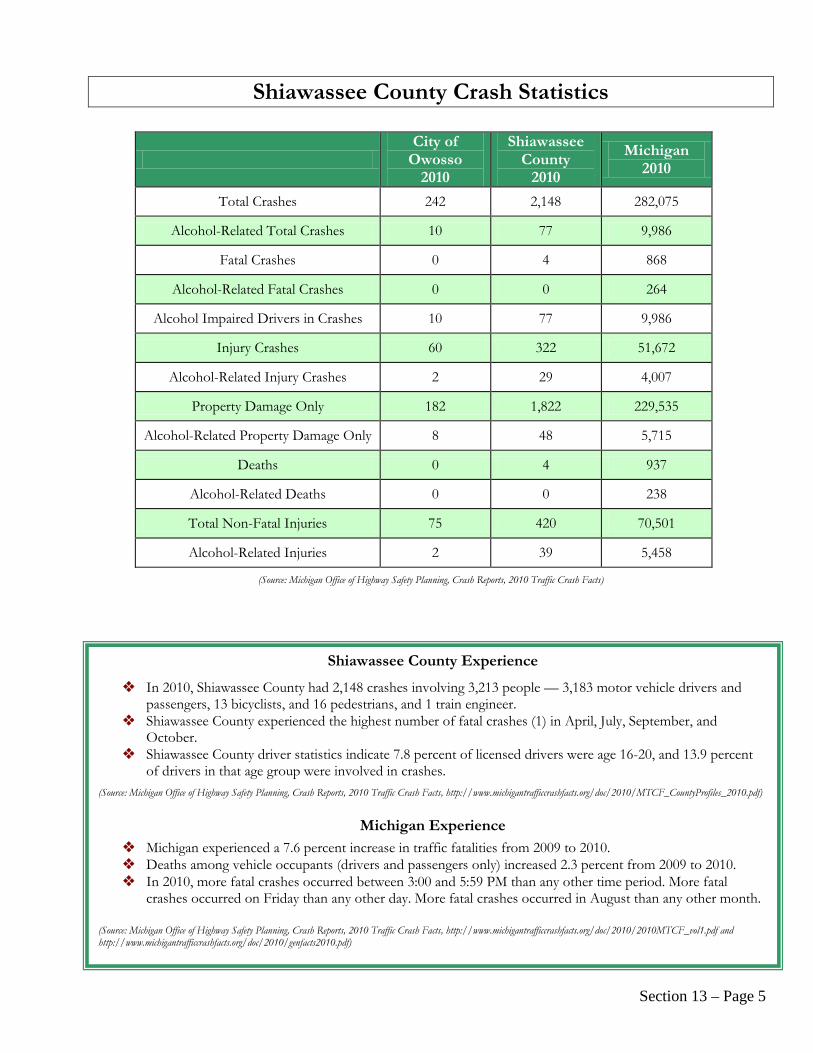
Section 13 – Page 5
Shiawassee County Crash Statistics
(Source: Michigan Office of Highway Safety Planning, Crash Reports, 2010 Traffic Crash Facts)
City of
Owosso 2010
Shiawassee County
2010
Michigan 2010
Total Crashes 242 2,148 282,075
Alcohol-Related Total Crashes 10 77 9,986
Fatal Crashes 0 4 868
Alcohol-Related Fatal Crashes 0 0 264
Alcohol Impaired Drivers in Crashes 10 77 9,986
Injury Crashes 60 322 51,672
Alcohol-Related Injury Crashes 2 29 4,007
Property Damage Only 182 1,822 229,535
Alcohol-Related Property Damage Only 8 48 5,715
Deaths 0 4 937
Alcohol-Related Deaths 0 0 238
Total Non-Fatal Injuries 75 420 70,501
Alcohol-Related Injuries 2 39 5,458
Shiawassee County Experience
In 2010, Shiawassee County had 2,148 crashes involving 3,213 people — 3,183 motor vehicle drivers and passengers, 13 bicyclists, and 16 pedestrians, and 1 train engineer.
Shiawassee County experienced the highest number of fatal crashes (1) in April, July, September, and October.
Shiawassee County driver statistics indicate 7.8 percent of licensed drivers were age 16-20, and 13.9 percent of drivers in that age group were involved in crashes.
(Source: Michigan Office of Highway Safety Planning, Crash Reports, 2010 Traffic Crash Facts, http://www.michigantrafficcrashfacts.org/doc/2010/MTCF_CountyProfiles_2010.pdf)
Michigan Experience
Michigan experienced a 7.6 percent increase in traffic fatalities from 2009 to 2010. Deaths among vehicle occupants (drivers and passengers only) increased 2.3 percent from 2009 to 2010. In 2010, more fatal crashes occurred between 3:00 and 5:59 PM than any other time period. More fatal
crashes occurred on Friday than any other day. More fatal crashes occurred in August than any other month. (Source: Michigan Office of Highway Safety Planning, Crash Reports, 2010 Traffic Crash Facts, http://www.michigantrafficcrashfacts.org/doc/2010/2010MTCF_vol1.pdf and http://www.michigantrafficcrashfacts.org/doc/2010/genfacts2010.pdf)

Section 14 – Page 1
Adult Marijuana and Other Drug Use
Key Findings In 2012, 9% of Shiawassee County adults had used marijuana during the past 6 months, and 9% of adults misused medications.
Adult Drug Use ♦ Nine percent (9%) of Shiawassee County
adults had used marijuana in the past 6 months.
♦ 66% of adults who used marijuana in the past year used it recreationally, but did not have a medical marijuana card. 17% had a medical marijuana card and used marijuana for medicinal purposes. 14% self-medicated with marijuana but did not have a medical marijuana card, and 3% used marijuana recreationally and had a medical marijuana card.
♦ When asked about their frequency of marijuana in the past six months, 25% of Shiawassee County adults who used marijuana did so almost every day, and 25% did so less than once a month.
♦ 1% Shiawassee County adults reported using other recreational drugs such as cocaine, methamphetamines, heroin, LSD, inhalants, or Ecstasy.
♦ 9% of adults had used medication not prescribed for them or they took more than prescribed to feel good or high and/or more active or alert during the past 6 months.
♦ When asked about their frequency of medication misuse in the past six months, 34% of Shiawassee County adults who used these drugs did so almost every day, and 34% did so less than once per month.
♦ Shiawassee County adults indicated they disposed of unused prescription medication in the following ways: took as prescribed (38%), threw them in the trash (23%), kept them (22%), flushed them down the toilet (21%), took them to a medication collection program (10%), gave them away (2%), and sold them (1%).
Drug-Related Emergency Department Visits
In the U.S. in 2009, there were nearly 4.6 million drug-related emergency department (ED) visits. Almost one half (2.1 million) were attributed to drug misuse or abuse.
The misuse or abuse of pharmaceuticals resulting in ED visits occurred at a rate of 405.4 visits per 100,000 population, compared with a rate of 317.1 per 100,000 population for illicit drugs.
Alcohol was a factor in the drug misuse or abuse accounting for about one third (31.8%) or 650,000 visits.
(Source: SAMHSA, Drug Abuse Warning Network Report, December 28, 2010, http://oas.samhsa.gov/2k10/DAWN034/EDHighlightsHTML.pdf)
Commonly Abused Prescription Drugs
Opiods–most often prescribed to relieve pain. Examples include: Codeine, Percocet, Darvon (Propoxyphene), Duragesic (Fentanyl), Dilaudid (Hydromorphone), Demerol (Meperidine), OxyContin (Oxycodone), and Vicodin (hydrocodone)
Central Nervous System (CNS) Depressants-may be used to treat anxiety and sleep disorders. Examples include: Mebaral (mephobarbital), Nembutal (pentobarbital sodium), Valium (diazepam), Librium (chlordiazepoxide HCL), Xanax (alprazolam), and ProSom (estazolam)
Stimulants-prescribed to treat narcolepsy, attention-deficit hyperactivity disorder (ADHD), asthma and obesity. Examples include: Dexedrine (dextroamphetamine), and Ritalin (methylphenidate)
(Source: National Institute on Drug Abuse, www.nida.nih.gov)
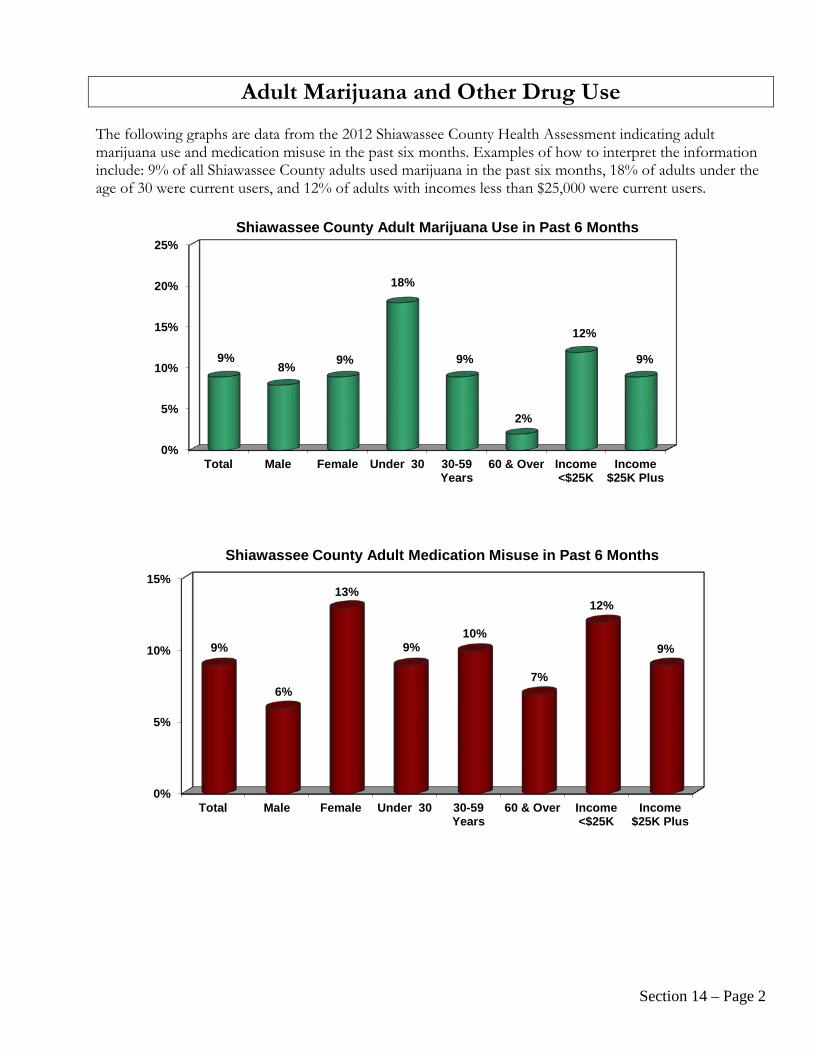
Section 14 – Page 2
Adult Marijuana and Other Drug Use The following graphs are data from the 2012 Shiawassee County Health Assessment indicating adult marijuana use and medication misuse in the past six months. Examples of how to interpret the information include: 9% of all Shiawassee County adults used marijuana in the past six months, 18% of adults under the age of 30 were current users, and 12% of adults with incomes less than $25,000 were current users.
0%
5%
10%
15%
20%
25%
Total Male Female Under 30 30-59Years
60 & Over Income<$25K
Income$25K Plus
9% 8% 9%
18%
9%
2%
12%
9%
Shiawassee County Adult Marijuana Use in Past 6 Months
0%
5%
10%
15%
Total Male Female Under 30 30-59Years
60 & Over Income<$25K
Income$25K Plus
9%
6%
13%
9% 10%
7%
12%
9%
Shiawassee County Adult Medication Misuse in Past 6 Months

Section 15 – Page 1
Women’s Health
Key Findings In 2012, three-fifths (60%) of Shiawassee County women over the age of 40 reported having a mammogram in the past year. 55% of Shiawassee County women have had a clinical breast exam and 44% have had a Pap smear to detect cancer of the cervix in the past year. The health assessment determined that almost one-quarter (24%) of women had high blood pressure, 29% had high blood cholesterol, 31% were obese, and 15% were identified as smokers, known risk factors for cardiovascular diseases.
Women’s Health Screenings ♦ In 2012, 62% of women had a mammogram at some
time and more than one-third (39%) had this screening in the past year.
♦ Three-fifths (60%) of women ages 40 and over had a mammogram in the past year and 77% had one in the past two years. The 2010 BRFSS reported that 76% of women 40 and over in the U.S. and 78% in Michigan had a mammogram in the past two years.
♦ Most (94%) Shiawassee County women have had a clinical breast exam at some time in their life and 55% had one within the past year.
♦ This assessment has identified that 95% of Shiawassee County women have had a Pap smear and 44% reported having had the exam in the past year. 68% of women had a Pap smear in the past two years.
♦ 70% of Shiawassee County women have done a self-breast exam in the past year.
Women’s Health Concerns ♦ 24% of Shiawassee County women had been pregnant in the past 5 years. ♦ During their last pregnancy, Shiawassee County women: got a prenatal appointment in the first 3 months
(71%), took a multi-vitamin (71%), smoked cigarettes (12%), experienced perinatal depression (8%), looked for options for an unwanted pregnancy (8%), used alcohol (2%), and used marijuana (2%).
♦ Major risk factors for cardiovascular disease include smoking, obesity, high blood cholesterol, high blood pressure, physical inactivity, and diabetes. In Shiawassee County the 2012 health assessment has identified that: 15% of all women were current smokers(19% U.S., 20% Michigan, 2011 BRFSS) 54% were overweight or obese (57% U.S., 61% Michigan, 2011 BRFSS) 29% were diagnosed with high blood cholesterol (37% U.S., 40% Michigan, 2011 BRFSS) 24% were diagnosed with high blood pressure (30% U.S. and 33% Michigan, 2011 BRFSS) 39% were exercising less than three days per week (includes 4% who were unable to exercise) 6% have been diagnosed with diabetes (11% U.S., 12% Michigan, 2011 BRFSS)
*2010 BRFSS
2012 Adult Comparisons
Shiawassee County
2012
Michigan 2011
U.S. 2011
Age 40 and over having had a mammogram in the past 2 years 77% 78%* 75%*
Had a pap smear in the past three years 79% 82%* 81%* Age 40 & over had a clinical breast exam in the past two years 78% 78%* 75%*
Shiawassee County Female Leading Types of Death, 2010
Total Female Resident Deaths: 342 1. Heart Diseases (23% of all deaths) 2. Cancers (20%) 3. Chronic Lower Respiratory Diseases (8%) 4. Stroke (5%) 5. Unintentional Injuries (3%)
(Source: MDCH, updated May 2012)
Michigan Female Leading Types of Death, 2010
Total Female Resident Deaths: 44,586 1. Heart Diseases (26% of all deaths) 2. Cancers (22%) 3. Chronic Lower Respiratory Diseases (6%) 4. Stroke (6%) 5. Alzheimer’s Disease (4%)
(Source: MDCH, updated May 2012)

Section 15 – Page 2
Women’s Health The following graph shows the percentage of Shiawassee County female adults that had various health exams in the past year. Examples of how to interpret the information shown on the graph include: 39% of Shiawassee County females have had a mammogram within the past year, 55% have had a clinical breast exam, and 44% have had a Pap smear.
0%
25%
50%
75%
100%
Total Under 40 40 & Older Income <$25K Income >$25K
39%
2%
60%
24%
42%
55% 55% 56%
36%
61%
44%
61%
37% 34%
49%
Shiawassee County Women's Health Exams Within the Past Year
Mammogram Breast Exam Pap Smear
Cancer and Women More women in the U.S. die from lung cancer than any other type of cancer. The most important
thing you can do to prevent lung cancer is not to start smoking, or to quit if you smoke. Breast cancer is the most common cause of cancer and the second most common cause of cancer
deaths in American women. Mammograms are the best way to find breast cancer early, before it can be felt, and when it is easier to treat.
Colorectal cancer is the third leading cause of cancer deaths in America women. Screening tests can find precancerous polyps so they can be removed before they turn into cancer. Everyone should be tested for colorectal cancer regularly, starting at age 50.
Gynecologic cancers (cervix, ovaries, and uterus) can be prevented by Pap tests, which can find abnormal cells and detect cancer early.
(Source: Centers for Disease Control and Prevention, National Cancer Institute, 2010)
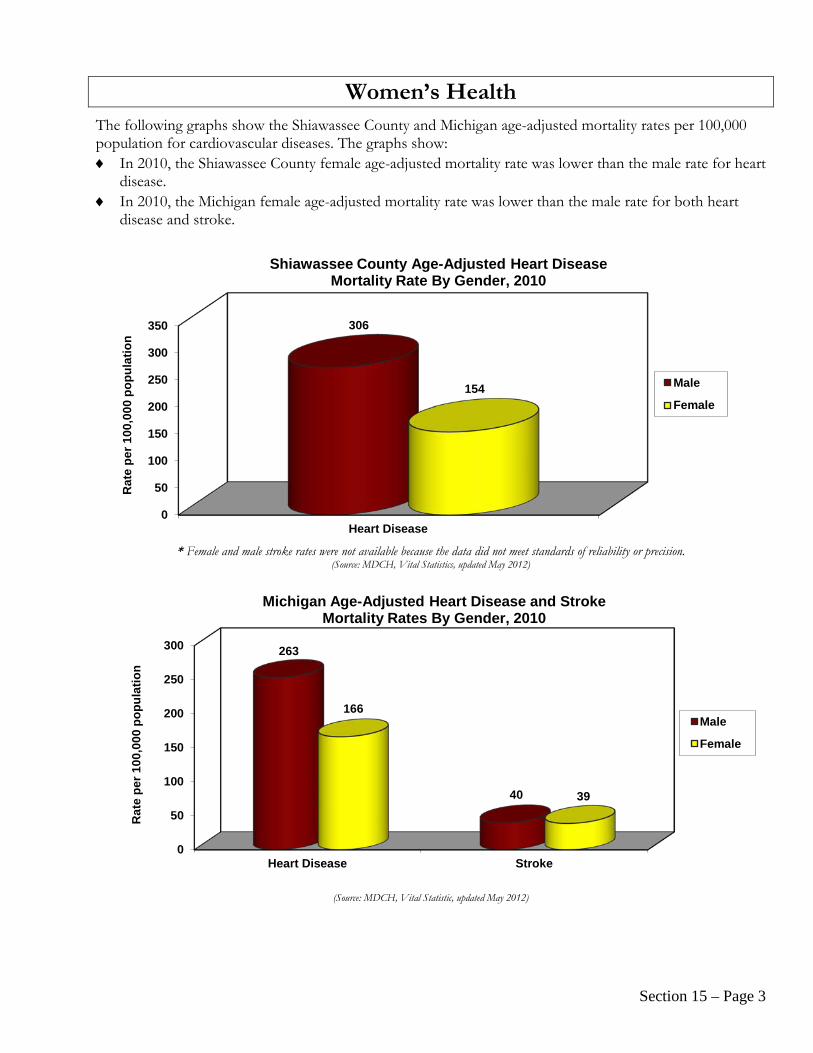
Section 15 – Page 3
Women’s Health
The following graphs show the Shiawassee County and Michigan age-adjusted mortality rates per 100,000 population for cardiovascular diseases. The graphs show: ♦ In 2010, the Shiawassee County female age-adjusted mortality rate was lower than the male rate for heart
disease. ♦ In 2010, the Michigan female age-adjusted mortality rate was lower than the male rate for both heart
disease and stroke.
* Female and male stroke rates were not available because the data did not meet standards of reliability or precision.
(Source: MDCH, Vital Statistics, updated May 2012)
(Source: MDCH, Vital Statistic, updated May 2012)
0
50
100
150
200
250
300
350
Heart Disease
306
154
Rat
e pe
r 100
,000
pop
ulat
ion
Shiawassee County Age-Adjusted Heart Disease Mortality Rate By Gender, 2010
Male
Female
0
50
100
150
200
250
300
Heart Disease Stroke
263
40
166
39
Rat
e pe
r 100
,000
pop
ulat
ion
Michigan Age-Adjusted Heart Disease and Stroke Mortality Rates By Gender, 2010
Male
Female

Section 15 – Page 4
Women’s Health
The following graphs show the Shiawassee County age-adjusted mortality rates per 100,000 population for women’s health with comparison to Healthy People 2020 objectives when available. The graphs show: ♦ From 2005-2009, the Shiawassee County age-adjusted mortality rate for female lung cancer was greater
than the Michigan rate, and less than the Healthy People 2020 target objective. ♦ From 2005-2009, the Shiawassee County age-adjusted breast cancer mortality rate was greater than the
Michigan rate and the Healthy People 2020 target objective. ♦ The Shiawassee, age-adjusted ovarian cancer rate was higher than the state rate, from 2005-2009.
*Note: Healthy People 2020 target rates are not gender specific; Healthy People 2020 Targets may not be available for all diseases.
(Source: National Cancer Institute, State Cancer Profiles, and Healthy People 2020)
(Source: National Cancer Institute, State Cancer Profiles)
0
10
20
30
40
50
Lung Cancer Colon/Rectum Cancer Breast Cancer
44.1
12.1
25.1
43.9
14.7
24
45.5
14.5 20.6
Rat
e pe
r 100
,000
p
opul
atio
n
Shiawassee County & Michigan Female Age-Adjusted Cancer Mortality Rates & Healthy People 2020 Targets
Shiawassee 2005-2009 Michigan 2005-2009 HP 2020 Target*
0
5
10
15
20
Ovarian Cancer
11.3
8.6
Rat
e pe
r 100
,000
p
opul
atio
n
Shiawassee County and Michigan Female Age-Adjusted Ovarian Cancer Mortality Rate
Shiawassee 2005-2009 Michigan 2005-2009

Section 15 – Page 5
Women’s Health
Human Papilloma Virus (HPV) and Vaccine
HPV is the most common sexually transmitted infection in the U.S., with 6.2 million people becoming newly infected annually. There are more than 100 types of HPV, more than 40 of which can infect the genitals. Most HPV infections are benign and transient; however, almost all cervical cancers are related to infections by HPV.
The Centers for Disease Control and Prevention report that every year in the U.S., about 11,000 women are diagnosed with cervical cancer and almost 4,000 of them die from this disease.
Most cases of cervical cancer and all cases of genital warts are caused by human papillomavirus (HPV). o 70% of cervical cancers are caused by HPV types 16 and 18.
There are two HPV vaccines available to protect against types 16, 18, and other subtypes of HPV that cause cervical cancers. These vaccinations include:
o Cervarix: The Federal Food and Drug Administration (FDA) licensed Cervarix in 2009. This vaccine is recommended for females ages 10 through 25.
o Gardasil: The FDA licensed Gardasil in 2006. This vaccine is recommended for 11 and 12 year-old girls as well as females ages 13 through 26, who were not previously vaccinated. The vaccine protects females against HPV types 6, 11, 16, and 18.
HPV Vaccines are approximately $130 per dose and are available in all 50 states through the Vaccine for Children (VFC) program, which covers vaccine costs for children and teens who do not have insurance and for some children and teens who are underinsured or eligible for Medicaid.
Recent data from the National Immunization Survey of Teens showed: Among US girls ages 13 to 17, uptake of the HPV vaccine initiation increased from 25.1% in 2007 to
48.7% in 2010. 32% or about one-third of girls had the complete three-shot vaccine series by 2010. Catch-up vaccine uptake improved for women between the ages of 13 and 26; from 10.5% in 2008 to
17.1% in 2009. o Non-Hispanic women had the highest catch-up HPV vaccine uptake (19.8%) in 2009. Following
were African American women (13.3%) and Hispanic women (12.6%).
(Sources: Centers for Disease Control and Prevention, Vaccine Safety, Human Papillomavirus (HPV) Vaccine, updated June 19, 2012, from http://www.cdc.gov/vaccinesafety/vaccines/HPV/Index.html and American Cancer Society. Cancer Prevention & Early Detection Facts & Figures 2012; p. 40-41. Atlanta: American Cancer Society; 2012)

Section 16 – Page 1
Men’s Health
Key Findings In 2012, more than half (52%) of Shiawassee County males over the age of 50 had a Prostate-Specific Antigen (PSA) test in the past year. 54% of males over the age of 50 had a digital rectal exam in the past year. Major cardiovascular diseases (heart disease and stroke) accounted for 30% and cancers accounted for 25% of all male deaths in Shiawassee County in 2010. The health assessment determined that 7% of men had a heart attack, and 1% had a stroke at some time in their life. Over one-third (35%) of men had been diagnosed with high blood pressure, 46% had high blood cholesterol, and 22% were identified as smokers, which, along with obesity (35%), are known risk factors for cardiovascular diseases.
Men’s Health Screenings ♦ Almost half (48%) of Shiawassee County males had
a Prostate-Specific Antigen (PSA) test at some time in their life and 35% had one in the past year.
♦ Two-thirds (67%) of men had a digital rectal exam in their lifetime and 38% had one in the past year.
♦ Almost three-fifths (59%) of men ages 40 and over had a PSA test in the past two years. The 2010 BRFSS reported that 53% of men 40 and over in the U.S. and 55% in Michigan, had a PSA test in the past two years.
♦ 71% of males age 50 and over had a PSA test at some time in their life, and 52% had one in the past year. ♦ 88% of males age 50 and over had a digital rectal exam at some time in their life, and 54% have had one in
the past year. ♦ 38% of men have done a self-testicular exam within the past year.
Men’s Health Concerns ♦ In 2010, major cardiovascular diseases (heart disease and stroke) accounted for 30% of all male deaths in
Shiawassee County (Source: MDCH, Vital Statistics) ♦ In 2012, the health assessment determined that 7% of men had a heart attack and 1% had a stroke at some
time in their life. ♦ Major risk factors for cardiovascular disease include smoking, obesity, high blood cholesterol, high blood
pressure, physical inactivity, and diabetes. In Shiawassee County, the 2012 health assessment has identified that: • 22% of all men were current smokers(24% U.S., 27% Michigan, 2011 BRFSS) • 84% were overweight or obese (70% U.S., 70% Michigan, 2011 BRFSS) • 46% were diagnosed with high blood cholesterol (40% U.S., 45% Michigan, 2011 BRFSS) • 35% were diagnosed with high blood pressure (32% U.S., 36% Michigan, 2011 BRFSS) • 41% were exercising less than three days per week (includes 6% who were unable to exercise) • 17% have been diagnosed with diabetes (10% U.S., 10% Michigan, 2011 BRFSS)
♦ In 2010, cancer was the second leading cause of death for Shiawassee County males (n=92 male resident deaths). Cancer was also the second leading cause of death for Michigan males (n=10,703 resident deaths) (Source: MDCH, Vital Statistics).
Shiawassee County Male Leading Types of Death, 2010
Total Male Resident Deaths: 369 1. Heart Diseases (25% of all deaths) 2. Cancers (25%) 3. Chronic Lower Respiratory Diseases (9%) 4. Unintentional Injuries (6%) 5. Stroke (5%)
(Source: MDCH, updated May 2012)
Michigan Male Leading Types of Death, 2010
Total Male Resident Deaths: 43,471 1. Heart Diseases (27% of all deaths) 2. Cancers (25%) 3. Chronic Lower Respiratory Diseases (6%) 4. Unintentional Injuries (5%) 5. Stroke (4%)
(Source: MDCH, updated May 2012)
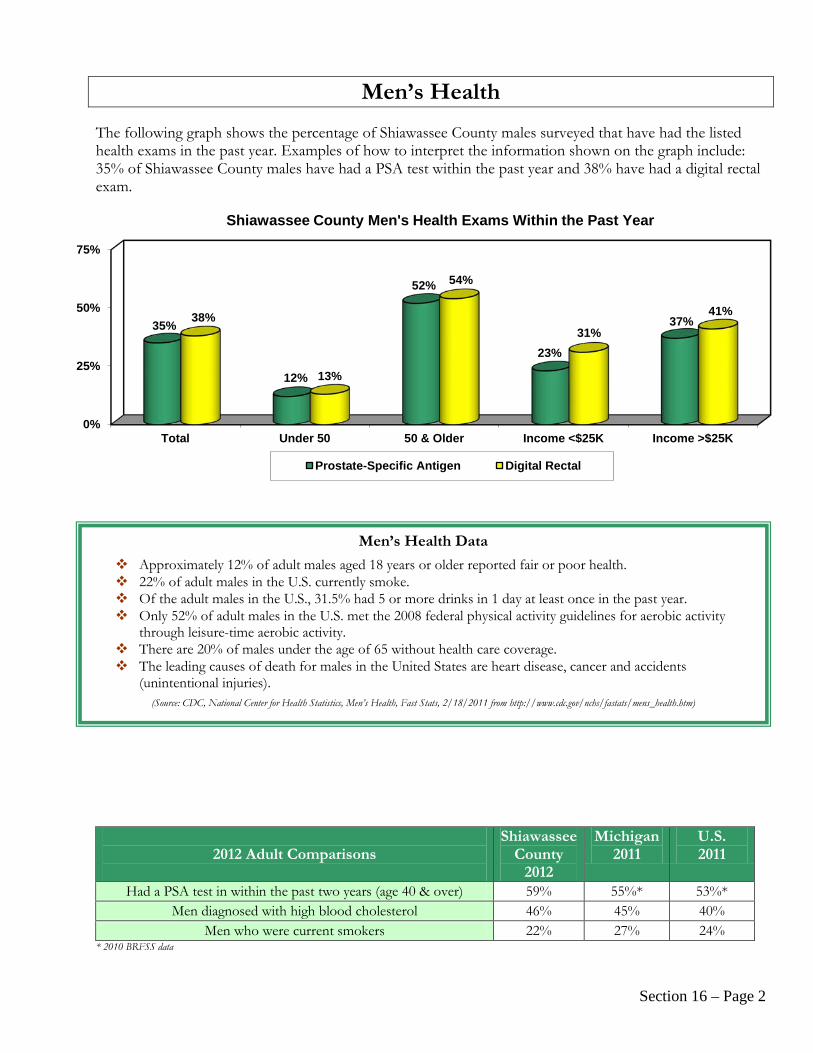
Section 16 – Page 2
Men’s Health The following graph shows the percentage of Shiawassee County males surveyed that have had the listed health exams in the past year. Examples of how to interpret the information shown on the graph include: 35% of Shiawassee County males have had a PSA test within the past year and 38% have had a digital rectal exam.
2012 Adult Comparisons
Shiawassee County
2012
Michigan 2011
U.S. 2011
Had a PSA test in within the past two years (age 40 & over) 59% 55%* 53%* Men diagnosed with high blood cholesterol 46% 45% 40%
Men who were current smokers 22% 27% 24% * 2010 BRFSS data
0%
25%
50%
75%
Total Under 50 50 & Older Income <$25K Income >$25K
35%
12%
52%
23%
37% 38%
13%
54%
31%
41%
Shiawassee County Men's Health Exams Within the Past Year
Prostate-Specific Antigen Digital Rectal
Men’s Health Data
Approximately 12% of adult males aged 18 years or older reported fair or poor health. 22% of adult males in the U.S. currently smoke. Of the adult males in the U.S., 31.5% had 5 or more drinks in 1 day at least once in the past year. Only 52% of adult males in the U.S. met the 2008 federal physical activity guidelines for aerobic activity
through leisure-time aerobic activity. There are 20% of males under the age of 65 without health care coverage. The leading causes of death for males in the United States are heart disease, cancer and accidents
(unintentional injuries).
(Source: CDC, National Center for Health Statistics, Men’s Health, Fast Stats, 2/18/2011 from http://www.cdc.gov/nchs/fastats/mens_health.htm)

Section 16 – Page 3
Men’s Health The following graphs show the Shiawassee County and Michigan age-adjusted mortality rates per 100,000 population for men’s cardiovascular diseases. The graphs show: ♦ In 2010, the Shiawassee County male age-adjusted mortality rate was higher than the female rate for
heart disease. ♦ In 2010, the Michigan male age-adjusted mortality rate was higher than the female rate for both heart
disease and stroke.
* Male and female stroke rate were not available because the data did not meet standards of reliability or precision.
(Source: MDCH, Vital Statistics, updated May 2012)
(Source: MDCH, Vital Statistic, updated May 2012)
0
50
100
150
200
250
300
350
Heart Disease
306
154
Rat
e pe
r 100
,000
pop
ulat
ion
Shiawassee County Age-Adjusted Heart Disease Mortality Rate By Gender, 2010
Male
Female
0
50
100
150
200
250
300
Heart Disease Stroke
263
40
166
39
Rat
e pe
r 100
,000
pop
ulat
ion
Michigan Age-Adjusted Heart Disease and Stroke Mortality Rates By Gender, 2010
Male
Female

Section 16 – Page 4
Men’s Health
The following graph shows the Shiawassee County age-adjusted mortality rates per 100,000 population for men’s health with comparison to Healthy People 2020 objectives. The graph shows: ♦ From 2005-2009, the Shiawassee County age-adjusted mortality rate for male lung cancer was greater
than the Michigan rate and the Healthy People 2020 target objective. ♦ From 2005-2009, the Shiawassee County age-adjusted mortality rate for male colorectal cancer was less
than the Michigan rate, but greater than the Healthy People 2020 target objective. ♦ The Shiawassee County, age-adjusted prostate cancer mortality rate was lower than the Michigan rate
and the Healthy People 2020 target objective, from 2005-2009.
*Note: the Healthy People 2020 target rates are not gender specific. (Source: National Cancer Institute, State Cancer Profiles and Healthy People 2020)
0
20
40
60
80
100
Lung Cancer Colon/Rectum Cancer Prostate Cancer
76.8
18.2 15.7
70.3
20.2 22.6
45.5
14.5 21.2 R
ate
per 1
00,0
00
pop
ulat
ion
Shiawassee County & Michigan Male Age-Adjusted Cancer Mortality Rates & Healthy People 2020 Targets
Shiawassee 2005-2009 Michigan 2005-2009 HP 2020 Target*
Cancer and Men More men in the U.S. die from lung cancer than any other type of cancer. The most important thing you can
do to prevent lung cancer is not to start smoking, or to quit if you smoke. Prostate cancer is the most common cancer in men in the U.S., not counting skin cancer. It is the second
most common cause of cancer death in men. While all men are at risk for prostate cancer, some factors increase risk. These include: o older age o family history of prostate cancer o being African American
Colorectal cancer is the third leading cause of cancer deaths in America men. Screening tests can find precancerous polyps so they can be removed before they turn into cancer. Everyone should be tested for colorectal cancer regularly, starting at age 50.
(Source: Center for Disease Control and Prevention, National Cancer Institute, 2010)

Section 17 – Page 1
Adult Preventive Medicine and Health Screenings
Key Findings 57% of adults over 50 had received a colonoscopy or sigmoidoscopy in the past 5 years. 26% of adults have received a pneumonia shot in their lifetime.
Preventive Medicine ♦ More than one-quarter (26%) of adults have had a
pneumonia shot in their life, increasing to 66% of those ages 65 and over.
♦ The 2011 BRFSS reported that 70% of U.S. and 67% of Michigan adults ages 65 and over had a pneumonia shot in their life.
♦ 40% of adults reported receiving a flu vaccine. Adults who did not receive a flu vaccine offered the following reasons for not doing so: did not need it (49%), get sick from it (12%), cost (8%), time (3%), insurance would not pay for it (2%), vaccine not available (1%), religious beliefs (<1%), and other reasons (21%).
Preventive Health Screenings and Exams ♦ 34% of adults had a colonoscopy or sigmoidoscopy in the past five years, increasing to 57% of those over the age
of 50. ♦ 24% of adults received a hearing screening within the past two years, increasing to 36% of those ages 60 and over. ♦ 70% of adults received preventive testing for vision within the past two years. ♦ Shiawassee County adults reported the following as symptoms of a heart attack: chest pain or discomfort (93%),
pain or discomfort in the arms and shoulders (86%), shortness of breath (83%), pain or discomfort in the jaw, neck, or back (67%), feeling weak, lightheaded, or faint (63%), and sudden trouble seeing in one or both eyes (42%).
♦ Shiawassee County adults reported the following as symptoms of stroke: sudden numbness or weakness of face, arm or leg (89%), sudden confusion or trouble speaking (88%), sudden trouble walking, dizziness or loss of balance (80%), sudden trouble seeing in one or both eyes (67%), severe headache with no known cause (60%), and sudden chest pain or discomfort (32%).
♦ 58% of adults had been to the doctor for a routine visit in the past year. ♦ In the past year, 60% of Shiawassee County women ages 40 and over have had a mammogram. ♦ In the past year, 52% of men ages 50 and over had a Prostate-Specific Antigen (PSA) test.
Preventive Counseling Services ♦ Shiawassee County adults indicated that their doctor or other health professional had discussed the following
topics with them within the past year: physical activity or exercise (40%), weight, diet or eating habits (39%), significance of family health history (21%), immunizations (20%), depression/anxiety/emotional problems (18%), injury prevention (12%), quitting smoking (11%), alcohol use (11%), alcohol use when taking prescription drugs (10%), sexual practices (6%), illicit drug abuse (5%), and domestic violence (2%).
Shiawassee County Adult Health Screening Results GENERAL SCREENING RESULTS Total Sample Diagnosed with High Blood Pressure 29% Diagnosed with High Blood Cholesterol 37% Diagnosed with Diabetes 11% Diagnosed with a Heart Attack 4% Diagnosed with a Stroke 2%
Ways to Prevent Seasonal Flu 1. Get vaccinated each year. 2. Avoid close contact with people who are sick. 3. Stay home when you are sick. 4. Cover your mouth and nose. 5. Wash your hands. 6. Avoid touching eyes, nose, or mouth. 7. Practice other good health habits, such as get plenty of
sleep, exercise routinely, drink plenty of fluids, eat a nutritious diet.
(Source: Centers for Disease Control, National Center for Immunization and Respiratory Diseases (NCIRD), Fact Sheet: Good Health Habits for Preventing Seasonal Flu)

Section 18 – Page 1
Adult Sexual Behavior and Pregnancy Outcomes
Key Findings In 2012, nearly three-fourths (71%) of Shiawassee County adults had sexual intercourse. Six percent of adults had more than one partner. Even though young people aged 15-24 represent only 25% of the sexually experienced population, they acquire nearly half of all STDs (Source: CDC, STDs in Adolescents and Young Adults, 2009 STD Surveillance).
Adult Sexual Behavior ♦ Nearly three-fourths (71%) of Shiawassee County
adults had sexual intercourse in the past year. ♦ 6% of adults reported they had intercourse with
more than one partner in the past year, increasing to 18% of those under the age of 30.
♦ Shiawassee County adults used the following methods of birth control: vasectomy (22%), abstinence (22%), tubes tied (15%), hysterectomy (9%), birth control pills (9%), condoms (8%), withdrawal (5%), contraceptive implants (2%), rhythm method (2%), diaphragm (1%), IUD (1%), shots (<1%), and contraceptive patch (<1%).
♦ 14% of Shiawassee County adults were not using any method of birth control. ♦ Shiawassee County adults did not use birth control for the following reasons:
o They or their partner had a hysterectomy/vasectomy/tubes tied (35%) o They or their partner were too old (15%) o They did not think they or their partner could get pregnant (7%) o They wanted to get pregnant (4%) o They did not want to use birth control (4%) o They did not care if they or their partner got pregnant (4%) o They or their partner did not like birth control/had a fear of side effects (3%) o Their partner did not want to use birth control (2%) o Their partner was currently pregnant (1%) o They could not pay for birth control (1%) o Religious preferences (1%) o They did not think they were going to have sex (no regular partner) (<1%) o They had a same-sex partner (<1%)
♦ Shiawassee County adults were diagnosed with the following sexually transmitted diseases (STDs) in the past 5 years: human papilloma virus (HPV) (2%), chlamydia (1%), and HIV (<1%).
♦ 16% of adults engaged in sexual activity following alcohol or other drug use that they would not have done if sober, increasing to 18% of those under 30.
Ways to Have Safer Sex
Be honest with your partner. Protect yourself and your partner from body
fluids. Sexual play without intercourse can be enjoyable
and safer than intercourse. Ask questions about partner’s history (drugs,
sexual partners, and whether or not they’ve been tested).
Get the correct treatment if you become infected.
Getting tested regularly for HIV/AIDS and other sexually transmitted diseases.
(Source: Planned Parenthood: Preventing STIs/STDs, http://www.plannedparenthood.org/sexual-health/std/preventing-stis-stds.htm)
Risk Factors for Contracting Sexually Transmitted Infections
Having unprotected sex Transmission from mother to infant Having multiple sex partners Injecting drugs Having a history of one or more STIs Abusing alcohol or using recreational drug
(Source: Mayo Foundation for Medical Education and Research, 2-24-2011)

Section 18 – Page 2
Adult Sexual Behavior and Pregnancy Outcomes The following graph shows the sexual activity of the Shiawassee County adults. Examples of how to interpret the information in graph one include: 65% of all Shiawassee County adults had one sexual partner in the last 12 months and 6% had more than one, and 57% of males had one partner in the past year.
Respondents were asked: “During the past 12 months, with how many different people have you had sexual intercourse?”
0%
20%
40%
60%
80%
100%
Total Male Female Under 30 30-59 Years 60 & Over Income<$25K
Income$25K Plus
65% 57%
74% 61%
73%
44% 51%
71%
6% 9%
3% 18% 6%
1% 5%
7%
29% 34%
23% 21% 21%
55% 44%
22%
Number of Sexual Partners in the Past Year
One More than one None
Types of Contraception
Sterilization: For females, this is also known as having their “tubes tied”. Female sterilization involves the surgical closing of the fallopian tubes which carry the eggs from the ovaries to the uterus. For males, sterilization is referred to as a vasectomy. This procedure involves the surgical closing of tubes that carry sperm.
Abstinence: The voluntary refraining from sexual activity. Abstinence is the only contraceptive method that is 100% effective in the prevention of both pregnancy and the transmission of sexually transmitted diseases.
Barrier Methods (Condoms): The male condom is a tube of thin material (latex rubber) that is rolled over the erect penis prior to contact with the vagina. This is the most commonly used barrier method. The female condom is a seven-inch long pouch of polyurethane with two flexible rings and is inserted into the vagina prior to intercourse.
Hormonal Methods: Whether administered as a pill, patch, shot, ring or implant, hormone medications contain manufactured forms of the hormones estrogen and/or progesterone. They work by either preventing a woman’s ovary from releasing an egg, thickening cervical mucus, making it harder for sperm to reach the egg, or by thinning the lining of the uterus making it harder for a fertilized egg to implant in the uterine wall.
Intrauterine Device (IUD): a small plastic device containing copper or hormones and is inserted into the uterus by a medical professional.
(Source: The American Pregnancy Association; Overview: Birth Control Methods, http://www.americanpregnancy.org/preventingpregnancy/overviewtypesbirthcontrol.html)

Section 18 – Page 3
Adult Sexual Behavior and Pregnancy Outcomes The following graphs show Shiawassee County chlamydia and gonorrhea disease cases per 100,000 population updated June 6, 2011 by the Michigan Department of Community Health. The data shows: ♦ The Shiawassee County chlamydia rate increased from 2006 to 2010. ♦ In 2010, the U.S. rate for new chlamydia cases was 426.0 per 100,000 population. (Source: CDC, Sexually Transmitted
Diseases Surveillance, 2010)
(Source: Michigan Sexually Transmitted Diseases Database, Updated 6-6-2011)
154 166 124 141
205
378 410
465 483 504
0
100
200
300
400
500
600
2006 2007 2008 2009 2010
Rat
e pe
r 100
,000
Pop
ulat
ion
Chlamydia Annualized Disease Rates for Shiawassee County and Michigan
Shiawassee Michigan
112 119
88 100
145
50
100
150
200
250
300
2006 2007 2008 2009 2010
Num
ber o
f cas
es re
port
ed
Annualized Count of Chlamydia Cases for Shiawassee County

Section 18 – Page 4
Adult Sexual Behavior and Pregnancy Outcomes ♦ The Shiawassee County gonorrhea rate fluctuated from 2006 to 2010.These rates remained well below
the Michigan rate. ♦ In 2010, the U.S. rate for new gonorrhea cases for the total population was 100.8 per 100,000
population. (Source: CDC, Sexually Transmitted Diseases Surveillance, 2010) ♦ The Healthy People 2020 objective for gonorrhea is 257 for new female cases and 198 for new male
cases per 100,000 population.
(Source: Michigan Sexually Transmitted Diseases Database, Updated 6-6-2011)
30 25 21
30 17
164 172 179 155
139
0
25
50
75
100
125
150
175
200
2006 2007 2008 2009 2010
Rat
e pe
r 100
,000
pop
ulat
ion
Gonorrhea Annualized Disease Rates for Shiawassee County and Michigan
Shiawassee Michigan
22 18
15
21
9
0
5
10
15
20
25
30
2006 2007 2008 2009 2010
Num
ber o
f cas
es re
port
ed
Annualized Count of Gonorrhea Cases for Shiawassee County

Section 18 – Page 5
Adult Sexual Behavior and Pregnancy Outcomes Pregnancy Outcomes *Please note that the pregnancy outcomes data includes all births to adults and adolescents. ♦ From 2005-2009, there was an average of 775 live births per year in Shiawassee County. ♦ In 2010, the U.S. fertility rate was 64.7 per 1,000 women ages 15-44 (Source: National Center for Health Statistics, CDC, 2010).
* Crude birth rates are live births per 1,000 resident population.
(Source for graphs: Michigan Department of Community Health, Natality and Pregnancy, Updated 1-25-12)
0
5
10
15
20
2006 2007 2008 2009 2010
12 11 11 10 10
13 12 12 12 12
Rat
e pe
r 1,0
00 P
opul
atio
n
Shiawassee County and Michigan Crude Birth Rates
Shiawassee Michigan
0
250
500
750
1,000
2006 2007 2008 2009 2010
863 807 772
716 717
Num
ber o
f Liv
e B
irths
Shiawassee County Total Live Births

Section 18 – Page 6
Adult Sexual Behavior and Pregnancy Outcomes Pregnancy Outcomes *Please note that the pregnancy outcomes data includes all births to adults and adolescents. ♦ From 2006 to 2010, the rate of abortions in Shiawassee County fluctuated, but decreased overall. ♦ From 2004 to 2009, the Shiawassee infant mortality rate decreased. ♦ In 2010, the U.S. infant mortality rate was 6.1 (Source: National Vital Statistics System, CDC, 2011).
*Rates per 1,000 females ages 15-44.
*Deaths occurring to individuals less than 1 year of age.
*The infant death rate is the number of resident infant deaths divided by total resident live births X 1,000
(Source for graphs: Michigan Department of Community Health, Natality and Pregnancy, Updated 1-28-11)
0
5
10
15
2006 2007 2008 2009 2010
7.4 7.7 7.4 7.5 6.0
11.9 11.8 12.7
11.2 11.9
Rat
es p
er 1
,000
fem
ales
Shiawassee Michigan
Shiawassee and Michigan Abortion Rates*
0
5
10
15
20
2004-2006 2007-2009
7.6 5.7
7.6 7.6
Rat
e pe
r 1,0
00 fe
mal
es
Shiawassee County and Michigan Infant Mortality Rates Three-Year Averages*
Shiawassee Michigan

Section 18 – Page 7
Adult Sexual Behavior and Pregnancy Outcomes Pregnancy Outcomes *Please note that the pregnancy outcomes data includes all births to adults and adolescents ♦ From 2006 to 2010, Shiawassee County low birth weight birth ratios fluctuated and remained below the
state rates, except in 2007. ♦ In 2009, 8.2% of all U.S. live births were low birth weight births. (Source: National Center for Health Statistics, CDC 2009)
*Low birth weight is less than 2500 grams. Ratios are low weight births per 1,000 live births.
0
25
50
75
100
2006 2007 2008 2009 2010
76.5
92.9
68.7 75.4
69.7
84.1 84.3 85.3 83.9 84.4
Rat
ios
per 1
,000
live
birt
hs
Shiawassee County and Michigan Low Birth Weight Births*
Shiawassee Michigan

Section 19 – Page 1
Quality of Life and Safety Key Findings Nearly one-quarter (24%) Shiawassee County adults in 2012 reported they were limited in some way because of a physical, mental or emotional problem.
Impairments and Health Problems ♦ Nearly one-quarter (24%) Shiawassee County
adults are limited in some way because of a physical, mental or emotional problem (26% Michigan, 24% U.S., 2011 BRFSS), increasing to 42% of those with incomes less than $25,000.
♦ Among those who were limited in some way, the following most limiting problems or impairments were reported: back or neck problems (38%), arthritis/rheumatism (36%), stress/anxiety/emotional problems (28%), walking problems (22%), obesity (22%), lung/breathing problems (18%), and fractures/bone or joint injury (18%).
♦ As a result of impairments or health problems, Shiawassee County adults needed help with the following: household chores (16%), getting around for other purposes (14%), shopping (10%), doing necessary business (7%), bathing (3%), dressing (3%), getting around the house (1%), and eating (1%).
♦ In the past month, 20% of adults provided regular care or assistance to a friend or family member who had a health problem, long-term illness or disability.
0%
10%
20%
30%
40%
50%
Back/NeckProblems
Arthritis Stress,Anxiety andEmotionalProblems
WalkingProblems
Obesity BreathingProblems
Fractures,Bone/Joint
Injury
38% 36%
28%
22% 22% 18% 18%
Shiawassee County Most Limiting Health Problems
2012 Adult Comparisons
Shiawassee County
2012
Michigan 2011
U.S. 2011
Limited in some way due to physical, emotional, or mental problems 24% 26% 24%
Back Pain Prevention The best things you can do to prevent back pain are:
Exercise often and keep your back muscles strong. Maintain a healthy weight or lose weight if you
weigh too much. Make sure you are getting enough calcium and
vitamin D every day. This is very important to keep bones strong.
Try to stand up straight and avoid heavy lifting when you can. If you do lift something heavy, bend your legs and keep your back straight.
Source: National Institutes of Health, National Institute of Arthritis and Musculoskeletal and Skin Diseases, http://www.niams.nih.gov/Health_Info/Back_Pain/back_pain_ff.asp, updated 9/09

Section 20 – Page 1
Social Context and Safety
Key Findings The health assessment identified that about 1 in 14 (7%) adults were abused in the past year. 12% of adults received assistance for food in the past year.
Safety ♦ About 1 in 14 (7%) adults were abused in the past
year. Of those who were abused, 55% were abused by their spouse or partner, 19% by a child, 19% by someone outside their home, 6% by another family member, 3% by a parent, and 13% were abused by someone else.
♦ Of those who were abused, they were abused in the following ways: emotionally (72%), verbally (71%), financially (16%), through electronic methods (13%), sexually (7%), and physically (3%).
Social Context ♦ In the past year, adults received assistance for the following: food (12%), healthcare (7%),
employment (6%), utilities (5%), prescription assistance (5%), free tax preparation (4%), rent/mortgage (3%), transportation (3%), home repair (3%), legal aid services (2%), clothing (2%), and emergency shelter (1%), credit counseling (1%).
♦ Shiawassee County adults experienced the following situations in the past year: death of a close friend or family member (36%), a close family member had to go in the hospital (35%), had bills they could not pay (18%), someone close to them had a problem with drinking or drugs (9%), someone in the household had their work hours reduced (9%), someone in the household lost their job (7%), moved to a new address (4%), had someone homeless living with them (4%), someone in the household went to jail (3%), became separated or divorced (2%), was homeless (1%), their child was hit or slapped by their spouse or partner (<1%), and was involved in a physical fight (<1%).
♦ Shiawassee County adults reported doing the following while driving: talking on hand-held cell phone (59%), eating (49%), talking on hands-free cell phone (17%), texting (11%), using internet on their cell phone (6%), checking facebook on their cell phone (5%), being under the influence of alcohol (3%), reading (3%), being under the influence of drugs (1%), and other activities (such as applying makeup, shaving, etc.) (3%).
♦ Adults indicated that they or someone in their household need more education about the following: tobacco use (9%), senior/elder care (7%), distracted driving (6%), disaster preparedness (6%), drug abuse (4%), bullying (3%), falls (2%), driving under the influence-DUI (1%), teenage pregnancy (1%), violence (1%), suicide prevention (1%), sexting (1%), speed (1%), seat belt/restraint usage (1%), bicycle safety (1%), homelessness (1%), and other issues (3%).
♦ Shiawassee County adults would use the following as their main method or way of getting information from authorities in a large-scale disaster or emergency: television (75%), radio (48%), cell phone (35%), internet (34%), neighbors (17%), land line phone (15%), print media (5%), 2-1-1 (2%), and other (2%).
Food Security in the United States
At some point in 2010, 14.5% of households were uncertain of having, or unable to acquire, enough food to meet the needs of all of their members because they had insufficient money or other resources for food (food insecure).
Approximately 9.1% (10.9 million) of U.S. households experienced low food security in 2010.
(Source: U.S. Department of Agriculture, Food Security in the United States: Statistics and Graphics, 2010)

Section 21 – Page 1
Mental Health and Suicide
Key Findings In 2012, 3% of Shiawassee County adults considered attempting suicide. 9% of adults felt so sad or hopeless nearly every day for two or more weeks that they stopped doing usual activities.
Adult Mental Health ♦ 3% of Shiawassee County adults considered
attempting suicide in the past year. ♦ 2% of adults made a plan about how they
would attempt suicide. ♦ Less than 1% of adults attempted suicide. ♦ 9% of adults felt so sad or hopeless nearly
every day for two or more weeks in a row that they stopped doing usual activities, increasing to 17% of those under the age of 30.
♦ 30% of adults indicated they were very satisfied with their life. 55% were satisfied, 10% were dissatisfied, and 2% were very dissatisfied.
♦ Shiawassee County adults got their social and emotional support from: family (81%), friends (70%), church (27%), neighbors (11%), a professional (5%), the community (5%), a self-help group (1%), and other places (6%).
♦ When feeling sad, blue, or depressed, Shiawassee County adults also had a period of two or more weeks when they experienced the following: felt fatigued/had no energy (26%), had trouble sleeping/slept too much (24%), woke up before they wanted (17%), had trouble thinking or concentrating (14%), lost interest in most things (14%), felt worthless or hopeless (12%), felt extremely restless or slowed down (12%), had a weight/appetite change (7%), thought about death or suicide (6%), and attempted suicide (<1%).
(Source: MDCH, Vital Statistics, Statewide Fatal Injuries, updated 6-7-12, and CDC, Fast Stats, Suicide, updated 1-27-12)
0
5
10
15
20
25
3026
13 12
Rat
e pe
r 100
,000
pop
ulat
ion
Age-Adjusted Suicide Mortality Rates for Shiawassee County Residents, Michigan, and U.S.
2010
Shiawassee 2010 Michigan 2010 U.S. 2009
Michigan Mental Illness
In 2010, approximately 30,000 people in Michigan were diagnosed with a serious mental illness.
Within the Michigan Department of Community Health (MDCH), the Behavioral Health and Developmental Disabilities Administration administers programs and services for adults with serious mental illness (SMI), children with severe emotional disturbance (SED), individuals with developmental disability and individuals with a substance use disorder.
Michigan’s public mental health system serves more than 200,000 consumers.
Those who are ineligible for SMI or SED can be approved for Medicaid Health Plans (MHPs) and Fee for Service Medicaid (FFS).
(Source: MDCH, Behavioral Health and Developmental Disabilities Administration, 2010-2011 Coordination of Care/Medical Services Utilization Focused Study Report, March 2012, http://www.michigan.gov/documents/mdch/MI2010-11_FocusedStudy_SMI-DD_Report_F1_382152_7.pdf)

Section 21 – Page 2
Mental Health and Suicide The following graphs show the Michigan and Shiawassee County age-adjusted suicide mortality rates per 100,000 population. The graph shows: ♦ The Shiawassee County age-adjusted suicide mortality rate was greater than the Michigan rate, from the
2005 to 2009, five year average.
(Source: MDCH, Vital Statistics)
0
5
10
15
20
2005-2009
12.4 11.3
Rat
e pe
r 100
,000
pop
ulat
ion
Shiawassee County and Michigan Age-Adjusted Suicide Mortality Rates
Shiawassee Michigan
Warning Signs for Suicide
More than 90 percent of people who kill themselves are suffering from one or more psychiatric disorders, in particular:
Major depression Bipolar depression Drug abuse and dependence Alcohol abuse and dependence Schizophrenia Post-Traumatic Stress Disorder (PTSD) Eating disorders Personality disorders
The core symptoms of major depression are a “down” or depressed mood most of the day or a loss of interest or pleasure in activities that were previously enjoyed for at least two weeks, as well as:
Changes in sleeping patterns Change in appetite or weight Intense anxiety, agitation, restlessness Fatigue or loss of energy Decreased concentration, indecisiveness or poorer memory Feelings of hopelessness, worthlessness, self-reproach or excessive or inappropriate guilt Recurrent thoughts of suicide
Prevention: Take it Seriously Fifty to 75% of all suicides give some warning of their intentions to a friend or family member. Recognize the Imminent Dangers:
Threatening to hurt or kill oneself Talking or writing about death, dying, or suicide Looking for ways to kill oneself (weapons, pills, or other means) Has made plans or preparations for a potentially serious attempt
(Source: American Foundation for Suicide Prevention, When You Fear Someone May Take Their Life, http://www.afsp.org/index.cfm?fuseaction=home.viewpage&page_id=F2F25092-7E90-9BD4-C4658F1D2B5D19A0)

Section 22 – Page 1
Oral Health
Key Findings The 2012 health assessment project has determined that almost two-thirds (65%) of Shiawassee County adults had visited a dentist or dental clinic in the past year. The 2010 BRFSS reported that 70% of U.S. adults and 73% of Michigan adults had visited a dentist or dental clinic in the previous twelve months.
Access to Dental Care ♦ In the past year, 65% of Shiawassee County adults had
visited a dentist or dental clinic, decreasing to 27% of adults with annual household incomes less than $25,000.
♦ When asked how long it had been since their last visit to a dentist or dental clinic, 10% of adults reported that it had been more than one year but less than two years, 14% reported that it had been more than two years but less than five years, and 8% responded it had been five or more years ago.
♦ When asked the main reason for not visiting a dentist in the last year, 16% said they had no reason to go, 15% said because they did not have insurance, 12% said because of cost, 9% said they had other priorities, 8% said fear, apprehension, nervousness, pain, and dislike going, 3% had not thought of it, 1% said they could not get into the office or clinic, and 1% said they do not have/know a dentist.
♦ 60% of adults indicated that none of their permanent teeth have been removed because of tooth decay or gum disease. 25% said 5 or fewer teeth had been removed, 8% said 6 or more, and 6% said all of their teeth had been removed because of tooth decay or gum disease. The 2010 BRFSS reported that 44% of U.S. adults and 41% of Michigan adults had one or more permanent teeth removed.
♦ 20% of those over the age of 65 had all of their permanent teeth removed. The 2010 BRFSS reported that 17% of U.S. adults and 13% of Michigan adults ages 65 and over had all of their permanent teeth removed.
♦ Shiawassee County parents gave the following reasons for not taking their child to the dentist in the past year: child was not old enough (8%), cost (7%), fear (2%), could not find a dentist to take their insurance (2%), and could not find a dentist to take Medicaid (1%). 81% of parents indicated they had taken their child to the dentist in the past year.
Totals may not equal 100% as respondents answered do not know.
*2010 BRFSS
Adult Oral Health Within
the Past Year
Within the Past 2 Years
Within the Past 5 Years
5 or More years Never
Time Since Last Visit to Dentist/Dental Clinic Males 60% 10% 18% 10% 0%
Females 71% 10% 10% 6% 0% Total 65% 10% 14% 8% 0%
2012 Adult Comparisons
Shiawassee County
2012
Michigan 2011
U.S. 2011
Adults who have visited the dentist in the past year 65% 73%* 70%* Adults who had one or more permanent teeth removed 39% 41%* 44%*
Adults 65 years and older who had all of their permanent teeth removed 20% 13%* 17%*
Shiawassee County Dental Care Resources - 2011
General Dentists- 30 Specialty Dentists- 2 Healthy Kids Dentists- 30 Number of dentists who treat Medicaid
patients- 0 Medicaid Dental Coverage – Healthy
Kids Dental Fee-for-Service, Adult (Source: Michigan Oral Health Coalition, 2011)

Section 22 – Page 2
Oral Health
The following graph provides information about the frequency of Shiawassee County adult dental visits. Examples of how to interpret the information on the first graph include: 65% of all Shiawassee County adults had been to the dentist in the past year, 57% of those under the age of 30 and 27% of those with incomes less than $25,000.
0%
20%
40%
60%
80%
100%
Total Males Females Under 30 30-59 Years 60 & Over Income<$25K
Income$25K Plus
65% 60%
71%
57% 65%
74%
27%
75%
Shiawassee County Adults Visiting a Dentist in the Past Year

Appendix i – Page 1
Shiawassee County Health Assessment Information Sources
Source Data Used Website American Cancer Society, Cancer Facts and Figures 2011 & 2012. Atlanta: ACS, 2011 & 2012
♦ 2011, 2012 Cancer facts, figures, and estimates
♦ ACS cancer detection guidelines ♦ Cancer risk factors ♦ Nutrition recommendations ♦ Screening recommendations ♦ Tobacco Use and Health
www.cancer.org
American Diabetes Association ♦ All about Diabetes: Type 2 Diabetes ♦ Diabetes Complications ♦ Diabetes Care: Screening Standards ♦ Risk factors for diabetes
www.diabetes.org
American Foundation for Suicide Prevention
♦ Warning Signs for Suicide ♦ Prevention: Take it Seriously
http://www.afsp.org/index.cfm?fuseaction=home.viewpage&page_id=F2F25092-7E90-9BD4-C4658F1D2B5D19A0
American Heart Association. Risk Factors for Coronary Heart Disease, 2011.
♦ Risk Factors for Cardiovascular Disease That Can Be Modified or Treated
www. americanheart.org
American Pregnancy Association ♦ Overview of birth control methods http://www.americanpregnancy.org/preventingpregnancy/overviewtypesbirthc
ontrol.html Annals of Emergency Medicine, v. 57, issue 6, 2011, p. 691
♦ Firearm Injury Prevention http://journals.ohiolink.edu/ejc/pdf.cgi/EJC_Article.pdf?issn=01960644&issue=v57i0006&articl
e=691_fip Arthritis at a Glance, 2011, Centers for Disease Control & Prevention, Morbidity and Mortality Weekly Report 2010; 59(39):999-1003
♦ What Can Be Done to Target Arthritis? ♦ Arthritis statistics
http://www.cdc.gov/chronicdisease/resources/publications/AAG/arthritis.h
tm Asthma Institute of Michigan, MDCH & The American Lung Association of Michigan, 2010
♦ Asthma in Michigan 2010 http://www.michigan.gov/documents/mdch/AsthmaInitiativeofMichigan_Stra
tegic_Plan6-06_269864_7.pdf
Behavioral Risk Factor Surveillance System (BRFSS), National Center for Chronic Disease Prevention and Health Promotion, Behavioral Surveillance Branch, CDC
♦ 2009 - 2010 adult Michigan and U.S. correlating statistics
www.cdc.gov
Center for Medicare and Medicaid Services ♦ Michigan residents enrolled in Medicaid http://www.cms.gov/
CDC, Alcohol and Public Health ♦ Caffeinated Alcoholic Beverages http://www.cdc.gov/alcohol/fact-sheets/cab.htm
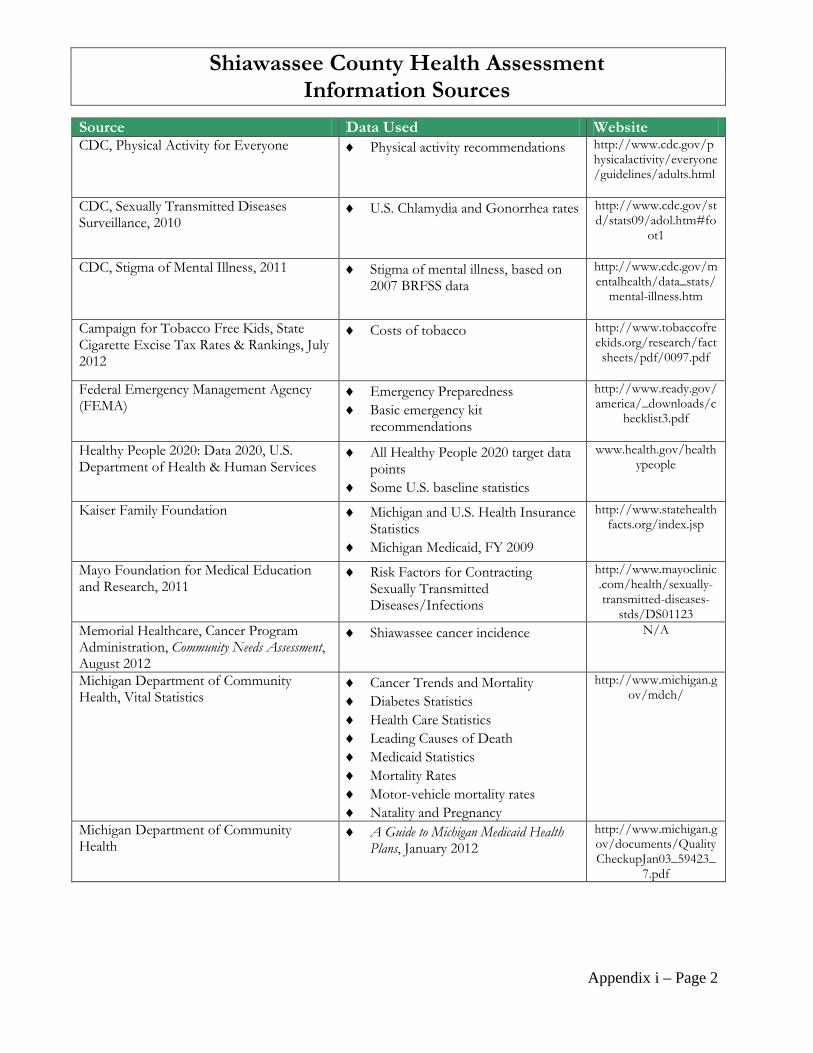
Appendix i – Page 2
Shiawassee County Health Assessment Information Sources
Source Data Used Website CDC, Physical Activity for Everyone ♦ Physical activity recommendations http://www.cdc.gov/p
hysicalactivity/everyone/guidelines/adults.html
CDC, Sexually Transmitted Diseases Surveillance, 2010
♦ U.S. Chlamydia and Gonorrhea rates http://www.cdc.gov/std/stats09/adol.htm#fo
ot1
CDC, Stigma of Mental Illness, 2011 ♦ Stigma of mental illness, based on 2007 BRFSS data
http://www.cdc.gov/mentalhealth/data_stats/
mental-illness.htm
Campaign for Tobacco Free Kids, State Cigarette Excise Tax Rates & Rankings, July 2012
♦ Costs of tobacco http://www.tobaccofreekids.org/research/factsheets/pdf/0097.pdf
Federal Emergency Management Agency (FEMA)
♦ Emergency Preparedness ♦ Basic emergency kit
recommendations
http://www.ready.gov/america/_downloads/c
hecklist3.pdf
Healthy People 2020: Data 2020, U.S. Department of Health & Human Services
♦ All Healthy People 2020 target data points
♦ Some U.S. baseline statistics
www.health.gov/healthypeople
Kaiser Family Foundation ♦ Michigan and U.S. Health Insurance Statistics
♦ Michigan Medicaid, FY 2009
http://www.statehealthfacts.org/index.jsp
Mayo Foundation for Medical Education and Research, 2011
♦ Risk Factors for Contracting Sexually Transmitted Diseases/Infections
http://www.mayoclinic.com/health/sexually-transmitted-diseases-
stds/DS01123 Memorial Healthcare, Cancer Program Administration, Community Needs Assessment, August 2012
♦ Shiawassee cancer incidence N/A
Michigan Department of Community Health, Vital Statistics
♦ Cancer Trends and Mortality ♦ Diabetes Statistics ♦ Health Care Statistics ♦ Leading Causes of Death ♦ Medicaid Statistics ♦ Mortality Rates ♦ Motor-vehicle mortality rates ♦ Natality and Pregnancy
http://www.michigan.gov/mdch/
Michigan Department of Community Health
♦ A Guide to Michigan Medicaid Health Plans, January 2012
http://www.michigan.gov/documents/QualityCheckupJan03_59423_
7.pdf
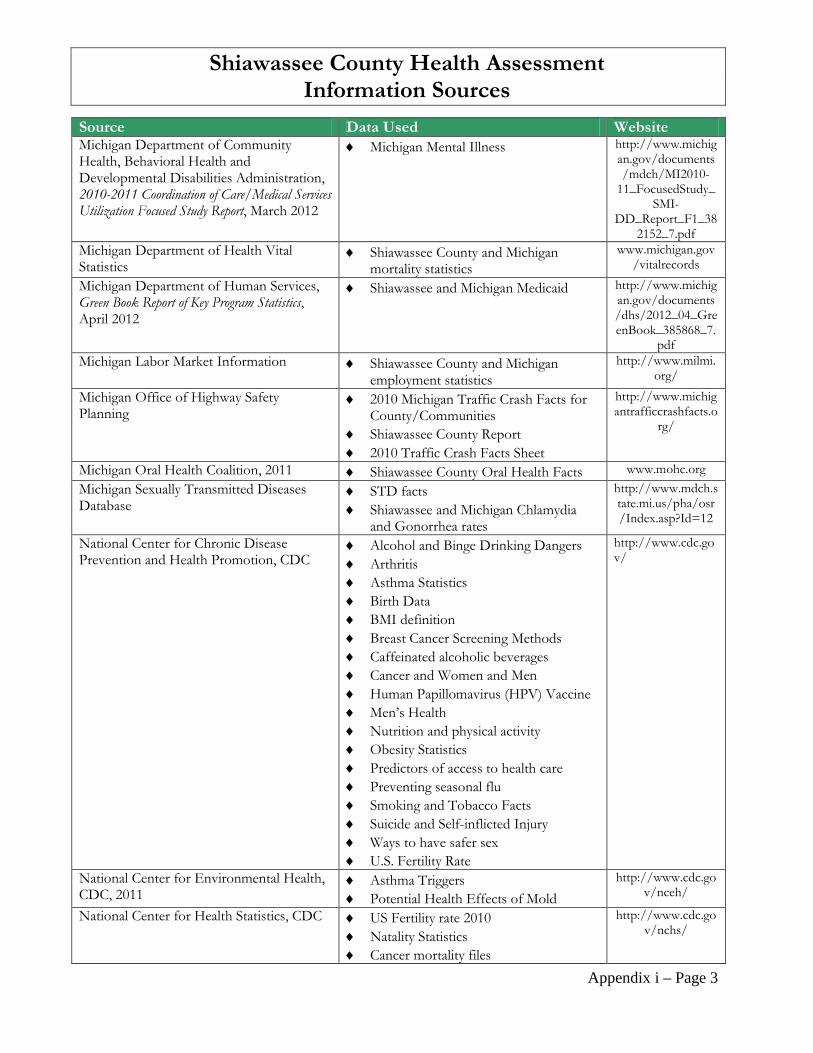
Appendix i – Page 3
Shiawassee County Health Assessment Information Sources
Source Data Used Website Michigan Department of Community Health, Behavioral Health and Developmental Disabilities Administration, 2010-2011 Coordination of Care/Medical Services Utilization Focused Study Report, March 2012
♦ Michigan Mental Illness http://www.michigan.gov/documents/mdch/MI2010-
11_FocusedStudy_SMI-
DD_Report_F1_382152_7.pdf
Michigan Department of Health Vital Statistics
♦ Shiawassee County and Michigan mortality statistics
www.michigan.gov/vitalrecords
Michigan Department of Human Services, Green Book Report of Key Program Statistics, April 2012
♦ Shiawassee and Michigan Medicaid http://www.michigan.gov/documents/dhs/2012_04_GreenBook_385868_7.
pdf Michigan Labor Market Information ♦ Shiawassee County and Michigan
employment statistics http://www.milmi.
org/
Michigan Office of Highway Safety Planning
♦ 2010 Michigan Traffic Crash Facts for County/Communities
♦ Shiawassee County Report ♦ 2010 Traffic Crash Facts Sheet
http://www.michigantrafficcrashfacts.o
rg/
Michigan Oral Health Coalition, 2011 ♦ Shiawassee County Oral Health Facts www.mohc.org Michigan Sexually Transmitted Diseases Database
♦ STD facts ♦ Shiawassee and Michigan Chlamydia
and Gonorrhea rates
http://www.mdch.state.mi.us/pha/osr/Index.asp?Id=12
National Center for Chronic Disease Prevention and Health Promotion, CDC
♦ Alcohol and Binge Drinking Dangers ♦ Arthritis ♦ Asthma Statistics ♦ Birth Data ♦ BMI definition ♦ Breast Cancer Screening Methods ♦ Caffeinated alcoholic beverages ♦ Cancer and Women and Men ♦ Human Papillomavirus (HPV) Vaccine ♦ Men’s Health ♦ Nutrition and physical activity ♦ Obesity Statistics ♦ Predictors of access to health care ♦ Preventing seasonal flu ♦ Smoking and Tobacco Facts ♦ Suicide and Self-inflicted Injury ♦ Ways to have safer sex ♦ U.S. Fertility Rate
http://www.cdc.gov/
National Center for Environmental Health, CDC, 2011
♦ Asthma Triggers ♦ Potential Health Effects of Mold
http://www.cdc.gov/nceh/
National Center for Health Statistics, CDC ♦ US Fertility rate 2010 ♦ Natality Statistics ♦ Cancer mortality files
http://www.cdc.gov/nchs/
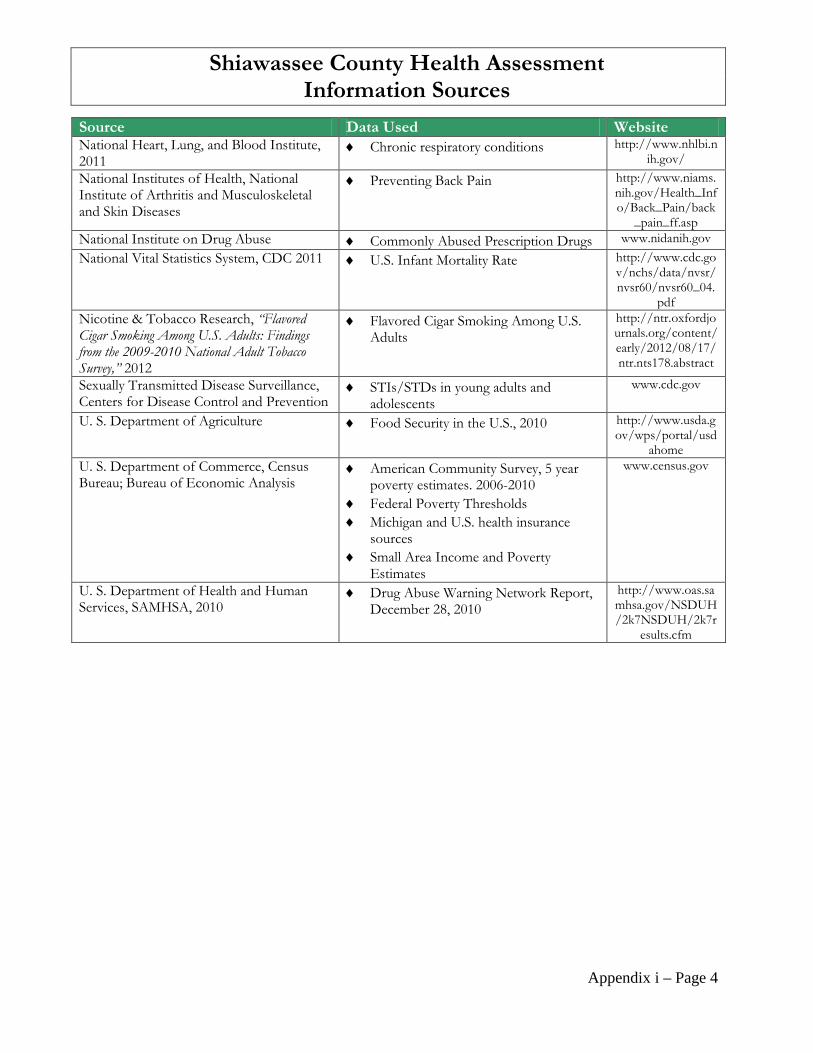
Appendix i – Page 4
Shiawassee County Health Assessment Information Sources
Source Data Used Website National Heart, Lung, and Blood Institute, 2011
♦ Chronic respiratory conditions http://www.nhlbi.nih.gov/
National Institutes of Health, National Institute of Arthritis and Musculoskeletal and Skin Diseases
♦ Preventing Back Pain http://www.niams.nih.gov/Health_Info/Back_Pain/back
_pain_ff.asp National Institute on Drug Abuse ♦ Commonly Abused Prescription Drugs www.nidanih.gov National Vital Statistics System, CDC 2011 ♦ U.S. Infant Mortality Rate http://www.cdc.go
v/nchs/data/nvsr/nvsr60/nvsr60_04.
pdf Nicotine & Tobacco Research, “Flavored Cigar Smoking Among U.S. Adults: Findings from the 2009-2010 National Adult Tobacco Survey,” 2012
♦ Flavored Cigar Smoking Among U.S. Adults
http://ntr.oxfordjournals.org/content/early/2012/08/17/ntr.nts178.abstract
Sexually Transmitted Disease Surveillance, Centers for Disease Control and Prevention
♦ STIs/STDs in young adults and adolescents
www.cdc.gov
U. S. Department of Agriculture ♦ Food Security in the U.S., 2010 http://www.usda.gov/wps/portal/usd
ahome U. S. Department of Commerce, Census Bureau; Bureau of Economic Analysis
♦ American Community Survey, 5 year poverty estimates. 2006-2010
♦ Federal Poverty Thresholds ♦ Michigan and U.S. health insurance
sources ♦ Small Area Income and Poverty
Estimates
www.census.gov
U. S. Department of Health and Human Services, SAMHSA, 2010
♦ Drug Abuse Warning Network Report, December 28, 2010
http://www.oas.samhsa.gov/NSDUH/2k7NSDUH/2k7r
esults.cfm

Appendix ii – Page 1
List of Acronyms and Terms Adult Defined as 19 years of age and older. Age-Adjusted Death rate per 100,000 adjusted for the age Mortality Rates distribution of the population. Binge drinking Consumption of five alcoholic beverages or more
(for males) or four or more drinks (for females) on one occasion
BMI Body Mass Index is defined as the contrasting measurement/relationship of weight to height
BRFSS Behavior Risk Factor Surveillance System, an adult survey conducted by the CDC.
CDC Centers for Disease Control and Prevention. Current Smoker Individual who has smoked at least 100 cigarettes in
their lifetime and now smokes daily or on some days. Crude Mortality Rates Number of deaths/estimated mid-year population
times 100,000. FPL Federal Poverty Level HCF Healthy Communities Foundation of the Hospital
Council of Northwest Ohio. HP 2020 Healthy People 2020, a comprehensive set of health
objectives published by the Office of Disease Prevention and Health Promotion, U.S. Department of Health and Human Services.
Health Indicator A measure of the health of people in a community, such as cancer mortality rates, rates of obesity, or incidence of cigarette smoking.
High Blood 240 mg/dL and above Cholesterol High Blood Pressure Systolic >140 and Diastolic > 90 MDCH Michigan Department of Community Health N/A Data not available.

Appendix ii – Page 2
List of Acronyms and Terms Race/Ethnicity Census 2010: U.S. Census data consider race and
Hispanic origin separately. Census 2010 adhered to the standards of the Office of Management and Budget (OMB), which define Hispanic or Latino as “a person of Cuban, Mexican, Puerto Rican, South or Central American, or other Spanish culture or origin regardless of race.” Data are presented as “Hispanic or Latino” and “Not Hispanic or Latino.” Census 2000 reported five race categories including: White, Black or African American, American Indian & Alaska Native, Asian, Native Hawaiian and Other Pacific Islander. Data reported, “White alone” or “Black alone”, means the respondents reported only one race.
Weapon Defined in the YRBSS as “a weapon such as a gun, knife, or club”
Youth Defined as 12 through 18 years of age YPLL/65 Years of Potential Life Lost before age 65.
Indicator of premature death.

Appendix iii - Page 1
Methods for Weighting the 2012 Shiawassee County Assessment Data
Data from sample surveys have the potential for bias if there are different rates of response for
different segments of the population. In other words, some subgroups of the population may be more represented in the completed surveys than they are in the population from which those surveys are sampled. If a sample has 25% of its respondents being male and 75% being female, then the sample is biased towards the views of females (if females respond differently than males). This same phenomenon holds true for any possible characteristic that may alter how an individual responds to the survey items.
In some cases, the procedures of the survey methods may purposefully over-sample a segment of
the population in order to gain an appropriate number of responses from that subgroup for appropriate data analysis when investigating them separately (this is often done for minority groups). Whether the over-sampling is done inadvertently or purposefully, the data needs to be weighted so that the proportioned characteristics of the sample accurately reflect the proportioned characteristics of the population. In the 2012 Shiawassee County survey, a weighting was applied prior to the analysis that weighted the survey respondents to reflect the actual distribution of Shiawassee County based on age, sex, race, and income.
Weightings were created for each category within sex (male, female), race (White, Non-White), Age (7 different age categories), and income (7 different income categories). The numerical value of the weight for each category was calculated by taking the percent of Shiawassee County within the specific category and dividing that by the percent of the sample within that same specific category. Using sex as an example, the following represents the data from the 2012 Shiawassee County Survey and 2010 Shiawassee County Census.
2012 Shiawassee
Survey 2010 Shiawassee
Census Weight
Sex Number Percent Number Percent Male 182 45.049505 34,921 49.4295663 1.097228 Female 222 54.950495 35,727 50.5704337 0.920291
In this example, it shows that there was a slightly smaller portion of males in the sample compared
to the actual portion in Shiawassee County. The weighting for males was calculated by taking the percent of males in Shiawassee County (based on Census information) (49.4295663%) and dividing that by the percent found in the 2012 Shiawassee County sample (45.049505%) [49.4295663 /45.049505 = weighting of 1.097228 for males]. The same was done for females [50.5704337 /54.950495 = weighting of 0.920291 for females]. Thus males’ responses are weighted heavier by a factor of 1.097228 and females’ responses weighted less by a factor of 0.920291.
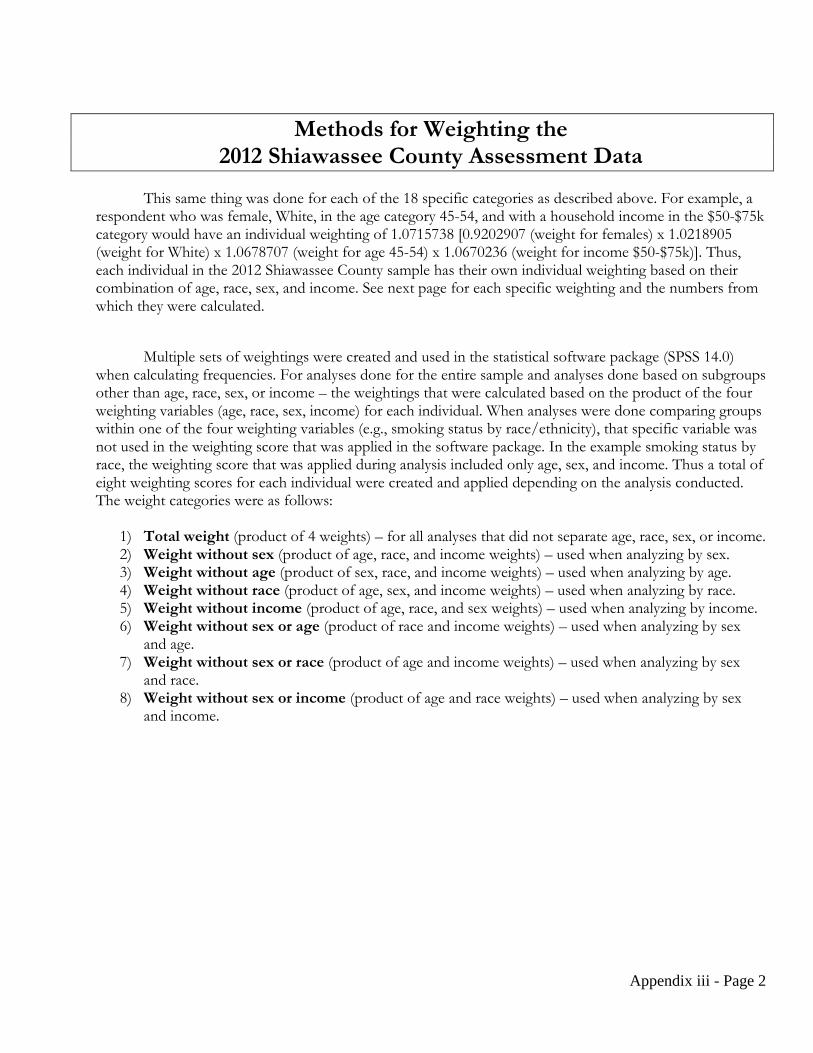
Appendix iii - Page 2
Methods for Weighting the 2012 Shiawassee County Assessment Data
This same thing was done for each of the 18 specific categories as described above. For example, a
respondent who was female, White, in the age category 45-54, and with a household income in the $50-$75k category would have an individual weighting of 1.0715738 [0.9202907 (weight for females) x 1.0218905 (weight for White) x 1.0678707 (weight for age 45-54) x 1.0670236 (weight for income $50-$75k)]. Thus, each individual in the 2012 Shiawassee County sample has their own individual weighting based on their combination of age, race, sex, and income. See next page for each specific weighting and the numbers from which they were calculated.
Multiple sets of weightings were created and used in the statistical software package (SPSS 14.0)
when calculating frequencies. For analyses done for the entire sample and analyses done based on subgroups other than age, race, sex, or income – the weightings that were calculated based on the product of the four weighting variables (age, race, sex, income) for each individual. When analyses were done comparing groups within one of the four weighting variables (e.g., smoking status by race/ethnicity), that specific variable was not used in the weighting score that was applied in the software package. In the example smoking status by race, the weighting score that was applied during analysis included only age, sex, and income. Thus a total of eight weighting scores for each individual were created and applied depending on the analysis conducted. The weight categories were as follows:
1) Total weight (product of 4 weights) – for all analyses that did not separate age, race, sex, or income. 2) Weight without sex (product of age, race, and income weights) – used when analyzing by sex. 3) Weight without age (product of sex, race, and income weights) – used when analyzing by age. 4) Weight without race (product of age, sex, and income weights) – used when analyzing by race. 5) Weight without income (product of age, race, and sex weights) – used when analyzing by income. 6) Weight without sex or age (product of race and income weights) – used when analyzing by sex
and age. 7) Weight without sex or race (product of age and income weights) – used when analyzing by sex
and race. 8) Weight without sex or income (product of age and race weights) – used when analyzing by sex
and income.

Appendix iii - Page 3
Methods for Weighting the 2012 Shiawassee County Assessment Data
Category Shiawassee
Sample % 2010
Census * % Weighting
Value
Sex:
Male 182 45.049505 34,921 49.429566 1.09722774 Female 222 54.950495 35,727 50.570433 0.92029078
Age: 20-24 99 23.515439 3,823 7.438901 0.31634114 25-34 19 4.513064 7,656 14.897260 3.30091925 35-44 45 10.688836 9,222 17.944427 1.67880085 45-54 87 20.665083 11,341 22.067637 1.06787071 55-59 50 11.876485 5,007 9.742761 0.82034052 60-64 34 8.076010 4,238 8.246419 1.02110079 65-74 43 10.213777 5,588 10.873287 1.06457072 75-84 25 5.938242 3,155 6.139087 1.03382238
85+ 19 4.513064 1,362 2.650217 0.58723250
Race: White 380 93.137255 67,240 95.176084 1.02189059 Other 28 6.862745 3,408 4.823915 0.70291344
Household
Income Less than
$10,000 41 11.081081 1,874 6.780274 0.61187841 $10k-$15k 17 4.594595 1,828 6.613842 1.43948342 $15k-$25k 46 12.432432 3,172 11.476536 0.92311274 $25k-$35k 41 11.081081 3,383 12.239950 1.10458093 $35k-$50 67 18.108108 4,606 16.664857 0.92029811
$50k-$75k 75 20.270270 5,978 21.628857 1.06702365 $75k or more 83 22.432432 6,798 24.595680 1.09643393
Note: The weighting ratios are calculated by taking the ratio of the proportion of the population of Shiawassee County in each subcategory by the proportion of the sample in the Shiawassee County survey for that same category. * Shiawassee County population figures taken from the 2010 Shiawassee County Census.

Appendix iv – Page 1
Shiawassee County Sample Demographic Profile*
Variable 2012 Survey
Sample
Shiawassee County Census
2010
Michigan Census 2010
Age 20-29 12.6%
10.6%
12.7% 30-39 14.8% 11.6% 12.0% 40-49 20.2% 15.2% 14.3% 50-59 22.5% 15.0% 14.7% 60 plus 25.7% 20.3% 19.5% Race/ Ethnicity White 94.3%
96.7%
78.9% Black or African American 0.6% 0.5% 14.2% American Indian and Alaska Native 2.3% 0.5% 0.6% Asian 0.2% 0.4% 2.4% Other 1.5% 0.5% 1.5% Hispanic Origin (may be of any race) 0.6% 2.4% 4.4% Marital Status† Married Couple 69.0%
53.6%
48.9% Never been married/member of an unmarried couple 14.3%
25.1% 31.9%
Divorced/Separated 9.5% 13.4% 13.0% Widowed 3.9% 7.8% 1.5% Education† Less than High School Diploma 3.9%
7.8%
7.8% High School Diploma 23.9% 42.3% 30.9% Some college/ College graduate 69.7% 49.8% 57.8% Income (Families) $14,999 and less 7.9%
8.1% 14.6% $15,000 to $24,999 9.9% 6.2% 12.9% $25,000 to $49,999 25.2% 32.2% 26.8% $50,000 to $74,999 20.8% 24.0% 18.9% $75,000 or more 25.1% 29.4% 26.8%
* The percents reported are the actual percent within each category who responded to the survey. The data contained within the report however are based on weighted data (weighted by age, race, sex, and income). Percents may not add to 100% due to missing data (non-responses).
† The Michigan and Shiawassee County Census percentages are slightly different than the percent who responded to the survey.
Marital status is calculated for those individuals 15 years and older. Education is calculated for those 25 years and older.

Appendix v - Page 1
Demographics
Shiawassee County Population by Age Groups and Gender U.S. Census 2010
Category Total Males Females
Shiawassee County 70,648 34,921 35,727 0-4 years 3,987 2,054 1,933 1-4 years 3,218 1,671 1,547 < 1 year 769 383 386 1-2 years 1,561 803 758 3-4 years 1,657 868 789 5-9 years 4,612 2,349 2,263 5-6 years 1,747 902 845 7-9 years 2,865 1,447 1,418
10-14 years 5,181 2,712 2,469 10-12 years 3,044 1,570 1,474 13-14 years 2,137 1,142 995 12-18 years 7,615 4,030 3,585 15-19 years 5,476 2,892 2,584 15-17 years 3,279 1,748 1,531 18-19 years 2,197 1,144 1,053 20-24 years 3,823 1,929 1,894 25-29 years 3,661 1,843 1,818 30-34 years 3,995 1,981 2,014 35-39 years 4,235 2,124 2,111 40-44 years 4,987 2,446 2,541 45-49 years 5,728 2,854 2,874 50-54 years 5,613 2,789 2,842 55-59 years 5,007 2,428 2,579 60-64 years 4,238 2,095 2,143 65-69 years 3,224 1,530 1,694 70-74 years 2,364 1,140 1,224 75-79 years 1,811 791 1,020 80-84 years 1,344 546 798 85-89 years 872 292 580 90-94 years 379 108 271 95-99 years 99 15 84
100-104 years 8 0 8 105-109 years 4 3 1
110 years & over 0 0 0 Total 85 years and over 1,362 418 944 Total 65 years and over 10,105 4,425 5,680 Total 19 years and over 52,441 25,459 26,982

Appendix v – Page 2
Shiawassee County Profile
General Demographic Characteristics (Source: U.S. Census Bureau 2010)
Total Population 2010 Total Population 70,648 2000 Total Population 71,687 Largest City-Owosso 2010 Total Population 15,194 100% 2000 Total Population 15,713 100% Population By Race/Ethnicity Total Population 70,648 100% White Alone 68,315 96.7% Hispanic or Latino (of any race) 1,695 2.4% Two or more races 1,026 1.5% Asian 256 0.4% African American 325 0.5% Other 349 0.5% American Indian and Alaska Native 350 0.5% Population By Age Under 5 years 3,987 5.6% 5 to 17 years 13,072 18.5% 18 to 24 years 6,020 8.5% 25 to 44 years 16,878 23.9% 45 to 64 years 20,586 29.1% 65 years and more 10,105 14.3% Median age (years) 40.3 Household By Type Total Households 27,481 100%
Family Households (families) 19,397 70.6% With own children <18 years 8,170 29.7%
Married-Couple Family Households 14,779 53.8% With own children <18 years 5,491 20.0%
Female Householder, No Husband Present 3,189 11.6% With own children <18 years 1,871 6.8%
Non-family Households 8,084 29.4% Householder living alone 6,648 24.2%
Householder 65 years and > 2,725 9.9% Households With Individuals < 18 years 9,100 33.1% Households With Individuals 65 years and > 7,196 26.2% Average Household Size 2.54 people Average Family Size 3.99 people

Appendix v – Page 3
Shiawassee County Profile
General Demographic Characteristics, Continued (Source: U.S. Census Bureau, American Community Survey 2010 - 1 Year Estimates)
Median Value of Owner-Occupied Units $114,700 Median Monthly Owner Costs (With Mortgage) $1,204 Median Monthly Owner Costs (Not Mortgaged) $415 Median Gross Rent for Renter-Occupied Units $678 Median Rooms Per Housing Unit 5.9
Selected Social Characteristics (Source: U.S. Census Bureau, American Community Survey 2010 - 1 Year Estimates)
School Enrollment Population 3 Years and Over Enrolled In School 18,174 100% Nursery & Preschool 1,272 7.0% Kindergarten 1,051 5.8% Elementary School (Grades 1-8) 7,705 42.4% High School (Grades 9-12) 4,414 24.3% College or Graduate School 3,732 20.5% Educational Attainment Population 25 Years and Over 47,380 100% < 9th Grade Education 963 2.0% 9th to 12th Grade, No Diploma 2,762 5.8% High School Graduate (Includes Equivalency) 20,037 42.3% Some College, No Degree 12,293 25.9% Associate Degree 4,830 10.2% Bachelor’s Degree 3,504 7.4% Graduate Or Professional Degree 2,991 6.3% Percent High School Graduate or Higher 92.1% Percent Bachelor’s Degree or Higher 13.7%

Appendix v – Page 4
Shiawassee County Profile
Selected Social Characteristics, Continued (Source: U.S. Census Bureau, American Community Survey 2010 - 1 Year Estimates)
Marital Status Population 15 Years and Over 56,471 100% Never Married 14,161 25.1% Now Married, Excluding Separated 30,287 53.6% Separated 1,104 1.9% Widowed 4,442 7.8%
Female 3,488 6.2% Divorced 6,477 11.5%
Female 3,214 5.7% Veteran Status
Civilian Veterans 6,123 11.5% Disability Status of the Civilian Non-institutionalized Population Total Civilian Noninstitutionalized Population 70,209 100%
With a Disability 9,649 13.7% Under 18 years 17,354 100%
With a Disability 1,033 6.0% 18 to 64 years 43,191 100%
With a Disability 4,727 10.9% 65 Years and Over 9,664 100% With a Disability 3,889 40.2%
Selected Economic Characteristics (Source: U.S. Census Bureau, American Community Survey 2010 - 1 Year Estimates)
Employment Status Population 16 Years and Over 55,522 100%
In Labor Force 35,041 63.1% Not In Labor Force 20,481 36.9%
Females 16 Years and Over 28,496 100% In Labor Force 16,162 56.7%
Population Living With Own Children <6 Years 5,161 100% All Parents In Family In Labor Force 3,402 65.9%
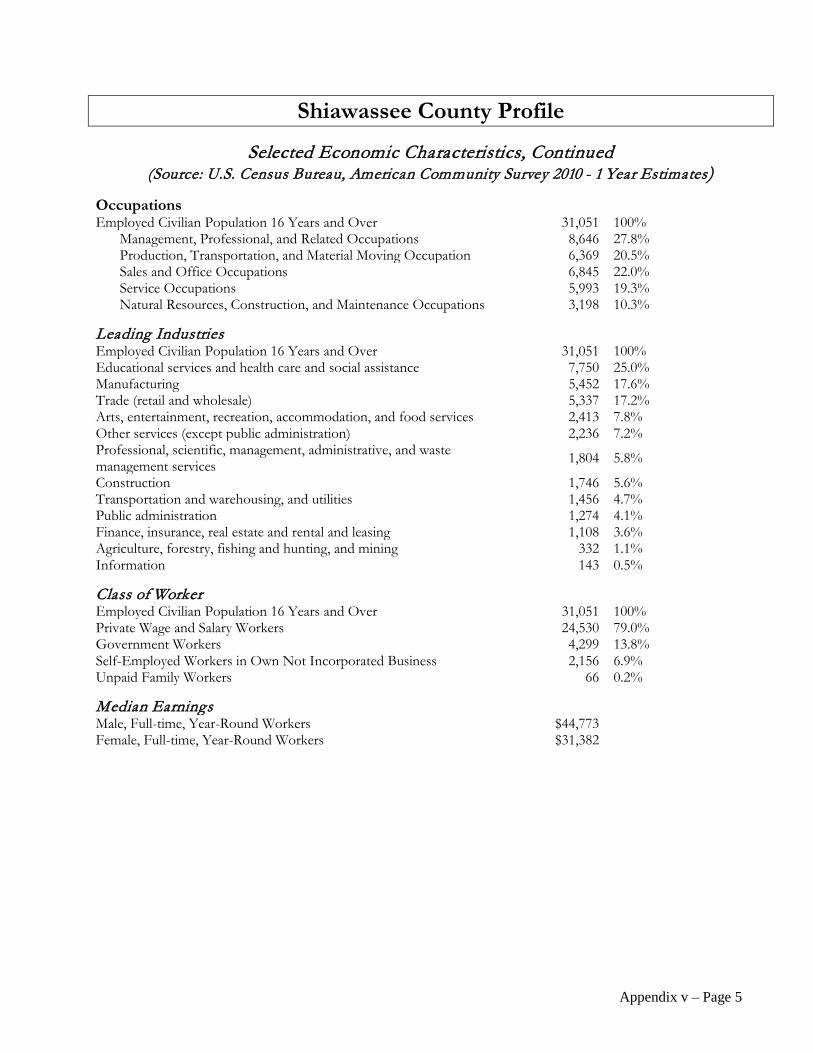
Appendix v – Page 5
Shiawassee County Profile
Selected Economic Characteristics, Continued (Source: U.S. Census Bureau, American Community Survey 2010 - 1 Year Estimates)
Occupations Employed Civilian Population 16 Years and Over 31,051 100%
Management, Professional, and Related Occupations 8,646 27.8% Production, Transportation, and Material Moving Occupation 6,369 20.5% Sales and Office Occupations 6,845 22.0% Service Occupations 5,993 19.3% Natural Resources, Construction, and Maintenance Occupations 3,198 10.3%
Leading Industries Employed Civilian Population 16 Years and Over 31,051 100% Educational services and health care and social assistance 7,750 25.0% Manufacturing 5,452 17.6% Trade (retail and wholesale) 5,337 17.2% Arts, entertainment, recreation, accommodation, and food services 2,413 7.8% Other services (except public administration) 2,236 7.2% Professional, scientific, management, administrative, and waste management services 1,804 5.8%
Construction 1,746 5.6% Transportation and warehousing, and utilities 1,456 4.7% Public administration 1,274 4.1% Finance, insurance, real estate and rental and leasing 1,108 3.6% Agriculture, forestry, fishing and hunting, and mining 332 1.1% Information 143 0.5% Class of Worker Employed Civilian Population 16 Years and Over 31,051 100% Private Wage and Salary Workers 24,530 79.0% Government Workers 4,299 13.8% Self-Employed Workers in Own Not Incorporated Business 2,156 6.9% Unpaid Family Workers 66 0.2% Median Earnings Male, Full-time, Year-Round Workers $44,773 Female, Full-time, Year-Round Workers $31,382

Appendix v – Page 6
Shiawassee County Profile
Selected Economic Characteristics, Continued (Source: U.S. Census Bureau, American Community Survey 2010 - 1 Year Estimates)
Income In 2010 (Inflation-Adjusted Dollars) Households 27,134 100% < $10,000 1,436 5.3% $10,000 to $14,999 1,875 6.9% $15,000 to $24,999 3,325 12.3% $25,000 to $34,999 3,216 11.9% $35,000 to $49,999 4,680 17.2% $50,000 to $74,999 6,004 22.1% $75,000 to $99,999 3,305 12.2% $100,000 to $149,999 2,749 10.1% $150,000 or $199,999 420 1.5% $200,000 or more 124 0.5% Median Household Income $46,528 Income In 2010 (Inflation-Adjusted Dollars) Families 18,801 100% < $10,000 765 4.1% $10,000 to $14,999 758 4.0 $15,000 to $24,999 1,175 6.2% $25,000 to $34,999 2,206 11.7% $35,000 to $49,999 3,851 20.5% $50,000 to $74,999 4,516 24.0% $75,000 to $99,999 2,620 13.9% $100,000 to $149,999 2,419 12.9% $150,000 or $199,999 380 2.0% $200,000 or more 111 0.6% Median Household Income $52,614 Per Capita Income In 2010 $21,103 Poverty Status in 2010 % Below
Poverty Level
Families 10.6% Individuals 15.4%

Appendix v – Page 7
Shiawassee County Profile
(Source: U.S. Bureau of Economic Analysis)
Bureau of Economic Analysis (BEA) Per Capita Personal Income Figures Income Rank of Michigan
counties BEA Per Capita Personal Income 2010 $27,954 58th of 83 counties BEA Per Capita Personal Income 2009 $26,820 57th of 83 counties BEA Per Capita Personal Income 2008 $27,147 58th of 83 counties BEA Per Capita Personal Income 2007 $26,088 51st of 83 counties BEA Per Capita Personal Income 2000 $23,025 41st of 83 counties BEA Per Capita Personal Income 1999 $22,195 42nd of 83 counties (BEA PCPI figures are greater than Census figures for comparable years due to deductions for retirement, Medicaid, Medicare payments, and the value of food stamps, among other things)
Employment Statistics Category Shiawassee Michigan
Labor Force 33,140 4,632,000
Employed 29,812 4,215,000
Unemployed 3,328 417,000
Unemployment Rate* in April 2012 8.6 8.0
Unemployment Rate* in March 2012 10.0 9.0
Unemployment Rate* in April 2011 10.4 10.1 *Rate equals unemployment divided by labor force. (Source: Michigan Labor Market Information, April 2012)

Appendix v – Page 8
Shiawassee County Profile
Estimated Poverty Status in 2010 Age Groups Number 90% Confidence Interval Percent 90% Confidence
Interval Shiawassee County All ages in poverty 10,394 8,759 to 12,029 15.0% 12.6 to 17.4 Ages 0-17 in poverty 3,596 2,900 to 4,292 21.6% 17.4 to 25.8 Ages 5-17 in families in poverty 2,328 1,856 to 2,800 18.4% 14.7 to 22.1
Median household income $45,444 42,618 to 48,270 Michigan All ages in poverty 1,614,110 1,591,644 to 1,636,576 16.7% 16.5 to 16.9 Ages 0-17 in poverty 537,003 524,201 to 549,805 23.4% 22.8 to 24.0 Ages 5-17 in families in poverty 360,763 349,617 to 371,909 21.1% 20.5 to 21.9
Median household income $ 45,354 45,052 to 45,656 United States All ages in poverty 46,215,956 45,975,650 to 46,456,262 15.3% 15.2 to 15.4 Ages 0-17 in poverty 15,749,129 15,621,395 to 15,876,863 21.6% 21.4 to 21.8 Ages 5-17 in families in poverty 10,484,513 10,394,015 to 10,575,011 19.8% 19.6 to 20.0
Median household income $ 50,046 49,982 to 50,110 (Source: U.S. Census Bureau, Small Area Income and Poverty Estimates, http://www.census.gov/hhes/www/saipe/county.html)
Federal Poverty Thresholds in 2011 by Size of Family and Number of Related Children Under 18 Years of Age
Size of Family Unit No Children
One Child
Two Children
Three Children
Four Children
Five Children
1 Person <65 years $11,702
1 Person 65 and > $10,788
2 people Householder < 65 years $15,063 $15,504
2 People Householder 65 and > $13,596 $15,446
3 People $17,595 $18,106 $18,123
4 People $23,201 $23,581 $22,811 $22,891
5 People $27,979 $28,386 $27,517 $26,844 $26,434
6 People $32,181 $32,309 $31,643 $31,005 $30,056 $29,494 7 People $37,029 $37,260 $36,463 $35,907 $34,872 $33,665 8 People $41,414 $41,779 $41,027 $40,368 $39,433 $38,247 9 People or > $49,818 $50,059 $49,393 $48,835 $47,917 $46,654 (Source: U. S. Census Bureau, Poverty Thresholds 2011, http://www.census.gov/hhes/www/poverty/data/threshld/index.html)