subsidiaries - ferreycorp.com.pe
24
1 Management Report and Discussion of the consolidated financial statements of Ferreycorp S.A.A. and subsidiaries Second Quarter 2013 Lima, July 25th, 2013. – Ferreycorp S.A.A. and its subsidiaries (BVL: FERREYC1), a leading Corporation in the capital goods and services sector, with presence in Peru, Guatemala, El Salvador, Nicaragua and Belize, announces consolidated results for the second quarter 2013 as of June 30, 2013. Consolidated Financial results have been prepared in accordance with International Financial Reporting Standards (IFRS) and are stated in Nuevos Soles. MAIN HIGHLIGHTS Consolidated sales of Ferreycorp S.A.A and its subsidiaries in Peru, Guatemala, El Salvador, Nicaragua and Belize reached record sales of US$ 1,049 million during the first six-month period of 2013, which represents an important growth of 33% compared to the same period of 2012 (US$ 791 million), as a result of higher sales of new and used Caterpillar equipment, the rental business, the supply of spare parts and services and the contribution of new businesses incorporated to the Corporation. It is important to point out that during the second quarter of 2013, sales reached a record of US$ 563 million, 36% higher compared to the same period of the previous year (US$ 414 million). For more information please visit www.ferreycorp.com.pe or contact: Patricia Gastelumendi L. CFO Telf: (511) 626-4257 [email protected] Elizabeth Tamayo M. IR Tel: (511) 626-5112 [email protected]
Transcript of subsidiaries - ferreycorp.com.pe
1
Management Report and Discussion of the consolidated financial statements of Ferreycorp S.A.A. and subsidiaries
Second Quarter 2013
Lima, July 25th, 2013. – Ferreycorp S.A.A. and its
subsidiaries (BVL: FERREYC1), a leading Corporation in the
capital goods and services sector, with presence in Peru,
Guatemala, El Salvador, Nicaragua and Belize, announces
consolidated results for the second quarter 2013 as of
June 30, 2013. Consolidated Financial results have been
prepared in accordance with International Financial
Reporting Standards (IFRS) and are stated in Nuevos
Soles.
MAIN HIGHLIGHTS
Consolidated sales of Ferreycorp S.A.A and its
subsidiaries in Peru, Guatemala, El Salvador, Nicaragua
and Belize reached record sales of US$ 1,049 million
during the first six-month period of 2013, which
represents an important growth of 33% compared to the
same period of 2012 (US$ 791 million), as a result of
higher sales of new and used Caterpillar equipment, the
rental business, the supply of spare parts and services
and the contribution of new businesses incorporated to
the Corporation. It is important to point out that during
the second quarter of 2013, sales reached a record of
US$ 563 million, 36% higher compared to the same
period of the previous year (US$ 414 million).
For more information please visit
www.ferreycorp.com.pe or contact:
Patricia Gastelumendi L.
CFO
Telf: (511) 626-4257
Elizabeth Tamayo M.
IR
Tel: (511) 626-5112
2
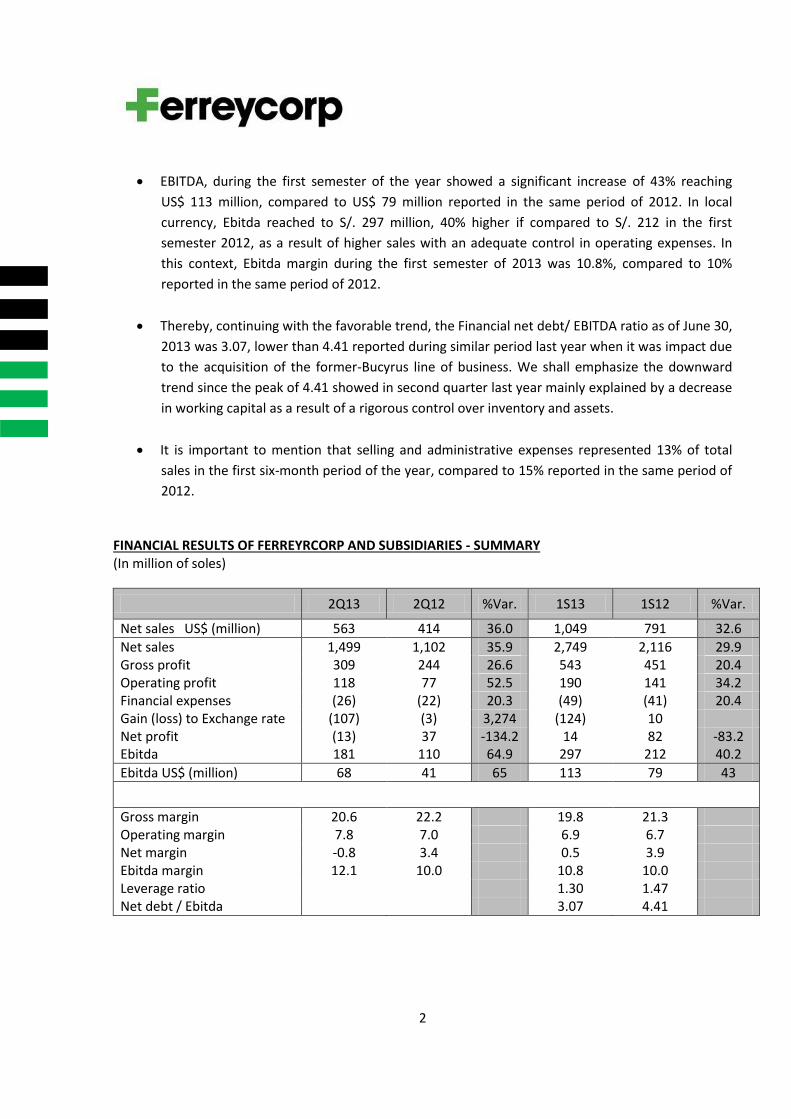
EBITDA, during the first semester of the year showed a significant increase of 43% reaching
US$ 113 million, compared to US$ 79 million reported in the same period of 2012. In local
currency, Ebitda reached to S/. 297 million, 40% higher if compared to S/. 212 in the first
semester 2012, as a result of higher sales with an adequate control in operating expenses. In
this context, Ebitda margin during the first semester of 2013 was 10.8%, compared to 10%
reported in the same period of 2012.
Thereby, continuing with the favorable trend, the Financial net debt/ EBITDA ratio as of June 30,
2013 was 3.07, lower than 4.41 reported during similar period last year when it was impact due
to the acquisition of the former-Bucyrus line of business. We shall emphasize the downward
trend since the peak of 4.41 showed in second quarter last year mainly explained by a decrease
in working capital as a result of a rigorous control over inventory and assets.
It is important to mention that selling and administrative expenses represented 13% of total
sales in the first six-month period of the year, compared to 15% reported in the same period of
2012.
FINANCIAL RESULTS OF FERREYRCORP AND SUBSIDIARIES - SUMMARY (In million of soles)
2Q13 2Q12 %Var. 1S13 1S12 %Var.
Net sales US$ (million) 563 414 36.0 1,049 791 32.6
Net sales 1,499 1,102 35.9 2,749 2,116 29.9 Gross profit 309 244 26.6 543 451 20.4 Operating profit 118 77 52.5 190 141 34.2 Financial expenses (26) (22) 20.3 (49) (41) 20.4 Gain (loss) to Exchange rate (107) (3) 3,274 (124) 10 Net profit (13) 37 -134.2 14 82 -83.2 Ebitda 181 110 64.9 297 212 40.2
Ebitda US$ (million) 68 41 65 113 79 43
Gross margin 20.6 22.2 19.8 21.3 Operating margin 7.8 7.0 6.9 6.7 Net margin -0.8 3.4 0.5 3.9 Ebitda margin 12.1 10.0 10.8 10.0 Leverage ratio 1.30 1.47 Net debt / Ebitda 3.07 4.41
3
SECOND QUARTER MAIN HIGHLIGHTS
Performance of Ferreycorp S.A.A. recent acquisitions
In the first half 2013, the shovel and drill lines, formerly known as Bucyrus, the ExxonMobil lubricant
distribution business in Guatemala and Nicaragua, as well as the industrial safety items business from
Tecseg, which were all recently incorporated into the corporation, contributed 14% to Ferreycorp’s
total sales. The following is a summary of its performance:
The distribution and support line formerly known as Bucyrus, today part of Caterpillar portfolio -
composed of electrical cable loaders, hydraulic shovels, and drills, along with the respective spare parts-
was successfully integrated into Ferreyros, generating total sales of US$ 156 million from June 2012
until the end of the first half 2013. As we previously mentioned, Ferreyros invested US$ 70 million in
this business, according to the contract with CAT Global Mining LLC. For the purpose of presenting to
investors the commercial effort associated with this line, we have included in this report a Management
Analysis that includes sales, cost of sales and gross profit from those purchase orders transferred by
Caterpillar to Ferreyros, according to the contract mentioned above. However, for accounting and tax
purposes, only the gross margin of these operations is considered under Other Operating Income.
In Peru, Mega Representations S.A., a subsidiary of the corporation dedicated to the l management of
supplies for sectors such as mining, construction and transportation, concluded the acquisition of 100%
stake of Tecseg S.A., a company dedicated to the commercialization of industrial safety items, for
approximately US$ 11 million during the first quarter 2013. As a comparison, during 2012 this company,
prior to the operation mentioned above, generated US$ 23 million. In the first half of this year,
following its incorporation into Ferreycorp, sales reached US$ 12.2 million, which were registered in
Mega Representaciones beginning in January.
As we mentioned, during the first quarter, the holding for Ferreycorp’s investments in Central America,
Inti Inversiones Interamericanas, acquired the distribution of Exxon Mobil’s lubricant line based in
Guatemala, entrusting its commercialization to Gentrac, a subsidiary of the corporation that operates in
that country. As a complement to that operation, Inti acquired from the same owner in Nicaragua, a
company dedicated to the distribution of ExxonMobil lubricants in that territory. In this manner, the
acquisition of these businesses jointly totaled US$ 17.2 million. At the same time, both reached
revenues of approximately US$ 30 million in 2012, and reported sales to Ferreycorp of US$ 12.8 million
during the first half 2013, after its incorporation. It is worth mentioning that these acquisitions are
consistent with the representation of Exxon Mobil’s lubricants that the subsidiary Cogesa has in El
Salvador for over a decade ago.
4
Use of funds derived from the placement of corporate bonds in the international market by
US$ 300 million
On April 26, Ferreycorp proceeded with the closing and issuance of bonds denominated "4,875% Senior
Guaranteed Notes due 2020," placed in the local and international market, for US$ 300 million. The
funds raised were assigned to the subsidiaries – particularly to Ferreyros and Unimaq, the ones with the
largest transaction volumes, by close to 70% -, for the purpose of adjusting the Company’s debt profile
to replace short and medium term financings with a better duration, to an average of 3 years with 7-
year bullet amortization payments at a fixed rate.
As a result, the corporation has freed up its credit lines to finance future investments.
Ferreyros S.A Local bonds program upgrade
The ratings agencies Equilibrium Clasificadora de Riesgo S. A. and Pacific Credit Rating (PCR) upgraded
the ratings from A+ to AA- assigned to the pending issuances of the First Debt Securities Program of
Ferreyros with a total amount of US$ 45 million and annual maturities until 2016.
As mentioned, by decision of the General Meeting of Debt Security Holders held on June 21, 2012, was
grated in favor of Ferreyros S. A., debt assumed by Ferreycorp as a result of the issuances of the Second
Debt Securities Program. Current issuances (first and seventh) were transferred to the subsidiary
Ferreyros S.A., as the first and second issuance of the now First Debt Securities Program for Ferreyros
S.A.
According to Equilibrium, the upgrade mentioned previously is based on “Ferreyros’ strong competitive
position with regards to the commercialization of capital goods and services, management’s know-how,
the company’s long track record in the domestic industry, a strong corporate governance culture,
support and strategic alliance held with Caterpillar Inc., and the support of Ferreycorp Holding of which
Ferreyros S. A. is the most important subsidiary", characteristics that were also highlighted by PCR.
Distinction of Ferreycorp with "Key to the BVL" for best Corporate Governance
For the fourth time Ferreycorp received the "Key to the BVL", a distinction of the Lima Stock Exchange
that recognizes the company with corporate governance best practices in Peru. The prize, awarded by
complying fully with the principles of good corporate governance, also considers stock liquidity.
Ferreycorp was awarded in 2013, 2012, 2011 and 2008.
Also, Ferreycorp’s stock was included again in the Good Corporate Governance Index (IBGC), as it has
been every year since its creation.
The key to the BVL was granted to Ferreycorp after a thorough validation process, carried out by a
consulting firm qualified by the BVL, with respect to the evaluation undertaken by the corporation on
their practices of good corporate governance during 2012. Such requirement found that Ferreycorp met
100% of the principles in this field.
5
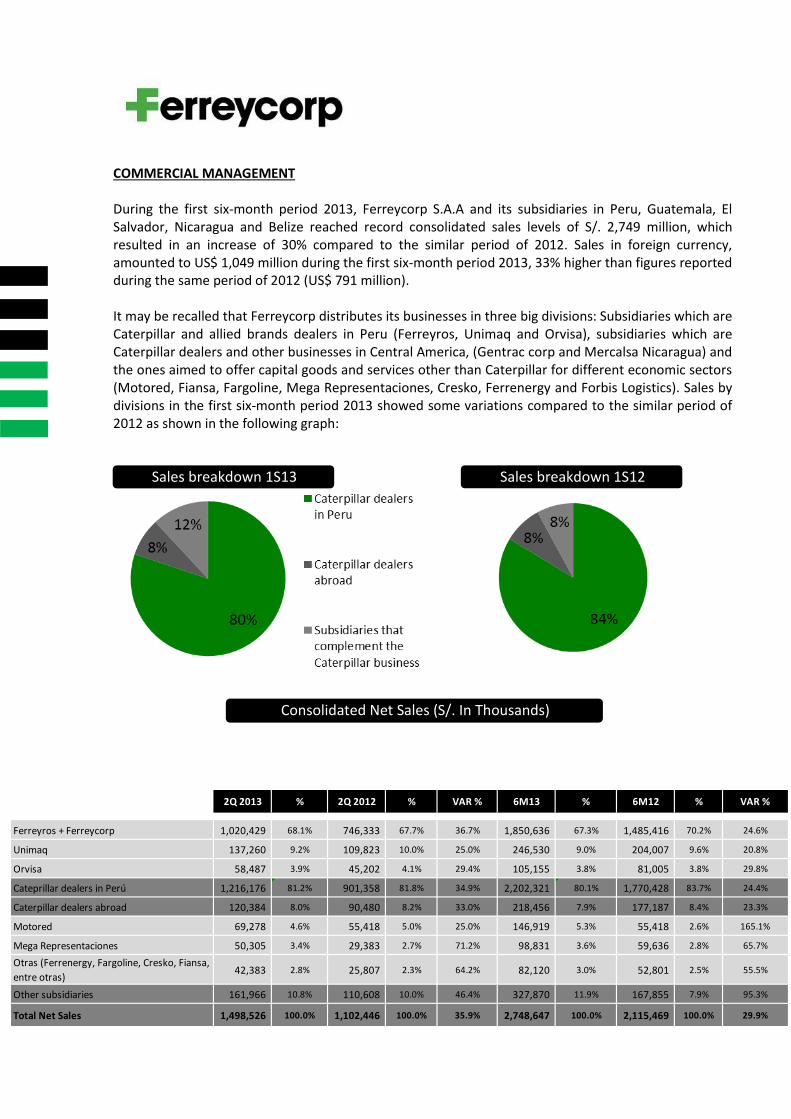
COMMERCIAL MANAGEMENT During the first six-month period 2013, Ferreycorp S.A.A and its subsidiaries in Peru, Guatemala, El Salvador, Nicaragua and Belize reached record consolidated sales levels of S/. 2,749 million, which resulted in an increase of 30% compared to the similar period of 2012. Sales in foreign currency, amounted to US$ 1,049 million during the first six-month period 2013, 33% higher than figures reported during the same period of 2012 (US$ 791 million). It may be recalled that Ferreycorp distributes its businesses in three big divisions: Subsidiaries which are Caterpillar and allied brands dealers in Peru (Ferreyros, Unimaq and Orvisa), subsidiaries which are Caterpillar dealers and other businesses in Central America, (Gentrac corp and Mercalsa Nicaragua) and the ones aimed to offer capital goods and services other than Caterpillar for different economic sectors (Motored, Fiansa, Fargoline, Mega Representaciones, Cresko, Ferrenergy and Forbis Logistics). Sales by divisions in the first six-month period 2013 showed some variations compared to the similar period of 2012 as shown in the following graph:
Sales breakdown 1S13 Sales breakdown 1S12
Consolidated Net Sales (S/. In Thousands)
2Q 2013 % 2Q 2012 % VAR % 6M13 % 6M12 % VAR %
Ferreyros + Ferreycorp 1,020,429 68.1% 746,333 67.7% 36.7% 1,850,636 67.3% 1,485,416 70.2% 24.6%
Unimaq 137,260 9.2% 109,823 10.0% 25.0% 246,530 9.0% 204,007 9.6% 20.8%
Orvisa 58,487 3.9% 45,202 4.1% 29.4% 105,155 3.8% 81,005 3.8% 29.8%
Cateprillar dealers in Perú 1,216,176 81.2% 901,358 81.8% 34.9% 2,202,321 80.1% 1,770,428 83.7% 24.4%
Caterpillar dealers abroad 120,384 8.0% 90,480 8.2% 33.0% 218,456 7.9% 177,187 8.4% 23.3%
Motored 69,278 4.6% 55,418 5.0% 25.0% 146,919 5.3% 55,418 2.6% 165.1%
Mega Representaciones 50,305 3.4% 29,383 2.7% 71.2% 98,831 3.6% 59,636 2.8% 65.7%
Otras (Ferrenergy, Fargoline, Cresko, Fiansa,
entre otras)42,383 2.8% 25,807 2.3% 64.2% 82,120 3.0% 52,801 2.5% 55.5%
Other subsidiaries 161,966 10.8% 110,608 10.0% 46.4% 327,870 11.9% 167,855 7.9% 95.3%
Total Net Sales 1,498,526 100.0% 1,102,446 100.0% 35.9% 2,748,647 100.0% 2,115,469 100.0% 29.9%
6
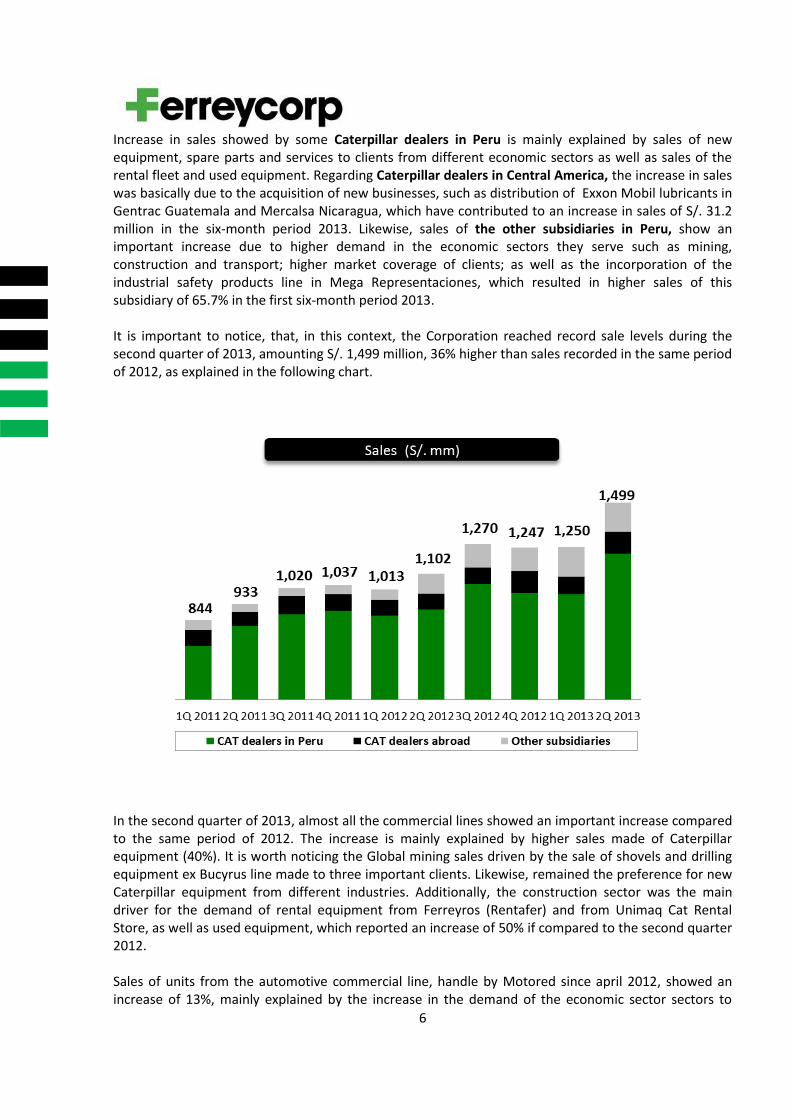
Increase in sales showed by some Caterpillar dealers in Peru is mainly explained by sales of new equipment, spare parts and services to clients from different economic sectors as well as sales of the rental fleet and used equipment. Regarding Caterpillar dealers in Central America, the increase in sales was basically due to the acquisition of new businesses, such as distribution of Exxon Mobil lubricants in Gentrac Guatemala and Mercalsa Nicaragua, which have contributed to an increase in sales of S/. 31.2 million in the six-month period 2013. Likewise, sales of the other subsidiaries in Peru, show an important increase due to higher demand in the economic sectors they serve such as mining, construction and transport; higher market coverage of clients; as well as the incorporation of the industrial safety products line in Mega Representaciones, which resulted in higher sales of this subsidiary of 65.7% in the first six-month period 2013. It is important to notice, that, in this context, the Corporation reached record sale levels during the second quarter of 2013, amounting S/. 1,499 million, 36% higher than sales recorded in the same period of 2012, as explained in the following chart.
In the second quarter of 2013, almost all the commercial lines showed an important increase compared to the same period of 2012. The increase is mainly explained by higher sales made of Caterpillar equipment (40%). It is worth noticing the Global mining sales driven by the sale of shovels and drilling equipment ex Bucyrus line made to three important clients. Likewise, remained the preference for new Caterpillar equipment from different industries. Additionally, the construction sector was the main driver for the demand of rental equipment from Ferreyros (Rentafer) and from Unimaq Cat Rental Store, as well as used equipment, which reported an increase of 50% if compared to the second quarter 2012. Sales of units from the automotive commercial line, handle by Motored since april 2012, showed an increase of 13%, mainly explained by the increase in the demand of the economic sector sectors to
7
which these sales are aimed, such as transport and construction, and to the transference of this business exclusively to subsidiary Motored. In addition, it is important to notice the important growth in sales of the other commercial lines handle by the other local subsidiaries, showing an increase of 55.7% in the second quarter of 2013 compared to the similar period of the previous year. Noticing the increase in sales of Mega Representaciones (S/. 20.9 million), Ferrenergy (S/. 4.9 million), Unimaq Equipos Ligeros (S/. 6.5 million) and Fargoline (S/. 3.9 million). Furthermore, other sales from subsidiaries in Central America showed an important increase of 211%, mainly due by, the acquisition of new businesses, such as the Exxon Mobil lubricants in Gentrac Guatemala and Mercalsa Nicaragua.
In million soles:
2Q 2013 % 2Q 2012 % Var
% Caterpillar Equipment:
Mining trucks and Caterpillar machines (GM1)
278 18.5 123 11.2 125.2
Machines and engines for other sectors
424 28.3 378 34.3 12.3
702 46.9 501 45.5 40.1
Rental and used 118 7.9 79 7.1 50.4
Automotive 60 4.0 53 4.8 13.4
Agricultural equipment 16 1.1 79 2.3 -38.5
896 59.8 658 59.7 36.1
Spare parts and services 454 30.3 357 32.4 26.9
Other sales from local subsidiaries 121 8.1 78 7.0 55.7
Other sales from subsidiaries abroad 28 1.9 9 0.8 211.0
Total 1,499 100.0 1,102 100.0 35.9 1: GM = Global mining
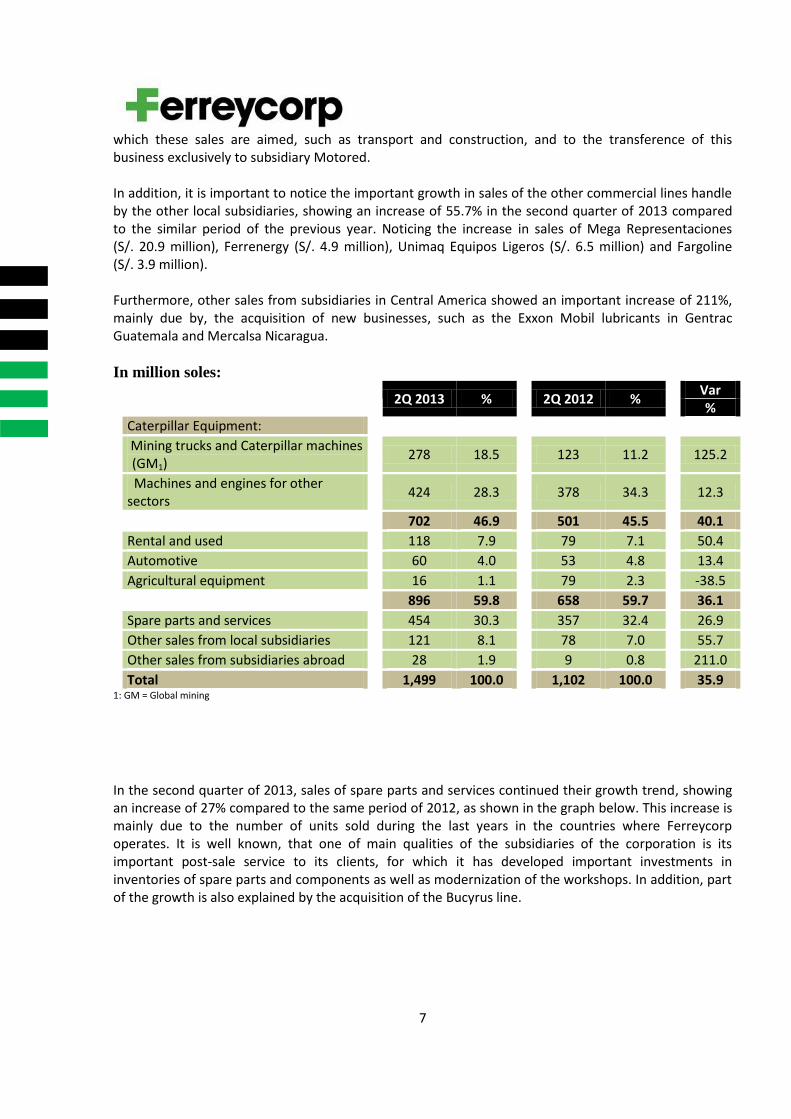
In the second quarter of 2013, sales of spare parts and services continued their growth trend, showing an increase of 27% compared to the same period of 2012, as shown in the graph below. This increase is mainly due to the number of units sold during the last years in the countries where Ferreycorp operates. It is well known, that one of main qualities of the subsidiaries of the corporation is its important post-sale service to its clients, for which it has developed important investments in inventories of spare parts and components as well as modernization of the workshops. In addition, part of the growth is also explained by the acquisition of the Bucyrus line.
8
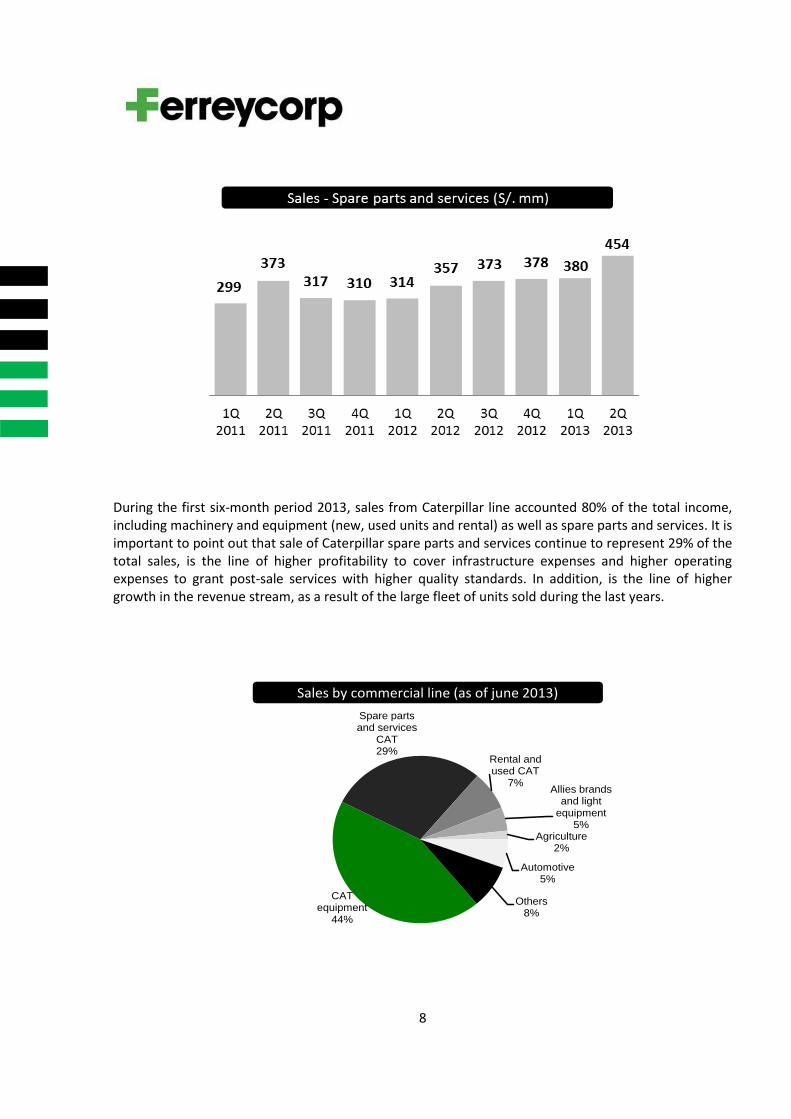
During the first six-month period 2013, sales from Caterpillar line accounted 80% of the total income, including machinery and equipment (new, used units and rental) as well as spare parts and services. It is important to point out that sale of Caterpillar spare parts and services continue to represent 29% of the total sales, is the line of higher profitability to cover infrastructure expenses and higher operating expenses to grant post-sale services with higher quality standards. In addition, is the line of higher growth in the revenue stream, as a result of the large fleet of units sold during the last years.
CAT equipment
44%
Spare parts and services
CAT29%
Rental and used CAT
7%Allies brands
and light equipment
5%Agriculture
2%
Automotive5%
Others8%
Sales by commercial line (as of june 2013)
9
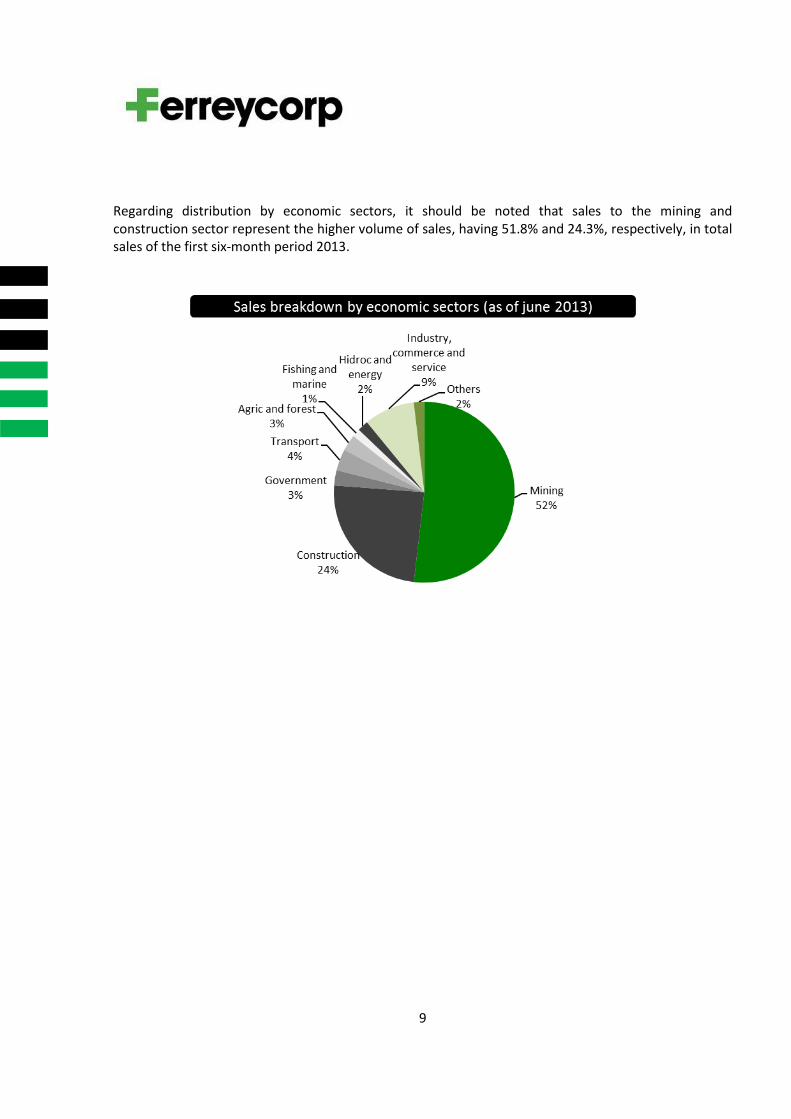
Regarding distribution by economic sectors, it should be noted that sales to the mining and construction sector represent the higher volume of sales, having 51.8% and 24.3%, respectively, in total sales of the first six-month period 2013.
10
FINANCIAL ANALYSIS
Sales
Million of soles 2Q13 2Q12 %Var. 1S13 1S12 %Var.
Net Sales 1,498.5 1,102.4 35.9 2,748.6 2,115.5 29.9
(See explanation of this variation in section: Commercial Management)
Gross Profit
Million of soles 2Q13 2Q12 %Var. 1S13 1S12 %Var.
Gross Profit 309.3 244.4 26.6 543.4 451.2 20.4
Gross profit and gross margin showed a positive behavior. In percentage terms, although gross margin
in the second quarter of 2013 is lower compared to the same period of the previous year (22.2%), it has
been the quarter with the highest gross margin in the year. Since the fourth quarter of 2012 the gross
margin has showed a continuous improvement, with 17.9% in that period, 18.7% in the first quarter of
2013 and 20.6% in the second quarter of 2013.
On the other hand, the gross margin was impact by the increase in participation of sales of machinery
made to big mining companies which have higher value, but lower margin compared to other
commercial lines and direct sales of drilling equipment and loading (former Bucyrus business) of US$ 62
million, which has lower margins compared to the average sales made to clients from big mining
companies, due to higher value of those equipments, although the effort and cost of managing those
purchase orders, is similar to the one made for equipment with lower price. Sales contribute to net
sales as well as in gross profit, but decrease the percentage of the total gross margin.
Selling and Administrative expenses
Million of soles 2Q13 2Q12 %Var. 1S13 1S12 %Var.
Selling and administrative expenses
195.3
167.2
16.8
365.4
312.2
17.0
Selling and administrative expenses, reached 15% as percentage of total sales in the second quarter of
2012 compared to 13% in the 2Q 201.
11
This positive result is mainly due to the corporation expenses control despite higher sales. Regarding
the personnel expenses, the following chart shows the number of employees as of June 2013,
compared to the same period of 2012, a variation of 9%. Of the total number of new employees in the
payroll, 30% represents new businesses acquired in 2013.
Ferreycorp and subsidiaries Jun-12 Dic-12 Jun-13
Executives 135 139 146
Administrative and Sales 2,999 3,169 3,410
Technicians 2,924 2,929 3,038
Total 6,058 6,237 6,594
However, there has been a nominal increase in this expenses explained by the recording of
amortization of tangible asset related to the acquisition of the Bucyrus commercial line (S/. 13.2
million), expense that was not recorded during the 2Q 2012. If we exclude this amortization, other
operating expenses only show an increase of 7%, much lower if compared to the increase in total sales.
Other income (expenses), net
Million of soles 2Q13 2Q12 %Var. 1S13 1S12 %Var.
Other income (expenses) net
3.6
-0.1
11.8
2.5
379.9
Net income in the 2Q 2013 includes Recording of S/. 2.7 million awarded by Caterpillar in relation to
warranty claims.
Financial Income
Million of soles 2Q13 2Q12 %Var. 1S13 1S12 %Var.
Financial Income 5.8 4.3 34.6 11.5 10.5 9.6
Financial income include interests charge to clients for financing sales
12
Financial Expenses
Million of soles 2Q13 2Q12 %Var. 6M13 6M12 %Var.
Financial expenses 26.1 21.7 20.3 48.8 40.5 20.4
Variation in financial expenses in the second quarter of 2013, is explained by an increase of 8.1% in
average liabilities subject to interest (S/. 1,860.8 million in 2Q 2013; S/. 1,722.1 million in 2Q 2012) and
to the increase of interest rates as a result of higher long-term funding which generally have higher
interest rates. The interest rate has vary since april 2013 due to the 4.875% interest rate generated
regarding the international bond (plus the commission for structuring), above the corporation average
interest rate. This variation is justified by the longer debt maturity. The international bond issued by
Ferreycorp allowed the corporation to restructure the debt to seven years with capital amortization and
interest payment at the seventh year.
Foreign Exhange Gain (Loss)
Million of soles 2Q13 2Q12 %Var. 1S13 1S12 %Var.
Foreign Exhange Gain (Loss)
(107.0)
(3.2)
(124.0)
9.6
The exchange loss in the 2Q of 2013 was caused by devaluation of the sol against the US dollar of
7.49%, compared to the 2Q of 2012, which registered an appreciation of the sol against the US dollar of
0.11%. The impact of this variations have caused a lower result of S/. 67.5 million, net of taxes.
It is important to mention that considering a financial point of view, a great amount of the
Corporation’s sales are made in foreign currency (US dollars), but the currency position net is widely
covered by inventories, which are recorded in US dollars. As of 06-30-2013, inventories are registered at
an average exchange rate of S/. 2.676, and liabilities at an exchange rate of S/. 2.783, which has lead to
a reserve of inventory of S/. 32 million (only Ferreyros, without including other subsidiaries’ inventory).
Net Profit
Million of soles 2Q13 2Q12 %Var. 1S13 1S12 %Var.
Net profit (12.7) 37.0 13.7 81.9 -83.2
Due to variations previously explained, net loss of the second quarter was caused by the exchange loss
registered during the second quarter of 2013, which do not consider higher value of inventory which is
invoice in US dollars.
13
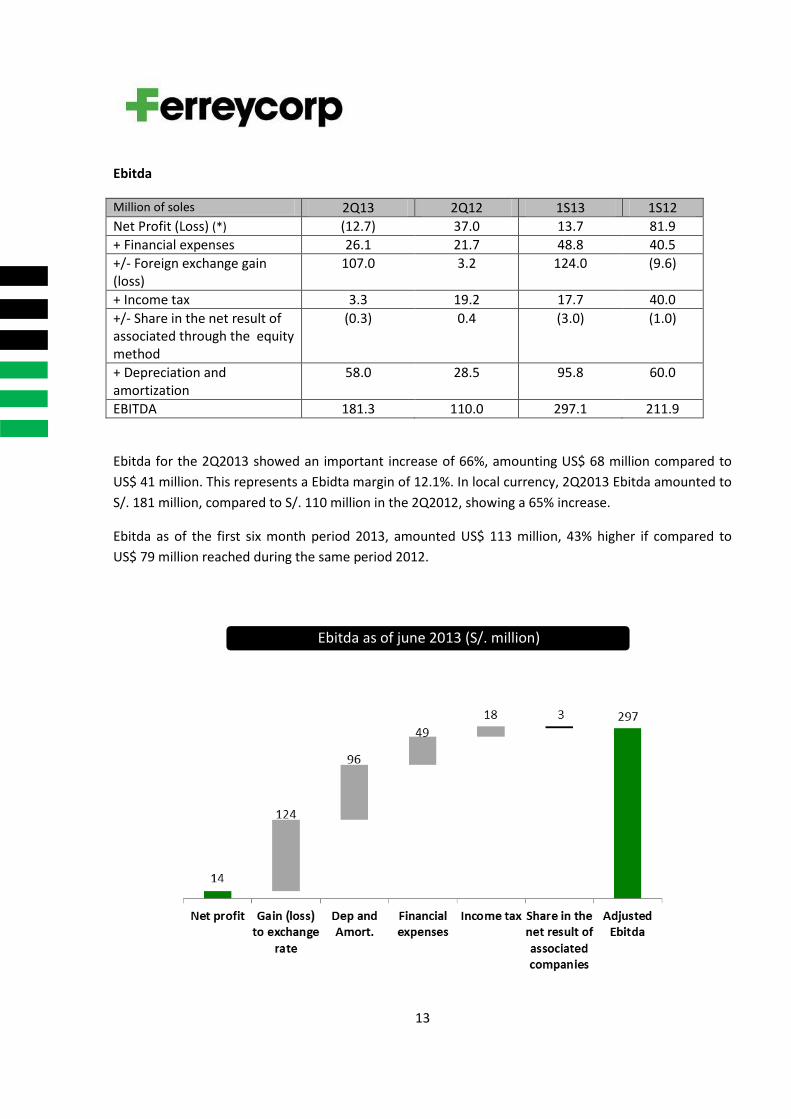
Ebitda
Million of soles 2Q13 2Q12 1S13 1S12
Net Profit (Loss) (*) (12.7) 37.0 13.7 81.9
+ Financial expenses 26.1 21.7 48.8 40.5
+/- Foreign exchange gain (loss)
107.0 3.2 124.0 (9.6)
+ Income tax 3.3 19.2 17.7 40.0
+/- Share in the net result of associated through the equity method
(0.3) 0.4 (3.0) (1.0)
+ Depreciation and amortization
58.0 28.5 95.8 60.0
EBITDA 181.3 110.0 297.1 211.9
Ebitda for the 2Q2013 showed an important increase of 66%, amounting US$ 68 million compared to
US$ 41 million. This represents a Ebidta margin of 12.1%. In local currency, 2Q2013 Ebitda amounted to
S/. 181 million, compared to S/. 110 million in the 2Q2012, showing a 65% increase.
Ebitda as of the first six month period 2013, amounted US$ 113 million, 43% higher if compared to
US$ 79 million reached during the same period 2012.
Ebitda as of june 2013 (S/. million)
14
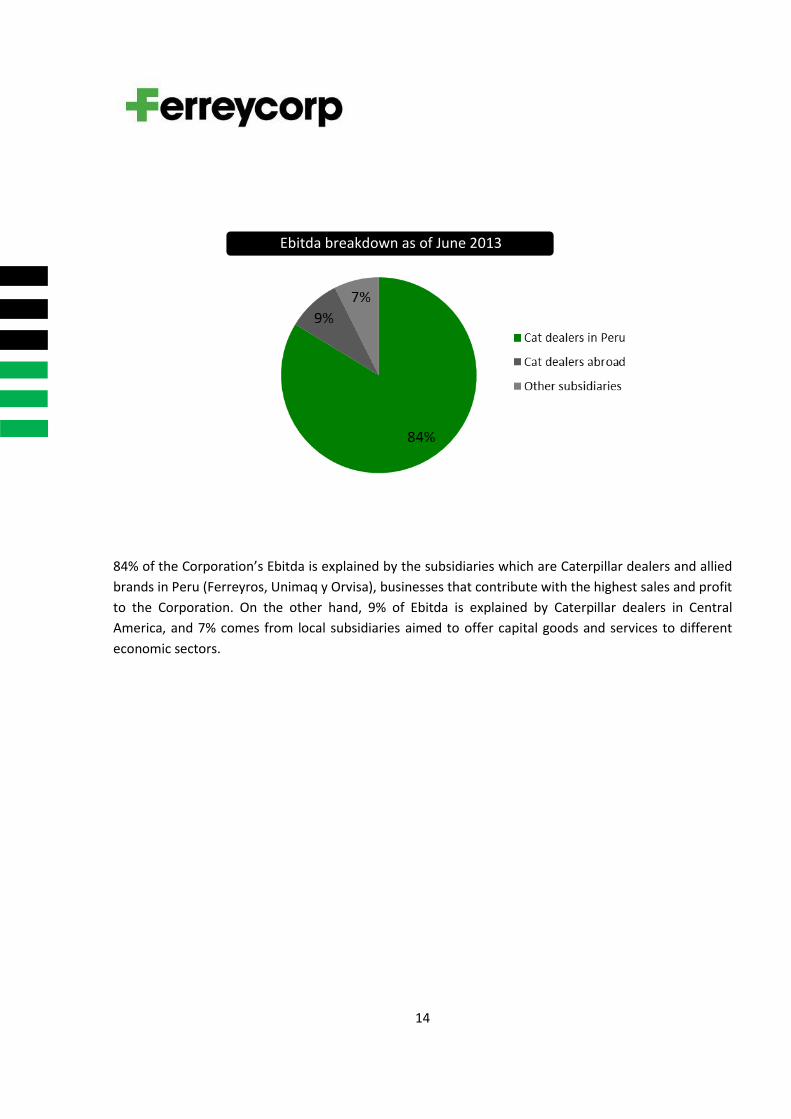
84% of the Corporation’s Ebitda is explained by the subsidiaries which are Caterpillar dealers and allied
brands in Peru (Ferreyros, Unimaq y Orvisa), businesses that contribute with the highest sales and profit
to the Corporation. On the other hand, 9% of Ebitda is explained by Caterpillar dealers in Central
America, and 7% comes from local subsidiaries aimed to offer capital goods and services to different
economic sectors.
Ebitda breakdown as of June 2013
15
CONSOLIDATED STATE OF FINANCIAL POSITION ANALYSIS
As shown in appendix 2, total assets as of June 30, 2013, amounted to S/. 4,183.4 million, compared to
S/. 4,128.2 million as of June 30, 2012, meaning, a slightly increase of S/. 55.2 million (1.3%).
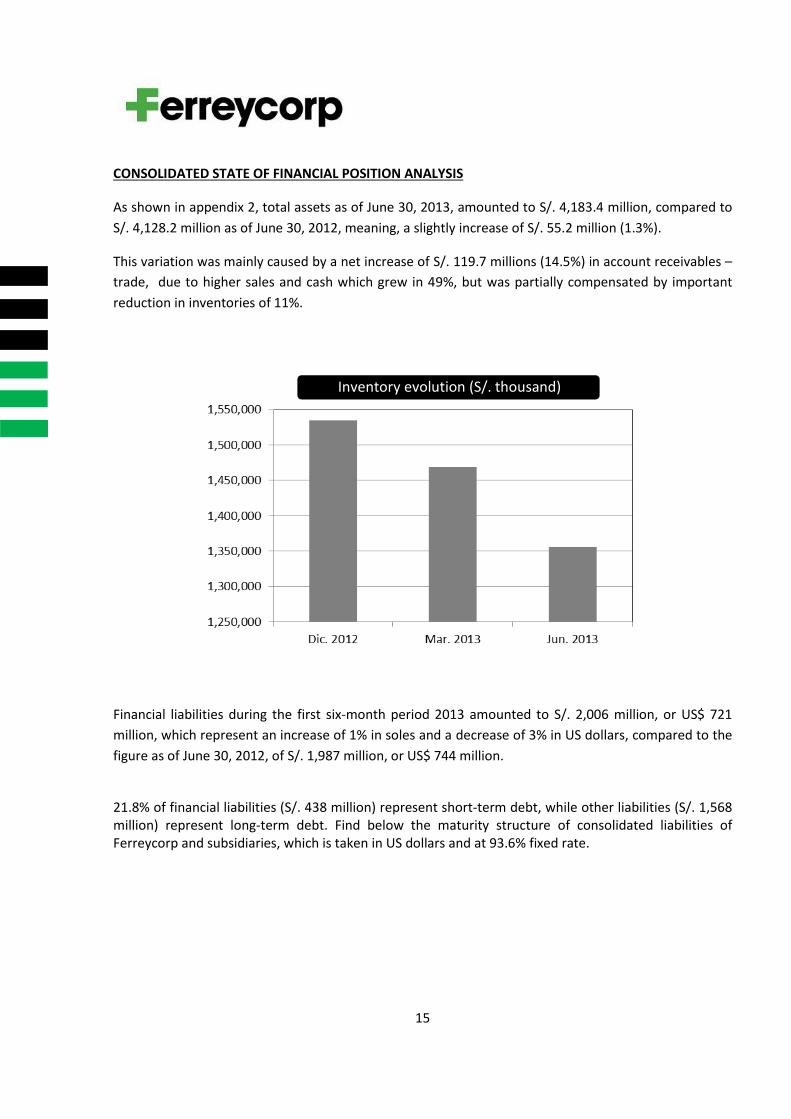
This variation was mainly caused by a net increase of S/. 119.7 millions (14.5%) in account receivables –
trade, due to higher sales and cash which grew in 49%, but was partially compensated by important
reduction in inventories of 11%.
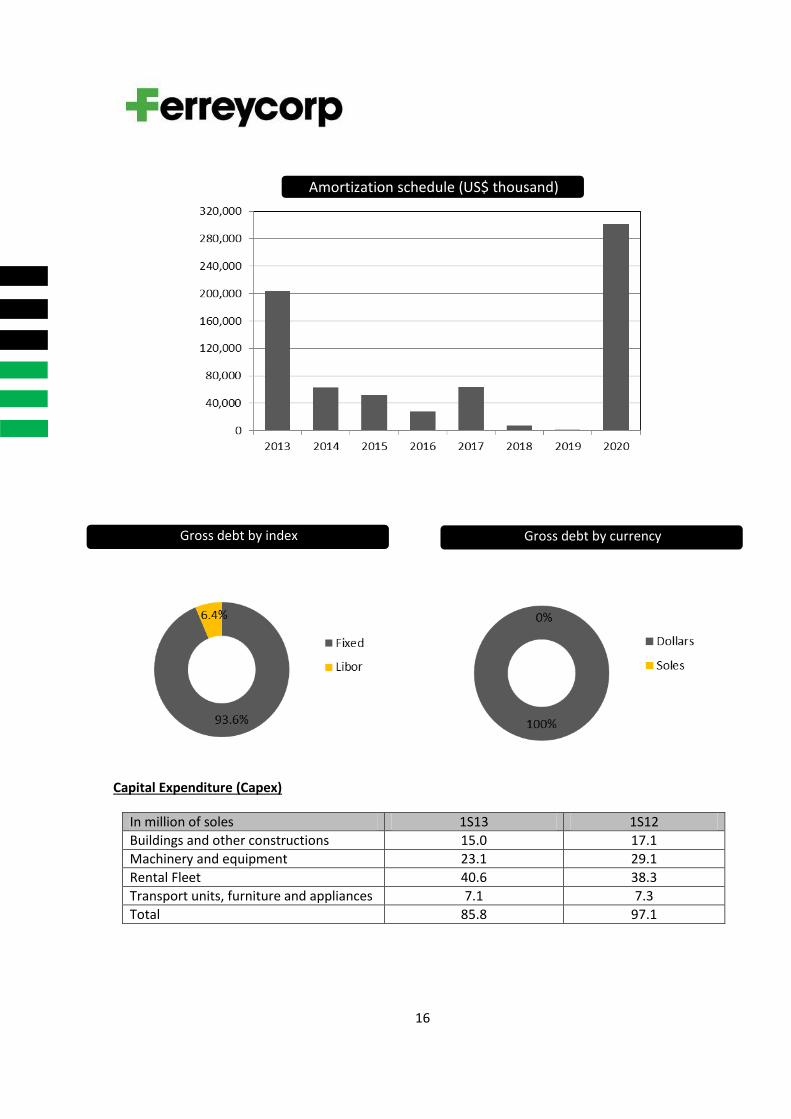
Financial liabilities during the first six-month period 2013 amounted to S/. 2,006 million, or US$ 721
million, which represent an increase of 1% in soles and a decrease of 3% in US dollars, compared to the
figure as of June 30, 2012, of S/. 1,987 million, or US$ 744 million.
21.8% of financial liabilities (S/. 438 million) represent short-term debt, while other liabilities (S/. 1,568 million) represent long-term debt. Find below the maturity structure of consolidated liabilities of Ferreycorp and subsidiaries, which is taken in US dollars and at 93.6% fixed rate.
Inventory evolution (S/. thousand)
16
Capital Expenditure (Capex)
In million of soles 1S13 1S12
Buildings and other constructions 15.0 17.1
Machinery and equipment 23.1 29.1
Rental Fleet 40.6 38.3
Transport units, furniture and appliances 7.1 7.3
Total 85.8 97.1
Amortization schedule (US$ thousand)
Gross debt by index Gross debt by currency
17
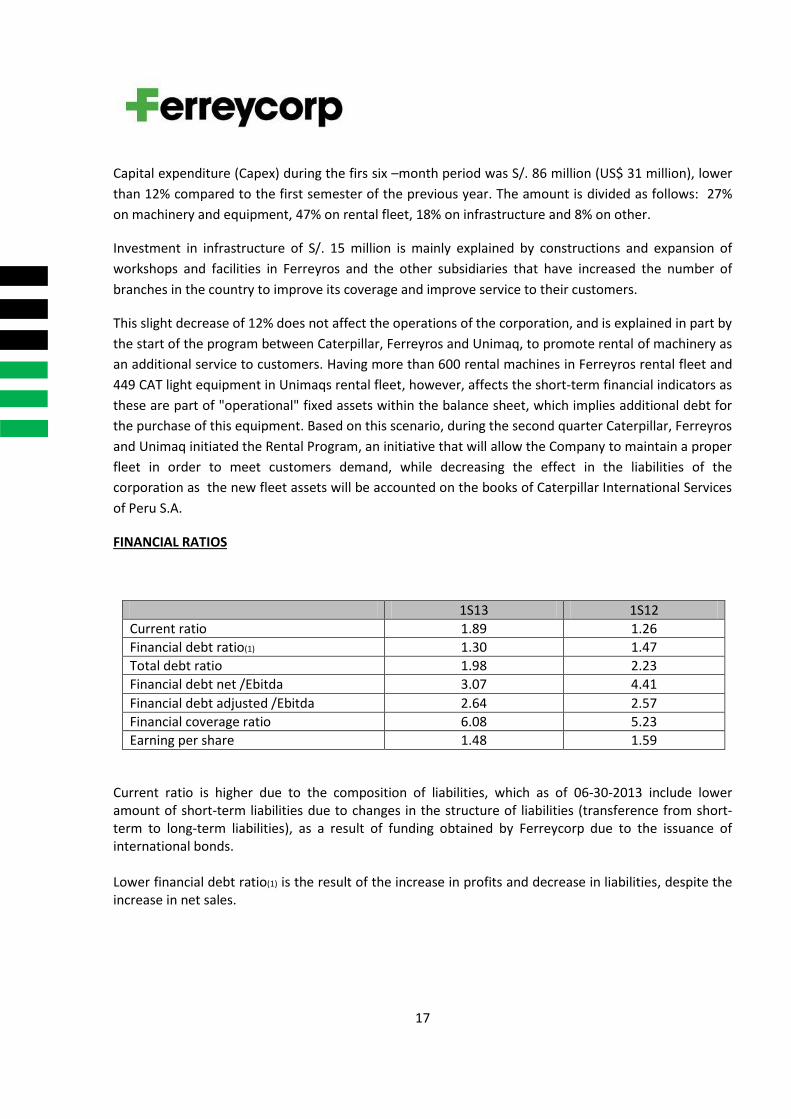
Capital expenditure (Capex) during the firs six –month period was S/. 86 million (US$ 31 million), lower
than 12% compared to the first semester of the previous year. The amount is divided as follows: 27%
on machinery and equipment, 47% on rental fleet, 18% on infrastructure and 8% on other.
Investment in infrastructure of S/. 15 million is mainly explained by constructions and expansion of
workshops and facilities in Ferreyros and the other subsidiaries that have increased the number of
branches in the country to improve its coverage and improve service to their customers.
This slight decrease of 12% does not affect the operations of the corporation, and is explained in part by
the start of the program between Caterpillar, Ferreyros and Unimaq, to promote rental of machinery as
an additional service to customers. Having more than 600 rental machines in Ferreyros rental fleet and
449 CAT light equipment in Unimaqs rental fleet, however, affects the short-term financial indicators as
these are part of "operational" fixed assets within the balance sheet, which implies additional debt for
the purchase of this equipment. Based on this scenario, during the second quarter Caterpillar, Ferreyros
and Unimaq initiated the Rental Program, an initiative that will allow the Company to maintain a proper
fleet in order to meet customers demand, while decreasing the effect in the liabilities of the
corporation as the new fleet assets will be accounted on the books of Caterpillar International Services
of Peru S.A.
FINANCIAL RATIOS
1S13 1S12
Current ratio 1.89 1.26
Financial debt ratio(1) 1.30 1.47
Total debt ratio 1.98 2.23
Financial debt net /Ebitda 3.07 4.41
Financial debt adjusted /Ebitda 2.64 2.57
Financial coverage ratio 6.08 5.23
Earning per share 1.48 1.59
Current ratio is higher due to the composition of liabilities, which as of 06-30-2013 include lower amount of short-term liabilities due to changes in the structure of liabilities (transference from short-term to long-term liabilities), as a result of funding obtained by Ferreycorp due to the issuance of international bonds. Lower financial debt ratio(1) is the result of the increase in profits and decrease in liabilities, despite the increase in net sales.
18
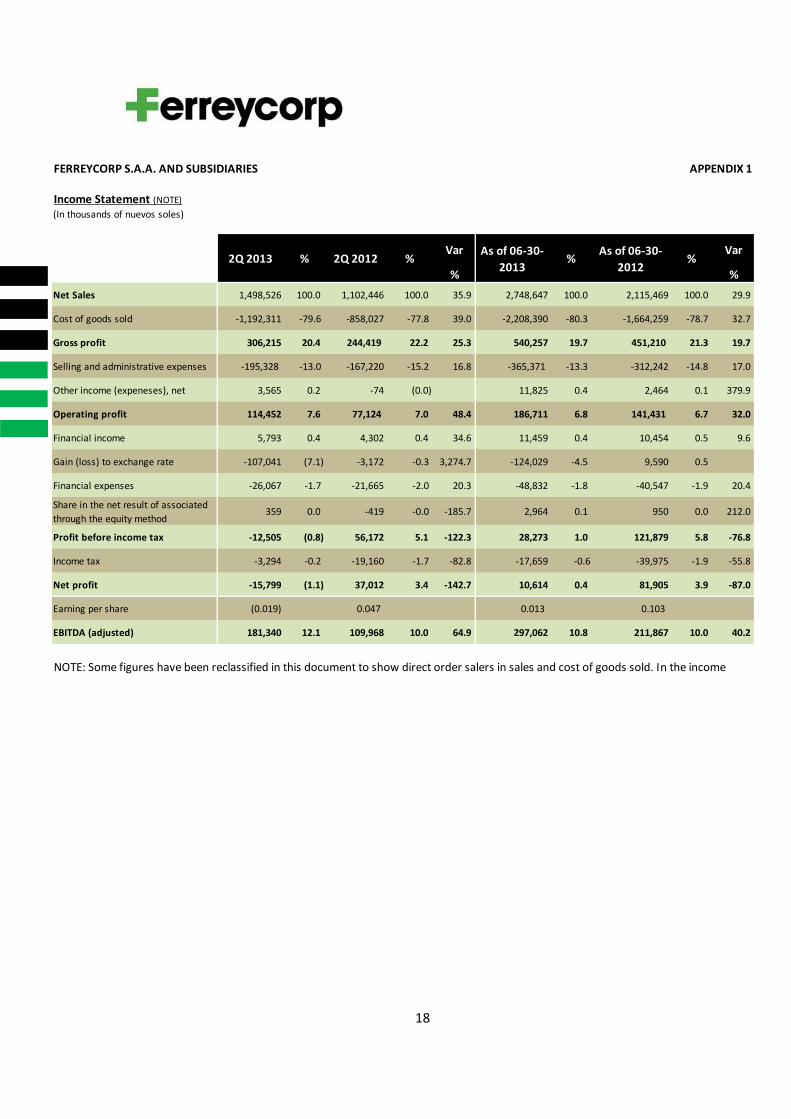
FERREYCORP S.A.A. AND SUBSIDIARIES APPENDIX 1
Income Statement (NOTE)
(In thousands of nuevos soles)
Var Var
% %
Net Sales 1,498,526 100.0 1,102,446 100.0 35.9 2,748,647 100.0 2,115,469 100.0 29.9
Cost of goods sold -1,192,311 -79.6 -858,027 -77.8 39.0 -2,208,390 -80.3 -1,664,259 -78.7 32.7
Gross profit 306,215 20.4 244,419 22.2 25.3 540,257 19.7 451,210 21.3 19.7
Selling and administrative expenses -195,328 -13.0 -167,220 -15.2 16.8 -365,371 -13.3 -312,242 -14.8 17.0
Other income (expeneses), net 3,565 0.2 -74 (0.0) 11,825 0.4 2,464 0.1 379.9
Operating profit 114,452 7.6 77,124 7.0 48.4 186,711 6.8 141,431 6.7 32.0
Financial income 5,793 0.4 4,302 0.4 34.6 11,459 0.4 10,454 0.5 9.6
Gain (loss) to exchange rate -107,041 (7.1) -3,172 -0.3 3,274.7 -124,029 -4.5 9,590 0.5
Financial expenses -26,067 -1.7 -21,665 -2.0 20.3 -48,832 -1.8 -40,547 -1.9 20.4
Share in the net result of associated
through the equity method359 0.0 -419 -0.0 -185.7 2,964 0.1 950 0.0 212.0
Profit before income tax -12,505 (0.8) 56,172 5.1 -122.3 28,273 1.0 121,879 5.8 -76.8
Income tax -3,294 -0.2 -19,160 -1.7 -82.8 -17,659 -0.6 -39,975 -1.9 -55.8
Net profit -15,799 (1.1) 37,012 3.4 -142.7 10,614 0.4 81,905 3.9 -87.0
Earning per share (0.019) 0.047 0.013 0.103
EBITDA (adjusted) 181,340 12.1 109,968 10.0 64.9 297,062 10.8 211,867 10.0 40.2
NOTE: Some figures have been reclassified in this document to show direct order salers in sales and cost of goods sold. In the income
%2Q 2013 2Q 2012As of 06-30-
2013
As of 06-30-
2012% % %
19
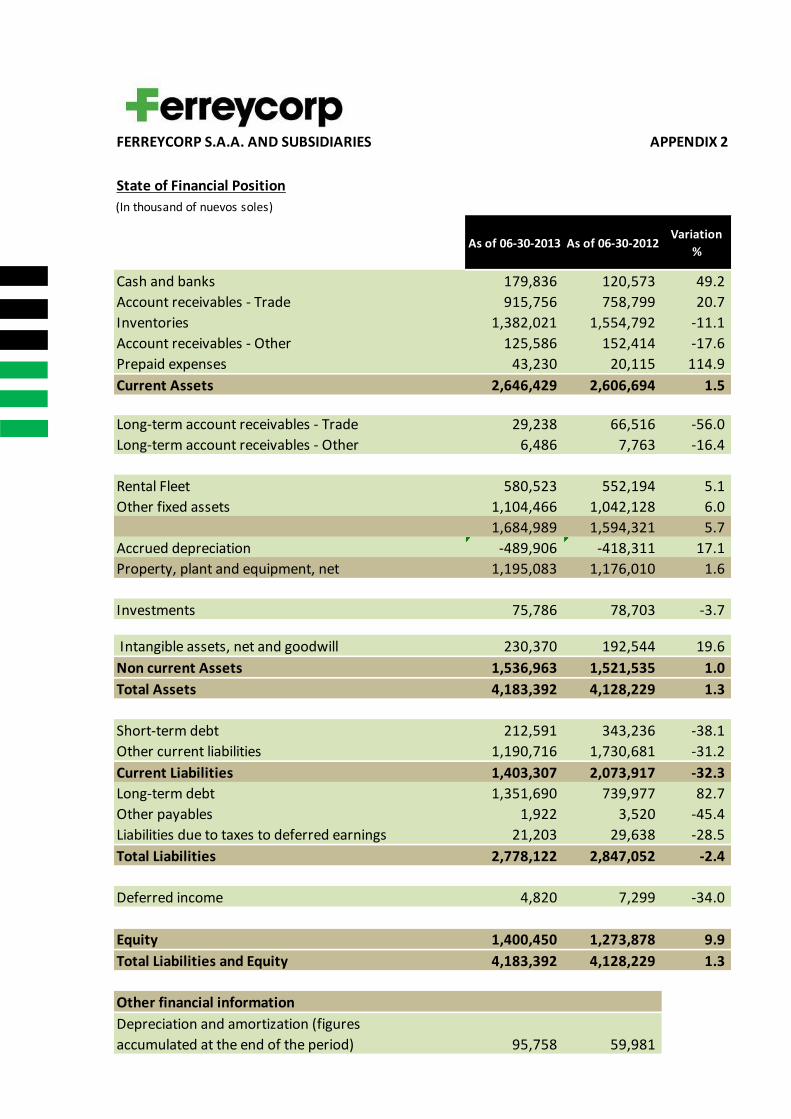
FERREYCORP S.A.A. AND SUBSIDIARIES APPENDIX 2
State of Financial Position
(In thousand of nuevos soles)
Cash and banks 179,836 120,573 49.2
Account receivables - Trade 915,756 758,799 20.7
Inventories 1,382,021 1,554,792 -11.1
Account receivables - Other 125,586 152,414 -17.6
Prepaid expenses 43,230 20,115 114.9
Current Assets 2,646,429 2,606,694 1.5
Long-term account receivables - Trade 29,238 66,516 -56.0
Long-term account receivables - Other 6,486 7,763 -16.4
Rental Fleet 580,523 552,194 5.1
Other fixed assets 1,104,466 1,042,128 6.0
1,684,989 1,594,321 5.7
Accrued depreciation -489,906 -418,311 17.1
Property, plant and equipment, net 1,195,083 1,176,010 1.6
Investments 75,786 78,703 -3.7
Intangible assets, net and goodwill 230,370 192,544 19.6
Non current Assets 1,536,963 1,521,535 1.0
Total Assets 4,183,392 4,128,229 1.3
Short-term debt 212,591 343,236 -38.1
Other current liabilities 1,190,716 1,730,681 -31.2
Current Liabilities 1,403,307 2,073,917 -32.3
Long-term debt 1,351,690 739,977 82.7
Other payables 1,922 3,520 -45.4
Liabilities due to taxes to deferred earnings 21,203 29,638 -28.5
Total Liabilities 2,778,122 2,847,052 -2.4
Deferred income 4,820 7,299 -34.0
Equity 1,400,450 1,273,878 9.9
Total Liabilities and Equity 4,183,392 4,128,229 1.3
Other financial information
Depreciation and amortization (figures
accumulated at the end of the period) 95,758 59,981
As of 06-30-2013 As of 06-30-2012Variation
%
20
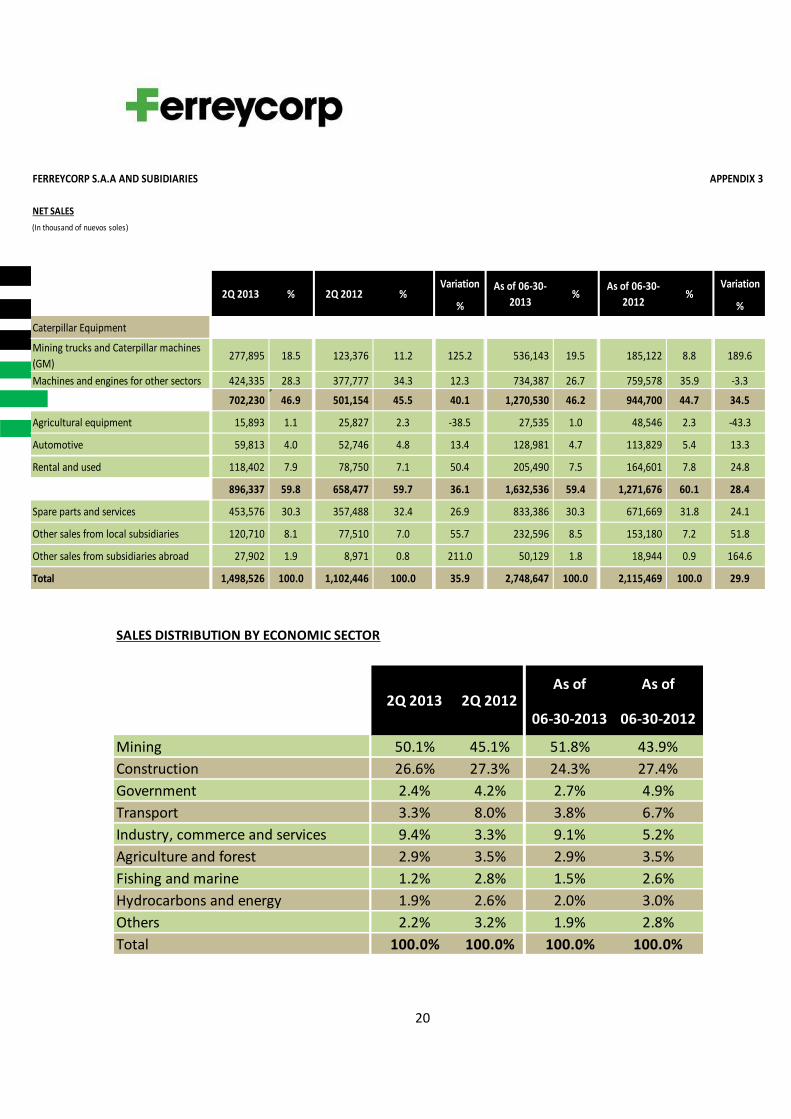
SALES DISTRIBUTION BY ECONOMIC SECTOR
As of As of
06-30-2013 06-30-2012
Mining 50.1% 45.1% 51.8% 43.9%
Construction 26.6% 27.3% 24.3% 27.4%
Government 2.4% 4.2% 2.7% 4.9%
Transport 3.3% 8.0% 3.8% 6.7%
Industry, commerce and services 9.4% 3.3% 9.1% 5.2%
Agriculture and forest 2.9% 3.5% 2.9% 3.5%
Fishing and marine 1.2% 2.8% 1.5% 2.6%
Hydrocarbons and energy 1.9% 2.6% 2.0% 3.0%
Others 2.2% 3.2% 1.9% 2.8%
Total 100.0% 100.0% 100.0% 100.0%
2Q 2013 2Q 2012
FERREYCORP S.A.A AND SUBIDIARIES APPENDIX 3
NET SALES
(In thousand of nuevos soles)
Variation Variation
% %
Caterpillar Equipment
Mining trucks and Caterpillar machines
(GM)277,895 18.5 123,376 11.2 125.2 536,143 19.5 185,122 8.8 189.6
Machines and engines for other sectors 424,335 28.3 377,777 34.3 12.3 734,387 26.7 759,578 35.9 -3.3
702,230 46.9 501,154 45.5 40.1 1,270,530 46.2 944,700 44.7 34.5
Agricultural equipment 15,893 1.1 25,827 2.3 -38.5 27,535 1.0 48,546 2.3 -43.3
Automotive 59,813 4.0 52,746 4.8 13.4 128,981 4.7 113,829 5.4 13.3
Rental and used 118,402 7.9 78,750 7.1 50.4 205,490 7.5 164,601 7.8 24.8
896,337 59.8 658,477 59.7 36.1 1,632,536 59.4 1,271,676 60.1 28.4
Spare parts and services 453,576 30.3 357,488 32.4 26.9 833,386 30.3 671,669 31.8 24.1
Other sales from local subsidiaries 120,710 8.1 77,510 7.0 55.7 232,596 8.5 153,180 7.2 51.8
Other sales from subsidiaries abroad 27,902 1.9 8,971 0.8 211.0 50,129 1.8 18,944 0.9 164.6
Total 1,498,526 100.0 1,102,446 100.0 35.9 2,748,647 100.0 2,115,469 100.0 29.9
2Q 2013 % 2Q 2012 %As of 06-30-
2013%
As of 06-30-
2012%
21
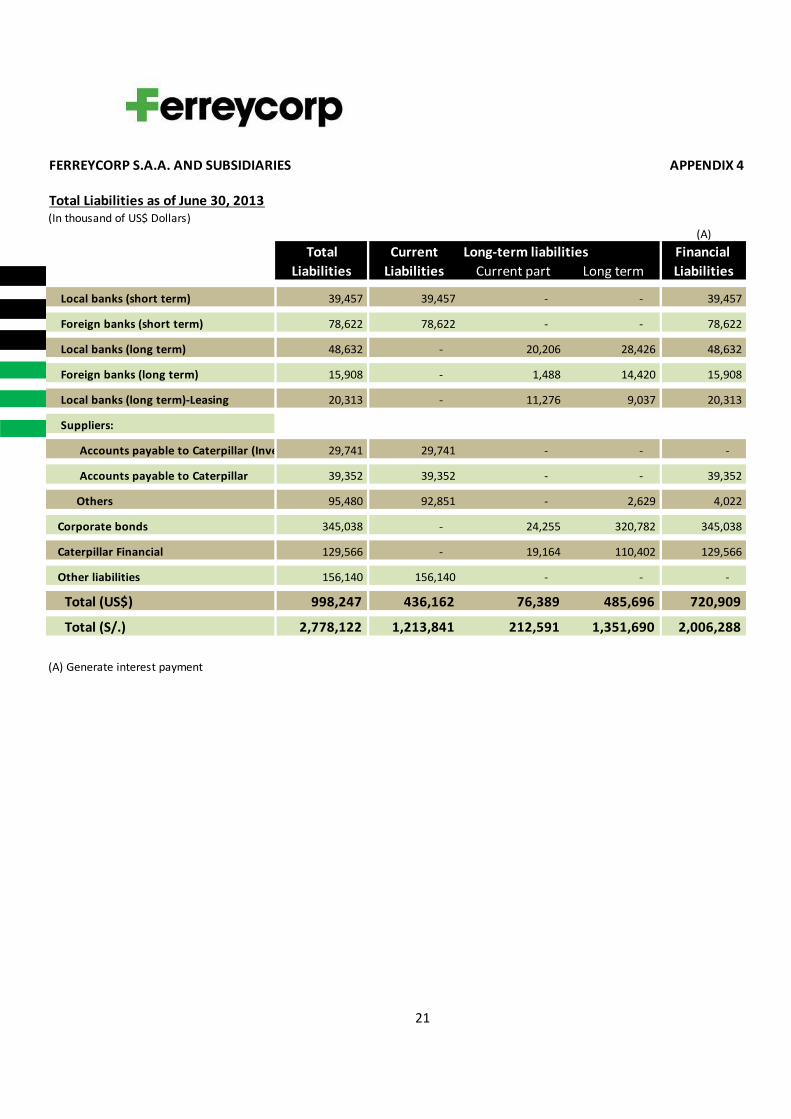
FERREYCORP S.A.A. AND SUBSIDIARIES APPENDIX 4
Total Liabilities as of June 30, 2013(In thousand of US$ Dollars)
(A)
Total Current Long-term liabilities Financial
Liabilities Liabilities Current part Long term Liabilities
Local banks (short term) 39,457 39,457 - - 39,457
Foreign banks (short term) 78,622 78,622 - - 78,622
Local banks (long term) 48,632 - 20,206 28,426 48,632
Foreign banks (long term) 15,908 - 1,488 14,420 15,908
Local banks (long term)-Leasing 20,313 - 11,276 9,037 20,313
Suppliers:
Accounts payable to Caterpillar (Invent) 29,741 29,741 - - -
Accounts payable to Caterpillar 39,352 39,352 - - 39,352
Others 95,480 92,851 - 2,629 4,022
Corporate bonds 345,038 - 24,255 320,782 345,038
Caterpillar Financial 129,566 - 19,164 110,402 129,566
Other liabilities 156,140 156,140 - - -
Total (US$) 998,247 436,162 76,389 485,696 720,909
Total (S/.) 2,778,122 1,213,841 212,591 1,351,690 2,006,288
(A) Generate interest payment
22
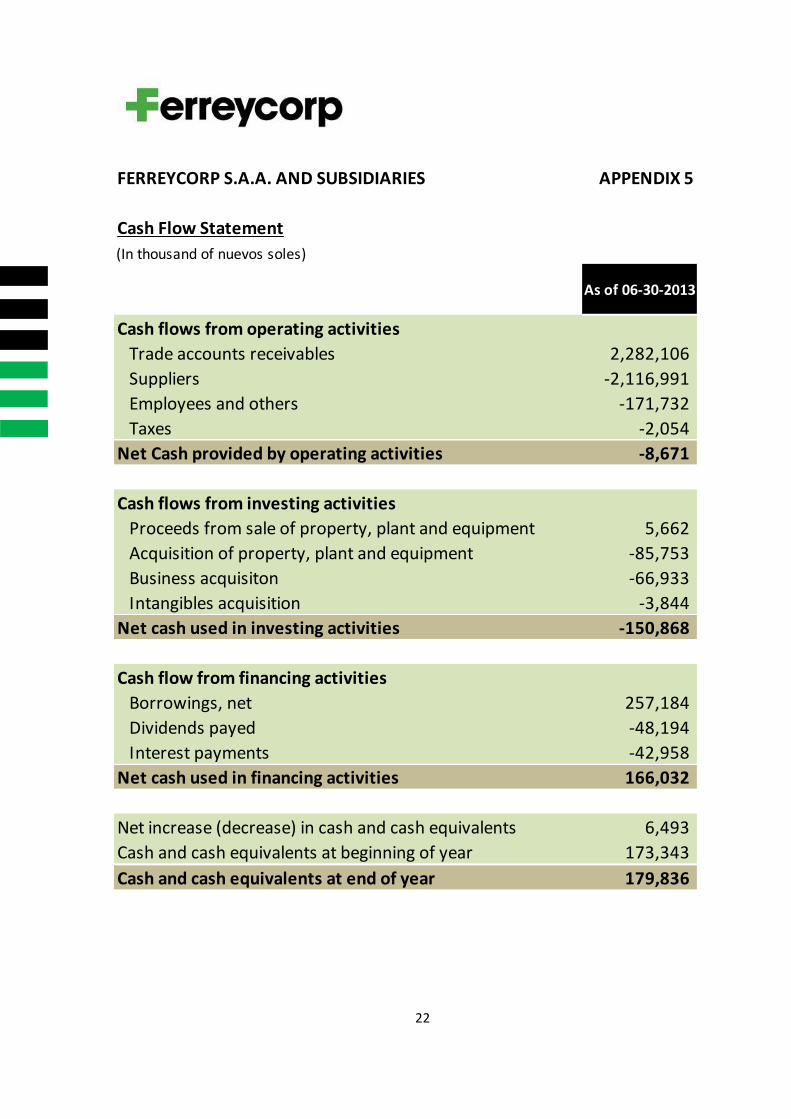
FERREYCORP S.A.A. AND SUBSIDIARIES APPENDIX 5
Cash Flow Statement
(In thousand of nuevos soles)
Cash flows from operating activities
Trade accounts receivables 2,282,106
Suppliers -2,116,991
Employees and others -171,732
Taxes -2,054
Net Cash provided by operating activities -8,671
Cash flows from investing activities
Proceeds from sale of property, plant and equipment 5,662
Acquisition of property, plant and equipment -85,753
Business acquisiton -66,933
Intangibles acquisition -3,844
Net cash used in investing activities -150,868
Cash flow from financing activities
Borrowings, net 257,184
Dividends payed -48,194
Interest payments -42,958
Net cash used in financing activities 166,032
Net increase (decrease) in cash and cash equivalents 6,493
Cash and cash equivalents at beginning of year 173,343
Cash and cash equivalents at end of year 179,836
As of 06-30-2013
23
COMPANY DESCRIPTION – FERREYCORP S.A.A
Ferreycorp S.A.A. and its subsidiaries (BVL: FERREYC1) is a leading importer of capital goods and services
with more than 90 years of history and presence in Peru, Guatemala, El Salvador, Nicaragua and Belize.
The Company has been listed on the Lima Stock Exchange (BVL) since 1962.
The corporation distributes its business in three big divisions: Companies which are Caterpillar dealers
and other allied brands in Peru, Companies which are Caterpillar dealers in Central America; and
Companies aimed to offer capital goods and services other than Caterpillar to different economic
sectors.
24
DISCLAIMER
Esta nota de prensa puede contener en las declaraciones ciertas estimaciones. Estas declaraciones son hechos no
históricos, y se basan en la visión actual de la administración de Ferreycorp S.A.A. y en estimaciones de
circunstancias económicas futuras, de las condiciones de la industria, el desempeño de la compañía y resultados
financieros. Las palabras “anticipada”, “cree”, “estima”, “espera”, “planea” y otras expresiones similares,
relacionadas con la corporación, tienen la intención de identificar estimaciones o previsiones. Las declaraciones
relativas a las actividades, los proyectos, las condiciones financieras y/o las operaciones de resultados de la
corporación, así como la implementación de la operación principal y estrategias financieras, y de planes de
inversión de capital, la dirección de operaciones futuras y los factores y las tendencias que afecten la condición
financiera, la liquidez o los resultados de operaciones son ejemplos de estimaciones declaradas; tales
declaraciones reflejan la visión actual de la gerencia y están sujetas a varios riesgos e incertidumbres. No hay
garantía que los eventos esperados, tendencias o resultados ocurrirán realmente. Las declaraciones están basadas
en varias suposiciones y factores, inclusive las condiciones generales económicas y de mercado, condiciones de la
industria y los factores de operación. Cualquier cambio en tales suposiciones o factores podrían causar que los
resultados reales difieran materialmente de las expectativas actuales.