Design Manual for Sedimentation Control Through Sedimentation ...

Basin Research (1 989) 2,115-1 31
Subsidence, sedimentation and sea-level changes in the Eromanga Basin, Australia Kerry Gallagher* Fission Track Research Group, Department of Geology, La Trobe University, Bundoora, Victoria, Australia 3083
Kurt Lambeck Research School of Earth Sciences, Australian National University, GPO BOX 4, Canberra, ACT, Australia 2607
ABSTRACT
The Jurassic-Cretaceous subsidence history of the Eromanga Basin, a large intracratonic sedimentary basin in central eastern Australia, has been examined using standard backstripping techniques, allowing for porosity reduction by compaction and cementation. Interpretation of the results suggests that during the Jurassic the basin was subsiding in a manner consistent with the exponentially decreasing form predicted by simple thermally based tectonic models. By the Early Cretaceous, the rate of subsidence was considerably higher than that expected from such models and nearly half of the total sediment thickness was deposited over the final 20 Myr of the basin's 95 Myr Mesozoic depositional history. The Early Cretaceous also marks the first marine incursion into the basin, consistent with global sea-level curves. Subsequently, however, the sediments alternate between marine and non-marine, with up to 1200 rn of fluvial sediments being deposited, and this was followed by a depositional hiatus of about 50 Myr in the Late Cretaceous. This occurred at a time when global sea-level was rising to its peak. A model is presented which is consistent with the rapid increase in tectonic subsidence rate and the transgressive-regressive nature of the sediments. The model incorporates a sediment influx which is greater than that predicted by the thermally based tectonic models implied by the Jurassic subsidence history. The excess sedimentation results in the basin region attaining an elevation which exceeds that of the contemporary sea-level, and thereby giving the appearance of a regression. The present day elevation of the region predicted by the model is about 100-200 m above that observed. This discrepancy may arise because the primary tectonic subsidence is better represented by a linear function of time rather than an exponentially decreasing form.
INTRODUCTION
Sedimentary basins provide a record of mainly vertical tectonic movement. More specifically, accumulations of shallow marine or non-marine sediments up to 5 km in thickness imply that progressive subsidence occurred to accommodate the sedimentary infilL A variety of physical mechanisms have been proposed for such subsidence (see, for example, the reviews by Sleep, Nunn & Chou, 1980; Turcotte, 1980; Quinlan, 1987). Three dominant factors have been recognized which can exert a primary or secondary influence on the overall evolution of a sedimen- tary basin. These are thermal, stress-based and gravitational effects. Broadly, thermal effects are manifested as heating or cooling with concomitant thermal expansion (uplifi) or contraction (subsidence), stress effects as in-plane forces (extension, compression and shear) and gravity effects as
' Formerly at Research School of Earth Sciences, Australian National University.
the response tosurfice or internal loading ofthe lithosphere. Generally, all three mechanisms will operate and it is the relative importance of each through time that determines the evolutionary character of a basin.
A common approach to sedimentary basin analysis is the reconstruction 'of sediment accumulation as a function of time. The technique, known as geohistory analysis, requires a knowledge, or inference, of the stratigraphic and absolute ages of the sediment, palaeowater depths and sea- level variations (van Hinte, 1978; Falvey & Deighton, 1982% b; Guidish d al., 1984). Watts & Ryan (1976), and subsequently Steckler & Watts (1978), developed a method, similar to geohistory analysis, to quantify tectonic subsi- dence in sedimentary basins. Here tectonic subsidence is defined as that p:irt of the observed subsidence being attributed to the primary physical processes forming the sedimentary basin To reveal this tectonic component, corrections are required to remove the loading effect of the sediment at the time ofdeposition. The method has become
115

K. Gallagher and K. Lambeck
known as backstripping and has been widely used to provide supporting evidence for particular basin forming mechanisms (e.g. Sclater & Christie, 1980; Barton & Wood, 1984; Bond & Kominz, 1984; Chadwick, 1986).
In this paper, the backstripping method has been applied to 40 wells from the Eromanga Basin, a Jurassic-Cretaceous intracratonic basin covering over 1 x lo6 km2 of central eastern Australia (Fig. l), and a representative basinwide subsidence curve has been established. The consistent features of the subsidence history are interpreted in terms of simple models, using two particular wells from the central and western regions of the Eromanga Basin as examples. The inference of sea-level variations from the observed vertical facies distributions in the stratigraphic record are subsequently discussed in the context of the factors considered to have been important during the basin's evolution.
GEOLOGY OF THE EROMANGA BASIN
The Eromanga Basin forms the major part of the Great Artesian Basin and represents part of a depositional system that was active over eastern Australia during the Jurassic to middle Cretaceous. This depositional system also included the Surat Basin to the east and the Carpentaria Basin to the north. However, the concentric nature of the surface geology (Fig. 2a), sediment isopachs and structure contours (Fig. 2b) implies that the Eromanga Basin was a structurally independent feature during its formation, although erosion is likely to have contributed in part to the bulls-eye pattern of the surface geology.
The Eromanga Basin is underlain by several smaller, non-marine Permo-Triassic basins (see Fig. 1). The maximum thickness of the Eromanga Basin sediments is observed over the southern Cooper and the Simpson Desert Basins, where Jurassic-Cretaceous sediment thickness reaches about 2700 m. Outside this central area, the
'21 Fig. 1 The location of the Eromanga Basin and other basins referred to in the text. The boundaries within the Eromanga Basin represent Permian to Triassic sedimentary basins underlying the Eromanga Basin sequence.
sediments tend to thin and show predictable facies variations towards the basin margins in the south, west and north. Only the relevant regional geological history is summarized here and in Table 1, and for more detailed descriptions of the geology of the region see Senior, Mond &Harrison ( 1978), Moore & Mount ( 1982), and Gravestock et d. (1986).
The Jurassic was a period of entirely non-marine deposition and is considered to comprise three cycles of upwards-fining clastics (Exon & Burger, 198 1 ; Gravestock, 1982; Burger, 1986; John & Almond, 1987). The sandstone-rich members of the three cycles are the Hutton, Adori/lower Namur and Hooraylupper Namur Sandstones and these represent a dominantly fluvial depositional
136 140 144 148
I I I I \ I I
140 144 (a) '36
I60
Fig. 2 (a) Simplified pre-Tertiary geology of the Eromanga and northern Surat Basins (see also Table 1). (b) Structure contours (in metres below sea-level) on the top of the Cadna-Owie Formation illustrating the subcircular geometry of the Eromanga Basin (adapted from Armstrong & Barr, in Gravestock et ul., 1986).
116

Eromanga Basin subsidence
environment. The shale-rich units are the Birkhead, Westbourne/middle Namur and Murta Formations and these are interpreted as either low-energy fluvial or lacustrine sediments. The temporal and geographical relationships of the sediments within the cycles are complicated by facies variations but, broadly, the cyclicity is attributable to changes in the sediment source areas and the energy of the depositional environment. Veevers (1 984), Moore er d. (1 986) and Duddy (1 987), noting the progressive increase in the proportion of volcanogenic material eastwards from the Eromanga Basin, across the Surat Basin to the Maryborough Basin, inferred a contemporaneous volcanic arc, located off what is now the present day east coast of aeensland. They attributed the iithological variations seen in the basins to fluctuations in the tectonic activity of this volcanic source region. It is also likely that these variations are related to changes in the dominant direction of drainage of the major river systems. As the rivers drained eastwards out through the Surat Basin, cratonically derived quartzose detritus would have been deposited over the Eromanga Basin. Westerly flowing rivers, possibley initiated as a result of increased activity at the eastern margin (volcanism and probably an enhanced topography), would have ultimately drained into the Erornanga Basin region. The earliest Jurassic sediments were deposited in the central Eromanga Basin region only but by the time of the deposition of the Hooray Sandstone (Late Jurassic), the area of sedimentation had increased such that approximately the present-day outcrop limits of the Eromanga Basin were reached (see Fig. 2a).
By the Early Cretaceous (Neocomian), the first evidence of marine conditions was seen in the Eromanga Basin during the deposition of the fluvial/paralic Cadna-Owie Formation. With time, shallow-marine conditions became widespread across the entire basin and surrounding region, marked by the deposition of the Doncaster Member of the Wallumbilla Formation and its equivalent in the south west of the basin, the Bulldog Shale. Although some onlap of the underlying units probably occurred, the presence of less marine facies in both the western (Moore &-Pitt, 1984) and northeastern (Exon & Senior, 1976) areas of the basin suggests that the shoreline was not too far away from the present basin margin. In addition to the initial easterly opening to fuIl marine conditions through the Surat Basin (Exon & Senior, 1976), marine influences came from the north through the Carpentaria Basin and this connection rapidly became dominant (Smart & Senior, 1980; Burger, 1986). Subsequently, however, the Coreena Member of the Wallumbilla Formation represents a progressive shallowing of the marine conditions. At this time there seems to have been a distinct change in the provenance region, as the lithological character of the sediments changed from quartz rich to being dominated by contemporaneous volcanogenic detritus (Exon & Senior, 1976; Senior et af., 1978; Smart & Senior, 1980; Duddy, 1987). These authors concluded that a major volcanic arc existed at this time off the present- day eastern coast of Queensland similar, but more active, to that proposed in the Jurassic and it is possible that
volcanic activity was more or less continuous from the Jurassic to the Cretaceous. The existence of a volcanic arc in the Cretaceous is supported by the observation of Albian dacitic-andesitic pyroclastics in the Whitsunday Island Group (Paine, 1969) and in the Maryborough Basin area (Ellis, 1968; Ellis & Whitaker, 1976) on the eastern coast of Queensland. The transport of large volumes of fresh (i.e. unweathered), volcanic detritus over distances of nearly 2000 km to the Eromanga Basin was probably facilitated by a cool climate at the time (Gilty, 1984).
By the middle Albian, widespread shallow-marine conditions returned to the Eromanga Basin, resulting in the deposition of the shaly Toolebuc Formation and the Allaru Mudstone, while paralic to non-marine sediments (Griman Creek Formation) were deposited in the Surat Basin. However, the marine conditions again became restricted in the Eromanga Basin. The Mackunda Forma- tion was deposited in a shallow-marinelparalic environ- ment, while sedimentation appears to have ceased in the Surat Basin by this time (Exon & Senior, 1976). Facies variations in the Eromanga and Carpentaria Basins indicate that the sea was retreating to the north (Exon & Senior, 1976; Smart & Senior, 1980; Smart et al., 1980; Burger, 1986) and the detrital character of the sediment again became markedly more volcaniclastic. The final stage of the Cretaceous depositional history of the Eromanga Basin is represented by the fluvial Winton Formation (Cenoman- ian), a sequence of volcanogenic sandstones and siltstones, with minor shales and coals, up to 1200 m in thickness (Moore & Pitt, 1984). The rate of sedimentation during this final stage was some 5-10 times greater than that for any previous formation. After this period of relatively rapid deposition, sedimentation effectively ceased in the Ero- manga Basin. The Late Cretaceous to Early Tertiary is marked by a period ofdeep ( - 100 m) chemical weathering of the Winton Formation, with little or no deposition (Senior el ul., 1978).
SUBSIDENCE A N A L Y S I S A N D BACKSTRIPPING
The aim of backstripping is to quantify that part of the observed subsidence which is the result of some primary tectonic mechanism. For a given thickness of sediment, H,, the backstripped or tectonic subsidence, Hb, under the assumption of Airy isostasy, is given as (Steckler & Watts, 1978)
H b = [ ( P m - p s ) Hs +(Pm-Pw) H w
- ~ m H s ~ l / ( ~ m - ~ i ) , (1)
where ps is the mein sediment density, pm, pw and p, are the densities of the mantle, water and the material assumed to infill the tectonic depression respectively, Hw is the water depth during deposition (palaeobathymetry) and H,, is the difference in sea-level, positive for a sea-level rise, relative to the present day (Fig. 3). Before proceeding it is
117

K. Gallagher and K. Lambeck
informative to consider under what circumstances the assumption of Airy isostasy is valid.
The general mechanical response to vertical loading or thermally induced density variations may be described as regional compensation such that local isostatic models, both the Airy and Pratt formulations (e.g. Heiskanen & Vening Meinesz, 1958), can then be regarded as special cases of this. In the regional compensation scheme the lithosphere is most simply considered to behave as a thin elastic plate overlying a fluid substratum (the asthenos- phere). Surface loads are compensated for by flexure of the lithosphere so that vertical deformation occurs over an area greater than that covered by the load. In the Airy isostatic scheme, deformation only occurs directly under the load and compensation is then said to be local. When considering departures from the Airy isostatic condition, it should be noted that the flexural response of the lithosphere is a function not only of its physical properties, but is also determined by the wavelength of the load. Under an axisymmetric load the length scale of deformation of a thin elastic plate is characterized by the flexural parameter, a, where
a= /= (2)
(Brotchie & Silvester, 1969; Beaumont, 1978). D (Nm) is the flexural rigidity of the elastic plate and is proportional to the cube of the elastic plate thickness, Ap (kg m-3) is the density contrast between the material below the plate
Present day sea level -
U U U Present day &compacted Backstripped or Observed sediment thickness at time unloaded basement thickness of deposition subsidence
Fig. 3 Decompaction and backstripping model. H, is the present-day thickness of a sedimentary unit, with its upper and lower surfaces at zI and z2 respectively. H,' is the decornpacted thickness at the time of deposition with the upper and lower surfaces at 2,' and z2'. If externally supplied cement is the sole cause of porosity reduction then it is assumed that H,' = H, and the thickness remains constant at all times during burial H , is the depth of water at the time of deposition, or palaeobathymetry, and H,, is the height of sea-level relative to the present day. Hb is the backstripped, or unloaded, basement depth and this depression is attributed to a tectonic or driving mechanism, and therefore is referred to as the tectonic subsidence.
and that which infills the deflection and g (ms-*> is gravitational acceleration. If the radius of a constant- thickness axisymmetric load is more than about 3 4 then the central portion of the deflection under the load will be close, or equal, to that predicted under Airy isostasy (see Brotchie & Silvester, 1969, Fig. 3). For flexural rigidities between 10" and lot4 Nm, this condition implies that a sediment-filled basin would require a load of at least 100- 300 km in radius to approximate local isostatic equilibrium in the central region. If flexural effects are neglected during backstripping then, although the form of the subsidence curves will not be significantly altered, absolute values of tectonic subsidence may be overestimated. The values of parameters inferred from subsidence curves, such as extension factors, may be as much as 40% in error (Watts, Karner & Steckler, 1982). For the purpose of this paper we assume Airy isostasy, which is a reasonable approximation for the central region of the basin, which has a diameter of about 1000 km.
When modelling the sediment load over time, it is appropriate to correct the sediment thickness for compac- tion (e.g. Steckler & Watts, 1978 ; Sclater & Christie, 1980). It is then implicitly assumed that observed porosity reduction with depth is due solely to increasing overburden and expulsion of pore fluids. An additional mechanism for porosity reduction is cement infill and this effect is likely to be important for quartz sandstones and carbonates. When considering thickness changes during continuous deposition we can, therefore, define two limiting cases. The first is where porosity is reduced by compaction and then the thickness of the unit decreases as it becomes progressively buried. The second is where porosity is reduced by cement derived from an external source and, in this situation, the thickness of the unit is assumed to be constant at all times. Althhgh the thickness of the sedimentary units remains constant as it is buried, the addition of externally sourced cement increases the total mass of the unit whereas, in the case of compaction, the total mass decreases with burial. The assumption that porosity reduction by cementation occurs merely as a function of burial depth is certainly an oversimplification and many additional factors influence the timing of cementation. Damanti & Jordan (1 989), for example, incorporated detailed petrographic data with standard decompaction techniques to constrain the diagenetic history of the Bermejo foreland basin in Argentina. However, it can be shown (Gallagher, 1989) that the compaction and cementation models discussed in this paper provide upper and lower bounds, respectively, on the first-order changes in the mass and thickness of a particular sedimentary unit as it is buried, irrespective of the timing of cementation. Dissolution can act to increase porosity and reduce the mass of a sedimentary unit if the dissolved material can be removed entirely from the system. However, it is probable that such material will be reprecipiated within the basin, and therefore dissolution is not considered further. Similarly, local cementation and dissolution are considered to represent a redistribution of
118
mass and, on a basinwide scale, are unlikely to affect significantly the mass of the sediments.
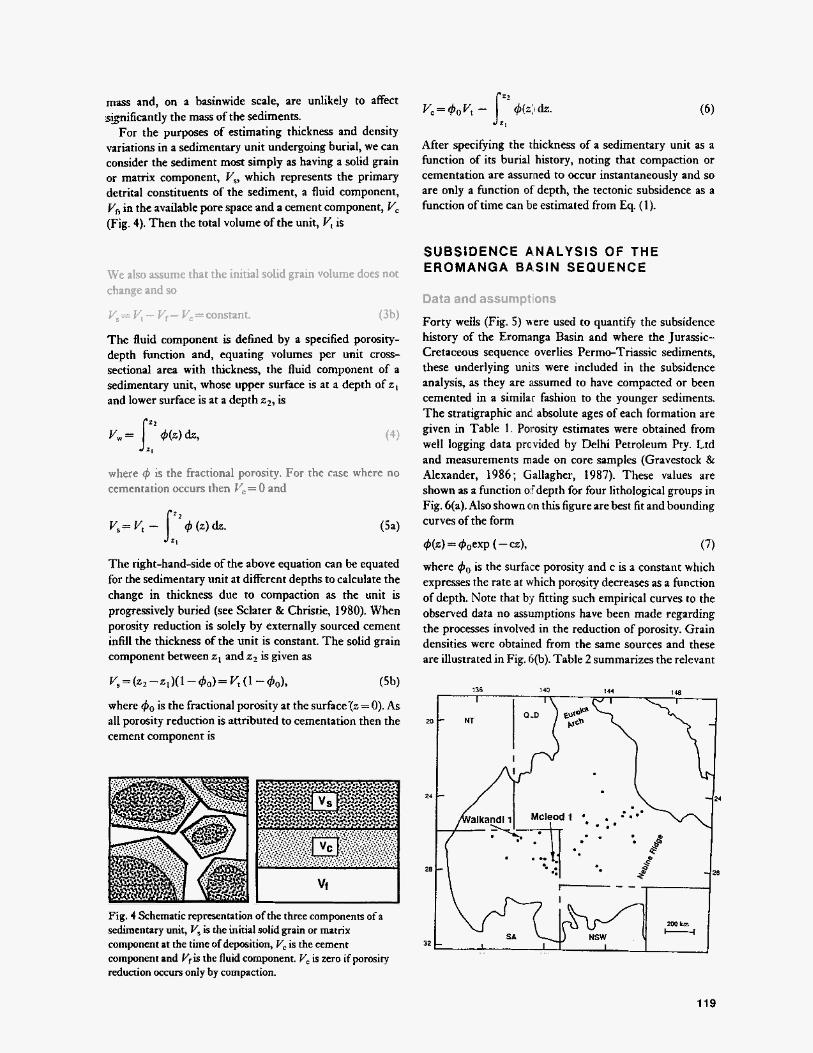
For the purposes of estimating thickness and density variations in a sedimentary unit undergoing burial, we can consider the sediment most simply as having a solid grain or matrix component, V,, which represents the primary detrital constituents of the sediment, a fluid component, Vf, in the available pore space and a cement component, V, (Fig. 4). Then the total volume of the unit, V, is
We also assume that the initial solid grain volume does not change and so
V, = Vt - Vf- V, = constant. (3b)
The fluid component is defined by a specified porosity- depth function and, equating volumes per unit cross- sectional area with thickness, the fluid component of a sedimentary unit, whose upper surface is at a depth of z , and lower surface is at a depth z2, is
(4)
where 4 is the fractional porosity. For the case where no cementation occurs then V, = 0 and
5 2
Vs= V, - [ 4 (2) dz. J 2,
The right-hand-side of the above equation can be equated for the sedimentary unit at different depths to calculate the change in thickness due to compaction as the unit is progressively buried (see Sclater & Christie, 1980). When porosity reduction is solely by externally sourced cement infill the thickness of the unit is constant. The solid grain component between z1 and z2 is given as
vs = (22 -z1)(1- 40) = Vt (1 - 401, (5b)
where 4o is the fractional porosity at the surface-(z = 0). As all porosity reduction is attributed to cementation then the cement component is
Fig. 4 Schematic representation of the three components of a sedimentary unit, V, is the initial solid grain or matrix component at the time of deposition, V, is the cement component and Vf is the fluid component. V, is zero if porosity reduction occurs only by compaction.
After specifling the rhickness of a sedimentary unit as a function of its burial history, noting that compaction or cementation are assumed to occur instantaneously and so are only a function of depth, the tectonic subsidence as a function of time can be estimated from Eq. (1).
SUBSIDENCE ANALYSIS OF THE EROMANGA BASIN SEQUENCE
Data and assumptions
Forty wells (Fig. 5) uere used to quantify the subsidence history of the Eromanga Basin and where the Jurassic- Cretaceous sequence overlies PermeTriassic sediments, these underlying units were included in the subsidence analysis, as they are assumed to have compacted or been cemented in a similar fashion to the younger sediments. The stratigraphic and. absolute ages of each formation are given in Table 1. Porosity estimates were obtained from well logging data provided by Delhi Petroleum Pty. Ltd and measurements made on core samples (Gravestock & Alexander, 1986 ; Gallagher, 1987). These values are shown as a function o.fdepth for four lithological groups in Fig. 6(a). Also shown cin this figure are best fit and bounding curves of the form
44 = 4'oexp ( - (4, (7) where 4o is the surfalie porosity and c is a constant which expresses the rate at which porosity decreases as a function of depth. Note that by fitting such empirical curves to the observed data no assumptions have been made regarding the processes involved in the reduction of porosity. Grain densities were obtained from the same sources and these are illustrated in Fig. 6(b). Table 2 summarizes the relevant
119

K. Gallagher and K. Larnbeck
Table 1. Jurassic and Cretaceous stratigraphic nomenclature in the Eromanga Basin (after Senior er al., 1978; Morgan, 1980; Moore & Pitt, 1984; Vincent er d., 1985 ; Burger, 1986; Moore, 1986; Scheibnerovh, 1986). The numbers in parentheses next to the marine sediments are the assumed palaeobathymetry in metres. The absolute ages of the formation tops were assigned with the Snelling (1985) timescale.
sw Central West Central South Central North Age Approx. max. sw NE (Ma) thickness (m)
Cenomanian Winton Formation (fluvial) Mackunda Formation (fluvial/shallow marine-10 m)
v)
Oodnadatta Fm Allaru Mudstone (shallow marine-30 m) 8
2 Woolridge Lst Urisino Beds Toolebuc Formation (shallow marine-SO m) u Y
Coorikiana Sdst Coreena Member (paralicl ?fluvial) Albian
Aptian Bulldog Shale Doncaster Member (shallow marine-30 m) Wallumbilla Frn
Neocomian Cadna-Owie Formation (fluvial/paralic)
91 95 >loo0 96 200
100 250
101 60 200
113 250 127 100
Late (Murta Mbr) (lacustrine/fluvial) Hooray Sandstone (fluvial) 138 150 Mooga Formation Westbourne Formation
Algebuckina (Namur Mbr) (fluvial) (lacustrinelfluvial) 144 150 U
Sandstone Adori Sandstone (fluvial) 146 100 Birkhead Formation (lacustrinelfluvial) 158 100
'3 2 Middle (fluvial) h
Hutton Sandstone (fluvial) 175 230 Early Poolowanna Beds (fluvial) Basal Jurassic (lacustrine/fluvial) - I86 120
Table 2. Best fit, upper and lower bound values derived for the parameters $o and c in the exponential porosity/ depth function (Eq. 7), and grain density for coarse- and fine-grained sandstone, siltstones and shale.
Lithology Best fit Upper Lower Grain density 40 c 40 c 40 c
(%I (km-') (%) (km-') (%) (km-') p9 (kgm - 3,
Coarse sandstone 42.8 0.614 48.0 0.446 38.0 0.846 2670 Fine sandstone 43.3 0.822 48.0 0.688 38.0 1.128 2670 Siltstone 45.7 1.158 51.0 0.965 41.0 1.310 2680 Shale 50.4 1.616 55.0 1.300. 45.0 1.760 2680
values for each lithology. To calculate the mean density of the sediment, representative values for the fractions of different rock types in each formation were derived from lithology logs.
Palaeo-waterdepths [ H , in Eq. (l)] are only relevant for the marine Cretaceous units. The fauna in these marine sediments are interpreted as being of shallow-water (littoral) affinity, with water .depths of less than 50 m (Morgan, 1980; Scheibnerovh, 1986; McMinn & Burger, 1986). In accordance with the water depths suggested by Scheibnerovh (1986) and the relative variations of water depth proposed by Morgan (1980), a maximum water depth of 50 m was adopted during the time of deposition of the Toolebuc Formation, 30 m during the Wallumbilla Formation and Allaru Mudstone, and 10 m during the Mackunda Formation. The error in the basement sub- sidence associated with water depth is equal to the error in
the water depth. As the sediments are all shallow marine this is likely to be less than about 50 m.
It is generally assumed that sea-level represents the uppermost possible depositional base level during sedimen- tation and variations in this level [H,, in (Eq. l)] may be corrected to maintain a constant datum. The curve of Falvey & Deighton (1982a, b), recalibrated to the Snelling (1985) time scale, was used for the sea-level corrections in this paper. This curve (Fig. 7) is based on the premise that the form of the first-order relative sea-level curve of Vail, Mitchum & Thompson (1977a, b) is correct, but the magnitudes will be closer to the estimates of Watts & Steckler (1979) and Bond (1 978). The Cretaceous high- stand at 78 Ma (Late Cretaceous) is about 200 m above present-day sea-level. More recently, Haq, Hardenbol & Vail (1987) have revised the chronology for the Vail sea- level curve and they suggest that sea-level peaked around
120

Porosity (YO) 10 20 30 40 50
(a ) -
Porosity (x) 10 20 30 40 50
1
2
3
1 - - E
f n
Y - - Q. Q 2 -
3 -
Sandstone I Porosity (YO)
10 20 30 40 50
Siltstone
. . Fine Sandstone
Porosity (%) 10 20 30 40 50
I Shale
the end of the Cenomanian, about 91 Ma. However, even in this curve, the absolute value of sea-level varies only by about 20-30 m up to 75 Ma, at which time the magnitude of the sea-level high is similar to that at 91 Ma. In this paper, the important, consistent feature of these sea-level curves is that a relative high occurred sometime in the mid-late Cretaceous.
The influence of sea-level variations on sedimentation within continental platforms, or interiors, is not obvious, and will certainly depend on the elevation of xhe region relative to the contemporary sea-level. For example, recent (Cenozoic) non-marine sediments in the Chad Basin (Burke, 1976) in Africa are at elevations up to 300 m above sea-level. As the sediments in the Eromanga Basin are all non-marine prior to about 120-1 13 Ma, the only influence sea-level variations would probably have had would be on the drainage direction of the major river systems considered to be controlling deposition. Marine influences are first apparent during deposition of the fluvial/paralic Cadna- Owie Formation, between 127 and 1 13 Ma. For calculating the sea-level correction to the tectonic subsidence then, it was assumed that sea-level at 11 3 Ma (- 60 m for the Falvey and Deighton curve) was the base level and any sea- level fluctuations on the continent are relative to this datum. The implication is that the sea would have had to rise by 6 0 m before it began to encroach into the depositional area on the continent.
In this paper average normalized water loaded [pi = pw
Eromanga Basin subsidence
(b) 50 I
40 i Sandstone EJ Siltstone
Shale
26CO 2640 2680 2720 276C
Density (kg m3)
Fig. 6 (a) Observed porosity/depth relationships for the characteristic lithologies in the Eromanga Basin. The best fit and bounding curves are defined by Eq. (7), with the values in Table 2. (b) Histograms ofsediment grain density.
in Eq. (l)] tectonic subsidence curves are presented to illustrate the main features of the subsidence history, both with and without palaeobathymetry and sea-level correc- tions. Gallagher (1 988) discusses the subsidence history of the region in more detail and includes the data and results from the 40 wells used to calculate the average curves. Wells from different locations around the basin show very similar subsidence trends although the absolute magnitudes of the calculated tectonic subsidence varies by a factor of about 2-3 for the 40 wells used here. The similar form of individual subsidence histories suggests that an average normalized curve provides a valid representation for the form of the tectonic subsidence around the basin. The subsidence curves were calculated separately for the cases where porosity reduction is attributed solely to either compaction or cementation, as described earlier. To calculate an averag;e subsidence curve, we follow the approach of Sleep (1971) where the average tectonic subsidence for the ith sedimentary formation of age t,, normalized by the tectonic subsidence value at a reference time, tn was calculated as
where
121

K. Gallagher and K. Larnbeck
Jurassic I Cretaceous I Tertiary -ma
200 150 1do M 0
Time (Ma) Fig. 7 Global sea-level curve for the iMesozoic relative to present-day sea-level from Falvey & Deighton (1982a, b) with the time-scale of Snelling (1985).
N is the total number of wells and xj is the location of the Jth welL’The 90% confidence limit was calculated using Student’s t-test (Krumbein & Graybill, 1965), i.e.
with tso(N- 1) being the 90% limit of Student’s t density, or distribution, for N-1 degrees of freedom and the sample variance, a’, is given by
The top of the Cadna-Owie Formation was taken as the reference horizon (t, = 1 13 Ma).
Results
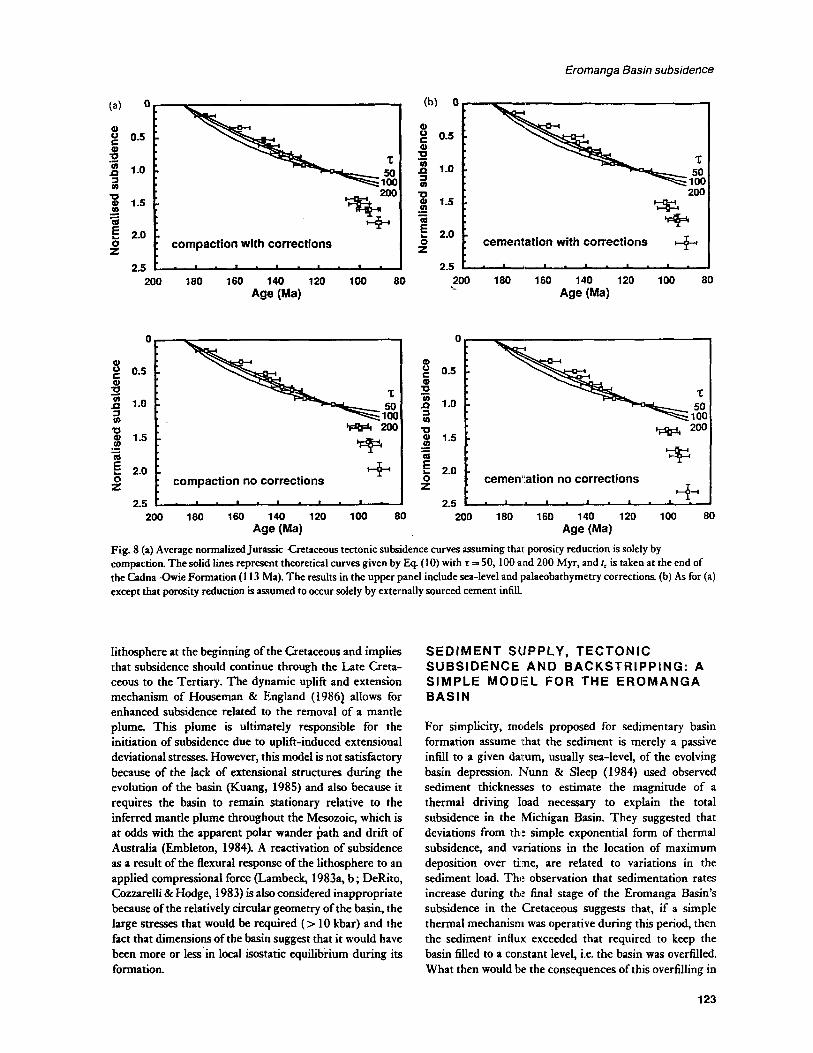
The normalized tectonic subsidence curves for the four cases described above are given in Fig. 8. The vertical error bars represent the 90% confidence limit on the mean as described earlier, and the horizontal error bars represent & 5 Myr in the absolute age. The absolute ages are not tightly constrained and the +S Myr error is arbitrary, serving mainly to emphasize this fact. Also included on these figures are normalized curves of the form
for T = 50, 100 and 200 Myr, to= 186 Myr (the assumed age of the earliest Jurassic unit) and t is age from the present day. This form of subsidence approximates that predicted by thermally controlled subsidence mechanisms (Sleep, 1971 ; McKenzie, 1978) when subsidence com- mences at to and approaches an asymptotic value of He For a single well the value of H, is estimated by fitting a curve of the form given by Eq. (10) to the observed data (note that for the normalized data, the curve is required to have a value of 1 at t-t,). In these formulations the thermal time constant, T, is determined, to first order, by the
thickness of the thermal lithosphere, a (m), and the thermal diffusivity, K (m2 s- ‘), so that
As can be seen from Fig. 8, the differences between the four cases only become significant for ages younger than about 110 Ma but the essential characteristics of the subsidence history are preserved, irrespective of the assumptions made regarding compaction, cementation or sea-level and palaeobathymetry corrections. The observed Jurassic-earliest Cretaceous subsidence phase ( - 186- 120 Ma) is pseudo-exponential or linear, and is consistent with the theoretical curves, suggesting a rhermally driven mechanism. Due to the uncertainties in the absolute ages, however, it is not possible to estimate the appropriate thermal time constant precisely. A time constant between 50 and 200 Myr is possible, although a lower value (50- 100 Myr) is favoured as z = 200 Myr implies a thermal lithosphere some 250 km thick for K = m2 s-* . This may not necessarily be implausible (e.g. Karner, Steckler & Thorne, 1983) but, if subsidence is thermally driven, then it would be expected to have continued noticeably for another 120-150 Myr,asonlyabout 40% ofthesubsidence would have occurred after 100 Myr.
Most significantly, the average tectonic subsidence curves after about 110 Ma are not consistent with the pseudo-exponential or linear form of the Jurassic subsid- ence. The tectonic subsidence curves obtained by backstrip- ping are directly related to the sediment thickness and, after correcting observed sediment thicknesses for porosity reduction, the general trend for the sedimentation rates is to increase towards the ends of the basin’s subsidence history by as much as 10-20 times those during the Jurassic. The late-stage increase in the subsidence and sedimentation rates relative to that expected from a simple exponential form is pervasive in the data and cannot be explained by errors in the assumptions made to obtain the subsidence curves. This feature clearly represents a significant event which needs to be explained in the overall evolution of the Eromanga Basin.
Given that the Jurassic subsidence can be characterized by a pseudo-exponential form, possibly the result of a thermal influence, an explanation for the increased subsidence rate at the end of the basin’s Mesozoic history lies with an additional tectonic influence. Gallagher (1 988) discussed a variety of tectonic mechanisms to account for this late-stage rapid subsidence phase, including deep crustal metamorphism, removal of a dynamic support from under the basin, and a flexural response to applied in-plane forces. However, these mechanisms do not provide adequate explanations without invoking unreasonable physical parameters or being inconsistent with the geological observations. For example, Middleton’s (1978, 1980) deep crustal metamorphism model, while adequately predicting the observed subsidence history up to the mid-Cretaceous requires a rapid doubling in thickness of the thermal
122
Eromanga Basin subsidence
I compaction with corrections
200 180 160 140 120 100 80 Age (Ma)
200
XG k=+
cementation with corrections I-$+
U 1.5 - -
m g 2.0 z
200 180 160 140 120 100 80 c
W + I compaction no corrections cementation no corrections
2.5 200 180 160 140 120 100 80
Age (Ma) Fig. 8 (a) Average normalized Jurassic-Cretaceous tectonic subsidence curves assuming that porosity reduction is solely by compaction. The solid lines represent theoretical curves given by Eq. (10) with T= 50,100 and 200 Myr, and I, is taken at the end of the Cadna-Owie Formation (1 13 Ma). The results in the upper panel include sea-level and palaeobathymetry corrections. (b) As for (a) except that porosity reduction is assumed to occur solely by externally sourced cement infill.
lithosphere at the beginning of the Cretaceous and implies that subsidence should continue through the Late Creta- ceous to the Tertiary. The dynamic uplift and extension mechanism of Houseman & England (1986) allows for enhanced subsidence related to the removal of a mantle plume. This plume is ultimately responsible for the initiation of subsidence due to uplift-induced extensional deviational stresses. However, this model is not satisfactory because of the lack of extensional structures during the evolution of the basin (Kuang, 1985) and also because it requires the basin to remain stationary relative to the inferred mantle plume throughout the Mesozoic, which is at odds with the apparent polar wander path and drift of Australia (Embleton, 1984). A reactivation of subsidence as a result of the flexural response of the lithosphere to an applied compressional force (Lambeck, 1983a, b; DeRito, Cozzarelli & Hodge, 1983) is also considered inappropriate because of the relatively circular geometry of the basin, the large stresses that would be required (> 10 kbar) and the fact that dimensions of the basin suggest that it would have been more or less in local isostatic equilibrium during its formation.
SEDIMENT SIJPPLY, TECTONIC SUBSIDENCE AND BACKSTRIPPING: A SIMPLE MODEL FOR THE EROMANGA BASIN
For simplicity, models proposed for sedimentary basin formation assume that the sediment is merely a passive infill to a given darum, usually sea-level, of the evolving basin depression. Nunn & Sleep (1984) used observed sediment thicknesses to estimate the magnitude of a thermal driving load necessary to explain the total subsidence in the Michigan Basin. They suggested that deviations from the simple exponential form of thermal subsidence, and variations in the location of maximum deposition over time, are related to variations in the sediment load. The observation that sedimentation rates increase during the final stage of the Eromanga Basin's subsidence in the Cretaceous suggests that, if a simple thermal mechanism was operative during this period, then the sediment influx exceeded that required to keep the basin filled to a corstant level, i.e. the basin was overfilled. What then would be the consequences of this overfilling in
123

K. Gallagher and K. Lambeck
the backstripping procedure and the inference of primary tectonic subsidence ?
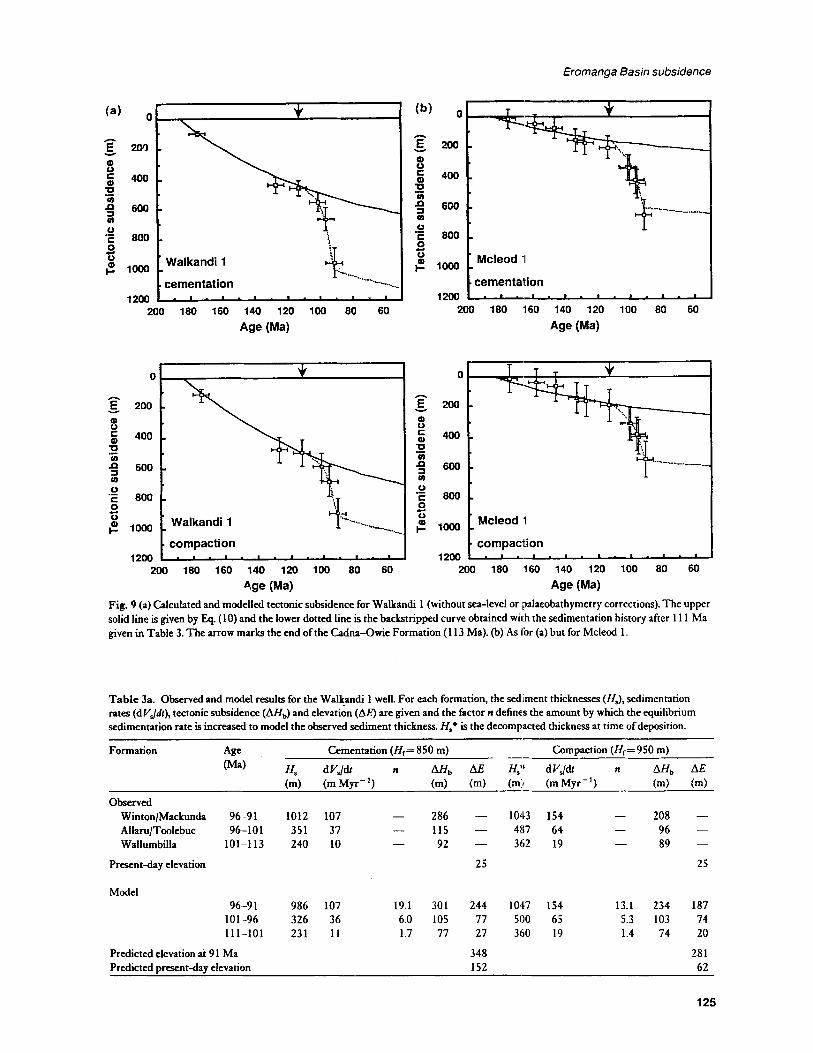
A simple model relating subsidence and excess sediment influx is formulated in the Appendix. Although the relevant calculations were made for all 40 wells, the results for two wells, Walkandi 1 and Mcleod 1 (see Fig. 5), are taken to illustrate the application of the excess sedimentation model to the evolution of the basin. These two wells intersect the Jurassic-Cretaceous sequence in the major depocentre in the central/western region of the Eromanga Basin. The Jurassic-Cretaceous sequence is over 2700 m in Walkandi 1 and over 2100 m in Mcleod 1, with 1600 and 1500 m (respectively) of the total sediment thickness corresponding to the late-stage increase in subsidence rate after the deposition of the Cadna-Owie Formation in the Early Cretaceous. The Jurassic to Cretaceous tectonic subsidence curves for these two wells, without sea-level or palaeoba- thymetry corrections, are shown on Fig. 9 together with the simple theoretical curves of the form given by Eq. (1 0) with T = 100 Myr and to = 186 Myr. The appropriate values of Hr, the asymptotic value for the exponential form of subsidence, are 850-950 m and 300-350m for Walkandi 1 and Mcleod 1 respectively, and the higher values in each case are appropriate for the compaction model results. The large difference in the values between the two wells is due primarily to the fact that in Mcleod 1, over 1500 m of PermianlTriassic sediments underlies the Jurassic-Cretaceous before basement is encountered, whereas in Walkandi 1, there is only 300 m of Triassic sediments, where basement is defined as either an igneous or metasedimentary rock type. As the total sediment thickness above basement was used in the backstripping, then the additional loading effect of the Permian and Triassic sediments in Mcleod 1 results in a reduction in the amount of tectonic subsidence required during the Jurassic and Cretaceous. If the pre-Jurassic sediments were to be ignored then the absolute values of the tectonic subsidence for Mcleod 1 are approximately doubled and the preferred value of Hr would then be about 650-700 m.
Also shown on Fig. 9 are the tectonic Subsidence curves that would be obtained by backstripping when the sedimentation rate was increased such that the observed thickness or, in the case of the compaction models, the decompacted thickness at the time of deposition is reasonably predicted. The models assume that sedimenta- tion is in equilibrium with the tectonic subsidence (Hb(t), calculated from Eq. 10) during the Jurassic and up to the end of the deposition of the Cadna-Owie Formation. Subsequently, over 5- or 10-Myr intervals, the rate of sediment influx (dVJdt), is increased by a factor n relative to the equilibrium value. At each time the resulting sediment thickness, elevation and the backstripped tectonic subsidence (estimated under the usual, but now erroneous, assumption that the basin was filled to sea-level at all times) are calculated as outlined in the Appendix. For these model calculations, the siltstone porosity parameters are used throughout the whole sedimentary sequence, including the underlying Permian and Triassic sediments, but the
resulting tectonic subsidence curves compare well with those obtained using more realistic proportions of each lithology as derived from the lithology logs. The results of the models for Walkandi 1 and Mcleod 1, in both the cementation and compaction cases, are summarized in Table 3.
Obviously it is not difficult to model the observed or decompacted thicknesses in each well and, as the back- stripped tectonic subsidence is directly related to these thicknesses, then the departure from the equilibrium curves can also be satisfactorily modelled. The other model prediction is the elevation in the depositional area. At 91 Ma the predicted elevation for the Walkandi 1 well is 280-350 m and for the Mcleod 1 well is 290-360 m above present-day sea-level, with the higher values in each case corresponding to the cementation model and the lower values to the compaction model. The predicted elevation across the basin at this time, neglecting six wells towards the eastern margin of the basin where erosion has reduced the thickness of the upper part of the section, varies from 170 to 320 m for the compaction case and from 230 to 380 m for the cementation case. The model predictions are not particularly sensitive to the asymptotic value of the tectonic subsidence, H,, and a variation of k 50 m in the assumed value of Hr results in less than k 10 m difference in the predicted elevation at 9 1 Ma.
The assumption made earlier that the basin region must have been 60 m above sea-level until the Early Cretaceous implies that the predicted elevations should be increased by 60 m. Alternatively, the depositional area may have been isolated from the sea and topographically low prior to the Cretaceous or the sea-level curve may be in error and the extra 60 m may be unwarranted. In either case the evolving basin topography would need to be accommodated by the differing elevations of the basin depression and the adjacent basement (cf. the Chad Basin). By the end of the Cretaceous deposition, about 91 Ma, the topography in eastern Australia must have been relatively elevated, as a major volcanic arc that provided the major source region for the sediments in the Eromanga Basin is postulated to have existed near the present-day eastern coast of Queensland. The cessation of sedimentation would have been either the result of a decline in tectonic activity at this margin and/or a change in the drainage direction, associated with the reduced topographic gradients as the depositional area filled up. The subsequent period of non-deposition in the Eromanga Basin during the Late Cretaceous may then also be the result, of the overfilling of the depositional area, with no detrital material being transported into the region.
If thermal tectonic subsidence of the form illustrated in Fig. 9 continued to the present day, then the topography would be reduced by 190-220 m for Walkandi 1 and 70- 80 m for Mcleod 1, implying present-day elevations of 62- 150 -j-- 20 m and 2 10-290 20 m respectively, again for a variation of k50 m in HF These values bracket the predicted present-day elevation across the basin for the other wells around the basin, neglecting those where erosion is considered to have been significant. The predicted
124
Eromanga Basin subsidence
m
400
600
800
1 OW
1 200
(b) 0
h
E 200 Y
a 0 f 400 P m 9 600 m
c 800 0
0 0
.- c.
f 1000
1 200
1 Mcleod -I
cementa'tion L... - - ' * ' - ' - ' I 200 180 160 140 120 100 80 60 200 180 160 140 120 100 80 60
Age (Ma) Age (Ma)
m
m 600 -
compaction 1200 I
200 180 160 140 120 100 80 60
4ge (Ma)
Mcleod 1
1000 1 cpmpaFtiqn . , , , . , , 1200
200 180 160 140 120 100 80 60 Age (Ma)
Fig. 9 (a) Calculated and modelled tectonic subsidence for Walkandi 1 (without sea-level or ipalaeobathymetry corrections). The upper solid line is given by Eq. (10) and the lower dotted line is the backstripped curve obtained with the sedimentation history after 11 1 Ma given in Table 3. The arrow marks the end of the Cadna-Owie Formation (1 13 Ma). (b) As lor (a) but for Mcleod 1.
Table 3a Observed and model results for the Walkandi 1 well. For each formation, the sediment thicknesses (HJ , sedimentation rates (dV,/dr), tectonic subsidence (AHb) and elevation (AE) are given and the factor n defines the amount by which the equilibrium sedimentation rate is increased to model the observed sediment thickness. H,+ is the demmpacted thickness at time of deposition.
Formation Age Cementation (Hf= 850 m) - Compaction (Hf=950 m)
(Ma) H, dVJ& n AH,, AE HIIk dVJ& n A& A.E ( 4 fmMyr-') (m) (m) (m:i fmMyr-') 6-4 ( 4
286 - 1043 154 Observed
208 - 96 - 89 -
- Winton/Mackunda 9 6 9 1 1012 107 - Allaru/Toolebuc 96-101 351 37 - 115 - 4117 64 - Wallumbilla 101-113 240 10 - 362 19 - 92 -
Presentday elevation 25 25
Model 96-9 1 986 107 19.1 301 244 1047 154 13.1 234 187
101-96 326 36 6.0 105 77 500 65 5.3 103 74 111-101 231 11 1.7 77 27 360 19 1.4 74 20
Predicted elevation at 91 Ma Predicted Dresentdav elevation
348 152
28 1 62
125

K. Gallagher and K. Lambeck
Table 3b. As Table 3(a) but for the Mcleod 1 well. ~ ~~~~~
Formation Age Cementation (Hf= 300 m) Compaction (Hf=350 m) (Ma) H, d VJdt n AHb AE H,* dV$dr n AHb AE
(m) (mMyr-') (m) (m) fm) (mMvr-') (m) h) Observed
155 - 73 -
116 -
WintonIMackunda 96-91 858 91 - 224 - 890 128 - Allaru/Toolebuc 96-101 284 28 - Wallumbilla 101-113 397 18 -
- 85 - 411 52 128 - 550 30 -
Present-day elevation 70 70
Model 9 6 9 1 836 91 42.3 243 206 893 128 27.2 185 154
101-96 272 30 13.1 81 67 400 51 10.3 74 60 111-101 389 18 7.2 116 88 551 30 5.7 107 78
Predicted elevation at 9 1 Ma 36 1 292 Predicted present-day elevation 292 21 1
elevations compare with present-day values in the central Eromanga Basin region of 25-150 m. The Lake Eyre region in the extreme west of the basin is currently at, or just below, sea-level, and at the eastern margin the topography rises to over 400 m. This westerly decreasing topographic gradient is thought to be the result of uplifi of the eastern region in the Tertiary, and many of the structures seen in the Eromanga Basin are considered to be the result of Tertiary activity (Moore & Pitt, 1984; Kuang, 1985). Although this episode has complicated the present-day topography, a problem with the model arises in the discrepancy of probably 100-200 m between the predicted and observed elevation for the central region. However, some postdepositional subsidence must have occurred in this region. As only fluvial or shallow-marine environments existed by about 95 Ma, the depositional base level must have been at, or near, the contemporary sea-level. This implies then that, by the Late Cretaceous, the upper surface of the basin would have been 200 f 50 m above present-day sea-level to avoid marine inundation. This assumes the commonly accepted values for the Cretaceous high stand (Bond, 1978; Watts & Steckler, 1979; Harrison et d., 1981, 1983; Falvey & Deighton, 1982% b; Kominz, 1984; Haq eb al., 1987), although the uncertainty associated with these is of the order of 50% (Kominz, 1984).
T o provide an explanation for the postdepositional reduction in the elevation of the Eromanga Basin region, changes in hypsometry associated with continental breakup in the Late Cretaceous (Australian-Antarctic rifting) and during the Tertiary (opening of the Tasman Sea) may be invoked. Such arguments have little physical basis, being predicated on the empirical relationships that presently larger continents have higher mean elevations (Harrison et d., 1981, 1983; Wyatt, 1984, 1986). Alternatively, the form of the theoretical subsidence curves may be inappro- priate. For example, if the depositional base level during the Early Jurassic was more elevated than has been assumed, the initial part of the curve would be steeper and a higher value of Hf would allow for more subsidence to
the present day. Another possibility is that the tectonic subsidence should be parameterized by a linear function of time, rather than an exponential form. Quinlan (1987) suggested that linear subsidence is indeed common in intracratonic basin settings and certainly, the Jurassic part of the subsidence history is equally consistent with a linear form as an exponential model. Continued linear subsidence would then have allowed a greater, and more rapid, reduction in the elevation with time. In geophysical modelling the predicted form of thermal subsidence is dependent on the prescribed boundary conditions. For example, Nakiboglu & Lambeck (1985, Fig. 5b) have shown that nearly linear subsidence can occur when the lithosphere is moving over a mantle heat source. More speculatively, additional subsidence may have occurred as a result of phase changes at depth associated with the pressure increase due to the sediment overburden. Contin- ued cooling of a primary thermal subsidence mechanism, offsetting the increase in temperature due to burial, and increasing pressure under the sediment would thermodyn- amically tend to favour a transition in the gabbo-granulite- eclogite system and an increase in the mean density of the lithosphere. However, this mechanism is best regarded as unsatisfactory, because the stability of these transitions and their reaction kinetics are poorly constrained over geologi- cal timescales (Spohn & Neugebauer, 1978; Mareschal & Lee, 1983; Fowler & Nisbet, 1985), it is unlikely that 1000 m of sediment would drive the required phase changes and the composition of the lower crustlupper mantle, required to test the validity of such a model, remains unknown. Of the mechanisms briefly outlined above, one resulting in linear subsidence is probably the most reasonable explanation for the reduction in elevation in the basin.
DISCUSSION
The final transition to non-marine sedimentation, in spite of the rising global sea-level, and the subsequent lack of Late Cretaceous deposition in the Eromanga Basin region,
126
Erornanga Basin subsidence
has been previously interpreted in terms of broad regional uplift (Bond, 1979 ; Veevers, 1984). The hypsometric arguments subsequently need to infer a period of wide- spread subsidence after the Cretaceous sea-level high to explain the present-day elevation in the basin, but the mechanisms for both the uplift and subsidence are unknown.
The excess sedimentation model outlined above accounts for some of the facies variations observed in the basin which appear to be in conflict with models of global sea-level variations Shallow-marine conditions existed across the Eromanga Basin by the beginning of the Doncaster Member of the Wallumbilla Formation (1 13 Ma). The topographic relief in the Eromanga Basin region must have h e n gentle for the marine inundation and uniform sedimentation to have occurred, on a basinwide scale, in a relatively short time ( < 5 Myr). However, although global sea-level was rising at this time, the sediments became paralic to non-marine. This is attributed to the influx of a large amount of volcanogenic detritus, such that the rate of sediment influx exceeded the rate of sea-level rise. By the end of this first stage of rapid sedimentation, the predicted elevation is 20-100 m above the initial datum. The assumed sea-level high at this time was about 90-100 m (Fig. 7), although these estimates are not well constrained (e.g. Kominz, 1984). The rapid infill would have changed the style of sedimentation, resulting in a shallowing of the water depth and the depositional base level may have ended up above the contemporary sea-level during the Coreena Member time. Subsequently, shallow-marine conditions existed again for about 5 Myr during the Toolebuc Formation-Allaru Mudstone time, although the predicted elevation by the end of this depositional period is 100- 180 m above present-day sea-level compared with a sea- level of about 100-120 m from the Falvey and Deighton curve. Finally, the most rapid period of sediment influx occurred, resulting in about 1000 m of sediment in about 5 Myr and a total elevation of 300-390 m above present- day sea-level. Sea-level was rising towards a maximum of probably about 150-250 m by the mid-late Cretaceous but the elevation in the Eromanga Basin exceeded this level, preventing the sea from encroaching into what is now the middle of the Australian continent. At this time, sedimentation was still occurring under marine conditions to the north of the Carpentaria Basin, although the sediments more proximal to the Eromanga Basin do show the influence of the volcaniclastic detritus (Smart & Senior, 1980; Smart et ul., 1980). The continuity of the sediments and stratigraphy between the Eromanga, Carpentaria and Surat Basins suggests that the depositional areas were connected. The geographical trend of sedimentary facies implies that the sea in fact moved out through the Carpentaria Basin to the north as the elevation in the Eromanga Basin increased. Morgan (1 980), Exon & Burger (1981) and Burger (1986) relate these facies variations to eustatic sea-level variations, but from the above discussion it is suggested that these are more likely to be local effects and a global correlation is not necessary.
In this context, it is worth noting evidence for inferred sea-level variations during the Cretaceous in other areas of the continent. The onshore Canning Basin in Western Australia (see Fig. 1) has up to 100 m of Aptian shallow- marine sediments, equivalent to the Doncaster Member of the Wallumbilla Fonnation in the Eromanga Basin. These marine sediments an: considered to extend as far as 26"s into the Officer Basin (Forman & Wales, 198 1 ;Jackson & van de Graaf, 1981). There are no observations of post- Aptian marine Sediments in these areas, yet marine sedimentation was SI ill occurring in the Eromanga Basin (Toolebuc Formation, Allaru Mudstone). Morgan (1980) considers that erosion has probably removed any onshore evidence of the Albian shale sequence seen in offshore wells in the Canning Basin. In contrast, Forman & Wales (198 l), interpreting the limited offshore data, suggest that the onshore area was not inundated by the sea after the Aptian. However, in the Eulzla Basin to the south of the Officer Basin, marine sedimentation appears to have occurred from at least the Aptian to probably the Late Cretaceous (Lowry, 1976; Jackson & van de Graaf, 1981). The lack of extensive Aptian mwine sediments in the Canning and Officer Basins may therefore be the result of uplift in this area at the time. In the offshore Canning Basin, the apparent sea-level variations (transgression/regreion), inferred by Morgan (1980) and Forman & Wales (1 98 I), occur over durations of less than 10 Myr. These timescales are consistent with a tectonic mechanism, rather than eustaticor global sea-level changes (Bally, 1982 ; Cloetingh, McQueen & Lambeck, 1985). The apparent transgression/ regression cycles in 1 he Eromanga/Surat/Carpentaria Bas- ins in eastern Australia could be an effect, rather than a cause, of the sedimerltological history which is itself related to the tectonic activiry at the continental margin.
C 0 N C L U S I0 N !i The Jurassic and Cretaceous subsidence history of the Eromanga Basin has been examined by standard backstrip- ping techniques, allowing for porosity reduction either by compaction or cementation. The results from forty wells have been averaged and normalized to show the first-order features of the basin's subsidence history (Fig. 8). During the Jurassic (- 18+110 Ma) the subsidence follows a pseudo-exponential or nearly linear trend consistent with a thermally based mechanism. The next 20Myr of the subsidence during the Early Cretaceous is more rapid and nearly 50% of the total sediment thickness was deposited during this interval. This latter period is also marked by the first marine sediments in the basin, coinciding with a time when global sea-level is considered to have been rising. Although first-order global sea-level curves suggest a continual rise up to the Late Cretaceous, the sediments of the Eromanga Basin during the Early Cretaceous show two transgressive-regressive cycles with distinctly volcanogenic sediment sources. The second of these cycles culminates with the deposition of up to 1OOOm of non-marine
127

K. Gallagher and K. Lambeck
sediments by about 91 Ma followed by a lengthy (- 50- Myr) period of nondeposition and chemical weathering.
A simple model has been presented in this paper whereby the equilibrium sedimentation rate, or that required for to keep a tectonically subsiding basin filled to a constant datum, is exceeded. The model predicts sediment thickness and the elevation of the depositional surface. In order to explain the observed sediment thickness by a combination of a simple form of tectonic subsidence (exponentially decaying), the sedimentation rate needs to have increased by up to 45 times the equilibrium value, although the maximum required sedimentation rate is only 150 m Myr-' and is consistent with the observed rates of sedimentation. The elevation in the basin region during the mid-late Cretaceous is predicted to exceed the global sea-level high at the time and the lack of deposition during Late Cretaceous may be attriiuted to reduced topographic gradients and/or a waning of the sediment source. The present-day elevation in the Eromanga Basin region has undoubtedly been complicated by Tertiary structuring, but the model predicts the elevation to be some 100-200 m above that presently observed. This may be attributable to a different form of the primary subsidence (e.g. linear with time) rather than the exponential form adopted for the modelling, or some additional unquantified tectonic subsidence mechanism. Finally, eustatic variations inferred from the sedimentary record in the Eromanga Basin may be, at least in part, the result of variations in the sediment influx into a tectonically subsiding region, rather than a primary global sea-level change.
ACKNOWLEDGEMENTS
The well data used in this work was obtained through Delhi Petroleum Pty Ltd, Adelaide and the Bureau of Mineral Resources, Canberra. K.G. would like to acknowl- edge receipt of an Australian National University PhD scholarship and current funding from an Australian Government National Research Fellowship. Norman Sleep and an anonymous reviewer provided useful comments on the manuscript.
REFERENCES
BALLY, A. W. (1982) Musings over sedimentary basin evolution. Phil. Tram. R.Soc. Lond. A. 305,325-338.
BARTON, P. & WOOD, R (1984) Tectonic evolution of the North Sea basin: crustal stretching and subsidence. G0phys.J. R. astr.
BEAUMONT, C (1978) The evolution of sedimentary basins on a viscxfastic lithosphere: theory and examples. Gophys. 3. R.
BOND, G. (1978) Speculations on real sea-level changes and vertical motions ofcontinents at selected times in the Cretaceous and Tertiary periods Geology 6,247-250.
BOND, G. C (1979) Evidence for some uplifts of large magnitude in continental platforms. Tectomp/ys. 61,285-305.
SOC. 79,987-1022.
astr,soc. 55,471-497.
BOND, G. C & KOMINZ, M. A. ( 1 984) Construction of tectonic subsidence curves for the lower Palaeozoic miogeocline, southern Canadian Rocky Mountains : implications for subsid- ence mechanisms, age of breakup and crustal thinning. Bull. geoL Sot. Am. 95, 155-173.
BROTCHIE, J. F. & S I L V ~ E R , R. (I 969) Crustal flexure. 3. geophys. Res. 74,5240-5252.
BURGER, D. (1986) Palynology, cyclic sedimentation and palace environments in the late Mesozoic of the Erornanga Basin. In : Contributions to the G e o k and Hydrocarbon Potential of the Eromnga Busin (Ed. by D. I. Gravestock, P. S. Moore, T. J. Mount & G. M. Pitt). Spec. publ. geol. Soc. Aust. 12, 53-70.
BURKE, K. (1976) The Chad Basin: an active intra-continental basin. Tectonophys. 36,197-206.
CHADWICK, R k (1986) Extension tectonics in the Wessex Basin, southern England.J.geol. SOL London 143,465-488.
CLOETINGH, S., MQUEEN, H. & LAMBECK, K. (1985) On a tectonic mechanism for regional sea level variations. Earth Planet. Sci. Len. 75, 157-166.
DAMANTI, J. F. & JORDAN, T. E. (1989) Cementation and compaction history of synorogenic foreland basin sedimentary rocks from Huaco, Argentina. BuU. Am. Ass. Petrol. Geol. 73,
DERITO, R. F., COZZARELLI, F. A. & HODGE, D. S. (1983) Mechanism of subsidence of ancient cratonic rift basins. Tectonophys. 94, 141-168.
DUDDY, I. R. (1987) Fission track thermal history assessment of the Eromanga-Cooper Basin: an initial apatite study. In: End of Grant Technical Report, NERDDP project no. 720, Dept. of Primary Industries and Energy, Commonwealth of Australia.
ELLIS, P. L. ( I 968) Geology of the Maryborough I :250 000 sheet area. Q&d. geol Sum. Rep. 26.
ELLIS, P. I.. & WHITAKER, W. G. ( 1976) Geology of the Bundaburg 1 :250 000 sheet area. Qld. G o l . Sum. Rep. 90.
EMBLETON, B. J. J. (1984) Past global settings, continental palaeomagnetism. In: Phanermic Earrh H h n y of Australia. (Ed. by J. J. Veevers), pp. 11-16. Clarendon Press, Oxford.
EXON, N. F. & BURGER, D. (1981) Sedimentary cycles in the Surat Basin and global changes of sea level. Bur. Miner. Res. J . Aust.
EXON, N. F. & SENIOR, B. R. (1976) The Cretaceous of the Eromanga and Surat Basins. Bur. Miner. Res. 3. Aust. Geol.
FALVEY, D. A. & DEIGHTON, I. (1982a) Recent advances in burial and thermal geohistory analysis. J. Aust. Petrol. Expl. Ass. 22,
FALVEY, D. A. & DEIGHTON, I. (1982b) Geohizroty Andysrj. University of Sydney.
FORMAN, D. J- & WALLS, D. W. (1981) Geological evolution of the Canning Basin, Western Australia. Bur. Miner. Res. Bull. 210.
FOWLER, C M. R & NISBET, E. G. (1985) The subsidence of the Williston Basin Can.3. Earth Sci. 22,408-415.
GALLAGHER, K. (1987) Thermal conductivity of sedimentary and basement rocks from the Eromanga and Cooper Basins, South Australia. Exph. Gophys. 18,381-392.
GALLAGHER, K. (1 988) The s u b s i h e history and thennal state of the Eromanga and Cooper Basins. PhD thesis, Australian National University, 225 pp.
GALLAGHER, K. (1989) An examination of some uncertainties associated with estimates of sedimentation rates and tectonic subsidence. Barin Research 2,97-114.
GRAVESTOCK, D. I. (1982) Jurassic to Lower Cretaceous stratig-
8 5 8-87 3.
GO^. GophyS. 6, 153-1 59.
Geophys. 1,33-SO.
65-81.
128

Eromanga Basin subsidence
raphy of the Eromanga Basin, South Australia-Problems and progress in subsurface correlation. In : Eromanga Basin Sympos- ium, Summary Papers (Ed. by P. S. Moore & T. J. Mount), pp. 79-91. Geol. Soc. Aust. and Petrol. Expl. Soc. Aust, Adelaide.
GRAVESTOCK, D. & ALEXANDER, A. M. (1986) Porosity and permeability of reservoirs and caprocks from the Eromanga Basin, South Australia3. Awt. Petrol. Expl. Arc. 24,202-213.
GRAVESTOCK, D. I., MOORE, P. S., MOUNT, T. J. & P m , G. M. (Eds) (1986) Contributions to the geology and hydrocarbon potential of the Eromanga Basin. Spec.publ.geo1. SOC. Aust. 12.
GUIDISH, T. M, LERCHE, I., KENDALL, C G. ST C & O'BRIEN, J. J. (1984) Relationship between eustatic sea level and basement subsidence. Bull. Am. Arc.petro1. Ceol. 68, 164-177.
HAQ, B. U, HARDENBOL, J. & VAIL, P. R. (1987) Chronology of fluctuating sea levels since the Triassic. Science 235, 1156- 1167.
HARRISON, C G. A, BRASS, G. W, SALTZMAN, E. S., SLOAN, J., SOUTHERN, J. & WHITMAN, J. M. (1981) Sea level variations, global sedimentation rates and the hypsographic curve. Earth Planet. Sci. Lett. 54, 1-16.
HARRISON, C G. A., MISKELL, K. J, BRASS, G. W., SALTZMAN, E. S. & SLOAN II, J- L. (1983) Continental hypsography. Tectonics 2,357-377.
HEISKANEN, W. A. & VENING MEINESZ, F. A. (1958) The Earth and its Gravity Field. McGraw-Hill, New York, 470 pp.
VAN HINTE, J. E. (1978) Geohistory analysis-application of micropalaeontology in exploration geology. Bull. Am. Ass. Petrol.
HOUSEMAN, G. A. & ENGLAND, P. C (1986) A dynamical model of lithosphere extension and sedimentary basin foimation. J. geofihys. Res. 9 1,7 19-729.
JACKSON, M. J. & VAN DE GRAAFF, W. J. E. (1 98 1) Geology of the Officer Basin. BulL Bur. Miner. Res. Ceol. Ceophys. 206.
JOHN, B. H. & ALMOND, C S. (1987) Lithostratigraphy of the lower Eromanga Basin sequence in south-west Queensland. 3. Aust. Petrol. Expl. Arc. 27, 196-2 14.
KARNER, G. D., STECKLER, M. S. & THORNE, J. A. (1983) Long term thermc-mechanical properties of the continental lithos- phere. Nature 304,250-253.
KOMINZ, M. A. (1984) Ocean ridge volumes and sea level changes-an error analysis. In: Interregional Unconfmities and Hydrocarbon Accumulatwns (Ed. by J. S. Schlee). Mem. Am. Ass. Petrol. Ceol. 36, 109-127.
KRUMBEIN, W. C & GRAYBILL, F. A. (1965) An hoduct ion to Statistzial Methods in Gology, McGraw-Hill, New York, 475 pp.
KUANG, K. S. (1985) History and style of Cooper-Eromanga Basin structures. +h. Gophys. 16,245-248.
LAMBECK, K. (1983a) Structure and evolution ofthe intracratonic basins of central Australia. Ceophys.3. R. ask. SOC. 74,843-886.
LAMBECK, K. (1983b) The role of compressive forces in intracratonic basin formation and midplate orogenies. Ceophys. Res. Lett. 10,845-848.
LOWRY, D. C (1976) The Eucla Basin. In: Economir Geology of Australia and Papua N ~ z , Guinea, Vol. 3 (Ed. by R G. Leslie, H. J. Evans & C L. Knight). Monogr. Aut. Inst. Min. Metalf. 7,
MARLSCHAL, J. C. & LEE, C-K. (1983) Initiation of subsidence in a sedimentary basin underlain by a phase change. Ce0phys.J. R .
MCKENZIE, D. P. (1978) Some remarks on the development of sedimentary basins. Earth Planet. Sci. Lett. 40,25-32.
MCMINN, A. & BURGER, D. ( 1986) Palynology and palaeoenviron- ments of the Toolebuc Formation (Sensu lato) in the Eromanga
Ce01.62.20 1-222.
95-98.
ask. SOC. 74,689-71 2.
Basin. In : Contributmns to the Ceologv and Hydrocarbon Potential of the Eromanga Buin (Ed. by D. I. Gravestock, P. S . Moore, T. J. Mount & G. &I. Pitt). Spec. publ. geol. Sac. AUSI. 12, 135- 154.
MIDDLETON, M. F. (1 478) The genesis of the Cooper and Eromanga Bacins. PhD thesis, Iiniversity ofSydney, 245 pp.
MIDDLETON, M. F. 1:1980) A model of intracratonic basin formation entailing deep crustal metamorphism. Geophys. J. R.
MOORE, P. S. (1986) Jurassic and Triassic stratigraphy and hydrocarbon poteni:ial of the Poolowanna Trough (Simpson Desert Region) northern South Australia. In: Contributions to the Ceology and Hydrocarbon Potential of the Eromanga Basin (Ed. by D. I. Gravestock, P. S. Moore, T. J. Mount & G. M. Pitt). Spec. publ. geol. Sac. 2 4 ~ t . 12,39-5 1.
MOORE, P. S., HOBDAY, D. K., MAIN, H. & SUN, 2. C (1986) Comparison of selected non-marine petroleum bearing basins in Australia and China.3. Aust. Petrol. Expl. Arcoc. 26,285-309.
MOORE, P. S. & MOUNT, T. J. (Eds) (1982) Eromanga Basin Symposium, Summary Papers. Ceol. SOC. Awt. and Pet. Explor. SOC. Aust, Adelaide.
MOORE, P. S. & PITT, G. M. (1 984) Cretaceous of the Eromanga Basin-Implications for hydrocarbon exploration. J. AUSI. Petrol. Expl. Arcoc. 2,1,358-376.
MORGAN, R. (1980) E.ustasy in the Australian early and middle Cretaceous. Bull. G o / . Sum. NS. W. 27.
NAKIBOGLU, S. M. & LAMBECK, K. (1985) Thermal response of a moving lithosphere over a mantle heat source. 3. geophys. Res.
NUNN, J. A. & SLEEP, N. H. (1984) Thermal contraction and flexture of intracratonic basins: a three dimensional study of the Michigan Basin. G0phys.J. R. astr. SOC. 76,587-635.
PAINE, A. G. L. (1969) Palaeovulcanology of central eastern Queensland. Spec. publ. geol. SOC. AUSI. 2, 183-1 92.
QUILTY, P. G. (1984) Phanerozoic climates and environments in Australia. In : Phant.raoic Earth Histoy of Australia (Ed. by J. J. Veevers), pp. 48-56. Clarendon Press, Oxford.
QUINLAN, G. M. (1987) A survey of subsidence mechanisms in intracratonic basim; and their application to North American examples. In : Sedimentary Basins and Basin Forming Mechanisms (Ed. by C Beaumont & A. Tankard). Mem. Can. Soc. Petrol. Ceol. 12,463-481.
SCHEIBNEROV~, V. (-1986) Marine Cretaceous of the Great Australian Basin-.:oraminifera1 and palynological zones finally reconciled. In: C0;itributions to the Geology and Hydrocarbon Potential of the Eromanga Busin (Ed. by D. I. Gravestock, P. S. Moore, T. J. Mouni: & G. M. Pitt). Spec.publ.geo1. SOC. AUSI. 12,
SCLATER, J. G. & CHRIFTIE, P. A. F. (1 980) Continental stretching: an explanation of post mid-Cretaceous subsidence of the central North SeaJ.geophys. Res. 85,371 1-3739.
SENIOR, B. R., MOND, A. & HARRISON, P. L. (1978) Geology of the Eromanga Basin. Bull. Bur. Min. Res. Ceol. Ceophys. 167.
SLEEP, N. H. (1971) Thermal effects of the formation of Atlantic continental margin; by continental break-up. Ceophys.3. R. as&.
SLEEP, N. H., NUNS, J. A. & CHOU, L. (1980) Platform basins. Ann. Rev. Earth Planet. Sci. 8, 17-34.
SMART, J., GRIMES, K.. G., DOUTCH, H. F. & PINCHIN, J. (1 980) The Carpentaria and Karumba Basins, North Queensland. Bull. Bur. Min. Res. Ceol. Ceophys., 202.
SMART, J. 81 SENIOR, B. R. (1980) JurassicXretaceous basins of northeastern Australia. In: The Ceohgy and Ceophpis of North
US&. SOC. 62,l- 1 4.
90,2985-2994.
115-1 18.
SOC. 24,325-350.
129
K. Gallagher and K. Lambeck
EasternQueensland (Ed. by R. A. Henderson & P. J. Stephenson), pp. 3 15-328. Geol. Soc, Aust. (Qld. Div.), Brisbane.
SNELLING, N. J. (Ed.) (1985) The Chronology of the Geological Record Mem.geo1. SOC. Lond. 10, pp. 343.
SPOHN, T. & NEUGEBAUER, H. J. (1978) Metastable phase transition models and their bearing on the development of Atlantic-type geosynclines. Tectonophys. SO, 387-41 2.
STECKLER, M. S. & WATTS, A. B. (1978) Subsidence of the Atlantic-type continental margin off New York. Earth Planet. Sci. Lett. 41, 1-13.
TURCOTTE, D. L (1980) Models for the evolution of sedimentary basins In : &namicr of Plate Interiors (Ed. by A. W. Bally, P. L. Bender, J. R. McGetchin & R. I. Walcott). Am. Ceophys. Un. Ceodyn.ser. 1,21-27.
VAIL, P. R., MITCHUM, R. M. & THOMPSON, S. (1977a) Relative changes of sea level from coastal onlap. In: Stratigraphic Interpretation of Seismic Data (Ed. by C E. Payton). Mem. Am. Ass. Petrol. &I. 26, 63-81.
VAIL, P. R., MITCHUM, R. M. & THOMPSON, S. (1977b) Seismic stratigraphy and global changes of sea level. In: Stratigraphic Interpretation of Seismic Data (Ed. by C E. Payton). Mem. Am. As$. Petrol. Ceol. 26,83-97.
VEEVERS, J. J. (Ed.) (1984) Phnermic Earth History of Australia. Clarendon Press, Oxford, 4 18 pp.
VINCENT, P. W., MORTIMER, I. R. & MCKIRDY, D. M. (1985) Hydrocarbon generation, migration and entrapment in the Jackson-Naccowlah area, ATP 259P, southwestern Queens- 1and.J Aust. Petrol. Ex#. Ass. 25,62-84.
WATTS, A. B., KARNER, G. D. & STECKLER, M. S. (1982) Lithospheric flexure and the evolution of sedimentary basins. Phd. Trans. R. SOC. Lond. A 305,249-281.
WATTS, A. B. & RYAN, W. B. F. (1976) Flexure of the lithosphere and continental margin basins Tectonophys. 36,2544.
WATTS, A. €3. & STECKLER, M. S. (1979) Subsidence and eustasy at the continental margin of eastern North America. A G U Maurice Emingser. 3,218-234.
WYATT, A. R. (1984) Relationship between continental area and elevation. Nature 311,370-372.
WYATT, A. R. (1986) Post-Triassic continental hypsometry and sea level.Jgeo1. Sac. Lond. 143,907-9 10.
APPENDIX
If a driving mechanism results in a total tectonic subsidence by time t , of Hb(t1) then the total sediment thickness will be, neglecting the sea-level and palaeobathymetry correc- tions, from Eq. (1)
The total thickness of sediment, H, (or VJ, is considered to be comprised ofa solid component, V,, a fluid component, Vw and a cement component, V,. The mean sediment density for the compaction case, for an exponential porosity/ depth relationship (Eq. 7), is given as
and for the cementation case, the mean density is given as
Ps(tl)=Pg-(Pg-Pc) (Po
where p s is the solid grain density and pc is the cement density. In this paper the cement density is set equal to the solid grain density (Gallagher, this issue, discusses the more general situation where this is not the case). If an assumption is made regarding the form of the tectonic subsidence, Hb(tl), then for the case where pi=pw, the expected total sediment thickness, H,(tl) is determined by rearranging Eq. (Al) to give
fexp [ - cH&, 11 - 1)
- Hdtl )(Pm - ~ w ) = 0. (A3)
This can then be solved numerically for Hs(ll). The solid thickness is given from Eq. (5a) for the compaction case
(A44 (PO
VS(t1)=~,(t l )+- {exp [-cH,(t,)]- I } C
and from Eq. (5b) for the cementation case
Vs(t1 ) = HSOl 1 - 40). (A4b)
Given the model assumptions, V&,) is interpreted as the amount of detritus that must be transported into the basin up to time t , for a total thickness of clastic sediment Hs(tl) to accumulate. The sediment is accommodated by the contemporary tectonic subsidence, Hb(tl), and isostatic adjustment under the sediment load. Therefore, Vs( t l ) is defined here as the equilibrium solid influx, or the amount required for sediment to fill the basin to a constant datum, given by &(t= 0). Similarly, V,(At) is the amount of solid influx required to keep the basin filled over the interval At, where
V,(At)= Vs(.t)- Y,(t--At). ('45)
If the integrated rate of sediment influx is less than this value then the basin will be underfilled. Where marine conditions exist, the water depth will increase and the sedimentary facies will change. Conversely, if the influx of sediment over the interval At is greater than the equilibrium value such that
!',*(At) = nV, (A& (A@
then the basin will be overfilled and a total sediment thickness of Hs'(tl) at time t , will result, where
H s + ( t l ) = H s ( t , ) + ~ s (At), ('47)
AH,(At) being the excess sediment thickness relative to the equilibrium value, H,(r,). After increasing the equilibrium sediment influx by a factor n, the total sediment thickness can be estimated from Eqs. (A4a) or (A4b). Using this value of H,*(t,) in backstripping will lead to an erroneous
130
Eromanga Basin subsidence
subsidence curve as the depositional base level is no longer at the assumed datum. In the absence of the palaeobathy- metry and sea-level correction terms, the tectonic sub- sidence is given by
Therefore, the true tectonic subsidence, Hb(t ), is over- estimated by
AHb(At) =Hb*(tl) -Hb(tl) . (A8b)
The excess sediment load will result in isostatic subsidence of
P&l) AH,(tl)=AHs(At) -* 649) P m
As a result of the overfilling the upper surface of the basin reaches an elevation, above the initial base level, of
P -P*(t1) AE,( t , ) = AH,(At) -m , P m
(AlOa)
which evolves with continued tectonic subsidence as
AEs(t) = -A-%(~I 4- Hdl) - Hb(tl 1, (AlOb)
where elevation is considered negative and subsidence to be positive. The mtdel therefore allows predictions to be made of the sediment thickness and the elevation which can be directly compared to observations. The tectonic subsidence is derive:d from the sediment thickness and so is not regarded as an independenr observation or prediction.
131