Subsea Mineral Resources - USGS A Subsea Mineral Resources By V. E. McKELVEY US. GEOLOGICAL SURVEY...
120
Subsea Mineral Resources U.S. GEOLOGICAL SURVEY BULLETIN 1689-A
Transcript of Subsea Mineral Resources - USGS A Subsea Mineral Resources By V. E. McKELVEY US. GEOLOGICAL SURVEY...

Subsea Mineral Resources
U.S. GEOLOGICAL SURVEY BULLETIN 1689-A


Chapter A
Subsea Mineral ResourcesBy V. E. McKELVEY
US. GEOLOGICAL SURVEY BULLETIN 1689
MINERAL AND PETROLEUM RESOURCES OF THE OCEAN
DEPARTMENT OF THE INTERIOR
DONALD PAUL MODEL, Secretary
U.S. GEOLOGICAL SURVEY
Dallas L. Peck, Director
UNITED STATES GOVERNMENT PRINTING OFFICE: 1986
For sale by the Books and Open-File Reports Section, U.S. Geological Survey, Federal Center, Box 25425, Denver, CO 80225
Library of Congress Cataloging-in-Publication Data
McKelvey, V. E. (Vincent Ellis), 1916- Subsea mineral resources.
(U.S. Geological Survey bulletin ; 1689-A)Bibliography: p. 95Supt. of Docs, no.: I 19.3:1689-A1. Marine mineral resources. I. Title. II. Series.QE75.B9 no. 1689-A 557.3s 86-600199[TN264] [553'.09162]

CONTENTS
Abstract 1 Introduction 2Concepts of reserves and resources 3
Definitions 4 Classification 4 Summary 7
Geology of the continental margins and ocean basins 7 Continental margins 7 Deep-ocean basins 8Plate tectonic processes in the origin of subsea geologic provinces 9 Subsea minerals in relation to the continent-ocean framework 9
Marine placers 9Placer minerals 10Geologic environments favorable for the formation of placers 10 Placers in the marine environment 11 World distribution of marine placer deposits 12 Guides to prospecting for offshore placers 13
Offshore sand, gravel, and calcium carbonate deposits 13 Sand and gravel 17 Shell 18Other offshore sources of calcium carbonate 19 Precious coral 20
Phosphorite and guano 21Mineralogy and goechemistry 22 Origin 22 Distribution 24 Guides to prospecting 27
Subsurface hard-mineral deposits of the continental margins 27 Metallic minerals 27 Coal 28Other nonmetallic minerals 28
Manganese nodules and encrustations 29 Chemical composition 30
World and ocean averages 30 Relation to latitude 34 Relation to water depth 35 Metal-rich types of nodules 41
Mineralogy 55 Origin 56
Relation to water depth 57Effects of direct precipitation from seawater in comparison with those
from diagenetic precipitation 57 Relation to regional variation in sediment type, biologic productivity, and
physiography 59 Distribution 61
The Clarion-Clipperton zone 62Other areas containing nickel- and copper-rich nodules 67
Subsea Mineral Resources III

Cobalt-rich encrustations 68Manganese- and iron-rich encrustations 71Feasibility of commercial recovery 72
Ferruginous and manganiferous sediments 73 Metallic sulfide deposits 78
Red Sea metalliferous sediments 78Sulfide deposits on the mid-ocean ridges of the east Pacific 80Sulfide deposits associated with volcanic seamounts 83Analogs on land 83Feasibility of commercial recovery 85Jurisdiction over exploration and production 86
Red clays 86 Radiolarian ooze 88 Barite 88 Seawater 89 Energy in the oceans 89 The Law of the Sea 91
Ocean regimes established by the Convention 92Provisions affecting mineral resources 92Consequences for the United States 94
Acknowledgments 95 References cited 95
FIGURES
1. Tectonic map showing active oceanic ridge systems of the deep-ocean floor with which hydrothermal systems are likely to be associated and where sulfide min erals may have been deposited 3
2, 3. Diagrams showing:2. Classification of mineral resources 53. Resource classification recommended by the UN group of
experts 64. Idealized profile of a continental margin 85. Map showing world distribution of coastal placer deposits 12
6-8. Maps showing heavy-mineral distribution on the:6. Washington-northern Oregon shelf 147. Central Oregon shelf 158. Southern Oregon-northern California shelf 16
9-12. Maps showing:9. Distribution of gravel off the Northeastern United States 18
10. Gravel on the sea bottom off northern New Jersey 1911. Sea-floor materials offshore Washington and northern
Oregon 2012. World distribution of precious coral 21
13. Diagram showing surface currents in an idealized ocean 23 14-16. Maps showing:
14. Distribution of subsea phosphorites 2515. Distribution of phosphate deposits in the Southeastern United
States 2616. Manganese nodule stations in the Scripps Institution of Oceanogra
phy's Sediment Data Bank as of March 1980 31 17-20. Plots showing relations between:
17. Manganese content in manganese nodules and their latitudes 3618. Combined nickel and copper content in manganese nodules and
their latitudes 37
IV Mineral and Petroleum Resources of the Ocean

19. Depth and combined nickel and copper content in manganese nodules 40
20. Depth and cobalt content in manganese nodules 4121-23. Plots showing relations between depth and combined nickel and copper con
tent in:21. Pacific Ocean manganese nodules 4222. Atlantic Ocean manganese nodules 4323. Indian Ocean manganese nodules 44
24-26. Plots showing relations between depth and cobalt content in:24. Pacific Ocean manganese nodules 4525. Atlantic Ocean manganese nodules 4726. Indian Ocean manganese nodules 48
27. Plot showing relation between depth and manganese content in manganesenodules 49
28-32. Maps showing distributions of:28. Manganese nodules containing 1.8 percent Ni+Cu or more 5029. Manganese nodules containing ^1.0 and <1.8 percent Ni+Cu 5130. Manganese nodules containing 1.0 percent Co or more 5231. Manganese nodules containing ^0.5 and <1.0 percent Co 5432. Manganese nodules containing 35.0 percent Mn or more 55
33. Ternary plot of the principal mineral phases of manganese nodules at 107 stations for which all constituents have been analyzed 58
34. Map showing distribution of manganese nodules in the world ocean 6235. Plot showing relation between depth and concentrations of manganese nod
ules 6336. Map showing areas in the northeastern equatorial Pacific Ocean in which man
ganese nodules contain more than 1.8 percent Ni+Cu 64 37-39. Maps showing distributions of:
37. Manganese nodules having high metal contents in the Pacific Ocean 68
38. Manganese nodules having high metal contents in the South Atlantic Ocean 69
39. Manganese nodules having high metal contents in the IndianOcean 70
40-42. Maps showing target areas for exploration for:40. Manganese nodules rich in combined nickel and copper in the cen
tral north equatorial Pacific Ocean 7141. Manganese nodules rich in combined nickel and copper in the
southeastern equatorial Pacific Ocean 7242. Manganese nodules rich in combined nickel and copper in the cen
tral south equatorial Indian Ocean 7343. Plot showing distribution of dissolved manganese and iron in the Black Sea 7644. Schematic cross section of the Nikopol bedded manganese deposits in the Soviet
Union 77 45, 46. Maps showing:
45. Hot brine deeps in the Red Sea 7946. Mid-ocean ridge sites where active hydrothermal circulation and as
sociated massive sulfide deposits have been observed 8047. Geologic sketch map of the southern Juan de Fuca rift valley 8148. Map showing regions of the ocean expected to provide areas geologically suitable
for subseabed waste disposal 87
TABLES
1. Areas of subsea physiographic provinces 8
Subsea Mineral Resources V

2. Placer minerals 113. Composition of phosphorites from various submarine localities 264. World metal contents, nodule concentrations, and depths of manganese
nodules 325. Comparison of the world average metal contents of manganese nodules listed
in table 4 with the values reported by Cronan (1980) 326. Principal metal contents, nodule concentrations, and depths of manganese nod
ules in the Pacific, Atlantic, and Indian Oceans 327. Average principal metal contents of manganese nodules, by ocean 338. Other elements in manganese nodules of the world and of the Pacific, At
lantic, and Indian Oceans 339, 10. Principal metal contents, nodule concentrations, depths, and metal ratios of
manganese nodules, grouped by latitude, in:9. The northern hemisphere 35
10. The southern hemisphere 3511-13. Average and maximum principal metal contents of manganese nodules, cate
gorized by latitude, in:11. The Pacific Ocean 3612. The Atlantic Ocean 3713. The Indian Ocean 38
14. Means of other elements in manganese nodules of the world, grouped by latitude 39
15. Metal contents, nodule concentrations, and depths of metal ratios in manganese nodules in water depths of less than 2,000 and more than 4,000 m 40
16. Principal metal contents of manganese nodules in water depths above and below 3,000 m 43
17. Means of other elements in manganese nodules in water depths above andbelow 3,000 m 46
18-20. Metal contents, nodule concentrations, and depths of manganese nodules con taining:
18. 1.0 percent Ni+Cu or more 4819. 1.0 percent Ni+Cu or more outside the Clarion-Clipperton zone 4920. More than 0.5 percent Co and more than 35 percent Mn 50
21. Other elements in manganese nodules of the world, grouped by combined nickel and copper, manganese, and cobalt contents 53
22. World means and ocean maximums of several other elements in manganese nodules that have exceptionally high concentrations 56
23. Metal contents, nodule concentrations, and metal ratios of manganese nodules in the C-C' area at stations where information on both is available 65
24. Metal contents and metal ratios of manganese nodules in the C-C' area 6525. Metal contents, nodule concentrations, and metal ratios of manganese nodules
in the C-C' area at stations where the nodule concentration is 5 kg/m2 or more 66
26. Partial composition of metalliferous sediments (excluding sulfide facies) of the Red Sea 74
27. Ferruginous and manganiferous sediments at or near oceanic spreading centers 75
28. Chemical analyses of the sulfide facies of Red Sea sediments 8029. Estimates of typical grades and values per ton of contained metals for sea-
floor massive sulfide deposits, compared with typical ore from ophiolite mas sive sulfide deposits and deep-sea manganese nodules 82
30. Elements present in seawater in amounts greater than 1 ppm 89
VJ Mineral and Petroleum Resources of the Ocean

31. Allowable nickel production from deep-ocean nodules under the provisions of the Law of the Sea Convention and U.S. Bureau of Mines forecasts of growth in world demand for nickel 93
32. Comparison of Authority's 25-year income and contractor's internal rate of re turn from a manganese nodule operation under various assumptions 93
Subsea Mineral Resources VII


MINERAL AND PETROLEUM RESOURCES OF THE OCEAN
Subsea Mineral ResourcesBy V. E. McKelvey
Abstract
About 20 nonpetroliferous minerals are produced from the continental margins. Sand and gravel, lime from shells and aragonite mud, precious coral, and placer minerals such as rutile, ilmenite, leucoxene, cassiterite, zircon, monazite, mag netite, gold, platinum, and diamonds are recovered by surface mining. Sulfur and salt are recovered by solution mining through drill holes. Barite is recovered by subsea quarrying. Coal and iron ore are mined underground from entry on adja cent land or from artificial islands. Potash is likely to be pro duced from subsea salt basins, and offshore production of phosphate is being considered in several areas.
The resources of the deep-ocean floor are yet to be devel oped. Those drawing the most interest are manganese nodules and encrustations, metallic sulfide deposits, and red clays.
Manganese nodules are composed chiefly of manganese and iron oxides, but, in places, they are relatively rich in nickel, copper, cobalt, molybdenum, and vanadium. Current com mercial interest is focused on nodules having a combined nickel-copper content of 1.8 percent or more. The most prospec tive area thus far known for such deposits lies in the northeastern equatorial Pacific between the Clarion and the Clipperton fracture zones. The area is about 2.5 million square kilometers in size and contains about 2.1 billion dry metric tons of potentially recover able nodules averaging 25 percent Mn, 1.3 percent Ni, 1 percent Cu, and 0.22 Co. Enough experimental work has been done to indicate that recovery of such deposits is technically feasible when economic conditions become favorable.
Cobalt-rich manganese oxide encrustations on bedrock are widespread on seamounts in the north-central Pacific Ocean and the Hawaiian Archipelago in water depths of 1,000 to 2,500 m. They appear to average about 2 cm in thickness and about 0.9 percent Co, 0.5 percent Ni, 24 percent Mn, and less than 0.1 percent Cu. Although the feasibility of mining the crusts has yet to be demonstrated, several factors lead some to believe that their recovery is closer to being commercially feasible than that of the nodules.
Metallic sulfide deposits are associated with hydrothermal systems along ocean-floor spreading centers. The most promis ing deposits found thus far lie in a series of deep basins along the central rift valley beneath the Red Sea. The largest, the Atlantis II Deep, has an area of about 56 km2 . The upper 10 m of sediments are estimated to contain about 2.9 million tons of Zn, 1 million tons of Cu, 0.8 million tons of Pb, 45,0001 of Ag, and 45 t of Au, worth on the order of a few billion dollars. The Governments of Saudi Arabia and Sudan have been sponsoring
recovery research, and the deposits are expected to come into production during the latter part of this decade.
Sulfide deposits similar to those associated with ophiolite complexes on land have recently been found at seven ridge crest localities in the eastern Pacific. Qualitatively, their com position is similar to that of the Atlantis II deposits, although their zinc content is generally much higher (in the range of 30-60 percent). Sulfide deposits have also been found on flank volcanoes near the crest of the East Pacific Rise. None of these deposits has been sampled enough to support meaningful ton nage estimates. Land analogs range from a few thousand to many millions of tons in size, and such a range can be expected for the subsea deposits also. The feasibility of their recovery has yet to be tested.
Red clays blanket about 30 percent of the deep-ocean floor, and several countries are seriously considering using them in situ for high-level radioactive waste storage. The extensive re search in progress on this possibility has thus far not revealed any unfavorable elements and has identified many favorable ones.
Seawater itself is an important source of some chemicals and several forms of energy. Salt, magnesium compounds, and bromine are recovered now, and potassium, sulfur, boron, and uranium may be recovered in the future. Desalinated seawater is a valuable product in coastal desert areas. Of the ocean's enormous reservoir of energy, only a small amount of tidal energy is now being recovered, but research is underway on the recovery of ocean thermal energy, wave-generated energy, the energy in circulating current systems, and the energy repre sented by the large osmotic pressure difference between fresh water and saltwater.
The 1982 Law of the Sea Convention contains many provi sions governing the development of subsea mineral resources. It assigns to coastal States the right to produce subsea minerals from their Exclusive Economic Zones, which extend 200 nmi seaward from their coasts, and also gives them jurisdiction over the mineral resources of most of their continental margins where they extend seaward of the Exclusive Economic Zones. Minerals beyond these limits of national jurisdiction are to be under the control of an International Sea-Bed Authority. The United States has not signed the Convention but has indicated that it will accept all of its provisions except those governing minerals beyond national jurisdiction.
Subsea Mineral Resources 1

INTRODUCTION
In 1876, Sir John Murray reported the discovery of metal- rich nodules on the deep-sea floor during the voyage of H.M.S Challenger in 1873. Such nodules were of no com mercial interest then, although small subsea mining opera tions had taken place near the shore in earlier times. For example, subsea mines were worked for lead and zinc in ancient Greece at Laurium and for tin and copper in Corn wall (Cruickshank and Siapno, 1985). A coal mine was developed from an artificial island off the coast of Scotland more than 350 years ago. In 1860, a concession was granted to a German firm to mine amber offshore in the Kurisches Haff in the Baltic Sea, an operation that lasted more than 30 years (Beiersdorf, 1972; Glasby, 1982). And, of course, the production of salt by solar evaporation of seawater dates back many centuries. But the possibility of mining deep-sea nodules and other deep-water resources was not even imag ined until the middle part of this century.
Three main series of events spurred interest in marine mineral resources. The first was the successful completion of an oil well in 8 m of water 1 mi offshore Louisiana in 1938. It, as well as several subsequent wells off Louisiana and Texas in the early 1940's, was drilled from a rigid platform set on the ocean bottom, but the success of these wells pointed up the petroleum potential of the continental shelf and led to the 1945 Truman Declaration of U.S. sover eign rights over the mineral resources of the continental shelves. In 1947, completion of the first floating drilling platform extended offshore drilling to deeper water and opened a vast new domain to petroleum exploration and production.
The second series of events stimulating interest in marine minerals began with John Mero's publication of several papers and a small book from 1957 to 1965 calling attention to the considerable potential value of the metals (mainly manganese, nickel, copper, and cobalt) contained in the nodules and the probable feasibility of commerical produc tion. Mero's works led several mining companies to investi gate the nature of the resource and the technology required to develop it and at the same time aroused governmental interest in the question of who should own or control the rights to produce minerals from the seabed beyond the limits of national jurisdiction. Following a speech by Ambassador Arvid Pardo of Malta to the General Assembly of the United Nations in 1967, in which he proposed that such resources be considered the common heritage of all mankind, the United Nations established an Ad Hoc Committee on the Peaceful Uses of the Seabed and the Ocean Floor Beyond the Limits of National Jurisdiction. One of the early actions of that committee was to establish, largely on the initiative of the United States, an International Decade of Ocean Ex ploration. The U.S. contribution to this program, funded through the National Science Foundation, was substantial, as was resource-related research by other U.S. organizations
and those of other nations as well, notably the French Centre National pour 1'Exploration des Oceans, the P.P. Shirshov Institute of Oceanology of the Soviet Union, the Geological Survey of Japan, the Institute of Oceanography of New Zealand, and the Bundesanstalt fur Geowissenschaften und Rohstoffe of West Germany.
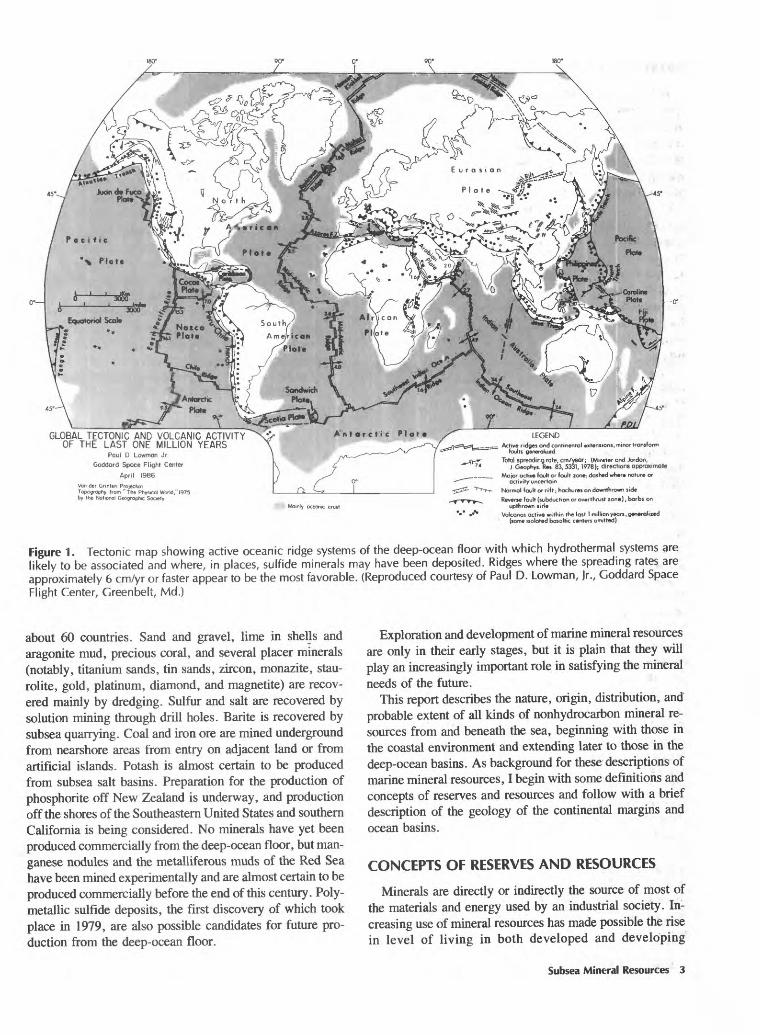
The third series of events stimulating interest in marine minerals was the research leading to the development in the early 1960's of plate tectonic theory, which postulates that the Earth's lithosphere is composed of about 20 moderately rigid, shell-like plates some 80 km thick that are in constant movement with respect to one another and that slide over a partially molten, plastic surface. Plates diverge along the mid-ocean ridge, where new oceanic crust is formed by volcanic and magmatic activity, and converge in the deep- ocean trenches, where cold oceanic crust moves downward beneath the adjacent continent or island arc and is destroyed at about the same rate at which new crust is formed. Plates also move past each other along strike-slip faults. Each of the six largest plates (the Eurasian, North American, South American, African, Indian-Australian, and Arabian plates) (fig. 1) includes continental masses and oceanic crust, which move together as a single plate and thus explain the past movements of the continents that led to the theory of continental drift advanced by Alfred Wegner in 1916 and by others before him. But most of the central evidence for this now widely accepted but still revolutionary theory came not from the continents but from the sea floor for example, Hess's (1948) observations that deep-sea trenches tend to be continuous along the island arcs and are clearly associated with strong seismic activity and volcanism in the adjacent land masses; Ewing and Heezen's (1956) discovery that a steep-walled linear valley occupies the crests of the mid- ocean ridges, which are also the sites of many small earth quakes (Tarns, 1927) and high heat flow (Bullard and oth ers, 1956); Heezen's (1960) recognition that the mid-ocean ridge system is worldwide and dynamic; and Mason and Raff's (1961) discovery of a linear pattern of magnetic anomalies on the sea floor off the western coast of the United States. The synthesis of plate tectonic theory that quickly followed these observations and others by Dietz (1961), Hess (1962), Vine and Matthews (1963), Wilson (1963), and others led to widespread recognition of the importance of marine geology in understanding a host of other phenomena ranging from mountain building to the origin of several kinds of mineral deposits. A deep-ocean drilling program soon won support, as did expanded marine geologic research worldwide.
As a result of these studies, knowledge about marine mineral resources and about the geology of the ocean basins has increased greatly during the last decade or so. Reports from oil and mining companies active in the marine environ ment indicate that much progress has also been made in mineral exploration and production technology. Oil and gas are now being produced from the continental shelves of
2 Mineral and Petroleum Resources of the Ocean
GLOBAL TECTONIC AND VOLCANIC ACTIVITY OF THE LAST ONE MILLION YEARS
Paul D Lawman JrGoddard Space Flight Center
April 1966
Van der Grmten ProjectionTopography from "The Physical World," 1975by the National Geographic Society
isform
LEGEND.___._ Active ridges end continental extensions, n
faults generalized
Total spreading rate, cm/year, (Minster and Jordan,J Geophys. Res 83,5331,1°78); directions approximate
Major active (cult or fault zone; dashed where nature oractivity uncertain
Normal fault or rift; hachures on downthrown side
Reverse fault (subduction or overthrusl zone), barbs onupthrown sirle
Volconos active within the lost 1 million years,generalized(some isolated basaltic centers omitted)
Figure 1. Tectonic map showing active oceanic ridge systems of the deep-ocean floor with which hydrothermal systems are likely to be associated and where, in places, sulfide minerals may have been deposited. Ridges where the spreading rates are approximately 6 cm/yr or faster appear to be the most favorable. (Reproduced courtesy of Paul D. Lowman, Jr., Goddard Space Flight Center, Greenbelt, Md.)
about 60 countries. Sand and gravel, lime in shells and aragonite mud, precious coral, and several placer minerals (notably, titanium sands, tin sands, zircon, monazite, stau- rolite, gold, platinum, diamond, and magnetite) are recov ered mainly by dredging. Sulfur and salt are recovered by solution mining through drill holes. Barite is recovered by subsea quarrying. Coal and iron ore are mined underground from nearshore areas from entry on adjacent land or from artificial islands. Potash is almost certain to be produced from subsea salt basins. Preparation for the production of phosphorite off New Zealand is underway, and production off the shores of the Southeastern United States and southern California is being considered. No minerals have yet been produced commercially from the deep-ocean floor, but man ganese nodules and the metalliferous muds of the Red Sea have been mined experimentally and are almost certain to be produced commercially before the end of this century. Poly- metallic sulfide deposits, the first discovery of which took place in 1979, are also possible candidates for future pro duction from the deep-ocean floor.
Exploration and development of marine mineral resources are only in their early stages, but it is plain that they will play an increasingly important role in satisfying the mineral needs of the future.
This report describes the nature, origin, distribution, and probable extent of all kinds of nonhydrocarbon mineral re sources from and beneath the sea, beginning with those in the coastal environment and extending later to those in the deep-ocean basins. As background for these descriptions of marine mineral resources, I begin with some definitions and concepts of reserves and resources and follow with a brief description of the geology of the continental margins and ocean basins.
CONCEPTS OF RESERVES AND RESOURCES
Minerals are directly or indirectly the source of most of the materials and energy used by an industrial society. In creasing use of mineral resources has made possible the rise in level of living in both developed and developing
Subsea Mineral Resources 3

countries. As usage has increased, concern and controversy have arisen about the adequacy of resources to meet future needs. Much of both the concern and the controversy is caused by a lack of understanding of what mineral resources are and of how supplies are developed. It is especially im portant in considering marine mineral resources to know just what is meant by that term and to have in perspective the difference between mineral deposits that are producible now and those that have some potential for future production but are not yet within economic or technological reach. The discussion that follows begins with definitions of terms and basic concepts and extends to a brief description of the classification of reserves and resources.
Definitions
The term "mineral" has several connotations. As used by the mineralogist, it may refer to a naturally occurring, solid, inorganic substance that has distinctive physical properties and a composition that can be described by a chemical formula. As used by the mineral economist, it may refer to a commercially traded commodity derived from a naturally occurring, nonliving, organic or inorganic, solid, liquid, or gaseous substance. As used to describe resources, it refers to naturally occurring, nonliving, organic or inorganic, solid, liquid, or gaseous substances useful, or believed to be potentially useful, to man. Reference to the mineral re sources of a country or region, for example, would likely be all encompassing and include its water resources, its energy resources (such as coal, gas, petroleum, uranium, and geothermal energy), and its potentially usable deposits of metallic and nonmetallic minerals, such as deposits of fer rous, base, and precious metals, phosphate rock, saline min erals, sand, gravel, and building stone. When specific as pects of mineral resources are discussed, the scope of the subject is generally limited to substances that are commer cially traded. Water resources are thus treated separately, with the exception of brines containing commercially recov erable dissolved salts. Air is not commonly thought of as a mineral resource, but gases recovered commercially from the atmosphere (for example, argon, nitrogen, and oxygen) are counted as minerals in mineral production statistics.
The term "ore" refers to solid substances currently recov erable at a profit. Generally, it applies to explored and developed deposits of metallic minerals, but it is sometimes used to describe producible deposits of a few nonmetallic inorganic minerals such as phosphate or potash.
An important part of the concept of mineral resources is that they have a known or a conceived potential use. Esti mates of resources thus do not represent permanently fixed quantities but may change over time as uses are found for naturally occurring substances previously thought to be worth less and as technologies are devised to recover valuable prod ucts from deposits once considered too lean, refractory, or
inaccessible to have any potential use. To prehistoric man, mineral resources thus would have been limited to flint, salt, water, and rocks that could be used for tools, weapons, or crude construction. By the end of the 19th century, about 30 chemical elements were being used commercially; alu minum was known only in the laboratory, and deposits rich in that element would not have been considered a resource. Today, about 80 elements and 135 mineral commodities are being used commercially hi the United States, and mineral deposits that were once considered worthless, such as taconite (a hard, highly siliceous, iron-bearing rock), are now being produced commercially. Some important marine resources such as manganese nodules and sulfide deposits are prime examples of such "new" resources only recently recognized as having potential commercial value.
Mineral resources (excluding water) have been described as nonrenewable resources, hi contrast to renewable re sources such as surface water and timber, which are or can be replenished naturally or artificially. The geologic proc esses by which most mineral deposits are formed take so long to complete that they cannot be expected to replenish deposits extracted from the ground and dispersed by use. But it is important to recognize that mineral resources can be extended by advancing technology that develops uses for substances not usable before, aids in the discovery of con cealed deposits, improves recovery efficiency, or makes possible the mining and processing of deposits once thought to have no value. The life of mineral resources can also be extended by increased efficiency of use. For example, the card-sized calculator weighing 35 g and costing about $5 in 1985 will perform more functions than the calculating ma chine of 1950 weighing 15 kg and costing $500 or more. Indeed, some of the advanced pocket calculators now avail able have more computing power than the computers of the early 1950's.
Classification
For many commercial and governmental purposes, it is desirable to know the magnitude of specific mineral re sources at a mine site, in a region, in a country, and in the world at large. Over the years, diverse terms and classifica tions have been introduced in recognition of the need to indicate something about the degree of certainty involved in individual estimates of mineral resources. None of these terms or classifications has achieved universality in use, but the terms "proved," "probable," and "possible" and "measured," "indicated," and "inferred" are illustrative of attempts to indicate degrees of certainty in resource esti mates. For many years, estimates were made only of known deposits believed to be recoverable at a profit, but, as ad vancing technology has lowered cutoff grades and shown the power of exploration in discovering new deposits and as mineral shortages have developed or threatened to develop,
4 Mineral and Petroleum Resources of the Ocean
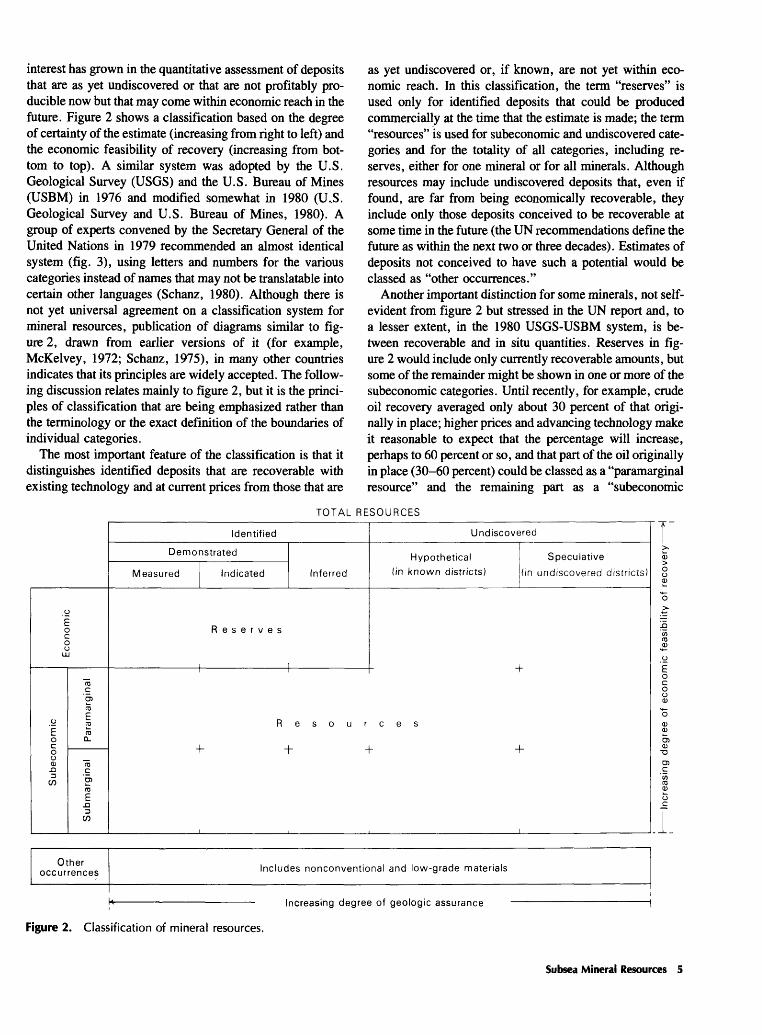
interest has grown in the quantitative assessment of deposits that are as yet undiscovered or that are not profitably pro ducible now but that may come within economic reach in the future. Figure 2 shows a classification based on the degree of certainty of the estimate (increasing from right to left) and the economic feasibility of recovery (increasing from bot tom to top). A similar system was adopted by the U.S. Geological Survey (USGS) and the U.S. Bureau of Mines (USBM) in 1976 and modified somewhat in 1980 (U..S. Geological Survey and U.S. Bureau of Mines, 1980). A group of experts convened by the Secretary General of the United Nations in 1979 recommended an almost identical system (fig. 3), using letters and numbers for the various categories instead of names that may not be translatable into certain other languages (Schanz, 1980). Although there is not yet universal agreement on a classification system for mineral resources, publication of diagrams similar to fig ure 2, drawn from earlier versions of it (for example, McKelvey, 1972; Schanz, 1975), in many other countries indicates that its principles are widely accepted. The follow ing discussion relates mainly to figure 2, but it is the princi ples of classification that are being emphasized rather than the terminology or the exact definition of the boundaries of individual categories.
The most important feature of the classification is that it distinguishes identified deposits that are recoverable with existing technology and at current prices from those that are
as yet undiscovered or, if known, are not yet within eco nomic reach. In this classification, the term "reserves" is used only for identified deposits that could be produced commercially at the time that the estimate is made; the term "resources" is used for subeconomic and undiscovered cate gories and for the totality of all categories, including re serves, either for one mineral or for all minerals. Although resources may include undiscovered deposits that, even if found, are far from being economically recoverable, they include only those deposits conceived to be recoverable at some time in the future (the UN recommendations define the future as within the next two or three decades). Estimates of deposits not conceived to have such a potential would be classed as "other occurrences."
Another important distinction for some minerals, not self- evident from figure 2 but stressed in the UN report and, to a lesser extent, in the 1980 USGS-USBM system, is be tween recoverable and in situ quantities. Reserves in fig ure 2 would include only currently recoverable amounts, but some of the remainder might be shown in one or more of the subeconomic categories. Until recently, for example, crude oil recovery averaged only about 30 percent of that origi nally in place; higher prices and advancing technology make it reasonable to expect that the percentage will increase, perhaps to 60 percent or so, and that part of the oil originally in place (30-60 percent) could be classed as a "paramarginal resource" and the remaining part as a "subeconomic
TOTAL RESOURCES
Identified
Demonstrated
Measured Indicated Inferred
Undiscovered
Hypothetical (in known districts)
Speculative
(in undiscovered districts)
T
Reserves
Resources
+ +
1
Other occurrences Includes nonconventional and low-grade materials
Increasing degree of geologic assurance
Figure 2. Classification of mineral resources.
Subsea Mineral Resources 5

R
In situ resources quantities of economic interest for the next few decades
R-1
Known deposits
reliable estimates
R-2
Extensions of known deposits
and newly discovered deposits-
preliminary estimates.
R-3
Undiscovered deposits tentative estimates
R-1-E R-1-S R-2-E R-2-S
Economically Subeconomic Economically Subeconomicexploitable exploitable
R-1-M
Marginal economic
Figure 3. Resource classification recommended by UN group of experts. Although R denotes resources in situ, r expresses the corresponding recoverable resources for each category and subcategory, such as r-1-E.
resource." In the system recommended by the UN expert group, estimates of in situ versus recoverable resources would be reported separately, as they would be to some extent in the 1980 USGS-USBM scheme. However the dis tinction is made, it is an important one to make for those minerals for which current extraction practice leaves a sub stantial portion in the ground. At least some of the remain der is a resource, and an estimate of its amount establishes a target for advances in extractive technology or an indica tion of amounts that might become available at increased prices.
A good indication of the uncertainty that exists in esti mates, even where discoveries have been made and some exploratory drilling completed, is seen in the National Re search Council (NRC) of the United States (1976) report on gas reserve estimation for offshore producible shut-in leases in the Gulf of Mexico that is, leases on which a commer cial discovery of oil or gas has been made but that are not yet in production. In 1974, because of concerns that Outer Continental Shelf Federal leases were deliberately shut in to raise gas prices, the Federal Power Commission (FPC) esti mated the proved and probable reserves of the 168 leases then classified as producible shut in. The results, showing proved reserves of 4.7 and probable reserves of 3.3 trillion cubic feet of gas, were challenged as being much too conser vative. Accordingly, the NRC was asked to make an inde pendent estimate, using the same USGS data that the FPC had used. The NRC selected 33 leases as a representative
sample of the 168 leases and commissioned two consulting firms to make independent estimates of the gas reserves. Their results indicate that, rather than being too low, the FPC estimates may have been much too high. In the 33- lease sample, the FPC's estimate of both proved and proba ble reserves was 1.5 trillion cubic feet, in comparison with the two consultants' "best" estimates of 0.65 and 0.45 tril lion cubic feet (the consultants also made "high" and "low" estimates that were 18-28 percent lower and 32-45 percent higher than their "best" estimates). The three groups' esti mates of reserves in some individual reservoirs differed by more than an order of magnitude; with few exceptions, the FPC was generally the highest, consultant A generally the lowest, and consultant B generally in between. Because many of the reservoirs are structural traps associated with salt domes, differences in interpreting the extent of reser voirs at this early stage of exploration are understandable, but that such differences were not random indicates that differences in philosophy (possibly born from experience or the lack of it) were significant. In any case, the wide range in gas estimates in discovered and partly explored fields in the Gulf of Mexico made by experts using the same data is indicative of the great uncertainty that necessarily accompa nies estimates of reserves, to say nothing of undiscovered resources. These "estimates" are fittingly described as such, with all the lack of precision implied by that term.
In light of such uncertainty, one may ask if estimates of reserves and resources serve any useful purpose. Obviously, they must be used with the understanding that they are only estimates, subject to a wide margin of error, and they they need to be continually updated as new information is ac quired. But, with that understanding, they show (with re spect to reserves) that there are or are not known deposits that can be mined with existing technology at current prices; they form the basis for commercial sale and purchase of mineral properties and guide plans for mineral development and production; and they provide governments with infor mation bearing on the design of short-term supply policies. Estimates of identified subeconomic resources show whether there are known deposits large enough to justify technological research and development, valuable informa tion for both industry and government. Estimates of undis covered resources show whether there are targets for addi tional exploration, information as essential to government in formulating policy as it is to industry in laying plans to develop future supply.
Estimates made within the framework of the classifica tions illustrated in figures 2 and 3 help to emphasize that the development of mineral resources is a dynamic process (Schanz, 1977) and that the magnitude of usable resources, although limited by a finite Earth (a point that some would not concede, now that space exploration has begun), is not fixed but increases as technology and exploration advance and, of course, decreases through production. The mineral deposits being produced today were once in the category of
6 Mineral and Petroleum Resources of the Ocean

undiscovered subeconomic resources. For most minerals, the measured reserves of tomorrow will come from today's subeconomic or undiscovered categories; for some, they may come from today's other-occurrence category; for still others, they may come from unknown types of deposits that would not even have been listed in 1986 in the other- occurrence category (DeYoung, 1978).
Marine mineral deposits fall into all of the classification categories shown in figures 2 and 3. Measured reserves exist for explored accumulations of oil and gas and several other minerals that are being mined now. The manganese nodules and marine sulfide deposits known on the deep-sea floor are classed as identified subeconomic resources. And, given the fact that subsea exploration for minerals has been small in comparison with the vastness of the area, undiscovered eco nomic and subeconomic resources of all minerals are large for most minerals, probably larger than those al ready identified.
Summary
Mineral resources are naturally occurring solid, liquid, or gaseous substances useful, or believed to be potentially use ful, to man. They are the source of most of the materials and energy used by an industrial society. Mineral resources in clude identified deposits producible under current eco nomic and technological conditions (termed reserves), undiscovered deposits of the same quality (undiscovered economic resources), and known and unknown deposits that cannot yet be produced profitably (identified and undiscovered subeconomic resources). Estimates of the magnitude of mineral resources have low accuracy and can be expected to change over time as the result of fur ther geologic exploration and technological advances that transform undiscovered and subeconomic resources into reserves.
All classes of mineral reserves and resources are repre sented in subsea oil and gas accumulations and other minerals under production, but the known deposits of the deep-ocean floor are in the subeconomic category. For most marine minerals, undiscovered deposits are proba bly far larger than deposits that have already been identi fied.
GEOLOGY OF THE CONTINENTAL MARGINS AND OCEAN BASINS
The solid Earth's surface is essentially composed of two great physiographic provinces the continents and the deep-ocean basins. The continents rise up to mean heights of 4,300 to 5,800 m above the deep-ocean floor. The ocean basins are filled with water, of course more than filled, in fact, for the oceans extend over the margins of the conti nents for distances of a few kilometers to more than 1,300
km. The boundary between the continents and the ocean basins lies beneath the sea at water depths of 2,000 to 4,000m.
These physiographic provinces reflect the fundamental geologic differences between them. The crust forming the continents is richer in silica and the alkalis and poorer in iron and magnesium than the oceanic crust is. The continental crust averages about 35 km in thickness, in comparison with about 7 km for oceanic crust, and its density is less, an average of about 2.7 in comparison with about 3.0 for oceanic crust. The continents and ocean basins are in iso- static equilibrium with the underlying mantle; the lighter continents rise above the ocean basins, much as an iceberg does in the sea.
The configuration of the surfaces of these two great provinces reflects a further contrast in surface-shaping proc esses. Erosion is the dominant process on the continents, whereas sedimentation and volcanism are the dominant surface-shaping processes in the ocean basins.
Although the ocean basins are a great and distinct physio graphic province when contrasted with the continents, they are themselves, like the continents, formed of several dis tinct physiographic features. The areas of the main subsea physiographic provinces are shown in table 1, and their character is briefly described in the following paragraphs.
Continental Margins
The submerged parts of the continents in most places consist of three main physiographic features (fig. 4). A continental shelf borders the land in most places. It is a gently seaward dipping surface that is a continuation of the coastal plain where one is present. The width of the shelf ranges from a few to several hundred kilometers and aver ages about 80 km. The edge of the shelf or shelf break, generally believed to be close to the lowest sea level during the Pleistocene glaciation, averages about 100 to 130 m in depth, but, at high latitudes, where it is believed that the shelves have not fully rebounded from the effects of ice loading, the depth of the shelf break may be at a depth of 300 m or more. At the edge of the shelf, on which the sea-floor gradient is generally less than 1:1,000, the sea- bottom gradient steepens to 1:40 or more and falls along the continental slope to depths of 1,500 to 3,500 m or an aver age at the foot of the slope of about 3,000 m. The shelf and slope together are sometimes called the continental terrace. In some areas, such as offshore California, the continental terrace consists of a series of ridges and basins called the continental borderland.
There are two main forms of continental margins. In the Atlantic or passive type, the continental slope passes rather abruptly into the continental rise, an apron of erosional debris having a seaward gradient of 1:100 to 1:1,000 and a width of 100 to 1,000 km. In the Pacific or active type of
Subsea Mineral Resources 7
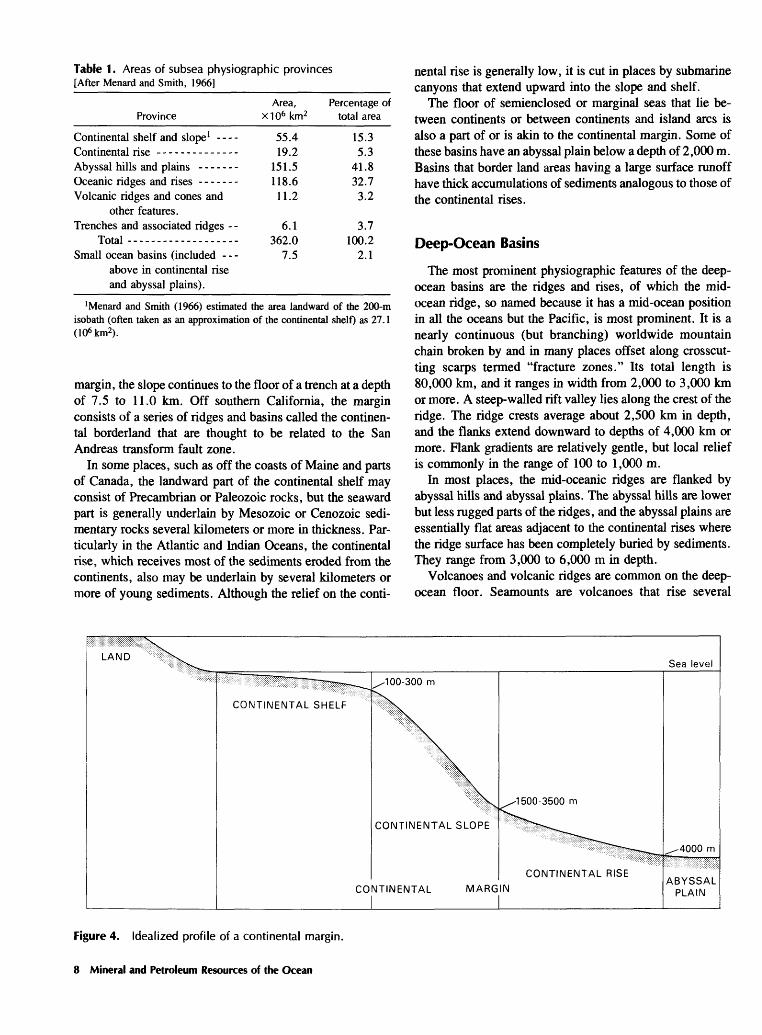
Table 1. Areas of subsea physiographic provinces [After Menard and Smith, 1966]
Province
Continental shelf and slope1 Continental rise --------------Abyssal hills and plains -------
Volcanic ridges and cones and other features.
Trenches and associated ridges - - Total -------------------
Small ocean basins (included - - - above in continental rise and abyssal plains).
Area, xl06 km2
55.4 19.2
151.5 118.6 11.2
6.1 362.0
7.5
Percentage of total area
15.3 5.3
41.8 32.7 3.2
3.7 100.2
2.1
'Menard and Smith (1966) estimated the area landward of the 200-m isobath (often taken as an approximation of the continental shelf) as 27.1 (106 km2).
margin, the slope continues to the floor of a trench at a depth of 7.5 to 11.0 km. Off southern California, the margin consists of a series of ridges and basins called the continen tal borderland that are thought to be related to the San Andreas transform fault zone.
In some places, such as off the coasts of Maine and parts of Canada, the landward part of the continental shelf may consist of Precambrian or Paleozoic rocks, but the seaward part is generally underlain by Mesozoic or Cenozoic sedi mentary rocks several kilometers or more in thickness. Par ticularly in the Atlantic and Indian Oceans, the continental rise, which receives most of the sediments eroded from the continents, also may be underlain by several kilometers or more of young sediments. Although the relief on the conti
nental rise is generally low, it is cut in places by submarine canyons that extend upward into the slope and shelf.
The floor of semienclosed or marginal seas that lie be tween continents or between continents and island arcs is also a part of or is akin to the continental margin. Some of these basins have an abyssal plain below a depth of 2,000 m. Basins that border land areas having a large surface runoff have thick accumulations of sediments analogous to those of the continental rises.
Deep-Ocean Basins
The most prominent physiographic features of the deep- ocean basins are the ridges and rises, of which the mid- ocean ridge, so named because it has a mid-ocean position in all the oceans but the Pacific, is most prominent. It is a nearly continuous (but branching) worldwide mountain chain broken by and in many places offset along crosscut- ting scarps termed "fracture zones." Its total length is 80,000 km, and it ranges in width from 2,000 to 3,000 km or more. A steep-walled rift valley lies along the crest of the ridge. The ridge crests average about 2,500 km in depth, and the flanks extend downward to depths of 4,000 km or more. Rank gradients are relatively gentle, but local relief is commonly in the range of 100 to 1,000 m.
In most places, the mid-oceanic ridges are flanked by abyssal hills and abyssal plains. The abyssal hills are lower but less rugged parts of the ridges, and the abyssal plains are essentially flat areas adjacent to the continental rises where the ridge surface has been completely buried by sediments. They range from 3,000 to 6,000 m in depth.
Volcanoes and volcanic ridges are common on the deep- ocean floor. Seamounts are volcanoes that rise several
CONTINENTAL MARGIN
Figure 4. Idealized profile of a continental margin.
8 Mineral and Petroleum Resources of the Ocean

hundred meters above the ocean floor. Some form islands. Volcanic ridges are generally formed by overlapping volca noes. Guyots or tablemounts are subaerially planed-off vol canoes that have since subsided.
Much of the Pacific basin is rimmed by deep trenches, which are narrow troughs having steep slopes on their land ward sides that range in depth from 7.5 to 11.0 km, in width from 40 to 120 km, and in length from 800 to 5,900 km. Most lie along the seaward sides of island arcs, but the longest (the Peru-Chile trench) lies along the western mar gin of South America.
Plate Tectonic Processes in the Origin of Subsea Geologic Provinces
The geologic provinces of the deep-ocean basins are the result of plate tectonic processes. The lithospheric plates mentioned earlier are pulling apart along the rift valleys at the crests of the mid-ocean ridges, and new oceanic crust is being formed there by the intrusion and extrusion of molten basaltic magma welling up from the mantle. A ridge crest is high relative to its flanks because it is hot and hence lower in density. As hot rock moves away from a spreading center, it begins to cool and contract, and its surface sinks as cool ing and contraction progress. Because rock is a slow con ductor of heat and because the plates are normally thick, the cooling process is a gradual one; about 80 Ma is required for oceanic crust to cool and sink to abyssal depths. The abyssal hills on the lower flanks of the ridges and the abyssal plains adjacent to some continental rises represent cooled and sunken oceanic crust buried beneath an accumulation of sediments.
The volcanic seamount chains on the ridge flanks and deep-ocean floor are the result of volcanic activity at hot spots (relatively stationary magma sources beneath the plates in the upper part of the mantle). Movement of a plate over such a stationary magma source produces a succession of extinct volcanoes such as those comprising the Hawaiian Islands chain. The extinct chain traces the movement of the plate through time, relative to the hot spot.
I mentioned earlier that trenches are the sites where cold oceanic crust plunges beneath another plate to be resorbed by the mantle at depth. Subduction, as the process is called, of oceanic crust beneath island arcs or convergent continen tal margins leads to volcanic activity of both basaltic and andesitic types and plays a major role in the accretion of new continental crust.
Convergence of two plates does not always result in sub- duction along a trench. Where a continental mass lies along the leading edge of converging plates, folded mountains may be the result. The Himalayas are examples of such mountains, formed by the collision of the Indian-Australian and Eurasian plates. Segments of oceanic crust and upper mantle, called ophiolite sequences in some places (in the
Alps, for example), have been incorporated in such moun tains, and, in some places, oceanic crust has been obducted or thrust up on the edge of a continental mass instead of being subducted.
The widest continental margins are generally the Atlantic or passive type formed by plate divergence, and it is only along such margins that continental rises are formed. Active continental margins adjacent to a subducting oceanic plate are typically narrow. Where an oceanic plate subducts be neath another oceanic plate, an island arc eventually devel ops, mainly as the result of volcanic activity caused by the melting of the descending ocean slab and the mantle above it. The back-arc basin or marginal sea between the island arc and the mainland is thus also initially a product of plate tectonic processes and in time may become the site of an other spreading center.
Subsea Minerals in Relation to the Continent- Ocean Framework
Subsea mineral deposits relate in composition and diver sity to the continent-ocean framework just as the physio graphic and geologic features do. Potentially associated with the continental margins is the full variety of minerals found on the continents, even including those that are typi cally associated with mafic as well as felsic igneous rocks. Most such deposits probably would have to be mined by underground or quarrying methods, and it is unlikely that many of them can be produced economically in the foresee able future. Much more promising are minerals typically associated with marine sediments. Subsea deposits already in production, such as oil, gas, sand and gravel, and others previously mentioned, are of this association; for them, the continental margins have a potential that may rival that of the land parts of the continents.
The minerals of the deep-ocean floor are of a much more limited variety mainly metalliferous deposits that are typ ically associated with mafic igneous activity. They include manganese nodules and encrustations, some of which have concentrations of nickel, copper, cobalt, and other metals; metallic sulfide deposits related to hydrothermal activity associated with volcanism along the mid-ocean ridges; and possibly radiolarian ooze and red clay. The metal-rich man ganese nodules of the equatorial Pacific, the cobalt-rich manganese encrustations of the central Pacific, and the metalliferous sulfide muds of the Red Sea deeps are the only deep-sea deposits that seem to have a potential for commer cial production during this century.
MARINE PLACERS
Placer deposits are economically valuable concentrations of heavy minerals (that is, minerals having specific gravities of 2.9 or more, heavier than those of common, rock-forming
Subsea Mineral Resources 9

minerals such as quartz and feldspar). They are residual minerals formed by the weathering of older rocks and sepa ration from lighter clastic particles during transport by wind or water. In addition to being relatively heavy minerals, they are also resistant to chemical weathering and abrasion. Heavy minerals such as metallic sulfides that oxidize rather quickly are not present in most placer deposits, especially those far from their sources. Even magnetite, a mineral prominent in many placers and mined commercially in some, will not withstand long-distance transport, particu larly in tropical or subtropical environments.
Placer Minerals
Twenty or so valuable heavy minerals are found in placers (table 2), but economically significant deposits are common for a much smaller number mainly gold, platinum, cassi- terite, monazite, zircon, xenotime, staurolite, kyanite, dia mond, and the titanium minerals rutile, ilmenite, and leu- coxene (largely titanium oxide formed by the removal of iron from ilmenite by weathering). Production of gold from geologically young placers is thought to have contributed between one-quarter and one-third of the world total, and geologically old fossil placers, such as the Precambrian deposits of the Witwatersrand district of South Africa, have been the world's principal source of gold for some time (Simons and Prinz, 1973). Placer deposits also supply most of the world's tin production in the form of cassiterite (Sainsbury and Reed, 1973); they are the main source of monazite and other rare-earth minerals and the sole com mercial source of zircon; and they are the source of about half of the world's production of titanium, including nearly all of its rutile (U.S. Bureau of Mines, 1982).
Most placer deposits yield more than one mineral, and some placer minerals, such as xenotime, monazite, kyanite, and staurolite, are rarely produced except as byproducts or coproducts of other minerals. A common assemblage con sists of titanium minerals, monazite, zircon, and perhaps kyanite or staurolite; for many such deposits, commercial production would not be feasible without the recovery of several or all of the heavy minerals.
Geologic Environments Favorable for the Formation of Placers
All placer minerals are derived from igneous or metamor- phic rocks or from mineral deposits formed as a result of hydrothermal activity associated with igneous processes. The immediate source for some placer deposits, however, is the reworking of a concentration of heavy minerals in older sediments, but, this exception notwithstanding, a prerequi site for the occurrence of placer deposits is a nearby crys talline terrane. Most gold placers are found within 15 km or so of their source, but placers containing tough minerals
such as ilmenite and rutile or diamond may be scores or even hundreds of kilometers from their sources. But, at least regionally, if not locally, a source terrane must be present.
Tectonic setting broadly controls magmatic activity and the composition of intrusive and extrusive igneous rocks and associated mineral deposits; hence, it broadly controls the composition and distribution of placers. For example, calc- alkaline volcanic igneous rocks are intruded and extruded in subduction-related arcs and are the source of the hydrother mal activity that leads to the formation of gold-bearing quartz veins. The tin-bearing granites of southeastern Asia are also the result of back-arc magmatic activity. Passive margins, on the other hand, are in many places the site of titanium and rare-earth mineral placers (Guild, 1974).
The formation of placers is especially favored by the deep chemical weathering of tropical and subtropical climates, which leads to the breakdown and destruction of most rock- forming silicates and the concentration of the chemically resistant minerals. The degree of concentration that may be involved is illustrated by Van Overeem's (1960) description of the relation between the tin-bearing "Kaksa" (the name given to the layer in which cassiterite is concentrated in valley bottoms) and its source rock on the island of Billiton, Indonesia:
A not very rich Kaksa has a tin content of about 3 percent. The overall tin content of the large block of basement rock enveloping the deep mine of Klappa Kampit is about 0.006 percent. Thus, if all the mineralization of Billiton would have been as intensive as in the Klappa Kampit complex (which is not the case), the rate of concentration would be in the order of 1:500. As the rate of mineralization of the Klappa Kampit area is an extreme one and taking into account the losses of fine-grained cassiterite which have undoubtedly taken place during the process of concentration in the valleys. . ., it can be said safely that thousands of cubic meters of basement rock were disinte grated and carried off to obtain one cubic meter of Kaksa layer.
When tin is selling for $6 or $7 a pound, a deposit con taining 3 percent (60 Ib/ton) is a rich ore indeed, but the concentration of the valuable minerals in placers does not need to be large to make them economically recoverable. For example, primary ilmenite deposits must contain about 10 percent Ti, more than 20 times its average abundance in the Earth's crust. Some of the Florida placers contain only about 0.4 to 0.6 Ti, a little less to a little more than its crustal average. Low-cost mining and beneficiation of unconsoli- dated sands plus coproduct recovery of other minerals make their recovery economic.
Although the occurrence of important placers in areas of present tropical or subtropical weathering is impressive (for example, Florida, Brazil, southwestern Africa, India, Cey lon, Indonesia, Thailand, and Australia), placers are also
10 Mineral and Petroleum Resources of the Ocean

Table 2. Placer minerals
Mineral Composition Specific gravity
Andalusite -------------------------------Al2SiO5Cassiterite -------------------------------SnO2Chromite -------------------------------- Fe +2Cr2O4Columbite-tantalite ------------------------ (Fe, Mn) (Nb, Ta)2O6Corundum -------------------------------A12O3Diamond --------------------------------CEuxenite ------------..--..--.......-.-.--(Y, Ca, Ce, U, Th) (Nb, Ta, Ti)2O6Garnet (almandine) ------------------------ 3FeOAl2O3 -3SiO2Gold ------------------------------------AuIlmenite --------------------------------- Fe +2TiO3Kyanite ---------------------------------- Al2SiO5Magnetite -------------------------------- FeOFe2O3Monazite -------------------------------- (Ce, La, Nd, Th)PO4Platinum --------------------------------- PtRutile ----------------------------------- TiO2Scheelite --------------------------------- CaWO4Sillimanite ------------------------------- Al2SiO5Staurolite -------------------------------- (Fe+2 , Mg, Zn)2Al9(Si, A1)4O22(OH)2Topaz -----------------------------------Ar2SiO4(F, OH)2Tourmaline-------------------------------H9A13(B, OH)2Si4O 19Wolframite -------------------------------(Fe, Mn)WO4Xenotime -------------------------------- YPO4Zircon -----------------------------------ZrSiO4
3.16-3.20 6.8-7.1 4.65.3 -7.3 3.95-4.1 3.54.7-5.0 4.25
15.6-19.3 4.7 3.23 5.24.9-5.3 14-19
4.18-4.25 5.9-6.1 3.233.65-3.77 3.4-3.6 3.0-3.2 5.0-5.5 3.23 4.2-4.86
found at higher latitudes. Some were derived during periods of deep weathering in the Tertiary. Important examples are the gold placers of California, which were derived from Eocene weathering when a subtropical climate prevailed there (Jenkins, 1935). At high latitudes, rapid physical rock disintegration accomplished through frost weathering is also effective in liberating minerals from source terrane. The great placers of British Columbia, Alaska, and eastern Siberia can be traced to this process. Glaciation, however, particularly continental glaciation, makes a negative contri bution to placer formation, for it mixes and hence dilutes rich source materials with the lean on a vast scale. Workable placers, therefore, are rarely derived from drift or even glacial outwash (Jenkins, 1935).
Placers in the Marine Environment
Most of the foregoing observations about placers apply to both continental and marine placers. To focus now on plac ers in the marine environment, two sites are favorable for their occurrence beaches and drowned river channels.
Beginning with the formation of the great ice sheets dur ing the Neogene, sea level has fallen and risen over a total range of about 200 m. During the last major buildup of the ice sheets about 18,000 years ago, sea level was about 130 m below its present level. The transgression that took place with warming was relatively rapid until about 7 ka, at which time sea level was about 10 m lower than it is now;
its rise continues but very slowly (see Kennett's (1982) summary). As a result of these fluctuations, fossil beaches are found in many places both above and below the present level, and river channels are found submerged beneath the sea in many areas.
Beach placers are formed by sorting in the high-energy environment caused by waves breaking on the beach. Light minerals are selectively winnowed away from the heavy minerals. It has been long observed (Raeburn and Milner, 1927) that high waves and a persistent wind direction are favorable for the development of placers on modern beaches. Although the beach environment is a narrow one, a transgressing sea can lead to the formation of a relatively wide deposit over time. The action of strong alongshore currents can lead to the development of beach placers a long distance from their source terrane. In the course of such transport, grain size is commonly reduced, and tough miner als such as rutile and zircon tend to be enriched as chemi cally or physically weaker minerals such as gold and mag netite are destroyed by abrasion, solution, or attrition.
Rivers and streams are probably the best sites for the concentration of heavy minerals (Emery and Noakes, 1968), particularly those that will not stand long-distance transport. The heavy minerals tend to be concentrated with coarse gravel at the bottom of the channel, in places trapped on the surface of bedrock, in cracks or cavities. Submerged river valleys are generally extensions of river valleys on land, but, of course, bottom topographic and perhaps seismic or
Subsea Mineral Resources 11

1(0 120 100 10 (0 40 20 0 20 40 10
\ \ \ \ \
EXPLANATION
Past or prtsent producer
A
Prospect, no known production
Arrow points to offshore producer or prospect
\ \ \ \ \ \ \ICO 140 120 100 »0 tO 40 20 0 20 40 10 10 100 ItO 140 l»0
Figure 5. World distribution of coastal placer deposits (from McKelvey and Chase, 1966). (Reproduced with permission from the Marine Technology Society.)
magentic surveys are required to determine their seaward course.
World Distribution of Marine Placer Deposits
The world distribution of marine placer deposits is shown in figure 5 (see also McKelvey and Wang, 1970; Rowland, 1985). Probably the most valuable offshore placer produc tion in total is that of cassiterite off Burma, Thailand, Malaysia, and Indonesia, mainly in drowned river valleys. Less valuable in aggregate production but more extensive and widespread geographically are beach and offshore de posits of what Emery and Noakes (1968) called the light heavy minerals, which have specific gravities in the range of 4.2 to 5.3 (the titanium minerals, monazite and other rare- earth minerals, zircon, and magnetite); coastal placers, in fact, are the principal sources of all these minerals except magnetite. Important deposits of these minerals, most of which contain several recoverable minerals, are found along the coasts of Brazil, Mauritania, Senegal, Sierra Leone, Kenya, Mozambique, Madagascar, India, Sri Lanka, Bangladesh, China, and the southwestern and eastern coasts
of Australia (see McKelvey and Wang's (1970) world map). Extensive deposits also occur off the eastern coast of Aus tralia, but they cannot be mined economically (Morley, 1981). Along the Konkin coast (west central) of India, ilmenite-rich sands, probably derived from the Deccan Traps (basalt), occur in beaches and bays over a distance of about 200 km (Siddiquie and others, 1979). Extensive de posits of light heavy minerals also containing potentially recoverable gold and cassiterite occur in beach deposits along Egypt's Mediterranean Sea coast (El Gemmizi, 1985).
In the United States, Pleistocene beach placers of light heavy minerals have been mined from South Carolina and Georgia and are being mined now in northeastern Florida. The Florida deposits are in sand bodies as much as 25 km long, 2 km wide, and 10m thick that contain 2 to 4 percent heavy minerals (Pirkle and Yoho, 1970; Pirkle and others, 1974, 1984). Recently, very extensive deposits containing an average of about 3.4 percent heavy minerals have been found offshore southern Virginia at water depths of 10 to 50m (Grosz and Escowitz, 1983), on the basis of grab samples spaced at intervals of 15 min of longitude and 10 min of latitude. Vibracores taken on a recent cruise show
12 Mineral and Petroleum Resources of the Ocean

that these deposits and similar ones off central Georgia extend to a depth of at least 10 ft (U.S. Geological Survey press release, June 28, 1985). In addition, Drucker (1983) has identified six zones of heavy-mineral concentration within the inner New York Bight as having heavy-mineral potential. In the eastern Gulf of Mexico, near Dauphin and Sand Islands, Stow and others (1976) estimated the presence of 23 million tons of light heavy minerals in deposits where they average 1.64 to 1.80 percent. On the Pacific coast, areas favorable for light heavy minerals have been identified by Phillips (1979) and Beauchamp and Cruickshank (1983) and include areas off Grays Harbor, Willapa Bay, and the Hoh River of Washington; the Columbia, Neholem, Silt- coas, and Umpqua Rivers of Oregon; and Crescent City, Calif, (see figs. 6, 7, 8).
As I mentioned previously, magnetite is destroyed early in the weathering process, particularly in tropical and semitropical climates, but titaniferous magnetite is more resistant to weathering. One such deposit containing 12 percent titanium oxides and 56 percent Fe is being mined off the southern coast of Japan's Kyushu Island (Mero, 1965) in 20 to 30 m of water in Ariaki Bay. Other large-scale de posits are known off the western coasts of New Zealand and Luzon (Philippines) and on the northern shore of the Gulf of St. Lawrence.
Diamonds have long been mined from raised beaches along the coast of Namibia, and they were discovered in gravels offshore in 1961. Mining there began a year or so later at water depths of 10 to 40 m but was suspended in 1972 because the rough seas in that area made dredging costly and dangerous. Operations were resumed, however, in 1979 (Cronan, 1980). Dredging for diamonds has also been reported off Brazil (Archer, 1973).
Chromite-bearing beach sands along the southern coast of Oregon were mined during World War II. They are known to occur also on the continental shelf, and the U.S. Depart ment of the Interior Outer Continental Shelf Mining Policy Task Force (1979) reported identified resources there con taining 30 million tons of chromite, 6 million ounces of gold, and 0.35 million ounces of platinum. Chromite plac ers are extensive on beaches and the near offshore of Sulawesi in Indonesia, Luzon and Palawan in the Philip pines, and New Caledonia, where they are derived from ultramatic rocks as the result of deep tropical weathering (B. Lipin, personal communication, 1983).
Gold has been mined from many beach placers (for exam ple, along the coasts of California, Oregon, Washington, and Alaska). Very likely, beach-placer gold has been pretty well depleted, but the high price of gold is stimulating interest in offshore deposits, as the following U.S. Geolog ical Survey (1982) report on current activities in Alaska indicated:
Three widely separated beach and offshore placer gold deposits are at various stages of develop ment. About 20,000 acres in Golovinn Lagoon
approximately 65 miles east of Nome are being tested by Goodwin Resources, Ltd. A $500,000 pilot recovery plant capable of handling 900 tons of sand a day is being built on the beach near Yakataga by Cusac Industries, Ltd., and Alaska Gold Mines, Inc. of Vancouver, British Colum bia. Plans to use a large suction dredge to mine 550 acres of tidal and offshore tracts near Point Woronzof in Cook Inlet adjacent to the Anchorage International Airport have been announced by Cook Inlet Exploration and Development. In the Nome area, State-issued prospecting leases and mining permits extend seaward to the 3 mile limit of State jurisdiction.
Moore and Welkie (1976) described potentially minable metal placers in the coastal Bering Sea, and Tagg (1979) identified nearshore areas on the western side of Kodiak Island; Yakataga, Yakutat, and Lituya Bay in the Gulf of Alaska; and the Bradfield Canal and Gastineau Channel in southeastern Alaska as meriting exploration for gold. Tagg also identified the Cape Prince of Wales area on the western Seward Peninsula as prospective for cassiterite and Good News Bay as prospective for platinum.
Guides to Prospecting for Offshore Placers
The best clues to identifying promising areas for the oc currence of offshore placer deposits are the presence on shore of alluvial or beach placers or the presence in the coastal region of igneous and metamorphic rocks, particu larly in areas of deep chemical weathering. Most of the known offshore placer deposits (for example, the diamonds off Namibia, the cassiterite placers off Indonesia, and the rutile placers off the eastern coast of Australia) have been found on the basis of such clues, and it seems likely that many submerged beach or alluvial deposits remain to be discovered.
Prospecting within generally favorable areas can be aided by using seismic reflection surveys to define buried river valleys and fossil beaches. Magnetometer and radiometric surveys may help to identify buried placers rich in magnetite and radioactive minerals, respectively, although radioactive minerals must be within a few centimeters of the surface to be detectable (Force and others, 1983). Recently, ilmenite placers in Florida have been found to give a strong response to induced polarization (Wynn and Grosz, 1983). Sampling, of course, is necessary to determine the presence of heavy miner als, and drilling is essential to determine the grades, thick nesses, and extents of deposits being considered for mining.
OFFSHORE SAND, GRAVEL, AND CALCIUM CARBONATE DEPOSITS
Construction materials sand and gravel and lime in various forms account for the largest volume of nonfuel
Subsea Mineral Resources 13

124°W
Heavy mineral Opaque percent percent (average)
0.5
6.0
12.0
0-10
10-20
20-30
>30
Percent total "heavy" minerals on Washington- northern Oregon continental shelf. Includes all "heavy" minerals, non-opaque and opaque (black sands) of sand fraction. Heavy minerals greater than 3.15 sp. gr.
Figure 6. Heavy-mineral distribution on the Washington-northern Oregon shelf (reproduced from Phillips, 1979).
mineral production offshore, just as they do on land. The main reason for this large offshore production is that land sources of these materials near coastal cities are becoming depleted. Because transportation costs are high, it is cheaper to turn to offshore sources than it is to attempt to develop
inland deposits. Environmental concerns about onshore quarrying and the growing competition between land users are additional incentives to offshore mining of construction materials. Inasmuch as these trends are likely to continue in the developed countries and to spread to the developing
14 Mineral and Petroleum Resources of the Ocean

124°W
Heavy mineral Opaque percent percent (average)
0-10
10-20
0.5
8.0
12.0
15.0
45'
Rock
Percent total "heavy" minerals on central Oregon continental shelf. Includes all "heavy" minerals, non-opaque (black sands), of sand fraction. Heavy minerals are greater than 2.96 sp. gr.
44'
43° N
Figure 7. Heavy-mineral distribution on the central Oregon shelf (reproduced from Phillips, 1979).
Subsea Mineral Resources 15

124°W
OREGON
Heavy mineral Opaque percent percent (average)
0-10
10-20
20-30
>30
Rock
0.5
8.0
12.0
15.0
Percent total "heavy" minerals en central Oregon continental shelf. Includes all "heavy" minerals, non-opaque (black sands), of sand fraction. Heavy minerals are greater than 2.96 sp. gr.
CALIFORNIA
Heavy mineral isopleth
< l f or no data
1-10
41
40° N»
Figure 8. Heavy-mineral distribution on the southern Oregon -northern California shelf (reproduced from Phillips, 1979).
16 Mineral and Petroleum Resources of the Ocean
ones, the offshore construction materials industry is likely to grow substantially.
Sand and Gravel
Continental runoff is the source of much sea sand, but, except where mountainous areas lie adjacent to the coast, most rivers do not transport gravel to the sea because their gradients are too low. Marine gravels are mainly derived from sea-cliff erosion and, at high latitudes, from glacial or fluvioglacial deposits. Where mountainous areas do lie adja cent to the coast, alluvial gravel may be an important source near river mouths and in submerged channels on the conti nental shelf. Although many offshore deposits were de posited on land when sea level was at a lower stand, strong currents can affect their distribution. For example, in the North Sea, where much is known about the distribution of sand and gravel because of an active offshore mining indus try, the sea bottom tends to be exposed rock where currents are more than about 7.4 km/h. Where currents are between 3.7 and 7.4 km/h, gravel deposits are common; where they are between 2.8 and 3.7 km/h, the bottom is made up of sand. Mud is the rule where currents are less than 2.8 km/h (Anonymous, 1980). Gravel is most common at depths less than 50 m, as are sediments having carbonate contents of more than 10 percent (Glasby, 1982).
World offshore production of sand and gravel much ex ceeds offshore production of other nonfuel minerals both in value and volume (Baram and others, 1978). The U.S. offshore sand and gravel industry is limited to State waters and is poorly developed in comparison with that in Europe and Japan, partly because land resources are still available in most areas and partly because regulations to govern leas ing and production on the federally controlled Outer Conti nental Shelf have never been developed. Sand and gravel are being dredged in State-controlled waters off New Jersey, Connecticut, and Texas, and sand is being dredged off New York, Florida, Mississippi, and California.
Sand and gravel resources on the U.S. Outer Continental Shelf are enormous. Thus, the U.S. Department of the Inte rior Outer Continental Shelf Mining Policy Task Force (1979) estimated resources of sand and gravel off the At lantic and Pacific coasts to be 830 and 29 billion cubic meters, 1 respectively; resources of sand off the gulf and Hawaiian coasts to be 269 and 19 billion cubic meters, respectively; and resources of sand and gravel off the coast of Alaska to be "large."
Gravel off the Atlantic coast is lagely restricted to the northeastern part (figs. 9, 10), where it is of fluvioglacial origin (Schlee and Pratt, 1970). Excellent deposits are known off central New Jersey in water depths of 30 m about 75 km from New York City, in Massachusetts Bay at similar
! lm3 = ~2.lt.
depths only 20 km from Boston, and at an average depth of about 20 m on Nantucket Shoals 150 km from Providence, R.I. The sands of the Atlantic Shelf are quartz rich in the northeast and calcium carbonate rich (shelly) in the south east.
The U.S. Department of the Interior Outer Continental Shelf Mining Policy Task Force (1979) listed numerous gravel deposits off the coast of California, including some in submerged river beds and beaches. Moore and Luken (1979) also identified numerous sand and gravel deposits off the coast of Washington and Oregon in water depths of less than 100 m (fig. 11). The gravel deposits off Washington are believed to be derived from glacial meltwaters during the Pleistocene. Most of the deposits off the coast of Oregon lie near submarine outcrops and are thought to have been formed by wave action at the lower sea levels prevailing during the Pleistocene.
An important use of gravel off the Beaufort Sea coast of Alaska and Canada (Pasho, 1985) will be to serve as artifi cial islands for oil and gas exploration and production plat forms. The Department of the Interior Task Force reported the presence of extensive gravel deposits up to several tens of meters thick beneath an overburden of mud, sand, peat, and clay mixtures of variable thickness. About 5 million cubic meters of gravel is the amount estimated to be required for this purpose, and the task force believed that the offshore and nearby onshore deposits contain considerably greater amounts.
Sand and gravel are in short supply in Hawaii, but the task force reported a potential white sand supply on Penguin Bank off the western coast of Molokai 40 km from Honolulu at water depths of 50 to 60 m. Penguin Bank is a sunken coral reef, and the sand has been derived by erosion of its surface. The volume of sand there is believed to be in excess of 350 million cubic meters. Sand and gravel are also in short supply in many other Pacific islands. A group of 11 island nations in the South Pacific (including the Cook Is lands, Fiji, Guam, Conga, Samoa, Kiribati, the Solomon Islands, Vanatu, and Tuvalu) have asked the USGS for help in finding offshore supplies suitable for their construction industries (McCloy, 1984). In the Virgin Islands and Puerto Rico, where construction sands are in short supply, exten sive offshore sources have been found recently that likely will dominate future production. Two of the deposits found offshore in Puerto Rico, for example, contain about 170 million cubic meters, enough to supply Puerto Rico's con struction industry for about 23 years at the current annual rate of consumption (Rodriguez, 1984).
The most extensive offshore sand and gravel industry is that of Japan. Approximately 1,000 small dredges there produce 60 to 70 million tons of sand and gravel a year, which is 20 percent of Japan's total production. The coun tries of northern Europe (in particular, the United Kingdom, the Netherlands, Denmark, and France) are also substantial
Subsea Mineral Resources 17

Figure 9. Distribution of gravel off the Northeastern United States (reproduced from Schlee and Pratt, 1970).
producers of offshore sand and gravel (Glasby, 1982; Padan, 1983). In total, they produced about 50 million tons in 1976. The leader among them, the United Kingdom, supplied about 15 percent of its own needs in 1980 (Tinsley, 1983) and exported about one-fourth of its offshore produc tion to the Netherlands, France, and Belgium (P. Webb, unpublished manuscript, 1983). In the North Sea, suction dredges mine at depths of up to 36 m. Sand and gravel are also mined offshore Thailand, Hong Kong, and Sydney, Australia.
Although dredging destroys bottom-dwelling organisms, dredges do leave behind undisturbed patches of sea floor between dredge tracks that serve as seeds for repopulation. A study of a dredged channel near Le Havre, France, showed that recolonization took place rapidly. Fish are not
harmed by dredging; in fact, fish reportedly follow along to i feed on sand fleas and worms that are uncovered by the disturbance at the draghead (Moore and Luken, 1979).
Shell
Offshore shell banks composed chiefly of calcium car bonate are an important source of construction aggregate, poultry grit, and lime in areas where limestone is scarce or lacking onshore. Iceland, for example, has no onshore source of lime and depends on a deposit of shell sand about 10 mi off its western coast. The sea bottom to the west of the deposit is relatively shallow and rocky and has a rich growth of mollusks. During the winter months, storm waves break up the shells and carry them into a depression in Faxa
18 Mineral and Petroleum Resources of the Ocean

40° 00'
:m:mt-
<z^m% C~ w " '- . ". ".' ' '.'' ''
.^;^?X,::^.;; ::;::.x;;:sii;
l^ifSSKi
NEW JERSEY
+&&X( $ma v^ XS^: M
x;
Wxi'*?* : . . -: :: .
ItiH ISSilrSr
*:::;;;; ^V// X
74°30'10 NAUTICAL MILLS
73 e OO'
EXPLANATION
Sample location
Sand
Pebbly Sand
MAXIMUM PEBBLE SIZE
o64-32mm
O32- 16mm
O16-8mm
O8-4mm
Boundary of limonite stained sediment
66
Submarine contours showing depth in feet
Figure 10. Gravel on the sea bottom off northern New Jersey, delineated by John Schlee and others in joint studies undertaken by the U.S. Geological Survey and Woods Hole Oceanographic Institution, may find an important market in nearby urban areas (Schlee, 1964). (Reproduced with permission from Pit and Quarry.)
Bay, so that the deposit is self-renewing (Mero, 1965). Oyster shells have been dredged from San Francisco Bay in California for the manufacture of cement, and shell is also mined offshore Texas, Louisiana, Alabama, Florida, and the Netherlands. Extensive accumulations of shell are also known off California's Santa Cruz, Santa Rosa, and San Miguel Islands (U.S. Department of the Interior Outer Con tinental Shelf Mining Policy Task Force, 1979), off Wash ington and Oregon (Moore and Luken, 1979), and off the
Isle of Man in the Irish Sea (Cronan, 1980) and doubtless will be found in many other places if local needs stimulate prospecting.
Other Offshore Sources of Calcium Carbonate
Extensive deposits of high-purity aragonite mud and sand, possibly between 50 and 100 billion tons, occur on the broad shelf areas surrounding the Bahama Islands. One of the areas is the site of a dredging operation producing
Subsea Mineral Resources 19

124°00' 124°00'
Figure 11 . Sea-floor materials offshore Washington and northern Oregon (from Moore and Luken, 1979). Contours are in meters. (Reproduced with permission from Oregon Geology.)
several hundred thousand tons a year for export to the United States. It is 35 km long, 4 km wide, and about 6 m thick and contains about 1 billion metric tons (Baram and others, 1978). Lithothamnia, a calcareous algae, is dredged off northwestern France. Coral sands have been produced off Hawaii and Fiji. The coral reefs off the coasts of many tropical islands are a potential source of lime and aggregate and, for some, may be the only economic source of those materials.
Calcareous ooze, mainly Globigerina ooze, covers about 128 million kilometers of the ocean floor at an average depth of 3,500 m (Mero, 1965). Although Mero pointed out that calcareous ooze would make a good cement rock and could be mined easily with a hydraulic dredge, it will be many years before serious consideration is given to deep-ocean mining of calcium carbonate, if ever.
Precious CoralSeveral species of coral produce skeletons that have long
been valued for their use in making jewelry. Unlike the soft
and porous coral that forms reefs, precious coral is dense and hard and takes a high polish. In ancient times, the principal source was the Mediterranean Sea, but it was dis covered in Hawaii in 1957, and it has since been found off the Bonin Islands near Japan, off Okinawa, and in several other localities in the western Pacific (fig. 12). In Hawaii, black coral occurs at depths of about 30 to 100 m, and the pink, red, gold, and bamboo varieties range from depths of about 350 to 500 m. In the Mediterranean, red coral occurs at depths ranging from about 10 to 275 m (Grigg, 1979). The deep Hawaiian coral beds are harvested by a sub mersible; elsewhere, a dragnet has been used. Shallow beds are harvested by scuba divers.
Precious coral ranges in value from about $100/kg for black to about $l,500/kg for "angelskin" pink coral. Grigg (1979) estimated the output of the world precious-coral jew elry industry to be worth about $500 million a year and implied that the value of the raw coral itself would be about one-tenth that amount.
20 Mineral and Petroleum Resources of the Ocean

Shaded tint shows approximate area of reef-building coral
Known precious coral beds
Black coral
o Bamboo coral x Red and pink corals A Gold coral
Figure 12. World distribution of precious coral (after Grigg, 1979). (Redrawn with permission of the National Geographic Society Cartographic Division.)
PHOSPHORITE AND GUANO
Phosphorus is an essential component of every living cell, and it plays several fundamental roles in metabolic proc esses (Albaum, 1952). It is required for the synthesis of starch, is an integral part of nucleic acids, may be essential to photosynthesis, is a major constituent of bone and teeth, and is important in the shell or the shell-forming processes of many organisms. Conversely, biologic processes influ ence the distribution of phosphorus and are responsible for its concentration in some deposits. Among the major plant nutrients, phosphorus is one of the less abundant in most soils, and its availability is one of the most critical factors controlling plant growth.
Most virgin soils in temperate climates contain enough phosphorus to support good plant growth, but many soils in tropical climates are deficient in phosphorus because it has been leached out by advanced chemical weathering. Phosphorus can be added to deficient soils in the form of natural or artificial fertilizers; for sustained good yields, it must be added to all soils when they are cropped heavily for long periods. Phosphate fertilizers are used exten sively now in the developed countries, but, in many of the less developed countries, their use must be much in creased to bring crop production to acceptable levels. Phosphorus is used in the manufacture of detergents and
many other chemicals, but, in the United States, about 87 percent of its consumption is as fertilizers. Phosphate consumption has been growing steadily, more than tripling in the United States from 1958 to 1979, and is expected to continue to do so.
Phosphorus is concentrated in certain igneous processes, in particular in the intrusion of alkalic complexes, but more than 80 percent of world phosphate production comes from phosphorites or phosphatic sedimentary rocks. Phosphorites are marine sedimentary rocks rich in the mineral carbonate fluorapatite (Ca10 (PO4-CO3)6F2-3), also called francolite. Guano deposits are mainly accumulations of sea-fowl drop pings on islands at low latitudes, although smaller quantities are formed by bats and other cave-dwelling mammals and birds.
Although phosphorite has been known subsea since it was dredged from the Agulhas Plateau off South Africa by the Challenger expedition in 1873 (Murray and Renard, 1891), mining it in the marine environment is just now beginning. Until now, of course, land deposits have been adequate to meet demands, but interest in subsea deposits is likely to increase as land deposits are depleted. Of particular interest will be unconsolidated nearshore deposits in shallow water that can be mined by existing dredging techniques and that are close to agricultural areas far removed from land de posits. Eventually, borehole mining may be used to mine
Subsea Mineral Resources 21

deeply buried deposits such as those off the Southeastern United States.
Mineralogy and Geochemistry
Phosphorus is the eleventh most abundant element in the Earth's crust. Because it averages only about 0.12 percent, however, it is classed as a trace element. Even so, it is a rock-forming element, both in the sense that it is a con stituent of most rocks and in the sense that some rocks are composed mainly of phosphorus-bearing minerals.
About 200 minerals are known to contain 1 percent P2O5 or more. Most of the phosphorus in the Earth's crust, how ever, occurs in species of the apatite group. The structure of apatite favors a wide variety of minor substitutions (McConnell, 1938). For example, small amounts of VO4 , As2O4 , SO2 , SO4 , or CO2 can substitute for equivalent amounts of PO4 , the F position can be partly or completely occupied by Cl or OH, or minor amounts of Mg, Mn, Sr, Pb, Na, U, Ce, and Y and other rare earths can substitute for Ca. The composition of apatite deposits, therefore, may change on exposure to solutions whose compositions are different from those from which they were deposited. One characteristic change is the substitution of fluorine for hy- droxyl in teeth and bone. It was this phenomenon that was used to demonstrate that the bones of "Piltdown Man" were modern rather than ancient (Oakley, 1955).
Because phosphorus in the lithosphere occurs only in the quinquevalent state, its solubility is not affected by the re- dox potential of the environment. The solubility of apatite, however, is strongly influenced by pH; it is slowly soluble in neutral and alkaline waters below a pH of about 7 to 8, and its solubility increases with increasing acidity, decreas ing hardness, and decreasing temperature. Apatite is less soluble than calcium carbonate and may form a residual concentrate on the weathering of a phosphatic limestone. In subtropical or tropical climates, apatite itself is eventually destroyed by weathering; some phosphorus may be rede- posited in the form of aluminum phosphate minerals such as wavellite.
Fresh sea-fowl droppings contain about 22 percent N and 4 percent P2O5 . Decomposition proceeds rapidly, and the phosphate content increases as the nitrogen and total organic matter content decrease. The mineralogy of partly decom posed guano is complex, but largely decomposed guano consists mainly of calcium phosphates such as monetite (HCaPO4) or brushite (CaHPO4-2H2O) and contains 20 to 32 percent P2O5 . In areas where rainfall occurs, the rela tively soluble phosphates of decomposing guano are carried to underlying rocks, where they may be deposited as cavity fillings or replacements. The mineralogy of phosphatized rock depends on the composition of the host. Where it is limestone, as it is on coral atolls, the phosphate mineral is hydroxyapatite at first but changes to fluorapatite with time
as fluorine is picked up from sea spray or storm waves (Altschuler, 1973). Where the underlying rock is a silicate, as it is in islands of volcanic origin, the phosphate minerals are aluminum or aluminum-iron phosphates (for example, variscite (A1PO4-2H2O) and strengite (FePO4-2H2O)).
Most phosphorites containing more than 30 percent P2O5 also contain 3 percent F or more and 0.01 percent U or more. Both elements are now recovered as byproducts in some places in the manufacture of phosphoric acid or other fertilizer chemicals. Some phosphorites also contain 0.1 to 0.5 percent V2O5 , which is also recovered as a byproduct in some operations.
Origin
Most phosphorus is carried to the sea as phosphate miner als or adsorbed on iron or aluminum hydroxides or clay, but some is carried in paniculate or dissolved organic com pounds, and about one-sixth of the total is carried in solu tion. The PO4 content of most river and lake waters ranges from about 0.01 to 0.5 ppm. Soft acid waters, such as those in parts of the Florida peninsula, may contain a few parts per million, however, and highly saline alkaline lake waters, such as those in Searles Lake, Calif., contain 200 to 900 ppm.
The ocean as a whole is nearly saturated with phosphate, and an amount equivalent to what is brought by rivers is precipitated almost continuously (Dietz and others, 1942; Kramer, 1964a, b; Robertson, 1966; Sillen, 1961; Smirnov and others, 1961). The phosphate content of the ocean is by no means uniform, however; deep, cold waters contain nearly 0.3 ppm PO4 , but warm surface waters contain only 0.01 ppm or less. Oceanic circulation (mainly a reflection of atmospheric circulation, brought about by solar heating combined with the rotation of the Earth) plows the sea and brings these phosphate-rich waters to the surface in several environments (Sverdrup and others, 1942, p. 140, 241, 246, 785; Brongersma-Sanders, 1948). Most of the early theories on the origin of phosphate developed from the study of ancient marine phosphorites exposed on land, beginning with Buckland (1829), who suggested that phosphorite was composed largely of fossilized coprolites. Other hypotheses of phosphorite origin also related it to some form of biologic activity (for example, the concentration of phosphate-rich skeletons, fecal matter, or the decay of carbonaceous mat ter).
In a remarkable paper, Kazakov (1937) discarded what he called the biolith theories and advanced the hypothesis of direct precipitation of apatite from seawater. He drew on geologic, oceanographic, and physical chemical evidence to support his hypothesis. For example, he observed that phos phorites are a sedimentary facies found only on the conti nental shelves and are not associated with deep-water sedi ments or with evaporite sequences. He observed that
22 Mineral and Petroleum Resources of the Ocean

phosphorite facies migrate laterally over time with marine transgressions and regressions. He distinguished the thin, nodular deposits generally associated with glauconite, which he called the platform facies, from the thicker pelletal deposits generally associated with black shale, which he called the geosynclinal facies. He noted that the P2O5 con tent of the present oceans increases with depth from a min imum in the zone of photosynthesis as the pH and tempera ture decrease and the partial pressure of CO2 increases. Supplementing such data with information on the areal dis tribution of P2O5 in the South Atlantic and with observations of his own on phase equilibria, Kazakov postulated that phosphate is chemically precipitated on shelving bottoms between depths of 50 and 200 m, where the pH of ascending cold waters rises as their temperature increases and the par tial pressure of CO2 decreases. In this circulating system, the deep waters ascending the shelves on one side of a basin are largely depleted of phosphorus; when they circulate back into the upper levels of the sea, they yield no phos phate, largely because of biologic productivity, when they reach the other side of the basin. Although Kazakov did not use the term upwelling, it is clearly the process that he described.
In an idealized ocean (see Fleming, 1957), the main ele ments of the current system consist of a large circulating gyral in each hemisphere (fig. 13); water cooled in polar latitudes moves toward the equator along the eastern side of the ocean, and water warmed in equatorial latitudes moves poleward along the western side. In this system, cold, nutrient-rich waters are brought to the surface in four situa tions:1. Where a current diverges from a coast or where two
currents diverge from each other, as they do along the equatorial currents and the countercurrent (diver gence upwelling). The action of currents moving to ward the equator in bringing cold, phosphate-rich water along the coast is abetted by the seaward move ment of coastal surface water that results from the combined effects of prevailing wind and Coriolis force, for, as the surface water moves seaward, deep, cold water wells up to replace it.
2. Where two currents meet to produce turbulence.3. Along the western edge of poleward-moving density cur
rents such as the Gulf Stream, where heavy and usu ally cold water lies to the left of an observer looking in the direction of flow in the northern hemisphere and to the right in the southern hemisphere (dynamic upwelling). In middle and northern latitudes, a cool coastal countercurrent, such as the one along the Northeastern United States, is an accompanying fea ture (Sverdrup and others, 1942, p. 676).
4. In upper latitudes where highly saline water from the tropics tends to sink as a result of winter cooling (convection).
90*
X X Turbulent mixing
Mixing as result of winter cooling
Upwelling caused by divergence
o Dynamically caused upwelling
Figure 13. Surface currents in an idealized ocean showing areas of ascending nutrient-rich waters (from McKelvey and Chase, 1966). (Reproduced with permission from the Marine Technology Society.)
Each of these processes can take place in locations besides those shown in figure 13. For example, upwelling can occur wherever a prevailing wind or current moves surface water away from a coast, and some convection resulting from increased surface-water density during winter cooling can take place wherever there are pronounced seasonal varia tions in temperature.
Pronounced climatic, biologic, and geologic effects ac company upwelling, especially where it is produced by di vergence in coastal areas (fig. 13). The presence of cold waters along coasts produces coastal fogs and humid-air deserts, such as those of northern Chile and southwestern Africa. The desert environment minimizes continental runoff on the one hand and leads to evaporative conditions in restricted coastal water bodies on the other. The nutrient- rich waters that lie alongside these deserts are the lushest gardens of the sea, for the upwelling cold waters there support tremendous quantities of organisms diatoms and other phytoplankton are at one end of the food chain, and fish, whales, and fish-eating sea fowl are at the other. Blooms of dinoflagellates (red tides) and diatoms are char acteristic biologic phenomena in upwelling areas, as are the mass mortalities of fish that accompany red tides and may be a consequence of them (Brongersma-Sanders, 1948, 1957). Most of the large accumulations of guano are formed
Subsea Mineral Resources 23
by sea-fowl colonies feeding in these waters; the extremely dry climate created by upwelling makes the preservation of guano possible (Hutchinson, 1950).
Concentrations of nutrients and accompanying organic growths are also found near the mouths of some large rivers as well as in estuaries in which the outflow of surface water is replaced by a countercurrent of seawater. The decaying remains of organisms in such estuaries sink from outflowing surface water, and their decay products are trapped in the system by inflowing seawater; nutrients accumulate as a result of this process, and the phosphate contents of such estuaries often are higher than those of adjacent river water or seawater. The same process may also tend to enrich the nutrient content of upwelling waters (Redfield and others, 1963, p. 60-66).
The solubility of phosphate in upwelling waters decreases as temperature and pH increase near the surface (Kazakov, 1937; Kramer, 1964b; Robertson, 1966), and apatite may be precipitated by organic or inorganic processes. Organic skeletons and excrement contribute phosphate in concen trated form to the sea bottom, and organic tissues may carry phosphate to the bottom in moderately soluble organic com pounds, from which it may be released before or after burial (van Vloten, 1955, p. 141; Bushinski, 1964). Apatite, gen erally as carbonate-fluorapatite but under special conditions perhaps also as hydroxyapatite (Kramer, 1964b), may also be precipitated from seawater by inorganic processes (Gul- brandsen and others, 1983); a common textural type of phosphorite composed of unaggregated microcrystalline ap atite probably formed in this way, as did the concentrically layered oolites common in many ancient phosphorites (Gul- brandsen, 1960, p. 119; Ilyin and Ratnikova, 1981).
Fossil shells such as gastropods and pelecypods that were nonphosphatic during the life of the organism are sometimes found to be composed of apatite, clear evidence of replace ment before or after burial. Apatite replacement of calcite has been demonstrated experimentally and has been sug gested by Ames (1959) to be the main process by which marine phosphorite is deposited. Evidence for its operation has been demonstrated in the Peru-Chile (Manheim and others, 1975) and southwestern Africa (Birch and others, 1983) offshore deposits. Interstitial accretion, however, probably is a quantitatively more important diagenetic proc ess and may be one of the processes by which the pellets and similar aggregates that are common in many phosphorites are first formed (Sheldon, 1957, p. E123; Bushinski, 1964; Cressman and Swanson, 1964, p. 375; D'Anglejan, 1967).
Emphasizing the importance of biologic and diagenetic processes in the origin of phosphorite, Baturin (1982, p. 228) believed that:
. . .the complete cycle of phosphorite formation on the ocean shelves includes five stages: (1) sup ply of phosphorus to the shelf zone in upwelling ocean waters; (2) consumption of phosphorus by phytoplankton and other organisms; (3) deposi
tion of phosphorus on the bottom in biogenic de tritus and accumulation of sediments with a high content of mobile biogenic phosphorus; (4) forma tion of gel-like, gradually hardening phosphate concretions in the sediments; (5) reworking of the sediments and residual concentration of the con cretions.
Although biologic processes are important in enriching the nutrient content of upwelling waters and in precipitating phosphate, they operate within and are basically controlled by the physical and chemical conditions of the system. The phosphorites and their lateral equivalents in the environment of strong upwelling (black shale, chert, dolomite, lime stone, and evaporites) are thus the depositional products of moving masses of water that change in composition as the result of physical, chemical, and biologic processes (Gul- brandsen, 1960),
Submarine volcanism has been suggested as a local source of the fluorine, phosphorus, and silica in marine phosphorites (Taliaferro, 1933; Mansfield, 1940; Gibson, 1967). Gulbrandsen's (1974) discovery of buddingtonite (an ammonium feldspar derived from the alteration of volcanic glass) in many beds of the Meade Peak Member of the Permian Phosphoria Formation supports this hypothesis (Burnett and Lee, 1980). No doubt, volcanic activity does contribute to the concentration of these elements and others in seawater, but their present distribution in seawater is not controlled by volcanic activity, and the processes described yield deposition from seawater of normal composition (McKelvey and others, 1953, 1959).
The origin of phosphorites illustrates the concatenation of processes that often take place in the formation of ore de posits of many kinds: (1) slight concentration of phosphorus in deep, cold water; (2) upwelling onto a shelving bottom and warming; (3) further concentration biologically or by direct precipitation or replacement; (4) diagenetic concen tration; (5) reworking; and (6) weathering. Summerhayes and others (1973) reported that, although phosphorite off Namibia appears to be forming now, most of the phospho rite in that region is derived from the reworking of Tertiary deposits, and Burnett and Veeh (1977) found that four peri ods of phosphogenesis ranging from 0 to 10 to 130 to 140 ka are represented in the deposits off Peru and Chile.
Distribution
Phosphorites on the present sea floor generally fit the distribution expected from the upwelling hypothesis (fig. 14). They have been found on the shelves on the western sides of continents as a result of divergent upwelling; on submerged mountains in the Pacific, where they probably formed on seamounts as they were carried beneath equato rial upwelling by the northwestward-moving Pacific plate, or on since-submerged islands that were the sites of the sea-
24 Mineral and Petroleum Resources of the Ocean
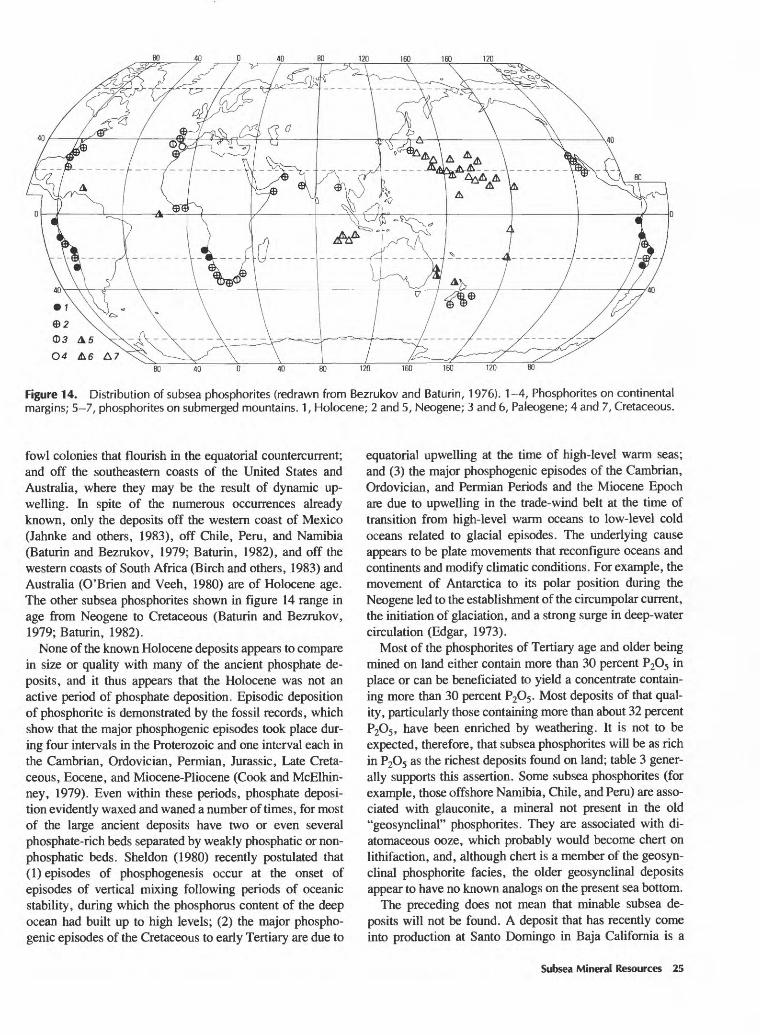
Figure 14. Distribution of subsea phosphorites (redrawn from Bezrukov and Baturin, 1976). 1-4, Phosphorites on continental margins; 5-7, phosphorites on submerged mountains. 1, Holocene; 2 and 5, Neogene; 3 and 6, Paleogene; 4 and 7, Cretaceous.
fowl colonies that flourish in the equatorial countercurrent; and off the southeastern coasts of the United States and Australia, where they may be the result of dynamic up- welling. In spite of the numerous occurrences already known, only the deposits off the western coast of Mexico (Jahnke and others, 1983), off Chile, Peru, and Namibia (Baturin and Bezrukov, 1979; Baturin, 1982), and off the western coasts of South Africa (Birch and others, 1983) and Australia (O'Brien and Veeh, 1980) are of Holocene age. The other subsea phosphorites shown in figure 14 range in age from Neogene to Cretaceous (Baturin and Bezrukov, 1979; Baturin, 1982).
None of the known Holocene deposits appears to compare in size or quality with many of the ancient phosphate de posits, and it thus appears that the Holocene was not an active period of phosphate deposition. Episodic deposition of phosphorite is demonstrated by the fossil records, which show that the major phosphogenic episodes took place dur ing four intervals in the Proterozoic and one interval each in the Cambrian, Ordovician, Permian, Jurassic, Late Creta ceous, Eocene, and Miocene-Pliocene (Cook and McElhin- ney, 1979). Even within these periods, phosphate deposi tion evidently waxed and waned a number of times, for most of the large ancient deposits have two or even several phosphate-rich beds separated by weakly phosphatic or non- phosphatic beds. Sheldon (1980) recently postulated that (1) episodes of phosphogenesis occur at the onset of episodes of vertical mixing following periods of oceanic stability, during which the phosphorus content of the deep ocean had built up to high levels; (2) the major phospho genic episodes of the Cretaceous to early Tertiary are due to
equatorial up welling at the time of high-level warm seas; and (3) the major phosphogenic episodes of the Cambrian, Ordovician, and Permian Periods and the Miocene Epoch are due to upwelling in the trade-wind belt at the time of transition from high-level warm oceans to low-level cold oceans related to glacial episodes. The underlying cause appears to be plate movements that reconfigure oceans and continents and modify climatic conditions. For example, the movement of Antarctica to its polar position during the Neogene led to the establishment of the circumpolar current, the initiation of glaciation, and a strong surge in deep-water circulation (Edgar, 1973).
Most of the phosphorites of Tertiary age and older being mined on land either contain more than 30 percent P2O5 in place or can be beneficiated to yield a concentrate contain ing more than 30 percent P2O5 . Most deposits of that qual ity, particularly those containing more than about 32 percent P2O5 , have been enriched by weathering. It is not to be expected, therefore, that subsea phosphorites will be as rich in P2O5 as the richest deposits found on land; table 3 gener ally supports this assertion. Some subsea phosphorites (for example, those offshore Namibia, Chile, and Peru) are asso ciated with glauconite, a mineral not present in the old "geosynclinal" phosphorites. They are associated with di- atomaceous ooze, which probably would become chert on lithifaction, and, although chert is a member of the geosyn clinal phosphorite facies, the older geosynclinal deposits appear to have no known analogs on the present sea bottom.
The preceding does not mean that minable subsea de posits will not be found. A deposit that has recently come into production at Santo Domingo in Baja California is a
Subsea Mineral Resources 25

Table 3. Composition of phosphorites from various submarine localities (after Cronan, 1980)[Localities 1-4, Agulhas Bank phosphorites, South Africa (from Parker, 1971; Parker and Siesser, 1972; Dingle, 1974); 5, Forty Mile Bank phosphorite, Baja California (from Mero, 1965); 6-10, northwest African continental margin phosphorites (from McArthur, 1974); 11, Peru-Chile continental margin, average from Burnett (1974); 12, sea off California, average of two samples from Burnett (1974); 13, Chatham Rise off New Zealand, average of two samples from Burnett (1974); 14, Blake Plateau phosphorite (from Burnett, 1974); 15, Necker Bank phosphorite (from Burnett, 1974)]
1 2 3
SiO2------ 6.20 3.45 15.30 TiO2------ .06 .04 .10
A12O3----- 1.13 .92 2.14 Fe2O3----- 1.40 25.80 5.58 MnO----- .01 .06 .01 MgO----- .97 1.49 1.34 CaO ------ 47 02 33 42 37 04
Na2O----- .62 .34 .78K20------ .43 .39 1.57P2O5------ 14.82 10.26 17.89S ._._ 31 91 Aft
F -------- 212 142 221
LOF4 ----- 25.52 23.24 16.15 Organic C-------------------
'Quartz only. 2Calcite only. 3Pyrite sulfur only. 4Loss on fusion (loss on ignition at
4 5
13.79 1 .11
2.12 7.34
.02 1.45
36.54 47.4 26 .73 1
1.51 16.82 29.6 18
.45 2.03 3.3
16.89
1,000 Tat localities
6
.8 1
.019
.37
.54
.01
.22
.99
.15
.3
.443
.61
11-15)
7
2.01
.016
.36
.77
.09
8.02
2.79 .13
26.2 .563
.76
83.1 1
.074 1.95 8.6
.017
9.02
1.96 2.10
16.5
.32
91.61
.053 1.12
10.7 .025
7.92
1.82 .41
18.3
.21
104.6 1
.087 2.00 8.7
.016
6.72
1.61 1.75
16.2
.34
11
22.13
5.15 2.85
1.07 33.93
.85 1.30
22.61 .16
2.22 8.78
12
8.93
1.38 1.00
.71 44.48
.83
.60 30.63
.35 3.45 9.34
13
0.95
1.83
.50 52.29
.55
.64 19.97
.35 2.47
20.8
14
0.20
.51 2.80
1.02 51.33
.58
.45 25.80
.61 3.25
15.2
15
1.14
1.83 50.73
.46
.15 14.62
.30 1.38
30.10
dune-beach-nearshore phosphatic sand formed when sea level was at a higher stand 10 to 27 ka (D'Anglejan, 1967). It averages only about 4 percent P2O5 but is esti mated to average about 20 m in thickness over an area of about 1,800 km2 and to contain about 1.5 billion tons of P2O5 . As an unconsolidated sand, it is easy to mine and beneficiate. Plans call for production of about 1.5 million metric tons of concentrate a year (Stowasser, 1982).
Relict phosphate deposits of Miocene age off southern California have attracted commercial interest but are not yet in production. They are estimated to contain approximately 65 million metric tons of phosphate nodules and 52 million tons of phosphatic sand that average about 28 percent P2O5 and occur at average water depths of over 200 m (U.S. Department of the Interior Outer Continental Shelf Mining Policy Task Force, 1979). Unevaluated phosphorite de posits are found at many other localities on the California borderland (Rowland and Cruickshank, 1983; Mullins and Rasch, 1985).
Phosphorite of Miocene age extends offshore Florida, Georgia, and South Carolina (fig. 15). A recent study (U.S. Department of the Interior Outer Continental Shelf Mining Policy Task Force, 1979) indicates the presence of about 1.3 billion tons of phosphorite on the federally controlled Outer Continental Shelf in a 30-mi2 (18.6-km2) area at a water depth of about 14 m, from which a concentrate averaging about 30 percent P2O5 could be produced at costs that com pare favorably with those of land-based operations. In the late 1960's, the Kerr-McGee Corporation considered off shore mining in State-controlled waters in the Savannah
MIOCENE UPLAND AREAS
Shoreline = 0 Meter laopaeh of
Pungo River end Hawthorn Sedlmentt
PHO8PHOQENIC PROVINCES
Arrow* Indicate Regional Increase In
Phoaphate Deposition. Actual
Photphate Concentration la
Determined by ««ond-JrM|D_CAROL|NA
'Order Structural.PROVINCE
KNOWN MIOCENE
PHOSPHATE DEPOSITS
1. AURORA. N.C.
2. ON8LOW BAY. N.C.
3. BLAKE PLATEAU
4. BEAUFORT. S.C.
6. CHATHAM-SAVANNAH. OA.
6. SOUTH OA.
7. NORTH FLA.
8. NORTH-CENTRAL FLA. *
9. OCALA HARD-ROCK
10. ST. AUGUSTINE. FLA.
11. EAST FLA.
12. CENTRAL FLA.
13. SOUTH FLA.
14. MIAMI TERRACE
16. POURTALES TERRACE
Figure T5. Distribution of phosphate deposits in the South eastern United States (from Riggs, 1984). (Reproduced with permission from Science.)
26 Mineral and Petroleum Resources of the Ocean

district, but the project was cancelled because of public concern about the destruction of saltwater marshes and the possible contamination of freshwater aquifers. Environmen tal impacts of mining on the Outer Continental Shelf have not yet been carefully evaluated but appear to be minimal, except in coral reef areas and areas of touristic interest.
Phosphorite of Miocene age also occurs off North Caro lina in the Aurora and Onslow Bay embayments (Riggs and others, 1982; Snyder and others, 1982) (fig. 15). The de posits in the Aurora outcrop area occur in 24 to 36 m of water. Two beds there are estimated to contain 3.75 billion metric tons of concentrate having an average P2O5 content of 29.2 percent (Riggs and others, 1985). Three beds in the northeastern Onslow Bay area, where the outcrop belt is in 15 to 22 m of water, are also extensive and contain at least 780 million metric tons of concentrate averaging 29.7 to 31 percent P2O5 . Seismic surveys suggest that the Onslow Bay deposits extend seaward in the subsurface over a large area.
The Aurora area also contains surficial phosphatic sands of Holocene age, derived in part from the Miocene deposits but including some phosphate that formed about 100 ka (S.R. Riggs and M.D. Ellington, paper presented at 1983 Geological Society of America Neogene Symposium; Riggs, 1984). They average about 0.6 m in thickness.
The Blake Plateau about 100 km off South Carolina con tains about 2 billion tons of phosphorite nodules in an un- consolidated layer about 10 cm thick at a depth of about 300 to 600 m (Manheim and others, 1980b). They average 20 to 25 percent P2O5 . The Blake Plateau also has about 1.2 billion tons of mixed manganese-phosphate nodule pave ment, probably lag deposits of Miocene age.
Phosphatic sediments of probable Miocene-Pliocene age also occur off the northeastern, southeastern, and south western coasts of Florida (Cathcart and others, 1984; Gorsline and Milligan, 1963; Gould and Stewart, 1953). These deposits are extensive in the subsurface. It is possible that they, as well as other Atlantic Continental Shelf de posits, may become accessible through borehole mining (extracting the phosphatic sediment as a slurry through a drill hole) (McKelvey, 1985).
The Chatham Rise deposits east of New Zealand are residual nodules derived from the weathering of a middle Miocene limestone. They have been traced for a distance of some 480 km along the crest of the rise in a belt up to about 40 km in width (Cullen, 1980). The nodules occur in a fine-grained glauconitic sand from which they could be eas ily separated, but the nodules themselves average only about 20.0 to 21.5 percent P2O5 . An area of "207 km2 or 284 km2 in the central part of the Rise at a water depth of about 400 m is estimated to contain 14 or 18 million tonnes of phospho rite nodules" (Kudrass and Cullen, 1982). Consideration is being given to mining the deposits for direct application as a fertilizer.
Dredge tests indicating the presence of significant minable deposits have recently been completed offshore Mataiva in French Polynesia.
Guides to Prospecting
The origin of phosphorite in areas of divergent and dy namic upwelling provides a basic guide to the selection of areas for further prospecting. As I have shown, it is not just areas of present upwelling that are of interest but also areas of upwelling in the past. From a practical standpoint, per haps the best clues to favorable areas are the presence of Cretaceous or younger phosphorites in the onshore coastal region and, of course, reports of phosphate in offshore areas. As Riggs and others (1982) have shown, core sam pling and seismic surveying may be necessary to find and appraise deposits that are largely concealed by surficial sed iments even in their "outcrop" area.
SUBSURFACE HARD-MINERAL DEPOSITS OF THE CONTINENTAL MARGINS
Theoretically, any mineral resource mined on the conti nents can occur in the continental margins. The problems associated with bringing them into production are the diffi culty of finding concealed deposits and the costs of extrac tion. In spite of these problems, however, underground min ing of subsea-floor mineral deposits has a long history, going back at least to the previously mentioned underground coal mine operated more than 350 years ago off the coast of Scotland (Austin, 1967a). More than 100 subsea under ground mines having shaft entry from land, islands, or arti ficial islands have recovered minerals such as coal, iron ore, nickel-copper ores, tin, gold, copper, mercury, and lime stone off the coasts of Australia, Canada, Chile, Finland, France, Greece, Japan, Poland, Spain, Taiwan, Turkey, the United Kingdom, the United States, and other areas (Austin, 1967a, b, c). Some of the larger mines have work ing depths below sea level ranging from 30 to more than 2,400 m and water cover of as much as 120 m and are as much as 8 km from shore (Cruickshank, 1969). Some min erals have been extracted through offshore wells by solution mining, and at least one mining operation is conducted by subsea quarrying.
Metallic Minerals
Many metallic mineral deposits within bedrock (such as tin ore, iron ore, nickel-copper ores, gold, and mercury) have been recovered from subsea underground mines in widely scattered areas. Off the Cornwall coast in the United Kingdom, for example, an early subsea underground tin mine was actively operated in the late 18th century until the shaft entry was accidentally hit by a ship and flooded. Geo logic evidence indicates that the shelf off northwestern
Subsea Mineral Resources 27

Cornwall may be extensively mineralized and that the belt of granitic plutons, some of which may be tin bearing, is likely to extend westward to the Scilly Islands and possibly continue 160 km further offshore (Dunham, 1969; Dunham and Sheppard, 1969).
Subsea iron ore of commercial grade has been actively mined off Jussaro Island in Finland, off Elba Island in Italy, and off Cockatoo Island in the northwestern part of Aus tralia. In Newfoundland, subsea iron-ore deposits, which were previously mined from shaft entries on Bell Island, are estimated to contain several billion tons of reserves (Pepper, 1958).
Generally, any mineral that is worth more than $25 to $30 a ton and extends offshore from the coast as a large, thick deposit (several hundred million dollars worth of reserves) beneath a cover of impervious rock may be economically recoverable by conventional underground mining. Solution mining through drill holes may have some potential in the future for the extraction of some metallic minerals from subsea deposits.
Not much prospecting has been undertaken as yet for lode deposits offshore, but areas favorable for their occurrence nearshore can be identified where mineralized terrane oc curs along the coast. In southeastern Alaska, for example, John Mulligan and Thomas Pittman of the USBM (in a 1970 letter referenced by Tagg (1979)) listed several places where they would expect to find sulfide deposits offshore.
Coal
Coal is the most important subsea-floor bedded deposit known to occur in large quantities in some of the ancient nonmarine sedimentary basins now buried beneath the con tinental shelves and beyond. Under certain geologic circum stances, portions of the coal-bearing basins might have sub sided together with the underlying crustal blocks and now occur beneath the continental slope and adjacent areas. One new finding was coal in nonmarine Jurassic sedimentary strata in a hole at Orphan Knoll about 600 km off New foundland. A coal seam of Mesozoic age was also encoun tered in offshore petroleum drilling on the Grand Banks more than 300 km off Newfoundland (Emery and Uchupi, 1972), and lignite of Late Cretaceous or early Tertiary age was found at a Deep Sea Drilling Project site on the Ninety- east Ridge in the central Indian Ocean (Luyendyk, 1977).
Extensions of large coal fields have been delineated in many shelf areas of the world, and, for many years, coal has been produced from subsea underground mines off the United Kingdom, Japan, Turkey, Chile, and several other countries. In 1972, undersea coal production accounted for 38 percent of total coal production in Japan and 10 percent in the United Kingdom; the world's annual subsea produc tion was about 30 million tons.
In Japan, subsea coal mining dates back to 1860, when the Takashima coal mine was first extended off the coast of western Kyushu (Wang and McKelvey, 1976). To date, many subsea coal fields have been discovered off eastern Hokkaido and western Kyushu containing over 300 million tons of proven coal reserves recoverable under current eco nomic conditions. The six existing subsea coal mines have been continually expanded and in 1972 produced a total of 10.8 million tons (including 5.3 million tons of coking coal). The Miike mine, the largest subsea coal mine in Japan, has galleries extending more than 5 km off the coast and now employs more than 5,000 underground workers.
Offshore drilling in the United Kingdom has delineated large coal reserves beneath the North Sea off the Durham coast and has also indicated that enormous quantities of coal probably lie further offshore beneath the western flank of the North Sea Basin. Although deposits there may be beyond the present economic limit of subsea underground mining with entry from land, they might become recoverable by in situ gasification in the future. Exploration of the southern North Sea has shown that the coal measures extend to the Netherlands but at depths of 7,000 m and more (Kent, 1980). The English Channel and the Celtic Sea are also likely to be underlain by coal.
Subsea coal deposits are widely known in many shelf areas of the world, including offshore Israel, Spain, the Arctic, the Soviet Union, northwestern Germany, Greece, Brazil, Japan, Argentina, Australia, Canada, and Alaska and possibly off New England, Washington, and Oregon (Tokunaga, 1967; McKelvey and others, 1969b). An appre ciable portion of the increasing demand for coal may well be supplied by future subsea mines, since subsea underground mining is more environmentally acceptable and involves no serious environmental risk of surface subsidence above the mines. Continuing engineering research to develop new au tomated techniques of underground excavation and tunnel ing through hard rocks may eventually extend the economic limit of subsea mining of coal and other large deposits (beneath a cover of impervious rocks) to more than 35 km from the coasts and islands (Wang and Cruickshank, 1969). Moreover, the world's increasing demand for energy may accelerate development of in situ gasification and other new methods that would permit commercial in situ extraction of not only the offshore coal deposits presently beyond the limit of subsea underground mining but also the low-grade coal seams and organic-rich shales offshore as well as on land.
Other Nonmetallic Minerals
Most of the world's deposits of saline minerals (for exam ple, sodium, potash, and magnesium salts) form by the evaporation of seawater, particularly during the early stages of continental rifting. They are thus widespread in the con-
28 Mineral and Petroleum Resources of the Ocean

tinental margins, but, because they are abundant in land sources, they have not been mined subsea. Huge potash deposits beneath the North Sea, however, can be accessed from vertical shafts at the Boulby mine near the coast of northeastern England (Woods, 1979; Smith and Crosby, 1979). The deposits, consisting of sylvite (KC1) and carnal- lite (KMgCl3 -6H2O) associated with halite and anhydrite, occur in the Zechstein Basin of Late Permian age at a depth of about 1,100 m at the Boulby mine. The west-central edge of the basin underlies land, but most of it underlies the North Sea, which eventually will be the main site of production. Potash in the form of sylvite as well as the magnesium salts bischoffite (MgCl2-6H2O) and tachyhydrite (CaCl2-MgCl2 - 12H2O) also occur onshore and offshore in the Congo Basin and its rifted part, the Sergipe Basin off the eastern coast of Brazil. The Congo deposits were mined from 1969 to 1977, when the mine was lost because of flooding (de Ruiter, 1979). Several occurrences of potash are known to be asso ciated with the Miocene salt beds in the Red Sea Basin, and an exploration program that will involve seismic surveys and drilling is being sponsored by the Saudi Arabian Gov ernment.
Common salt was produced by solution mining on the U.S. Outer Continental Shelf off Louisiana from 1960 to 1979. Manheim (1979) estimated the rock salt present off the Atlantic and Gulf coasts to a depth of 1 km to total about 70 trillion tons.
Native sulfur associated with salt-dome cap rock com posed of anhydrite (CaSO4) has been produced offshore Louisiana by the Frasch process, in which superheated water is pumped into the deposit through drill holes to melt the sulfur and molten sulfur is pumped to the surface. Twenty-four of the 329 onshore and offshore salt domes in the U.S. coastal area of the Gulf of Mexico, 4 of the 41 salt domes in the Isthmus of Tehuantepec of Mexico, and the Challenger Knoll arising from the Sigsbee abyssal plain are overlain by cap rock that contains native sulfur (Davis and Kirkland, 1979). The origin of these salt domes is complex. The cap rock forms when the top of a salt diapir penetrates an aquifer; the halite dissolves and leaves a residue of rela tively insoluble anhydrite. Sulfate-reducing bacteria in the presence of hydrocarbons oxidize organic matter, reduce sulfate, and emit carbon dioxide and hydrogen sulfide as waste products. The carbon dioxide reacts with calcium ions from the anhydrite to form calcium carbonate, and the hy drogen sulfide oxidizes to elemental sulfur. The reaction is
CaSO4+CH4bacterial
action H2S+CaCO3+H2O
2H2S+O2 2S+2H20
Onshore native sulfur deposits are also associated with bedded deposits of anhydrite and gypsum in structurally
favorable settings, such as along faults or in structural highs, and there seems to be no reason not to expect similar de posits to occur offshore. Sulfur deposits tend to be much smaller than those of the saline minerals with which they are associated (in the range of millions or tens of millions of tons).
Sulfur is also recovered from offshore production of hy drogen sulfide contained in sour natural gas and in the refin ing of sulfur-bearing crude oil. Onshore, sulfuric acid is produced as a byproduct of the smelting of metal-bearing sulfide ores; if subsea sulfide deposits come into production, as at least the Red Sea deposits seem likely to do, byproduct recovery of sulfuric acid would almost certainly be required for environmental reasons.
Frasch mining of elemental sulfur deposits has declined since 1974 as known deposits are depleted and production from oil and gas increases (Bodenlos and Nelson, 1979). Even so, these deposits are still the largest source of sulfur production in the United States and the world and, in the United States, still account for about half of sulfur produc tion.
A high-grade deposit of barite (BaSO4) first mined on Castle Island off southeastern Alaska has been mined by underwater blasting and dredging since 1969. The operation shows the feasibility of subsea mining of hard-rock de posits, but, at this stage of technological development, only high-grade deposits are likely to be amenable to this ap proach.
Amber, a fossil resin, occurs in marine glauconitic sands of early Tertiary age beneath the North Sea and the Baltic Sea and has been mined offshore and from beach deposits (Beiersdorf, 1972).
MANGANESE NODULES AND ENCRUSTATIONS
Black or dark-brown nodules and encrustations on rock surfaces composed of a variable mixture of manganese and iron oxides, phillipsite, and other silicate minerals are widely distributed in the deep-ocean basins and are found also in some parts of the continental margins, such as the Blake Plateau off the Southeastern United States (Manheim, 1965). The nodules are of many shapes, ranging from roughly spheroidal to discoidal, and are generally 2 to 10 cm in diameter. Most are concentrically laminated about a nu cleus of a fish tooth or bone, a rock fragment, or a fragment of a nodule (see Sorem and Fewkes (1977) and Haynes and others (1982) for extensive photographs and descriptions of manganese nodules). The encrustations are also generally laminated and may be several centimeters thick.
In several areas of the deep-ocean floor, the nodules con tain 2.5 to 3.0 percent Ni+Cu+Co and, in recent years, have been the object of much research and technological development on the part of several mining organizations.
Subsea Mineral Resources 29
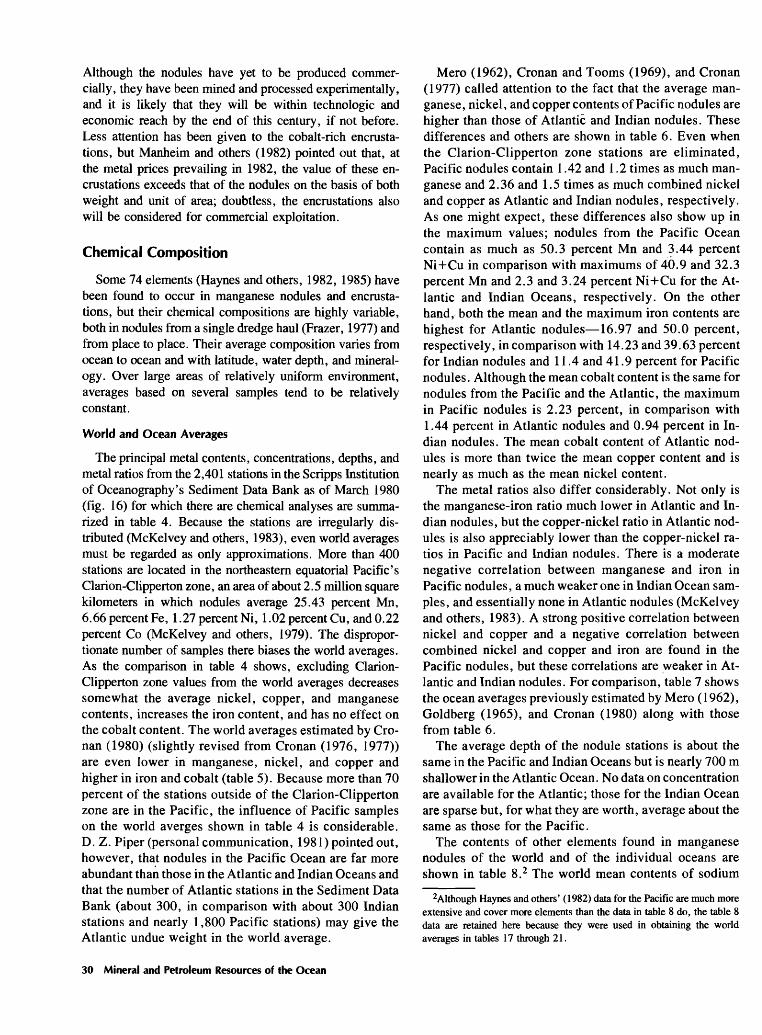
Although the nodules have yet to be produced commer cially, they have been mined and processed experimentally, and it is likely that they will be within technologic and economic reach by the end of this century, if not before. Less attention has been given to the cobalt-rich encrusta tions, but Manheim and others (1982) pointed out that, at the metal prices prevailing in 1982, the value of these en crustations exceeds that of the nodules on the basis of both weight and unit of area; doubtless, the encrustations also will be considered for commercial exploitation.
Chemical Composition
Some 74 elements (Haynes and others, 1982, 1985) have been found to occur in manganese nodules and encrusta tions, but their chemical compositions are highly variable, both in nodules from a single dredge haul (Frazer, 1977) and from place to place. Their average composition varies from ocean to ocean and with latitude, water depth, and mineral ogy. Over large areas of relatively uniform environment, averages based on several samples tend to be relatively constant.
World and Ocean Averages
The principal metal contents, concentrations, depths, and metal ratios from the 2,401 stations in the Scripps Institution of Oceanography's Sediment Data Bank as of March 1980 (fig. 16) for which there are chemical analyses are summa rized in table 4. Because the stations are irregularly dis tributed (McKelvey and others, 1983), even world averages must be regarded as only approximations. More than 400 stations are located in the northeastern equatorial Pacific's Clarion-Clipperton zone, an area of about 2.5 million square kilometers in which nodules average 25.43 percent Mn, 6.66 percent Fe, 1.27 percent Ni, 1.02 percent Cu, and 0.22 percent Co (McKelvey and others, 1979). The dispropor tionate number of samples there biases the world averages. As the comparison in table 4 shows, excluding Clarion- Clipperton zone values from the world averages decreases somewhat the average nickel, copper, and manganese contents, increases the iron content, and has no effect on the cobalt content. The world averages estimated by Cro- nan (1980) (slightly revised from Cronan (1976, 1977)) are even lower in manganese, nickel, and copper and higher in iron and cobalt (table 5). Because more than 70 percent of the stations outside of the Clarion-Clipperton zone are in the Pacific, the influence of Pacific samples on the world averges shown in table 4 is considerable. D. Z. Piper (personal communication, 1981) pointed out, however, that nodules in the Pacific Ocean are far more abundant than those in the Atlantic and Indian Oceans and that the number of Atlantic stations in the Sediment Data Bank (about 300, in comparison with about 300 Indian stations and nearly 1,800 Pacific stations) may give the Atlantic undue weight in the world average.
Mero (1962), Cronan and Tooms (1969), and Cronan (1977) called attention to the fact that the average man ganese, nickel, and copper contents of Pacific nodules are higher than those of Atlantic and Indian nodules. These differences and others are shown in table 6. Even when the Clarion-Clipperton zone stations are eliminated, Pacific nodules contain 1.42 and 1.2 times as much man ganese and 2.36 and 1.5 times as much combined nickel and copper as Atlantic and Indian nodules, respectively. As one might expect, these differences also show up in the maximum values; nodules from the Pacific Ocean contain as much as 50.3 percent Mn and 3.44 percent Ni+Cu in comparison with maximums of 40.9 and 32.3 percent Mn and 2.3 and 3.24 percent Ni+Cu for the At lantic and Indian Oceans, respectively. On the other hand, both the mean and the maximum iron contents are highest for Atlantic nodules 16.97 and 50.0 percent, respectively, in comparison with 14.23 and 39.63 percent for Indian nodules and 11.4 and 41.9 percent for Pacific nodules. Although the mean cobalt content is the same for nodules from the Pacific and the Atlantic, the maximum in Pacific nodules is 2.23 percent, in comparison with 1.44 percent in Atlantic nodules and 0.94 percent in In dian nodules. The mean cobalt content of Atlantic nod ules is more than twice the mean copper content and is nearly as much as the mean nickel content.
The metal ratios also differ considerably. Not only is the manganese-iron ratio much lower in Atlantic and In dian nodules, but the copper-nickel ratio in Atlantic nod ules is also appreciably lower than the copper-nickel ra tios in Pacific and Indian nodules. There is a moderate negative correlation between manganese and iron in Pacific nodules, a much weaker one in Indian Ocean sam ples, and essentially none in Atlantic nodules (McKelvey and others, 1983). A strong positive correlation between nickel and copper and a negative correlation between combined nickel and copper and iron are found in the Pacific nodules, but these correlations are weaker in At lantic and Indian nodules. For comparison, table 7 shows the ocean averages previously estimated by Mero (1962), Goldberg (1965), and Cronan (1980) along with those from table 6.
The average depth of the nodule stations is about the same in the Pacific and Indian Oceans but is nearly 700 m shallower in the Atlantic Ocean. No data on concentration are available for the Atlantic; those for the Indian Ocean are sparse but, for what they are worth, average about the same as those for the Pacific.
The contents of other elements found in manganese nodules of the world and of the individual oceans are shown in table 8. 2 The world mean contents of sodium
2Although Haynes and others' (1982) data for the Pacific are much more extensive and cover more elements than the data in table 8 do, the table 8 data are retained here because they were used in obtaining the world averages in tables 17 through 21.
30 Mineral and Petroleum Resources of the Ocean

80°N180°W. 150°W. 12(n/V. 90°W. 60°W. 30°W. 0° 30*E. 60°E. 90°E. 120°E. 150°E. 180°E.
60°N.
40°N.
80«S.
Figure 16. Manganese nodule stations in the Scripps Institution of Oceanography's Sediment Data Bank as of March 1980 (from McKelvey and others, 1983).
(1.97 percent), magnesium (1.57 percent), aluminum (2.70 percent), silicon (7.69 percent), and calcium (2.23 percent) exceed 1.5 percent in the nodules; the sum of the oxides of these elements at their mean values is about 30 percent. In the ^0.1- to < 1.5-percent range are the means of carbon (0.327 percent), phosphorus (0.37 percent), sulfur (0.51 percent), chlorine (0.83 percent), potassium (0.73 percent), titanium (0.69 percent), zinc (0.12 percent), and barium (0.23 percent). The means of 12 other elements (lithium, vanadium, strontium, yttrium, zirconium, molybdenum, tellurium, lanthanum, cerium, neodymium, and lead) are in the range of ^0.01 to <0.1 percent. Although the mean concentrations of these elements in nodules are all much lower than those in the deposits from which they are mined on land, many represent substantial geochemical concentra tions. For example, in comparison with the averages esti mated by Lee and Yao (1970) for oceanic crust, the mean for zinc in nodules is 10 times greater, that for lead is 93 times greater, and that for molybdenum is 253 times greater. Even though their amounts are relatively small, some of
these minor metals for which the price is relatively high conceivably might be recovered as byproducts in the extrac tion of nickel and copper.
Analyses available for other elements are fewer than those available for the metals previously discussed. Given this limitation, regional variations nevertheless appear simi lar to variations observed for the principal metals occurring in the contents of some other elements. If only elements for which the station population in each ocean is 10 or more are considered, the means for phosphorus, calcium, and yttrium in Atlantic nodules are more than 20 percent higher than the world mean, and those for potassium and titanium are more than 20 percent lower (table 8). The means for silica, ar senic, and cerium in the Indian Ocean are more than 20 percent higher than the world mean, and those for lithium, carbon, zirconium, potassium, molybdenum, and tin are more than 20 percent lower. Because stations in the Pacific are much more numerous than those in other oceans, they strongly influence the world mean for most elements,
Subsea Mineral Resources 31

Table 4. World metal contents (in percent), nodule concentrations (in kg/m2), and depths (in m) of manganese nodules [The Clarion-Clipperton zone is taken to be the area defined by lat 7° to 15° N., long 114° to 153° W.]
Mn --------------------Fe ---------------------Ni......................Cu- -----------------Ni+Cu -----------------Co----- ---------------Nodule concentration -----FW>r»th
No. of stations
9 -I7O
_--_-.-2 374O -30-J
2 1^CO
2 1 fr
_______7 284__._.._ 344------- jt*t -------2,277
All stations
Mean
18.60 12.47
.66
.45 1.12
.27 10.89
4,270
Stations outside the Clarion-Clipperton zone
Range
0.04-50.3 .30-50.0 .01-1.95 .01-1.90 .02-3.44 .01-2.23 .12-70.8 46-7,280
No. of stations
1,979 1,979 1,977 1,962 1,960 1,888
291 1,951
Mean
17.4 13.6
.55
.34
.90
.27 11.5
4,182
Range
0.04-50.3 .42-50.0 .01-1.8 .01-1.9 .02-3.44 .01-2.23 .18-70.8 46-7,280
Table 5. Comparison of the world average metal contents of manganese nodules listed in table 4 with the values reported byCronan (1980)[All values in percent. The Clarion-Clipperton zone is here taken to be the area defined by lat 7° to 15° N., long 114° to 153° W.]
Element
Mn-----------------PONi ..................Cu-----------------.Ni+Cu -------------.Co ------------------
World
-------------- 18.60.-..--_._-._._ 12.47.............. .66..-----------. 45.............. 1.12.............. .27
Table 4 values
World, excluding Clarion-Clipperton
zone
17.45B fi
.55
.34
.90
.27
World values reported by
Cronan (1980)
16.17415.608
/lOOO
O^<i1
74499007
Table 6. Principal metal contents (in percent), nodule concentrations (in kg/m2 ), and depths (in m) of manganese nodules in thePacific, Atlantic, and Indian Oceans[The Clarion-Clipperton zone is here taken to be the area defined by lat 7° to 15° N., long 114° to 153° W.]
All Pacific Ocean stationsPacific Ocean stations outside the Clarion-Clipperton zone All Atlantic Ocean stations All Indian Ocean stations
No. of No. of No. of No. of stations Mean Range stations Mean Range stations Mean Range stations Mean Range
Mn-------- 1,777 20.1 0.07-50.3 1,378 18.840.07-50.3 298 13Fe- -------- 1,772 11.4 .3-41.9 1,377 12.77 .42 41.90 299 16Ni--------- 1,784 .76 .01 1.95 1,378 .63 .01 1.80 297Cu -------- 1,771 .54 .01-1.90 1,365 .41 .01-1.90 297 Ni+Cu----- 1,770 1.30 .02 3.44 1,364 1.04 .02 3.44 296/-i ITIl^k T7 J"k 1 'I T} \ *} \ A ^n J"\ 1 ^ T"> ^OC
Nodule con- 321 10.89 .12-70.80 268 11.61 .18-70.80 0 centration.
rw»th------ 1 677 A. ^7Q 46 7 ">8n 1 TS1 A. ->7O 46 7 ->«n ">Q6 ^ 614
.25 0.04-40.9 303 15.25 0.60-32.30
.97 1.54-50.0 303 14.23 1.33-39.63
.32 .01-1.56 302 .43 .01-1.58
.13 .01-.88 300 .25 .01-1.66
.44 .03-2.3 300 .69 .03-3.24
.27 .01-1.44 289 .21 .01-.94 23 10.82 .40-43.2
-m 7 18f» mi A. ^Od. S6A 6 117
32 Mineral and Petroleum Resources of the Ocean

Table 7. Average principal metal contents of manganese nodules, by ocean[The Clarion-Clipperton zone is here taken to be the area defined by lat 7° to 15° N., long 114° to 153° W.]
Pacific Ocean
Element
Mn-------Fe--------Ni--------Cu-------Ni+Cu---- Co-------
All table 6 stations
- 20.1- 11.4- .76- .54
- 1.30- .27
Table 6 stations, minus Clarion-
Clipperton zone
18.84 12.77
.63
.41 1.04
.29
Mero (1962)
24.2 14.0
.99
.53 1.52
.35
Goldberg(1965)
19 14
.4
.5
.9
.3
Cronan(1980) 1
19.78 11.96
.634
.392 1.026
.335
Atlantic Ocean
Table 6
13.25 16.97
.32
.13
.44
.27
Mero (1962)
16.317.5
.42
.20
.62
.31
Cronan (1980) 1
15.78 .78 .328 .116 .444 .318
Indian Ocean
Table 6
15.25 14.23
.43
.25
.69
.21
Cronan (1980) 1
15.10 14.74
.464
.116
.580
.325
'Estimates made on the basis of detrital-free material.
Table 8. Other elements in manganese nodules of the world and of the Pacific, Atlantic, and Indian Oceans [ , no data]
Element
Li----------f3~
C ---------
Na---------Mg Al---------Si--- .......
fftfi Sc- --------
Ti------~-.V---------.Cr---------Zn --------n«
Ge--------Ac
Rb--------
Si ---- .
Y---------
Zr---------Nb----..--Mo--------Ag------Ci\ --------
No. of stations
----- 19.-.__ 40
Of.
----- 75----- 2
----- 410----- 531. . . . . 592----- 509----- 321
----- 106----- 13----- 490
i noa
if.
Qnn
- - - - - 437- - - - - 274----- 1,363----- 57
..... 4----- 63----- 32----- 369. . . _ . H4
TOOf.Q
QIC.
..... 7----- 19Q
World
Mean, in percent
0.010nni
.029327. ~>4* i
T nn
1.971.572.707.69
.37
.51O-3
.732.23
nns
.69052007.V/V/ /
.12001
004
.014OO9
noc
.015
.057OO7n-jo
oninni
Range, in percent
0.00-0.060
.00-.010nn9 non033 1 50
a on ~\ nn
.30-6.5502 5 39
. \J4* *J . J s
H o nn
94 98 8n
.02-6.03
.05-3.5098 i ni
.11-3.70n9 98 T\
00 9fS9.W .^»U:7
m 8 ononi snnonn 9^1ni o nn
ono on?
nnn_ nno009 04Rnnn r\f\f.
nni 98^009 nos
nn9 ~\fj[\
.001-.030nn9 T>nnnn_ nn9nnn_ nn^
Pacificmean,
in percent
0.02001
.030
342
3.0
2 05
1.502 75
7 CS)
98
32O-3
89
1.96nns
.73
.051OOQ
.116nni
nn4.011OO9
f\O A
.015
.061nn?041nninni
Atlanticmean,
in percent
0.025
.77
1 O£
1.752 37
6.34.91
1.34
.573.72
nn9
.42
.06r\nf.
123nni
.02
.094f\^ A
.056no4.031
nni
Indianmean,
in percent
0.001nni
nn?.212
3.0
1.701.432 £*7
9.39.37
o-j
.481.97
nni
£O
.054nn9.149001
ni o
.079
.011
.034nn?.029
nni
Subsea Mineral Resources 33

Table 8. Other elements in manganese nodules of the world and of the Pacific, Atlantic, and Indian Oceans Continued [ , no data]
Element
Sn --------Sb --------Te --------I---.---...Ba--------
La --------Ce --------Nd--------Sm--------Eu --------
Tb--------Yb ------Lu --------Hf --------Ta --------
Hg -----Tl---------Pb --------
Th--------
No. ofstations
----- 141----- 10----- 17..... 1----- 463
----- 75----- 72----- 37----- 38----- 38
----- 36----- 101----- 32----- 8...-. 9
----- 22.--.. i----- 130----- 1,246----- 41----- 121
World
Mean,in percent
.008
.005
.022250
.23
.021
.072
.026
.004
.001
.001
.003
.000
.001
.002
.010
.000
.016
.093on?.003
Range,in percent
.000-.040
.004-.005
.017-.027
.000-2.14
.009-.070
.009-.300
.007-. 070
.002-.011
.000-.002
.000-.002
.001-.010
.OOO-.OOl
.OOO-.OOl
.000-.002
fina n/in
ftflfl c\f\\.01-.75
nnn_ nno.000-.013
Pacificmean,
in percent
.010
.005
.02225
.235
.022
.069
.027
.004
.001
.001
.003
.000
.001
.002
nos
.000
.017
.083003
.003
Atlanticmean,
in percent
.007
.004
.228
.023
.003
ni 8
.14001
Indianmean,
in percent
.001
.21
.018
.125
.011
.004
.001
.001
.001
.000
.012
fine
.101ftftl
.003
and significant departures from the world mean are not to be expected in Pacific nodules. Even so, the mean for chromium in Pacific nodules is 28 percent higher than the world mean (and 4.5 times higher than that in Indian Ocean nodules), and sulfur is 37 percent lower.
Relation to Latitude
It has been known for some time that the subsea man ganese nodules richest in nickel and copper are found hi the equatorial regions of the Pacific Ocean (Mero, 1962; Horn and others, 1972, 1973; Arrhenius, 1975; Piper and Williamson, 1977; Skornyakova, 1979; Cronan, 1980; Heath, 1981; Exon, 1983), although J.Z. Frazer (written communication, 1980) pointed out that, whereas nodules greatly enriched in copper occur only near the equator, nodules high in nickel occur in many different regions. Hutchinson (1947) also reported a latitudinal zonation of the iron-manganese ratio in surficial sediments of the Atlantic, and Goldberg (1954) found a pronounced dependence of this ratio on latitude in pelagic sediments of the Pacific (see also Skornyakova, 1965; Greenslate, 1975; Piper and Williamson, 1977). Tables 9 and 10 show that the relation between latitude and the metal content of the nodules ex tends to higher latitudes as well. The average manganese, copper, and nickel contents generally increase toward the
equator in both hemispheres, and iron decreases, although its high is in the 20° to 40° S. zone. Cobalt decreases slightly toward the equatorial region in the northern hemisphere but shows the opposite relation in the southern hemisphere. The increase toward the equator holds nearly as well for the maximum values of manganese, nickel, and copper. Curi ously, however, the maximum values of iron and cobalt in both hemispheres are between latitudes 20° and 40°. Al though the total metal content also increases toward the equatorial regions in both hemispheres, the difference be tween 20° groups is relatively small, except below latitude 60°, where the total of the five metals considered is only about 25 percent, an indication that less than half of the nodules there are composed of iron and manganese minerals.
The latitudinal relations for manganese and combined nickel and copper are also shown in figures 17 and 18. These plots show well the increase in these metals toward the equator, but the graphs indicate that their contents de crease rather abruptly in the zone extending a few degrees north and south of the equator, as Piper and Williamson (1977) also showed. The graphs also show a rather curious decrease in manganese and combined nickel and copper between 20° and 30° S.
Although the average values for both nickel and copper generally increase toward the equatorial regions (the value
34 Mineral and Petroleum Resources of the Ocean
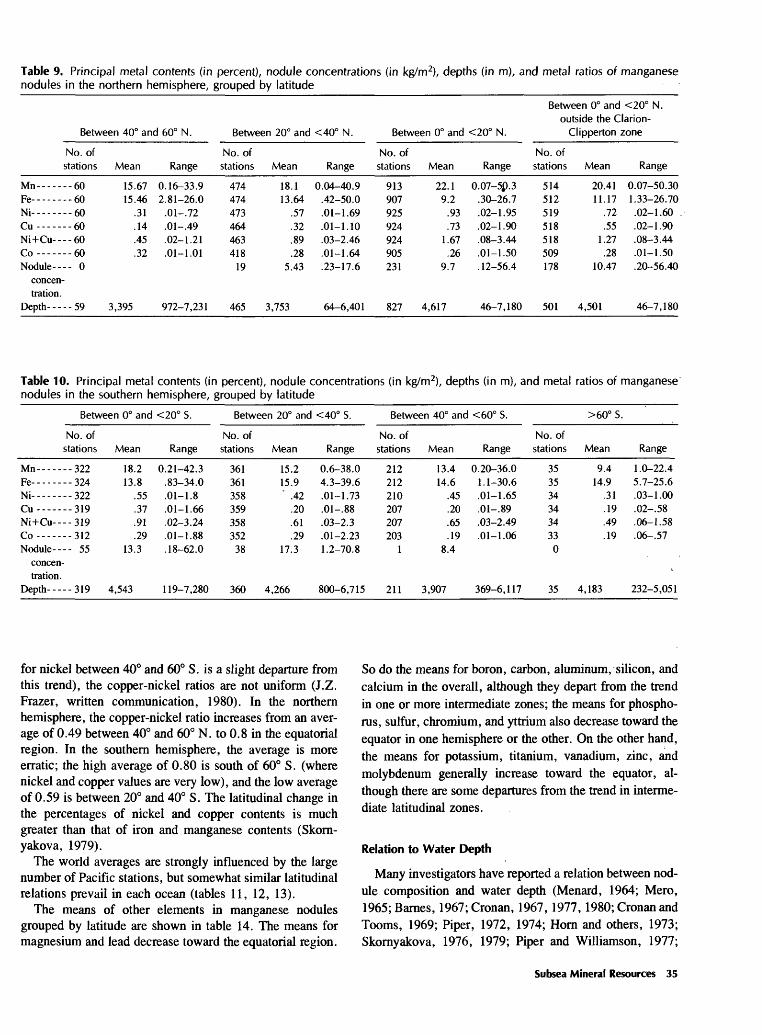
Table 9. Principal metal contents (in percent), nodule concentrations (in kg/m2), depths (in m), and metal ratios of manganese nodules in the northern hemisphere, grouped by latitude
Between 40° and 60° N. Between 20° and <40° N. Between 0° and <20° N.
Between 0° and <20° N.outside the Clarion-
Clipperton zone
No. of stations
Mn-------60Fe- -------60N1--------60Cu-------60Ni+Cu----60Co-------60Nodule---- 0
concentration.
Depth- - - - - 59
Mean
15.67
.31
.14
.45
3,395
Range
0.16-33.92 0 1 "ifi f\
.01-.72
.01 .49
.02-1.21
.01 1.01
972-7,231
No. of stations
474474
463418
19
465
Mean
18.1n 64
.57
.32
.89Tfi
5.43
3,753
Range
0.04-40.9.42-50.0.01-1.69.01 1.10.03-2.46
.23-17.6
64-6,401
No. of stations
913907925f\^ A
924
231
827
Mean
22.19.2
.93
.731.67
l^S
9.7
4,617
Range
0.07-5P.3.30-26.7.02-1.95.02 1.90.08-3.44.01 1.50.12-56.4
46-7,180
No. of stations
514512519CIO
518509178
501
Mean
20.4111.17
.72
.551.27
Tfi
10.47
4,501
Range
0.07-50.301 -2 -a )/: if\
.02-1.6009 1 QO
.08-3.44
.01 1.50
.20-56.40
46-7,180
Table 10. Principal metal contents (in percent), nodule concentrations (in kg/m2), depths (in m), and metal ratios of manganese nodules in the southern hemisphere, grouped by latitude
Between 0° and
No. ofstations
Mn-------322Fe- ------- 324Ni - -322Cu-------319Ni+Cu----319Co- 312Nodule---- 55
concentration.
Depth----- 319
Mean
1ST
1 3 fi
.55
.37
.91
.2913.3
4,543
<20° S.
Range
0.21-42.383 34 0
.01-1.8
.01-1.66
.02-3.24m l fifi
.18-62.0
119-7,280
Between 20° and
No. ofstations
361361 3CO
359358
38
360
Mean
15.9
.20
.61
.2917.3
4,266
<40° S.
Range
A H "2O A
01 1 73
m oo
.03-2.3
.01-2.231.2-70.8
800-6,715
Between 40° and <60° S.
No. ofstations
212212210207207203
1
211
Mean
14.6.45.20.65.19
8.4
3,907
Range
0.20-36.01.1-30.6.01-1.65m oo
.03-2.49
.01-1.06
369-6,117
No. ofstations
3535
34330
35
>60° S.
Mean
9.414.9
.31
.19
.49
.19
4,183
Range
1.0 22.45.7 25.6A-J 1 no.02-.58.06-1.58.06-.57
232-5,051
for nickel between 40° and 60° S. is a slight departure from this trend), the copper-nickel ratios are not uniform (J.Z. Frazer, written communication, 1980). In the northern hemisphere, the copper-nickel ratio increases from an aver age of 0.49 between 40° and 60° N. to 0.8 in the equatorial region. In the southern hemisphere, the average is more erratic; the high average of 0.80 is south of 60° S. (where nickel and copper values are very low), and the low average of 0.59 is between 20° and 40° S. The latitudinal change in the percentages of nickel and copper contents is much greater than that of iron and manganese contents (Skorn- yakova, 1979).
The world averages are strongly influenced by the large number of Pacific stations, but somewhat similar latitudinal relations prevail in each ocean (tables 11, 12, 13).
The means of other elements in manganese nodules grouped by latitude are shown in table 14. The means for magnesium and lead decrease toward the equatorial region.
So do the means for boron, carbon, aluminum, silicon, and calcium in the overall, although they depart from the trend in one or more intermediate zones; the means for phospho rus, sulfur, chromium, and yttrium also decrease toward the equator in one hemisphere or the other. On the other hand, the means for potassium, titanium, vanadium, zinc, and molybdenum generally increase toward the equator, al though there are some departures from the trend in interme diate latitudinal zones.
Relation to Water Depth
Many investigators have reported a relation between nod ule composition and water depth (Menard, 1964; Mero, 1965; Barnes, 1967; Cronan, 1967, 1977,1980; Cronan and Tooms, 1969; Piper, 1972, 1974; Horn and others, 1973; Skornyakova, 1976, 1979; Piper and Williamson, 1977;
Subsea Mineral Resources 35

UJU QC
55
50
45
40
35
30UJ
Z O
UJ 0) UJZ 20< O
10
v; i.>''. *
*.* " « >
80*S. 60°S. 40*S. 20°S. 0°
LATITUDE
20°N. 40°N. 60°N. 80°N.
Figure 17. Relation between manganese content in manganese nodules and their latitudes at stations in the Scripps Institution of Oceanography's Sediment Data Bank (from McKelvey and others, 1983).
Table 11. Average and maximum (in parentheses) principal metal contents (in percent) of manganese nodules in the Pacific Ocean, categorized by latitude
Element
Mn--------Fe- --------
Ni---------Cu--------Ni+Cu-----Co--------
Total --
40°-<60° N. (30 stations)
15.71 (33.9) 11.33 (26.0)
.35 (.72)
.19 (.49)
.54 (1.21)
.24 (.86) 28.36
20°-<40° N. (355 stations)
19.72 (39.56) 12.28 (41.90)
.66 (1.69)
.38 (1.10) 1.04 (2.46)
.28 (1.64) 34.36
0°-<20° N. (885 stations)
22.39 (50.30) 8.90 (26.7)
.96(1.95)
.76(1.90) 1.72 (3.44) .26(1.50)
34.99
0°-<20° S. (244 stations)
18.30 (42.3) 14.17(34.0)
.54 (1.80)
.34 (1.54)
.89(3.11)
.31 (1.88) 34.55
2o°-<40° S. (146 stations)
16.46 (38.02) 16.93 (32.20)
.47(1.73)
.22 (.65)
.69 (2.17)
.35 (2.23) 35.12
40°-60° S. (98 stations)
14.89 (36.0) 14.13(28.20)
.54(1.65)
.24 (.84)
.79 (2.49)
.22(1.06) 30.81
>60° S. (32 stations)
10.11 (22.40) 15.57 (25.64)
.32(1.00)
.20 (.58)
.52(1.58)
.19 (.57) 26.91
36 Mineral and Petroleum Resources of the Ocean
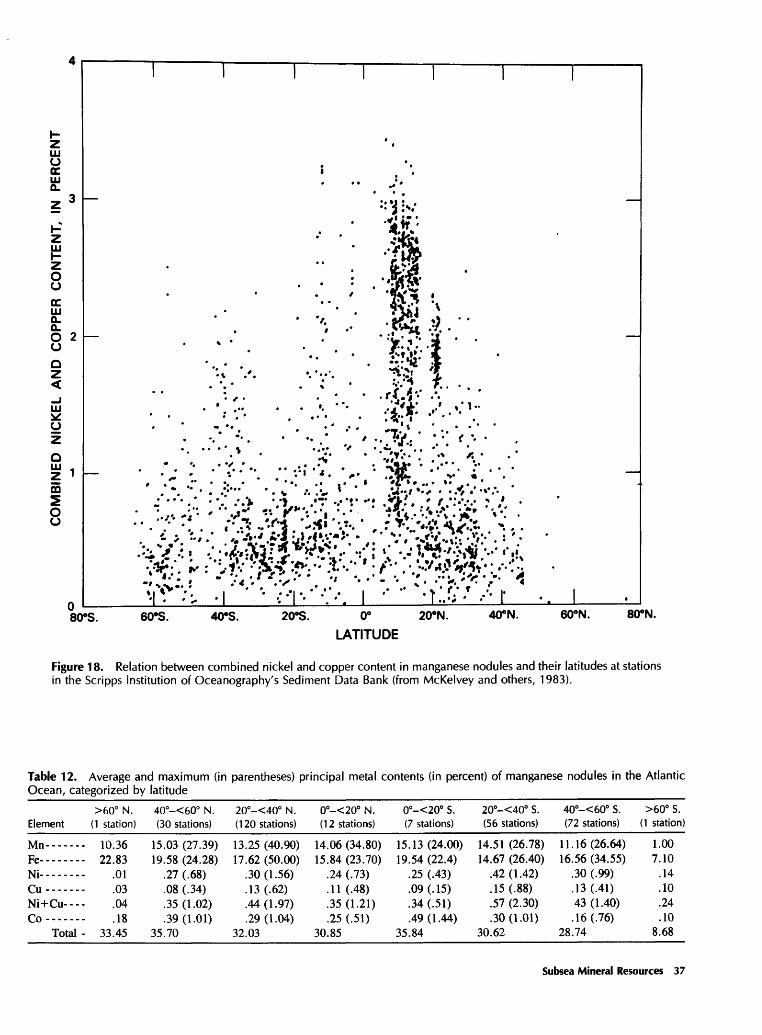
H ^ ( LO j^j.
Cft
LO C^J o LO to 0 LO o 00
LO Lft
2 LO O ON
to to OO
^J 4*.
00
00
9 H^
00
LO
NO b to v£> 1 to Lft
^^
^ £ £ 3 O b > ' i
ON ,^
j 3
g
+ n i j o -
LO b
toN
'
ft
1 Lft
*- 1*0 ~ £ 2 '" "'
Lft
->)
to 3 rv LO H-
"*^
^ to J>
P o 8 & LO ON E OO
^"^ s Lft
v~'
Lft bo -25 ^_
iLO
V ^^ O
S O to
»i S LO
0 I £ ^J Oi)
N* '
Lft do ^^ to to Oii o -
is it
? K>
OO
LO ,
^O 00 to
to OO ^J ON
Lft
O Lft
S to ^
0 v~'
^o 2 KJ
i; l .
4^ ON to I H-
ON (^ ON LO ( Jl
i5 ~J o
1 0 LO ON H^
V^<
0 to ^S LO L^ £ V '
4^ g LO ^^ 0 >_>
Lft
LO J> 8 "^ l . 4^ Lft to ON
OO
V '
_ - ,__» ON to T_
v '
> ' 8
m (D 3 (D 1 o' 3 * '
UJ
O o'
3 ^ O r-t- 1 ^ KJ
r-fr
OJ O i. . . 1 o' !£,
^ ON U 5'
3 Q KJ
j;n U 3 ^ ^ v> r^ CJ o" 3__
V ON
O z ^ q
1°
A 9
Z KJ
O A Z O 1° A KJ
? O 1° A KJ
°o S" o 1° A o 1°
A ON °
tn V ON °o
? ft)
3 n w OQ
N'
^ CT
-< ST c
o.
Z Nd > fs /s n? ft> 3 Q.
3 ft> X. 3 c 3 5'
~o ft> 3 r
^ 1 5'
o T3'
£L 3 2- §L n 0 3 ST 3 cr 5'
"^ n re 3 G-
^ 3 ft> 3
OQ
ft
)3 (9 n> 3 O Q
.C o> f/1 5
'
Er
0) ^. r^ 3 n'
- Q «
T3'
' ff
* 8
|3 OQ |:
&
0)
w
f^
CO
MB
INE
D
NIC
KE
L A
ND
C
OP
PE
R
CO
NT
EN
T,
IN
PE
RC
EN
T
O03 O
0
) 3
o 5'
3 3
.31 c Q
.
o
Table 13. Average and maximum (in parentheses) principal metal contents (in percent) of manganese nodules in the Indian Ocean, categorized by latitude [ , no data]
Element
Mn----------Fe- ------Ni-----------Cu----------Ni+Cu-------Co----------
Total - - - -
0°-20° N. (28 stations)
---- 16.52(32.30)---- 16.64(22.80)
-JO / 01\
---- .10 (.30)---- .48(1.08). . . . 29 ( 93)'**' \-^-} > ---- 34.41
0°-<20° S. (73 stations)
18.05 (32.25) 11.92(19.70)
.58 (1.58)
.47(1.66) 1.06(3.24) .20 (.94)
32.28
20°-<40° S. (159 stations)
14.36 (26.50) 15.47 (39.63)
.37(1.19)
.18 (.84)
.55 (1.95)
.22 (.62) 31.15
40°-<60° S. (42 stations)
13.53 (24.57) 12.25 (21.60)
.48(1.43)
.25 (.89)
.72(2.13)
.13 (.37) 27.36
>60° S. (2 stations)
3.07 (3.93) 8.94 (12.22)
.04
.02
.06
12.13
Pautot and others, 1978; Frazer and Fisk, 1981; Andrews and others, 1980). High values of cobalt, for example, are found mainly on seamounts, and cobalt content tends to decrease with increasing depth. A moderate negative corre lation of cobalt with depth is found (the correlation is weakly positive south of lat 60°, but the negative correlation is rather strong only in the group of samples from 40° to 60° N.), as is a weak positive correlation of combined nickel and copper with depth (McKelvey and others, 1983). Data on three groups of stations are summarized in table 15. The means for stations in water depths of less than 2,000 m are 0.53 percent Co, 18.00 percent Mn, 14.81 percent Fe, and only 0.50 percent Ni+Cu. The means for samples from water depths of greater than 4,000 m are 18.6 percent Mn, 11.7 percent Fe, 1.24 percent Ni+Cu, and only 0.24 per cent Co. If Clarion-Clipperton zone samples are eliminated, the mean manganese value drops to 17.10 percent, com bined nickel and copper decreases to 0.99 percent, iron increases to 13.01 percent, and the cobalt content remains unchanged.
Given the rather marked differences in the metal contents of these groups, one might expect the correlations of nickel, copper, and cobalt with depth to be stronger than tables 4, 6, 9, and 10 indicate. The explanation of why they are not is found in figures 19 and 20, which show that the depth relation is not linear. Rather, there is a threshold depth of about 2,900 to 3,000 m, above which combined nickel and copper contents greater than 1 percent are rare and below which nodules containing cobalt in amounts greater than about 0.6 percent are rare. As figures 21 through 26 show, below the threshold depth for combined nickel and copper and above it for cobalt, the maximum metal contents rise to an optimum depth range and then decline. Nodules contain ing more than 3.0 percent Ni+Cu, for example, are found only in a depth range of about 4,450 to 5,450 m in the Pacific, and nearly all of them are in a range of 4,800 to 5,200 m. No such values are found in the Atlantic, but the few samples containing more than 1.5 percent Ni+Cu occur in a depth range of about 4,850 to 5,200 m. In the Pacific, the optimum depth range for nodules containing more than
1 percent Co is about 800 to 1,850 m; in the Atlantic, it is about 1,000 to 1,650 m. No such high values have been found in Indian nodules, but one of the two highest values reported is from a depth of about 1,350 m. The rather substantial differences in the mean values of nickel, copper, iron, and cobalt above and below the 3,000-m depth are shown in table 16.
Cronan and Tooms (1969, p. 340) also noted the enrich ment of nickel and copper in the deeper water nodules and observed that:
. . . 3000-4000 m is a critical depth for many of the elements. In the case of Co, Cu, Pb, Ba, and V, in particular, there is a sharp difference be tween the concentrations above and below 3000 m. Those elements which are in higher con centrations in the shallower waters tend to increase gradually in concentration from 3000 m to the surface. A similar distribution is observed in the case of Cu although the highest average concentrations are recorded at the maximum depths.
(As I indicated above, the increase "to the surface" does not hold for cobalt.) Piper (1974) reported that the rare-earth composition of nodules also changes at the 3,000-m depth, and Piper and Williamson (1977) showed that the high val ues of the manganese-iron ratio as well as those of the nickel and copper ratios are below this depth.
As figure 27 shows, manganese shows little correlation with depth, although the data suggest a decrease in the maximum values and possibly an increase in the minimum values with increasing depth. No nodule analysis shows more than 32 percent Mn below depths of 5,300 m, and only one reports less than about 13 percent Mn below 6,000 m.
The increase in the copper-nickel ratio with increasing depth reported by S.A. Mooreby (unpublished thesis, 1978, discussed by Cronan (1980)) for Indian Ocean nodules can also be seen by comparing the mean copper-nickel ratio with mean depths in the various populations analyzed in the tables here. Thus, at the mean depth of 1,266 m for samples from depths less than 2,000 m, the copper-nickel ratio is
38 Mineral and Petroleum Resources of the Ocean

Table 14. Means of other elements (in percent) in manganese nodules of the world, grouped by latitude [ , no data. Values set in italics are based on 10 stations or more]
Element
L ........Be-------
C --------F --------
Na-------Mg-------A1
Si--------P ........
Cl--------
Ca -------<sr
Ti--------V-- ------Cr--------Zn -------Ga-------
Ge -------As -------Rb-------Sr--»- Y-- ------
Zr-- ------Nb-------Mo-------Ag - Cd-------
Sn -------Sb -------Te -------I-....-...Ba-------
La -------Ce -------Nd-------Sm ------ -Eu -------
Tb-------Yb-------Lu -------Hf -------Ta -------
W--------Hg -Ti--------Pb .......
Th-------
60°-40° N.
--- 0.000ft9 8 ")£
--- 1.64--- 7.72
2 0 /--- 72.75
.267-3
.57--- 2.79
nni
.53 --- .042
Ofld
.06
.002
.01
.003f\O A
("19°.
.040
.005
.038
.000
.000
.297
.018
.053
.018
.004
.001
.001
.002
.000
.010
.720nni
.008
40°-20° N.
--- 0.02
.000/T>^C
.29
7.577.672.677 04/ .\j*t
.50
.51Of
.713.30
/r/n
.66
.055
.012
.12
.001
---- .004.019.003.097.076
.062
.009
.040---- .001
.007
.005---- .005---- .022
.37
.02
.10
.027
.004
.001
.001
.003
.000---- .001
_ _ _ _ 003- - - - ,\j\jj
n is
.103003.\j\jj
.0021
20° N.-0°
0.001.000.02.22
--- 3.0
1.841.572 CO
7.427S
.26
.741.87
023
64046
.011
.11
.001
.009
.0070<°2
.075
047.\J*T4,
.004
.046
.001
.001
- - - - 25.267
.027
.055
.034
.006
.001
.001
.003
.000
.076
.067004
.0021
0°-20° S.
0.001.001.029.30
2.301.402.567 CJ?
70
64.L^T
03
2.07nr\ i
T^C
.056nnj
.13
.001
.000
.016
.001
.077
.075
.057
.070
.037
.001
.007
.004
.020
.773
.020
.065
.020
.003
.001
.001
.003
.000
--- .002
.077--- .000
.076
.091/T/19
.00^1
20°-40° S.
0.001.022.412
1 OO
7.961.425 7S
o /T7
.47
K7
.9064
2.12OO 7^
.\J\JJ
son
04Q.\S*TS
(\(\*)
.17
.002
.009
.075
057.073
.036
.004
.031
.002
.001
.070
.234
.020
.126
.020
.004
.001
.001
.003
.000
OOQ
.014
.121/U19
.005
40°-60° S.
0.002043too
2.377.552.46O jCO
OjC
.5198
OjC
7.52002
£^ 3
059f)04.10.001
.015
/1C9
.073
.072
.005
.037
.002
.009
.736
.017
.045
.030
.004
.001
.002
.003
.000
.012
.141003.004
60°-80° S.
1.962.64 310
i-a oo
9642.25
.639041
.06
084
.073
.037
.005
.709
.161
Subsea Mineral Resources 39

Table 15. Metal contents (in percent), nodule concentrations (in kg/m 2), and depths (in m) of metal ratios of manganese nodulesin water depths of less than 2,000 and more than 4,000 m[The Clarion-Clipperton zone is here taken to be the area defined by lat 7° to 15° N., long 114° to 153° W.]
<2,000 m >4,000 mStations outside Clarion-Clipperton
zone at >4,000 m
No. of No. ofstations Mean Range stations Mean
Mn--------------- 186 18.00 0.16-50.30 1,561 18.6 Fe---------------- 186 14.81 .42-41.9 1,557 11.7Ni---------------- 185 .41 .01-1.16 1,565 .71Cu --------------- 174 .08 .01-.73 1,565 .52Ni+Cu------------ 174 .50 .02-1.78 1,563 1.24Co--------------- 170 .53 .01 2.23 1,530 .24Nodule------------ 0 332 11.1
concentration.Depth------------- 188 1,266 46-2,000 1,576 4,946 4
PERCENT
CJ <k
Z
h- ZLUh-
COPPER CON
Ni
0Z<_JLU
CJ
Z
0
COMBIIS
D
1
' -" I/)
/ivi?'t » ** « *
No. ofRange stations Mean Range
0.04-42.30 1,249 17.10 0.04-42.30 .3-50.0 1,249 13.01 .83-50.00
.01-1.89 1,247 .58 .01-1.80
.01-1.90 1,247 .41 .01-1.90
.02-3.44 1,245 .99 .02-8.44
.01-1.04 1,221 .24 .01-1.04
.12-70.8 279 11.78 .18-70.8
,000-7,280 1,258 4,977 4,000-7,280
\
,.\
+ ' ' '' .
» " ' .
It * "
« * «, *.ji.^**-*- --.> V . * I;'v * * s ' f'. *"
. , « * ' ' » . . ' ." '
*' "
..' ' '' -v - ..* * 7 C » - *'* ' . '
* ' * »*. ***|. * * 4^*^
, ' * "; \"> '
' * " ."' . :,*' / 1 *' .»"*.
- ' ".rAv-' >.;>. & $11$^: \ . ,-: -^f \: ., «-^;::A^iVr.- -..- ...>-.- -: .-« -: ? M-;..'..f ..;.,r, .
. , '*'.*. »'* ' ..*'*.
1000 2000 3000 4000 5000
DEPTH, IN METERS6000 7000 8000
Figure 19. Relation between depth and combined nickel and copper content in manganese nodules at stations in the Scripps Institution of Oceanography's Sediment Data Bank (from McKelvey and others, 1983).
40 Mineral and Petroleum Resources of the Ocean

LU 2O QC UJ CL
zUJK
o o
O 1o
1000 2000 3000 4000 5000
DEPTH, IN METERS
6000 7000 8000
Figure 20. Relation between depth and cobalt content in manganese nodules in the Scripps Institution of Oceanogra phy's Sediment Data Bank (from McKelvey and others, 1983).
0.196; at the mean depth of 3,395 m for samples between 40° and 60° N., the ratio is 0.49; at the mean depth of 4,379 m for all Pacific stations, it is 0.71.
Means of other elements in water depths above and below 3,000 m are shown in table 17. If only those elements that have been analyzed at 10 stations or more in populations above and below the 3,000-m depth are compared, alu minum, silicon, potassium, scandium, and samarium are enriched in nodules below that depth, and boron, phospho rus, sulfur, calcium, vanadium, chromium, arsenic, stron tium, yttrium, barium, cerium, and lead are enriched in nodules above it. Means for several other elements (for example, sodium, magnesium, zinc, zirconium, molybde num, and lanthanum) are about the same in both groups.
Metal-Rich Types of Nodules
Three distinct, only rarely overlapping compositional types of possible economic interest can be recognized:(1) nodules containing more than 1 percent Ni+Cu,(2) nodules containing more than 0.5 percent Co, and(3) nodules containing more than 35 percent Mn (although nodules in this group contain more than 0.5 percent Co only exceptionally, they do average nearly 1.1 percent Ni+Cu) (McKelvey and others, 1983). The metal contents of these types are summarized in tables 18, 19, and 20; the groups having high combined nickel and copper contents and high cobalt contents have been broken into two parts. These groups are similar to ones that Howarth and others (1977)
Subsea Mineral Resources 41

zUJo ccUJ*- 3z
HzUJ
Zo oQC UJ Q.fe 2O
Q
<
UJ*O
QI 1002O o
V'
I * * ' -#.V.
v 7**. *
1000 2000 3000 4000 5000
DEPTH, IN METERS
6000 7000 8000
Figure 21. Relation between depth and combined nickel and copper content in Pacific Ocean manganese nodules at 1,770 stations in the Scripps Institution of Oceanography's Sediment Data Bank (from McKelvey and others, 1983).
defined for the composition of Pacific nodules by using a nonlinear mapping technique. Their group 2, for example, averages 0.60 percent Co, 0.56 percent Ni+Cu, and 15.58 percent Mn; their groups 3, 4, and 5 average 0.3, 0.27, and 0.17 percent Co, 1.15, 1.97, and 2.74 percent Ni+Cu, and 17.67, 22.07, and 26.99 percent Mn, respectively; their group 6 averages 0.06 percent Co, 1.05 Ni+Cu, and 34.29 percent Mn.
Tables 18 and 19 show nodules high in combined nickel and copper worldwide and outside the Clarion-Clipperton zone. Mean combined nickel and copper contents of nodules within the Clarion-Clipperton zone seem to be slightly richer than those of nodules outside, but nodules rich in combined nickel and copper have essentially the same
chemical compositions wherever they are found. Given the depth and latitude relations already discussed, one would expect nodules rich in nickel and copper to occur at abyssal depths in low latitudes; tables 18 and 19 and figures 28 and 29 confirm this expectation. Figures 28 and 29, however, show that nodules rich in nickel and copper also occur at higher latitudes. In both the Pacific and the Indian Oceans, nodules richest in nickel and copper are found mainly in the eastern parts (Cronan and Tooms, 1969; Tooms and others, 1969; Cronan, 1980). Nodules containing 1.8 percent Ni+Cu or more are essentially absent from the Pacific west of 180° W., even at low latitudes, and none have been reported west of 75° E. in the Indian Ocean (fig. 28). Only a few samples containing 1.8 percent Ni+Cu or more have
42 Mineral and Petroleum Resources of the Ocean

UJoDC UJ CL
Z Oocc 111Q. Q. O O
UJ
oZ
oUJZm
O o
1000 2000 3000 4000 5000
DEPTH, IN METERS
6000 7000 8000
Figure 22. Relation between depth and combined nickel and copper content in Atlantic Ocean manganese nodules at 296 stations in the Scripps Institution of Oceanography's Sediment Data Bank (from McKelvey and others, 1983).
Table 16. Principal metal contents of manganese nodules in water depths above and below 3,000 m
Element
M
Fe-- ------------Ni--------------Cu -------------Ni+Cu- ------Co--- ----------
No. of stations
..._-----.-. 324
............ 324
3 (\Q
irn
<3,000 m
Mean, in percent
17.161 C £.1
.39
.10
.50
.46
No. of stations
1,9311,9261,9361 9351 933
'
>3,000 m
Mean, in percent
18.6012.17
.69
.49118
.23
Subsea Mineral Resources 43

ccUJ
IOu
O OO
UJ
UzOUJ
5
O O
; '.. "v vi*U ^v!^V.''j : , ** ' '< .
' ".*' ' * ' * *«
_j______\_____\______\-1000 2000 3000 4000
DEPTH, IN METERS
5000 6000 7000
Figure 23. Relation between depth and combined nickel and copper content in Indian Ocean manganese nodules at 300 stations in the Scripps Institution of Oceanography's Sediment Data Bank (from McKelvey and others, 1983).
been reported from the Atlantic, but the largest concentra tions of samples containing > 1.0 to < 1.8 percent also lie on the eastern side of the basin (fig. 29).
Nodules containing >1.0 to <1.8 percent Ni+Cu are generally distinct from those in the cobalt- and manganese- rich groups. In comparison with nodules containing 1.8 percent Ni+Cu or more, they contain less manganese and more iron, and their copper-nickel ratio is appreciably lower.
Tables 18 and 19 indicate that the concentration of nod ules on the sea floor is inversely related to combined nickel and copper content, both in the lower average concentration found in nodules containing 1.8 percent Ni+Cu or more in
comparison with those containing >1.0 to <1.8 percent Ni+Cu and in the maximum nodule concentrations in each group. This relation was previously reported by Menard and Frazer (1978) and Frazer and Fisk (1981) for the entire Pacific but was found to be weak in the Clarion-Clipperton zone (McKelvey and others, 1979).
The manganese content of nodules high in cobalt (table 20) is similar to that of nodules high in combined nickel and copper, but the iron content is much higher. These cobalt- rich nodules are low in combined nickel and copper, and their copper-nickel ratio is also low. Comparison of the >0.5- to < 1.0-percent group shows that, in the > 1.0- percent group, manganese is appreciably higher, iron is
44 Mineral and Petroleum Resources of the Ocean

UJoQC
z Oo
GO O O
1000 2000 3000 4000 5000
DEPTH, IN METERS
6000 7000 8000
Figure 24. Relation between depth and cobalt content in Pacific Ocean manganese nodules at 1,710 stations in the Scripps Institution of Oceanography's Sediment Data Bank (from McKelvey and others, 1983).
slightly lower, the copper-nickel ratio is lower, and the average depth is about 1,000 m less. Figures 30 and 31 suggest, along with previous observations (Mero, 1962; Menard, 1964; Cronan and looms, 1969; Piper and Williamson, 1977; Calvert, 1978), that, although cobalt- rich nodules occur over a wide range of latitudes and longi tudes, those containing more than 1 percent or even more than 0.5 percent Co are relatively more populous in the central and western Pacific. The > 1.0-percent cobalt group is, in fact, essentially of the same composition, as are the encrustations reported by Craig and others (1982) from the Hawaiian Archipelago and by Manheim and others (1982) on mid-Pacific seamounts 1.0 percent Co, 0.5 percent Ni, 25.0 percent Mn, and <0.1 Cu in the crusts, according to
Manheim and others, in comparison with means of 1.25 percent Co, 0.55 percent Ni, 26.02 percent Mn, and 0.094 percent Cu for the same metals in the > 1.0-percent Co nodules shown in table 20. It is possible that some samples reported as nodules in the Sediment Data Bank may actually be encrustations.
Nodules containing more than 1.0 percent Co have not been reported in the Indian Ocean, but those containing 0.5 percent Co or more are confined to the western side of that basin. The number of samples in the ^ 1.0-percent Co group is only 27, perhaps not enough to justify much confidence in the observations made about them here.
Nodules high in manganese (table 20) also have been found at only 27 stations, again too few to support much
Subsea Mineral Resources 45

Table 17. Means of other elements in manganese nodules in water depths above and below 3,000 m [ , no data]
<3,000 m
Element
L--.- .....Be ---------------
C ----------------
Na--- ------ Mg ---- .A1
Si-. - .....P -_...._........_
o
d- -------------- _.
Ca ............ ....<5r
Ti-- ...............V-----------------Pr
Zn -----.------.--.Ga---------------
Ge----- - ---- .As ---------------Rb---. ............Si-------- -----Y--- -.- ....
Zr----------------Nb----------------Mo---------------.Ag --------Cd----------------
Sn ----------------Sb ----------------Te ----------------I----.....-........Ba - ---
La ----------------Ce ----- - Nd----------------Sm----------------Eu ----------------
Tb ----------------Yb----------------Lu ----------------Hf ----------------Ta ----------------
W-----------------Hg--~- ----- n- . - ....Pb ----------------
Th- - -----
No. of stations
....-----..... 5
.............. 10
.-..----...--. 33
.............. 2
.............. i
.............. 98
.....---...... 125
.............. 103
.....-------.. 94
.............. 51
.............. 12
....--.-...... o
.............. 119
.............. igg
.............. 21
1 1£.
f.0
.............. 52
.............. 188
....-..-.-.... 15
.............. o
.............. 14
.............. o
.............. 771£i
-____-----__._ Af\
.............. 15
.............. us
.............. o
.............. 23
.....-.--..... 19
.............. i
.............. o
.............. o
.............. 63
.............. 33
.............. 15
.............. 13
.....---...... 13
.............. 13
.............. n
.............. 36
.............. 13
.............. o
.............. o
.............. o
.....---..-... o
.............. 24
.............. 197
.............. 9
.............. 13
Mean, in percent
0.001.001040.vtU
.913 00
1.831.611.725.071.148
oc
.474.65
ftftl
.76
.071
.015
.11
.001
_.020
.122
.024
.057
.005
.045
.001
.004
.004
.34
.022
.087
.021
.003
.001
.001
.004
.000
_ni 8
.14002,\j\j£ .002
>3,000 m
No. of stations
143052£Q
1
310403478399O£«
9213
1£Q
88354
7481£.1
2211,118
41
44732
290
23952
7107
102
1228
171
398
4257242525
256419
89
221
1011,029
31105
Mean, in percent
0.013.001.022.311
3 on
2.021.5532 958 0Q
.22A 1
0-3
01
1.72Oft?
£Q
049006
.12
.001
.004
.012
.002
.075
.012
057.008.037.001.001
.009
.005
.02225 ^ J
.22
.021
.068
.028
.005
.001
.001
.002
.000
.001
.002
.010
.000
.016
.08001
.003
46 Mineral and Petroleum Resources of the Ocean

UJO QCUJCL
Oo
00O U
1000 2000 3000 4000 5000
DEPTH, IN METERS6000 7000 8000
Figure 25. Relation between depth and cobalt content in Atlantic Ocean manganese nodules at 285 stations in the Scripps Institution of Oceanography's Sediment Data Bank (from McKelvey and others, 1983).
generalization about them. The data, however, indicate that they are relatively low in iron (some are very low); the mean manganese-iron ratio is 16.12, in comparison with 4.43 for nodules of the 1.8-percent Ni+Cu type. The mean com bined nickel and copper content, 1.08 percent, falls in the lower range of the sl.O- to < 1.8-percent Ni+Cu group. Halbach and Fellerer (1980) found, for nodules from the southeastern Pacific, that combined nickel and copper in creases as the manganese-iron ratio increases up to about 5 and decreases as that ratio increases further.
Although the number of samples shown in figure 32 is small, all but two of them occur in the eastern and north equatorial Pacific (see also Mero, 1962; Cronan and Tooms, 1969; Skornyakova, 1979; Cronan, 1980; Heath, 1981).
Only one sample is in the Atlantic, and none have been found in the Indian Ocean. Whereas the nodules especially rich in manganese are found along the eastern margin of the Pacific Basin, Skornyakova (1979) reported that those rich in iron are from its western margin, where they have con centrations as high as 70 percent Fe2O3 and manganese-iron ratios of less than 1 (see also Price and Calvert, 1970).
Other elements in manganese nodules classed by metal type are shown in table 21. Examining the distribution of other elements hi nodules typed by their high contents of combined nickel and copper, manganese, and cobalt (table 21) indicates that several other elements follow these metals in their variations. The mean values of magnesium, alu minum, silicon, potassium, scandium, chromium, and zinc
Subsea Mineral Resources 47

Z UJ O DC UJ Q.
Z UJ
O O
00OO
1000 2000 3000 4000
DEPTH, IN METERS
5000 6000 7000
Figure 26. Relation between depth and cobalt content in Indian Ocean manganese nodules at 289 stations in the Scripps Institution of Oceanography's Sediment Data Bank (from McKelvey and others, 1983).
Table 18. Metal contents (in percent), nodule concentrations (in kg/m2), and depths (in m) of manganese nodules containing 1.0 percent Ni+Cu or more
>1.8 percent Ni+Cu
Mil-------"--" ---.Co
Ni-- -- - -" .Cu -Ni+Cu-- .Co - Nodule concentrationDepth - -
No. of stations
----- 557. . . . . 554----- 561----- 561----- 561. . . . . 527----- 141
fftf.
Mean
26.17 6.89 1.29 1.05 2.34
.21 5.9
4,720
Range
14.02-45.6 .3-16.92
.56-1.95
.33-1.90 1.81-3.44 .01-.63 12 27 25
2,660-6,401
>1-<1.8 percent
No. of stations
459 457 465 465 465 444
76 423
Mean
20.4 10.2
.85
.54 1.39
.23 9.3
4,668
Ni+Cu
Range
7.11-45.5 1.0-22.2 .24-1.43 .06-1 .22 1.0-1.8 .01-1.0 .18-30
1,116-6,965
48 Mineral and Petroleum Resources of the Ocean
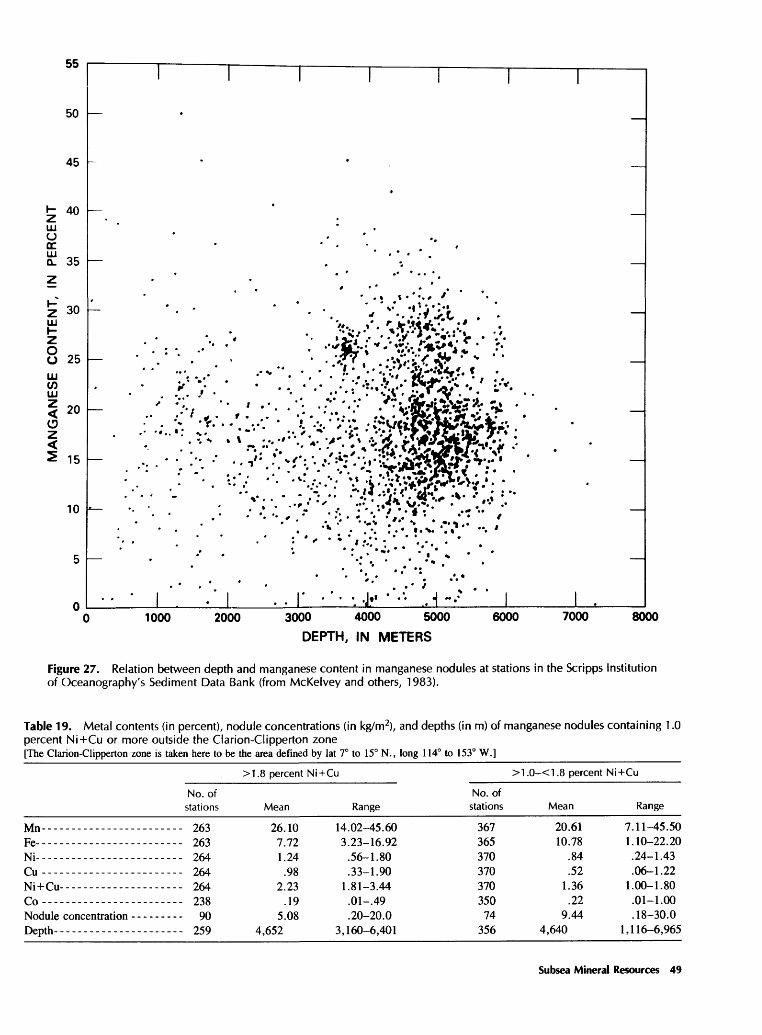
55
50
45
^ 40UJU <ra! 35
2 30UJ
Z
8 25
UJ COUJ
20
15
10
1000 2000 3000 4000 5000
DEPTH, IN METERS
6000 7000 8000
Figure 27. Relation between depth and manganese content in manganese nodules at stations in the Scripps Institution of Oceanography's Sediment Data Bank (from McKelvey and others, 1983).
Table 19. Metal contents (in percent), nodule concentrations (in kg/m2), and depths (in m) of manganese nodules containing 1.0percent Ni+Cu or more outside the Clarion-Clipperton zone[The Clarion-Clipperton zone is taken here to be the area defined by lat 7° to 15° N., long 114° to 153° W.]
Mn-------------------fta
^i.... .................
Cu-------------------Ni+Cu----------------Co --------------------
Depth- ----------------.
No. of stations
*^£.1
O£1
. . . _ . 264
. . . . . 264
. . . . . 264T30
----- 90. . _ . . 259
>1.8 percent Ni+Cu
Mean
26.10 1 7.72 1.24
.98 2.23
.19 5.08
4,652 3
>1.0-<1.8 percent Ni+Cu
Range
4.02-45.60 3.23-16.92
.56-1.80
.33 1.901.81-3.44 .01-.49 .20-20.0
,160-6,401
No. of stations
367 365 370 370 370 350
74 356
Mean
20.61 10.78
.84
.52 1.36
.22 9.44
4,640
Range
7.11-45.50 1.10-22.20 .24-1.43 .06-1.22
1.00-1.80 .01-1.00 .18-30.0
1,116-6,965
Subsea Mineral Resources 49

180°W. 150°W. 120-W. 90°W.8CTN. r
60-W. 30-W. 30°E. 60°E. 90°E. 120"E. 150°E. 180°E.
60°N.
60°S.
80"S.
Figure 28. Distribution of manganese nodules containing 1.8 percent Ni+Cu or more (from McKelvey and others, 1983).
in the > 1.8-percent Ni+Cu group are appreciably higher than those in the >0.5- to < 1.0-percent Co group. The highest means for magnesium (1.87 percent), scandium (0.018 percent), and chromium (0.013 percent) are in the ^ 1.8-percent Ni+Cu group, which also has the lowest
mean values for sulfur (0.22 percent), calcium (1.59 per cent), strontium (0.06 percent), lanthanum (0.013 percent), cerium (0.035 percent), and lead (0.048 percent); the mean for vanadium (0.043 percent) in this group is also apprecia bly lower than that in the >0.5-percent Co groups but is
Table 20. Metal contents (in percent), nodule concentrations (in kg/m2), and depths (in m) of manganese nodules containing more than 0.5 percent Co and more than 35 percent Mn
^ 1.0 percent Co >0.5-<1.0 percent Co >35 percent Mn
Mn-------------Fe-------------Ni-------------.Cu ---- --.Ni+Cu---------.Co------------.Nodule ---------
concentration. Depth----- ------
No. of stations
--- 27--- 27--- 27--- 27--- 27--- 27... o
--- 23
Mean
26.02 15.6
.55
.094
.64 1.25
1,764
Range
18.83-50.3 9.5-20.3
.3-1.25 .03-. 36 .33-1.5 1.0-2.23
795-5,192
No. of stations
155 154 155 150 150 155
4
152
Mean
20.0 16.54
.44
.16
.60
.64 17.2
2,791
Range
6.3-45.5 4.2-26.0 .11-1.47 .02-1.50. 17 £.O
.5-.91 1.8-30
64-5,775
No. of stations
27 27 27 27 27 24
1
27
Mean
38.68 5.74
.69
.38 1.08
.24 3.6
3,467
Range
35.12-50.3 .65-15.8 .05-1.74 .01-1.37 .06-3.11 .01-1.5
260-5,276
50 Mineral and Petroleum Resources of the Ocean

80°N180«W. 150°W. 120°W. 90*W. 6(TW. 30°W. 0° 3(TE. 60°E. 90T. 120°E. 15CTE. 1WE.
60°N.
40°N.
20°N.
20°S.
40°S.
60°S.
BO'S.
Figure 29. Distribution of manganese nodules containing >1.0 and <1.8 percent Ni+Cu (from McKelvey and others, 1983).
about the same as that in the ^35.0-percent Mn group. The ^0.5-percent Co groups have the highest means for phos phorus (0.531 percent), calcium (2.83 percent), titanium (1.07 percent), vanadium (0.069 percent), strontium (0.14 percent), yttrium (0.031 percent), zirconium (0.072 per cent), lanthanum (0.027 percent), cerium (0.133 percent), and lead (0.26 percent) and the lowest means for magnesium (1.337 percent), aluminum (0.71 percent), silicon (2.00 per cent, at only six stations, however), potassium (0.32 per cent), and zinc (0.07 percent). The >35.0-percent man ganese group has the highest means for sodium (2.77 percent, at only nine stations) and barium (0.423 percent) and the lowest means for phosphorus (0.120 percent, at only seven stations), titanium (0.253 percent), and vanadium (0.041 percent at only eight stations). The mean for silicon (4.68 percent) in this group is appreciably lower than that in the high combined nickel and copper groups, and it is lower also than the silicon mean in the ^0.5- to < 1.0-percent Co group (5.18 percent).
Although the covariance of other elements with the prin cipal metals in manganese nodules supports the idea that the
metal groups described are geochemically distinct, the metal groups do not include the maximum values for several other elements namely, titanium (8.9 percent), phosphorus (6.03 percent), sulfur (3.50 percent), potassium (3.70 per cent), calcium (28.73 percent), scandium (0.269 percent), vanadium (0.5 percent), zinc (9.00 percent), molybdenum (0.220 percent), barium (2.14 percent), lanthanum (0.07 percent), cerium (0.30 percent), yttrium (0.095 percent), neodymium (0.07 percent), and lead (0.75 percent). Be cause many of these maximums are larger than the means by an order of magnitude or more, one might suspect that they are simply erroneous. That this explanation may not be valid, however, is suggested by the fact that their maxi mums in each ocean are also much higher than the world mean (table 22). For example, the world maximum for titanium (8.90 percent) comes from the Pacific, but the highest values in the Atlantic and Indian Oceans are 2.03 and 1.76 percent, respectively. The maximum for zinc (9.0 percent) is from the Indian Ocean, but the high values in the Atlantic and Pacific Oceans are 8.0 and 7.0 percent, respec tively. It seems possible, then, that types of metal-rich nod-
Subsea Mineral Resources 51

80°N.180°W. 150°W. 120*W. 90°W. 60*W. 30°W 30°E. 60°E. 90°E. 120°E. 150°E. 180*E.
60°S.
80°S.
Figure 30. Distribution of manganese nodules containing 1.0 percent Co or more (from McKelvey and others, 1983).
ule groups other than those discussed here may exist and that some of them may have potential economic value.
The Sediment Data Bank had no analyses for platinum metals and gold in manganese nodules as of March 1980. In 1932, however, V.M. Goldschmidt and C. Peters (see Goldschmidt, 1954) reported 0.5 ppm Pt, 0.2 ppm Pd, and 0.2 ppm Rh in a nodule from Challenger Station No. 286 in the southeastern Pacific (133°22' W., 33°29' S.). Harriss and others (1968) determined palladium, iridium, and gold values in several nodules and found ranges of 0.24 to 9.25 ppb Pd, 0.90 to 23.1 ppb Ir, and 0.21 to 8.28 ppb Au. Although individual analyses thus vary considerably, the averages for each metal in both Atlantic and Pacific nodules are similar, and no correlation with any other major and trace metals was found.
Recently, P.J. Aruscavage (see Flanagan and Gottfried, 1980) determined platinum, palladium, and ruthenium val ues for the two nodule samples used by the USGS as stand ard samples. The one from the Clarion-Clipperton zone (at 124°28' W., 14°50' N.) contains 123 ppb Pt, 5.6 ppb Pd, and 4.7 ppb Ru, and the one from the Blake Plateau (at
78°22' W., 31°02' N.) contains 453 ppb Pt, 2.5 ppb Pd, and 18 ppb Ru. Analyses of 12 other nodules from the western Atlantic (Manheim and others, 1980a) show that iron- enriched nodules from seamounts have the lowest platinum values, the maximum being 120 ppb. Elements best corre lated with platinum in these samples are nickel and cad mium. The rhodium content of these samples ranges from 2 to 30 ppb. Halbach and others (1984) recently found that platinum concentrations in ferromanganese seamount crusts from the central Pacific range from 0.14 to 0.8 ppm, older crust generally being richer (~0.6 ppm) than younger crust (~0,3 ppm Pt). The shallower the water, the higher the platinum content. The platinum contents correlate positively with nickel and with the manganese-iron ratio.
Because so few samples have been analyzed for precious metals, nothing can be said about their geographic or geo- chemical distributions. If the few data available are reliable, they do suggest that the concentrations of silver in the nod ules and of the metals that are commonly associated with gold in its ores (antimony, tellurium, and bismuth) are geo- chemically remarkable, even though the actual amounts are
52 Mineral and Petroleum Resources of the Ocean

Table 21 . Other elements in manganese nodules of the world, grouped by combined nickel and copper, manganese, and cobaltcontents[ , no data]
a 1.8 percentNi+Cu
Element
L-------R*
r .......F .-.---.
Ma ....
Mg------A1-------Si-------p .......
SI ...----
Q .......
Ca ------Sc- ------
Ti-------V-------Cr-------Zn------Ga ------
Ge ------As ------DU
Sr-------Y-------
Zr-------Nb------Mo------
f* j
Sn ------Ol_
Te ------
Ba------
T a - - -
Ce ------Nd------Sm------Fu ------
T*!*
V1»
Lu ------TJf
Ta ------
No. of stations
4-- 6-- 15-- 15-- 0
4678
ion-- 111-- 61
07
4-- 73
07Q
-- 16
-- 169-- 69
-- 371-- 10
0-- 19
18-- 55-- 33
A !*>437
1 Q£
0-- 29
6451
78
-- 11
-- 22
455
5-- 17
24n
Mean, in percent
0.018 .0002 .02 .23
2.02 1.87 2.65 6.98
.21
.22
.86
.79 1.59
.018
.47
.043
.013
.14
.002
.008
.002
.06
.011
.049
.007
.05
.002
.010
.004
.024
.25
.288
.013
.035
.021
.003
.001
.001
.002
.000
.001
>1.0-<1.8 percentNi+Cu
No. of stations in
5 12 20 22
1
67 91
111 111 70
32 5
80 191
19
169 95 55
267 16
1 14
8 80 32
55 17
175 3
28
26 4 9 0
101
15 15 7
10 10
10 22
7 4 n
Mean, percent
0.020 .000 .027 .321
3.00
1.97 1.57 2.96 8.26
.288
.319
.860
.86 1.73
.001
.58
.05
.001
.14
.001
.000
.012
.001
.077
.012
.050
.007
.039
.001
.001
.009
.005
.021
.224
.019
.066
.023
.004
.001
.001
.002
.000
.001
>35.0 percentMn
No. of stations
0 0 61 0
9 9
11 117
3 0
10 14
3
16 8 5
114
01 0 8 5
61
13 0 0
1 0 0 0
10
1 0 0 0 0
0 5 0 0 n
Mean, in percent
0.016 .93
2.77 1.67 2.09 4.68
.120
.547
.72 1.64
.001
.253
.041
.001
.08
.001
.002
.070
.007
.033
.001
.056
.009
.423
.018
.002
&1.
No. of stations
0 0 5 0 0
7 8
12 64
1 0 8
114
16 9 3
12 1
0 1 07 5
6 1
11 0 1
2 0 0 0 8
62 2 2 2
1 6 2 0 n
0 percent Co
Mean, in percent
0.041
1.99 1.47 .71
2.00 .32
1.2
.32 2.72
.001
1.07 .069 .002 .07 .002
.027
.14
.031
.072
.007
.060
.000
.022
.333
.024
.133
.032
.005
.001
.000
.005
.001
*0.5-<
No. of stations
2 6 9 2 1
37 47 46 39 23
3 0
43 81
8
80 34 28 85 4
07 3
27 14
18 7
63 0
15
5 0 1 0
39
13 10 5 4 4
4 12 4 0 n
C1.0 percent Co
Mean, in percent
0.000 .001 .032 .080
3.0
1.80 1.337 1.81 5.18
.531
1.199
.49 2.83
.001
1.01 .064 .001 .14 .001
.016
.001
.119
.021
.061
.006
.048
.001
.004
.021
.286
.027
.098
.034
.006
.001
.001
.004
.000
Subsea Mineral Resources 53

Table 21 . Other elements in manganese nodules of the world, grouped by combined nickel and copper, manganese, and cobalt contents Continued [ , no data]
2:1.8 percentNi+Cu
Element
W-------Hg------
O
Tl-------Pb ------ft:
T*U
No. of stations
10
-- 25-- 301
139
Mean, in percent
.003
.02
.048
.001
.002
>1.0-<1.8 percentNi+Cu
No. of stations
2 0
24 229
9 24
Mean, in percent
.004
.013
.071
.002
.003
> 3 5.0 percent >1.0 Mn
No. of stations
0 0 1
19 0 1
Mean, in percent
.000
.09
.005
No. of stations
0 02
12 2 1
percent Co
Mean, in percent
.037
.26
.003
.001
>0.5-<1.0 percent Co
No. of stations
0 0
15 95
4 10
Mean, in percent
.020
.17
.003
.003
small. The world means for silver, antimony, tellurium, and bismuth in the nodules (table 17) are 0.001, 0.005, 0.022, and 0.003 percent, respectively, and represent concentration factors above the averages in oceanic crust (according to Lee and Yao, 1970) of 110, 55, 250,000, and 200 percent, respectively.
Interest in recovering metals from subsea manganese nod ules has thus far focused on nickel, copper, cobalt, and (on the part of a few companies) manganese. It seems possible, however, that some other elements (molybdenum and vana dium, for example) may also prove to be recoverable as coproducts, particularly if hydrometallurgical processes are used to concentrate the metals.
80*N180*W. 15CTW. 120-W. 90*W. 60-W. 30°W. 3<TE. BO-E. 90°E. 120°E. 1WE. 180°E.
60*N
ears.
80*S
Figure 31. Distribution of manganese nodules containing >0.5 and <1.0 percent Co (from McKelvey and others, 1983).
54 Mineral and Petroleum Resources of the Ocean

80°N180°W. 150°W. 120*W. 90°W. 60*W. 3(n/V. 0° 30°E. 60°E. 90°E. 120°E. 150°E. 180°E.
60°S.
80°S.
Figure 32. Distribution of manganese nodules containing 35.0 percent Mn or more (from McKelvey and others, 1983).
Mineralogy
Many of the variations in the chemical compositions of nodules are reflected in their mineralogy. Mineralogical studies are difficult because most component particles, are submicroscopic, but much progress has been made, begin ning with the pioneering X-ray diffraction studies of Buser and Grutter (1956). They described three manganese oxide minerals in nodules by identifying their X-ray patterns as those of synthetic analogs and named then 10-A manganite, 7-A manganite, and AMnO2 . They also identified the ferric oxyhydroxide mineral goethite as a component of the nod ules. Subsequent workers (Straczek and others, 1960; Hewett and others, 1963; Manheim, 1965; Cronan and Tooms, 1969) correlated the 10-A manganite with todor- okite and the 7-A manganite with birnessite. Controversy has developed over the terminology used to describe the manganese minerals and indeed over the question of whether they are valid minerals (see Burns and Burns (1977) for a review), but there seems to be no disagreement over the existence of the three phases. Most authors, following
the recommendations of Burns and Burns (1977), have re ferred to them as todorokite, birnessite, and AMnO2 . Chukhrov and others (1979), however, recently proposed that the AMnO2 phase be called vernadite. Burns and Burns (1979) accepted that proposal, and that usage is adopted here. Haynes and others (1982), in addition to the three main manganese oxide minerals, listed 11 other manganese oxide minerals as having been identified, though rarely, in manganese nodules.
Although goethite (alpha FeOOH) has been reported by some investigators, the iron phase is generally believed to be amorphous hydrated ferric oxide (Burns and Burns, 1977; Bischoff and others, 1981). Haynes and others (1982) listed eight other iron oxide minerals as having been identified in the nodules; of these, they said that lepidocrocite (gamma FeOOH) and feroxyhyte (delta FeOOH) are the most com monly observed.
All three main manganese minerals can be present in individual nodules, and it appears that vernadite is present in most of them. Birnessite is less common and generally occurs only if the other two are also present (Barnes, 1967;
Subsea Mineral Resources 55

Table 22. World means and ocean maximums (in percent) of several other elements in manganese nodules that have excep tionally high concentrations [ , no data]
Element
p ........_.....c
Ca- ---------Ti--------------Sc- ------
V --------Cr- -Zn -------------Y--------------Mo - Ba-------------La -------------Ce -------------Nd-------------Pb -------------
World mean---------- 037.......... .51..-_---_.. 73----..--.. 2.23.....---.. .69
rjn«
---------- 052----- 007
.......--. .12---------- .015---------- .038.......... .23.......... .021.......... .072...-.---.. .026---------- .093
Pacific5 121.903.70
24.0S on
.269500. JW
2317.00
095.220
1.65.070.300.070.46
Maximum
Atlantic
6 m
2 5012.71
28.732 03
0041
.15
.0178.00
.07 1 1
.177
.800
.033 1 .40
Indian
4.423.50
.6514.93
1.76001 1
.102
.0139.00
.038 1
.0662.14
.029 1
.3001
.015 1
.75
'Based on fewer than 10 samples.
Piper and others, 1979; Bischoff and others, 1981). The vernadite phase is extremely fine grained, and, when it occurs in nodules, it contains admixed amorphous iron hy droxide and extremely fine grained silicate minerals (Usui, 1979; Halbach and Ozkara, 1979), including some of extra neous origin. Recently, Bischoff and others (1981) have shown that the mineral phillipsite (K, Na, Ca)^ (Si, A1)8O 16 -H2O, according to Fleischer (1980) is also ubiq uitous in the nodules and forms in place on the growing nodules, as the manganese minerals and amorphous iron hydroxide do. Bischoff and his coworkers suggested, in fact, coupled and mutually catalytic reactions in which the alteration of phillipsite from volcanic glass locally raises the pH and stimulates the oxidation of Mn +2 ; this process, in turn, releases the hydrogen required in the formation of phillipsite. Haynes and others (1982) listed 34 accessory minerals as having been identified in the nodules; a few of these minerals are authigenic, but most are elastics acciden tally incorporated in the growing nodules.
Origin
Early interest in the origin of manganese nodules focused on the source of the manganese. Sir John Murray postulated its release from ocean-floor basalt by submarine weathering (Murray, 1877), but his coauthor in the Challenger reports, A.M. Renard, favored a seawater source, the manganese presumably being derived from continental runoff (Murray and Renard, 1891). K.W. vonGumbel, however, proposed a subsea hydrothermal source (Berger, 1986). Although the importance of the hydrothermal source of metals in the
deep-sea environment is recognized to a much greater extent now than it was in von Gumbel's time, the other sources identified by Murray and Renard also contribute. Interest in the origin of the nodules in recent years has focused more on the factors controlling their deposition, composition, and distribution.
Abundant evidence has accumulated to show that varia tions in the metal contents of these minerals are reflected in variations in bulk nodule chemical composition. The struc ture of todorokite (Mn+2 , Ca, Mg)Mn+4O7 -H2O (Fleis cher, 1980) includes sites in which small divalent cations, such as nickel, copper, magnesium, and zinc, can replace Mn+2 and other sites that will accommodate large cations, such as potassium. Birnessite Na4Mn14O27 -H2O (Fleis cher, 1980) apparently has somewhat similar properties (Burns and Burns, 1977). It is the nodules rich in todorokite and birnessite that are rich in nickel and copper and the other minor metals previously described as most abundant in the > 1-percent Ni+Cu type (Burns and Fuerstenau, 1966; Barnes, 1967; Cronan and Tooms, 1969; Tooms and others, 1969; Margolis and Burns, 1976; Piper and Williamson, 1977; Calvert and Price, 1977; Halbach and Ozkara, 1979; Usui, 1979; Piper and others, 1979; Cronan, 1980; Bischoff and others, 1981). It is also the todorokite-rich nodules that have a manganese-iron ratio greater than 1.5 (Margolis and Burns, 1976; Piper and Williamson, 1977; Calvert and Price, 1977; Halbach and Ozkara, 1979). On the basis of microprobe analyses of individual layers of todorokite and the AMnO2 (vernadite) phase (including the amorphous iron) in nodules from the north-central Pacific, Usui (1979) found several of the elements that he examined to be parti-
56 Mineral and Petroleum Resources of the Ocean

tioned between the two phases by grade, such that concen trations of manganese greater than 30 percent, of both cop per and nickel greater than 0.8 percent, of magnesium greater than 0.8 percent, of potassium greater than 0.6 per cent, and of sodium greater than 0.5 percent are in the todorokite phase and concentrations below those values are mostly, if not entirely, in the vernadite phase. Amounts of iron greater than 4 percent and of silica greater than 1.2 percent are restricted to the AMnO2 phase (vernadite). Cobalt has about the same range in both phases, but most of the concentrations greater than 0.3 percent are in the AMnO2 phase, and most below that value are in todorokite.
Although a number of authors have reported a positive correlation between cobalt and iron, Usui found a positive correlation between cobalt and manganese and concluded that trivalent cobalt is substituting for manganese in the vernadite phase and that some divalent cobalt may substitute for manganese in the todorokite phase (10-A manganite phase in his terminology). Burns (1976) made a similar proposal and suggested that the formula for AMnO2 (verna dite) should be (Mn, Co+3)Mn6O 13 -H2O. Halbach and Ozkara (1979) reported similar findings in studies of nod ules from an area within the Clarion-Clipperton zone. Nod ules consisting mainly of todorokite contain 23 to 32 percent Mn, 2 to 3.2 percent Ni+Cu, 0.1 to 0.2 percent Co, and less than 7 percent Fe; those consisting mainly of vernadite con tain 16 to 24 percent Mn, 1.0 to 1.6 percent Ni+Cu, 0.25 to 0.40 percent Co, more than 1 percent TiO2 , and more than 9 percent Fe and have an manganese-iron ratio of 2.5 or less.
Bischoff and others (1981) believed that titanium, phos phorus, and some silica are associated with the amorphous iron phase, and Calvert and Price (1977) showed a similar correlation of arsenic, yttrium, lead, strontium, and co balt with iron. Even though amorphous iron hydroxide is physically a part of the vernadite phase in the nodules, its content varies independently of the vernadite content. Vari ations in the chemistries of the nodules are thus best under stood as variations in their contents of authigenic todorokite- birnessite, vernadite, amorphous iron hydroxide, and phillipsite, along with clay and other siliceous minerals of extraneous origin. To illustrate compositional variations in the authigenic components of nodules, Bischoff and others (1981) used a ternary diagram in which all of the manganese phases are lumped together and plotted against the phillip site and amorphous iron phases. Figure 33 follows this de sign and shows an almost complete gradation of mineral composition within the ranges of about 4 to 55 percent manganese oxide phases, 7 to 37 percent amorphous iron phase, and 7 to 60 percent phillipsite phase.
Given the mineralogy of the nodules, it is easy to under stand the concentration of so many of the chemical ele ments. Not only does the structure of todorokite favor the incorporation of many elements, but also both iron and manganese oxides are well known for their abilities to scav
enge other metals from seawater by physical adsorption (Goldberg, 1954). It is also easy to understand variation in metal content as a function of mineralogy, at least in large part. But to what factors do variations in the proportion of mineral phases relate?
Relation to Water Depth
Barnes (1967), Cronan (1967), Cronan and Tooms (1969), and Piper (1972) found that the relation between metal content and water depth is also a function of the mineralogy of the nodules, todorokite being more abundant in deeper water nodules and vernadite being dominant in nodules from shallower depths. The three manganese oxide phases represent different degrees of oxidation of man ganese, and Cronan and Tooms (1969) concluded that vari ations in the mineralogy of nodules with depth may reflect variations in the degree of oxidation of the environment of deposition. Piper and Williamson (1977) found support for this theory in the fact that the few nodules containing more than 0.5 percent Co and occurring in water depths greater than 3,000 m are from the area immediately west of the Line Island Ridge, where there is a major intrusion of highly oxidizing antarctic bottom water. Halbach and Manheim (1984), however, pointed to the presence of an oxygen minimum in the central Pacific, where the seamount de posits are richest in cobalt, and suggested that cobalt enrich ment in these waters rather than oxidizing environmental conditions account for the elevated cobalt concentrations.
Cronan (1980) related the increase in the combined nickel and copper content of nodules that takes place at a depth of about 3,000 m to the lysocline, the depth at which calcium carbonate inorganic remains begin to dissolve and to liberate metals (particularly copper) concentrated by organisms. Be cause copper is more concentrated in the skeletons of many organisms than nickel is (Halbach and others, 1979), this process would also explain the fact that copper-nickel ratios in shallow-water nodules are lower than those in deep-water nodules. (Heath (1981) has reviewed the importance of sur face plankton in the concentration of metals.)
Effects of Direct Precipitation from Seawater in Comparison with Those from Diagenetic Precipitation
Another factor that may explain differences in nodule mineralogy involves the source and manner of deposition of their components. Rabb (1972) found that many nodules have a smooth upper surface and a gritty, lumpy bottom. Separate analyses of tops and bottoms showed that the tops are high in iron, cobalt, and lead and low in copper, nickel, molybdenum, zinc, and manganese and that the reverse is true for the bottoms. Calvert and Price (1977), Halbach and Fellerer (1980), Piper and others (1979), and Usui (1979) have suggested that the upper surfaces of such nodules (shown to be composed of vernadite) represent precipitate derived directly from seawater and that the bottoms (todor okite) represent a diagenetic precipitate derived by leaching
Subsea Mineral Resources 57
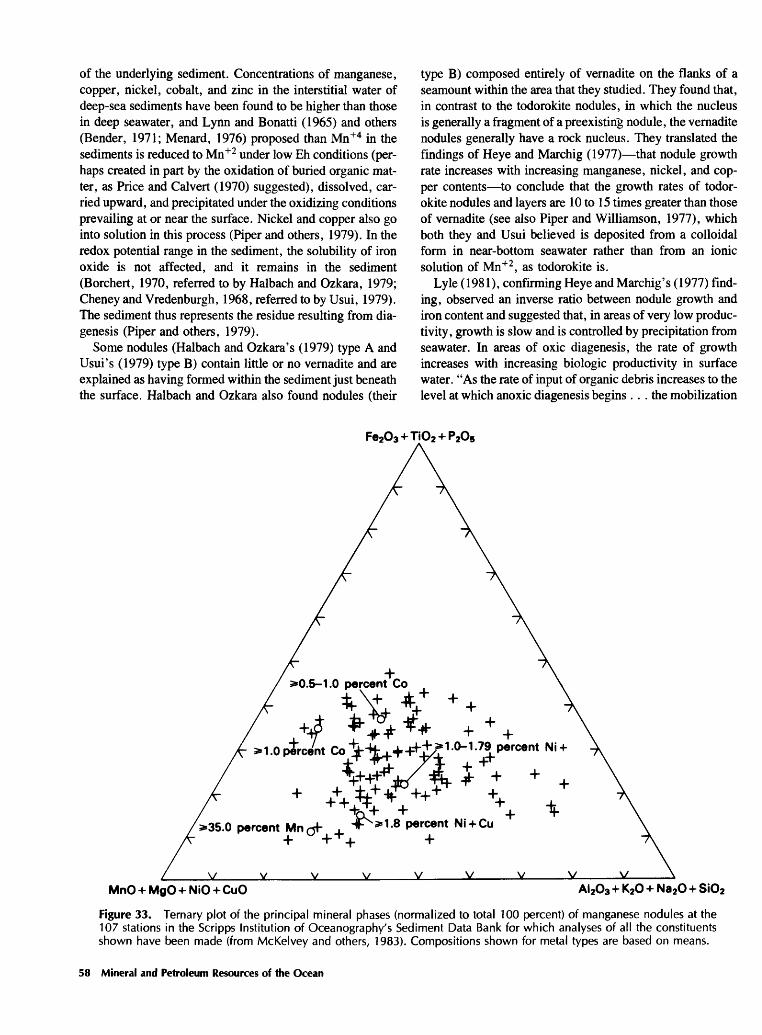
of the underlying sediment. Concentrations of manganese, copper, nickel, cobalt, and zinc in the interstitial water of deep-sea sediments have been found to be higher than those in deep seawater, and Lynn and Bonatti (1965) and others (Bender, 1971; Menard, 1976) proposed than Mn+4 in the sediments is reduced to Mn+2 under low Eh conditions (per haps created in part by the oxidation of buried organic mat ter, as Price and Calvert (1970) suggested), dissolved, car ried upward, and precipitated under the oxidizing conditions prevailing at or near the surface. Nickel and copper also go into solution in this process (Piper and others, 1979). In the redox potential range in the sediment, the solubility of iron oxide is not affected, and it remains in the sediment (Borchert, 1970, referred to by Halbach and Ozkara, 1979; Cheney and Vredenburgh, 1968, referred to by Usui, 1979). The sediment thus represents the residue resulting from dia- genesis (Piper and others, 1979).
Some nodules (Halbach and Ozkara's (1979) type A and Usui's (1979) type B) contain little or no vernadite and are explained as having formed within the sediment just beneath the surface. Halbach and Ozkara also found nodules (their
type B) composed entirely of vernadite on the flanks of a seamount within the area that they studied. They found that, in contrast to the todorokite nodules, in which the nucleus is generally a fragment of a preexisting nodule, the vernadite nodules generally have a rock nucleus. They translated the findings of Heye and Marchig (1977) that nodule growth rate increases with increasing manganese, nickel, and cop per contents to conclude that the growth rates of todor okite nodules and layers are 10 to 15 times greater than those of vernadite (see also Piper and Williamson, 1977), which both they and Usui believed is deposited from a colloidal form in near-bottom seawater rather than from an ionic solution of Mn+2 , as todorokite is.
Lyle (1981), confirming Heye and Marchig's (1977) find ing, observed an inverse ratio between nodule growth and iron content and suggested that, in areas of very low produc tivity, growth is slow and is controlled by precipitation from seawater. In areas of oxic diagenesis, the rate of growth increases with increasing biologic productivity in surface water. "As the rate of input of organic debris increases to the level at which anoxic diagenesis begins ... the mobilization
MnO + MgO + NiO + CuO AI2O3 +K2O + Na20 + SiO2
Figure 33. Ternary plot of the principal mineral phases (normalized to total 100 percent) of manganese nodules at the 107 stations in the Scripps Institution of Oceanography's Sediment Data Bank for which analyses of all the constituents shown have been made (from McKelvey and others, 1983). Compositions shown for metal types are based on means.
58 Mineral and Petroleum Resources of the Ocean

of Mn under anoxic conditions results in rapid nodule growth that virtually swamps the input of other metals, leading to lower Cu and Ni contents" (Heath, 1981, p. 757). This process, Heath believed, explains the high manganese content of nodules in the hemipelagic sediment along the eastern margin of the Pacific.
The three types of nodules described by Halbach and Ozkara are all from within a relatively small area in which the water depths range from 4,600 m at the summit of a seamount to 5,200 m on the surrounding ocean floor. The presence of both todorokite and vernadite in the same nod ules indicates that both minerals may form in the same macroenvironment. Halbach and Ozkara believed that the type formed is governed by topography, the availability of rock fragments to serve as nuclei, local sedimentation rate, and bottom-current activity. Vernadite forms as nodules or crusts on rock surfaces where no sediment has accumulated or on the tops of nodules exposed to seawater, and todor okite forms at or near the surface of the sediment, which is largely radiolarian ooze in the southern part of the Clarion- Clipperton zone and red clay in the northernmost part. Nod ules containing adjacent laminae of both minerals (the A type of Usui and the AB type of Halbach and Ozkara) reflect merely a change in the nodule's exposure to seawater (for example, burial by sediment to deposit todorokite on top of vernadite or a winnowing away of enough sediments to uncover a nodule forming near the bottom surface). Local variations in nodule content within the Clarion-Clipperton zone, in which the todorokite-vernadite nodules are most common (Halbach and Ozkara, 1979), may thus reflect dif ferences in the todorokite contents of the nodules as a result of local variations in their exposure to seawater. Cronan (1977), however, suggested that, although the presence of todorokite is a probable prerequisite for the enrichment of nickel and copper in the nodules, it is not the only factor, for some todorokite-rich nodules outside the North Pacific have lower contents of these metals.
The great concentration of manganese with respect to iron in Clarion-Clipperton zone nodules is thus explained as a diagenetic mobilization of manganese in sediments in which the iron, although it is several to many times more abundant than manganese, remains fixed. More puzzling is the fact that, in the vernadite-amorphous iron phase apparently formed by colloidal precipitation from seawater, the manganese-iron ratio, although averaging only about 1.5 according to Usui's analyses, is the reverse of what it is in seawater. For whatever reason, proportionately more iron than manganese leaves seawater in some other way.
This fact leads to other interesting questions. Why do the iron and manganese phases occur together, and why do they commonly occur as nodules? As Halbach and Ozkara (1979) and others indicated, they occur as encrustations on bedrock where nucleating grains are absent. The tendency for ex tremely fine grained particles to form aggregates is common with many other kinds of materials; Ramberg (1952) at
tributed this tendency to differences in surface energy that lead to a lower free energy in clusters rather than in dissem inated form. The scarcity of iron-manganese minerals indi cates that iron and manganese have little chemical affinity, but Burns and Burns (1977, p. 246) pointed out that:
. . .although AMnO2 and Fe OOHxH2O consist of very small disordered crystallites, both phases contain cations in octahedral sites of hexagonally closed packed oxygen layers. Therefore, these two phases in manganese nodules are highly sus ceptible to epitaxial intergrowth (that is, oriented intergrowth of one phase on the other where lat tice parameters or interplanar spacings are similar) which probably initiates nucleation and leads to the intimate association of manganese and iron oxide phases.
As I mentioned earlier, Bischoff and others (1981) thought that the other main constituent of manganese nodules, phillipsite, may form as a coupled reaction with the man ganese oxides. It thus appears that there are good reasons for these chemically distinct phases to occur together in the nodules.
Because both todorokite and vernadite phases can form in the same macroenvironment, it would seem that, of the factors previously proposed as affecting the composition of the nodules, hydrostatic pressure (Barnes, 1967), dissolved oxygen (Cronan and Tooms, 1969), and pH-Eh conditions within the abyssal aqueous environments (Crerar and Barnes, 1974) do not control the deposition of todorokite versus vernadite or the ratio between the two. Such physio- chemical factors, however, may influence their minor- element contents. The enrichment in the cobalt contents of nodules from shallow depths, for example, has been as cribed to oxidation from Co+2 to Co +3 under the highly oxidizing conditions prevailing on seamounts and similar features (Goldberg, 1961; Burns, 1965; Cronan and Tooms, 1969; Piper and Williamson, 1977), and Goldberg (1965) suggested a similar effect with respect to lead. Halbach and Manheim (1984), however, attributed the high cobalt con tent in central Pacific seamount deposits to cobalt enrich ment in those waters, another possible factor in metal en richment. The wide variations in the nickel and copper contents of todorokite (Usui, 1979) may be due in part to variations in physicochemical factors.
Relation to Regional Variation in Sediment Type, Biologic Productivity, and Physiography
Because of the importance of sediment diagenesis in the formation of todorokite, which has a high manganese-iron ratio and generally high nickel and copper contents, regional variations in sediment character should be examined as a possible source of regional variations in nodule composi tion. Piper and Williamson (1977) found that, in the Pacific, the relation between the manganese-iron ratio of nodules and latitude is almost the reverse of the relation between the
Subsea Mineral Resources 59

manganese-iron ratio of sediments and latitude (sediment data from Skornyakova, 1965). Manganese-iron ratios in nodules are in the range of 6 to 9 near 10° N. and 10° S. and diminish to about 2 in the equatorial region and to less than 1 north and south of the 20° parallels. The high manganese-iron ratio in sediments is about 0.7 in the equatorial region, and the lows of 0.01 to 0.03 are in the 10° N. and 10° S. regions. On the basis of a comparison with Lisitzin's (1972) map showing sedimentation rates for the Pacific, Piper and Williamson suggested that nod ules having high manganese-iron ratios tend to occur in areas where sediment accumulation is slow.
Although Skornyakova (1979) found no correlation be tween the manganese, nickel, copper, and cobalt contents of nodules and associated sediment, she broadly related changes in nodule composition to sediment lithology. Fol lowing Horn and others (1973), she observed that nodules in the northern Pacific having the highest average man ganese, nickel, copper, and zinc concentrations are asso ciated with the radiolarian ooze of the equatorial belt and decrease successively in the adjacent zones of miopelagic clay, eupelagic clay, and calcareous ooze. She attributed the differences in the iron and manganese contents of nodules on the eastern and western sides of the Pacific to differences in primary manganese contents during sedi mentation; sediments on the west are initially poor in manganese, and those on the east are richer because of the presence of only a thin oxidized layer of sediment. Skornyakova related the composition of nodules in the equatorial belt to the high organic productivity associated with the equatorial currents, which cause the diagenetic migration of the metals as buried organic matter oxidizes, and to slow deposition of sediment because of high-velocity bottom currents. Heath (1981) also related the metal content of the nodules to sediment type and, in turn, to biologic productivity in the overlying waters.
The zone of highest organic productivity in the equatorial region of the Pacific lies 50 to 100 km south of rather than above the zones in which nodules are richest in nickel and copper. Exon (1981, p. 61) suggested that this zone is a result of northwestward movement of the Pacific plate in this region at a rate of about 100 km/Ma: "Assuming that the high productivity zone has not moved much (relative to the equator) in the past 10 million years, the time during which the nodules probably formed, they would have been beneath the high productivity zone for much of their growth."
Several other investigators (Arrhenius, 1975; Greenslate and others, 1973; Margolis and Burns, 1976; Piper and Williamson, 1977; Cronan, 1977) also have suggested that organic productivity plays an important role in concentrat ing some of the nodule metals and transporting them to the bottom and, when such metals are buried by sediment, in creating the reducing environment that leads to their diage netic mobilization and subsequent deposition at the surface.
According to Glasby (1981, p. 4), "On a regional scale, the most important factor controlling the composition of South Pacific abyssal nodules is the biological productivity of the overlying surface sea water." Nodule abundance in that area, he reported, is inversely related to sedimentation rate, a factor that Piper and others (1982) considered to be of primary importance in the distribution of nodules over the Pacific Basin as a whole (see also Menard, 1976).
Greenslate (1975), Wendt (1974), and Margolis and Burns (1976) reported the widespread presence of sessile arenaceous foraminifera on the nodules. Margolis and Burns found that, whereas foraminifera are present on nodules from all latitudes, they are most abundant and most diverse on nodules from the Clarion-Clipperton zone. The iron, titanium, and cobalt contents of foraminiferal tubes are higher than those of the nodule surface on which they are growing, and the manganese, nickel, and copper contents are lower. Margolis and Burns did not believe that the foraminifera actually precipitate manganese, copper, and nickel, although they deposit iron oxide as a cementing agent, but they did "feel that the large number of these animals. . .on the nodules from the copper-nickel rich zones of the northeastern equatorial Pacific, are somehow linked to the unique chemical composition of nodules from this area" (Margolis and Burns, 1976, p. 259), perhaps as a part of the high biologic productivity of the area. They asked, however, why, if high productivity of the surface layers of the ocean is the critical factor in trace-metal concentration in the manganese nodules, are nodules from other areas of oceanic upwelling and high productivity (the diatom ooze beneath the Antarctic convergence at about 55° S., for ex ample), not also so enriched? As a possible reason, they suggested dilution by terrigenous sediment in those areas. Nodules from high southern latitudes differ from those in the equatorial region not only in their lower metal content but also in their low manganese-iron ratios. Cronan (1977, p. 37) suggested that high detrital sedimentation rates "could lead to low Mn/Fe ratios in view of the greater amounts of releasable Fe relative to Mn in the products of continental weathering," and he suggested that higher detri tal sedimentation rates in the Atlantic as compared with those in the Pacific may explain the differences in their manganese-iron ratios.
However, many of the stations outside the Clarion- Clipperton zone in the Pacific, where nodules are high in combined nickel and copper (fig. 28), as well as many stations where the nodules contain 35 percent Mn or more (fig. 32) do, in fact, lie seaward of areas of coastal up- welling along the eastern side of the Pacific Basin, close enough, perhaps, to receive some of the organic debris generated by coastal upwelling. But such a relation is not evident in the central South Pacific, where the nodules are also high in combined nickel and copper (figs. 28, 29).
60 Mineral and Petroleum Resources of the Ocean

Many of the regional variations in nodule metal content relate to the physiography of the ocean basins as it controls depth, organic productivity, and sediment type. Cronan's (1977) analysis of variations in nodule metal contents from different environments brings out, for example, the high cobalt content of nodules from seamounts and other sub marine elevations, the high manganese content of nodules from continental borderlands, and the high combined nickel and copper contents of abyssal nodules.
In summary, many factors may play a part in the origin of subsea manganese nodules and the variations in their compositions: (1) the rate of deposition of sediment and its content of terrigenous and biogenous matter, (2) the redox potential of the environment and the extent to which diage- netic processes are locally operative, (3) the local availabil ity of the various metals, (4) the local availability of nucle ating materials, (5) the bottom topography and water depth and the bottom-current activity and character, and (6) the biologic productivity of surface waters, which is, in turn, related to oceanic circulation and its effects in locally bring ing nutrient-rich waters into the photic zone.
Combinations of these factors seem to explain, at least partly, some of the features of nodule distribution and com position. For example, the high concentrations of cobalt in western Pacific nodules relate to the highly oxidizing, es sentially nondepositional environment prevailing on the ex tensive seamounts and plateaus in that area. The asymmetri cal concentrations of the principal metals in nodules on the eastern sides of the oceans versus those on the western sides and their latitudinal variations may be a function of slow sedimentation at abyssal depths and oceanic circulation. The main elements of oceanic circulation are (1) two large circu lating gyrals, one in the northern hemisphere moving clockwise and one in the southern hemisphere moving counterclockwise, (2) an eastward-flowing equatorial countercurrent between them, and (3) areas of high organic productivity where cold, nutrient-rich waters well up in coastal areas along the eastern sides of the basins in each hemisphere and along the equatorial countercurrent. These elements combine to create a widespread blanket of sedi ments on the abyssal floor; this blanket varies regionally in character, depending on whether biogenous, pelagic, or ter rigenous sediments are dominant, and is generally below the lysocline, where metals are liberated from organic matter and where diagenetic processes are active in mobilizing and partitioning metals.
The differences in the average compositions of nodules from ocean to ocean may reflect the major differences in their geology and morphology. The Atlantic Ocean, for example, recieves much more terrigenous matter per unit of area than the Pacific does, its abyssal plains and areas cov ered by noncalcareous pelagic sediments are proportionally much smaller, and its mean depth is nearly 10 percent less all factors that would help to account for the lower average
contents of manganese, nickel, and copper in Atlantic nodules.
But such broad controls are not much help in explaining many aspects of the regional trends for example, the con tinuation of the poleward decrease in manganese, nickel, and copper contents of nodules to high latitudes, even in areas of high organic productivity; the area of the central South Pacific in which the content of these metals is high; the apparent localization of the manganese-rich (35 percent or more) nodules on the eastern side of the Pacific Basin and the northeastern equatorial region east of the Clarion- Clipperton zone and their lower nickel and copper contents; the higher iron content of nodules on the western side of the Pacific; and the anomalously high local content of some normally minor metals such as tellurium, lead, and zinc. Given the large number of factors that can affect the compo sition of the nodules, it is not surprising that it is difficult to determine their interplay in accounting for specific varia tions. But, plainly, a greater understanding of ocean proc esses and regional oceanography is needed to explain all the variations observed in the compositions of subsea man ganese nodules. If the reasons for these variations do come to be understood, they may facilitate, on one hand, prospecting for economically valuable deposits; on the other hand, the local composition of nodules may serve as an indicator of locally prevailing environmental conditions.
One final question concerning the origin of manganese nodules deserves mention namely, why are they not buried by sediment instead of remaining at the surface? Their growth rate of 3 to 50 mm/Ma is much less than the rate of deposition of the sediment on which they accumu late. Hence, it might be thought that their slow growth rate would not allow them to remain at the surface. In fact, the nodules are generally older than the sediment on which they lie. Some have suggested that they are kept at the surface as the result of the movement of animals, but this theory does not seem reasonable. Not all nodules are at the surface; some have been buried by sediment, for they have been found in cores, and bottom photographs in some places show them to lie beneath a light blanket of sediment.
Distribution
The world distribution of manganese nodules is shown in figure 34, taken from Cronan's (1980) reduction of Rawson and Ryan's (1978) compilation. More detailed compilations of nodule distribution have not been made for the Atlantic and Indian Oceans, but Piper and others (1982, 1985) have mapped their distribution in the Pacific on the basis of per centage of the bottom covered as seen on bottom photo graphs and reported in core samples. Piper and others (1982) showed that:
In the northeast quadrant of the Pacific Ocean, three areas exhibit a sea floor coverage that com-
Subsea Mineral Resources 61

::::: Areas of nodule coverage JJJ Areas where nodules are particularly abundant
Figure 34. Distribution of manganese nodules in the world ocean (after Rawson and Ryan, 1978, as modified by Cronan, 1980). (Copyright 1980 by Academic Press.)
monly exceeds 50 percent. One area lies between the Clarion and Clipperton fracture zones. A sec ond is in the Central Pacific basin, and a third is in the vicinity of the Musician Seamounts. Corre lation of hiatuses in sedimentation during the Neo- gene, with these areas of high nodule coverage, suggest that a low rate of sediment accumulation is of primary importance.
Another area where the nodule coverage is 50 percent or more lies in the eastern part of the southwestern Pacific Basin. Areas where the nodule coverage is 25 percent or more are in the vicinity of the Jane Seamount in the north western Pacific, the south-central Pacific, the Peru Basin, and the southeastern Pacific Basin (Piper and others, 1985). Coverage is less than 1 percent over large areas of the Pacific, perhaps three-quarters of it in the aggregate.
The publicly available data on concentration (that is, weight per unit of area) of manganese nodules are insuffi cient, especially outside of the Pacific, to support any firm conclusions, but, in figure 35, all but one of the stations having more than about 13 kg/m2 of nodules occur at depths greater than about 3,700 m. Analysis of hundreds of free- fall grab samples collected by the Centre National pour 1'Exploration des Oceans-Societe le Nickel and the Associ ation Frangaise pour 1'Etude et la Recherche des Nodules Polymetalliques led Pautot and Melguen (1979) to conclude
that the greatest concentrations of nodules are restricted to an interval of 300 to 400 m, the lower limit of which varies from basin to basin but falls within the range of 4,350 to 5,200 m, close to the carbonate compensation depth in each basin. Skornyakova (1979) also reported that the highest concentrations of nodules are confined to depths below the carbonate compensation depth.
Although available evidence thus indicates that the great est concentrations of nodules occur at abyssal depths, the encrustations, which average 2 cm in thickness over large areas, reported by Halbach and Manheim (1984) and Com- meau and others (1984) on mid-Pacific seamounts at depths between 2,500 and 1,200 m represent a far greater concen tration of metalliferous oxides per unit area than the nodules do, except in their rarest concentrations. In fact, the average concentration of manganese oxide crust of 33 kg/m2 implied by Manheim and others (1982) is four times the average of 8.33 kg/m2 dry weight in nodules of the Clarion-Clipperton zone, the area of greatest current commercial interest for nodule mining.
The Clarion-Clipperton zone
Figure 36 shows the approximate limits of areas in the northeastern equatorial Pacific within which publicly avail able analyses indicate that manganese nodules contain more
62 Mineral and Petroleum Resources of the Ocean

1C 80ISUJ5
UJ
< 70
O
GC UJ°- 60
GC <D O
UJ
O O
UJ(/)
50
40
CD
20
Z OI 10UJO
;:
8 2500 3000 3500 4000 4500 5000
DEPTH, IN METERS5500 6000 6500
Figure 35. Relation between depth and concentration of manganese nodules at stations in the Scripps Institution of Oceanography's Sediment Data Bank (from McKelvey and others, 1983).
than 1.8 percent Ni+Cu. The existence of high-grade nod ules in this region has been known for many years. Mero (1965) included this region as part of a broader one in which nodules are high in copper; Menard (1964, p. 186) identified part of the region as containing nodules high in nickel. Subsequently, Horn and others (1972, 1973) referred to the area between the Clarion and Clipperton fracture zones and 120° and 155° W. as having unquestionably the best eco nomic potential for nodules rich in nickel and copper and showed that the distribution of the rich nodules corresponds to that of siliceous sediments of Miocene age. Cronan (1972), Skornyakova (1976, p. 206-207), Margolis and Burns (1976), Bezrukov (1976, p. 252), and Piper and Williamson (1977) also roughly delineated the area as one containing nodules high in nickel and copper, and several
authors (Archer, 1976, 1978; Holser, 1976; Pasho and Mclntosh, 1976; Frazer, 1977; Bastien-Thiry and others, 1977) have recently attempted to estimate the magnitude of the resources in the general region and the number of poten tial mine sites that it might contain. The region has been the focus of studies sponsored by the National Science Founda tion in support of the International Decade of Ocean Explo ration (Frazer and Arrhenius, 1972; Horn and others, 1972, 1973), by the Federal Republic of Germany's ship Valdivia (Schultz-Westrum, 1973; Friedrich and others, 1974), a French group (Bastien-Thiry and others, 1977), and the Deep Ocean Mining Environmental Study sponsored by the National Oceanic and Atmospheric Administration (see Piper and others, 1979; Sorem and others, 1979; Bischoff and Piper, 1979). The Deepsea Ventures, Inc., "claim" is
Subsea Mineral Resources 63

ieo°w 110PW
Figure 36. Areas in the northeastern equatorial Pacific in which manganese nodules contain more than 1.8 percent Ni+Cu (from McKelvey, 1980). Numbers represent the average percentage of combined nickel and copper of samples in 1° squares where analyses are available at five stations or more. The rectangles outline the Deepsea Ventures, Inc., "claim" (DSV) and the Deep Ocean Mining Environmental Studies program sites (A, B, C). (Copyright 1980 by the American Association for the Advancement of Science.)
within the high-grade area between the Clarion and Clipper- ton fracture zones, as are other sites selected by deep-sea mining consortia for prospecting and experimental mining and the three sites judged by the USBM to have the best potential for economic mining (Hillman, 1983). Nodules containing more than 1.8 percent Ni+Cu are known in other parts of the world (Rawson and Ryan, 1978; McKelvey and others, 1983), but the area between the Clarion and Clipper- ton fracture zones (hereafter referred to as the C-C' area) shown in figure 36 is clearly the one of greatest current interest with regard to the possible recovery of manganese nodules.
The metal content and concentration of nodules at stations within the C-C' zone, where data on both are available, are shown in table 23. The data show a correlation coefficient between combined nickel and copper content and concentra tion of -0.24 at the 98-percent confidence level, weak enough to suggest that, in this area only, a slight positive bias would result from treating grade and abundance as independent variables. On the basis of this assumption, the grade of all available samples has been averaged in table 24. The results are only slightly different from those shown in table 23, with the exception of molybdenum.
Because only six molybdenum analyses are available for the stations represented in table 23, in comparison with 93 for those in table 24, the average shown in table 24 must be considered more reliable, although the difference is slight. Table 25 has been added on the assumption that it may be
possible to restrict operations to areas containing higher concentrations of nodules.
The slight differences in the average metal contents of C-C' nodules shown in tables 23, 24, and 25 indicate a basis for high confidence in their validity. They confirm, in fact, Hein's (1977) report of almost identical averages for the several thousand samples collected from the C-C' zone by the Centre National pour 1'Exploration des Oceans (namely, 25.56 percent Mn, 6.40 percent Fe, 1.25 percent Ni, 1.05 percent Cu, and 0.24 percent Co), and they also correspond almost exactly to the averages of Haynes and others (1982) (namely, 25.4 percent Mn, 6.9 percent Fe, 1.28 percent Ni, 1.02 percent Cu, and 0.24 percent Co). The average concentration of nodules in the C-C' area, however, is much more uncertain than the average metal content, partly because the determinations are fewer but also because the measurement itself is less certain. Bastien-Thiry and others (1977) considered that the error in concentration estimates ranges from 20 to 50 percent.
The weak inverse relation between grade and nodule con centration in the C-C' area can be seen by comparing tables 23 and 25. These tables show a decrease of approximately 5 percent or 0.15 wt percent in the mean content of nickel plus copper in comparison with an increase of approxi mately 41 percent in mean concentration from 8.45 to 11.94 kg/m2 . The low-grade nodules in the high concentrations shown in table 25, however, contain more nickel plus
64 Mineral and Petroleum Resources of the Ocean

Table 23. Metal contents (in percent), nodule concentrations (in kg/m 2), and metal ratios of manganese nodules in the C-C' area at stations where information on both is available [ , not enough stations for a meaningful value]
Mn ----------------------Fe -----------------------Ni .......................Cu -----------------------Ni+Cu -------------------Co -----------------------Mo ----------------------Nodule concentration -------Mn/Fe--------------------Ni/Mn--------------------Cu/Mn -------------------(Ni+Cu)/Mn --------------Co/Mn -------------------Mo/Mn -------------------Cu/Ni --------------------
No. ofstations
..........90
..........90
..........90
..........90
..........90
..........60
.......... 6
..........90
..........90
..........90
.......... 90
..........90
..........60
.......... 6
..........90
Mean
27.157.251.401.062.45
.24
.068.454.24
.052
.039
.091
.009
.002
.75
Range
7.30-35.503.31-12.51
.52-1.91
.26-1.64
.78-3.50
.09-. 39
.03-.07
.20-27.251.30-9.70.026-. 148.013-.114.039-.261.003-.027.002-.002.49-1.04
Standarddeviation
4.922.17
.31
.30
.58
.05
.026.141.84
.013
.011
.022
.004
.000
.12
Correlationcoefficient
-0.241-.642
.772
.802
.822
.0092
.832
Between nickel plus copper and concentration. 2Between the respective metals.
copper per unit area (0.27 kg/m2) than the high-grade nod ules but low concentrations shown in table 23 (0.21 kg/m2).
Previous estimates of the potentially recoverable re sources in the C-C' area were for the region as a whole, reduced to an area considered minable on the basis of, for example, the percentages of samples considered to be above some "cutoff grade and concentration. Archer (1976) esti mated that the area contains 23 to 27 potential mine sites, each capable of producing an average of 3 million metric tons of dry nodules per year for 25 years. Holser (1976, fig. 4) showed approximately 20 "first-generation" mine sites for the Clarion-Clipperton area, each averaging 75 million metric tons for its lifetime production. For the northeastern
equatorial Pacific, bounded by lat 0° N. and long 100° W. and 170° E. and excluding the Mid-Pacific Mountains in the region north of 20° N. and west of 160° W., Pasho and Mclntosh (1976) estimated a 95-percent chance that there are at least 5 mine sites capable of producing 3 million metric tons a year for 20 years, a 50-percent chance that there are more than 30 such sites, and a 5-percent chance that there are more than 140 sites that may become commer cially exploitable before the year 2000. Pasho (1977) later refined this estimate to indicate a probable range of 10 to 95 mine sites. In the northern equatorial Pacific, Frazer (1977) identified an area of 3.3 million square kilometers in 11 5°
Table 24. Metal contents (in percent) and metal ratios of manganese nodules in the C-C' area
Element
Mn -------.--..-----.Fe -------------------Ni --------------.-.--Cu-------------------Ni+Cu ---------------Co-------------------Mo ------------------Mn/Fe ----------------Ni/Mn ----------------Cu/Mn ---------------(Ni+Cu)/Mn ----------Co/Mn ---------------Mo/Mn ---------------Cu/Ni ----------------
No. ofstations
.............362
.............359
.............366
.............366
.............366
.............323
............. 93
.............359
.............362
.............362
.............362
.............319
............. 93
.............366
Mean
25.436.661.271.022.29
.22
.054.38
.05
.04
.09
.009
.002
.80
Range
2.50-36.43.50-15.31.11-1.91.11-1.66.22-3.51.05-.56.02-.08.30-57.00.02-. 15.Ol-.ll.04-.26
.003-.027
.001-.004.44-1.34
Standarddeviation
4.981.99
.27
.28
.52
.07
.013.41
.01
.01
.02
.004
.000
.14
Correlationcoefficient 1
-0.30.75.70.77.028.59.79
'Between the respective metals.
Subsea Mineral Resources 65
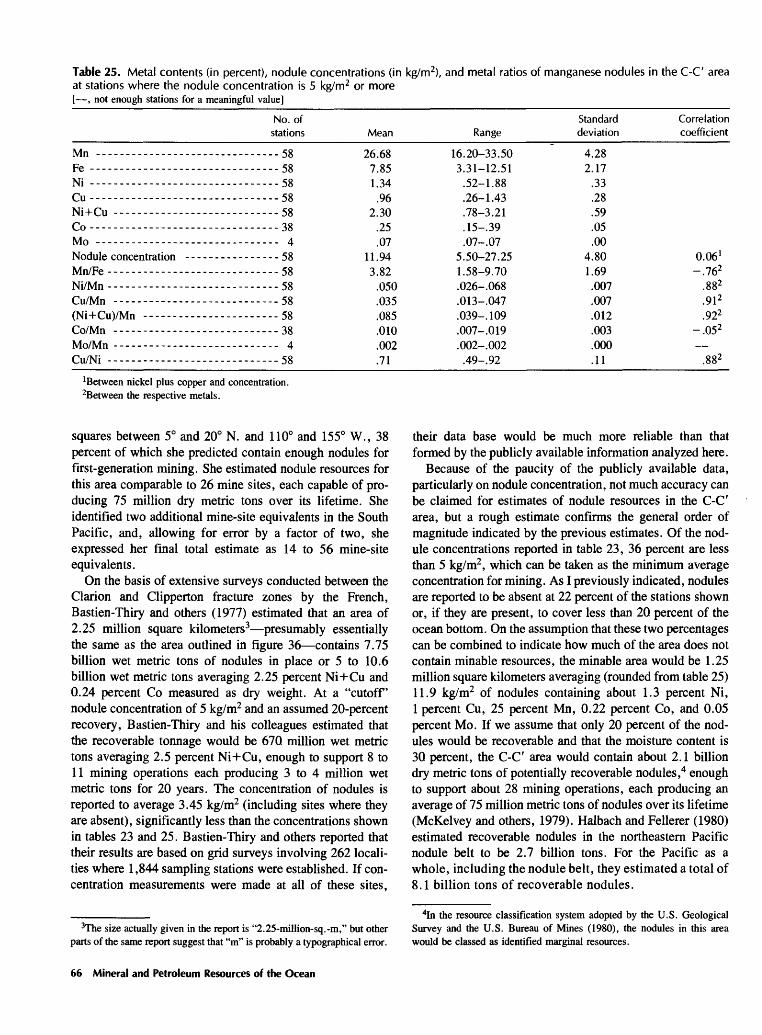
Table 25. Metal contents (in percent), nodule concentrations (in kg/m2) at stations where the nodule concentration is 5 kg/m2 or more [ , not enough stations for a meaningful value]
and metal ratios of manganese nodules in the C-C area
Mn -----.-------...----..Fe -------.-.------..---..Ni .......................Cu----------------------Ni+Cu ..-...-..--........Co ....._.................Mo ----------------------Nodule concentration -------Mn/Fe --------------------Ni/Mn--------------------Cu/Mn -------------------(Ni+Cu)/Mn --------------Co/Mn -------------------Mo/Mn -------------------Cu/Ni --------------------
No. ofstations
...... ....58----------58......_...58..........58..........58..........38.......... 4...-....-.58---------58..........58..........58..........58..........38...-..._.. 4...... ...58
Mean
26.687.851.34
.962.30
.25
.0711.943.82
.050
.035
.085
.010
.002
.71
Range
16.20-33.503.31-12.51
.52-1.88
.26-1.43
.78-3.21
.15-.39
.07-.075.50-27.251.58-9.70.026-.068.013-.047.039-. 109.007-.019.002-.002.49-.92
Standarddeviation
4.282.17
.33
.28
.59
.05
.004.801.69.007.007.012.003.000.11
Correlationcoefficient
0.06 1-.762
.882
.91 2
.922-.052
.882
'Between nickel plus copper and concentration. 2Between the respective metals.
squares between 5° and 20° N. and 110° and 155° W., 38 percent of which she predicted contain enough nodules for first-generation mining. She estimated nodule resources for this area comparable to 26 mine sites, each capable of pro ducing 75 million dry metric tons over its lifetime. She identified two additional mine-site equivalents in the South Pacific, and, allowing for error by a factor of two, she expressed her final total estimate as 14 to 56 mine-site equivalents.
On the basis of extensive surveys conducted between the Clarion and Clipperton fracture zones by the French, Bastien-Thiry and others (1977) estimated that an area of 2.25 million square kilometers3 presumably essentially the same as the area outlined in figure 36 contains 7.75 billion wet metric tons of nodules in place or 5 to 10.6 billion wet metric tons averaging 2.25 percent Ni+Cu and 0.24 percent Co measured as dry weight. At a "cutoff nodule concentration of 5 kg/m2 and an assumed 20-percent recovery, Bastien-Thiry and his colleagues estimated that the recoverable tonnage would be 670 million wet metric tons averaging 2.5 percent Ni+Cu, enough to support 8 to 11 mining operations each producing 3 to 4 million wet metric tons for 20 years. The concentration of nodules is reported to average 3.45 kg/m2 (including sites where they are absent), significantly less than the concentrations shown in tables 23 and 25. Bastien-Thiry and others reported that their results are based on grid surveys involving 262 locali ties where 1,844 sampling stations were established. If con centration measurements were made at all of these sites,
their data base would be much more reliable than that formed by the publicly available information analyzed here.
Because of the paucity of the publicly available data, particularly on nodule concentration, not much accuracy can be claimed for estimates of nodule resources in the C-C' area, but a rough estimate confirms the general order of magnitude indicated by the previous estimates. Of the nod ule concentrations reported in table 23, 36 percent are less than 5 kg/m2 , which can be taken as the minimum average concentration for mining. As I previously indicated, nodules are reported to be absent at 22 percent of the stations shown or, if they are present, to cover less than 20 percent of the ocean bottom. On the assumption that these two percentages can be combined to indicate how much of the area does not contain minable resources, the minable area would be 1.25 million square kilometers averaging (rounded from table 25) 11.9 kg/m2 of nodules containing about 1.3 percent Ni, 1 percent Cu, 25 percent Mn, 0.22 percent Co, and 0.05 percent Mo. If we assume that only 20 percent of the nod ules would be recoverable and that the moisture content is 30 percent, the C-C' area would contain about 2.1 billion dry metric tons of potentially recoverable nodules,4 enough to support about 28 mining operations, each producing an average of 75 million metric tons of nodules over its lifetime (McKelvey and others, 1979). Halbach and Fellerer (1980) estimated recoverable nodules in the northeastern Pacific nodule belt to be 2.7 billion tons. For the Pacific as a whole, including the nodule belt, they estimated a total of 8.1 billion tons of recoverable nodules.
3The size actually given in the report is "2.25-million-sq.-m," but other parts of the same report suggest that "m" is probably a typographical error.
4In the resource classification system adopted by the U.S. Geological Survey and the U.S. Bureau of Mines (1980), the nodules in this area would be classed as identified marginal resources.
66 Mineral and Petroleum Resources of the Ocean

Estimates based on other plausible assumptions would be higher or lower but of the same order of magnitude. When we consider the paucity and uncertainty of the concentration data and the fact that data stations are not randomly dis tributed, it is readily conceivable that the size of the minable area could range from one-half to twice the size estimated, with proportionate effects on the estimates. If the distribu tion of the nodules is found to be locally irregular, a mini mum average concentration may not be adopted in mining; as a result, the potentially recoverable resource may in crease somewhat, although the percentage of the resources recoverable would initially be reduced. If the percentage of recoverable nodules is increased as a result of technological advances over time, then potentially recoverable tonnage and the number of average-sized operations that such ton nage would support would increase proportionately. It seems clear, however, that this most promising area now known contains potentially recoverable manganese nodule resources adequate to support not more than several tens of the average-sized operation postulated.
The three areas within the C-C' zone selected by the USBM as having the best potential are estimated to have 67 million dry tons of recoverable nodules containing 1.3 per cent Ni, 1.0 percent Cu, and 0.21 percent Co; 66.9 million tons containing 1.45 percent Ni, 1.24 percent Cu, and 0.25 percent Co; and 148.8 million tons containing 1.33 percent Ni, 1.04 percent Cu, and 0.26 percent Co (Hillman, 1983).
Other Areas Containing Nickel- and Copper-Rich Nodules
The Clarion-Clipperton zone is the largest and most promising area known to have nodules rich in nickel and copper; in fact, at this stage, it seems likely that no other area of comparable size containing nodules of comparable quality and concentration will be found. Nevertheless, anal ysis of the data on the 2,401 stations in the Sediment Data Bank shows that several other areas appear to contain metal- rich nodules, including some that might be high enough in combined nickel and copper (that is, 1.8 percent or more) to justify exploration for sites suitable for first-generation min ing.
For this analysis, the locations of stations falling into the metal types described in the preceding section were plotted on a world map (parts of which are reproduced here) as a basis for selecting areas in which nodules might contain 1 percent Ni+Cu or more and that therefore seemed to de serve further study. The results give some indication of areas that seem favorable for further exploration. Because data on concentrations outside of the Clarion-Clipperton zone are few, no attempt has been made to estimate tonnage in other areas. The detailed information on nodule deposits in the Peru Basin between lat 8° and 5° S. and long 90° and 92° W. was reported by Halbach (1984; Halbach and others, 1980) from a cruise of the R. V. Sonne in 1979. The nodule
density shows mean values ranging from 7 to 14 kg/m2 for different locations, some peak values being 30 kg/m2 . The nodules average 1.1 to 1.2 percent Ni, 0.5 to 0.7 percent Cu, and 22 to 38 percent Mn.
Estimates of average grade and of size are given for several other areas, but, because the data are sparse, these estimates must be taken as only a rough indication of what may be present in areas that, at this time, are merely targets for exploration. Nor should it be concluded that the areas identified as warranting further study are the only ones that deserve further exploration. As the maps show, many other areas contain high-quality nodules, and further sampling might show some of these areas to be of minable size.
No consideration has been given here to further identify ing exploration areas for nodules rich in cobalt or man ganese. The data shown in figures 30, 31, and 32 do sug gest, however, that there may be large areas in which such nodules might be found. One of the striking results of this analysis as well as of other analyses is that there appears to be considerable continuity in the combined nickel and cop per contents of manganese nodules over large areas, and this continuity may hold also for nodules rich in cobalt and in manganese. The data suggest, for example, that one or more such areas in which nodules contain more than 1 percent Co may be found in the north-central Pacific between 158° and 180° W. This region is the one within which Manheim and others (1980b) reported cobalt-rich manganese oxide en crustation covering "nearly the entire exposed surface of the seamounts studied" between depths of 2,500 and 1,200 m. Samples containing more than 35 percent Mn that have been reported along the eastern side of the Pacific Basin (fig. 32) may be indicative of large areas of manganese-rich nodules, although the data assembled by Piper and others (1985) on sea-floor nodule coverage indicate that the concentration of nodules there is very likely to be low.
Several areas in which nodules have high combined nickel and copper contents have been selected for further analysis; these areas are shown in figures 37, 38, and 39, along with the average combined nickel and copper contents for all stations within each area. These averages range from 0.72 percent Ni+Cu in the South Atlantic to 1.56 percent in the central south equatorial Indian Ocean. Figures 40, 41, and 42 are enlarged maps of the same areas within which are delineated smaller areas of nodules containing more than 1.0 percent and more than 1.8 percent Ni+Cu. Nodules containing lesser amounts have been included in these smaller areas where the average of a particular station and the stations adjacent to it is above the cutoff. It must be emphasized that areas thus delineated are significant only as targets for further exploration.
Subsea Mineral Resources 67

30°N
15°N.
15°S.
30°S.
45eS.
Figureothers,
EXPLANATION10.861 Area selected for further study. + 3=1.8 percent Ni + Cu
Number is average Ni + Cu ««..-,« *. * ^ percentage at stations within study x 1 «°- 1 -79 Percent Nl + Cu area o SB 1.0 percent Co
A 3=35.0 percent Mn
37. Distribution in the Pacific Ocean of manganese nodules having high metal contents (from McKelvey and 1983).
As figures 40, 41, and 42 show, fairly large target areas for nodules containing more than 1.8 percent Ni+Cu can be identified in the central north equatorial Pacific Ocean, the southeastern equatorial Pacific Ocean, and the central south equatorial Indian Ocean. If nodule mining becomes possi ble, the rich resources of the Clarion-Clipperton zone will probably be large enough to support production for several decades. Some time in the distant future, however, it may be feasible to mine lower grade nodules; looking to that possibility, one can identify even larger areas in which the nodules contain ^1.0 to <1.8 percent Ni+Cu.
As I have already mentioned, those target areas identified on the maps should not be thought the only ones worth considering. Others can be picked out from figures 28, 32, and 37. For example, a fair-sized target for nodules contain ing more than 1.8 percent Ni+Cu appears to lie at long 154°
to 160° W., lat 1° to 3° S. in the South Pacific (McKelvey and Wright, 1980); on the basis of recent samplings, Exon (1982) identified this area and other areas in the central South Pacific between lat 1° and 7° S. as containing nodules of potential economic significance. The large area at long 124° to 160° W., lat 0° to 18° S. would be a target for nodules containing more than 1.0 percent Ni+Cu. Of course, further sampling may disclose other promising areas now unknown.
Cobalt-Rich Encrustations
Cobalt-rich encrustations of manganese oxides on six submarine terraces in the Hawaiian Archipelago at depths
68 Mineral and Petroleum Resources of the Ocean
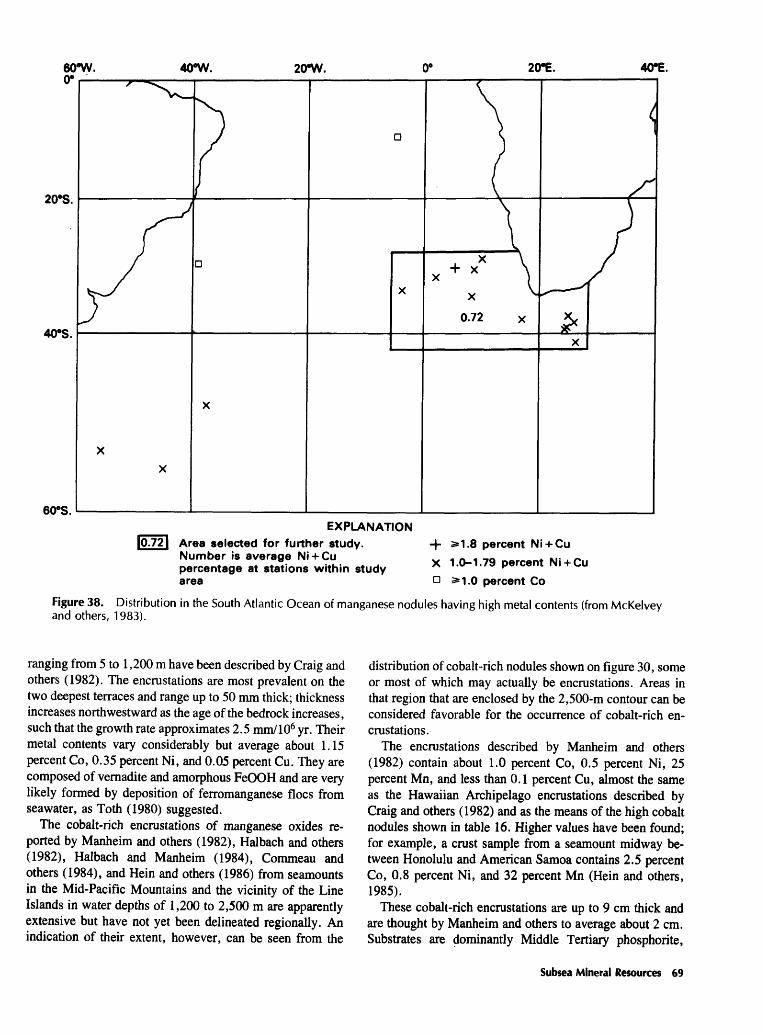
60«W. 40°W. 20«W. 20*E. 40°E.
20°S.
40»S.
60°S.EXPLANATION
Area selected for further study. Number is average Ni + Cu percentage at stations within study area
+ 3=1.8 percent Ni + Cu
X 1.0-1.79 percent Ni + Cu
n 3*1.0 percent Co
Figure 38. Distribution in the South Atlantic Ocean of manganese nodules having high metal contents (from McKelvey and others, 1983).
ranging from 5 to 1,200 m have been described by Craig and others (1982). The encrustations are most prevalent on the two deepest terraces and range up to 50 mm thick; thickness increases northwestward as the age of the bedrock increases, such that the growth rate approximates 2.5 mm/106 yr. Their metal contents vary considerably but average about 1.15 percent Co, 0.35 percent Ni, and 0.05 percent Cu. They are composed of vernadite and amorphous FeOOH and are very likely formed by deposition of ferromanganese floes from seawater, as Toth (1980) suggested.
The cobalt-rich encrustations of manganese oxides re ported by Manheim and others (1982), Halbach and others (1982), Halbach and Manheim (1984), Commeau and others (1984), and Hein and others (1986) from seamounts in the Mid-Pacific Mountains and the vicinity of the Line Islands in water depths of 1,200 to 2,500 m are apparently extensive but have not yet been delineated regionally. An indication of their extent, however, can be seen from the
distribution of cobalt-rich nodules shown on figure 30, some or most of which may actually be encrustations. Areas in that region that are enclosed by the 2,500-m contour can be considered favorable for the occurrence of cobalt-rich en crustations.
The encrustations described by Manheim and others (1982) contain about 1.0 percent Co, 0.5 percent Ni, 25 percent Mn, and less than 0.1 percent Cu, almost the same as the Hawaiian Archipelago encrustations described by Craig and others (1982) and as the means of the high cobalt nodules shown in table 16. Higher values have been found; for example, a crust sample from a seamount midway be tween Honolulu and American Samoa contains 2.5 percent Co, 0.8 percent Ni, and 32 percent Mn (Hein and others, 1985).
These cobalt-rich encrustations are up to 9 cm thick and are thought by Manheim and others to average about 2 cm. Substrates are dominantly Middle Tertiary phosphorite,
Subsea Mineral Resources 69
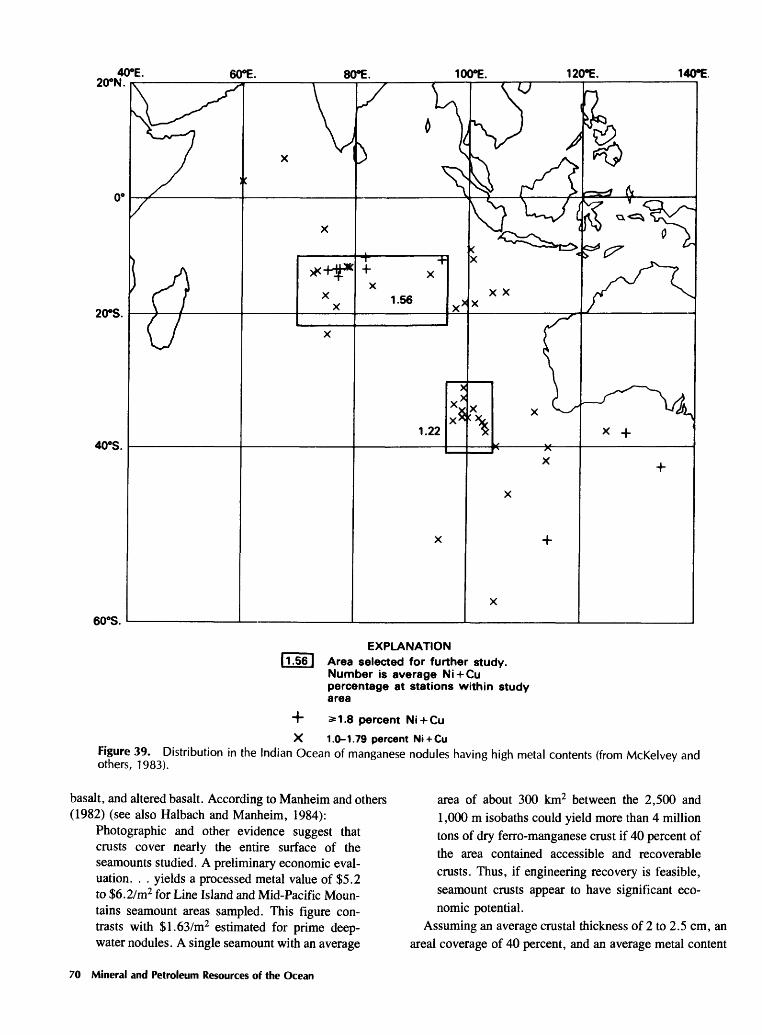
20°N.40°E. 60°E. 80°E. 100°E. 120°E. 140°E
0°
20°S.
40°S.
60°S.
1.56
1.22
X X
EXPLANATIONArea selected for further study. Number is average Ni + Cu percentage at stations within study area
-I- 3=1.8 percent Ni + Cu
X 1.0-1.79 percent Ni + CuFigure 39. Distribution in the Indian Ocean of manganese nodules having high metal contents (from McKelvey and others, 1983).
basalt, and altered basalt. According to Manheim and others (1982) (see also Halbach and Manheim, 1984):
Photographic and other evidence suggest that crusts cover nearly the entire surface of the seamounts studied. A preliminary economic eval uation. . . yields a processed metal value of $5.2 to $6.2/m2 for Line Island and Mid-Pacific Moun tains seamount areas sampled. This figure con trasts with $1.63/m2 estimated for prime deep- water nodules. A single seamount with an average
area of about 300 km2 between the 2,500 and 1,000 m isobaths could yield more than 4 million tons of dry ferro-manganese crust if 40 percent of the area contained accessible and recoverable crusts. Thus, if engineering recovery is feasible, seamount crusts appear to have significant eco nomic potential.
Assuming an average crustal thickness of 2 to 2.5 cm, an areal coverage of 40 percent, and an average metal content
70 Mineral and Petroleum Resources of the Ocean

180-W 20°N.
170°W. 160-W.
10°N.
H~
X
D
EXPLANATION *1.8 percent Ni + Cu
1.0-1.79 percent Ni + Cu
3*1,0 percent Co 0.5-0.99 percent Co <1.0 percent Ni + Cu, <0.5 percent Co
Area within which Ni + Cu* 1.8 percent (240,000 km 3; 27 stations; average 2.0 percent Ni + Cu)
Area within which Ni + Cu*1.0 percent
Figure 40. Target areas for exploration for manganese nodules rich in combined nickel and copper in the central north equatorial Pacific Ocean (from McKelvey and others, 1983).
of 0.9 percent Co, 0.5 percent Ni, 0.06 percent Cu, and 24.7 percent Mn, Clark and others (1984) estimated that the more favorable areas within the 200-mi Exclusive Economic Zones (EEZ) of the Hawaiian Archipelago and the Johnston- Palmyra Islands region contain 6.9 million metric tons of cobalt, 3.9 million metric tons of nickel, 0.5 million metric tons of copper, and 189.2 million metric tons of manganese. Assuming that prime areas (where the crusts average 4 cm thick and 1.0 percent Co, 0.5 percent Ni, 0.06 percent Cu, and 24.7 percent Mn and cover 60 percent of the area) make up 7.5 percent of the permissive areas in these regions, they estimated that the prime areas contain 0.628 million metric tons of cobalt, 0.314 million metric tons of nickel, 0.039 million metric tons of copper, and 15.523 million metric tons of manganese. They believed that, in some areas, the crusts are so weakly bonded to bedrock that they can be scraped off easily, and, because they occur in much shal lower water, they may pose less difficult problems for min ing than the nodules do. These advantages, together with the facts that the value of the crusts is higher than that of the nodules and that large tonnages of the crusts occur in areas under national jurisdiction where the terms for mining may be more attractive than those in the area beyond national jurisdiction and under the Law of the Sea Convention, led Clark and his coworkers to believe that the crusts "will prove to be closer to commercial viability than deep-sea nodules."
It should be noted, however, that the most abundant com ponent in the crusts is cobalt, the producer price of which for most of 1982 and 1983 was $12.50/lb, in comparison with the pre-1976 price of $3.00 to $4.00/lb. Spot prices during that period were half the producer price or less, an indication of price weakness. Substantial production from the subsea nodules or encrustations or another new source might result in a much reduced price for cobalt, which would inject uncertainty into the near-term value of the cobalt-rich man ganese oxides.
Manganese- and Iron-Rich Encrustations
Encrustations of manganese-rich oxides on basalt have been reported from several localities along the rift valleys at active spreading centers. Examples are the Mid-Atlantic Ridge at lat 23°, 26°, and 36° N., the East Pacific Rise near the equator (the Galapagos spreading center) and at lat 8° S., and the Gulf of Aden near lat 12° N. These encrustations are of hydrothermal origin and consist of todorokite, birnessite, or pyrolusite. They contain 30 to 58 percent Mn. In that respect, they resemble the manganese-rich nodules in com position, but they contain much less iron (less than 1.0 percent in some deposits), nickel, copper, and cobalt than the nodules do (Rona, 1978, 1984; Cronan, 1980).
Iron-rich manganese-poor encrustations have also been found in subsea hydrothermal environments (for example, the East Pacific Rise at lat 8° S.) (Bonatti and Joensuu,
Subsea Mineral Resources 71

100"W. 90°W. 80°W.
10°S
20°S
EXPLANATION
j" 5*1.8 percent Ni + Cu
X 1.0-1.79 percent Ni + Cu
A 3535.0 percent Mn
O 0.5-0.99 percent Co
<1.0 percent Ni + Cu, <35.0 percent Mn, <0.5 percent CoArea within which Ni + Cus*1.8 percent (815,000 km2 ;12 stations; average 2.11 percent Ni + Cu)
Area within which Ni + Cus«1.0 percent
Figure 41. Target areas for exploration for manganese nodules rich in combined nickel and copper in the southeastern equatorial Pacific Ocean (from McKelvey and others, 1983).
1966). Cronan (1980) attributed the rather clean separation of iron and manganese in the subsea hydrothermal environ ment to early precipitation of iron oxides and silicates as ascending hot, low Eh solutions begin to cool and oxidize as they enter the marine environment, manganese oxide being precipitated later in the process.
Feasibility of Commercial Recovery
The commercial feasibility of mining a given mineral deposit means that the operation has or can meet several prerequisites: technical feasibility of mining and processing; environmental acceptability; profitability; and legal autho rization. Only a successful operation can demonstrate con clusively that all of these requirements have been met. Be cause full-scale mining of manganese nodules and crusts has not been attempted, judgments about its commercial feasi bility at this stage are necessarily speculative. Even so, they are indicative of the near-term outlook.
Although the results of the extensive research and devel opment activities undertaken by several nodule mining con- sortia are held as trade secrets, several of these groups have announced success in their attempts to lift nodules from the bottom and in the development of methods to recover the metals. More research and development may be required in advance of full-scale operations, but there is little doubt now that the mining and processing of the nodules will be techni cally feasible (Chung, 1985).
The environmental effects of experimental mining activi ties have been monitored by the National Oceanic and At mospheric Administration, which has also published (Na tional Oceanic and Atmospheric Administration, 1981) a programmatic environmental impact statement on nodule mining and has sponsored much environmental research related to both mining and processing (see Tweedt (1985) for a summary). Nodule dredging totally destroys the bot tom fauna but leaves it unharmed in adjacent undredged areas, which provide the seed for repopulation. Adverse effects are therefore short lived. Other environmental effects
72 Mineral and Petroleum Resources of the Ocean

70°E. 80°E.
10°S.
20°S.
+
X
EXPLANATION
3*1.8 percent Ni + Cu
1.0-1.79 percent Ni + Cu
<1.0 percent Ni + Cu, <0.5 percent Co, <35.0 percent MnArea within which Ni + Cus*1.8 percent (270,000 km 2 ; 12 stations; average 2.3 percent Ni + Cu)
Area within which Ni + Cus* 1.0 percent
Figure 42. Target areas for exploration for manganese nodules rich in combined nickel and copper in the central south equatorial Indian Ocean (from McKelvey and others, 1983).
appear to be negligible. Further activities need to be moni tored, but, at this stage, it seems that nodule mining and processing can be undertaken without adverse environmen tal effects.
The cost of nodule mining and processing has been esti mated in several publicly available studies (for example, Arthur D. Little, Inc., 1977; Nyhart and others, 1978; Flipse, 1982; Andrews and others, 1983; Antrim and Sebe- nius, 1983; Hillman, 1983). Capital costs in these estimates range from about $0.6 to $1.7 billion, and estimates of the internal rate of return (IROR) range from about 2.7 to 18.1 percent, the higher costs and less profitable returns being the most recent ones. Even though the estimates range widely, they tell the same story: nodule mining will require huge capital outlays and is not prospectively profitable enough to warrant undertaking now. Although most manufacturing companies have an IROR in the range of 13 to 15 percent, it is generally recognized that the prospective IROR for high-risk ventures such as the first deep-seabed mining projects should be of the order of 30 percent to warrant investment.
As I will discuss more fully later, considerable uncer tainty exists now as to the legal authorization for mining beyond the limits of national jurisdiction. Combined with the low prospective profitability, this uncertainty casts doubt on the feasibility of commercial nodule mining for some years to come.
As I mentioned previously, cobalt-rich manganese oxide crusts are more valuable than nodules at current prices. Because extensive deposits lie within the EEZ, the legal
uncertainty about their availability for mining may be much reduced and perhaps eliminated, depending on the actions of national governments. On these counts, the prospects for their commercial production are better than those for the nodules. The technical feasibility of mining the crusts has yet to be established, although preliminary ideas are already being considered (Paul, 1985). But, until methods for min ing the crusts are developed and tested, the feasibility of producing them commercially will be uncertain.
FERRUGINOUS AND MANGANIFEROUS SEDIMENTS
The hot brine deeps in the median valley of the Red Sea are underlain by several types of metalliferous sediments namely, sulfides, oxides, carbonates, and silicates. Al though iron is an important component of the sulfide facies, which will be discussed in the next section, it is also an important component of the other facies, as table 26 shows. These facies are the products of a hydrothermal system arising from the circulation of seawater through evaporites and hot basalts along the Red Sea spreading center. Accord ing to Shanks and Bischoff (1977), the several mineral facies represent a fractionation as the temperature of the brine decreases after it emanates from the sea bottom and the pH and Eh rise. The sequence of precipitation of the facies on cooling is sulfides, iron silicates, iron oxides, and man ganese oxides; manganese precipitates later than iron oxides
Subsea Mineral Resources 73

Table 26. Partial composition (in percent) of metalliferous sediments (excluding sulfide facies) of the Red Sea (from Bignell, 1975)
Fe Mn Zn Cu
Silicate facies
Atlantis II Deep:Ferroan nontronite ------------------------ 9.72 0.06 0.69 0.18Green smectite---------------------------21.50 .22 .52 .28Brown montmorillonite -------------------- 8.90 1.15 .21 .16
Iron oxide facies
Limonite facies:Kebrit Deep ----------------Gypsum Deep --------------Vema Deep ----------------
TTiAtic rV»f»n
Atlantis II Deep ------------Lepidocrocite facies:
Atlantis II Deep -------------^tff»1Y*l 1 C T~^f*f*T>
Thetis Deep ----------------Gypsum Deep --------------
Hematite facies, Atlantis II Deep ---\Aytonf^t iff* "FQf*if*c Ttiffic T^ffr%
.......-....--30.80
. ---------- .--50.70
.............-57.70
.._...._--.... 54.60
..--.. -------- fid 50/;i i/j
..-.........--51.43
._..- _-_--.-_ 35 00
..............60.47
.---_-.------. 54 35
.----------.-- 35 79£S1 TC
0.17 .35 .05 .45 .98 .26
.36 2.00 1.28
.19
.29
.21
0.10 .24 .10 .66 .20 .15
.08
.10
.17
.18
.12
.13
0.03 .01 .001 .006 .09 .01
.004
.08
.40
.03
.74
.47
Manganite facies
Thetis Deep --------------------
Chain Deep B -----------------.
..............20.50
..............30.75
..--_-._--.-_- 12 93-i on
15.48 17.85 35.37 15.56
0.75 1.32 1.22
.21
0.09 .04 .13 .01
Carbonate facies
Rhodochrosite, Atlantis II Deep ----.............. 6.49CO C£i
9.41.25
0.23 .16
0.02 .04
because of its slower rate of oxidation and its solubility at a higher pH (Krauskopf, 1957; Cronan, 1980). Although the iron in some ferruginous sediments in the Red Sea deeps is as rich or richer than that in most iron ores being mined on land, the recovery of iron from these sediments is not cur rently contemplated.
Ferruginous and manganiferous sediments (both lithified and unlithified) have also been found in the Gulf of Aden. The manganiferous sediments, a mixture of todorokite and birnessite, contain 34 to 42 percent Mn, 1.3 to 6.4 percent Fe, 14 to 900 ppm Ni, 8 to 203 ppm Cu, and 2 to 75 ppm Co (Cann and others, 1977). Crerar and others (1982) be lieved that the Gulf of Aden deposits and similar ones near the Galapagos rift are the modern analogs of manganese and manganiferous chert deposits in the Franciscan Complex of California, which in turn are similar to manganese deposits associated with ophiolite complexes elsewhere, such as those described in the Apennines by Bonatti and others (1976b). Typically, the Franciscan deposits are lens shaped,
as much as 30 m thick (but averaging only 1 m), and as much as 300 m in diameter (but most commonly only 15m). Although these deposits may contain 30 to 50 percent Mn, their tonnage is too small to make modern analogs attractive for exploration and mining by themselves; it is conceivable, however, that they might be recovered as a part of a mining operation directed at sulfide deposits, with which they may be associated vertically or laterally.
Ferruginous and manganiferous sediments have been found in numerous localities at other oceanic spreading cen ters and as basal sediments as much as 20 m thick overlying basalt in many drill holes in both the Atlantic and Pacific Ocean Basins (Bostrom, 1970; Von der Borch and Rex, 1970). The sediments were evidently deposited as a result of hydrothermal activity on newly formed basaltic crust in or near the axial zone of spreading and brought to their present positions as a result of continued sea-floor spreading. As table 27 shows, iron is considerably more abundant than manganese in these sediments, and, among the minor
74 Mineral and Petroleum Resources of the Ocean

Table 27. Ferruginous and manganiferous sediments at or near oceanic spreading centers (from Rona, 1978) [DSDP, Deep-Sea Drilling Project. , no data]
Range of composition
Location
Basal sediment overly
Mineralogy
f ing-- Goethite, iron-rich smec-
Fe, in percent
2.3-10.5
Mn, in percent
0.3-.7
Ni, in ppm
20-370
Cu, in ppm
25-167
Co, in ppm
Zn, in ppm
62-267basalt in several DSDP holes in North Atlantic Basin.
tite, manganese hy droxides.
Basal sediment overlying - - Siderite and other miner- basalt in several DSDP als. holes in east Atlantic Basin.
1.1-1.6 .02-7.3
Bauer Deep Smectite, goethite, todorokite.
9-18 2-7 410-1,700 710-1,200 90-330 110-680
Basal sediment overlying-- Goethite, iron-rich smec- 21.1-27.8 5.7-7.6 570-800 800-1,490 55-110 480-690 basalt in several DSDP tite, manganese hy- holes in north-central droxides. Pacific Basin.
East Pacific Rise crest ---- Goethite, iron-rich smec-between lat 12° and tite, manganese hy-14° S. droxides.
5.7-22.6 .6-8.8 250-1,200 510-1,800 75-280 190-530
Basal sediment overlying-- Goethite, iron-rich smec- 2.1-30.6 basalt in several DSDP tite, manganese hy- holes on East Pacific droxides. Rise between lat 10° and 15° N.
.4-9.6 62-1,680 220-1,814 10-183 33-518
Basal sediment overlying-- Goethite, iron-rich smec- basalt in several drill tite, manganese hy- holes on the East droxides. Pacific Rise between lat 9° and 13° S.
4.7-23.3 .2-9.5 270-805 270-1,700 18-290 220-1,050
Indian Ocean Ridge between lat 16° and 40° S.
.03-7.0 .1-2.0
metals, copper is more abundant than nickel in many areas, the reverse of their relation in nearly all subsea manganese nodules.
Similar sediments are found in the Bauer Deep between the East Pacific Rise and the Galapagos Rise. Sediments there average 15 percent Fe, 4 percent Mn, 0.12 percent Cu, 0.1 percent Ni, 0.02 percent Co, and 0.04 percent Zn (Bischoff and others, 1979). The Bauer Deep is about 3.9 million square kilometers in size and contains about 360 trillion tons of such sediment on a dry salt-free basis (J.L. Bischoff, personal communication, 1978). At 1983 prices, the four minor metals together would be the equiva lent of about 15 Ib/t Cu, which is within the range of the
grade of porphyry copper deposits now being mined on land. Even so, the sediments in the Bauer Deep and similar sediments elsewhere cannot be thought to be minable in the foreseeable future (Field and others, 1981).
Iron and manganese oxide precipitates have also been found associated with subsea hydrothermal activity in other areas besides the mid-ocean spreading centers. Zelenov (1964) reported iron and manganese oxide precipitates around hydrothermal vents on the submarine Banu Wuhu volcano of Indonesia. Deposits associated with hot springs in New Britain's Matupi Harbor contain 44 percent Fe, 0.034 percent Mn, 52 ppm Zn, and 47 ppm Cu (Ferguson and Lambert, 1972). Sediments in the inner exhalation zone
Subsea Mineral Resources 75

of the Santorini caldera in the Cyclodes volcanic arc in the eastern Mediterranean contain 40 percent Fe and 0.02 per cent Mn; in the outer exhalation zone, they contain 7 percent Fe and 0.55 percent Mn (Smith and Cronan, 1975; Cronan, 1980).
All of these deposits are of hydrothermal origin, although Cronan (1980) suggested that the sediments of the Bauer Deep are deriving some of their metals from the decay of organic matter and perhaps by the adsorption from seawater of iron and manganese oxides. Together with the sulfide deposits to be described in the next section, these deposits are the products of a hydrothermal system in which seawater circulating in fractures along the ridges is heated by contact with freshly intruded basalt, leaches metals from it, and emanates from the sea floor from hydrothermal vents. Cro nan (1980) believed that the iron-rich manganese-poor de posits and the rarer manganese-rich iron-poor deposits are products of a basically similar hydrothermal system in which sulfides precipitate first (possibly subsurface), fol lowed by silicates, iron oxides, and manganese oxides, the same sequence described for the Atlantis II deposits.
An ironstone crust containing as much as 47 percent Fe has been found at the surface of the bottom at many loca tions in the Gulf of Mexico (Pequegnat and others, 1972), and thin ferruginous layers of sediment have been found also in many cores in the Gulf of Mexico (Watson and Angino, 1969). Ferruginous crusts at the sea floor have also been found at a number of localities in the western equatorial Atlantic by McGeary and Damuth (1973), who believed that these crusts were formed at or near the end of the Pleis tocene, when the postglacial sea-level rise shut off the sup ply of terrigenous sediment to the deep-ocean floor:
Geochemical and stratigraphic evidence seem to indicate that the iron-rich crust was formed when decaying organic material reduced the iron and the terrigenous minerals. The reduced iron dissolved in the interstitial water, which was then expressed upward during sediment compaction. Upon reach ing the sediment-water interface, the iron was ox idized and reprecipitated, forming an iron- cemented crust that has been varied by post glacial pelagic sediments.
But, whereas the known iron- and manganese-rich sedi ments on the present sea floor are the products of hydrother mal activity and are spatially linked to hydrothermal sys tems, the most important and extensive fossil marine iron and manganese ores bear no direct relation to hydrothermal activity. According to Force and others (1983) and Cannon and Force (1983), about three-fourths of the world produc tion of manganese ore comes from shallow marine sedimen tary deposits for which there are as yet no known large analogs on the present sea bottom. They believed that fossil deposits formed during high sea-level stands that corre sponded to stratified and stagnant oceans. Manganese is more than 100 times more soluble in anoxic seawater than
it is in oxygenated seawater, and Cannon and Force believed that manganese oxides precipitated where deep anoxic water welled up toward the surface and became oxygenated. A present-day analog is the Black Sea, where deep anoxic water has an Eh of -0.15, a pH of 7.6, and dissolved CO2 and H2S; above a depth of 200 m, the water has an Eh greater than 0, a pH of 8.0 to 8.3, and dissolved oxygen. The dissolved manganese in the anoxic water is about 500 times greater than that in the oxygenated surface water (fig. 43). Manganese nodules forming on a shallow-water shelf in the northwestern part of the Black Sea may be the result of upwelling anoxic water mixing with oxygenated surface water. A similar process may account for manganese nod ules in the Baltic Sea, where silled anoxic basins are rimmed with manganese nodules (Manheim, 1965). Cannon and Force (1983) believed that the large bedded manganese ox ide and carbonate deposits of the Nikopol and Chiatura districts in the Soviet Union and the Varna district in Bul garia were deposited during the Oligocene, when anoxic conditions occurred in the paleo-Black Sea.
The ore in the Nikopol district overlies a glauconitic sand stone and is 2 to 3 m thick over an area about 25 km wide and over 150 km long (Maynard, 1983, summarized from Varentsov and Rakhmanov, 1977, 1980, and others). The ore changes from oxides in the north to mixed oxides and carbonates and then to carbonate in the south, a reflection of increasing water depth at the time of deposition (fig. 44).
+200
CONCENTRATION (ppb)
100 300 500
5 -500
-1500 L
Approximate
shelf break
Fe
Figure 43. Distribution of dissolved man ganese and iron in the Black Sea (after Brewer and Spencer, 1974).
76 Mineral and Petroleum Resources of the Ocean
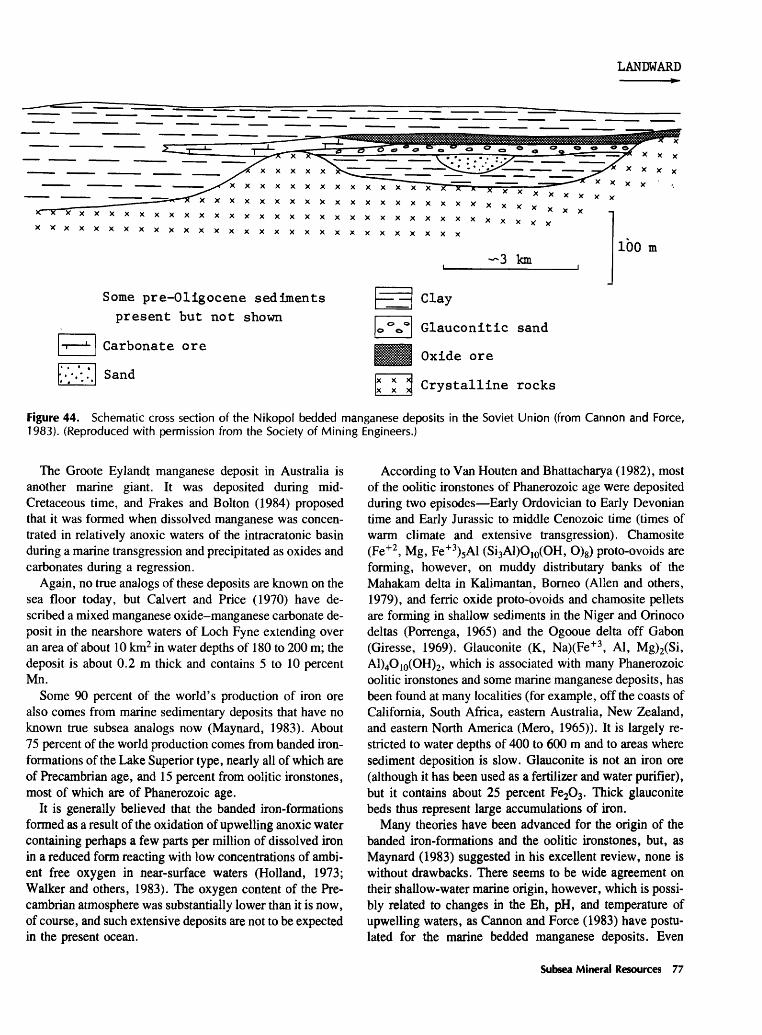
LANDWARD
XXX
100 m
Some pre-Oligocene sediments present but not shown
Carbonate ore
Sand
Clay
Glauconitic sand
Oxide ore
Crystalline rocks
Figure 44. Schematic cross section of the Nikopol bedded manganese deposits in the Soviet Union (from Cannon and Force, 1983). (Reproduced with permission from the Society of Mining Engineers.)
The Groote Eylandt manganese deposit in Australia is another marine giant. It was deposited during mid- Cretaceous time, and Frakes and Bolton (1984) proposed that it was formed when dissolved manganese was concen trated in relatively anoxic waters of the intracratonic basin during a marine transgression and precipitated as oxides and carbonates during a regression.
Again, no true analogs of these deposits are known on the sea floor today, but Calvert and Price (1970) have de scribed a mixed manganese oxide-manganese carbonate de posit in the nearshore waters of Loch Fyne extending over an area of about 10 km2 in water depths of 180 to 200 m; the deposit is about 0.2 m thick and contains 5 to 10 percent Mn.
Some 90 percent of the world's production of iron ore also comes from marine sedimentary deposits that have no known true subsea analogs now (Maynard, 1983). About 75 percent of the world production comes from banded iron- formations of the Lake Superior type, nearly all of which are of Precambrian age, and 15 percent from oolitic ironstones, most of which are of Phanerozoic age.
It is generally believed that the banded iron-formations formed as a result of the oxidation of upwelling anoxic water containing perhaps a few parts per million of dissolved iron in a reduced form reacting with low concentrations of ambi ent free oxygen in near-surface waters (Holland, 1973; Walker and others, 1983). The oxygen content of the Pre cambrian atmosphere was substantially lower than it is now, of course, and such extensive deposits are not to be expected in the present ocean.
According to Van Houten and Bhattacharya (1982), most of the oolitic ironstones of Phanerozoic age were deposited during two episodes Early Ordovician to Early Devonian time and Early Jurassic to middle Cenozoic time (times of warm climate and extensive transgression). Chamosite (Fe+2 , Mg, Fe +3)5Al (Si3Al)O 10(OH, O)8) proto-ovoids are forming, however, on muddy distributary banks of the Mahakam delta in Kalimantan, Borneo (Alien and others, 1979), and ferric oxide proto-ovoids and chamosite pellets are forming in shallow sediments in the Niger and Orinoco deltas (Porrenga, 1965) and the Ogooue delta off Gabon (Giresse, 1969). Glauconite (K, Na)(Fe +3 , Al, Mg)2(Si, A1)4O 10(OH)2 , which is associated with many Phanerozoic oolitic ironstones and some marine manganese deposits, has been found at many localities (for example, off the coasts of California, South Africa, eastern Australia, New Zealand, and eastern North America (Mero, 1965)). It is largely re stricted to water depths of 400 to 600 m and to areas where sediment deposition is slow. Glauconite is not an iron ore (although it has been used as a fertilizer and water purifier), but it contains about 25 percent Fe2O3 . Thick glauconite beds thus represent large accumulations of iron.
Many theories have been advanced for the origin of the banded iron-formations and the oolitic ironstones, but, as Maynard (1983) suggested in his excellent review, none is without drawbacks. There seems to be wide agreement on their shallow-water marine origin, however, which is possi bly related to changes in the Eh, pH, and temperature of upwelling waters, as Cannon and Force (1983) have postu lated for the marine bedded manganese deposits. Even
Subsea Mineral Resources 77

though iron and manganese are partitioned in their precipita tion, as previously described, it is not uncommon to find iron and manganese deposits in close association in the same vertical sequence (for example, in the Francevillian basin of Gabon, in Urucum in Mato Grosso, Brazil, and in Nsuta in West Africa), and it seems possible that at least some iron and manganese deposits (perhaps glauconite deposits also) are lateral time equivalents.
The present oceans are not anoxic, of course, and thus are not widely favorable for the formation of the huge iron and manganese deposits of the past. But that unfavorability does not rule out the possibility of the local existence of such deposits in restricted environments. Even if such deposits were present, however, they are not likely to be of economic interest in the foreseeable future.
METALLIC SULFIDE DEPOSITS
Concentrations of base-metal sulfide deposits were first discovered on the deep-ocean floor in the Atlantis II Deep of the Red Sea by a Woods Hole Oceanographic Institution expedition in 1965 (Degens and Ross, 1969), and they were first reported in a mid-ocean ridge crest in 1974 when Bonatti and others (1976a) found small amounts of iron and copper sulfides in the equatorial Mid-Atlantic Ridge. Begin ning with the 1977 discovery by Lonsdale (1979) of small amounts of iron, copper, and zinc sulfides in the rift valley in the Gulf of California and the discovery by the C YAMEX expedition in 1978 of sizable sulfide deposits in the East Pacific Rise at 21° N. (Francheteau and others, 1979), sev eral sulfide deposits have been found along the axes of Pacific spreading centers. These sea-floor discoveries were preceded by recognition that the massive sulfide deposits associated with volcanic rocks were deposited in similar submarine environments. Thus, since the late 1950's, it has been recognized that the massive sulfide deposits associated with ophiolite complexes on land were formed on the deep- ocean floor (for reviews, see Anderson, 1969; Sillitoe, 1972; Sawkins, 1976; Solomon and Walshe, 1979; Franklin and others, 1981). And, beginning in the 1960's with the discovery of metalliferous sediments along mid-ocean ridge crests (Bostrom and Peterson, 1966) and of high heat flow there (Elder, 1965), several geologists predicted the occur rence of sulfide deposits in association with hydrothermal systems in the spreading center environment (Sillitoe, 1972; Bonatti and others, 1976a).
Sulfide deposits have also been found on seamounts a few kilometers from the East Pacific Rise crest at lat 13° N. (Hekinian and others, 1981) and near lat 20° N. (Lonsdale and others, 1982a). Rona (1984) listed a total of 21 occur rences of sulfide minerals on the sea floor in all environ ments, including some in fracture zones. Most are of scien tific interest only.
Red Sea Metalliferous Sediments
The Red Sea occupies a rift valley at a divergent plate boundary. Seventeen deep basins (Shanks, 1983) lie along its median valley (fig. 45). Most of them contain hot, highly concentrated brines, and some contain metalliferous sedi ments. Of these, the sediments of the Atlantis II Deep are the most promising for commercial production, and they have been the object of extensive scientific studies and ex ploration.
The Atlantis II Deep lies at a depth of about 2,000 m. It is elongate and parallel to the axis of the median valley and has an area of about 56 km2 . It has two layers of hot brine. The lower layer had temperatures of 56 °C and 60 °C in 1966 and 1972, respectively, and a salinity of 25.7 percent. The upper layer had a temperature of 44 °C to 60 °C in the same years and a salinity of 13.5 percent. A layer of sulfide muds about 1 m thick is extensive (table 28). Except in the south western basin of the deep, where it is cut by veins and otherwise modified by epigenetic processes (Zierenberg and Shanks, 1983), the sulfide mud is finely laminated. It is overlain by 7 to 8 m of iron oxide and iron silicate muds that also contain small quantities of other metals (Bischoff, 1969). The principal minerals of the sulfide mud are pyrite (FeS 2), chalcopyrite (CuFeS2), and sphalerite (ZnS2). Bischoff and Manheim (1969) estimated that the upper 10m of sediment in the Atlantis II Deep averages 29 percent Fe, 3.4 percent Zn, 1.3 percent Cu, 0.1 percent Pb, 54 ppm Ag, and 0.05 ppm Au. Contemplating recovery of all these metals except iron, they estimated that the upper 10 m of sediment in the Atlantis II Deep would contain about 2.9 million tons of zinc, 1 million tons of copper, 800,000 t of lead, 4,500 t of silver, and 45 t of gold. Hackett and Bischoff (1973) later revised the estimates for zinc and copper to 3.2 million and 0.8 million tons, respectively. A more recent estimate (Nawab, 1984) is 2 million tons of zinc, 0.4 million tons of copper, 4,000 t of silver, and 80 t of gold (see also Guney and others, 1984). At mid-1983 metal prices, the total in-place value of these metals for these estimates would be in the range of about $3.8 to $5.1 billion, about 40 to 25 percent of which would be in the value of silver and gold.
As I discussed previously, the Red Sea deeps contain several distinct facies of metalliferous sediments seen in both vertical and lateral variations, in some places over short distances (Bischoff, 1969; Bignell, 1975). These facies in clude (1) the mixed sulfide facies already described; (2) a pyrite facies; (3) several silicate facies in which smectite (Al2O3 -2SiO2) and other clay like minerals dominate and among which an iron-rich smectite is the most widespread; (4) several oxide and hydroxide facies in which limonite (2Fe2O3 -3H2O), goethite (Fe2O3 -H2O), lepidocrocite (Fe 2 O 3 -H 2 O), magnetite (Fe 3 O 4 ), or manganite (Mn2O3 -H2O) dominate; (5) carbonate facies in which
78 Mineral and Petroleum Resources of the Ocean

X Deeps with brines
D Deeps with hydrothermal sediments
A Hydrothermally influenced sediments
1,000m
Figure 45. Hot brine deeps in the Red Sea (modified from Mustafa and Amann, 1980) (from McKelvey, 1980). Deeps shown are those containing the most highly metalliferous sediments. (Copyright 1980 by the American Association for the Advancement of Science.)
siderite (FeCO3) and rhodochrosite (MnCO3) are present; (6) sulfate facies composed of anhydrite (CaSO4) and gyp sum (CaSO4 -2H2O). Buried saline deposits are also exten-
The Red Sea metalliferous sediments are the products of a still-active hydrothermal system along a slow-rate spread
ing center in which seawater of normal composition (Craig, 1969) circulating through subsurface halite, anhydrite, and gypsum attains a high salinity. Contact with recent basalt in the rift area raises the water temperature to more than 200 °C and allows it to leach metals from the basalt. On
Subsea Mineral Resources 79

Table 28. Chemical analyses of the sulfide facies of Red Sea sediments (from Bignell, 1975) [ND, not detected; N/D, not determined]
FaciesCa,
in percentAI 203 ,
in percentFe, Mn,
in percent in percentZn, Cu, Ni, Co,
in percent in percent in ppm in ppm
Mixed sulfide facies:Atlantis II Deep (SU2) ------------------ 3.70 2.81 15.74 1.11 10.92 2.22 130 185Atlantis II Deep (SU^ ------------------ 9.70 1.72 20.31 2.81 5.31 1.34 94 125Atlantis II Deep------------------------ 5.70 1.74 25.71 .17 11.40 .83 60 260
(sulfide-silicate facies). ErbaDeep --------------------------- 10.64 4.11 16.60 .61 .34 .06 45 40
Pyrite facies:
Gypsum Deep ------------ ............ 29.10 .18 19.10 .09 .05 .67 13 45
discharge and cooling at the surface, the metals precipitate, beginning with chalcopyrite, galena, sphalerite, and pyrite and followed successively by iron silicates, iron oxides, and manganese oxides as the temperature decreases and the pH increases (Shanks and Bischoff, 1977; Krauskopf, 1957).
Although two of the deeper lakes in the East African rift valley show evidence of hydrothermal mineralization and although a small deposit of iron and manganese oxides in the Afar rift bordering the Red Sea may also be of volcanic- sedimentary origin (reviewed by Maynard, 1983), no other large brine pool deposits are known. It seems unlikely that any will be found in the open ocean. Deposits having the same lithologic association are not known in the fossil record, either, but, because evaporites are a common product of the early stages of continental rifting, it would not be surprising if similar deposits were found in ancient rift systems.
Sulfide Deposits on the Mid-Ocean Ridges of the East Pacific
Since the 1978 CYAMEX discovery of sulfide deposits at lat 21° N. on the East Pacific Rise (Francheteau and others, 1979; Crane and Ballard, 1980; Hekinian and others, 1980; Zierenberg and others, 1984), such deposits have been found at seven other ridge crest localities in the east Pacific (fig. 46): (1) the Juan de Fuca Ridge (Normark and others, 1982, 1983, 1984; Normark, 1983;Koski and others, 1982, 1984); (2) the Gorda Ridge (Rowland and others, 1983); (3) the Guaymas Basin in the Gulf of California (Lonsdale and Becker, 1985; Lonsdale and others, 1980; Lonsdale, 1984); (4) the East Pacific Rise at lat 13° N. (Hekinian and others, 1981, 1983); (5) the East Pacific Rise at lat 21° N.; (6) the Galapagos rift (Corliss and others, 1979; Malahoff, 1981, 1982a; Law and others, 1981; Malahoff and others, 1983); and (7) the East Pacific Rise at lat 20° S. (Ballard and others, 1981). The deposits are all associated with active or inactive hydrothermal vents. Associated with the active
vents are unique assemblages of large clams, mussels, and tube worms, the food for which comes from microbial chemosynthesis using energy from the reaction of sulfides in heated seawater (Grassle, 1982). The hydrothermal fluids are at temperatures of up to 380 °C or so, and they contain about 100 ppm Fe and a few parts per million of zinc and
I20°W 90°W
30°N
0°
25°S
Figure 46. Mid-ocean ridge sites (solid circles) where active hydrothermal circulation and associated massive sulfide de posits have been observed (from Normark and others, 1983). 1, Juan de Fuca Ridge; 2, Gorda Ridge; 3, Guaymas Basin; 4, East Pacific Rise, lat 21° N.; 5, East Pacific Rise, lat 13° N.; 6, Galapagos rift; 7, East Pacific Rise, lat 20° S. Open circles indicate numbered Deep-Sea Drilling Project sites where simi lar sulfide deposits have been recovered at depth.
80 Mineral and Petroleum Resources of the Ocean
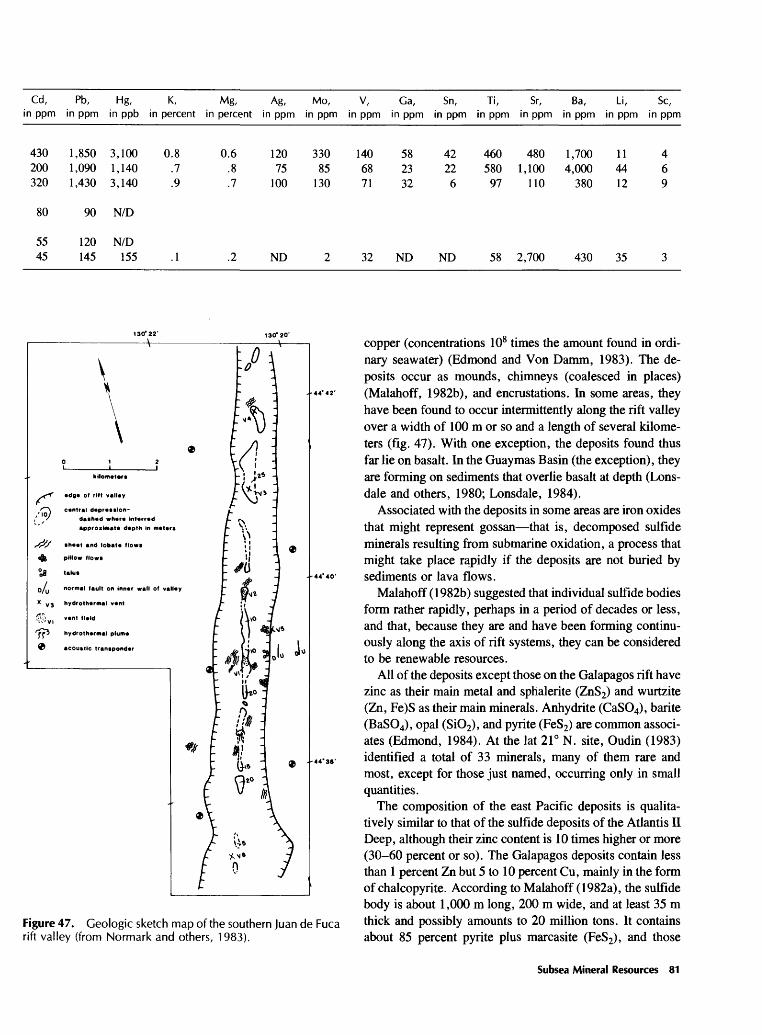
Cd, Pb, Hg, K, Mg, Ag, Mo, V, Ga, Sn, Ti, Sr, Ba, Li, Sc, in ppm in ppm in ppb in percent in percent in ppm in ppm in ppm in ppm in ppm in ppm in ppm in ppm in ppm in ppm
430200320
80
1,850 3,1001,090 1,1401,430 3,140
90 N/D
0.8 0.6 120 330 140 58 42 460 480 1,700 11 4.7 .8 75 85 68 23 22 580 1,100 4,000 44 6.9 .7 100 130 71 32 6 97 110 380 12 9
55 45
120 N/D 145 155 .1 .2 ND 2 32 ND ND 58 2,700 430 35 3
*Is
edge of rift valley
central depression- dashed where Inferred approximate depth in meters
sheet and lobate flows
pillow flows
talus
X VJ hydrothermal vent
&! v) » "' " '<*
rffi> hydrothermal plume
9 acoustic transponder
* -
/, »
Figure 47. Geologic sketch map of the southern Juan de Fuca rift valley (from Normark and others, 1983).
copper (concentrations 108 times the amount found in ordi nary seawater) (Edmond and Von Damm, 1983). The de posits occur as mounds, chimneys (coalesced in places) (Malahoff, 1982b), and encrustations. In some areas, they have been found to occur intermittently along the rift valley over a width of 100 m or so and a length of several kilome ters (fig. 47). With one exception, the deposits found thus far lie on basalt. In the Guaymas Basin (the exception), they are forming on sediments that overlie basalt at depth (Lons- dale and others, 1980; Lonsdale, 1984).
Associated with the deposits in some areas are iron oxides that might represent gossan that is, decomposed sulfide minerals resulting from submarine oxidation, a process that might take place rapidly if the deposits are not buried by sediments or lava flows.
Malahoff (1982b) suggested that individual sulfide bodies form rather rapidly, perhaps in a period of decades or less, and that, because they are and have been forming continu ously along the axis of rift systems, they can be considered to be renewable resources.
All of the deposits except those on the Galapagos rift have zinc as their main metal and sphalerite (ZnS2) and wurtzite (Zn, Fe)S as their main minerals. Anhydrite (CaSO4), barite (BaSO4), opal (SiO2), and pyrite (FeS2) are common associ ates (Edmond, 1984). At the lat 21° N. site, Oudin (1983) identified a total of 33 minerals, many of them rare and most, except for those just named, occurring only in small quantities.
The composition of the east Pacific deposits is qualita tively similar to that of the sulfide deposits of the Atlantis II Deep, although their zinc content is 10 times higher or more (30-60 percent or so). The Galapagos deposits contain less than 1 percent Zn but 5 to 10 percent Cu, mainly in the form of chalcopyrite. According to Malahoff (1982a), the sulfide body is about 1,000 m long, 200 m wide, and at least 35 m thick and possibly amounts to 20 million tons. It contains about 85 percent pyrite plus marcasite (FeS2), and those
Subsea Mineral Resources 81

Table 29. Estimates of typical grades and values per ton of contained metals for sea-floor massive sulfide deposits, compared with typical ore from ophiolite massive sulfide deposits and deep-sea manganese nodules (from Bischoff and others, 1983) [ , not determined]
Sulfides, Iat21° N. and Juan de Fuca Ridge
Element
Zn ------Cu------Ni ------Co------/"* A
Mo -----Ae -----AS Pb ------
Mn -----Ge ------
Total
Metal values, 1 in $/kg
O OQ
------ 1.46------7.1
3« r>8
_-_--. 2 221 8 87
ice 90
....... .44-------.40-- 1,060.0
Typical grade,2
in percent
30.5
.07
.02
.30
.01
Value per ton,
in dollars
267.0 7.30
1.55
71.06 1.32
(106.0) ---348 236
Sulfides, Galapagos rift
Typical grade,3
in percent
0.2 5.0
.02
.017
Value per ton,
in dollars
1.78 73.0
7.01
3.20
84.9
Sulfide ore, Cyprus4
Typical grade,4
in percent
0.22.5
Value per ton,
in dollars
1.78 36.50
38.28
Deep-sea manganese nodules
Typical grade, 5
in percent
0.13 .99
1.22.23
.018
28.8
Value per ton,
in dollars
1.16 14.45 86.62 80.69
9.05
(115.20)
191.97 (307. 17)7
'Prices from Metals Week, December 6, 1981. Mn as ferromanganese, others as pure metals.Approximate average from Bischoff and others (1983, table 5).3Taken from Bischoff and others (1983, table 3, sample 9).4Typical ore from Skouriotissa mine reported by Constantinou and Govett (1972).5Average for Clarion-Clipperton prime zone reported by McKelvey and others (1979).6Excluding Ge because its recovery at such a concentration likely would not be profitable.'Including Mn.
minerals are also present (but in much lesser amounts) in the zinc-rich deposits (Bischoff and others, 1983).
None of these deposits has been sampled enough to make meaningful estimates of average composition, but Bischoff and others (1983) have developed "typical" compositions of the zinc- and copper-rich sulfide deposits and compared them with Cyprus sulfide ore and with manganese nodules from the Clarion-Clipperton zone (table 29) (Broadus and Bowen, 1983). As the table shows, Bischoff and others considered zinc, copper, cadmium, silver, and lead to be potentially recoverable from the zinc-rich deposits, 77 per cent of the total value being made up by zinc and 20 percent by silver. They considered copper, zinc, cobalt, and molyb denum to be the potentially recoverable metals in the copper-rich deposits, 86 percent of the value being made up by copper. Their total values of $348/t and $85/t for the zinc- and copper-rich deposits, respectively, compare with about $38/t for Cyprus ore and $192/t for Clarion-Clipper ton zone manganese nodules if manganese is not recovered and $307/t if it is. Very likely, sulfur would also be recov ered, but its potential value has not been estimated.
All of the ridge sulfide deposits found thus far are in areas where the spreading rates are medium or fast (that is, greater than about 5 cm/yr). Iron and manganese oxides of hy- drothermal origin have been found in many other ridge
systems, including the slow-spreading'Mid-Atlantic Ridge, but, with the exception of a rare find (Bonatti and others, 1976a) of disseminated grains of pyrite or chalcopyrite in basalt, sulfide deposits have not been found in ridges having slow spreading rates. However, the largest subsea sulfide deposit found thus far (the Atlantis II) is forming at a slow- rate spreading center; in fact, on theoretical grounds, Rona (1984) believed the probability for the formation of large deposits on slow-spreading centers to be greater than that on fast-spreading centers. In the Pacific and Indian Ocean Basins, medium- or fast-spreading ridge systems have a total length of approximately 40,000 km (Bischoff and oth ers, 1983). The fact that all Pacific Ridge expeditions since 1978 have discovered sulfide deposits indicates that they are widespread, as the following discussion of the analogous deposits already mined and explored on land will show, but it is not to be supposed that a continuous sulfide deposit exists along the entire mid-ocean ridge.
As with the Red Sea deposits, the mid-ocean ridge sulfide deposits are the result of seawater circulating through hot basalt and leaching metals from it. Bischoff and others (1983) estimated that the deposition of the silver in 1 g of sulfide required the leaching of about 2,500 g of basalt, if all of its silver were removed.
82 Mineral and Petroleum Resources of the Ocean

Sulfide Deposits Associated with Volcanic Seamounts
Hekinian and others (1981) reported iron-rich (pyrite and marcasite) sulfide (and some chalcopyrite, rare zinc sulfide, and local concentrations of cobalt) on the flanks of a vol canic seamount 6 km southeast of the axis of the East Pacific Rise near lat 13° N., where zinc-rich sulfides are found in the axial zone at about 30 sites over a distance of about 15 km. Hekinian (1984) said that, "A first approximation indi cates that the deposit has a volume of material 10 times as great as all the combined sulfide deposits distributed along the 20-kilometer segment of the adjacent axis of the East Pacific Rise." He considered seamounts to be "favoured sites for the formation of mineral deposits."
Lonsdale and others (1982) found deposits of pyrite and chalcopyrite on Green volcano (so named for bright-green secondary copper minerals found in places) about 20 km west of the sulfide deposits in the axial zone of the East Pacific Rise at lat 21° N. They occur in three environ ments the caldera floor, on the walls of the caldera and pit craters, and on the summit benches around the caldera and craters. Outcrops of massive sulfides formed about 5 per cent of a 10,000-m2 area of crater wall, and Lonsdale and others speculated that they might be projections from a continuous sulfide deposit mostly blanketed by a fine grained iron oxide veneer. They believed that sulfide de posits on flank volcanoes such as this one are most likely to form during the geologically brief period when the magma chamber is freezing and thus creating fractures that give access to circulating fluids.
Flank volcanics are carried away from the ridge axis by plate movement and become extinct before they have moved very far. Lonsdale and others (1982) thought that they might be far more numerous than anyone had previously realized. Unless sulfide deposits formed on the surfaces of these volcanics are quickly buried, however, they are likely to be destroyed rather quickly by oxidation. If seamount deposits prove to be large enough and rich enough to be of commer cial value, targets for exploration would be flank volcanoes near the ridge crest.
Analogs on Land
Strata-bound sulfide deposits associated with submarine volcanic rocks are found in many parts of the world. Known as a part of the generic group of volcanic-associated massive sulfide deposits, they have been defined by J.M. Franklin and D.F. Sangster in a comprehensive review (Franklin and others, 1981) as sulfide accumulations normally composed of at least 60 percent sulfides in their stratiform portions; pyrite is generally the dominant sulfide, and chalcopyrite,
sphalerite, or galena is the principal economic mineral. Franklin and Sangster said (Franklin and others, 1981) that at least 420 deposits of this type have been recorded (al though information on occurrences of this type in the Soviet Union and the People's Republic of China is scant) and that:
. . .virtually every major tectonic domain that has submarine volcanic rocks has at least minor repre sentation of this deposit type. From our compila tion of tonnage and grade data (production and reserves) these deposits collectively contain at least 3.7X10⁷ metric tons of copper, 8.6xl07 metric tons of zinc, 2.2x 10⁷ metric tons of lead, 6.3X10¹⁰ g of silver, and 2.2xl09 g of gold. These are obviously minimum figures.
All of these deposits were formed on the sea bottom (some overlie a stringer system of discordant veins) as the result of hydrothermal systems associated with submarine volcanism, possibly in areas where the bottom waters were anoxic and where they were thus preserved until burial (Force and others, 1983). Not all of them, however (perhaps not even half), were formed in the mid-ocean ridge environ ment in association with basaltic volcanic activity. The vol canic rocks associated with many of them are wholly felsic in composition (rhyolites, dacites, or andesites). Felsic ex- trusives are not unknown in mid-ocean ridge volcanoes (some are found in Iceland, for example), but, if present at all, they are a minor component. The domains in which they are dominant are continental crust overlying subduction zones in island arcs or near the edges of continental masses. Thus, the volcanoes forming the "ring of fire" around the Pacific are dominantly felsic. The massive sulfide deposits in which the associated volcanoes are mainly felsic, as they are in the famous Kuroko deposits of Japan, likely were formed in submarine basins in an island arc setting. Qhmoto (1978) suggested that they were deposited on submarine resurgent calderas. Although many of their characteristics are similar to those formed in a ridge setting, they are of interest not as analogs of the recently discovered east Pacific deposits but as examples of sulfide deposits that may be found in other subsea environments yet to be identified in the present ocean.
Also known on land are syndiagenetic sulfide deposits associated with marine sedimentary rocks not in the imme diate vicinity of volcanic rocks. Examples are the silver- lead-zinc deposit at the Sullivan mine in British Columbia (Sawkins, 1976, 1982); the lead-zinc deposits at Mac Arthur River in Australia (Maynard, 1983); and the recently dis covered Red Dog zinc-lead-silver deposit in the Delong Mountains of northwestern Alaska (G.E. McKelvey, per sonal communication, 1984). These deposits are clearly of subsea hydrothermal origin; for example, Alexander Mala- hoff found tube worms associated with the Red Dog deposit. Sawkins (1976, 1982) believed that these deposits and other
Subsea Mineral Resources 83
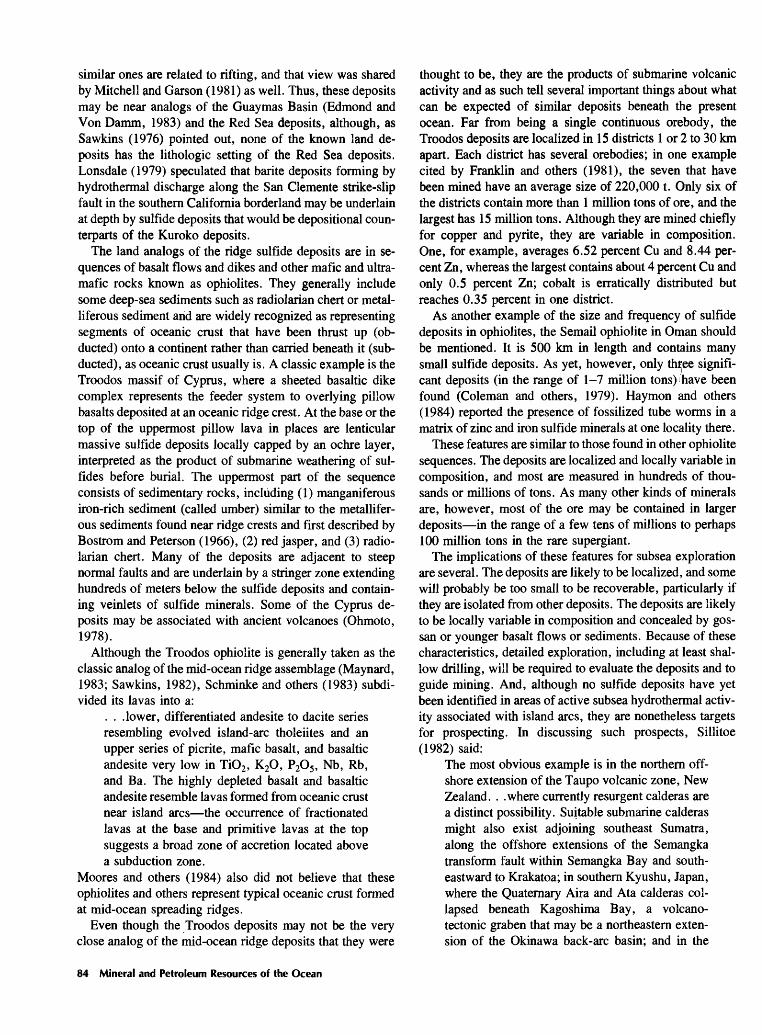
similar ones are related to rifting, and that view was shared by Mitchell and Garson (1981) as well. Thus, these deposits may be near analogs of the Guaymas Basin (Edmond and Von Darnm, 1983) and the Red Sea deposits, although, as Sawkins (1976) pointed out, none of the known land de posits has the lithologic setting of the Red Sea deposits. Lonsdale (1979) speculated that barite deposits forming by hydrothermal discharge along the San Clemente strike-slip fault in the southern California borderland may be underlain at depth by sulfide deposits that would be depositional coun terparts of the Kuroko deposits.
The land analogs of the ridge sulfide deposits are in se quences of basalt flows and dikes and other mafic and ultra- mafic rocks known as ophiolites. They generally include some deep-sea sediments such as radiolarian chert or metal liferous sediment arid are widely recognized as representing segments of oceanic crust that have been thrust up (ob- ducted) onto a continent rather than carried beneath it (sub ducted), as oceanic crust usually is. A classic example is the Troodos massif of Cyprus, where a sheeted basaltic dike complex represents the feeder system to overlying pillow basalts deposited at an oceanic ridge crest. At the base or the top of the uppermost pillow lava in places are lenticular massive sulfide deposits locally capped by an ochre layer, interpreted as the product of submarine weathering of sul- fides before burial. The uppermost part of the sequence consists of sedimentary rocks, including (1) manganiferous iron-rich sediment (called umber) similar to the metallifer ous sediments found near ridge crests and first described by Bostrom and Peterson (1966), (2) red jasper, and (3) radio larian chert. Many of the deposits are adjacent to steep normal faults and are underlain by a stringer zone extending hundreds of meters below the sulfide deposits and contain ing veinlets of sulfide minerals. Some of the Cyprus de posits may be associated with ancient volcanoes (Ohmoto, 1978).
Although the Troodos ophiolite is generally taken as the classic analog of the mid-ocean ridge assemblage (Maynard, 1983; Sawkins, 1982), Schminke and others (1983) subdi vided its lavas into a:
. . .lower, differentiated andesite to dacite series resembling evolved island-arc tholeiites and an upper series of picrite, mafic basalt, and basaltic andesite very low in TiO2 , K2O, P2O5 , Nb, Rb, and Ba. The highly depleted basalt and basaltic andesite resemble lavas formed from oceanic crust near island arcs the occurrence of fractionated lavas at the base and primitive lavas at the top suggests a broad zone of accretion located above a subduction zone.
Moores and others (1984) also did not believe that these ophiolites and others represent typical oceanic crust formed at mid-ocean spreading ridges.
Even though the Troodos deposits may not be the very close analog of the mid-ocean ridge deposits that they were
thought to be, they are the products of submarine volcanic activity and as such tell several important things about what can be expected of similar deposits beneath the present ocean. Far from being a single continuous orebody, the Troodos deposits are localized in 15 districts 1 or 2 to 30 km apart. Each district has several orebodies; in one example cited by Franklin and others (1981), the seven that have been mined have an average size of 220,000 t. Only six of the districts contain more than 1 million tons of ore, and the largest has 15 million tons. Although they are mined chiefly for copper and pyrite, they are variable in composition. One, for example, averages 6.52 percent Cu and 8.44 per cent Zn, whereas the largest contains about 4 percent Cu and only 0.5 percent Zn; cobalt is erratically distributed but reaches 0.35 percent in one district.
As another example of the size and frequency of sulfide deposits in ophiolites, the Semail ophiolite in Oman should be mentioned. It is 500 km in length and contains many small sulfide deposits. As yet, however, only three signifi cant deposits (in the range of 1-7 million tons) have been found (Coleman and others, 1979). Haymon and others (1984) reported the presence of fossilized tube worms in a matrix of zinc and iron sulfide minerals at one locality there.
These features are similar to those found in other ophiolite sequences. The deposits are localized and locally variable in composition, and most are measured in hundreds of thou sands or millions of tons. As many other kinds of minerals are, however, most of the ore may be contained in larger deposits in the range of a few tens of millions to perhaps 100 million tons in the rare supergiant.
The implications of these features for subsea exploration are several. The deposits are likely to be localized, and some will probably be too small to be recoverable, particularly if they are isolated from other deposits. The deposits are likely to be locally variable in composition and concealed by gos san or younger basalt flows or sediments. Because of these characteristics, detailed exploration, including at least shal low drilling, will be required to evaluate the deposits and to guide mining. And, although no sulfide deposits have yet been identified in areas of active subsea hydrothermal activ ity associated with island arcs, they are nonetheless targets for prospecting. In discussing such prospects, Sillitoe (1982) said:
The most obvious example is in the northern off shore extension of the Taupo volcanic zone, New Zealand. . .where currently resurgent calderas are a distinct possibility. Suitable submarine calderas might also exist adjoining southeast Sumatra, along the offshore extensions of the Semangka transform fault within Semangka Bay and south eastward to Krakatoa; in southern Kyushu, Japan, where the Quaternary Aira and Ata calderas col lapsed beneath Kagoshima Bay, a volcano- tectonic graben that may be a northeastern exten sion of the Okinawa back-arc basin; and in the
84 Mineral and Petroleum Resources of the Ocean

southern Aegean, where Holocene caldera col lapse (for example, Santorini) was in a tensional back-arc setting linked to northward subduction.
Rona (1982) considered the marginal seas of the western Pacific, where spreading centers occur in back-arc basins between the volcanic island arcs and the 'mainland, to be generally favorable for their occurrence. Using abiogenic methane in surface water as a tracer for submarine hy- drothermal systems, Kim and others (1983) believed that they have identified sites of hydrothermal activity in the Mariana Trough and at Loihi Seamount, the youngest of the Hawaiian volcanoes.
Feasibility of Commercial Recovery
Only the Atlantis II Deep has been explored enough to justify an estimate of its tonnage and potential value; on the basis of publicly available information, even such estimates must be regarded as tentative and subject to major revision. With that caveat, the Atlantis II deposit has been estimated by Bischoff and Manheim (1969) to contain about 85 mil lion tons of the composition already indicated. It thus ranks among the supergiants of known sulfide deposits, although it is lower in grade than many of them. Even so, at current prices and on the assumption of about 85 percent recovery, the potential value of its contained metals would be roughly $3.2 to $4.3 billion.
In 1974, the Governments of Saudi Arabia and Sudan formed the Red Sea Commission to undertake joint research and development studies on the Red Sea deposits. Work has been proceeding steadily, mainly through a contract with the German firm Preussag AG. All phases of the recovery, processing, and tailings disposal systems have been tested (Mustafa and Amann, 1980; Nawab, 1984), and, although some pilot-scale testing remains to be done, production is expected to begin in the latter part of this decade.
Given the metal compositions estimated by Bischoff and others (1983) for "typical" east Pacific ridge deposits and shown in table 29, the value of these deposits in place would range from $85/t to $348/t. No speculations have even been made public as to the cost of mining the mid-ocean ridge deposits. It is possible that the experimental lifting technol ogy already used for manganese nodule mining might be suitable for the sulfides, and processing technology is al ready well established. How the mining itself would be done is the problem (Cruickshank and Zippin (1983) and Kauf- man (1985) have discussed the possibilities). Some of the rock might be soft enough to be dredged with a towed or self-propelled miner, but, if the rock is hard enough to require blasting, the added cost would be considerable. An other required technology not transferable from nodule re search and development is that of detailed exploration, in cluding drilling.
Neither the feasibility nor the profitability of subsea sul fide mining can be assessed now. A useful question at this stage, however, is whether the targets appear to be large enough to warrant further investment in exploration and research and development. A crude approach to finding an answer is to look at the targets for nodule mining. It has been generally accepted that a reasonable model for a manganese nodule operation would be one producing 3,000,000 t/yr of nodules for 25 years. Estimates of whether the revenues from such an operation would be sufficient to warrant the large investment required have varied considerably, but it is significant that a target of that magnitude has led several consortia of members from several countries to invest many tens of millions of dollars in exploration and research and development on nodule mining. The value of the metals in 75 million tons of nodules is about $13.4 billion if only nickel, copper, and cobalt are recovered and $23 billion if manganese is recovered also. Notwithstanding the fact that the target justifying research and development on the Red Sea muds (where the discovery had already been made and where the hurdles anticipated in developing the technology were lower than those seen here for the ridge sulfides) was only about $6 billion, it would appear that the target justify ing exploration and research and development on the ridge sulfide deposits would have to be of the order of $15 billion or possibly more. A roughly similar assumption has been made by Cruickshank and Zippin (1983), who speculated that a viable operation on the Gorda Ridge would produce a total of 30 million tons of ore over 20 years; at the value of $348/t calculated by Bischoff and others (1983) for the nearby Juan de Fuca deposits, such an operation would represent a total value of about $10.5 billion.
Is it likely that such targets exist? The $15 billion trans lates into about 43 million tons or so of the Juan de Fuca tenor not necessarily in a single deposit or even in one closely spaced cluster of deposits but at least in an area small enough that a mining organization can hope to control it. On the basis of the land analogs discussed previously, the an swer would seem to be, "Yes, there are some, and, if one could expect to control a sulfide-bearing ridge crest of the length of the Troodos massif (that is, 90 to 100 km), there are probably a lot more."
Even if such targets do exist, the feasibility of mining subsea sulfide deposits has yet to be demonstrated. Craw- ford and others (1984) have made some preliminary studies of the geotechnical engineering properties of the subsea sulfides (their density, porosity, durability, hardness, com- pressive strength, and cutting properties). They concluded that "the most feasible method for mining would be some type of cutter head and hydraulic lifting system," but, as yet, such a system has not even been designed, much less tested. At this stage, one cannot assume that the deposits will be come economically recoverable (Broadus and Bowen, 1984).
Subsea Mineral Resources 85

Jurisdiction Over Exploration and Production
Much of the mid-ocean ridge lies seaward of 200 nmi from the coastal baselines from which the breadth of the territorial sea is measured. Under the provisions of the Con vention adopted by the Law of the Sea Conference on April 30, 1982, coastal States would have jurisdiction over the 200-mi EEZ and over the part of the continental margin that extends beyond that distance. Its language is somewhat ambiguous in stating that "the outer limits of the continental shelf. . .either shall not exceed 350 nautical miles from the baselines from which the breadth of the territorial sea is measured or shall not exceed 100 nautical miles from the 2500 meter isobath," but, notwithstanding these provisions, "on submarine ridges the limits of the continental shelf shall not exceed 350 nautical miles from the base lines from which the breadth of the territorial sea is measured," perhaps an implication that, on an oceanic ridge, the limit might be as much as 350 mi if the bathymetry would carry it that far. This implication is clearly negated, however, by an earlier provision defining the continental margin, over which coastal States are to have jurisdiction, as including the shelf, slope, and rise but not "the deep-ocean floor with its oceanic ridges."
Beyond the EEZ, then, the mid-ocean ridge would be a part of the area under the control of the International Sea- Bed Authority. The Convention provides no detailed regula tions governing the mining of minerals other than man ganese nodules, but a provision added during the eleventh session of the conference requires that the Council (the Authority's executive body), acting by consensus, would, on request, promulgate rules and regulations governing the mining of other minerals. If the parallel system were applied to the sulfide deposits, as it is to the nodules, an aspiring contractor would have to identify two areas containing de posits of estimated equal value much more of a burden on a sulfide miner than it would be on a nodule miner in view of the probable requisite deposit size just discussed.
The ridge area that would be under coastal State jurisdic tion would not be nearly as large as that under international jurisdiction, but, because of the area's proximity to shore and because the operator might not have to bear the burden of the parallel system, it seems likely that commercial inter est in ridge sulfide deposits would focus initially on areas within the EEZ. Examples of ridge areas that would fall within the EEZ include the northern part of the Juan de Fuca Ridge (Canada), the northern part of the Gorda Ridge (United States), the Guaymas Basin (Mexico), parts of the East Pacific Rise (Mexico and Chile), and part of the Gala pagos Ridge (Ecuador). Also within the EEZ would be most of the areas that are promising for the occurrence of subsea sulfide deposits associated with felsic volcanic rocks.
Although many areas in the EEZ can be identified as likely to attract commercial interest, none of the countries involved has regulations in place governing the exploration
and development of such deposits. Serious commercial ex ploration is therefore not likely to develop soon.
RED CLAYS
Deposits of red or brown clay blanket about 30 percent (100 million square kilometers) of the ocean floor (Hollister and others, 1981). They are largely of terrigenous or vol canic origin, and the regional variations in their mineralog- ical compositions reflect climate and continental input. The illite that generally forms more than 50 percent of the clay in the northern hemisphere and 20 to 50 percent in the southern hemisphere reflects continental input. Chlorite is much more abundant in polar areas than it is in tropical seas, where it weathers to kaolinite, which is much more abundant in tropical regions. Montmorillonite (smectite) is an alteration product of volcanic ash and is much more abundant in the Pacific and Indian Oceans than it is in the Atlantic, which is less active volcanically (Kennett, 1982).
The average grain size of red clay is generally less than 5 (X. Red clay is generally found away from plate boundaries in open ocean areas at depths greater than 4,000 m. Its rate of accumulation is on the order of 0.1 to 10 mm/ka. Because of this slow rate, coupled with a continuously renewed oxy gen supply, the red clays are oxidized and generally low in organic carbon (generally less than 1 percent) (Hollister and others, 1981). Because they lie below the carbonate com pensation depth, red clays contain little or no calcium car bonate, and, because of the great sorptive power of the clays, they contain many minor elements; Goldberg and Arrhenius (1958) reported the presence of 19 elements in addition to silica and alumina, including manganese, nickel, copper, cobalt, vanadium, and lead.
Mero (1962) speculated that these minor elements might be recoverable, particularly if the manganese oxide grains, with which several of them are probably associated, just as they are in the manganese nodules, could be separated from the clay; he also speculated that the clay might be used for ceramics. Neither of these possible uses is likely to become economic for many decades, if ever, but one potential use is being seriously considered by several countries namely, in situ use for the storage of high-level radioactive waste. Canada, the Commission of European Communities, France, Japan, the Netherlands, the United Kingdom, the Federal Republic of Germany, and the United States are members of a Seabed Working Group under the auspices of the Organization for Economic Cooperation and Develop ment's Nuclear Energy Agency conducting research on the feasibility of storing solidified high-level radioactive waste in canisters emplaced 25 to 50 m beneath the surface within the red clay blanket.
It is generally agreed that a safe site for the disposal of high-level radioactive wastes, whether on land or beneath
86 Mineral and Petroleum Resources of the Ocean

the sea, must have a low probability of seismic or volcanic activity, must remain unaffected by climatic change (such as a return to a glacial period), and must provide a strong barrier to the movement of fluids. In addition, the character istics being sought for a subseabed repository are a long, uninterrupted sediment depositional history, a capacity for strong sorption of nuclides by the sediments, a low perme ability, good elastic properties, no degradation of properties under thermal stress, absence of gases within the sediments, and low or no natural pore-water circulation. The site should also not be in areas characterized by bad weather, should not be near shipping lanes or strong surface currents, should not be at high latitudes (Hinga, 1982), and should not be in areas where abyssal storms are likely to erode the bottom (Hollister and others, 1984). It should also be possible to recover the canisters containing the waste.
Several regions in the Pacific and Atlantic Oceans are being evaluated as potential subseabed waste-disposal sites (fig. 48), and the properties of the red clay and its probable reactions to possible stresses are being studied (Anderson, 1979; Hollister and others, 1981; Laine and others, 1983; McConnell and Shephard, 1983). The studies are incom plete, and none of the investigators is ready to draw final
conclusions about the suitability of the red clay. Thus far, however, no unfavorable elements have Been encountered; to the contrary, many favorable elements have been identi fied (Hollister and others, 1981). For example, although the clay is extremely cohesive, it has elastic properties that will allow easy penetration by a canister through either free fall or drilling, and yet the emplacement hole can either self-seal or be easily sealed artificially. It has extremely low perme ability and the highest sorption capacity for radionuclides of any geologic medium yet tested, so it can be expected to contain the waste after the canisters have decayed. Acording to Hollister and others (1981):
Initial estimates suggest that for a 1.5 kw decay ing heat source (i) a water molecule will be trans ported by thermally induced movement approxi mately 0.3 m in 1,000 years (after which, effectively, all of the heat is gone), and (ii) a radionuclide with a distribution coefficient of 103 to 106 ml/g, a half-life of less than 500,000 years, and a burial depth of 15 m or more in the sediment will not reach the benthic boundary layer at the surface of the sediment before it has decayed es sentially to zero concentration.
IN 121 141 IN IN IN 149 in IN N N 41 21 I 21 41 N N
Figure 48. Regions of the oceans expected to provide areas that are geologically suitable for subseabed waste disposal (large boxes) (from Hinga, 1982). The smaller boxes are locations surveyed by the Sea-Bed Working Group nations. (Copyright 1980 by the American Geophysical Union.)
Subsea Mineral Resources 87

Although the ocean itself is not considered to be a barrier to the leakage of radioactive waste, it certainly can dilute and disperse to low levels any radioactive nuclides that might escape, in spite of the improbability of their doing so. Abyssal waters are also very cold (about 2 °C) and constitute a huge heat sink for any heat that might be generated by the waste (McConnell and Shephard, 1983).
The red clay environment meets well the requirements of tectonic stability and protection from the effects of climatic change such as glaciations. A 25-m piston core from the north-central Pacific, for example, shows continuous red clay sedimentation extending back 70 Ma (McConnell and Shephard, 1983). Another advantage of the red clay envi ronment is that most of it is devoid of other resources. Much of it is a biological desert because of the absence of nutri ents, and, although manganese nodules may be present on the sea floor, their metal content over large areas is too low to be of commercial interest (Anderson, 1979). Hinga (1983) believed that, even if mining operations were con ducted over a repository, they would not jeopardize the containment of radioactive wastes. Still another advantage is that the water-saturated red clay is an excellent medium for the propagation of sound, so that the lateral and vertical characters of the repository can be accurately established by seismic reflection techniques, calibrated with sediment cores (Hollister and others, 1981). The north-central Pacific also appears to be free of abyssal storms that might scour bottom sediments (Hollister and others, 1984).
Several kinds of rocks (salt, granite, basalt, shale, and tuff) are being investigated as possible repositories on land for high-level radioactive waste (Kerr, 1979), but, if levels of containment assurance are assumed to be equal and satis factory, the abyssal red clay environment has several advan tages over land sites. For one thing, some nuclear nations may not have suitable disposal sites within their borders. For another, the abyssal environment in areas containing no resources of commercial value helps to ensure that the area will be safe from human intrusion.
The U.S. Seabed Disposal Program projects 1988 as the time when it will be possible to judge the merits of seabed emplacement (Hinga, 1982). If it is considered to be desir able, engineering development would take several years. Even more time consuming might be the development of a suitable regulatory regime to authorize and manage sub- seabed disposal.
Disposal of high-level radioactive waste in the ocean is prohibited by the 1973 London Dumping Convention and the U.S. Marine Protection, Research, and Sanctuaries Act of 1972. However, the International Atomic Energy Agency recognized in 1973 that subseabed disposal is not the same as ocean dumping, so those prohibitions would not apply (McConnell and Shephard, 1983). What probably would apply, however, would be provisions of the 1982 Law of the Sea Convention, particularly article 137, which states that "No State shall claim or exercise sovereignty or sovereign
rights over any part of the Area or its resources. ..." "Area" means the seabed and subsoil beyond the limits of national jurisdiction, and resources are defined in article 133 as "all solid, liquid or gaseous mineral resources in situ in the Area or beneath the seabed." Subseabed emplacement of waste would constitute the in-place use of a resource, for it is the physical and chemical properties of the clay that are being counted on for containment.
The United States and some Western countries have not signed the Law of the Sea Convention and might claim not to be under its prohibitions. They are, however, signatories to the 1958 convention on the high seas, article 2 of which states that"... no State may validly purport to subject any part of [the high seas] to its sovereignty." Committing an area of the seabed to waste disposal for a million years is likely to be considered as a claim of sovereignty over the area. It seems likely, then, that international regulations will be required. The Law of the Sea Convention does not now provide for the recovery or use of resources other than the manganese nodules, but one of its provisions requires that rules and regulations governing mining of other minerals be developed on request.
It is conceivable that a suitable abyssal clay site might be found north of the Hawaiian Islands within the U.S. EEZ. Use of such a site would come under U.S. regulations alone, but, of course, such regulations would have to be devel oped.
RADIOLARIAN OOZE
The manganese nodules in the Clarion-Clipperton zone in the northeastern equatorial Pacific lie on a substrate of clay and radiolarian ooze. Arrhenius (1977) has suggested that an associated product of nodule mining might be radiolarian silica. Diatomite, also composed of silica and otherwise similar to radiolarite, is mined on land for a variety of uses ranging from filtration to light-weight aggregate. Its price averaged $175/t in 1982; if comparability is assumed, radi olarian silica would be a valuable product. The extremely high moisture content of the ooze, however, poses difficult transport and processing problems. Moreover, most of the ooze is admixed with red clay. For these reasons, its com mercial recovery does not seem likely.
BARITE
Barite (BaSO4) has been found as nodules, crystals, and microcrystalline aggregates on the deep-ocean floor in many parts of the world. It has already been mentioned as part of the mineral assemblage associated with hydrothermal vents, and it is possible that hydrothermal waters may be the source of barite concentrations away from the vents.
Arrhenius and Bonatti (1965) reported that widespread barite in the southeastern Pacific makes up 5 to 10 percent
88 Mineral and Petroleum Resources of the Ocean
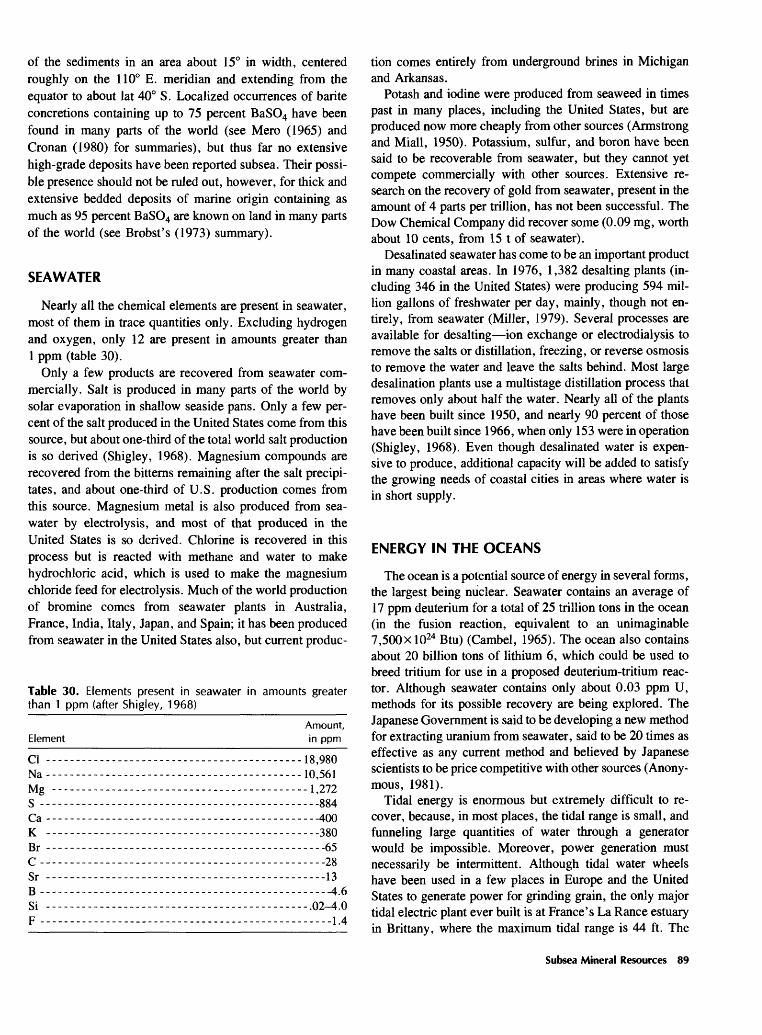
of the sediments in an area about 15° in width, centered roughly on the 110° E. meridian and extending from the equator to about lat 40° S. Localized occurrences of barite concretions containing up to 75 percent BaSO4 have been found in many parts of the world (see Mero (1965) and Cronan (1980) for summaries), but thus far no extensive high-grade deposits have been reported subsea. Their possi ble presence should not be ruled out, however, for thick and extensive bedded deposits of marine origin containing as much as 95 percent BaSO4 are known on land in many parts of the world (see Brobst's (1973) summary).
SEAWATER
Nearly all the chemical elements are present in seawater, most of them in trace quantities only. Excluding hydrogen and oxygen, only 12 are present in amounts greater than 1 ppm (table 30).
Only a few products are recovered from seawater com mercially. Salt is produced in many parts of the world by solar evaporation in shallow seaside pans. Only a few per cent of the salt produced in the United States come from this source, but about one-third of the total world salt production is so derived (Shigley, 1968). Magnesium compounds are recovered from the bitterns remaining after the salt precipi tates, and about one-third of U.S. production comes from this source. Magnesium metal is also produced from sea- water by electrolysis, and most of that produced in the United States is so derived. Chlorine is recovered in this process but is reacted with methane and water to make hydrochloric acid, which is used to make the magnesium chloride feed for electrolysis. Much of the world production of bromine comes from seawater plants in Australia, France, India, Italy, Japan, and Spain; it has been produced from seawater in the United States also, but current produc-
Table 30. Elements present in seawater in amounts greater than 1 ppm (after Shigley, 1968)________________
ElementAmount, in ppm
d -----------..-...----.--..-......--.--..---18,980Na-------------------------------------------10,561Mg -------------------------------------------1,272S --------------------------------..--------.----884Ca -------------------------------------------.--400K ----------------------------------------------380Br -----------------.-----------..-.--------------65C------------------------------------------------28Sr -----------------------------------------------13B---------------------------------.---------------4.6Si -------------------------------.------------.02-4.0F -------------------------------------------------1.4
tion comes entirely from underground brines in Michigan and Arkansas.
Potash and iodine were produced from seaweed in times past in many places, including the United States, but are produced now more cheaply from other sources (Armstrong and Miall, 1950). Potassium, sulfur, and boron have been said to be recoverable from seawater, but they cannot yet compete commercially with other sources. Extensive re search on the recovery of gold from seawater, present in the amount of 4 parts per trillion, has not been successful. The Dow Chemical Company did recover some (0.09 mg, worth about 10 cents, from 15 t of seawater).
Desalinated seawater has come to be an important product in many coastal areas. In 1976, 1,382 desalting plants (in cluding 346 in the United States) were producing 594 mil lion gallons of freshwater per day, mainly, though not en tirely, from seawater (Miller, 1979). Several processes are available for desalting ion exchange or electrodialysis to remove the salts or distillation, freezing, or reverse osmosis to remove the water and leave the salts behind. Most large desalination plants use a multistage distillation process that removes only about half the water. Nearly all of the plants have been built since 1950, and nearly 90 percent of those have been built since 1966, when only 153 were in operation (Shigley, 1968). Even though desalinated water is expen sive to produce, additional capacity will be added to satisfy the growing needs of coastal cities in areas where water is in short supply.
ENERGY IN THE OCEANS
The ocean is a potential source of energy in several forms, the largest being nuclear. Seawater contains an average of 17 ppm deuterium for a total of 25 trillion tons in the ocean (in the fusion reaction, equivalent to an unimaginable 7,500xl024 Btu) (Cambel, 1965). The ocean also contains about 20 billion tons of lithium 6, which could be used to breed tritium for use in a proposed deuterium-tritium reac tor. Although seawater contains only about 0.03 ppm U, methods for its possible recovery are being explored. The Japanese Government is said to be developing a new method for extracting uranium from seawater, said to be 20 times as effective as any current method and believed by Japanese scientists to be price competitive with other sources (Anony mous, 1981).
Tidal energy is enormous but extremely difficult to re cover, because, in most places, the tidal range is small, and funneling large quantities of water through a generator would be impossible. Moreover, power generation must necessarily be intermittent. Although tidal water wheels have been used in a few places in Europe and the United States to generate power for grinding grain, the only major tidal electric plant ever built is at France's La Ranee estuary in Brittany, where the maximum tidal range is 44 ft. The
Subsea Mineral Resources 89
installation consists of a dam near the mouth of the estuary, a powerplant equipped with turbines that can operate on both inflow and outflow and with blades that can turn the turbines into pumps to accelerate the buildup and lowering of the basin level, locks for navigation, and sluice gates to accelerate the filling and emptying of the basin. Its maxi mum output is 240 MW, but, because its power generation is not constant, its output is only about one-third of that. But is is assured production, not subject to droughts.
A mean tidal range of 5 m or more is considered neces sary for an economic operation. More than 30 sites around the world meet this requirement (Couper, 1983). Potentially suitable sites in the United States are Cook Inlet in Alaska and Pasamaquoddy and Cobscock Bays in Maine. In other countries, the most promising areas are the upper Bay of Fundy in Nova Scotia, where a plant under construction at Annapolis Royal was expected to go onstream in August 1983 (Arpin, 1982); the Gulf of Mezen in the Soviet Union; the Bay of Mont St. Michel in France; the Severn River estuary in England; the Walcott Inlet in Australia; San Jose, Argentina; and Asan Bay in South Korea, where a plant is also under construction(?). Tidal possibilities worldwide have been estimated to have a potential energy output of 635,000 GW, the equivalent of more than a billion barrels of oil a year (Ryan, 1979).
Wind-generated wave energy incident on the coastlines of the world has been estimated to be 2 to 3 x 10 12 W, a signif icant fraction of world power consumption (Newman, 1979). Because of the prevalence of westerly winds, the eastern edges of the oceans are the most favorable for wave power. The western coasts of Norway and Scotland have received the most attention, but the western coast of North America is comparably promising. Mean values of the wave power in such areas are 10 to 1,000 kW/m of coastline. Many devices are being investigated for the recovery of wave power, particularly in Japan, the United Kingdom, and Norway. Newman (1979) believed that, if the cost of conventional power generation continues to escalate, wave- energy conversion may become economic within a decade.
Among the largest reservoirs of solar energy are the ocean-circulating current system, or gyres, in both hemi spheres. Because of the Earth's spin, these currents are strongest on the western sides of the oceans. The Florida current 30 km off Miami Beach contains 50 times more energy than all the rivers in the world (Lissaman, 1979). In 1973, W.A. Mouton proposed what he called the Coriolis concept, the idea of manufacturing electric power from the installation of giant turbines in the Florida current. Feasibil ity studies have been underway since then, supported by the U.S. Department of Energy since 1978. Results have been generally encouraging. Development of a prototype unit has not yet begun but may take place within a few years. The concept calls for an array of turbines that would deliver 10,000 MW of power to Miami, about 10 percent of the energy needs of the State of Florida. Such an extraction of
energy would reduce the speed of the Gulf Stream by only about 1 to 2 percent, much less than its natural fluctuation. Many believe that the cost of producing electricity from this resource may be lower than that of producing it from fossil fuels or nuclear powerplants "at the same site, particularly in the Pacific islands (Craven, 1984).
The large temperature difference (171 °C-221 °C) be tween surface and deep-ocean water in the tropics has stim ulated interest in ocean thermal energy conversion. Warm surface water would be used to vaporize liquid ammonia at high pressure. The vapor would drive a turbine and generate electricity. Cold water pumped from the bottom would cool and liquify the vapor for reuse. Nutrients brought up in the cold water might enhance organic productivity, and fish might be a byproduct of electric power (Cohen, 1979). A conversion plant might also be used to desalinate seawater. One-third of the energy generated would have to be used for pumping up the cold water (a 100-MW plant would require a cold water throughput equal to the flow at Boulder Dam), and economic means of transporting the electricity to land have yet to be worked out. Another alternative would be to use the electricity at the site for electrolyzing water to make hydrogen. Other options are also possible (Craven, 1984).
Another large store of solar energy in the oceans is in the form of salinity; the salinity gradient between river water flowing into the sea represents an osmotic pressure differ ence of 24 atm, equivalent to a 240-m waterfall. Wick (1979) estimated that, if it were possible to convert the salinity gradient of one-half the flow of the Columbia River into electricity at only 30-percent efficiency, 2,300 MW would be produced. He estimated that the potential salinity- gradient power of global runoff is 2.6X10 12 W, about 10 percent of present global power demands. The technol ogy for the recovery of salinity-gradient power is not yet available, but Wick described several methods that he be lieved could be commercially successful.
The artificial culture of biomass (not a mineral resource but a potential form of ocean energy also of solar origin) is receiving serious consideration as a possible source of en ergy (Ryther, 1979). Seaweed is cultured now in the Far East for hydrocolloids and other products and yields as much as 20 dry t/acre/yr (deciduous and evergreen forests yield about 5 and 10 dry t/acre/yr, respectively); under care fully controlled experimental conditions, Ryther has ob tained as much as 40 dry t/acre/yr. Beginning in the mid- 1970's, a research and development program for the design and development of an ocean energy farm to culture kelp, covering 100,000 acres 100 mi off the coast of southern California, was begun under the auspices of the U.S. Energy Research and Development Administration, the National Science Foundation, the American Gas Association, and other public and private organizations. The anticipated har vest would be the equivalent of about 15 dry t/acre/yr, 8 dry t of which would be organic biomass. Energy conver sion by wet anerobic digestion would yield natural gas that
90 Mineral and Petroleum Resources of the Ocean

would be piped to shore. Considering the magnitude of the research and development that lie ahead, Ryther (1979) believed that "open-ocean energy farming of sea weeds must be regarded as a long-term prospect that cannot be realized in a time frame of less than tens of years."
Hydrothermal vents on the ocean ridges and subsea volca noes complete the catalog of ocean energy sources. The temperature of the water at these vents is about 350 °C, and, if they were on land, they would be of commercial interest. One possible way to recover energy from such sources would be to locate an ocean thermal energy conversion plant on or near a vent. Inasmuch as the cold water for the system could be obtained nearby, the lengthy cold-water pipe re quired for a surface conversion plant could be eliminated (Couper, 1983).
THE LAW OF THE SEA
The Law of the Sea has been a topic of international concern for centuries, but the UN Law of the Sea Confer ences date back to President Harry S. Truman's 1945 decla ration claiming sovereign rights over the mineral resources of the continental shelf. This pronouncement followed the completion of the first producing oil well offshore Louisiana and the recognition that the technology for offshore produc tion was in hand. Several other countries, at first interested in fish rather than in minerals, soon declared sovereignty over territorial seas up to 200 mi in width, leading to inter national concern over extensions of national jurisdiction.
The United Nations convened the First Law of the Sea Conference in 1958; representatives of 86 States were in attendance. After only 9 weeks of negotiations, the confer ence concluded the 1958 Geneva Conventions on the Terri torial Sea and Contiguous Zone, the High Seas, Fishing and Conservation of the Living Resources of the High Seas, and the Continental Shelf. The Continental Shelf Convention gave coastal States sovereign rights over nonliving re sources of the seabed and subsoil of the continental shelf, which it defined as ". . .the submarine areas adjacent to the coast but outside the area of the territorial sea, to a depth of 200 meters or, beyond that limit, to where the depth of the superjacent waters admits of the exploitation of the natural resources of the said areas."
The 1958 Territorial Sea Conference failed to reach agreement on the breadth of the Territorial Sea. A second conference focused on that topic in 1962 also failed to reach any agreement.
In setting limits to the continental shelf on the basis of exploitation, the conferees plainly did not think that the resources of the deep-ocean floor would ever be exploitable. In 1959, however, John Mero began publishing papers, followed by a book in 1965, calling attention to their poten tial value and the feasibility of their recovery and thus sparked interest in deep-ocean mining on the part of mining companies and politicians.
In 1966, U.S. Ambassador James Roosevelt spoke to the UN Economic and Social Council about the potential value of deep-sea resources; in the same year, President Lyndon B. Johnson referred to them as the "legacy of all human beings." This concept was elaborated by Ambassador Arvid Pardo of Malta in a 1967 speech to the UN General Assem bly describing resources of the areas beyond national juris diction as the common heritage of mankind and calling for the establishment of an international regime under which those resources could be developed for the benefit of all mankind. A Committee on the Seabeds and Ocean Floor Beyond the Limits of National Jurisdiction was then estab lished and held the first of many meetings in June 1968.
Although the initial focus of the committee was on the breadth of the Territorial Sea, the limits of national jurisdic tion, and seabed resources in international areas, its scope gradually expanded to include nearly all aspects of the Law of the Sea, which became the scope also of the Third UN Law of the Sea Conference, which began in 1974. If the formation of the United Nations can be thought of as the world's first giant step toward world government, this Law of the Sea Conference can be thought of as the second giant step in that direction, for it prescribed an international regime over about 50 percent of the solid Earth to deal with the allocation of mineral resources, the collection of rev enues from their production, the protection of the environ ment, and the settlement of disputes. The conference also defined the nature and extent of national jurisdiction over the rest of the ocean and prescribed some of the things that must be accomplished or addressed under national regimes.
On April 30, 1982, after 8 years of difficult negotiations, the Third UN Law of the Sea Conference voted 130 to 4 (with 17 abstentions) to adopt the new Convention. At a signing ceremony held in Jamaica on December 10, 1982, 117 nations signed the Convention, and several others have signed since. The Convention will enter into force 12 months after 60 States have signed and ratified it. A Preparatory Commission entrusted with broad responsibili ties to draw up rules and regulations governing mineral exploration and mining in the area beyond national jurisdic tion was formed early in 1983 and is meeting for several weeks at a time twice a year.
The United States is one of four countries that voted against adoption of the Convention. On July 9, 1982, Pres ident Ronald W. Reagan announced that the United States will continue to participate at a "technical expert level" but that it will not sign the Convention because of objections to provisions related to deep-sea mining. Several other indus trialized countries have already signed, including Australia, Canada, Denmark, France, Japan, the Netherlands, Nor way, Sweden, the Soviet Union, China, Belgium, and Italy. The Federal Republic of Germany and the United Kingdom joined the United States in not signing because of objections to the deep-seabed mining provisions. The following
Subsea Mineral Resources 91

sections will outline the major provisions of the Convention, on the assumption that it will enter into force with at least some industrialized countries as parties to it, and the proba ble implications for the United States and other countries that do not accede to it.
Ocean Regimes Established by the Convention
The Convention consists of some 320 articles and 8 an nexes, accompanied by 4 resolutions. The text is divided into 17 parts, 9 of which deal with the regimes to be estab lished over various parts of the oceans; the remaining 8 deal with topical matters. Two of the regimes the High Seas and the Area (that is, the deep-ocean floor in which the exploration and exploitation of nonliving resources are to be under international control) are beyond the limits of na tional jurisdiction, but the others spell out the rights and obligations of coastal States in areas where they have some jurisdiction. The main elements of the regimes are:1. A Territorial Sea 12 nmi in breadth adjacent to the
coastal State which has sovereignty over it but with the right of innocent passage for ships of other nations and a 12-nmi Contiguous Zone in which the coastal State has certain rights related to the enforcement of its laws and regulations in the Territorial Sea.
2. An Archipelagic regime in which an archipelagic State would have rights over waters within baselines joining the outermost points of its islands equivalent to the rights of a coastal State over its Territorial Sea but guaranteeing freedom of navigation and overflight in specified sealanes.
3. An International Straits regime giving all States the right of transit passage (that is, continuous and expeditious) for ships (including submerged vessels) and aircraft through and over straits used for international naviga tion but giving adjacent States the right to enforce international safety and pollution regulations.
4. An EEZ extending up to 200 nmi from the baselines from which the Territorial Sea is measured, within which the adjacent coastal State has sovereign rights over living and nonliving resources and from which consent must be obtained for the conduct of marine scientific re search but where freedom of navigation and overflight is preserved.
5. A Continental Shelf regime in which the coastal State has sovereign rights over sedentary species and nonliving resources over most of the continental margin where it extends beyond the EEZ but must make payments on production of nonliving resources starting 5 years after production has begun at each site. Coastal State con sent is required for the conduct of marine scientific research related to seabed resources, but consent may not be withheld except in specific areas in which min eral exploitation is or will soon be taking place.
6. A regime of Habitable Islands beyond the 200-nmi EEZ for which jurisdiction over the adjacent sea and its resources is determined by the same provisions that apply to other land territory.
7. A regime of Enclosed or Semi-Enclosed Seas for which no special delimitation provisions are defined but within which bordering States are supposed to cooper ate in the management, conservation, and exploitation of living resources, in the protection of the marine environment, and in the conduct of scientific research.
8. The High Seas beyond the 200-nmi EEZ, where the activities of nationals, although required to conform to internationally agreed rules, are under the control of their flag States.
9. The Area of the seabed beyond the limits of the continen tal shelf or the EEZ where the shelf extends less than 200 nmi offshore in which exploration and exploitation of nonliving resources are under the control of an Inter national Sea-Bed Authority under conditions specified in the Convention.
Other parts of the Convention deal with protection of the marine environment, scientific research, development and transfer of marine technology, and settlement of disputes.
Although coastal States would have jurisdiction over some or most activities in all of the ocean regimes except the Area, those acceding to the Convention would be required to do many things. For example, they are obligated to pro tect the marine environment; to take all measures necessary to prevent, reduce, and control pollution of the marine envi ronment from any source; to adopt laws and regulations to prevent, reduce, and control pollution from land-based sources, from seabed activities, from dumping, from ves sels, and from or through the atmosphere and to enforce such laws and regulations; and to cooperate in the conserva tion and management of the living resources of the High Seas.
Provisions Affecting Mineral Resources
The 200-nmi EEZ would put under coastal State jurisdic tion most of the minerals of the continental margins and, in some areas, those of the deep-ocean floor. For example, Isla Clarion (Mexico) might have manganese nodules within its EEZ, Mexico and Ecuador have the sulfide deposits of part of the East Pacific Rise, the United States has the deposits of part of the Gorda Ridge, and Saudi Arabia and Sudan have the Red Sea sulfide deposits. The Continental Shelf (note that the term is used in the Convention with a juridical meaning far broader than that of the geomorphic usage) regime would give coastal States jurisdiction over resources of the continental margin where it extends beyond the EEZ to a line connecting fixed points not more than 60 nmi apart. At each of these points, the thickness of sedimentary rocks is at least 1 percent of the shortest distance to the foot of the
92 Mineral and Petroleum Resources of the Ocean
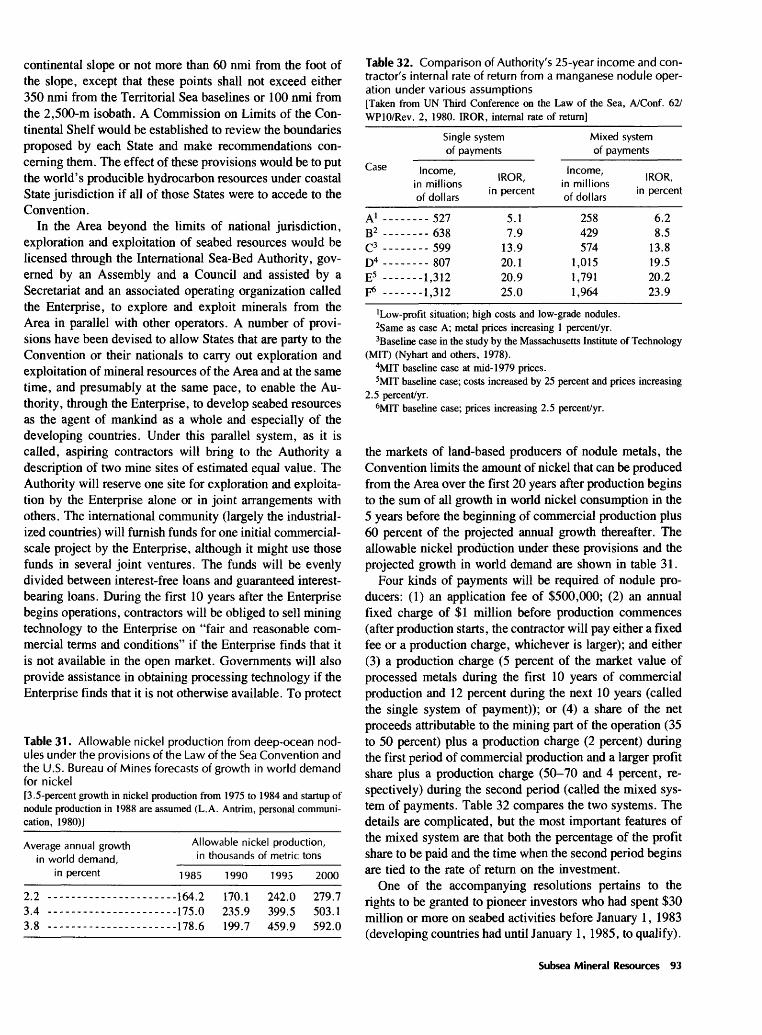
continental slope or not more than 60 nmi from the foot of the slope, except that these points shall not exceed either 350 nmi from the Territorial Sea baselines or 100 nmi from the 2,500-m isobath. A Commission on Limits of the Con tinental Shelf would be established to review the boundaries proposed by each State and make recommendations con cerning them. The effect of these provisions would be to put the world's producible hydrocarbon resources under coastal State jurisdiction if all of those States were to accede to the Convention.
In the Area beyond the limits of national jurisdiction, exploration and exploitation of seabed resources would be licensed through the International Sea-Bed Authority, gov erned by an Assembly and a Council and assisted by a Secretariat and an associated operating organization called the Enterprise, to explore and exploit minerals from the Area in parallel with other operators. A number of provi sions have been devised to allow States that are party to the Convention or their nationals to carry out exploration and exploitation of mineral resources of the Area and at the same time, and presumably at the same pace, to enable the Au thority, through the Enterprise, to develop seabed resources as the agent of mankind as a whole and especially of the developing countries. Under this parallel system, as it is called, aspiring contractors will bring to the Authority a description of two mine sites of estimated equal value. The Authority will reserve one site for exploration and exploita tion by the Enterprise alone or in joint arrangements with others. The international community (largely the industrial ized countries) will furnish funds for one initial commercial- scale project by the Enterprise, although it might use those funds in several joint ventures. The funds will be evenly divided between interest-free loans and guaranteed interest- bearing loans. During the first 10 years after the Enterprise begins operations, contractors will be obliged to sell mining technology to the Enterprise on "fair and reasonable com mercial terms and conditions" if the Enterprise finds that it is not available in the open market. Governments will also provide assistance in obtaining processing technology if the Enterprise finds that it is not otherwise available. To protect
Table 31. Allowable nickel production from deep-ocean nod ules under the provisions of the Law of the Sea Convention and the U.S. Bureau of Mines forecasts of growth in world demand for nickel[3.5-percent growth in nickel production from 1975 to 1984 and startup of nodule production in 1988 are assumed (L.A. Antrim, personal communi cation, 1980)]
Table 32. Comparison of Authority's 25-year income and con tractor's internal rate of return from a manganese nodule oper ation under various assumptions[Taken from UN Third Conference on the Law of the Sea, A/Conf. 62/ WPlO/Rev. 2, 1980. IROR, internal rate of return]
Average annual growth in world demand,
Allowable nickel production, in thousands of metric tons
in percent
22 -----3.4 ................\ 8
1985
.-.----164 2
...-..-175.01 TO £.
1990
170.1235 9199.7
1995
242.0399.5459.9
2000
279.7503.1592 0
Single system of payments
Case
A 1 ---B2 ---C3 ---
D4 ---E5 ---p6 ...
Income, in millions of dollars
..... 527<;io
-----5998O7
----1 312----1 312
IROR, in percent
5.1 7.9
13.9 20.1 20.9 25.0
Mixed system of payments
Income, in millions of dollars
258 429 574
1,015 1,791 1,964
IROR, in percent
6.2 8.5
13.8 19.5 20.2 23.9
1 Low-profit situation; high costs and low-grade nodules.2Same as case A; metal prices increasing 1 percent/yr.3Baseline case in the study by the Massachusetts Institute of Technology
(MIT) (Nyhart and others, 1978).4MIT baseline case at mid-1979 prices.5MIT baseline case; costs increased by 25 percent and prices increasing
2.5 percent/yr.6MIT baseline case; prices increasing 2.5 percent/yr.
the markets of land-based producers of nodule metals, the Convention limits the amount of nickel that can be produced from the Area over the first 20 years after production begins to the sum of all growth in world nickel consumption in the 5 years before the beginning of commercial production plus 60 percent of the projected annual growth thereafter. The allowable nickel production under these provisions and the projected growth in world demand are shown in table 31.
Four kinds of payments will be required of nodule pro ducers: (1) an application fee of $500,000; (2) an annual fixed charge of $1 million before production commences (after production starts, the contractor will pay either a fixed fee or a production charge, whichever is larger); and either (3) a production charge (5 percent of the market value of processed metals during the first 10 years of commercial production and 12 percent during the next 10 years (called the single system of payment)); or (4) a share of the net proceeds attributable to the mining part of the operation (35 to 50 percent) plus a production charge (2 percent) during the first period of commercial production and a larger profit share plus a production charge (50-70 and 4 percent, re spectively) during the second period (called the mixed sys tem of payments. Table 32 compares the two systems. The details are complicated, but the most important features of the mixed system are that both the percentage of the profit share to be paid and the time when the second period begins are tied to the rate of return on the investment.
One of the accompanying resolutions pertains to the rights to be granted to pioneer investors who had spent $30 million or more on seabed activities before January 1, 1983 (developing countries had until January 1, 1985, to qualify).
Subsea Mineral Resources 93
The number of pioneers permitted to qualify is limited to eight, plus an unspecified number from developing coun tries; six of these eight are identified as existing consortia from industrialized countries. Each consortium is limited to one site not larger than 150,000 km2 , half of which would have to be relinquished by the end of 8 years and reserved for the Enterprise. Each investor would have to be registered with the Preparatory Commission by a "certifying State" that had signed the Convention. All of the States whose companies are members of a consortium must be parties to the Convention. Each pioneer would pay a $250,000 fee to the Preparatory Commission for registration, plus $250,000 to the Authority when it applied for approval of its work plan. Work obligations would be specified by the Prepara tory Commission. Certifying States would have to ensure before applications are submitted that claims for individual areas do not overlap. Pioneer investors would be guaranteed approval of their plans for exploitation if those plans were submitted within 6 months of the Convention's entry into force. Each pioneer would also be given the right to produce up to a specified amount of minerals within the production limitation formula provided in the Convention; the Enter prise would be guaranteed production authorization for two mine sites.
During its last session, the conference guaranteed a seat on the Council to the largest consumer of seabed minerals, which was expected to be the United States.
The Convention calls for a review conference to convene 15 years after commercial production begins to consider whether the system of exploitation has achieved its aims. If, after 5 years, the conference has not agreed on the system of exploitation, it may decide to adopt amendments to the existing system by a three-fourths majority vote; these amendments would enter into force for all State parties 12 months after accession by two-thirds of the State parties. Although the detailed regulatory provisions of the Conven tion are clearly directed to the mining of manganese nod ules, the Authority would have the right to regulate the exploration and exploitation of other minerals, and, under a provision added in the last session of the conference, the Council (the Authority's executive body), acting by consen sus, would have to promulgate, on request, rules and regu lations governing such mining.
Consequences for the United States
Even if the United States does not accede to the Conven tion, it may benefit from some provisions that might come to be recognized as customary international law. President Reagan, for example, has already declared U.S. jurisdiction over a 200-nmi EEZ and has announced a policy encourag ing the development of its mineral resources. The U.S. Minerals Management Service is responding to this policy by developing a leasing program for nonenergy minerals in
the EEZ, including the cobalt-rich crusts and the sulfide deposits (Smith and others, 1985). The U.S. EEZ comprises 3.9 billion acres, the largest of any country in the world. An indication of its resource potential has been presented by Rowland and McGregor (1984).
Beyond the limits of national jurisdiction, the United States is planning to authorize mining as a high-seas free dom and to protect the interests of its nationals by reciprocal agreements with other States. Under the Deep Seabed Hard Mineral Resources Act of 1980, an American entity can obtain a license for exploration and a permit for exploitation of seabed mineral resources beyond the limits of national jurisdiction. Such a license or permit would exclude other American entities from conducting exploration or exploita tion in the same area. There is also a provision for reciprocal recognition of such rights issued by other countries that establish compatible ocean mining programs. Six other na tions (the Federal Republic of Germany, France, Japan, the United Kingdom, the Soviet Union, and Italy) have also passed deep-seabed mining legislation.
In August 1984, the United States signed an agreement with Belgium, France, the Federal Republic of Ger many, Italy, Japan, the Netherlands, and the United King dom designed to avoid conflicts over mine sites. The United States subsequently issued licenses to four consortia autho rizing them to undertake exploration in their respective areas.
Some of the States that signed the August agreement have also signed the Convention (France, Japan, Belgium, the Netherlands, and Italy). If the Convention enters into force, these States would not be permitted to recognize any future claims by U.S. nationals, for article 137 of the Convention provides that "No state or natural or juridical person shall claim or acquire or exercise rights with respect to the miner als recovered from the Area except in accordance with this part. Otherwise no such claim shall be recognized."
Ambassador Tommy Koh, the last president of the Law of the Sea Conference, has said with respect to the U.S. intention to establish a separate mining regime, "An alter nate to the Law of the Sea Convention is unacceptable because it would take resources that are a part of the com mon heritage of mankind. . . .If the United States does engage in seabed mining through an alternate regime, I will challenge it by bringing an action to the International Court of Justice" (Van Dyke, 1985). In response, Brian Hoyle of the U.S. Department of State argued ". . .that it is in the interest of both those nations that have signed the Conven tion and those that have not to allow some International Court of Justice. . . .But the fact is there would still be a cloud on title if a nation continued to grant a license outside the Convention. The ICJ's decision is not going to be dis positive as far as a banker is concerned" (Van Dyke, 1985).
Security of tenure is a cardinal requirement for the devel opment of a mine site anywhere. Until that security can be assured for deep-seabed sites beyond the limits of national
94 Mineral and Petroleum Resources of the Ocean

jurisdiction, mining is not likely to take place there, even if economic conditions become favorable.
ACKNOWLEDGMENTS
Parts of this report are updated and revised versions of previous publications prepared in collaboration with my col leagues, Livingston Chase, Frank F.H. Wang, Nancy A. Wright, Robert W. Rowland, and Roger W. Bowen. Their fine efforts are gratefully acknowledged. Much appreciated also are the helpful suggestions received from reviewers Michael J. Cruickshank, N. Terence Edgar, and Frank T. Manheim and editor Kathie R. Fraser.
REFERENCES CITED
Albaum, H.G., 1952, The role of phosphorus in the metabolism of plants, in Wolterink, L.F., ed., The biology of phosphorus: East Lansing, Michigan State College Press, p. 35-75.
Alien, G.P., Laurier, D., and Thouvenin, J., 1979, Etude sedi- mentologique du delta de la Mahakam: Compagnie Frangaise des Pe"troles Notes et Memoirs, v. 15, 156 p.
Altschuler, Z.S., 1973, The weathering of phosphate deposits Environmental and geochemical aspects, in Griffith, E.J., Beeton, A., Spencer, J.M., and Mitchell, D.T., eds., The environmental phosphorus handbook: New York, John Wiley, p. 33-96.
Ames, L.L., Jr., 1959, The genesis of carbonate apatites: Eco nomic Geology, v. 54, p. 829-840.
Anderson, C.A., 1969, Massive sulfide deposits and volcanism: Economic Geology, v. 64, p. 129-146.
Anderson, D.R., 1979, Nuclear waste disposal in subseabed geo logic formations: The seabed disposal program: Albu querque, N. Mex., Sandia Laboratories, Sand 78-2211, un limited release.
Andrews, B.V., Flipse, J.E., and Brown, F.C., 1983, The eco nomic viability of a four-metal deep ocean mining venture: Washington, D.C., National Oceanic and Atmospheric Ad ministration, 201 p.
Andrews, J.E., Pautot, G., and Friedrich, G., 1980, Results eval uation of hypotheses concerning nodule growth [abs.]: Inter national Geological Congress, 26th, Paris 1980, Resumes, v. 3, no. 26, p. 897.
Anonymous, 1980, UK contractors foremost in aggregate dredg ing: International Dredging and Port Construction, July 1980, p. 13-18.
Anonymous, 1981, Uranium extraction method developed: The AAPG Explorer, v. 3, no. 4, p. 27.
Antrim, L.N., and Sebenius, J.K., 1983, Incentives for ocean mining under the convention, in Oxman, B .H., Caron, D.D., and Buderi, C.L.O., eds., Law of the Sea U.S. policy dilemma: San Francisco, Institute for Contemporary Studies, p. 79-100.
Archer, A.A., 1973, Economics of offshore exploration and pro duction of solid minerals on the continental shelf: Ocean Management, v. 1, p. 5.
1976, Prospects for the exploitation of manganese nodules: The main technical, economic, and legal problems, in Glasby, P.G., and Katz, H.R., eds., Papers presented at International Decade of Ocean Exploration Workshop, Suva, Fiji, 1-6 September, 1975: UN Economic and Social Com mission for Asia and the Pacific Technical Bulletin 2, p. 21-38.
-1978, Resources and potential reserves of nickel and copper in manganese nodules, in Manganese nodules; dimen sions and perspectives: Boston, Reidel, p. 71-82.
Armstrong, E.F., and Miall, L.M., 1950, Raw materials from the sea: Leicester, England, Constructive Publications, Ltd., 164P-
Arpin, C., 1982, It was a big day for tidal power: MontrealGazette, June 29.
Arrhenius, G., 1975, Mineral resources of the ocean floor, in Thenew wave in the earth sciences: Cambridge, MassachusettsInstitute of Technology, 77 p.
1977, New ceramic materials from deep-sea resources: Scripps Institution of Oceanography Reference 7727, 7 p.
Arrhenius, G., and Bonatti, E., 1965, Neptunism and volcanism in the ocean: Progress in Oceanography, v. 3, p. 7-22.
Arthur D. Little, Inc., 1977, Technological and economic assess ment of manganese nodule mining and processing: Washing ton, D.C., U.S. Department of the Interior, 75 p.
Austin, C.F., 1967a, In the rock A logical approach for undersea mining of resources: Engineering and Mining Journal, v. 168, p. 82-88.
1967b, Undersea drilling and production sites for petroleum: Journal of Petroleum Technology, v. 19, p. 1309-1316. -1967c, Rock site A way into the sea: Sea Frontiers, v. 13,
p. 342-352. Ballard, R.D., Morton, J.L., and Francheteau, J., 1981, Geology
and high temperature hydrothermal circulation of ultra-fastspreading ridge: East Pacific Rise at 20°S: Eos, v. 62, p. 912.
Baram, M.S., Rice, D., and Lee, W., 1978, Marine mining of thecontinental shelf: Cambridge, Mass., Ballinger, 301 p.
Bames, S.S., 1967, Minor element composition of ferroman-ganese nodules: Science, v. 157, p. 63-65.
Bastien-Thiry, H., Lenoble, J.-P., and Rogel, P., 1977, Frenchexploration seeks to define minable nodules tonnages onPacific floor: Engineering and Mining Journal, v. 178,p. 86-87, 171.
Baturin, G.N., 1982, Phosphorite on the seafloor: New York,Elsevier, 343 p.
Baturin, G.N., and Bezrukov, P.L., 1979, Phosphorites on the seafloor and their origin: Marine Geology, v. 31, p. 317-332.
Beauchamp, R.G., and Cruickshank, M.J., 1983, Placer mineralson the U.S. continental shelves Opportunity for develop ment, in Oceans '83: Washington, D.C., Marine TechnologySociety, v. 2, p. 698-702.
Beiersdorf, H., 1972, Mining for amber on the sea-bed in Kursiu-marios: Meerestechnik, v. 3, p. 100-101. (In German, withEnglish abstract.)
Bender, M.L., 1971, Does upward diffusion supply the excessmanganese in pelagic sediments?: Journal of GeophysicalResearch, v. 76, no. 18, p. 4212-4215.
Berger, W.H., 1986, Gumbel's hypothesis regarding the origin ofmanganese nodules: Eos, v. 67, p. 169.
Subsea Mineral Resources 95

Bezrukov, P.L., 1976, Geological background of the exploitation of ferromanganese deposits: Transactions of the P.P. Shir- shov Institute of Oceanology, Academy of Sciences of the U.S.S.R., v. 109, p. 250-257.
Bezrukov, P.L., and Baturin, G.N., 1976, Lithology and age of sea-floor phosphorites, in Lithology of phosphorite-bearing deposits: Nauka, Moscow, p. 20-28.
Bignell, R.D., 1975, Timing, distribution, and origin of sub marine mineralization in the Red Sea: Transactions of the Institute of Mining and Metallurgy, v. 84, p. B1-B6.
Birch, G.F., Thomson, J., McArthur, J.M., and Burnett, W.C., 1983, Pleistocene phosphorites off the west coast of South Africa: Nature, v. 302, p. 601-603.
Bischoff, J.L., 1969, Red Sea geothermal brine deposits: Their mineralogy, chemistry, and genesis, in Degens, E.T., and Ross, D.A., eds., Hot brines and Recent heavy metal deposits in the Red Sea: New York, Springer-Verlag, p. 368-401.
Bischoff, J.L., and Manheim, F.T., 1969, Economic potential of the Red Sea heavy metal deposits, in Degens, E.T., and Ross, D.A., eds., Hot brines and Recent heavy metal deposits in the Red Sea: New York, Springer-Verlag, p. 535-541.
Bischoff, J.L., and Piper, D.Z., eds., 1979, Marine geology and oceanography of the Pacific manganese nodule province: New York, Plenum, 834 p.
Bischoff, J.L., Piper, D.Z., and Quinterero, P., 1979, Nature and origin of metalliferous sediment in DOMES site C, Pacific manganese nodule province, in Lalou, C., ed., La genese des nodules de manganese: Colloques Intemationaux du Centre National de la Recherche Scientifique, no. 289, 410 p.
Bischoff, J.L., Piper, D.Z., andLeong, K., 1981, The aluminosil- icate fraction of north Pacific manganese nodules: Geochem- ica et Cosmochimica Acta, v. 45, p. 2047-2063.
Bischoff, J.L., Rosenbauer, R.J., Aruscavage, P.J., Baedecker, P.A., and Crock, J.G., 1983, Geochemistry and economic potential of massive sulfide deposits from the eastern Pacific Ocean: U.S. Geological Survey Open-File Report 83-324, 35 p.
Bodenlos, A.J., and Nelson, C.P., 1979, Sulfur: Economic Geol ogy, v. 74, p. 459-461.
Bonatti, E., and Joensuu, O., 1966, Deep-sea iron deposit from the South Pacific: Science, v. 154, p. 643-645.
Bonatti, E., Guerstein-Honnorez, B.M., Honnorez, J., and Stern, C., 1976a, Copper-iron sulfide mineralizations from the equatorial Mid-Atlantic ridge: Economic Geology, v. 71, p. 1515-1525.
Bonatti, E., Zerbi, M., Kay, R., and Rydell, H., 1976b, Metalli ferous deposits from the Apennine ophiolites: Mesozoic equivalents of modem deposits from oceanic spreading cen ters: Geological Society of America Bulletin, v. 87, p. 83- 94.
Bostrom, K., 1970, Geochemical evidence for ocean floor spread ing in the South Atlantic: Nature, v. 227, p. 1041-1043.
Bostrom, K., and Peterson, M.N.A., 1966, Precipitates from hy- drothermal exhalations on the East Pacific Rise: Economic Geology, v. 61, p. 1258-1265.
Brewer, P.G., and Spencer, D.W., 1974, Distribution of some trace elements in the Black Sea and their flux between dis solved and particulate phases, in Degens, E.T., and Ross,
R.A., eds., The Black Sea Geology, chemistry, and biol ogy: American Association of Petroleum Geologists Mem oir 20, p. 137-143.
Broadus, J.M., and Bowen, R.E., 1983, Evaluating the economic significance of poly metallic sulfides deposits: Offshore Tech nology Conference, 15th, Houston, Tex., 1983, Proceedings, v. l,p. 419-424.
1984, Polymetallic sulfides and policy spheres: Oceanus, v. 27, no. 3, p. 26-31.
Brobst, D.A., 1973, Barite, in United States mineral resources: U.S. Geological Survey Professional Paper 820, p. 73-84.
Brongersma-Sanders, M., 1948, The importance of upwelling water to vertebrate paleontology and oil geology: Verhan- delingen der Koninklijke Nederlandse Akademie van Weten- schappen, Afdeeling Natuurkurde, 2d sec., pt. 15, no. 4, 112P-
1957, Mass mortality in the sea, in Treatise on marine ecology and paleoecology: Ecology: Geological Society of America Memoir 67, v. 1, p. 941-1010.
Buckland, W., 1829, On the discovery of coprolites, or fossil faeces, in the Lias at Lyme Regis, and in other formations: Transactions of the Geological Society of London, 2d ser., v. 3, p. 223-238.
Bullard, E.G., Maxwell, A.E., and Revelle, R.R., 1956, Heat flow through the deep ocean floor: Advances in Geophysics, v. 4, p. 153-181.
Burnett, W.C., 1974, Phosphorite deposits from the seafloor off Peru and Chile: Radiochemical and geochemical investiga tions concerning their origin: Honolulu, Hawaii Institute of Geophysics, 164 p.
Burnett, W.C., and Lee, A.I.N., 1980, The phosphate supply system in the Pacific region: Geojournal, v. 4, no. 5, p. 423- 436.
Bumett, W.C., and Veeh, H.H., 1977, Uranium-series disequi librium series studies in phosphorite nodules from the west coast of South America: Geochirnica et Cosmochimica Acta, v. 41, p. 755-764.
Burns, R.G., 1965, Formation of Co (III) in the amorphous FeOOH n^O phase of manganese nodules: Nature, v. 205, p. 999.
1976, The uptake of cobalt into ferromanganese nodules,soils, and synthetic manganese (IV) oxides: Geochirnica etCosmochimica Acta, v. 40, p. 95-102.
Burns, R.G., and Burns, V.M., 1977, Mineralogy of manganesenodules, in Glasby, G.B., ed., Marine manganese deposits:New York, Elsevier, p. 185-248.
1979, Manganese oxides, in Burns, R.G., ed., Marine minerals: Mineralogical Society of America Reviews in Min eralogy, v. 6, p. 1-46.
Burns, R.G., and Fuerstenau, D.W., 1966, Electroprobe determi nation of inter-element relationships in manganese nodules: American Mineralogist, v. 51, p. 895-902.
Buser, W., and Grutter, A., 1956, Uber die Natur de Mangan- knollen: Schweizerische Mineralogische und Petrograpische Mitteilungen, v. 36, p. 49-62.
Bushinski, G.I., 1964, On shallow water origin of phosphorite sediments, in van Straaten, L.M.J.U., ed., Deltaic and shal low marine deposits Proceedings of the Sixth International Sedimentological Congress, the Netherlands and Belgium
96 Mineral and Petroleum Resources of the Ocean

1963: Developments in sedimentology: Amsterdam, Elsevier, v. 1, p. 62-70.
Calvert, S.E., 1978, Geochemistry of oceanic ferromanganese deposits: Philosophical Transactions of the Royal Society of London, v. 290A, no. 1366, p. 43-73.
Calvert, S.E., and Price, N.B., 1970, Composition of manganese nodules and manganese carbonates from Loch Fyne, Scot land: Contributions to Mineralogy and Petrology, v. 29, no. 3, p. 215-233.
1977, Geochemical variation in ferromanganese nodules and associated sediments from the Pacific Ocean: Marine Chemistry, v. 5, p. 43-74.
Cambel, A.B., 1965, Energy R&D and national progress: Wash ington, D.C., U.S. Government Printing Office, 437 p.
Cann, J.R., Winter, C.K., and Pritchard, R.G., 1977, A hy- drothermal deposit from the floor of the Gulf of Aden: Mining Magazine, v. 41, p. 193-199.
Cannon, W.F., and Force, E.R., 1983, Potential for high-grade shallow-marine manganese deposits in North America, in Shanks, W.C., JU, Cameron volume on unconventional mineral resources: New York, Society of Mining Engineers, p. 175-189.
Cathcart, J.B., Sheldon R.P., and Gulbrandsen, R.A., 1984, Phosphate-rock resources of the United States: U.S. Geolog ical Survey Circular 888, 48 p.
Cheney, E.S., and Vredenburgh, L.D., 1968, The role of iron sulfides in the diagenetic formation of iron poor manganese nodules: Journal of Sedimentary Petrology, v. 38, p. 1363-1365.
Chukhrov, F.V., Gorshkov, A.I., Beresovskaya, V.V., and Siv- tosov, A.V., 1979, Contributions to the mineralogy of authi- genic manganese phases from marine manganese deposits: Mineralia Deposita, v. 14, p. 249-261.
Chung, J.S., 1985, Advances in manganese nodule mining tech nology: Marine Technology Society Journal, v. 19, p. 39-44.
Clark, A., Johnson, C., and Chinn, P., 1984, Assessment of cobalt-rich manganese crusts in the Hawaiian, Johnston and Palmyra Islands' exclusive economic zones: Natural Resource Forum, v. 8, p. 163-174.
Cohen, R., 1979, Energy from ocean thermal gradients: Oceanus, v. 24, no. 4, p. 12-22.
Coleman, R.G., Houston, C.C., El Borishi, I.M., Al-Hinai, K.M., and Bailey, E.H., 1979, The Semail ophiolite and associated massive sulfide deposits, Sultanate of Oman, in Evolution and mineralization of the Arabian-Nubian Shield: Institute of Applied Geology, King Abdulaziz University of the Kingdom of Saudi Arabia Bulletin 3, v. 2, p. 179-192.
Commeau, R.F., Clark, A., Johnson, C., Manheim, F.T., Arus- cavage, T.J., and Lane, C., 1984, Ferromanganese crust re sources in the Pacific and Atlantic Oceans, in the Exclusive Economic Zone papers: Rockville, Md., National Oceanic and Atmospheric Administration, Ocean Assessments Divi sion, p. 62-71.
Constantinou, G., and Govett, G.J.S., 1972, Genesis of sulphide deposits, ochre, and umber of Cyprus: Transactions of the Insti tution of Mining and Metallurgy, v. 81, sec. B, p. B34-B46.
Cook, P.J., and McElhinney, M.W., 1979, A reevaluation of the spatial and temporal distribution of sedimentary phosphate deposits in the light of plate tectonics: Economic Geology, v. 74, p. 315-330.
Corliss, J.B., Dymond, J., Gordon, L.I., Edmont, J.M., von Herzen, R.P., Ballard, R.D., Green, K., Williams, D., Bain-
bridge, A., Crane, K., and Van Andel, T.H., 1979, Sub marine thermal springs on the Galapagos Rift: Science, v. 203, p. 1073-1082.
Couper, A., 1983, The Times atlas of the oceans: New York, Van Nostrand Reinhold, 272 p.
Craig, H., 1969, Geochemistry and origin of Red Sea brines, in Degens, E.T., and Ross, D.A., eds., Hot brines and Recent heavy metal deposits in the Red Sea: New York, Springer- Verlag, p. 208-242.
Craig, J.D., Andrews, J.E., and Meylan, M.A., 1982, Ferroman ganese deposits in the Hawaiian Archipelago: Marine Geol ogy, v. 45, p. 127-157.
Crane, K., and Ballard, R.D., 1980, The Galapagos Rift at 86° W, 4, Structure and morphology of hydrothermal fields and their relationship to the volcanic and tectonic processes of the rift valley: Journal of Geophysical Research, v. 85, p. 1443-1454.
Craven, J.P., 1984, The ocean thermal resource and the Pacific: Ocean Management, v. 9, p. 101-112.
Crawford, A.M., Hollingshead, S.C., and Scott, S.D., 1984, Geotechnical engineering properties of deep-ocean poly- metallic sulfides from 21° N, East Pacific Rise: Marine Min ing, v. 4, p. 337-353.
Crerar, D.A., and Barnes, H.L., 1974, Deposition of deep-sea manganese nodules: Geochimica et Cosmochimica Acta, v. 38, p. 279-300.
Crerar, D.A., Namson, J., Chyi, M.S., Williams, N., andFergen- son, M.D., 1982, Manganiferous cherts of the Franciscan assemblage, I, General geology, ancient and modem ana logues, and implications for hydrothermal convection at oceanic spreading centers: Economic Geology, v. 77, p. 519-540.
Cressman, E.R., and Swanson, R.W., 1964, Stratigraphy and petrology of the Permian rocks of southwestern Montana: U.S. Geological Survey Professional Paper 313-C, p. C275-C569.
Cronan, D.S., 1967, The geochemistry of some manganese nod ules and associated pelagic sediments: London, University of London, unpublished Ph.D thesis.
1972, Regional geochemistry of ferromanganese nodules in the world oceans, in Horn, D.R., ed., Papers from a confer ence on ferromanganese deposits of the ocean floor: Washing ton, D.C., National Science Foundation, p. 19-30.
1976, Manganese nodules and other ferromanganese oxide deposits, in Riley, J.P., and Chester, R., eds., Chemical oceanography: London, Academic, v. 5, p. 217-263.
1977, Deep-sea nodules: Distribution and geochemistry, in Glasby, G.P., ed., Marine manganese deposits: Amsterdam, Elsevier, p. 11-44.
-1980, Underwater minerals: London, Academic, 362 p.Cronan, D.S., and Tooms, J.S., 1969, The geochemistry of man
ganese nodules and associated pelagic deposits from the Pacific and Indian Oceans: Deep-Sea Research, v. 16, p. 335-359.
Cruickshank, M.J., 1969, Mining and mineral recovery, in Covey, C.W., and others, eds., Undersea technology handbook-di rectory: Arlington, Va., Compass, p. A45-A54.
Cruickshank, M. J., and Siapno, W., 1985, Marine minerals An update and introduction: Marine Technology Society Journal, v. 19, p. 3-5.
Cruickshank, M.J., and Zippin, J.P., 1983, Development scenario for Gorda Ridge area lease operations, in Draft environmental impact statement on proposed polymetallic sulfide minerals
Subsea Mineral Resources 97

lease offering, Gorda Ridge: Washington, D.C., U.S. Miner als Management Service, p. 417-502.
Cullen, D.J., 1980, Distributions, composition, and age of sub marine phosphorites on the Chatham Rise, east of New Zealand, in Bentor, Y.K., ed., Marine phosphorites: Society of Economic Paleontologists and Mineralogists Special Publi cation 29, p. 139-148.
D'Anglejan, B.F., 1967, Origin of marine phosphorites off Baja California, Mexico: Marine Geology, v. 5, p. 15-44.
Davis, J.B., and Kirkland, D.W., 1979, Biogenic sulfur deposits: Economic Geology, v. 74, p. 462-468.
Degens, E.T., and Ross, D.A., eds., 1969, Hot brines and Recent heavy metal deposits in the Red Sea: New York, Springer- Verlag, 600 p.
de Ruiter, P.A.C., 1979, The Gabon and Congo Basin salt de posits: Economic Geology, v. 74, p. 419-431.
De Young, J.H., Jr., 1978, Mineral resources map of the Chan- dalar quadrangle, Alaska: U.S. Geological Survey Miscella neous Field Studies Map MF-878-B, 2 sheets, scale 1:250,000.
Dietz, R.S., 1961, Continent and ocean basin evolution by spread ing of the sea floor: Nature, v. 190, p. 854-857.
Dietz, R.S., Emery, K.O., and Shepard, F., 1942, Phosporite deposits on the sea floor off southern California: Geological Society of America Bulletin, v. 53, p. 815-848.
Dingle, R.V., 1974, Agulhas Bank phosphorites: A review of 100 years of investigation: Transactions of the Geological Society of South Africa, v. 77, p. 261-264.
Dunham, K.C., 1969, Practical geology and the natural environ ment of man, II, Seas and oceans: Quarterly Journal of the Geological Society of London, v. 124, p. 101-129.
Dunham, K.C., and Sheppard, J.E., 1969, Superficial and solid mineral deposits of the continental shelf around Britain: Com monwealth Mining and Metallurgical Congress, 9th, London 1969, Proceedings, v. 2, p. 3-25.
Drucker, B.S., 1983, Distribution and analysis of selected eco nomic heavy minerals species within the inner New York Bight: Offshore Technology Conference, 15th, Houston, Tex., 1983, Proceedings, v. 1, p. 427-436.
Edgar, N.T., 1973, Discoveries from deep ocean drilling: Transac tions of the Gulf Coast Association of Geological Societies, v. 23, p. 10.
Edmond, J.M., 1984, The geochemistry of Ridgecrest hot springs: Oceanus, v. 27, no. 3, p. 15-19.
Edmond, J.M., and Von Damm, K., 1983, Hot springs on the ocean floor: Scientific American, v. 248, no. 4, p. 78-93.
Elder, J.W., 1965, Physical processes in geothermal areas, in Lee, W.H.K., ed., Terrestrial heat flow: American Geophysical Union Monograph 8, p. 211-229.
El Gemmizi, M.A., 1985, Note on the occurrence of gold and cassiterite in the Egyptian beach placer deposits: Economic Geology, v. 80, p. 769-772.
Emery, K.O., and Noakes, L.C., 1968, Economic placer deposits of the continental shelf: UN Committee to Coordinate Joint Prospecting for Mineral Resources in Asian Offshore Areas Technical Bulletin 1, p. 95-111.
Emery, K.O., and Uchupi, E., 1972, Western North Atlantic Ocean: Topography, rocks, structures, water, life, and sedi ments: American Association of Petroleum Geologists Mem oir 17, 532 p.
Ewing, M., and Heezen, B., 1956, Some problems of Antarctic submarine geology: American Geophysical Union Mono graph 1, p. 75-81.
Exon, N.F., 1981, Manganese nodules in the Cook Islands region, southwest Pacific: South Pacific Marine Geological Notes, v. 2, no. 4, p. 47-65.
1982, Manganese nodules in the Kiribati region, equatorial western Pacific: South Pacific Marine Geological Notes, v. 2, no. 6, p. 77-102.
-1983, Manganese nodule deposits in the central PacificOcean and their variation with latitude: Marine Mining, v. 4, no. 1, p. 79-107.
Ferguson, J., and Lambert, I.E., 1972, Volcanic exhalations and metal enrichments at Matupi Harbor, T.P.N.G.: Economic Geology, v. 67, p. 25-37.
Field, C.W., Wetherell, D.G., and Dasch, E.J., 1981, Economic appraisal of Nazca plate metalliferous sediments: Geological Society of America Memoir 154, p. 315-320.
Flanagan, F.J., and Gottfried, D., 1980, USGS rock standards, pt. JU, Manganese nodule reference samples USGS-Nod-A-1 and USGS-Nod-P-1: U.S. Geological Survey Professional Paper 1155, 39 p.
Fleischer, M., 1980, Glossary of mineral species, 1980: Tucson, Mineralogical Record, 192 p.
Fleming, R.H., 1957, General features of the oceans, in Hedgpeth, J.W., ed., Treatise on marine ecology and paleoecology: Geological Society of America Memoir 67, v. 1, p. 87-108.
Flipse, J.E., 1982, An economic analysis of a pioneer deep ocean mining venture: Washington, D.C., National Oceanic and Atmospheric Administration, 83 p.
Force, E.R., Cannon, W.F., Koski, R.A., Passmore, K.T., and Doe, B.R., 1983, Influences of ocean anoxic events on man ganese deposition and ophiolite-hosted sulfide preservation, in Cronin, T.M., Cannon, W.F., and Poore, R.Z., eds., Paleoclimate and mineral deposits: U.S. Geological Survey Circular 822, p. 26-29.
Frakes, L.A., and Bolton, B.R., 1984, Origin of manganese giants: Sea-level change and anoxic-oxic history: Geology, v. 12, p. 83-86.
Francheteau, J., Needham, H.D., Choukraume, P., Jateau, T., Seguret, M., Ballard, R.D., Fox, P.J., Normark, W., Car- ranza, A., Cordoba, D., Guerro, J., Rangin, C., Bargault, H., Cambon, P., and Hekinian, R., 1979, Massive sulfide ore deposits discovered by submersible on the East Pacific Rise Project: Project RITA, 21°N: Nature, v. 257, p. 523-528.
Franklin, J.M., Lydon, J.W., and Sangster, D.F., 1981, Volcanic- associated massive sulfide deposits, in Skinner, B.J., ed., Economic Geology 75th anniversary volume, 1905-1980: El Paso, Tex., Economic Geology Publishing, p. 485-627.
Frazer, J.Z., 1977, Manganese nodule reserves: An updated esti mate: Marine Mining, v. 1, p. 103-123.
Frazer, J.Z., and Arrhenius, G., 1972, Worldwide distribution of ferromanganese nodules and element concentrations in se lected Pacific Ocean nodules: La Jolla, Calif., Scripps Institu tion of Oceanography, Technical Report 2, 51 p.
Frazer, J.Z., and Fisk, M.B., 1981, Geological factors related to characteristics of sea-floor manganese nodule deposits: Deep- Sea Research, v. 28A, p. 1533-1551.
Friedrich, G.H.W., Kunzendorf, H., and Pluger, W.L., 1974, Ship-borne geochemical investigations of deep-sea manganese-
98 Mineral and Petroleum Resources of the Ocean

nodule deposits in the Pacific using a radioisotope energy-dis persive x-ray system: Journal of Geochemical Exploration, v. 3, no. 4, p. 303-307.
Gibson, T.G., 1967, Stratigraphy and paleoenvironment of the phosphatic Miocene strata of North Carolina: Geological So ciety of America Bulletin, v. 78, p. 631-650.
Giresse, P., 1969, Etude des differents grains ferrugineux authigenes des sediments sous marins au large delta de Ogooue (Gabon): Science de la Terre, v. 14, p. 27-62.
Glasby, G.P., 1981, Manganese nodule studies in the southwest Pacific: South Pacific Marine Geological Notes, v. 2, no. 3, p. 37-46.
1982, Marine mining and mineral research activities inEurope: Marine Mining, v. 3, p. 379-409.
Goldberg, E.D., 1954, Marine geochemistry, pt. I, Chemicalscavengers of the sea: Journal of Geology, v. 62, p. 249-265.
1961, Chemistry in the oceans, in Sears, M., ed., Oceanography: American Association for the Advancement of Science Publication 67, p. 583-597.
-1965, Minor elements in sea water, in Riley, J.P., andSkirrow, G., eds., Chemical oceanography: London, Aca demic, v. 1, p. 163-196.
Goldberg, E.D., and Arrhenius, G., 1958, Chemistry of Pacific pelagic sediments: Geochimica et Cosmochimica Acta, v. 13, p. 153-212.
Goldschmidt, V.M., 1954, Geochemistry: London, Oxford Uni versity Press, 730 p.
Gorsline, D.S., and Milligan, D.B., 1963, Phosphatic deposits along the margin of the Pourtales Terrace, Florida: Deep-Sea Research, v. 10, p. 259-262.
Gould, H.R., and Stewart, R.H., 1953, Continental terrace sedi ments in the northeast Gulf of Mexico, in Hough, J.L., ed., Finding ancient shorelines: Society of Economic Paleontolo gists and Mineralogists Special Publication 2, p. 2-20.
Grassle, J.F., 1982, The biology of hydrothermal vents: A short summary of recent findings: Marine Technology Society Journal, v. 16, p. 33-38.
Greenslate, J.L., 1975, Manganese-biota association in northeast Pacific sediments: San Diego, University of California, un published Ph.D. thesis.
Greenslate, J.L., Frazer, J.Z., and Arrhenius, G., 1973, Origin and deposition of selected transition elements in the seabed, in Morgenstein, M., ed., Papers on the origin and distribution of manganese nodules in the Pacific and prospects for explo ration: Honolulu, Hawaii Institute of Geophysics, p. 45-70.
Grigg, R.W., 1979, Hawaii's deep sea jewels: National Geo graphic, v. 155, p. 719-732.
Grosz, A.E., and Escowitz, B.C., 1983, Economic heavy minerals of the U.S. Atlantic Continental Shelf, in Tanner, W.F., ed., Near-shore sedimentology: Symposium on Coastal Sedimen- tology, 6th, Tallahassee, Fla., 1983, Proceedings, p. 231.
Guild, P.W., 1974, Distribution of metallogenic provinces in rela tion to major earth structures, in Petroscheck, W.E., ed., Metallogenetische und Geochemische Provinzen: Vienna, Akademie der Wissenschaften, v. 1, p. 10-24.
Gulbrandsen, R.A., 1960, Petrology of the Meade Peak Phos phatic Shale Member of the Phosphoria formation at Coal Canyon, Wyoming: U.S. Geological Survey Bulletin 1111- C, p. C74-C146.
1974, Buddingtonite, ammonium feldspar, in the Phospho ria Formation, southeastern Idaho: Journal of Research of the U.S. Geological Survey, v. 2, p. 693-697.
Gulbrandsen, R.A., Robertson, C.E., andNeil, S.T., 1983, Time and the crystallization of apatite in sea water: Geochimica et Cosmochimica Acta, v. 48, p. 213-218.
Guney, M., Nawab, Z., and Marhoun, M.A. 1984, Atlantis-II Deep's metal reserves and their evaluation: Offshore Technol ogy Conference, 16th, Houston, Tex., 1984, v. 3, p. 33-39.
Hackett, J.P., Jr., and Bischoff, J.L., 1973, New data on the stratigraphy, extent, and geologic history of the Red Sea geother- mal deposits: Economic Geology, v. 68, no. 4, p. 553-564.
Halbach, P., 1984, Deep-sea metallic deposits: Ocean Manage ment, v. 9, p. 35-60.
Halbach, P., and Fellerer, R., 1980, The metallic minerals of the Pacific seafloor: Geojoumal, v. 4, no. 5, p. 407-422.
Halbach, P., and Manheim, F.T., 1984, Potential of cobalt and other metals in ferromanganese crusts on seamounts of the central Pacific basin: Marine Mining, v. 4, p. 319-336.
Halbach, P., and Ozkara, 1979, Morphological and geochemical classification of deep-sea ferromanganese nodules and its ge- netical interpretation: Colloques Intemationaux du Centre Na tional de la Recherche Scientifique, no. 289, p. 77-88.
Halbach, P., Rehm, E., and Marchig, V., 1979, Distribution of Si, Mn, Fe, Ni, Cu, Co, Zn, Pb, Mg, and Ca in grain-size fractions of sediment samples from a manganese nodule field in the central Pacific Ocean: Marine Geology, v. 29, p. 237-252.
Halbach, P., Marchig, V., and Scherhag, C., 1980, Regional variations in Mn, Ni, Cu, and Co of ferromanganese nodules from a basin in the southeast Pacific: Marine Geology, v. 38, p. 111-119.
Halbach, P., Manheim, F.T., and Otten, P., 1982, Co-rich ferro manganese deposits on the marginal seamount regions of the central Pacific basin Results of Midpac '81: Erzemetall, v. 35, p. 447-453.
Halbach, P., Puteanus, D., and Manheim, F.T., 1984, Platinum concentrations in ferromanganese seamount crusts from the central Pacific: Naturwissenschaften, v. 71, p. 977 979.
Harriss, R.C., Crocket, J.H., and Stainton, M., 1968, Palladium, iridium, and gold in deep-sea manganese nodules: Geochim ica et Cosmochimica Acta, v. 32, p. 1049-1056.
Haymon, R.M., Koski, R.A., and Sinclair, C., 1984, Fossils of hydrothermal vent worms from Cretaceous sulfide ores of the Samail Ophiolite, Oman: Science, v. 223, no. 4643, p. 1407- 1409.
Haynes, B.W., Law, S.L., and Barron, D.C., 1982, Mineralogi- cal and elemental description of Pacific manganese nodules: U.S. Bureau of Mines Information Circular 8906, 60 p.
Haynes, B.W., Barron, D.C., Kramer, G.W., Maeda, R., and Magyar, M.J., 1985, Laboratory processing and characteriza tion of waste materials from manganese nodules: U.S. Bureau of Mines Report of Investigations 8938, 16 p.
Heath, G.R., 1981, Ferromanganese nodules of the deep sea, in Skinner, B.J., ed., Economic Geology 75th anniversary volume, 1905-1980: El Paso, Tex., Economic Geology Pub lishing, p. 735-765.
Heezen, B.C., 1960, The rift in the ocean floor: Scientific Amer ican, v. 203, p. 98-110.
Hein, J.R., Manheim, F.T., Schwab, W.C., Davis, A.S., Daniel, C.L., Bluse, R.M., Morgenson, L.A., Sliney, R.E., Clague,
Subsea Mineral Resources 99

D., Tate, G.B., and Cacchione, D.A., 1985, Geological and geochemical data for seamounts and associated ferroman- ganese crusts in and near the Hawaiian, Johnston Island and Palmyra Island Exclusive Economic Zones: U.S. Geological Survey Open-File Report 85-292, 129 p.
Hein, J.R., Morgenson, L.A., Clague, D.A., and Koski, R.A., 1986, Cobalt-rich ferromanganese crusts from the exclusive economic zone of the United States and nodules from the oceanic Pacific, in Scholl, D., Grantz, A., and Vedder, J., eds., Geology and resource potential of the continental mar gin of western North America and adjacent ocean basins Beaufort Sea to Baja California: American Association of Petroleum Geologists Memoir, in press.
Hein, P., 1977, Geochime des nodules du Pacifique nord-est, etude statistique: Centre National pour 1'Exploitation des Oceans Rapports Scientifiques et Techniques, no. 35, 74 p.
Hekinian, R., 1984, Undersea volcanoes: Scientific American, v. 251, p. 46-55.
Hekinian, R., Fevrier, M., Bischoff, J.L., Picot, P., and Shanks, W., 1980, Sulfide deposits from the East Pacific Rise near 21°N, a mineralogical and geochemical study: Science, v. 207, p. 1433-1444.
Hekinian, R., Fevrier, M., Needham, H.D., Avedik, F., and Cambon, P., 1981, Sulfide deposits, East Pacific Rise near 13°N.: Eos, v. 62, p. 913.
Hekinian, R., Fevrier, M., Avedik, F., Cambon, P., Charlou, J.L., Needham, H.D., Raillard, J., Boulegue, J., Merlivat, L., Moinet, A., Manganini, S., and Lange, J., 1983, East Pacific Rise near 13°N: Geology of new hydrothermal fields: Science, v. 219, p. 1321-1324.
Hess, H.H., 1948, Major structural features of the western North Pacific: Geological Society of America Bulletin, v. 59, p. 417-446.
1962, History of ocean basins, in Engel, A.E.J., and oth ers, eds., Petrologic studies A volume in honor of A.F. Buddington: Boulder, Colo., Geological Society of America, p. 599-620.
Hewett, D.F., Fleischer, M., and Conklin, N., 1963, Deposits of the manganese oxides [suppl.]: Economic Geology, v. 58, p. 1-51.
Heye, D., and Marchig, V., 1977, Relationship between the growth rate of manganese nodules from the central Pacific and their chemical constitution: Marine Geology, v. 23, p. Ml 9- M25.
Hillman, C.T., 1983, Manganese nodule resources of three areas in the northeast Pacific Ocean, with proposed mining- beneficiation systems and costs: U.S. Bureau of Mines Infor mation Circular 8933, 60 p.
Hinga, K.R., 1982, Ocean research conducted for the subseabed disposal program: Eos, v. 63, p. 802-803.
1983, The conflicts between deep ocean mining and sub- seabed disposal of radioactive wastes: Marine Mining, v. 4, p. 109.
Holland, H.D., 1973, The oceans: A possible source of iron and iron-formations: Geology, v. 2, p. 1169-1172.
Hollister, C.D., Anderson, D.R., and Heath, G.R., 1981, Subseabed disposal of nuclear wastes: Science, v. 213, p. 1321-1326.
Hollister, C.D., Nowell, A.R.M., and Juirrars, P.A., 1984, The dynamic abyss: Scientific American, v. 250, p. 42-53.
Holser, A.F., 1976, Manganese nodule resources and mine site availability: Washington, D.C., U.S. Department of the Inte rior, Ocean Mining Administration, professional staff study, p. 1-12.
Horn, D.R., Horn, B.M., and Delach, M.N., 1972, Ferroman ganese deposits of the North Pacific: National Science Foun dation, Office of International Decade of Ocean Exploration Technical Report 1, 78 p.
Horn, D.R., Delach, M.N., and Horn, B.M., 1973, Metal content of ferromanganese deposits of the oceans: National Science Foundation, Office of International Decade of Ocean Explo ration Technical Report 3, 51 p.
Howarth, R.J., Cronan, D.S., andGlasby, G.P., 1977, Non-linear mapping of regional geochemical variability of manganese nodules in the Pacific Ocean: Transactions of the Institution of Mining and Metallurgy, v. 86, p. 134-138.
Hutchinson, G.E., 1947, The problems of ocean geochemistry: Ecological Monographs, v. 17, p. 299-307.
1950, The biogeochemistry of vertebrate excretion: Amer ican Museum of Natural History Bulletin 96, 554 p.
Ilyin, A.V., and Ratnikova, G.I., 1981, Primary, bedded, struc tureless phosphorite of the Khubsugul Basin, Mongolia: Jour nal of Sedimentology, v. 51, p. 1215-1222.
Jahnke, R.A., Emerson, S.R., Roe, K.K., and Burnett, W.C., 1983, The present day formation of apatite in Mexican conti nental margins: Geochimica et Cosmochimica Acta, v. 47, p. 259-266.
Jenkins, O.P., 1935, New techniques applicable to the study of placers: California Journal of Mines and Geology, v. 31, no. 2, p. 143-210.
Kaufman, R., 1985, Conceptual approaches to mining marine polymetallic sulfide deposits: Marine Technology Society Journal, v. 19, p. 50-56.
Kazakov, A.V., 1937, The phosphorite facies and the genesis of phosphorites: Transactions of the U.S.S.R. Science Institute of Fertilizers and Insectofungicides, no. 142, p. 95-113.
Kennett, J., 1982, Marine geology: Englewood Cliffs, N.J., Pren tice Hall, 813 p.
Kent, P., 1980, Minerals from the marine environment: New York, Halsted, 88 p.
Kerr, R.A., 1979, Geologic disposal of nuclear wastes: Salti lead is challenged: Science, v. 204, p. 603-606.
Kirn, K., Craig, H., and Horibe, Y., 1983, Methane: A "real time" tracer for submarine hydrothermal systems [abs.]: Eos, v. 64, p. 724.
Koski, R.A., Normark, W.R., Morton, J.L., and Delaney, J.R., 1982, Metal sulfide deposits on the Juan de Fuca Ridge: Oceanus, v. 25, no. 3, p. 42-48.
Koski, R.A., Clague, D.A., andOudin, E., 1984, Mineralogy and chemistry of massive sulfide deposits from the Juan de Fuca Ridge: Geological Society of America Bulletin, v. 95, p. 930-945.
Kramer, J.R., 1964a, Seawater-saturation with apatites and car bonates: Science, v. 146, p. 637-638.
1964b, Sedimentary phosphate facies [abs.]: Geological Society of America Special Paper 76, p. 95.
Krauskopf, K.B., 1957, Separation of manganese from iron in sedimentary processes: Geochimica et Cosmochimica Acta, v. 12, p. 61-84.
100 Mineral and Petroleum Resources of the Ocean

Kudrass, H.R., and Cullen, D.J., 1982, Submarine phosphorite nodules from the central Chatham Rise off New Zealand Composition, distribution and reserves (Valdivia cruise, 1978): Geologisches Jahrbuch, Reihe D, v. 51, 41 p.
Laine, E.P., Anderson, R.D., and Hollister, C.D., 1983, Site qualification plan for subseabed disposal of nuclear waste: Eos, v. 64, p. 741.
Law, S., Malahoff, A., Embley, R., and Fornari, D., 1981, Mas sive polymetallic sulfides of the Galapagos Rift: Eos, v. 62, p. 1027.
Lee, T., and Yao, C.L., 1970, Abundance of chemical elements in the earth's crust and its major tectonic units: International Geology Review, v. 12, p. 778-786.
Lisitzin, A.P., 1972, Sedimentation in the world oceans: Society of Economic Paleontologists and Mineralogists Special Publi cation 17, 218 p.
Lissaman, P.B.S., 1979, The Coriolis program: Oceanus, v. 24, no. 4, p. 23-28.
Lonsdale, P., 1979, A deep-sea hydrothermal site on a strike-slip fault: Nature, v. 281, p. 531-534.
1984, Hot vents and hydrocarbon seeps in the Sea of Cortez: Oceanus, v. 27, no. 3, p. 21-25.
Lonsdale, P., and Becker, K., 1985, Hydrothermal plumes, hot springs, and conductive heat flow in the southern trough of Guaymas Basin: Earth and Planetary Science Letters, v. 73, p. 211-225.
Lonsdale, P.P., Bischoff, J.L., Burns, V.M., Kastner, M., and Sweeney, R.E., 1980, A high temperature hydrothermal de posit on the seabed at a Gulf of California spreading center: Earth and Planetary Science Letters, v. 49, p. 8-20.
Lonsdale, P.P., Batiza, R., and Simkin, T., 1982, Metallogenesis at seamounts on the East Pacific Rise: Marine Technology Society Journal, v. 16, p. 54-61.
Luyendyk, B.P., 1977, Deep sea drilling on the Ninetyeast Ridge: Synthesis and a tectonic model, in Heirtzler, J.R., Bolli, H.M., Davies, T.A., Saunders, J.B., and Sclater, J.G., eds., Indian Ocean geology and biostratigraphy: Washington, D.C., American Geophysical Union, p. 165-187.
Lyle, M., 1981, Formation and growth of ferromanganese oxides on the Nazca plate: Geological Society of America Memoir 154, p. 269-293.
Lynn, D.C., and Bonatti, E., 1965, Mobility of manganese in diagenesis of deep-sea sediments: Marine Geology, v. 3, no. 6, p. 457-474.
Malahoff, A., 1981, Comparison between Galapagos and Gorda spreading centers: Offshore Technology Conference, 13th, Houston, Tex., 1981, Proceedings, v. 4, p. 115-120.
1982a, Massive enriched polymetallic sulfides of the ocean floor: A new commercial source of strategic minerals?: Off shore Technology Conference, 14th, Houston, Tex., 1982, Proceedings, v. 2, p. 725-730.
-1982b, A comparison of the massive submarine polymetal-
J.T., eds., Symposium on Marine Geochemistry: University of Rhode Island Narragansett Marine Laboratory Occasional Publication 3, p. 217-275. 1979, Potential hard mineral and associated resources of
lie sulfides of the Galapagos Rift with some continental de posits: Marine Technology Society Journal, v. 16, p. 39-45.
Malahoff, A., Embley, R.W., Cronan, D.S., and Skirrow, R., 1983, The geological setting and chemistry of hydrothermal sulfides and associated deposits from the Galapagos Rift at 86° W: Marine Mining, v. 4, p. 123-137.
Manheim, F.T., 1965, Manganese-iron accumulations in the shallow-marine environment, in Shink, D.R., and Corliss,
the Atlantic and Gulf continental margins: U.S. Department of Commerce National Technical Information Service PB- 81-192643, 42 p.
Manheim, F.T., Rowe, G.T., and Jipa, D., 1975, Marine phos phorite formation off Peru: Journal of Sedimentary Petrology, v. 45, p. 243-251.
Manheim, F.T., Aruscavage, P.J., Simon, P.O., and Wu, C.C., 1980a, Composition and mineralogy of western Atlantic fer romanganese nodules, with special emphasis on platinum metals [abs.]: International Geological Congress, 26th, Paris 1980, Resumes, v. 3, no. 26, p. 966.
Manheim, F.T., Pratt, R.M., andMcFarlin, P.P., 1980b, Compo sition and origin of phosphorite deposits of the Blake Plateau, in Bentor, Y.K., ed., Marine phosphorites: Society of Eco nomic Paleontologists and Mineralogists Special Publica tion 29, p. 117-137.
Manheim, F.T., Halbach, P., Woo, C.C., and Commeau, R.F., 1982, Economic significance of ferromanganese crust on seamounts of the Mid-Pacific area [abs.]: Geological Society of America Abstracts with Program, v. 14, p. 555.
Mansfield, G.R., 1940, The role of fluorine in phosphate deposi tion: American Journal of Science, v. 238, p. 863-879.
Margolis, S.V., and Burns, R.G., 1976, Pacific deep-sea man ganese nodules: Their distribution, composition and origin: Annual Review of Earth and Planetary Science, v. 4, p. 229- 263.
Mason, R.G., and Raff, A.D., 1961, A magnetic survey off the west coast of North America 32° N. to 42° N.: Geological Society of America Bulletin, v. 72, p. 1259-1265.
Maynard, J.B., 1983, Geochemistry of sedimentary ore deposits: New York, Springer-Verlag, 305 p.
McArthur, J.M., 1974, The geochemistry of phosphorite from the continental margin off Morocco: London, Imperial College, unpublished Ph.D. thesis.
McCloy, M., 1984, South Pacific Isles heal sand shortage: The AAPG Explorer, v. 5, no. 13, p. 16-18.
McConnell, A.A., andShephard, L.E., 1983, Subseabed disposal: A geosciences perspective: Geophysics: The leading edge of exploration, March, p. 36-39.
McConnell, D., 1938, A structural investigation of isomorphism of the apatite group: American Mineralogist, v. 23, p. 1-9.
McGeary, D.F.R., and Damuth, J.E., 1973, Post glacial iron-rich crusts in hemipelagic deep-sea sediment: Geological Society of America Bulletin, v. 84, p. 1201-1212.
McKelvey, V.E., 1972, Mineral resource estimates and public policy: American Scientist, v. 60, no. 1, p. 32-40.
1985, The U.S. phosphate industry: Revised prospects and potential: Marine Technology Society Journal, v. 19, p. 65- 67.
McKelvey, V.E., and Chase, L., 1966, Selecting areas favorable for subsea prospecting: Exploiting the ocean: Marine Tech nology Society Conference and Exhibit, 2d, Washington, D.C., 1966, Transactions, p. 44-57.
McKelvey, V.E., and Wang, F.H.H., 1970, World subsea mineral resources: U.S. Geological Survey Miscellaneous Geologic Investigations Map 1-632, scale 1:60,000,000.
Subsea Mineral Resources 101

McKelvey, V.E., and Wright, N.A., 1980, Metal content of man ganese nodules in part of the southeastern equatorial Pacific: U.S. Geological Survey Open-File Report 80-373, 24 p.
McKelvey, V.E., Swanson, R.W., and Sheldon, R.P., 1953, The Permian phosphorite deposits of Western United States: Inter national Geological Congress, 19th, Algiers 1952, Comptes rendus, sec. 11, pt. 11, p. 45-64.
McKelvey, V.E., Williams, J.S., Sheldon, R.P., Cressman, E.R., Cheney, T.M., and Swanson, R.S., 1959, The Phosphoria, Park City, and Shedhorn formations in the western phosphate field: U.S. Geological Survey Professional Paper 313-A, p. A1-A47.
McKelvey, V.E., Stoertz, G.E., and Vedder, V.G., 1969, Subsea physiographic provinces and their mineral potential: U.S. Ge ological Survey Circular 619, p. 1-10.
McKelvey, V.E., Wright, N.A., and Rowland, R.W., 1979, Man ganese nodule resources in the northeastern equatorial Pacific, in Bischoff, J.L., and Piper, D.Z., eds., Marine geology and oceanography of the Pacific manganese nodule province: New York, Plenum, p. 747-762.
McKelvey, V.E., Wright, N.A., and Bowen, R.W., 1983, Anal ysis of the world distribution of metal-rich subsea manganese nodules: U.S. Geological Survey Circular 886, 55 p.
Menard, H.W., 1964, Marine geology of the Pacific: New York, McGraw-Hill, 271 p.
1976, Time, chance, and the origin of manganese nodules: American Scientist, v. 64, p. 519-529.
Menard, H.W., and Frazer, J.Z., 1978, Manganese nodules on the seafloor: Inverse condation between grade and abundance: Science, v. 199, p. 969-971.
Menard, H.W., and Smith, S.M., 1966, Hypsometry of ocean basin provinces: Journal of Geophysical Research, v. 71, p. 4305-4325.
Mero, J.L., 1962, Ocean-floor manganese nodules: Economic Ge ology, v. 57, p. 747-767.
1965, The mineral resources of the sea: New York, El-sevier, 312 p.
Miller, C.T., 1979, Living in the environment: Belmont, Calif.,Wadsworth, 470 p.
Mitchell, A.H.G., and Garson, M.S., 1981, Mineral deposits andglobal tectonic settings: London, Academic, 421 p.
Moore, G.W., and Luken, M.D., 1979, Offshore sand and gravelresources of the Pacific Northwest: Oregon Geology, v. 41,p. 143-151.
Moore, J.R., and Welkie, C.J., 1976, Metal-bearing sediments ofeconomic interest, coastal Bering Sea, in Proceedings of thesymposium on sedimentation: Anchorage, Alaska GeologicalSociety, p. K1-K17.
Moores, E.M., Robinson, P.T., Malpas, J., and Xenophonotos,C., 1984, Model for the origin of the Troodos massif, Cyprus,and other mideast ophiolites: Geology, v. 12, p. 500-503.
Morley, I.W., 1981, Black sands: A history of the mineral sandmining industry in eastern Australia: St. Lucia, University ofQueensland Press, 278 p.
Mullins, H.T., and Rasch, R.F., 1985, Sea-floor phosphoritesalong the central California continental margin: EconomicGeology, v. 80, p. 696-715.
Murray, J., 1877, On the distribution of volcanic debris over thefloor of the ocean: Proceedings of the Royal Society of Edin burgh, v. 9, p. 255.
Murray, J., and Renard, A.F., 1891, Report on deep-sea deposits based on the specimens collected during the voyage of H.M.S. Challenger in the years 1872-1876, in Challenger reports: London, Government Printer.
Mustafa, Z., and Amann, H., 1980, The Red Sea prepilot mining test 1979: Offshore Technology Conference, 12th, Houston, Tex., 1980, Proceedings, v. 4, p. 197-210.
National Oceanic and Atmospheric Administration, 1981, Deep seabed mining programmatic environmental impact state ment: Washington, D.C., v. 1, 198 p.
National Research Council of the United States, 1976, Gas reserve estimation of offshore producible shut-in leases in the Gulf of Mexico: Washington, D.C., National Academy of Sciences, 170 p.
Nawab, Z.A., 1984, Mining of metalliferous sediments and possi ble tailing disposal risk in the Red Sea: International Ocean Disposal Symposium, 4th, Plymouth, England, 1983, Pro gram and abstracts, 181 p.
Newman, J.N., 1979, Power from ocean waves: Oceanus, v. 22, no. 4, p. 38-45.
Normark, W.R., 1983, Studies of sulfide mineralization on the southern Juan de Fuca Ridge; a review [abs.]: Geological Association of Canada, Mineralogical Association of Canada, and Canadian Geophysical Union Program with Abstracts, v. 8, p. A51.
Normark, W.R., Lupton, J.E., Murray, J.W., Koski, R.A., Clague, D.A., Morton, J.L., Delaney, J.R., and Johnson, H.P., 1982, Polymetallic sulfide deposits and water column tracers of active hydrothermal vents on the southern Juan de Fuca Ridge: Marine Technology Society Journal, v. 16, p. 46-53.
Normark, W.R., Morton, J.L., Koski, R.A., Clague, D.A., and Delaney, J.R., 1983, Active hydrothermal vents and sulfide deposits on the southern Juan de Fuca Ridge: Geology, v. 11, p. 158-163.
Normark, W.R., Morton, J.L., and Koski, R.A., 1984, The Juan de Fuca Ridge metallogenesis program, in Clarice, S.H., ed., U.S. Geological Survey highlights in marine research: U.S. Geological Survey Circular 938, p. 49-56.
Nyhart, J.D., Antrim, L.N., Capstaff, A., Kohler, A., and Leshaw, D. A., 1978, A cost model of deep ocean mining and associated regulatory issues: Massachusetts Institute of Tech nology Sea Grant Report MITSG 78-4, 367 p.
Oakley, K.P., 1955, Analytical methods of dating bones, in Tech niques in archeology: Advances in Science, v. 12, no. 45, p. 3-8.
O'Brien, G.W., and Veeh, H.H., 1980, Holocene phosphorite on the East Australian continental margin: Nature, v. 288, p. 690-697.
Ohmoto, H., 1978, Submarine calderas: A key to the formation of volcanogenic massive sulfide deposits: Mining Geology, v. 28, p. 219-231.
Oudin, E., 1983, Hydrothermal sulfide deposits of the East Pacific Rise (21° N.), pt. 1, Descriptive mineralogy: Marine Mining, v. 4, p. 39-72.
Padan, J.W., 1983, Offshore sand and gravel mining: Offshore Technology Conference, 15th, Houston, Tex., 1983, Pro ceedings, v. 1, p. 437-444.
Parker, R.J., 1971, The petrography and major element geochem istry of phosphorite nodule deposits on the Agulhas Bank,
102 Mineral and Petroleum Resources of the Ocean

South Africa: South African National Committee for Oceano- graphic Research, Marine Geology Programme Bulletin 2, 94 p.
Parker, R.J., and Siesser, W.G., 1972, Petrology and origin of some phosphorites from the South African continental mar gin: Journal of Sedimentary Petrology, v. 42, p. 434-440.
Pasho, D.W., 1977, Review of the development of deep seabed manganese nodules: The Northern Miner, April 14.
1985, Canada and ocean mining: Marine Technology Soci ety Journal, v. 19, p. 26-30.
Pasho, D.W., and Mclntosh, J.A., 1976, Recoverable nickel and copper from manganese nodules in the northeast equatorial Pacific Preliminary results: Canadian Institution of Mining and Metallurgy Bulletin, v. 69, p. 15-16.
Paul, R.G., 1985, Development of metalliferous oxides from cobalt-rich manganese crusts: Marine Technology Society Journal, v. 19, p. 45-49.
Pautot, G., and Melguen, M., 1979, Influence of deep water circulation and sea floor morphology on the abundance and grade of central south Pacific manganese nodules, in Bischoff, J.L., and Piper, D.Z., eds., Marine geology and oceanography of the Pacific manganese nodule province: New York, Plenum, p. 621-649.
Pautot, G., Hoffert, M., Karpoff, A., and Schoaf, A., 1978, Le Bassin de Tiki (Pacifique Sud Central): Relations entre composition-distribution des nodules et profondeur-mor- phologie du fond: Colloques Internationaux du Centre Na tional de le Recherche Scientifique, no. 289, p. 113-118.
Pepper, J.F., 1958, Potential mineral resources of the continental shelves of the western hemisphere: U.S. Geological Survey Bulletin 1067, p. 43-65.
Pequegnat, W.E., Bryant, W.R., Fredericks, A.D., McKee, T.R., and Spalding, R., 1972, Deep-sea ironstone deposits in the Gulf of Mexico: Journal of Sedimentary Petrology, v. 42, p. 700-710.
Phillips, R.L., 1979, Heavy minerals and bedrock minerals on the continental shelf off Washington, Oregon, and California: U.S. Department of Commerce National Technical Informa tion Service PB 81-192601, 56 p.
Piper, D.Z., 1972, Rare elements in manganese nodules from the Pacific Ocean, in Horn, D.R., ed., Ferromanganese deposits on the ocean floor: Washington, D.C., National Science Foundation, p. 123-130.
1974, Rare earth elements in manganese nodules and other marine phases: Geochimica et Cosmochimica Acta, v. 38, p. 1007-1022.
Piper, D.Z., and Williamson, M.E., 1977, Composition of Pacific Ocean ferromanganese nodules: Marine Geology, v. 23, p. 285-303.
Piper, D.Z., Leong, K., and Cannon, W.F., 1979, Manganese nodules and surface sediment compositions: DOMES sites A, B, and C, in Bischoff, J.L., and Piper, D.Z., eds., Marine geology and oceanography of the Pacific manganese nodule province: New York, Plenum, p. 437-473.
Piper, D.Z., Swint, T.R., McKelvey, V.E., and Sullivan, L., 1982, Distribution of manganese nodules in the Pacific Ocean: American Association of Petroleum Geologists Bul letin, v. 66, p. 980-981.
Piper, D.Z., Swint, T.R., Sullivan, L.G., and McCoy, F.W., 1985, Manganese nodules, seafloor sediments, and sedimen
tation rates of the circum-Pacific region: Tulsa, Okla., Amer ican Association of Petroleum Geologists, scale 1:17,000,000.
Pirkle, E.G., and Yoho, W.H., 1970, The heavy mineral ore body of Trail Ridge, Florida: Economic Geology, v. 65, p. 17-30.
Pirkle, E.G., Pirkle, W.A., and Yoho, W.H., 1974, The Green Cove Springs and Boulougne heavy mineral sand deposits of Florida: Economic Geology, v. 69, p. 1129-1137.
Pirkle, E.G., Pirkle, F.L., Pirkle, W.A., and Stayert, E.R., 1984, The Yulee heavy mineral sand deposits of northeastern Flor ida: Economic Geology and the Bulletin of the Society of Economic Geologists, v. 79, p. 725-737.
Porrenga, D.H., 1965, Chamosite in Recent sediments of Niger and Orinoco deltas: Geologic en Mijnbouw, v. 44, p. 400- 403.
Price, N.B., and Calvert, S.E., 1970, Compositional variation in the Pacific Ocean ferromanganese nodules and its relationship to sediment accumulation rates: Marine Geology, v. 9, p. 145-171.
Rabb, W., 1972, Physical and chemical features of Pacific deep sea manganese nodules and their implications to the genesis of nodules, in Horn, D.R., ed., Ferromanganese deposits on the ocean floor: Washington, D.C., National Science Founda tion, p. 31-49.
Raeburn, C., and Milner, H.B., 1927, Alluvial prospecting: The technical investigation of economic alluvial minerals: New York, Van Nostrand, 478 p.
Ramberg, H., 1952, The origin of metamorphic and metasomatic rocks: Chicago, University of Chicago Press, 317 p.
Rawson, M.D., and Ryan, W.B.F., 1978, Ocean floor sediment and poly metallic nodules map: Palisades, N.Y., Lamont- Doherty Geological Observatory of Columbia University.
Redfield, A.C., Ketchum, B.H., and Richards, F.A., 1963, The influence of organisms on the composition of seawater, in Hill, M.H., ed., The sea: New York, Interscience, v. 2, p. 26-77.
Riggs, S.R., 1984, Paleoceanographic model of Neogene phos phorite deposition, U.S. Atlantic continental margin: Sci ence, v. 223, p. 123-131.
Riggs, S.R., Hine, A.C., and Snyder, S.W., 1982, Phosphate exploration and resource potential on the North Carolina con tinental shelf: Offshore Technology Conference preprint OTC 4295, p. 737-742.
Riggs, S.R., Snyder, S.W.P., Hine, A.C., Synder, S.W., Elling- ton, M.D., and Mallette, P.M., 1985, Geologic framework of phosphate resources in Onslow Bay, North Carolina continen tal shelf: Economic Geology, v. 80, p. 716-738.
Robertson, C.E., 1966, Solubility implications of apatite hi sea water, in Geological Survey research: U.S. Geological Sur vey Professional Paper 550-D, p. D178-D185.
Rodriguez, R.W., 1984, Submerged sand resources of Puerto Rico, in Clarke, S.H., ed., U.S. Geological Survey high lights in marine research: U.S. Geological Survey Circular 938, p. 57-64.
Rona, P.A., 1978, Criteria for recognition of hydrothermal min eral deposits in oceanic crust: Economic Geology, v. 73, p. 135-160.
1982, Polymetallic sulfides at sea floor spreading center: A global overview: Marine Technology Society Journal, v. 16, p. 81-86.
Subsea Mineral Resources 103

1984, Hydrothermal mineralization at seafloor spreading centers: Earth Science Reviews, v. 20, p. 1-104.
Rowland, R.W., and McGregor, B.A., 1984, Recommendations from the Department of the Interior EEZ Symposium, in Exclusive Economic Zone papers: Rockville, Md., National Oceanic and Atmospheric Administration, Ocean Assess ments Division, p. 50-55.
Rowland, R.W., Gould, M.R., and McGregor, B.A., 1983, The U.S. exclusive economic zone A summary of its geology, exploration and resource potential: U.S. Geological Survey Circular 912, 29 p.
Rowland, T.J., 1985, Non-energy marine mineral resources of the world's oceans: Marine Technology Society Journal, v. 19, no. 4, p. 6-17.
Rowland, T.J., and Cruickshank, M.J., 1983, Mining for phos phorites on the United States outer continental shelf: Opportu nities for development, in Oceans '83: Washington, D.C., Marine Technology Society, v. 2, p. 703-707.
Ryan, P.R., 1979, Harnessing power from tides: The state of the art: Oceanus, v. 22, no. 4, p. 64-67.
Ryther, J.H., 1979, Fuels from marine biomass: Oceanus, v. 24, no. 4, p. 48-58.
Sainsbury, C.L., and Reed, B.L., 1973, Tin, in United States mineral resources: U.S. Geological Survey Professional Paper 820, p. 637-651.
Sawkins, F.J., 1976, Massive sulfide deposits in relation to geo- tectonics: Geological Association of Canada Special Paper Number 14, p. 221-240.
1982, Metallogenesis in relation to rifting, in Palmason, G., ed., Continental and oceanic rifts: American Geophysical Union Geodynamic Series, v. 8, p. 259-270.
Schanz, J.J., Jr., 1975, Resource terminology: An examination of concepts and terms and recommendations for improvement: Electric Power Research Institute Report 336, 116 p.
1977, United States minerals A perspective: Mining Congress Journal, v. 63, no. 2, p. 26-29.
1980, The United Nations endeavor to standardize mineralresource classification: Natural Resources Forum, v. 4, p. 307-313.
Schlee, J., 1964, New Jersey offshore gravel deposit: Pit and Quarry, v. 57, p. 80-82.
Schlee, J., and Pratt, R.M., 1970, Atlantic continental shelf and slope of the United States Gravels of the northeastern part: U.S. Geological Survey Professional Paper 529-H, p. Hl- H39.
Schminke, H.-U., Rautenschlem, M., Robinson, P.T., and Mehe- gan, J.M., 1983, Troodos extrusive series of Cyprus; a com parison with oceanic crust: Geology, v. 11, no. 7, p. 405- 409.
Schultz-Westrum, H.H., 1973, The station and cruise pattern of the R/V Valdivia in relation to the variability of manganese nodule occurrences, in Morgenstein, M., ed., Papers on the origin and distribution of manganese nodules in the Pacific and prospects for exploration: Honolulu, Hawaii Institute of Geophysics, p. 145-149.
Shanks, W.C., III, 1983, Economic and exploration significance of Red Sea metalliferous brine deposits, in Shanks, W.C., HI, ed., Cameron volume on unconventional mineral deposits: New York, Society of Mining Engineers, p. 157-171.
Shanks, W.C., and Bischoff, J.L., 1977, Ore transport and depo sition in the Red Sea geothermal system: A geochemical model: Geochimica et Cosmochimica Acta, v. 41, p. 1507- 1521.
Sheldon, R.P., 1957, Physical stratigraphy of the Phosphoria for mation in northwestern Wyoming: U.S. Geological Survey Bulletin 1042-E, p. E105-E185.
1980, Episodicity of phosphate deposition and deep ocean circulation, in Bentor, Y.K., ed., Marine phosphorites: Soci ety of Economic Paleontologists and Mineralogists Special Publication 29, p. 239-248.
Shigley, C.M., 1968, Seawater as a raw material: University of Rhode Island Graduate School of Oceanography Occasional Publication 4, p. 45-50.
Siddiquie, H.N., Rajamanickam, G.V., and Almeida, F., 1979, Offshore ilmenite placers of Ratnagiri, Konkan Coast, Maha- rashtra, India: Marine Mining, v. 2, p. 91-118.
Sillen, L.G., 1961, The physical chemistry of sea water, in Sears, M., ed., Oceanography Invited lectures presented at the International Oceanography Congress, New York, 1959: American Association for the Advancement of Science Publi cation 67,.p. 549-581.
Sillitoe, R.H., 1972, Formation of certain massive sulfide deposits at sites of sea-floor spreading: Institute of Mining and Metal lurgy Transactions, sec. B, v. 81, p. B141-B148.
1982, Extensional habitats of rhyolite-hosted massive sul fide deposits: Geology, v. 10, p. 403-407.
Simons, F.S., and Prinz, W.C., 1973, Gold, in United States mineral resources: U.S. Geological Survey Professional Paper 820, p. 263-275.
Skornyakova, N.S., 1965, Dispersed iron and manganese in Pacific Ocean sediments: International Geology Review, v. 7, p. 2161-2174.
1976, Chemical composition of ferromanganese nodules of the Pacific: Transactions of the P.P. Shirshov Institute of Oceanology, Academy of Sciences of the U.S.S.R., v. 109, p. 190-240.
-1979, Zonal regularities in occurrence, morphology, andchemistry of manganese nodules of the Pacific Ocean, in Bischoff, J.L., and Piper, D.Z., eds., Marine geology and oceanography of the Pacific manganese nodule province: New York, Plenum, p. 699-728.
Smirnov, A.D., Ironitaskaya, B.B., and Zalavina, T.P., 1961, Preliminary results of a study of the CaO-P2O5-H2O system under conditions closely approaching natural conditions labs.]: Chemical Abstracts, v. 55, p. 15094.
Smith, D.B., and Crosby, A., 1979, The regional and stratigraphic context of Zechstein 3 and 4 potash deposits in the British sector of the southern North Sea and adjoining land areas: Economic Geology, v. 74, p. 397-408.
Smith, J.B., Holt, B.R., and Paul, R.G., 1985, The Minerals Management Service's leasing program for the Outer Conti nental Shelf (EEZ), in Minerals and materials: Washington, D.C., U.S. Bureau of Mines, April/May, p. 35-43.
Smith, P.A., and Cronan, D.S., 1975, Oceanology international 1975: London, BPS Exhibitions, Ltd., p. 111-114.
Snyder, S.W., Hine, A.C., and Riggs, S.R., 1982, Miocene seis mic stratigraphy, structural framework, and sea-level cyclic- ity: North Carolina continental shelf: Southeastern Geology, v. 23, p. 247-266.
104 Mineral and Petroleum Resources of the Ocean

Solomon, M., and Walshe, J.L., 1979, The formation of massive sulfide deposits on the sea floor: Economic Geology, v. 74, p. 797-813.
Sorem, R.K., and Fewkes, R.H., 1977, Manganese nodules: New York, Plenum, 723 p.
Sorem, R.K., Fewkes, R.H., McFarland, W.D., and Reinhard, W.R., 1979, Physical aspects of the growth environment of manganese nodules in the "Horn region," in east equatorial Pacific Ocean, in La genese des nodules de manganese: Col logues Internationaux du Centre National de la Recherche Scientifique, no. 289, p. 61-76.
Stow, S.H., Drummond, S.E., and Haynes, C.D., 1976, Occur rence and distribution of heavy minerals, offshore Alabama and Mississippi: American Institute of Mining, Metallurgical, and Petroleum Engineers Transactions, v. 260, p. 75-77.
Stowasser, W.F., 1982, Phosphate rock, in Metals and minerals: U.S. Bureau of Mines Minerals Yearbook, v. 1, p. 649-666.
Straczek, J.A., Horen, A., Ross, M., and Warshaw, C.M., 1960, Studies of the manganese oxides, pt. 4, Todorokite: American Mineralogist, v. 45, p. 1174-1184.
Summerhayes, C.P., Birch, G.F., Rogers, J., and Dingle, R.V., 1973, Phosphate in sediments off S.W. Africa: Nature, v. 243, p. 509-511.
Sverdrup, H.U., Johnson, M.W., and Fleming, R.H., 1942, The oceans: New York, Prentice-Hall, 1,087 p.
Tagg, A.R., 1979, Offshore heavy metals resources of Alaska: U.S. Department of Commerce National Technical Informa tion Service PB 81-192585, 42 p.
Taliaferro, N.L., 1933, The relation of volcanism to diatomaceous and associated siliceous sediments: California University De partment of Geological Science Bulletin, v. 23, p. 1-56.
Tarns, E., 1927, Die seismichen Verhaltnisse des offenen Atlantis- chen Oceans: Zeitschrift Geophysik, v. 3, p. 361-363.
Tinsley, D., 1983, The trade in sea-dredged aggregate to the Thames, 1st ed.: Port of London, p. 29-33.
Tokunaga, S., 1967, Outline of offshore coal fields in Japan, pt. 1: Bulletin of the Geological Survey of Japan, v. 18, no. 9, p. 633-640.
Tooms, J.S., Summerhayes, C.P., andCronan, D.S., 1969, Geo chemistry of marine phosphate and manganese deposits: Oceanography and Marine Biology Annual Review, v. 7, p. 49-100.
Toth, J.R., 1980, Deposition of submarine crusts rich in man ganese and iron: Geological Society of America Bulletin, v. 91, p. 44-54.
Tweedt, P.T., 1985, Summary of ocean minerals activities and related research, 1985: Washington, D.C., National Oceanic and Atmospheric Administration, 12 p.
U.S. Bureau of Mines, 1982, Mineral commodity summaries: Washington, D.C., 183 p.
U.S. Department of the Interior Outer Continental Shelf Mining Policy Task Force, 1979, Program feasibility document OCS hard minerals leasing, executive summary: U.S. Department of Commerce National Technical Information Service PB SI- 192551, 180 p.
U.S. Geological Survey, 1982, 1982 annual report on Alaska's mineral resources: U.S. Geological Survey Circular 884, 59 p.
U.S. Geological Survey and U.S. Bureau of Mines, 1980, Princi ples of a resource/reserve classification for minerals: U.S. Geological Survey Circular 831, 5 p.
Usui, A., 1979, Minerals, metal contents, and mechanisms of formation of manganese nodules from the central Pacific basin (GH 76-1 and GH 77-1 areas), in Bischoff, J.L., and Piper, D.Z., eds., Marine geology and oceanography of the Pacific manganese nodule province: New York, Plenum, p. 651-679.
Van Dyke, J.M., ed., Consensus and confrontation: The United States and the Law of the Sea Convention: Honolulu, The Law of the Sea Institute, 576 p.
Van Houten, F.B., and Bhattacharya, D.P., 1982, Phanerozoic oolitic ironstones Geologic record and facies model: An nual Review of Earth and Planetary Sciences, v. 10, p. 441- 458.
Van Overeem, A.J.A., 1960, The geology of cassiterite placers of Billiton, Indonesia: Geologie en Mijnbouw, v. 39, p. 444- 457.
van Vloten, R., 1955, Geology of the border region between Coahuila and Zacatecas, Mexico: Leidse Geologische Med- edelingen, pt. 19, p. 111-166.
Varentsov, I.M., and Rakhmanov, V.P., 1977, Deposits of man ganese, in Smirnov, V.I., ed., Ore deposits of the U.S.S.R.: London, Pittman, p. 114-178.
1980, Manganese deposits of the U.S.S.R. (a review), in Varentsov, I.M., and Grasselly, Gy., eds., Geology and geo chemistry of manganese: Stuttgart, Schweizerbart'sche, v. 2, p. 319-392.
Vine, F.J., and Matthews, D.H., 1963, Magnetic anomalies over oceanic ridges: Nature, v. 199, p. 947-949.
Von der Borch, C.C., and Rex, R.W., 1970, Amorphous iron oxide in sediments cored during Leg 5, Deep Sea Drilling Project, in Initial reports of the Deep-Sea Drilling Project: Washington, D.C., U.S. Government Printing Office, v. 5, p. 541-544.
Walker, J.C.G., Kline, C., Schidlowski, M., Schopf, J.W., Stevenson, D.J., and Walter, M.R., 1983, Environmental evolution of the Archean-early Proterozoic earth, in Schopf, J. W., ed., Earth's earliest biosphere: Its origin and evolution: Princeton, N.J., Princeton University Press, p. 260-289.
Wang, F.H.H., and Cruickshank, M.J., 1969, Technologic gaps in exploration and exploitation of sub-sea mineral resources: First Annual Offshore Technology Conference Preprints, p. 285-298.
Wang, F.H.H., and McKelvey, V.E., 1976, Marine mineral re sources, in Govett, G.J.S., and Govett, M.H., eds., World mineral supplies: New York, Elsevier, p. 221-286.
Watson, J.A., and Angino, E.E., 1969, Iron-rich layers in sedi ments from the Gulf of Mexico: Journal of Sedimentary Petrology, v. 39, p. 1412-1419.
Wendt, J., 1974, Encrusting organisms in deep-sea manganese nodules: International Association of Sedimentologists Spe cial Publication 1, p. 437-447.
Wick, G.S., 1979, Salt power: Is Neptune's ole salt a tiger in the tank?: Oceanus, v. 24, no. 4, p. 29-37.
Wilson, J.T., 1963, Evidence from islands on the spreading of the ocean floor: Nature, v. 197, p. 536-538.
Woods, P.J.E., 1967, The geology of the Boulby Mine: Economic Geology, v. 74, p. 409-418.
Subsea Mineral Resources 105

Wynn, J.C., and Grosz, A.E., 1983, Geophysical response of titanium-bearing deposits of placer heavy minerals in north eastern Florida: International Society of Exploration Geophysicists Meeting, 53d, Las Vegas 1983, Expanded ab stracts with biographies, 1983 technical program, p. 192- 193.
Zelenov, K.K., 1964, Iron and manganese in exhalations of sub marine Bann Wisher volcano (Indonesia): Akademiya Nauk
SSSR Doklady, v. 155, p. 1317-1320. (Translated into En glish by the American Geological Institute.)
Zierenberg, R.A., and Shanks, W.C., III, 1983, Mineralogy and geochemistry of epigenetic features in metalliferous sedi ment, Atlantis n Deep, Red Sea: Economic Geology, v. 78, p. 58-72.
Zierenberg, R.A., Shanks, W.C., III, and Bischoff, J.L., 1984, Massive sulfide deposits at 21° N, East Pacific Rise: Chemical composition, stable isotopes, and phase equilibria: Geological Society of America Bulletin, v. 95, p. 922-929.
106 Mineral and Petroleum Resources of the Ocean D.S. GOVERNMENT PRINTING OFFICE: 1986 - 491-405 - 226/40015