Subscribe with Caution to ICICI Securities...
11
“Subscribe with Caution” to ICICI Securities Ltd. Positive fundamentals already factored in the demanded valuation
Transcript of Subscribe with Caution to ICICI Securities...
“Subscribe with Caution” to
ICICI Securities Ltd.
Positive fundamentals already factored in the demanded valuation

Salient features of the IPO: • ICICI Securities Ltd. (ISEC) is a leading technology based securities
firm in India that offers a wide range of financial services including brokerage, financial product distribution and investment banking; and focuses on both retail and institutional clients.
• The issue is fully OFS, the company will not receive any proceeds from it.
Key competitive strengths: • Largest equity broker in India powered by owned proprietary
technology platform • Natural beneficiary of fundamental transformation in the Indian
savings environment • Strong and growing distribution business with an “open-source”
distribution model • Superior customer experience through product and technology
innovation • Strong financial performance with significant operating efficiency Risk and concerns: • Subdued equity capital market activities • Pricing pressure and unfavorable product mix • Increased competition • Rise in operating expenses Valuation & recommendation: At the higher price band of Rs. 520 per share, ISEC’s share is valued at a P/E multiple of 34.7x (to its restated TTM EPS of Rs. 15 per share) as against the peer average of 27.8x. Below are few key observations of the issue: (For detailed valuation, refer to page 7 & 8 of the report) • ISEC, being one of the pioneers in the e-brokerage business in India,
along with its strong brand name, large registered customer base, wide range of products across asset classes, complimentary advisory services, positions it to be the natural beneficiary of the growth in digitization and resultant transformational changes in the Indian savings markets.
• Since FY14, the company is the largest broker in India in terms of brokerage revenue and active clients on the NSE. As of 31st Dec. 2017, it had 3.9mn accounts operational on the “ICICIdirect” electronic platform, which is a scalable plug-and-play architecture. Since inception and till 31st Dec. 2017, the company has acquired a total of 4.6mn customers through this platform. For the nine month ended Dec. 2017, the company had an average daily turnover (ADTO) market share of 9.1% as compared to 4.4% in FY13.
• Retail brokerage accounted for 90.5% of the brokerage business in FY17. Additionally, 40% of the brokerage revenue during the period was derived from the customers that have maintained accounts with ISEC for more than ten years. In FY17, it was the second largest non-bank distributor of mutual funds in India.
21st Mar. 2018
1
Recommendation Subscribe with Caution
Price Band (Rs.) Rs. 519 - 520 per Share
Face Value (Rs.) Rs. 5
Shares for Fresh Issue (mn)
Nil
Shares for OFS (mn) 77.25mn Shares
Fresh Issue Size (Rs. mn) N/A
OFS Issue Size (Rs. mn) Rs. 40,092.5 - 40,169.7mn
Total Issue Size (Rs. mn) Rs. 40,092.5 - 40,169.7mn
Bidding Date 22nd Mar. – 26th Mar. 2018
MCAP at Higher Price Band
Rs. 167,514mn
Enterprise Value at Higher Price Band
Rs. 160,818mn
Book Running Lead Manager
DSP Merrill Lynch Ltd., Citigroup Global Markets India Pvt. Ltd., CLSA India Pvt. Ltd., Edelweiss Financial Services Ltd., IIFL Holdings Ltd. and SBI Capital Markets Ltd.
Registrar Karvy Computershare Pvt. Ltd.
Sector/Industry Other Financial Services
Promoters ICICI Bank Ltd.
Pre and post - issue shareholding pattern
Pre – Issue Post - Issue
Promoter and Promoter Group
100.00% 76.02%
Public 0.00% 23.98%
Total 100.00% 100.00%
Retail Application Money at Higher Cut-Off Price per Lot
Number of Shares per Lot 28
Application Money Rs. 14,560 per Lot
Reserved for ICICI Bank Ltd. Shareholders (mn Shares)
3.86mn Shares
Analyst
Rajnath Yadav
Research Analyst (022 - 6707 9999; Ext: 912)
Email: [email protected]
• On financial performance front, ISEC has shown strong growth with significant operating efficiency. It reported a 18.8% CAGR rise in the total operating revenue to Rs. 14,042.3mn in FY17. This was on the back of 14.8% and 20.9% CAGR increase in the brokerage income and services income. Due to operational efficiency, total operating expenses increased at a lower rate as compared to top-line. Operating cost to its total revenue declined from 78.3% in FY13 to 59.7% in FY17. As a result, EBITDA increased by 38.6% CAGR with margin expansion by over 18ppts over FY13-17 to 40.3% in FY17. Reported PAT increased by 47.4% CAGR during the period. PAT margin expanded by around 14ppts to 24.1% in FY17. Average RoIC and RoE of the period stood at 94.9% and 55.1%, respectively, over FY13-17. ISEC has consistently paid dividend during the period with average dividend payout of 53.9%.
• For the nine month ended Dec. 2017, the company reported a 31.5% Y-o-Y rise in top-line to Rs. 13,446.9mn with an EBITDA and PAT margin of 49% and 29.7%, respectively. For FY18E, we are anticipating a top-line of Rs. 16,949.6mn (an increase of 20.7% over FY17) and EPS of 14.4 per share (an increase of 36.8% over FY17). EBITDA and PAT margin are anticipated at 46.1% and 27.3%, respectively. In FY19, it is expected to report a top-line of Rs. 20,129.9mn and EPS of 18.4 per share.
• On valuation front, at higher price band, ISEC is demanding a P/E valuation of 34.7x (to its restated TTM EPS of Rs. 15), which is at a premium to the peer average. Moreover, with respect to FY18E and FY19E earnings too, it is asking a premium valuation. We are of the opinion that all the positives are already being factored in and there is a limited upside potential post listing. However, considering the growing equity cult in India, its positioning in the equity market, scalable & asset light business model, strong financial & return ratios and healthy dividend payout, we assign a “Subscribe with Caution” rating to the issue.
2
Offer Opens on 22-Mar-2018
Offer Closes on 26-Mar-2018
Finalization of Basis of Allotment 02-Apr-2018
Unblocking of ASBA Account 03-Apr-2018
Credit to Demat Accounts 04-Apr-2018
Listing on Stock Exchanges 05-Apr-2018
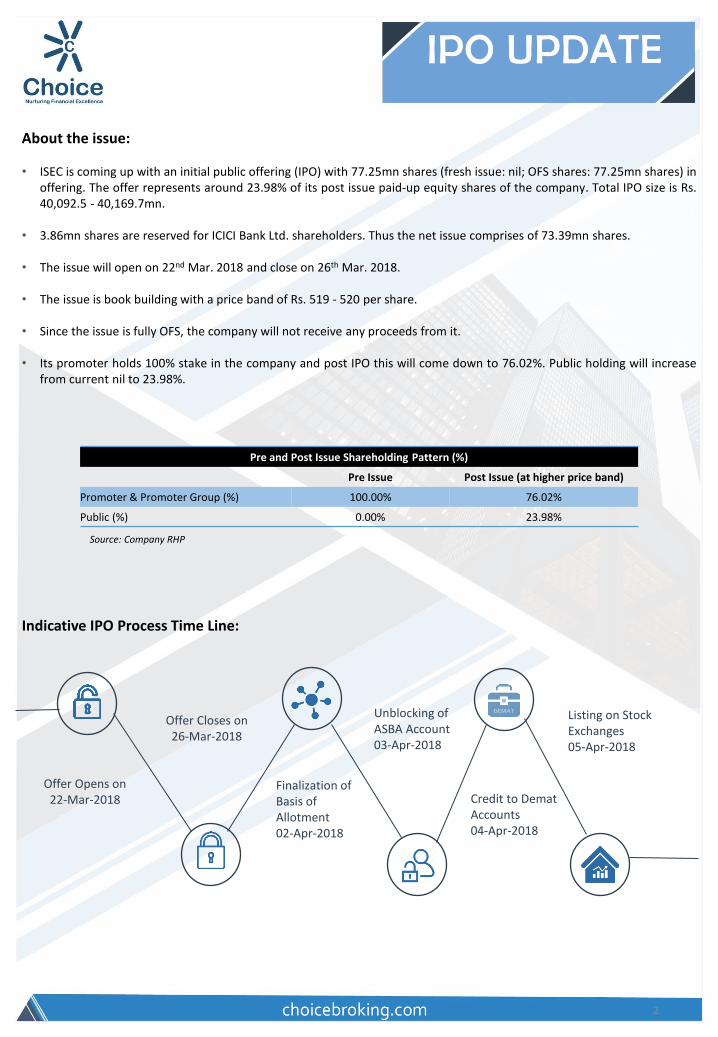
About the issue: • ISEC is coming up with an initial public offering (IPO) with 77.25mn shares (fresh issue: nil; OFS shares: 77.25mn shares) in
offering. The offer represents around 23.98% of its post issue paid-up equity shares of the company. Total IPO size is Rs. 40,092.5 - 40,169.7mn.
• 3.86mn shares are reserved for ICICI Bank Ltd. shareholders. Thus the net issue comprises of 73.39mn shares.
• The issue will open on 22nd Mar. 2018 and close on 26th Mar. 2018.
• The issue is book building with a price band of Rs. 519 - 520 per share.
• Since the issue is fully OFS, the company will not receive any proceeds from it. • Its promoter holds 100% stake in the company and post IPO this will come down to 76.02%. Public holding will increase
from current nil to 23.98%.
Pre and Post Issue Shareholding Pattern (%)
Pre Issue Post Issue (at higher price band)
Promoter & Promoter Group (%) 100.00% 76.02%
Public (%) 0.00% 23.98%
Source: Company RHP
Indicative IPO Process Time Line:
3
Company Introduction: ISEC is a leading technology based securities firm in India that offers a wide range of financial services including brokerage, financial product distribution and investment banking and focuses on both retail and institutional clients. It has been the largest equity broker in India since FY14 by brokerage revenue and active customers in equities on the National Stock Exchange (Source: Company RHP), powered by its significant retail brokerage business, which accounted for 90.5% of the revenue from the brokerage business (excluding income earned on own funds used in the brokerage business) in FY17. As of 31st Dec. 2017, ICICIdirect, its award winning proprietary electronic brokerage platform had approximately 3.9mn operational accounts of which 0.8mn had traded on NSE in the preceding 12 months (Source: Company RHP). Since inception and till 31st Dec. 2017, the company has acquired a total of 4.6mn customers through this platform. ISEC’s retail brokerage and financial product distribution businesses empower its customers to access the Indian financial capital markets through the ICICIdirect platform and provide them with a seamless settlement process through a 3-in-1 account, which links the company’s electronic brokerage platform with customer’s savings bank and dematerialized accounts held with ICICI Bank Ltd. In addition to allowing its retail customers to carry out a variety of transactions, ISEC’s electronic brokerage platform provides an integrated interface that allows the customers to track various portfolio parameters, including the performance of their investments. ISEC offers its retail customers a wide range of products and services in equities, derivatives and research, and it also distributes various third-party products including mutual funds, insurance products, fixed deposits, loans, tax services and pension products. The retail brokerage and distribution businesses are supported by its nationwide network, consisting of over 200 of its own branches, over 2,600 branches of ICICI Bank Ltd. through which the electronic brokerage platform is marketed and over 4,600 sub-brokers, authorized persons, independent financial associates and independent associates. The company also offers its customers a wide variety of advisory services, including financial planning, equity portfolio advisory, access to alternate investments, retirement planning and estate planning. ISEC provides domestic and foreign institutional investors with brokerage services, corporate access and equity research. It is empanelled with a large cross-section of institutional clients, including foreign institutional investors, who it services through dedicated sales teams. The company believes that it has established a significant presence amongst domestic institutional investors and are increasing the focus on attracting foreign institutional investors. The investment banking business offers equity capital markets services and other financial advisory services to corporate clients, the government and financial sponsors. The company’s equity capital markets services include management of public equity offerings, share buybacks, tender offers and equity private placements. From 01st Apr. 2012 to 30th Sept. 2017, it was the leading investment bank in the Indian equity capital markets by number of primary issuances managed (Source: Company RHP). ISEC also provides its clients with financial advisory services in relation to domestic and cross-border mergers and acquisitions, private placements, and restructuring. The company is headquartered in Mumbai, and operate offices in India, the United States, Singapore and Oman. It is a part of the ICICI Group, one of the largest financial conglomerates in the country and promoted by ICICI Bank Ltd., India’s largest private sector bank in terms of consolidated total assets with an asset base of Rs. 10.5tn as at 31st Dec. 2017. The ICICI Group includes the largest Indian private-sector life insurance company by retail weighted received premiums, the largest Indian private-sector general insurance company by gross written premium, each in FY17, the largest Indian asset management company by average assets under management in India for the quarter ended 31st Dec. 2017 (Source: Company RHP), and other companies involved in home finance, private equity, primary dealership and other businesses. Competition: ISEC competes directly or indirectly with various companies in the financial services industry, including Indian and foreign brokers, discount brokers, investment banks, public and private sector commercial banks, insurance companies, non-banking financial institutions and asset managers. It also compete with its promoter, ICICI Bank Ltd., in connection with certain products and services that it offer.
3
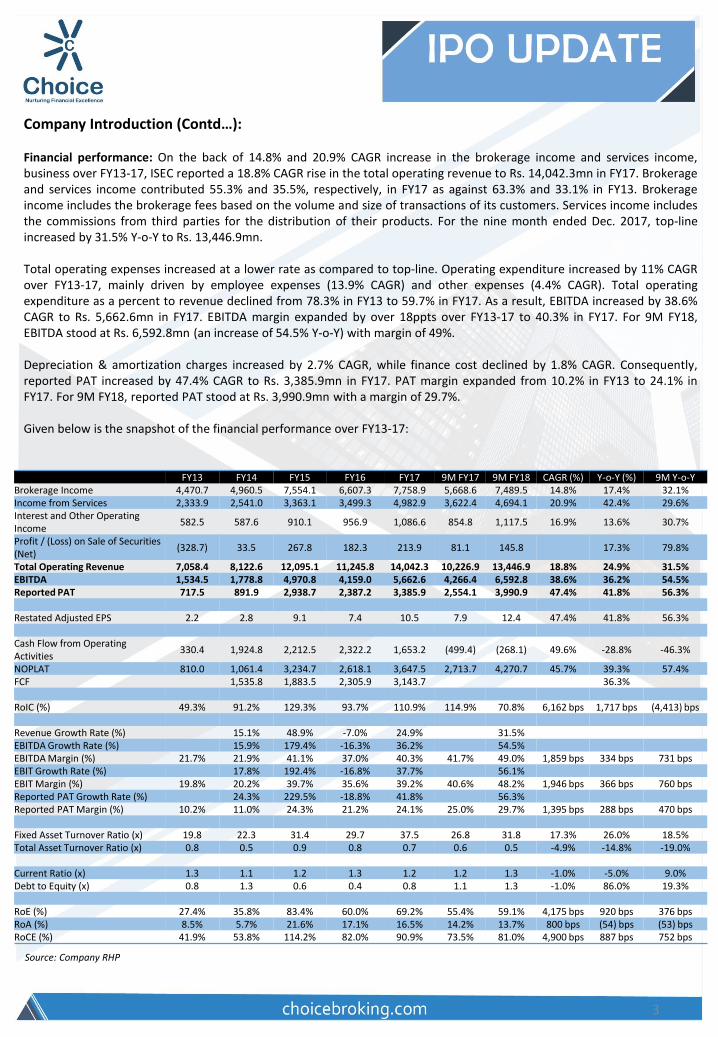
Company Introduction (Contd…): Financial performance: On the back of 14.8% and 20.9% CAGR increase in the brokerage income and services income, business over FY13-17, ISEC reported a 18.8% CAGR rise in the total operating revenue to Rs. 14,042.3mn in FY17. Brokerage and services income contributed 55.3% and 35.5%, respectively, in FY17 as against 63.3% and 33.1% in FY13. Brokerage income includes the brokerage fees based on the volume and size of transactions of its customers. Services income includes the commissions from third parties for the distribution of their products. For the nine month ended Dec. 2017, top-line increased by 31.5% Y-o-Y to Rs. 13,446.9mn. Total operating expenses increased at a lower rate as compared to top-line. Operating expenditure increased by 11% CAGR over FY13-17, mainly driven by employee expenses (13.9% CAGR) and other expenses (4.4% CAGR). Total operating expenditure as a percent to revenue declined from 78.3% in FY13 to 59.7% in FY17. As a result, EBITDA increased by 38.6% CAGR to Rs. 5,662.6mn in FY17. EBITDA margin expanded by over 18ppts over FY13-17 to 40.3% in FY17. For 9M FY18, EBITDA stood at Rs. 6,592.8mn (an increase of 54.5% Y-o-Y) with margin of 49%. Depreciation & amortization charges increased by 2.7% CAGR, while finance cost declined by 1.8% CAGR. Consequently, reported PAT increased by 47.4% CAGR to Rs. 3,385.9mn in FY17. PAT margin expanded from 10.2% in FY13 to 24.1% in FY17. For 9M FY18, reported PAT stood at Rs. 3,990.9mn with a margin of 29.7%. Given below is the snapshot of the financial performance over FY13-17:
Source: Company RHP
FY13 FY14 FY15 FY16 FY17 9M FY17 9M FY18 CAGR (%) Y-o-Y (%) 9M Y-o-Y Brokerage Income 4,470.7 4,960.5 7,554.1 6,607.3 7,758.9 5,668.6 7,489.5 14.8% 17.4% 32.1% Income from Services 2,333.9 2,541.0 3,363.1 3,499.3 4,982.9 3,622.4 4,694.1 20.9% 42.4% 29.6% Interest and Other Operating Income
582.5 587.6 910.1 956.9 1,086.6 854.8 1,117.5 16.9% 13.6% 30.7%
Profit / (Loss) on Sale of Securities (Net)
(328.7) 33.5 267.8 182.3 213.9 81.1 145.8 17.3% 79.8%
Total Operating Revenue 7,058.4 8,122.6 12,095.1 11,245.8 14,042.3 10,226.9 13,446.9 18.8% 24.9% 31.5% EBITDA 1,534.5 1,778.8 4,970.8 4,159.0 5,662.6 4,266.4 6,592.8 38.6% 36.2% 54.5% Reported PAT 717.5 891.9 2,938.7 2,387.2 3,385.9 2,554.1 3,990.9 47.4% 41.8% 56.3%
Restated Adjusted EPS 2.2 2.8 9.1 7.4 10.5 7.9 12.4 47.4% 41.8% 56.3%
Cash Flow from Operating Activities
330.4 1,924.8 2,212.5 2,322.2 1,653.2 (499.4) (268.1) 49.6% -28.8% -46.3%
NOPLAT 810.0 1,061.4 3,234.7 2,618.1 3,647.5 2,713.7 4,270.7 45.7% 39.3% 57.4% FCF 1,535.8 1,883.5 2,305.9 3,143.7 36.3%
RoIC (%) 49.3% 91.2% 129.3% 93.7% 110.9% 114.9% 70.8% 6,162 bps 1,717 bps (4,413) bps
Revenue Growth Rate (%) 15.1% 48.9% -7.0% 24.9% 31.5% EBITDA Growth Rate (%) 15.9% 179.4% -16.3% 36.2% 54.5% EBITDA Margin (%) 21.7% 21.9% 41.1% 37.0% 40.3% 41.7% 49.0% 1,859 bps 334 bps 731 bps EBIT Growth Rate (%) 17.8% 192.4% -16.8% 37.7% 56.1% EBIT Margin (%) 19.8% 20.2% 39.7% 35.6% 39.2% 40.6% 48.2% 1,946 bps 366 bps 760 bps Reported PAT Growth Rate (%) 24.3% 229.5% -18.8% 41.8% 56.3% Reported PAT Margin (%) 10.2% 11.0% 24.3% 21.2% 24.1% 25.0% 29.7% 1,395 bps 288 bps 470 bps
Fixed Asset Turnover Ratio (x) 19.8 22.3 31.4 29.7 37.5 26.8 31.8 17.3% 26.0% 18.5% Total Asset Turnover Ratio (x) 0.8 0.5 0.9 0.8 0.7 0.6 0.5 -4.9% -14.8% -19.0%
Current Ratio (x) 1.3 1.1 1.2 1.3 1.2 1.2 1.3 -1.0% -5.0% 9.0% Debt to Equity (x) 0.8 1.3 0.6 0.4 0.8 1.1 1.3 -1.0% 86.0% 19.3%
RoE (%) 27.4% 35.8% 83.4% 60.0% 69.2% 55.4% 59.1% 4,175 bps 920 bps 376 bps RoA (%) 8.5% 5.7% 21.6% 17.1% 16.5% 14.2% 13.7% 800 bps (54) bps (53) bps RoCE (%) 41.9% 53.8% 114.2% 82.0% 90.9% 73.5% 81.0% 4,900 bps 887 bps 752 bps
© CHOICE INSTITUTIONAL RESEARCH
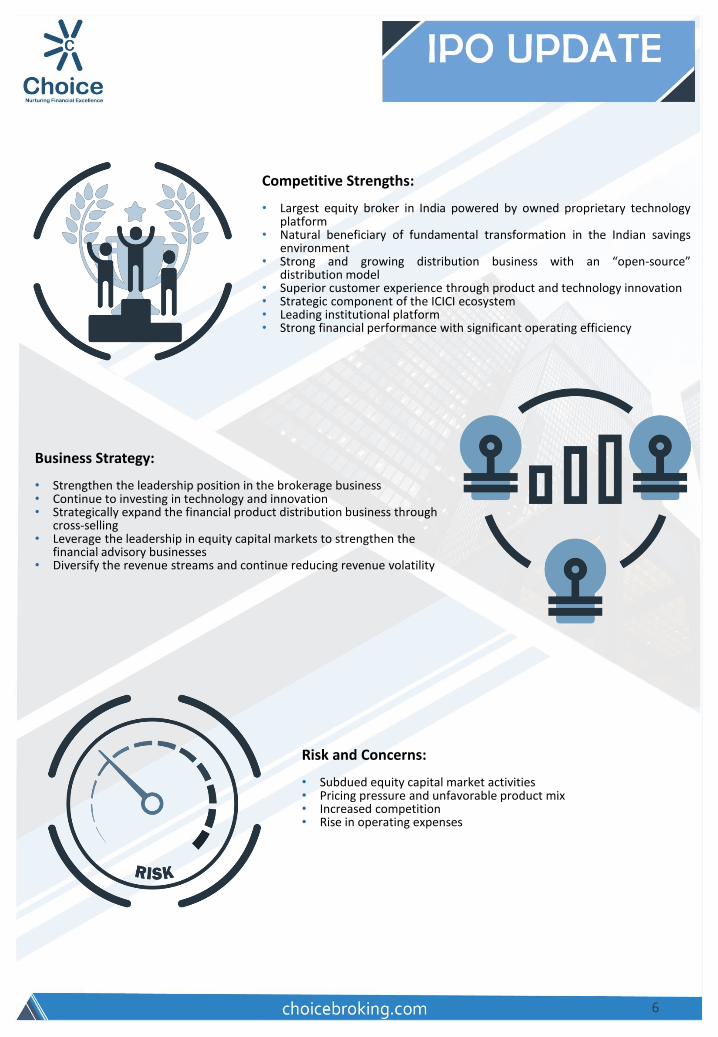
Competitive Strengths: • Largest equity broker in India powered by owned proprietary technology
platform • Natural beneficiary of fundamental transformation in the Indian savings
environment • Strong and growing distribution business with an “open-source”
distribution model • Superior customer experience through product and technology innovation • Strategic component of the ICICI ecosystem • Leading institutional platform • Strong financial performance with significant operating efficiency
6
Business Strategy:
• Strengthen the leadership position in the brokerage business • Continue to investing in technology and innovation • Strategically expand the financial product distribution business through
cross-selling • Leverage the leadership in equity capital markets to strengthen the
financial advisory businesses • Diversify the revenue streams and continue reducing revenue volatility
Risk and Concerns:
• Subdued equity capital market activities • Pricing pressure and unfavorable product mix • Increased competition • Rise in operating expenses
© CHOICE INSTITUTIONAL RESEARCH
Peer Comparison and Valuation:
7
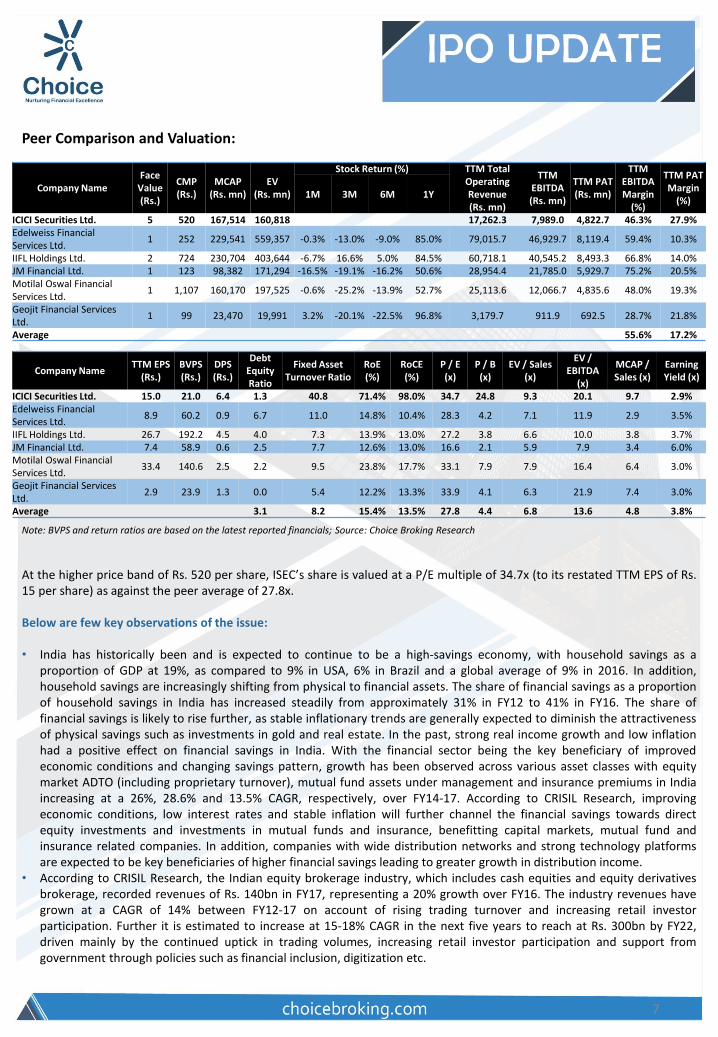
At the higher price band of Rs. 520 per share, ISEC’s share is valued at a P/E multiple of 34.7x (to its restated TTM EPS of Rs. 15 per share) as against the peer average of 27.8x. Below are few key observations of the issue: • India has historically been and is expected to continue to be a high-savings economy, with household savings as a
proportion of GDP at 19%, as compared to 9% in USA, 6% in Brazil and a global average of 9% in 2016. In addition, household savings are increasingly shifting from physical to financial assets. The share of financial savings as a proportion of household savings in India has increased steadily from approximately 31% in FY12 to 41% in FY16. The share of financial savings is likely to rise further, as stable inflationary trends are generally expected to diminish the attractiveness of physical savings such as investments in gold and real estate. In the past, strong real income growth and low inflation had a positive effect on financial savings in India. With the financial sector being the key beneficiary of improved economic conditions and changing savings pattern, growth has been observed across various asset classes with equity market ADTO (including proprietary turnover), mutual fund assets under management and insurance premiums in India increasing at a 26%, 28.6% and 13.5% CAGR, respectively, over FY14-17. According to CRISIL Research, improving economic conditions, low interest rates and stable inflation will further channel the financial savings towards direct equity investments and investments in mutual funds and insurance, benefitting capital markets, mutual fund and insurance related companies. In addition, companies with wide distribution networks and strong technology platforms are expected to be key beneficiaries of higher financial savings leading to greater growth in distribution income.
• According to CRISIL Research, the Indian equity brokerage industry, which includes cash equities and equity derivatives brokerage, recorded revenues of Rs. 140bn in FY17, representing a 20% growth over FY16. The industry revenues have grown at a CAGR of 14% between FY12-17 on account of rising trading turnover and increasing retail investor participation. Further it is estimated to increase at 15-18% CAGR in the next five years to reach at Rs. 300bn by FY22, driven mainly by the continued uptick in trading volumes, increasing retail investor participation and support from government through policies such as financial inclusion, digitization etc.
Company Name Face
Value (Rs.)
CMP (Rs.)
MCAP (Rs. mn)
EV (Rs. mn)
Stock Return (%) TTM Total Operating Revenue (Rs. mn)
TTM EBITDA (Rs. mn)
TTM PAT (Rs. mn)
TTM EBITDA Margin
(%)
TTM PAT Margin
(%) 1M 3M 6M 1Y
ICICI Securities Ltd. 5 520 167,514 160,818 17,262.3 7,989.0 4,822.7 46.3% 27.9% Edelweiss Financial Services Ltd.
1 252 229,541 559,357 -0.3% -13.0% -9.0% 85.0% 79,015.7 46,929.7 8,119.4 59.4% 10.3%
IIFL Holdings Ltd. 2 724 230,704 403,644 -6.7% 16.6% 5.0% 84.5% 60,718.1 40,545.2 8,493.3 66.8% 14.0% JM Financial Ltd. 1 123 98,382 171,294 -16.5% -19.1% -16.2% 50.6% 28,954.4 21,785.0 5,929.7 75.2% 20.5% Motilal Oswal Financial Services Ltd.
1 1,107 160,170 197,525 -0.6% -25.2% -13.9% 52.7% 25,113.6 12,066.7 4,835.6 48.0% 19.3%
Geojit Financial Services Ltd.
1 99 23,470 19,991 3.2% -20.1% -22.5% 96.8% 3,179.7 911.9 692.5 28.7% 21.8%
Average 55.6% 17.2%
Company Name TTM EPS
(Rs.) BVPS (Rs.)
DPS (Rs.)
Debt Equity Ratio
Fixed Asset Turnover Ratio
RoE (%)
RoCE (%)
P / E (x)
P / B (x)
EV / Sales (x)
EV / EBITDA
(x)
MCAP / Sales (x)
Earning Yield (x)
ICICI Securities Ltd. 15.0 21.0 6.4 1.3 40.8 71.4% 98.0% 34.7 24.8 9.3 20.1 9.7 2.9% Edelweiss Financial Services Ltd.
8.9 60.2 0.9 6.7 11.0 14.8% 10.4% 28.3 4.2 7.1 11.9 2.9 3.5%
IIFL Holdings Ltd. 26.7 192.2 4.5 4.0 7.3 13.9% 13.0% 27.2 3.8 6.6 10.0 3.8 3.7% JM Financial Ltd. 7.4 58.9 0.6 2.5 7.7 12.6% 13.0% 16.6 2.1 5.9 7.9 3.4 6.0% Motilal Oswal Financial Services Ltd.
33.4 140.6 2.5 2.2 9.5 23.8% 17.7% 33.1 7.9 7.9 16.4 6.4 3.0%
Geojit Financial Services Ltd.
2.9 23.9 1.3 0.0 5.4 12.2% 13.3% 33.9 4.1 6.3 21.9 7.4 3.0%
Average 3.1 8.2 15.4% 13.5% 27.8 4.4 6.8 13.6 4.8 3.8%
Note: BVPS and return ratios are based on the latest reported financials; Source: Choice Broking Research
© CHOICE INSTITUTIONAL RESEARCH
Peer Comparison and Valuation (Contd…): • ISEC, being one of the pioneers in the e-brokerage business in India, along with its strong brand name, large registered
customer base, wide range of products across asset classes, complimentary advisory services, positions it to be the natural beneficiary of the growth in digitization and resultant transformational changes in the Indian savings markets.
• Since FY14, the company is the largest broker in India in terms of brokerage revenue and active clients on the NSE. As of 31st Dec. 2017, it had 3.9mn accounts operational on the “ICICIdirect” electronic platform, which is a scalable plug-and-play architecture to support quick-to-market product introduction and modifications. Since inception and till 31st Dec. 2017, the company has acquired a total of 4.6mn customers through this platform. For the nine month ended Dec. 2017, the company had an ADTO market share of 9.1% as compared to 4.4% in FY13.
• In FY17, the company derived 55.3% of the revenues from Brokerage income, which includes services offered to retail and institutional clients. Retail brokerage accounted for 90.5% of the brokerage business in FY17 and was consistently above 90% over FY13-17. Additionally, 40% of the brokerage revenue in FY17 was derived from the customers that have maintained accounts with ISEC for more than ten years. Other significant revenue segment is the Income from the services, which contributed 35.5% of the total revenue in FY17. Under this segment, the company distributes financial products like mutual funds, insurance products, portfolio management services, fixed deposits, loans etc. It earns commission from the third parties for the distribution of these financial products. In FY17, the company was the second largest non-bank distributor of mutual funds in India.
• As of 31st Dec. 2017, the retail and distribution business is supported by its nationwide network consisting of over 200 branches, over 2,600 branches of ICIC Bank Ltd. and over 4,600 sub brokers, authorized persons and associates.
• ISEC’s proprietary electronic brokerage platform is well received from the investor community and is gaining traction from the digitization of the financial transactions in India. In FY17, over 95% of the brokerage transactions by notional value and over 90% of the mutual fund transaction performed by its customers were online.
• Over the years, ISEC have been working on diversifying its revenue streams to reduce volatility in revenues associated with its brokerage business by increasing the contribution from the distribution and investment banking businesses. As a result, the contribution of the brokerage business to its overall revenue has decreased from 63.3% in FY13 to 55.3% in FY17. While the share of the Income from services segment increased from 33.1% in FY13 to 35.5% in FY17. This can be largely attributed to its open-source distribution model, through which it distributes over 2,500 mutual funds. Going forward, the company intends to continue to offer new products and services and also increase its focus on products that provide it with recurring revenue like mutual funds, long-term life insurance policies and portfolio management services.
• On financial performance front, ISEC has shown strong growth with significant operating efficiency. It reported a 18.8% CAGR rise in the total operating revenue to Rs. 14,042.3mn in FY17. This was on the back of 14.8% and 20.9% CAGR increase in the brokerage income and services income. Due to operational efficiency, total operating expenses increased at a lower rate as compared to top-line. Operating cost to its total revenue declined from 78.3% in FY13 to 59.7% in FY17. As a result, EBITDA increased by 38.6% CAGR with margin expansion by over 18ppts over FY13-17 to 40.3% in FY17. Reported PAT increased by 47.4% CAGR during the period. PAT margin expanded by around 14ppts to 24.1% in FY17. Average RoIC and RoE of the period stood at 94.9% and 55.1%, respectively, over FY13-17. ISEC has consistently paid dividend during the period with average dividend payout of 53.9%.
• For the nine month ended Dec. 2017, the company reported a 31.5% Y-o-Y rise in top-line to Rs. 13,446.9mn with an EBITDA and PAT margin of 49% and 29.7%, respectively. For FY18E, we are anticipating a top-line of Rs. 16,949.6mn (an increase of 20.7% over FY17) and EPS of 14.4 per share (an increase of 36.8% over FY17). EBITDA and PAT margin are anticipated at 46.1% and 27.3%, respectively. In FY19, it is expected to report a top-line of Rs. 20,129.9mn and EPS of 18.4 per share.
On valuation front, at higher price band, ISEC is demanding a P/E valuation of 34.7x (to its restated TTM EPS of Rs. 15), which is at a premium to the peer average. Moreover, with respect to FY18E and FY19E earnings too, it is asking a premium valuation. We are of the opinion that all the positives are already being factored and there is a limited upside potential post listing. However, considering the growing equity cult in India, its positioning in the equity market, scalable & asset light business model, strong financial & return ratios and healthy dividend payout, we assign a “Subscribe with Caution” rating to the issue.
7
© CHOICE INSTITUTIONAL RESEARCH
Financial Statements:
7
Source: Company RHP
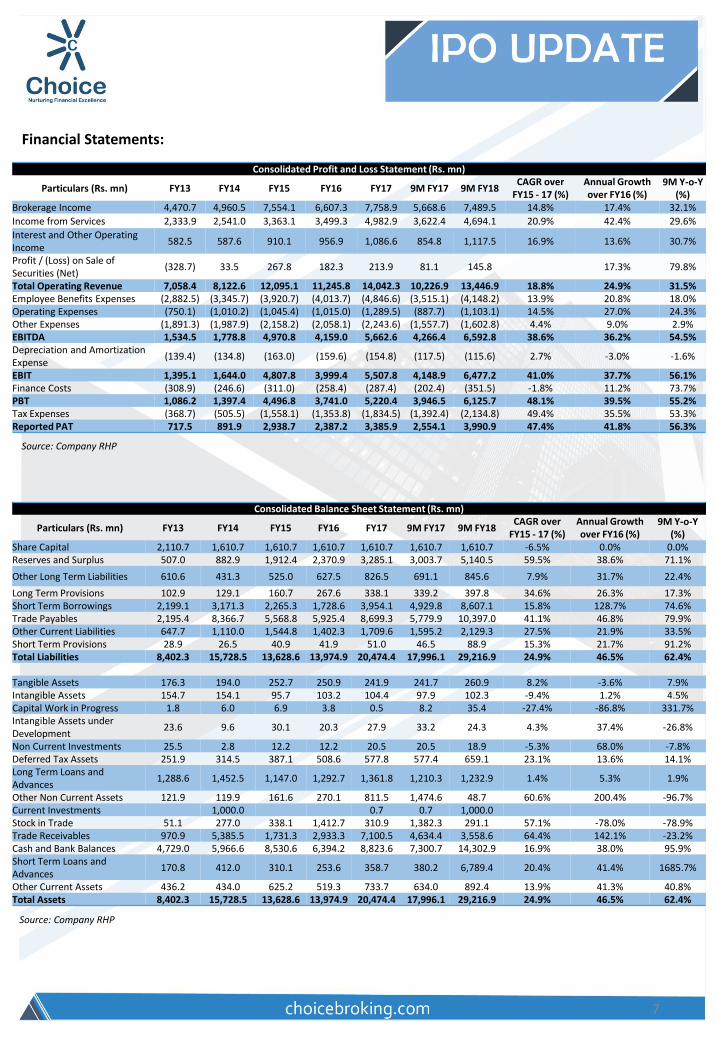
Consolidated Profit and Loss Statement (Rs. mn)
Particulars (Rs. mn) FY13 FY14 FY15 FY16 FY17 9M FY17 9M FY18 CAGR over
FY15 - 17 (%) Annual Growth over FY16 (%)
9M Y-o-Y (%)
Brokerage Income 4,470.7 4,960.5 7,554.1 6,607.3 7,758.9 5,668.6 7,489.5 14.8% 17.4% 32.1%
Income from Services 2,333.9 2,541.0 3,363.1 3,499.3 4,982.9 3,622.4 4,694.1 20.9% 42.4% 29.6%
Interest and Other Operating Income
582.5 587.6 910.1 956.9 1,086.6 854.8 1,117.5 16.9% 13.6% 30.7%
Profit / (Loss) on Sale of Securities (Net)
(328.7) 33.5 267.8 182.3 213.9 81.1 145.8 17.3% 79.8%
Total Operating Revenue 7,058.4 8,122.6 12,095.1 11,245.8 14,042.3 10,226.9 13,446.9 18.8% 24.9% 31.5% Employee Benefits Expenses (2,882.5) (3,345.7) (3,920.7) (4,013.7) (4,846.6) (3,515.1) (4,148.2) 13.9% 20.8% 18.0% Operating Expenses (750.1) (1,010.2) (1,045.4) (1,015.0) (1,289.5) (887.7) (1,103.1) 14.5% 27.0% 24.3% Other Expenses (1,891.3) (1,987.9) (2,158.2) (2,058.1) (2,243.6) (1,557.7) (1,602.8) 4.4% 9.0% 2.9% EBITDA 1,534.5 1,778.8 4,970.8 4,159.0 5,662.6 4,266.4 6,592.8 38.6% 36.2% 54.5% Depreciation and Amortization Expense
(139.4) (134.8) (163.0) (159.6) (154.8) (117.5) (115.6) 2.7% -3.0% -1.6%
EBIT 1,395.1 1,644.0 4,807.8 3,999.4 5,507.8 4,148.9 6,477.2 41.0% 37.7% 56.1% Finance Costs (308.9) (246.6) (311.0) (258.4) (287.4) (202.4) (351.5) -1.8% 11.2% 73.7% PBT 1,086.2 1,397.4 4,496.8 3,741.0 5,220.4 3,946.5 6,125.7 48.1% 39.5% 55.2% Tax Expenses (368.7) (505.5) (1,558.1) (1,353.8) (1,834.5) (1,392.4) (2,134.8) 49.4% 35.5% 53.3% Reported PAT 717.5 891.9 2,938.7 2,387.2 3,385.9 2,554.1 3,990.9 47.4% 41.8% 56.3%
Consolidated Balance Sheet Statement (Rs. mn)
Particulars (Rs. mn) FY13 FY14 FY15 FY16 FY17 9M FY17 9M FY18 CAGR over
FY15 - 17 (%) Annual Growth over FY16 (%)
9M Y-o-Y (%)
Share Capital 2,110.7 1,610.7 1,610.7 1,610.7 1,610.7 1,610.7 1,610.7 -6.5% 0.0% 0.0% Reserves and Surplus 507.0 882.9 1,912.4 2,370.9 3,285.1 3,003.7 5,140.5 59.5% 38.6% 71.1%
Other Long Term Liabilities 610.6 431.3 525.0 627.5 826.5 691.1 845.6 7.9% 31.7% 22.4%
Long Term Provisions 102.9 129.1 160.7 267.6 338.1 339.2 397.8 34.6% 26.3% 17.3% Short Term Borrowings 2,199.1 3,171.3 2,265.3 1,728.6 3,954.1 4,929.8 8,607.1 15.8% 128.7% 74.6% Trade Payables 2,195.4 8,366.7 5,568.8 5,925.4 8,699.3 5,779.9 10,397.0 41.1% 46.8% 79.9% Other Current Liabilities 647.7 1,110.0 1,544.8 1,402.3 1,709.6 1,595.2 2,129.3 27.5% 21.9% 33.5% Short Term Provisions 28.9 26.5 40.9 41.9 51.0 46.5 88.9 15.3% 21.7% 91.2% Total Liabilities 8,402.3 15,728.5 13,628.6 13,974.9 20,474.4 17,996.1 29,216.9 24.9% 46.5% 62.4%
Tangible Assets 176.3 194.0 252.7 250.9 241.9 241.7 260.9 8.2% -3.6% 7.9% Intangible Assets 154.7 154.1 95.7 103.2 104.4 97.9 102.3 -9.4% 1.2% 4.5% Capital Work in Progress 1.8 6.0 6.9 3.8 0.5 8.2 35.4 -27.4% -86.8% 331.7% Intangible Assets under Development
23.6 9.6 30.1 20.3 27.9 33.2 24.3 4.3% 37.4% -26.8%
Non Current Investments 25.5 2.8 12.2 12.2 20.5 20.5 18.9 -5.3% 68.0% -7.8% Deferred Tax Assets 251.9 314.5 387.1 508.6 577.8 577.4 659.1 23.1% 13.6% 14.1% Long Term Loans and Advances
1,288.6 1,452.5 1,147.0 1,292.7 1,361.8 1,210.3 1,232.9 1.4% 5.3% 1.9%
Other Non Current Assets 121.9 119.9 161.6 270.1 811.5 1,474.6 48.7 60.6% 200.4% -96.7% Current Investments 1,000.0 0.7 0.7 1,000.0 Stock in Trade 51.1 277.0 338.1 1,412.7 310.9 1,382.3 291.1 57.1% -78.0% -78.9% Trade Receivables 970.9 5,385.5 1,731.3 2,933.3 7,100.5 4,634.4 3,558.6 64.4% 142.1% -23.2% Cash and Bank Balances 4,729.0 5,966.6 8,530.6 6,394.2 8,823.6 7,300.7 14,302.9 16.9% 38.0% 95.9% Short Term Loans and Advances
170.8 412.0 310.1 253.6 358.7 380.2 6,789.4 20.4% 41.4% 1685.7%
Other Current Assets 436.2 434.0 625.2 519.3 733.7 634.0 892.4 13.9% 41.3% 40.8% Total Assets 8,402.3 15,728.5 13,628.6 13,974.9 20,474.4 17,996.1 29,216.9 24.9% 46.5% 62.4%
Source: Company RHP
© CHOICE INSTITUTIONAL RESEARCH
Financial Statements (Contd…):
7
Note: Pre-issue data; Source: Company RHP
Source: Company RHP
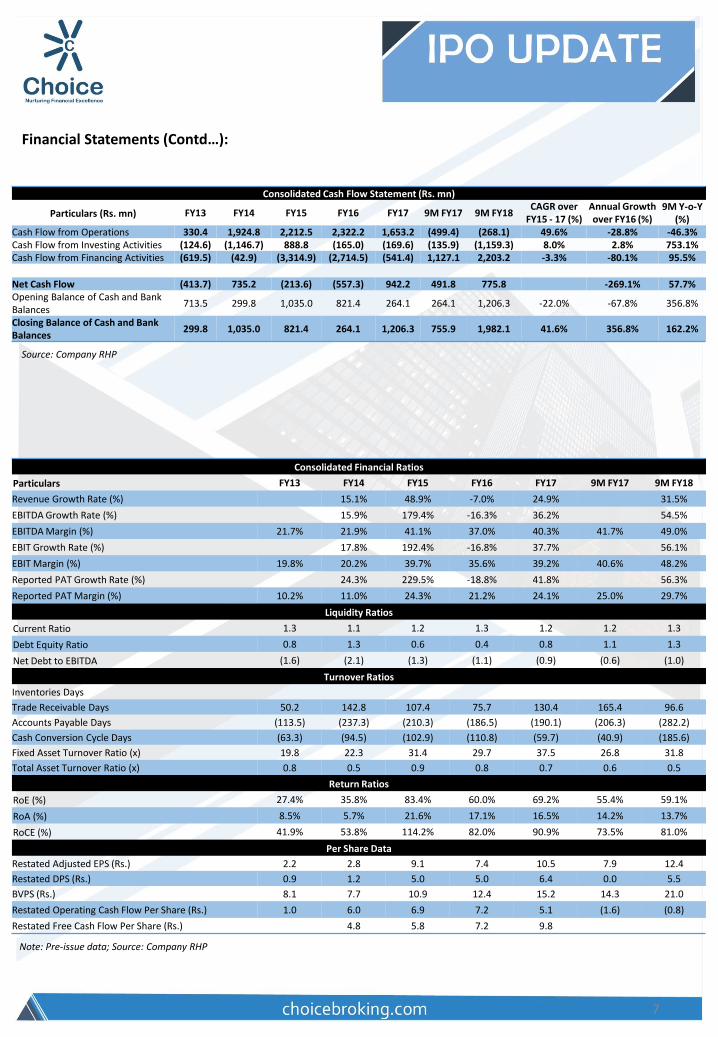
Consolidated Cash Flow Statement (Rs. mn)
Particulars (Rs. mn) FY13 FY14 FY15 FY16 FY17 9M FY17 9M FY18 CAGR over
FY15 - 17 (%) Annual Growth over FY16 (%)
9M Y-o-Y (%)
Cash Flow from Operations 330.4 1,924.8 2,212.5 2,322.2 1,653.2 (499.4) (268.1) 49.6% -28.8% -46.3% Cash Flow from Investing Activities (124.6) (1,146.7) 888.8 (165.0) (169.6) (135.9) (1,159.3) 8.0% 2.8% 753.1% Cash Flow from Financing Activities (619.5) (42.9) (3,314.9) (2,714.5) (541.4) 1,127.1 2,203.2 -3.3% -80.1% 95.5%
Net Cash Flow (413.7) 735.2 (213.6) (557.3) 942.2 491.8 775.8 -269.1% 57.7% Opening Balance of Cash and Bank Balances
713.5 299.8 1,035.0 821.4 264.1 264.1 1,206.3 -22.0% -67.8% 356.8%
Closing Balance of Cash and Bank Balances
299.8 1,035.0 821.4 264.1 1,206.3 755.9 1,982.1 41.6% 356.8% 162.2%
Consolidated Financial Ratios
Particulars FY13 FY14 FY15 FY16 FY17 9M FY17 9M FY18
Revenue Growth Rate (%) 15.1% 48.9% -7.0% 24.9% 31.5%
EBITDA Growth Rate (%) 15.9% 179.4% -16.3% 36.2% 54.5%
EBITDA Margin (%) 21.7% 21.9% 41.1% 37.0% 40.3% 41.7% 49.0%
EBIT Growth Rate (%) 17.8% 192.4% -16.8% 37.7% 56.1%
EBIT Margin (%) 19.8% 20.2% 39.7% 35.6% 39.2% 40.6% 48.2%
Reported PAT Growth Rate (%) 24.3% 229.5% -18.8% 41.8% 56.3%
Reported PAT Margin (%) 10.2% 11.0% 24.3% 21.2% 24.1% 25.0% 29.7%
Liquidity Ratios
Current Ratio 1.3 1.1 1.2 1.3 1.2 1.2 1.3
Debt Equity Ratio 0.8 1.3 0.6 0.4 0.8 1.1 1.3
Net Debt to EBITDA (1.6) (2.1) (1.3) (1.1) (0.9) (0.6) (1.0)
Turnover Ratios
Inventories Days
Trade Receivable Days 50.2 142.8 107.4 75.7 130.4 165.4 96.6
Accounts Payable Days (113.5) (237.3) (210.3) (186.5) (190.1) (206.3) (282.2)
Cash Conversion Cycle Days (63.3) (94.5) (102.9) (110.8) (59.7) (40.9) (185.6)
Fixed Asset Turnover Ratio (x) 19.8 22.3 31.4 29.7 37.5 26.8 31.8
Total Asset Turnover Ratio (x) 0.8 0.5 0.9 0.8 0.7 0.6 0.5
Return Ratios
RoE (%) 27.4% 35.8% 83.4% 60.0% 69.2% 55.4% 59.1%
RoA (%) 8.5% 5.7% 21.6% 17.1% 16.5% 14.2% 13.7%
RoCE (%) 41.9% 53.8% 114.2% 82.0% 90.9% 73.5% 81.0%
Per Share Data
Restated Adjusted EPS (Rs.) 2.2 2.8 9.1 7.4 10.5 7.9 12.4
Restated DPS (Rs.) 0.9 1.2 5.0 5.0 6.4 0.0 5.5
BVPS (Rs.) 8.1 7.7 10.9 12.4 15.2 14.3 21.0
Restated Operating Cash Flow Per Share (Rs.) 1.0 6.0 6.9 7.2 5.1 (1.6) (0.8)
Restated Free Cash Flow Per Share (Rs.) 4.8 5.8 7.2 9.8
11
Disclaimer This is solely for information of clients of Choice Broking and does not construe to be an investment advice. It is also not intended as an offer or solicitation for the purchase and sale of any financial instruments. Any action taken by you on the basis of the information contained herein is your responsibility alone and Choice Broking its subsidiaries or its employees or associates will not be liable in any manner for the consequences of such action taken by you. We have exercised due diligence in checking the correctness and authenticity of the information contained in this recommendation, but Choice Broking or any of its subsidiaries or associates or employees shall not be in any way responsible for any loss or damage that may arise to any person from any inadvertent error in the information contained in this recommendation or any action taken on basis of this information. This report is based on the fundamental analysis with a view to forecast future price. The Research analysts for this report certifies that all of the views expressed in this report accurately reflect his or her personal views about the subject company or companies and its or their securities, and no part of his or her compensation was, is or will be, directly or indirectly related to specific recommendations or views expressed in this report. Choice Broking has based this document on information obtained from sources it believes to be reliable but which it has not independently verified; Choice Broking makes no guarantee, representation or warranty and accepts no responsibility or liability as to its accuracy or completeness. The opinions contained within the report are based upon publicly available information at the time of publication and are subject to change without notice. The information and any disclosures provided herein are in summary form and have been prepared for informational purposes. The recommendations and suggested price levels are intended purely for stock market investment purposes. The recommendations are valid for the day of the report and will remain valid till the target period. The information and any disclosures provided herein may be considered confidential. Any use, distribution, modification, copying, forwarding or disclosure by any person is strictly prohibited. The information and any disclosures provided herein do not constitute a solicitation or offer to purchase or sell any security or other financial product or instrument. The current performance may be unaudited. Past performance does not guarantee future returns. There can be no assurance that investments will achieve any targeted rates of return, and there is no guarantee against the loss of your entire investment.
POTENTIAL CONFLICT OF INTEREST DISCLOSURE (as on date of report) Disclosure of interest statement – • Analyst interest of the stock /Instrument(s): - No. • Firm interest of the stock / Instrument (s): - No.
+91-022-6707 9999 +91-022-6707 9959 www.choicebroking.in
Choice Equity Broking Pvt. Ltd. Choice House, Shree Shakambhari Corporate Park, Plot No: -156-158,
J.B. Nagar, Andheri (East), Mumbai - 400 099.