Subpart B – Conservation Planning, Part 614, Amend 3 ... .....5 What is a Healthy Stream?.....6...
60
FOTG, Section III NRCS, CO Planning Forms June 2017 Stream Visual Assessment Protocol (version 2) Colorado June 2017 National Biology Handbook Subpart B – Conservation Planning, Part 614, Amend 3, December 2009 Arikaree River Yuma County, Colorado Kerber Creek Saguache County, Colorado
Transcript of Subpart B – Conservation Planning, Part 614, Amend 3 ... .....5 What is a Healthy Stream?.....6...

FOTG, Section III NRCS, CO Planning Forms June 2017
Stream Visual Assessment Protocol (version 2)
Colorado June 2017
National Biology Handbook Subpart B – Conservation Planning, Part 614, Amend 3, December 2009
Arikaree River Yuma County, Colorado
Kerber Creek Saguache County, Colorado

For additional information contact:
Fisheries Biologist West National Technology Support Center
1201 NE Lloyd Blvd., Suite 1000 Portland, Oregon 97232
(503) 273–2400
Wildlife Biologist Denver State Office
Denver Federal Center, Bldg 56, Room 2604 Denver, Colorado 80225
(720) 544-2804
Non-discrimination statement In accordance with Federal civil rights law and U.S. Department of Agriculture (USDA) civil rights regulations and policies, the USDA, its Agencies, offices, and employees, and institutions participating in or administering USDA programs are prohibited from discriminating based on race, color, national origin, religion, sex, gender identity (including gender expression), sexual orientation, disability, age, marital status, family/parental status, income derived from a public assistance program, political beliefs, or reprisal or retaliation for prior civil rights activity, in any program or activity conducted or funded by USDA (not all bases apply to all programs). Remedies and complaint filing deadlines vary by program or incident.
Persons with disabilities who require alternative means of communication for program information (e.g., Braille, large print, audiotape, American Sign Language, etc.) should contact the responsible Agency or USDA's TARGET Center at (202) 720-2600 (voice and TTY) or contact USDA through the Federal Relay Service at (800) 877-8339. Additionally, program information may be made available in languages other than English.
To file a program discrimination complaint, complete the USDA Program Discrimination Complaint Form, AD-3027, found online at How to File a Program Discrimination Complaint and at any USDA office or write a letter addressed to USDA and provide in the letter all of the information requested in the form. To request a copy of the complaint form, call (866) 632-9992. Submit your completed form or letter to USDA by: (1) mail: U.S. Department of Agriculture, Office of the Assistant Secretary for Civil Rights, 1400 Independence Avenue, SW, Washington, D.C. 20250-9410; (2) fax: (202) 690-7442; or (3) email: [email protected].

Preface
The Stream Visual Assessment Protocol, version 2 (SVAP2) is a national NRCS protocol that provides an initial evaluation of the condition of wadeable stream ecosystems at the property level. This preliminary assessment will allow conservationists to assist landowners with determining and understanding the quality of stream habitats located on their property and in identifying resource concerns and their potential causes. The SVAP2 also may be used to track trends in stream conditions over time.
Acknowledgments
This version of the Stream Visual Assessment Protocol was developed by the U.S. Department of Agriculture (USDA) Natural Resources Conservation Service (NRCS) under the leadership of Kathryn Boyer, fish biologist, West National Technology Support Center, Portland, OR. The SVAP Revision Workgroup members provided substantial assistance in revision of the overall protocol and specific scoring elements. Jenny Adkins, water quality specialist, NRCS, Nashville, TN Kale Gullett, fisheries biologist, East National Technology Support Center, Greensboro, NC Edward Neilson, resource conservationist, NRCS, Grand Junction, CO Barry Southerland, fluvial geomorphologist, West National Technology Support Center, Portland, OR Billy Teels (retired), Central National Technology Support Center, Fort Worth, TX Deborah Virgovic, fisheries biologist, NRCS, Mount Vernon, WA Kip Yasumiishi, civil engineer, West National Technology Support Center, Portland, OR Formal technical reviews of an earlier draft of the protocol were completed by the following people whose assistance is much appreciated. Greg Kidd, biologist, NRCS, Madison, WI Julie Hawkins, biologist, NRCS, Richmond, VA Robert Weihrouch, biologist, NRCS, Madison, WI Mitch Cummings, fisheries biologist, NRCS, Tillamook, OR Todd Bobowick, soil conservationist (fisheries), NRCS, Torrington, CT Erin Myers, biologist, NRCS, Gainesville, FL Romy Myszka, biologist, NRCS, Fort Worth, TX Jennifer Anderson-Cruz, biologist, NRCS, Des Moines, IA Stephen Brady, wildlife biologist, NRCS, Fort Worth, TX Chet Hadley, biological science technician, NRCS, Heppner, OR Andrew Lipsky, biologist, NRCS, Warwick, RI Daniel Thompson, wildlife biologist, NRCS, Grand Junction, CO National Riparian Service Team, Bureau of Land Management, Prineville,OR The Colorado version of the Stream Visual Assessment Protocol was developed by Field, State, and Area staff of Colorado Natural Resources Conservation Service and partner biologists, under the leadership of Kathryn Boyer, Fish Biologist, West National Technology Support Center, Portland, OR.
Stream Visual Assessment Protocol (version 2) Colorado
Contents Introduction ................................................................................................................................................................ 5 What is a Healthy Stream? .......................................................................................................................................... 6 Stream Classification ................................................................................................................................................... 9 Reference Sites ......................................................................................................................................................... 10 Using This Protocol ................................................................................................................................................... 11
(a) Preliminary Watershed Assessment: .............................................................................................................. 11
(b) Delineating the Assessment Area: ................................................................................................................. 12
(c) Scoring the Assessment Elements .................................................................................................................. 13
(d) Using the SVAP2 Data Form ........................................................................................................................... 14
Stream Assessment Elements .................................................................................................................................. 15 Element 1. Channel Condition............................................................................................................................... 15
Element 2. Hydrologic Alteration ......................................................................................................................... 21
Element 3. Bank Condition ................................................................................................................................... 23
Elements 4 and 5. Riparian Area Quantity and Quality ........................................................................................... 25
Element 6. Canopy Cover/Stream Shading ........................................................................................................... 29
Element 7. Water Appearance .............................................................................................................................. 31
Element 8. Nutrient Enrichment .......................................................................................................................... 33
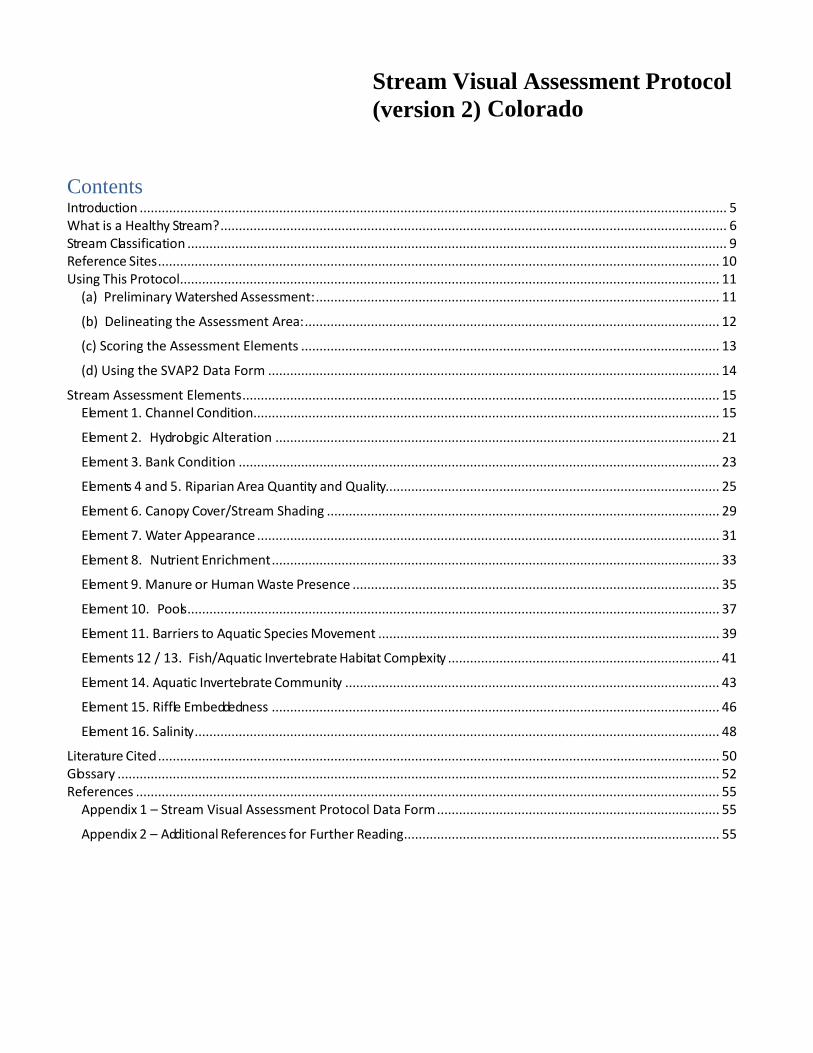
Element 9. Manure or Human Waste Presence .................................................................................................... 35
Element 10. Pools ................................................................................................................................................. 37
Element 11. Barriers to Aquatic Species Movement ............................................................................................. 39
Elements 12 / 13. Fish/Aquatic Invertebrate Habitat Complexity .......................................................................... 41
Element 14. Aquatic Invertebrate Community ...................................................................................................... 43
Element 15. Riffle Embeddedness .......................................................................................................................... 46
Element 16. Salinity ............................................................................................................................................... 48
Literature Cited ......................................................................................................................................................... 50 Glossary .................................................................................................................................................................... 52 References ............................................................................................................................................................... 55
Appendix 1 – Stream Visual Assessment Protocol Data Form ............................................................................. 55
Appendix 2 – Additional References f or Further Reading ...................................................................................... 55

Stream Visual Assessment Protocol (version 2) Colorado
Page 5 of 60
Introduction The Stream Visual Assessment Protocol, version 2 (SVAP2) is a national NRCS protocol that provides a preliminary assessment of the condition of wadeable stream ecosystems at the property level. This preliminary assessment will allow conservationists to assist landowners with understanding the quality of the stream habitat located on their property, and in identifying resource concerns and their potential causes. The SVAP2 may also be used to track trends in stream condition over time.
The SVAP2 is a qualitative assessment based on visually apparent physical, chemical, and biological features within a specified reach of the stream corridor. Because of its qualitative design, the protocol may not detect all causes of resource concerns, especially if such causes are a result of land use actions in other parts of the watershed. If further evaluation is needed, utilize a quantitative assessment instead (refer to Appendix 2: Quantitative Stream Assessment).
The SVAP2 assessment can be successfully applied by conservationists with limited training in biology, geomorphology or hydrology; when the users read the protocol’s guidance thoroughly before beginning an assessment.
Colorado SVAP2 modifications The national Stream Visual Assessment Protocol (version 2) can be found in the NRCS 190-National Biology Handbook, Subpart B, Part 614 dated December 2009. Its authors recognize the importance of regional differences in influencing stream conditions and encouraged states to amend or revise the protocol as necessary to better assess the local conditions. This document is Colorado’s SVAP2 revision; developed with emphasis on Colorado western stream, riparian and floodplain ecosystems.
NRCS Conservation Planning using SVAP2
SVAP2 will used in the planning process when a stream is present on the planning area.
A minimum score of 5.0 is necessary to meet planning criteria.
If the score is less than 5.0 it represents a poor or severely degraded condition. Review the lowest scoring factors and determine which conservation practices can be implemented to bring the score up to 5.0 or higher. If the stream is complex, the planner may need to bring in additional disciplines to fully understand the situation.
If the score is 5.0 or higher and the landowner’s objective is to further improve habitat, the planner can develop practices to raise the lowest scoring factors and further improve the overall score. If the stream is complex, the planner may need to bring in additional disciplines to fully understand the situation.

Stream Visual Assessment Protocol (version 2) Colorado
Page 6 of 60
What is a Healthy Stream? A stream’s watershed captures precipitation, filters and stores water, and regulates its release through the stream channel network and eventually into a lake, another watershed, or an estuary and the ocean. Watersheds are characterized by different climates, geomorphic features, soil types, vegetation, and land uses. Their upland features control the quantity and timing of water and materials that make their way overland and into a stream system. The environmental conditions of a stream or river corridor (such as water quantity and quality, riparian and floodplain function, and habitat quality) are thus linked to the entire watershed. These linkages affect stream processes that act vertically, laterally, longitudinally, and over time. Land managers may have little control of watershed management beyond their property lines or jurisdictional boundaries. Nevertheless, activities that occur in many individual farm fields, rangelands, or pastures can have cumulative impacts on the condition of an individual landowner’s stream, and those downstream. Sound watershed and stream corridor management are important for maintaining stream conditions that allow the stream to be resilient and resistant to natural disturbance and human-caused perturbations. The natural resilience of a stream to recover from floods, fire, and drought is an indicator that it is healthy (Meyer, 1997).
Streams, their floodplains and adjacent riparian areas are complex ecosystems where numerous biological, physical, and chemical processes interact (Cushing and Allen, 2001). Changes in any one feature or process in a stream ecosystem have cascading effects throughout the stream as it flows downstream and as its flows change with seasonal shifts in precipitation. Stream processes are inter-connected and these connections maintain a balance of materials that are transported and deposited by the stream, including sediment, water, wood, and nutrients. If conditions change, these processes must re-adjust to keep the stream resilient and functional for energy and material transport and aquatic fauna and flora. The conditions of a stream reflect current and past land uses and management actions. As such, they may also help predict future trends of watershed land use and conditions.
Multiple factors affect stream conditions and therefore stream quality (Figure 1). For example, increased nutrient loads alone may not cause a visual change to a forested stream. But when combined with tree removal and channel widening, the result may shift the energy dynamics from a community based on leaf litter inputs to one based on algae and aquatic plants. The resulting chemical changes caused by photosynthesis and respiration of aquatic plants coupled with temperature increases due to loss of canopy cover will alter the aquatic community.
Many stream processes are in delicate balance. For example, the force of the stream flow, the amount of sediment, and the stream features that slow or hasten flow must be in relative balance to prevent channel incision or bank erosion. Increases in sediment loads beyond the capacity of the stream to transport them downstream can lead to extensive deposition of sediments and channel widening.
Lastly, the biological community of a stream also affects its overall condition. As indicators of biological integrity fish, aquatic invertebrates, and all other members of a stream’s community portray a pattern of stream condition that further enhances our ability to detect concerns. For example, the prevalence of exotic species in a fish assemblage of a particular stream often indicates deterioration in stream function or quality. While beyond the scope of the SVAP2, such indices of biological integrity provide an even more comprehensive picture of a stream ecosystem’s condition (Giller, Malmqvist, 1998; Matthews, 1998).

Stream Visual Assessment Protocol (version 2) Colorado
Page 7 of 60
Figure 1. Factors that influence the quality or condition of streams (modified from Karr et. al. (1986))
Stream corridors benefit from complex and diverse physical structure. Such complexity increases “channel roughness” that dissipates the energy of water and reduces its erosive power. Structural complexity is provided by channel form (i.e., meanders, pools, riffles, backwaters, wetlands), profile (i.e., stream gradient, width, and depth), materials that have fallen into the channel (trees and bank material), overhanging vegetation, roots extending into the flow, and streambed materials (sand, gravel, rocks, and boulders). The movement of these materials and the path of flow form pools, riffles, backwaters, side-channels, floodplain wetlands, and many other types of habitats. Thus, streams with complex floodplains and a diversity of structural features generally support a higher diversity of aquatic species (Schlosser 1982; Pearsons et al., 1992; Gurnell et al., 1995)
Chemical pollution of streams and rivers diminishes stream health and harms aquatic species. The major categories of chemical pollutants are oxygen-depleting sources such as manure, ammonia, and organic wastes; nutrients such as nitrogen and phosphorus from both fertilizers and animal wastes; acids from
Figure 2. Stream Complexity

Stream Visual Assessment Protocol (version 2) Colorado
Page 8 of 60
mining or industrial effluents; and contaminants such as pesticides, salts, metals, and pharmaceuticals. It is important to note that the effects of many chemicals depend on multiple factors. For example, an increase in the pH caused by excessive algal plant growth may cause an otherwise safe concentration of ammonia to become toxic.
Finally, it is important to recognize that healthy, resilient streams, riparian areas and floodplains operate as a connected stream corridor system. Lateral exchange of water and materials between a stream and its floodplain is the driving force for nutrient dynamics in the stream corridor community. Primary productivity of floodplain habitats is closely tied to hydroperiod, or the length of time the floodplain is inundated or saturated with water. Productivity is greatest in wetlands with pulsed flooding (i.e., periodic inundation and drying) and high nutrient input, and lower in drained or permanently flooded conditions. Floodplains and their associated wetlands thus play a critical role in the health of the stream itself. An example would be the removal of nitrogen (denitrification) in floodwaters by floodplain wetlands (Forshay and Stanley, 2005).
Riparian wetlands may also influence stream channel morphology and flows, buffering the stream channel against the physical effects of high flows by dissipating energy as waters spread out onto the floodplain. In many instances, these floodplains provide refuge habitat for aquatic species, especially during flood events. As stream flows recede, riparian wetlands provide water storage, slowly releasing water and aquatic organisms back to the stream through surface and subsurface transport, thereby influencing stream base flows during drier times of the year.
In summary, physical, chemical and biological elements that influence stream conditions also provide indicators of how well a stream is functioning and responding to natural disturbances (e.g., floods) or human actions (e.g., land clearing). A stream corridor that maintains key ecological and physical functions over time is a healthy, resilient ecosystem that can support diverse communities of aquatic species.
Figure 3. Example of pH (Courtesy of U.S. EPA)

Stream Visual Assessment Protocol (version 2) Colorado
Page 9 of 60
Stream Classification A healthy stream will look and function differently depending on its location or ecological setting. For example, a mountain stream that flows through a narrow valley over a shale bedrock bottom is very different from a stream that flows through a wide valley over alluvial deposits. Stream classification is a way to account for the effects of these natural variations in streams. Accurately classifying the type of stream (i.e. stream type/class) in an area of interest is important to assessing the current condition or health of that particular stream. Additionally, understanding the stream type will help to avoid comparing stream reaches which are not naturally similar. For this reason, a separate SVAP2 assessment will be made for each stream type. Some important factors to consider are: the Ecoregion or Major Land Resource Area, and the watershed basin where the assessment will occur. Other factors are the size of the watershed drainage area, the streambed gradient (slope), and streambed substrate.
There are numerous stream classification protocols available and any may be used for this purpose. Provided below are a few of the classification protocols available: Bryce, S.A., and S.E. Clarke. 1996. Landscape-level ecological regions: linking state-level ecoregion frameworks with stream
habitat classifications. Environmental Management 20:297–311 Frissell, C.A., W.J. Liss, C.E. Warren, and M.D. Hurley. 1986. A hierarchical framework for stream habitat classification: viewing
streams in a watershed context. Environmental Management 10:199–214. Hawkes, H.A. 1975. River zonation and classification. In River ecology. B.A. Whitton (ed.). University of California Press, Berkeley,
CA. pp. 312–374. Kondolf, G.M. 1995. Geomorphological stream channel classification in aquatic habitat restoration: uses and limitations. Aquatic
Conservation: Marine and Freshwater Ecosystems 5:127–141. Montgomery, D.R., and J.M. Buffington. 1993. Channel classification, prediction of channel response, and assessment of channel
condition. Washington State Timber, Fish, and Wildlife. p. 67. Rosgen, D.L. 1994. A classification of natural rivers. Catena 22:169–199 Thorne, C.R. 1997. Channel types and morphological classification. Applied Fluvial Geomorphology for River Engineering and
Management. John Wiley & Sons, Chichester, UK. pp.176–222.
Example: Rosgen, 1994. A Classification of Natural Rivers.

Stream Visual Assessment Protocol (version 2) Colorado
Page 10 of 60
Reference Sites One of the most difficult challenges associated with evaluating a stream’s quality or existing condition is the determination of historic and potential conditions. An accurate assessment of the stream requires a benchmark of, or reference to, what a healthy stream in the targeted ecoregions should look like. We often assume that historic conditions of streams were healthy or resilient after disturbances. However, it is unrealistic to expect that all stream systems can potentially be as resilient as they were prior to extensive land use activity. In such cases, land managers often identify a benchmark condition that reflects the “least impaired conditions” of the ecoregion. Under this scenario, the SVAP2 would be adapted to reflect the stream corridor conditions which managers are aspiring to achieve.
Reference sites represent the range of conditions that potentially exist for a particular class/type of stream. Least-impaired reference sites represent the best conditions attainable, and most- impaired reference sites the worst. One challenge in selecting least-impaired reference sites is that there are few streams left, especially in agricultural landscapes that have not been influenced by human actions. Accessible, least-impaired reference sites are important not only because they define a benchmark for attainable conditions, but they also serve as demonstration areas for field staff to observe the characteristics of the region’s best streams that would result in the highest possible SVAP2 scores. A common pitfall in reference site selection is the failure to survey a wide enough area to find sites that are truly least-impaired and are representative of an entire class of stream. Another common problem, particularly in highly altered landscapes, is the failure to identify sites that are most-impaired. In addition to setting the lower “bar” of the stream health gradient, most-impaired sites provides a clear illustration of how streams are not supposed to look, and serve as models for improvement actions. Remember, reference sites should represent an entire stream class and thus may be located in another county or state.
Colorado NRCS is in the process of developing a series of riparian Ecological Site Descriptions (ESDs) that will be based on reference stream reaches within a Major Land Resource Area (MLRA). When the riparian ESDs become available, they will be located in the Colorado NRCS Field Office Technical Guide, Section II. Online at: https://www.nrcs.usda.gov/wps/portal/nrcs/site/co/home/ If reference reaches are not readily available for a particular stream type and setting, there are resources available which can help the user determine factors or conditions to expect in a healthy stream. The following documents may help find/describe the reference reach: Kittel, Gwen, Erika VanWie, Mary Damm, Reneé Rondeau, Steve Kettler, Amy McMullen, and John Sanderson. 1999. A
Classification of Riparian Wetland Plant Associations of Colorado: User Guide to the Classification Project. Colorado Natural Heritage Program, Colorado State University,Fort Collins, CO. 80523 Online at http://www.cnhp.colostate.edu/download/documents/1999/UserGuide.PDF

Stream Visual Assessment Protocol (version 2) Colorado
Page 11 of 60
Using This Protocol This protocol is intended for use in the field with the landowner. Conducting the assessment with the landowner provides an opportunity to discuss natural resource concerns and conservation opportunities. The Stream Visual Assessment Data Form (Appendix 1) provides a standardized form for recording information and data collected during both the preliminary and field portions of the assessment.
(a) Preliminary Watershed Assessment: Become familiar with watershed conditions before going to the assessment site. Stream conditions are influenced by the entire watershed including uplands that surround the assessment site. Changes in upland conditions can change the discharge, timing, or duration of stream-flow events that affect stream conditions. Aerial photographs, topographic maps, stream gage data, watershed reports and any other source of data available can be used to obtain information about watershed conditions. State agencies, watershed groups, local landowners, and federal land managers are likely to already have documented relevant information about watershed conditions. Ecoregion descriptions, size of the watershed (drainage area) and upland practices often explain conditions at the assessment site and are helpful for addressing some of the elements in SVAP2.
Gather land use information. To provide a context for the stream to be assessed and a better understanding of the conditions at the site. For example, road crossings and diversion structures may prevent movement of aquatic species. Mining, agriculture, and urbanization, all influence water quality and quantity as well as stream corridor condition.
Review available water resource information for the watershed and stream. Water control structures and/or activities outside of your assessment area may be affecting stream flow. Ask the landowner if he or she is aware of upstream withdrawals (e.g., surface diversions or pump stations), drains, or any features that affect the amount of instream flow during the year.
Review the Environmental Protection Agency’s Surf Your Watershed website: www.epa.gov/surf,
USGS Colorado Water Science Center website: https://co.water.usgs.gov/
Consult your state fish and wildlife agency regarding stream and riparian species likely to be present in the reach and whether fish passage to or from the area is appropriate.
Become familiar with potential riparian plant species and community types that are likely to occur in the study area. Refer to Appendix 2: Riparian Plant Guidebooks, and the plant lists or references associated to the reference reaches. For Colorado, the following is recommended: Kittel, Gwen, Erika VanWie, Mary Damm, Reneé Rondeau, Steve Kettler, Amy McMullen, and John Sanderson. 1999. A
Classification of Riparian Wetland Plant Associations of Colorado: User Guide to the Classification Project. Colorado Natural Heritage Program, Colorado State University,Fort Collins, CO. 80523 Online at http://www.cnhp.colostate.edu/download/documents/1999/UserGuide.PDF

Stream Visual Assessment Protocol (version 2) Colorado
Page 12 of 60
(b) Delineating the Assessment Area: The assessment area will include a representative stream reach which includes the riparian and active floodplain associated with each side of the stream. Definitions: Stream Reach is the length of the stream selected for monitoring. At a minimum, the length of the assessed stream reach should equal 12 times the bankfull channel
width, unless limited by property boundaries. Reach length is measured down the centerline of the stream. stream reach length = bankfull channel width x 12 The reach should be representative of the overall stream conditions within the planning area. It may
be necessary to complete more than one assessment if stream conditions (or stream types) vary across the planning area.
Bankfull Channel Width is the average stream width at the bankfull stage (the elevation where the stream flows overtop the active channel and spreads across the floodplain).
How to: Bankfull width is determined by locating the first flat depositional surface occurring above the bed of the stream. These are often the top of the point bars that form at the inside of meander bends; these provide the most consistent indicator of bankfull stage. Other indicators of bankfull elevation include (1) a break in slope on the bank, (2) vegetation changes or exposed roots, (3) a change in the particle size of bank material, and (4) wood or small debris left from high waters.
Identifying bankfull stage can be extraordinarily challenging in the arid southwest. For the purposes of this protocol, the bankfull width is primarily used for determining the assessment reach length; just use best judgment on identifying bankfull stage. A useful reference is: Moody, T., M. Wirtanen, and S.N. Yard. 2003. Regional Relationships for Bankfull Stage in Natural Channels of the Arid
Southwest, Natural Channel Design, Inc. Flagstaff, AZ. 38 p. http://www.naturalchanneldesign.com/NCD%20Reports.htm
Examples of determining bankfull stage
bankfull stage bankfull stage bankfull stage

Stream Visual Assessment Protocol (version 2) Colorado
Page 13 of 60
(c) Scoring the Assessment Elements There are 15 elements to assess in the SVAP2. Each element has a matrix that includes an element description with guidance on what to look for, and a range of scores based on condition quality or function. Element scores range from zero to ten, with higher scores representing a higher quality or function.
There are seven elements that are required to be assessed: The remaining elements will be completed if they are appropriate to the ecological setting of the stream. The element descriptions will assist in making this determination, but if a reference site is available it should be used to determine if an element applies. Where an element will not be assessed, enter “N/A” on the datasheet in the score column (do not enter a “0”) and make a note of the reasoning for the decision. Elements that are assessed will be assigned a score based on a comparison of the field observations and the element matrix. If the comparison matches more than one column of the matrix, then score the element based on the lower valued description. For example, when scoring the element Hydrologic Alteration, if bankfull flows occur according to the natural flow regime (Score 10 -9 column) but there is a water control structure present (Score 8-7 column), assign the score based on the lowest scoring indicator present within the reach, which in this case would be an 8 or 7. If there is difficulty matching descriptions, compare what you are observing to the conditions at the reference site (if available).
Each element has a benchmark score (current condition) and a planned score (anticipated score after restoration or enhancement). Estimating the planned score is optional, unless the landowner’s objectives include enhancing stream/floodplain health or a Resource Management System (RMS) is being planned where the benchmark score is below 5.0. Again, a minimum score of 5.0 is necessary to meet planning criteria.
If the score is less than 5.0 it represents a poor or severely degraded condition. Review the lowest scoring factors and determine which conservation practices can be implemented to bring the score up to 5.0 or higher. If the stream is complex, the planner may need to bring in additional disciplines to fully understand the situation.
If the score is 5.0 or higher and the landowner’s objective is to further improve habitat, the planner can develop practices to raise the lowest scoring factors and further improve the overall score. In order to address limiting factors for aquatic and riparian habitat, it is important to work on improving the lowest scoring factor first. If the stream is complex, the planner may need to bring in additional disciplines to fully understand the situation.
Quality Control. Due to the nature of a visual qualitative assessment, it is anticipated that there will be subtle subjective differences in scores between users. It is less critical to discern between +/- one point range than it is to ensure that the protocol be interpreted and applied consistently.
Timing of the Assessment. The SVAP2 ideally should be completed during base flows (low flows) when habitat features are likely to be most visible. Avoid completing the assessment during or 2-5 days after a precipitation event.
Required Element Resource Concern Bank Condition ▪Soil Erosion - Streambank ▪Water Quality – Sediment Riparian Quantity, ▪Water Quality - Stream Riparian Quality, Temperature Canopy Cover Barriers to Fish/ ▪Wildlife – Aquatic Habitat Aquatic Movement, Barriers Movement

Stream Visual Assessment Protocol (version 2) Colorado
Page 14 of 60
(d) Using the SVAP2 Data Form The complete assessment is recorded on the SVAP Data Form (Appendix 1) which consists of two principal sections: (1) Preliminary Watershed Assessment and (2) Field Assessment.
Section 1 records the preliminary information gathered about the watershed and the stream; understanding the basic stream and floodplain ecology of the site is necessary to evaluate many of the elements. Additionally, basic stream reach information gathered in the field is entered in this section. An estimate is provided by the user(s) on the reach’s bankfull width, stream reach length, slope gradient, streambank substrate, and other factors necessary to complete the assessment. This section must be completed prior to evaluating the elements.
Section 2 is used to record the scores of the assessment elements. A condensed version of the element matrix is included in the fill-able Excel version to provide a quick reference when filling-out the form in the field. The final page of Section 2 is the summary sheet which provides the overall SVAP2 score. The overall score is determined by adding the values for each element (total sum) divided by the number of elements assessed. The overall SVAP2 score provides an indicator of the environmental condition of the stream reach. This value can be used as a general statement about the "state of the environment" of the stream or (over time) as an indicator of trends in condition.
SVAP2 overall score Stream Condition
1 to 2.9 Severely Degraded 3 to 4.9 Poor 5 to 6.9 Fair 7 to 8.9 Good 9 to 10 Excellent
There is additional space provided on the summary sheet to include notes, photo point documentation, and recommendations. » A map of the assessment reach, showing reach location and the location of relevant elements such as water diversion points, failing banks etc. should be attached to the completed SVAP2 data form. The map is often handwritten field note.

Stream Visual Assessment Protocol (version 2) Colorado
Page 15 of 60
Photo 1: CEM Stage 1 - Stable channel condition.
Stream Assessment Elements Element 1. Channel Condition Description and Rationale. The shape of a stream channel changes constantly, imperceptibly or dramatically, depending on the condition of the stream corridor (channel, riparian area, and floodplain) and how it transports water and materials. Channel condition is a description of the geomorphic stage of the channel as it adjusts its shape relative to its floodplain. Channel adjustments resulting in a dramatic drop in streambed elevation (incision or degradation) or excessive deposition of bed load that raises the bed elevation (aggradation), affect the degree of bank shear and often decrease stream channel stability. Such channel adjustments can have substantial effects on the condition of streams, adjacent riparian areas, associated habitats, and their biota. For example, the greater the incision in a channel, the more it is separated from its floodplain, both physically and ecologically. Conversely, the greater the aggradation, the wider and shallower a stream becomes, which can affect riparian vegetation, surface water temperatures and stream and riparian habitat features.
Conceptual models of how a channel evolves, or adjusts over time illustrate the sequence of geomorphic changes in a stream that result from disturbances in the watershed. Such sequences are useful for evaluating trends in channel condition. The stages of the Schumm Channel Evolution Model (CEM), as shown in Figure 4, provide a visual orientation of the pattern of stream bed adjustment in an incising stream, its gradual detachment from the existing floodplain, and eventual formation of a new floodplain at a lower elevation. A similar model by Simon (1989) is also described in the Stream Corridor Restoration Handbook (FISRWG, 1998) available in most NRCS field offices.
Figure 4. Channel Evolution Model (CEM), after Schumm, Harvey and Watson, 1984.
Stage I channels are generally stable and have frequent interaction with their floodplains. The relative stability of the stream bed and banks is due to the fact that the stream and its floodplain are connected and flooding occurs at regular intervals. Consequently, the stream’s banks and floodplain are well-vegetated. Depositional areas (bars), if present, form a gradual transition into the active floodplain, as shown by the arrow in Photo 1.
I
II
III
IV
V
stable
incision
widening
stabilizing
stable terrace
flood plain
Elem
ent 1

Stream Visual Assessment Protocol (version 2) Colorado
Page 16 of 60
Photo 3: CEM stage III, bars adjacent to vertical banks
Land-use activities that increase runoff, such as land-clearing or channel straightening often result in channel incision processes characteristic of stage II in channel evolution. The height of the banks increases due to down cutting of the channel and the stream and floodplain have less frequent interaction. Bank vegetation becomes stressed and banks are prone to failure. Once failures begin, the channel widening of stage III begins. A Stage II channel is typically narrower at the bed relative to the depth (often referred to as low width-to-depth ratio) than a stage III channel. A stage II channel is in an active downward trend in condition and active head-cuts are often present (Photo 2).
During stage III, bank failures increase the formation of bars located next to the now relatively vertical banks. In stage III, alternating point bars are typically forming on opposite banks adjacent to vertical banks (Photo 3). Channel widening continues until the stream bed is wide enough to disperse stream flows and slow the water, beginning stage IV in channel evolution. Bank vegetation loss continues.
During stage IV, sediments begin to build up in the channel instead of moving downstream, aggrading the bed. Eventually, vegetation begins to establish in the sediment deposited along the edge of the stream, creating channel roughness and further slowing the flow. An early stage IV channel indicates relatively poor conditions, while a late stage IV channel indicates an improving trend in channel condition. At this stage, the stream has become more sinuous.
Alternating bar features are apparent.
Stage V begins when a new floodplain begins to form. Early in stage V, bank vegetation may not be fully established and some bank erosion is likely. In a late stage V, the original active floodplain from stage I is now a high terrace and the evolution of a stage I channel begins, with a new floodplain developing at a lower elevation than the terrace (Photo 4).
Keep this conceptual channel evolution model in mind as you visually assess the characteristics of the stream. In areas where heavy vegetation occurs naturally, eroded banks and slightly incised channels may be masked and consequently harder to observe. In these areas, try to observe bank features from a location near the channel bed.
Photo 2: CEM state II. Incised channel condition.
Photo 4: CEM stage V channel with developing floodplain (left) and “abandoned floodplain,” now a terrace, behind trees on right side of stream
terrace

Stream Visual Assessment Protocol (version 2) Colorado
Page 17 of 60
Element 1. Channel Condition Scoring Matrix
Natural, stable channel with established bank vegetation
If channel is incising (appears to be down cutting or degrading): ▪Evidence of past incision and some recovery; some bank erosion possible, ▪Active channel and flood plain are connected in most areas, inundated seasonally, ▪Stream banks may be low or appear to be steepening, ▪Top of point bars are below active floodplain and regeneration of preferred species is occurring. Stage I: Score 8 Stage V: Score 7–8 Stage IV: Score 6
▪Active incision evident; plants are stressed, dying or falling in channel, ▪Active channel appears to be disconnected from the floodplain, with infrequent or no inundation, ▪Steep banks, bank failures evident or imminent, ▪Point bars located adjacent to steep banks. Stage IV: Score 5 Stage III: Score 4 Stage II: Score 3
▪Headcuts or surface cracks on banks; active incision; vegetation very sparse, ▪Little or no connection between floodplain and stream channel and no inundation, ▪Steep streambanks and failures prominent, ▪Point bars, if present, located adjacent to steep banks. Stage II or III, score 2 to 0 depending on severity
▪No discernible signs of incision (such as vertical banks) or aggradation (such as very shallow multiple channels), ▪Streambanks low with few or no bank failures, ▪Active channel and floodplain are connected throughout reach and flooded at natural intervals, Stage I: Score 10 Stage V: Score 9 (if terrace is visible)
8 7 6 5 4 3 2 1 0 If channel is aggrading (appears to be filling in and is relatively wide and shallow): ▪Minimal lateral migration and bank erosion, ▪A few shallow places in reach, due to sediment deposits, ▪Minimal bar formation (less than 3).
▪Moderate lateral migration and bank erosion, ▪Deposition of sediments causing channel to be very shallow in places, ▪3–4 bars in channel.
▪Severe lateral channel migration and bank erosion, ▪Deposition of sediments causing channel to be very shallow in reach, ▪Braided channels (5 or more bars in channel).
10 9 8 7 6 5 4 3 2 1 0
I
II
III
IV
V
stable
incision
widening
stabilizing
stable terrace
flood plain

Stream Visual Assessment Protocol (version 2) Colorado
Page 18 of 60
What to look for:
Natural, stable channel with established bank vegetation. A score of 10 is appropriate for a stage I channel with a frequently inundated floodplain that often covers the width of the valley. A late stage V channel with a lower active (frequently flooded) floodplain, well-established vegetation on the banks, and a higher terrace (i.e. abandoned floodplain) from previous channel evolutions would score 9.
Channel appears to be incising (downcutting/degrading). The active channel and its floodplain are connected in most areas and inundated seasonally, and the top of the point bars are still below the elevation of the floodplain. Scores of 8, 7, or 6 indicate degrees of observable detachment between the channel and its floodplain.
Stage I or V channel that has an active, but less frequent than the natural interval out-of-bank flow into the floodplain (due to a slight channel incision), score an 8.
Stage V where active channel erosion is apparent on the outside of meanders and it is forming a new floodplain and out-of-bank flows still occur, score a 7.
Active bank erosion is causing sediment build up in the channel, forming depositional features of a stage IV channel (i.e. the channel is still adjusting its width), score a 6.
CEM stage I with slight incision. Score 8
CEM stage I. Score 10
pointbar is below banks
All banks low, stable & vegetated.
CEM stage V (late stage). Score 9
terrace. banks are stable and vegetated
frequently flooded, (connected) floodplain
V
stable terrace
I
stable
flood plain
CEM Stage V with erosion on the outside bend. Score 7
CEM Stage IV Score 6 (if bars adjacent to steep banks, Score 5)
I
stable
flood plain
V
stable terrace
IV
stabilizing
out-of-bank still occurs, often on the inside of the meander.
some bank erosion, but mostly stable. Showing slight incision.

Stream Visual Assessment Protocol (version 2) Colorado
Page 19 of 60
Channel is incising (downcutting/degrading). Active channel appears to be disconnected from the floodplain, with infrequent or no inundation of the floodplain. Riparian vegetation is compromised by lack of seasonal flooding and lowered water table. Scores of 5, 4, or 3 indicate degrees of incision.
Stage IV where active bank erosion is causing sediment build up in the channel forming depositional features, and has point bars formed adjacent to steep banks, score a 5. Stage III appears to be widening in areas of sediment build-up, score 4 to 0 (based on severity).
Stage II incised channel with tensile cracks or headcuts present, score 3 to 0 (based on severity).
Channel appears to be aggrading. Streams that once maintained single- or dual-threaded channel patterns, have converted to a braided system (three or more channels at bankfull discharge). They often have bank failure; appear excessively wide and shallow with multiple center bars, and lack pools. They may have lateral migration (the process of a stream shifting from side to side within a valley or other confinement) causing a lack of transported sediments downstream. Excessively aggraded systems are unstable and channel adjustments from side to side can be rapid.
Channel is wide and shallow and the banks are actively eroding. Extensive deposition such as center bars and side bars are present. The stream bed has a more consistent riffle-plane bed (i.e. less pool to riffle features). Bank vegetation is sparse. Pools that would have typically formed in the meander bend portion are shallow and featureless.
CEM Stage III. Score 4 to 0. CEM Stage II. Score 3 to 0.
Aggrading channel with ≤ 3 channels and min. lateral movement. Score 8-7
Aggrading channel with ≤ 3 channels with shallow areas. Score 6
Aggrading channel with 3-4 bars, with lateral migration evident. Score 5
II
incision
III
widening
more lateral migration with some shallow areas and/or some erosion.
banks and bar mostly stable

Stream Visual Assessment Protocol (version 2) Colorado
Page 20 of 60
Channel appears to be aggrading (cont.)
As you conclude assessment of this element of SVAP, remember that Channel Condition is of critical importance to overall stream health, yet difficult to visually assess accurately. Scores of less than 5 for channel condition may indicate substantial channel adjustments are occurring and a quantitative assessment by well-trained specialists is warranted.
Aggrading channel with 3-4 bars, with moderate lateral movement. Score: 4 - 3
Aggrading channel with ≥ 5 wide/shallow “braided” channels, with actively eroding streambanks. Score 2 - 0

Stream Visual Assessment Protocol (version 2) Colorado
Page 21 of 60
Element 2. Hydrologic Alteration Description and Rationale Hydrologic alteration is the degree to which hydrology and stream flow conditions differ from natural, unregulated flow patterns. Stream flow regime affects the distribution and abundance of stream species and influences the health of streams through several physical and chemical processes (Allan, 1995; Poff et al., 1997). Naturally occurring daily and annual flow variations provide ecological benefits to floodplain ecosystems and the aquatic and terrestrial organisms that depend upon them (Poff and Ward, 1989). With respect to fish, natural stream flow variations provide cues for spawning, egg hatching, rearing, and swimming to off-channel floodplain habitats for feeding or reproduction, and upstream or downstream migration (Junk et al., 1989).
The full range of stream flow at any point in a given watershed is essential in maintaining the complex physical and biological structures and functions of a stream corridor. The geometry, composition, and appearance of a stream channel and its adjacent floodplain are largely the result of fluvial processes that govern a dynamic equilibrium between stream flow, the materials it carries, and riparian vegetation (Lane, 1955; Leopold et al., 1964). Bankfull and higher flows are important factors that control stream channel shape and function and maintain physical habitat for animals and plants (Wolman and Miller, 1960). Generally, bankfull flow occurs every 1 to 2 years in unregulated alluvial rivers (Wolman and Leopold, 1957) and lasts for only a few days each year. However, numerous researchers have recorded bankfull flow return intervals greater than 2 years (Williams, 1978), especially in arid and semi-arid settings such as we experience in the southwestern US (Wolman and Gerson, 1978). Conversely, in regions dominated by frequent, prolonged rainfall, bankfull flow can occur once or twice yearly. Consequently, the 2-year event should be considered as only a coarse estimate of bankfull
flow. The reader is encouraged to seek additional assistance when working in streams where stream flow is generated by monsoonal precipitation or other extreme climatic events, or affected by significant flow regulation because of upstream reservoirs, pump plants, or diversions.
Water and land management practices that alter the timing, duration, magnitude, frequency, or rate of change of stream flow patterns can substantially alter riparian and instream habitat along regulated stream reaches (Calow and Petts, 1994). Water withdrawals, watershed and floodplain development, agricultural or wastewater effluents, and practices that change surface runoff (e.g., dikes and levees) or subsurface drainage (e.g., tile drainage systems) affect the amount and quality of water in a stream channel across the water year.
The effects of water withdrawals on aquatic resources and stream condition can usually be readily observed (especially during low-flow periods). However, augmenting stream flow with irrigation runoff or storm water from municipal areas also often results in adverse physical and biological impacts. For example, the total runoff volume from a one-acre parking lot is about 16 times that produced by an undeveloped acre of meadow (Schueler, 1994). Additionally, peak discharge, velocity, and time of concentration also increase significantly when natural landscapes are replaced by impervious surfaces (Booth, 1990). Further, urban runoff introduces pollutants to waterways, and often results in rapid physical deterioration and aquatic community changes (Booth and Jackson, 1997). Finally, heavy grazing and clearcutting often have similar, although typically less severe, effects (Platts, 1991; Jones and Grant, 1996).
Elem
ent 2

Stream Visual Assessment Protocol (version 2) Colorado
Page 22 of 60
Element 2. Hydrologic Alteration Scoring Matrix ▪Bankfull or higher flows occur according to the flow regime that is characteristic of the site, (generally every 1 to 2 years), and No dams, dikes, or development in the flood plain1], or water control structures are present, and natural flow regime2] prevails.
▪Bankfull or higher flows occur less often than the local natural flow regime (generally every 3 to 5 yrs), ▪Developments in the flood plain, water withdrawals, flow augmentation, or water control structures may be present, but do not significantly alter the natural flow regime2].
▪Bankfull or higher flows occur less often than the local natural flow regime (generally every 6 to 10 years), ▪Developments in the flood plain, stream water withdrawals, flow augmentation, or water control structures alter the natural flow regime2].
▪Bankfull or higher flows rarely occur, ▪Stream water withdrawals completely dewater channel; and/or flow augmentation, stormwater, or urban runoff discharges directly into stream and severely alters the natural flow regime2].
10 9 8 7 6 5 4 3 2 1 0 1] Development in the floodplain refers to transportation infrastructure (roads, railways), commercial or residential development, land conversion for agriculture or other uses, and similar activities that alter the timing, concentration, and delivery of precipitation as surface runoff or subsurface drainage. 2] As used here, “natural flow regime” refers to streamflow patterns unaffected by water withdrawals, floodplain development, agricultural or wastewater effluents, and practices that change surface runoff (dikes and levees) or subsurface drainage.
What to look for:
Ask the landowner about the frequency of bankfull or higher flows (i.e. flooding / floodplain inundation) and/or check stream gauge data (USGS Water Watch http://waterwatch.usgs.gov). Be cautious, reports of water in an adjacent field does not necessarily indicate natural flooding. The water may have flowed overland to a low spot or be a result of irrigation or drainage.
Look for field indicators of bankfull or higher flows: newly deposited debris (leaves, branches etc.) or high water marks (water stain lines) above the stream channel, and/or mud lines, sands and silts near the edge of the active channel. Another indicator is vegetation on channel bars; a plant community dominated by invasive species or seedlings less than two years old is a good indicator that higher flows have occurred in the last two years, or with some regularity. An absence of vegetation could be interpreted in the same manner, unless the stream is braided with excessive sand, gravel and/or cobble substrates and a notable lack of permanent vegetation).
Developments are any man-made features that alters streamflow or floodplain overflow (including those that alter the timing, concentration, or delivery). Including: dam/dikes (temporary or permanent), diversions, water control structures, ditches, stream water out-take structures (pump stations/flap gate/screw gate, etc.), and roads/railroads/urban development that restrict floodplain flow.
Concentrated flow is undispersed water flow; usually as overland flow of adjacent uplands, which is concentrated by a ditch, drain, or manipulated natural waterway that does not allow natural water dispersion across the riparian/floodplain. Generally these flows contain sediments and/or contaminants from areas beyond the stream corridor (e.g., confined feed lot, agricultural field, orchard, urban development, etc.). This may also include developed concentrated flows intended to by-pass water dispersal through the riparian area.
In many stream types (gradient ≤3%), stable and active beaver dams are a healthy component to the stream ecosystem; they can reduce water velocities thereby reducing erosion, and can promote inundation within the floodplain. Look for dams of mud and wood, and beaver cut trees.

Stream Visual Assessment Protocol (version 2) Colorado
Page 23 of 60
Element 3. Bank Condition
Description and Rationale Stable streambanks are essential components of functional physical habitat and unimpaired biological communities. An excess of fine sediment in streams impacts aquatic species assemblages (Waters, 1995), and results in significant water quality impacts with severe economic consequences (Pons, 2003). Simon et al. (2000) found that unstable streambanks can contribute as much as 85 percent of the total sediment yield in an entire watershed. Severely unstable streambanks can result in the loss of valuable farmland, force changes in water tables, and endanger transportation infrastructure and other floodplain features. Bank erosion is a natural mechanism in alluvial rivers, cannot be totally eradicated, and provides important physical and ecological functions to the evolution of stream channels and floodplains (Wolman and Leopold, 1957; Hooke and Redmond, 1992). Excessive bank erosion usually occurs where riparian areas are degraded or when a stream is unstable because of changes in land management practices, hydrology, sediment dynamics, or isolation from its floodplain. Bank failures are generally attributed to the interaction of fluvial and gravitational forces (Thorne, 1982)—high, steep banks with undercutting occurring at the base of the slopes are very prone to erosion or collapse. A healthy riparian corridor with a well-vegetated floodplain contributes to bank stability. The roots of some perennial grasses, sedges, and woody vegetation can help hold bank soils together and physically protect the bank from scour during bankfull and higher flow events. Therefore, the type of vegetation covering streambanks is an important component of bank stability. For example, many trees, shrubs, sedges, and rushes have the type of root masses capable of withstanding high streamflow events, while Kentucky bluegrass does not. Further, native riparian vegetation generally provides better erosion resistance and bank stability than invasive
species (Tickner et al., 2001). Finally, surface and subsurface soil types also influence bank stability. Banks with a thin soil cover over gravel or sand are more prone to collapse than are banks with deep, cohesive soil layers.
Unstable bank,
Stable bank,
Elem
ent 3

Stream Visual Assessment Protocol (version 2) Colorado
Page 24 of 60
Element 3. Bank Condition Scoring Matrix
Banks are stable: ▪ >75% protection of banks by deep binding plant roots, wood, vegetation or rock 1], ▪No erosion or bank failures, or effects are minimal (<5% of the bank reach affected), ▪No man-made structures present on the banks, ▪Recreational use and/or grazing do not negatively impact bank condition.
Banks moderately stable: ▪50-75% protection of banks by roots of natural wood, vegetation and/or rock 1], ▪Small or infrequent areas with erosion or bank failures often "healed over" (5-25% of the bank reach affected), ▪Limited number of structures present on bank, ▪Recreational use and/or grazing do not negatively impact bank condition.
Banks moderately unstable: ▪25-50% protection of banks by roots of natural wood, vegetation and/or rock 1], ▪Small or infrequent areas with erosion or bank failures often "healed over" (5-25% of the bank reach affected), ▪Structures cover more than half of reach or entire bank, ▪Recreational and/or livestock use are contributing to bank instability.
Banks are unstable: ▪<25% protection of banks by roots of natural wood, vegetation and/or rock, ▪25-50% of the banks within the reach have active bank erosion or bank failures, or have high erosion potential, ▪Structures dominate banks, ▪Recreational and/or livestock use are contributing to bank instability.
10 9 8 7 6 5 4 3 2 1 0
1] Natural wood and rock does not mean riprap, gabions, log cribs, or other fabricated revetments. 2] Bank failure refers to a section of streambank that collapses and falls into the stream, usually due to slope instability.
What to look for:
Evaluate the entire length of all banks along the assessment reach, and then consider the proportion of unstable to stable banks. Obviously, if a quantifiable portion of the reach shows signs of accelerated erosion or bank failures, bank stability is a problem and should be scored as such. Conversely, if the majority of the reach shows minimal erosion and no signs of bank failure, bank stability is likely good. Finally, it is best to score this element during the summer or whenever flows in your assessment reach are low.
Signs of erosion and possible bank stability problems include unvegetated stretches, exposed tree roots, and scalloped edges (sections of eroded bank between relatively intact sections).
When observing banks from within the active channel or below bankfull elevation, look for piping holes, rills, and or gullies. Each of these concentrated flow paths is associated with eventual bank stability problems or outright failures.
Look for tension cracks while walking along streambanks. Tension cracks will appear as vertical fissures or crevices running along the top of the streambank roughly parallel to the flow.
Evidence of construction, vehicular, or animal paths near banks or grazing areas leading directly to the water's edge suggest conditions that may lead to bank collapse.
Sections of streambank lying instream adjacent to existing banks are a telltale sign of active bank erosion and instability.

Stream Visual Assessment Protocol (version 2) Colorado
Page 25 of 60
Elements 4 and 5. Riparian Area Quantity and Quality Description and Rationale Riparian areas are the vegetated areas adjacent to stream channels that function as transitional areas between the stream and uplands. Riparian vegetation thrives on the moisture provided by stream flow and ground water associated with the stream corridor. Riparian areas may or may not include floodplains and associated wetlands, depending on the valley form of the stream corridor. For example, steep mountainous streams in narrow V-shaped valleys often do not have obvious floodplains. Riparian areas are among the most biologically diverse habitats of landscapes and they are sources of wood, leaves, and organic matter for the stream. These areas provide important habitat and travel corridors for numerous plants, insects, amphibians, birds, and mammals. Ecological processes that occur in the stream corridor are linked to those in uplands via intact riparian areas. Riparian areas themselves also provide valuable functions that maintain or improve stream and floodplain conditions. The capacity for riparian areas to sustain these functions depends in part on the quality and quantity of the riparian vegetation and how it interacts with the stream ecosystem. The quality of the riparian area increases with the width, complexity and linear extent of its vegetation along a stream. A complex riparian community consists of diverse plant species native to the site or functioning similarly to native species, with multiple age-classes providing vertical structural diversity suitable for the site.
Well-established and connected riparian areas provide critical functions for maintaining healthy, resilient stream ecosystems, which include:
Providing a vegetative filter for surface runoff, reducing pollutants and sediment entering streams, and no concentrated flow from upland areas;
Providing roughness that slows water and the erosive effects of floodwater; Providing root systems that bind soil, protect
streambank integrity, and build floodplain surfaces; Providing moisture, soil conditions, surface
macro-topography and micro-topography, and microclimates for a diversity of riparian plants, animals, and microorganisms; Providing shade or overhanging vegetation to
maintain cooler water temperatures for aquatic species; Providing large wood to forested stream
channels, which offers instream cover, creates pools, traps sediments, and provides habitat for stream biota; Providing organic material (leaves, twigs, grass)
and insects for stream and riparian food chains; Providing undercut banks important to fish for
hiding and resting; and Providing diverse, complex off-channel
habitats, such as backwaters, wetlands, and side channels formed by the interaction of streamflow, riparian vegetation, and often large wood. These areas of slower water provide critical refuge during floods for a variety of aquatic species, and serve as rearing areas for juvenile fish.
For these reasons, it is important to evaluate both the quantity and the quality of the riparian area, and score the riparian conditions of the entire stream within a property boundary. If the stream is too extensive to score using SVAP2, score only the assessment reach visually and use recent aerial photos (less than 2 years old) to score those riparian areas of the stream outside of the assessment reach. Score Elements 4 and 5 for all assessments.
Elem
ent 4
& 5

Stream Visual Assessment Protocol (version 2) Colorado
Page 26 of 60
Element 4. Riparian Area Quantity Scoring Matrix
Natural plant community (woody and herbacous) covers 90-100% of the entire active floodplain, along the stream assessment reach, and is primarily contiguous.
Natural plant community covers 75-90% of the entire active floodplain, along the stream assessment reach, and is generally contiguous: ▪Streamside vegetation gaps1] do not exceed 10% of the assessment reach length.
Natural plant community covers 50-75% of the entire active floodplain, along the stream assessment reach. ▪Vegetation gaps1] do not exceed 30% of the assessment reach length.
▪Natural plant community extends at least 1/3 of the bankfull width, or >25% of active floodplain along the stream assessment reach. ▪Vegetation gaps1] may exceed 30% of the assessment reach length.
▪Natural plant community extends less than 1/3 of the bankfull width, or <25% of active floodplain along the stream assessment reach. ▪Vegetation gaps1]
may exceed 30% of the assessment reach length.
10 9 8 7 6 5 4 3 2 1 0 1] Vegetation Gaps: lengths of streamside with no natural vegetation ecologically suitable for the site and/or vegetation is at a density uncharacteristic of the plant community.
Score each bank separately. Scores should represent the entire stream riparian area within the property. Score for this element = left bank score + right bank score /2. If the score of one bank is 7 or greater and the score of the other bank is 4 or less, subtract 2 points from final score. What to look for:
This element rates the extent of the riparian area on the property (length x width). Estimate the width of the vegetation area from the edge of the active channel outward to where natural riparian vegetation ends and other land-use/land cover begin.
Refer to “How to Determine Bankfull Width” on page 8.
Vegetation gaps have little to no natural vegetation. Including plants not ecologically suitable for the site and/or at a density uncharacteristic of the site. Gap percentage = (total length of gaps / the total length of the streambank) x 100. Note: Desirable natural gaps include: floodplain wetland/slough/oxbow, natural sand/gravel/cobble deposits, and native meadows.
For this element, “natural plant community” means one with species native to the site or introduced species that have become “naturalized” and function similarly to native species of designated reference sites, growing at densities characteristic of the site. Regional plant guidebooks are useful to have in the field for scoring this element.
Compare the width of the riparian area to the bankfull channel width. In steep, V- shaped valley forms there may not be enough room for a floodplain riparian area to extend as far as one or two active channel widths. In this case, a score may be adjusted to a higher value, based on reference site conditions.

Stream Visual Assessment Protocol (version 2) Colorado
Page 27 of 60
Element 5. Riparian Area Quality Scoring Matrix Natural plant community is dominated by Herbaceous Riparian Plants. Natural and diverse composition, density and appropriate age structure: ▪ 0-5% undesirable plant species present.
Natural and diverse composition, density and appropriate age structure: ▪ 5-25% undesirable plant species present.
Natural plant community compromised: ▪ 25-50% undesirable plant species present.
Natural plant community compromised: ▪ >50% undesirable plant species present.
10 9 8 7 6 5 4 3 2 1 0 Natural plant community is dominated by Woody Riparian Plants. Natural and diverse composition, density and appropriate age structure: ▪ 0-5% undesirable plant species present, ▪Regeneration of native, desirable trees and shrubs is appropriate for the site.
Natural and diverse composition, density and appropriate age structure: ▪ 5-25% undesirable plant species present, ▪Adequate regeneration of native, desirable trees and shrubs (5-10% composition of saplings/seedlings).
Natural plant community compromised: ▪ 25-50% undesirable plant species present, ▪Limited regeneration of native, desirable trees and shrubs (2-5% composition of saplings/seedlings).
Natural plant community compromised: ▪ >50% undesirable plant species present, ▪Little to no regeneration of native, desirable trees and shrubs (0-2% composition of saplings/seedlings).
10 9 8 7 6 5 4 3 2 1 0
Undesirable riparian species generally include noxious and invasive species. Score each bank separately. The average will be reported as a single score. Vigorously growing vegetation in the riparian area on both sides of the stream is important for healthy stream and riparian conditions. What to look for:
Plant species should be native or naturalized and consist of multiple structural layers (grasses and forbs, shrubs, and some trees). Forested sites should also have a diverse mix of shrubs, understory trees, and new shrub and tree regeneration. Early successional sites (recently disturbed by fire, tree harvesting, grazing, land clearing) should have representative native species (typically herbaceous, woody, and tree seedlings). Continually disturbed sites usually have only a few species and often these include non-native invasive species. As “early” vegetation matures, the structure of the plant community becomes more diverse with a multi-layer canopy. Finally, the plant community reaches a mature stage with regeneration, growth and mortality occurring in all layers. In forested streams, mature trees with potential for falling into the stream are present. Regional plant guidebooks are useful for scoring this element.
Identify noxious weeds as established by the Colorado Department of Agriculture at https://www.colorado.gov/pacific/agconservation/noxiousweeds. For this purpose, include Class A, B and C weeds, and the Watch List weeds.
Exposed soil surfaces are not protected from erosive forces by plants, litter/duff, downed woody material, or rock surface >2.5 inches. Exposed soil can be caused by soil conditions, human caused activities (including livestock grazing), wildlife damage, or by a dense canopy cover.
The type, timing, intensity, and extent of activities in riparian areas are critical in determining the impact on these areas. Score accordingly and note these in the summary sheet.

Stream Visual Assessment Protocol (version 2) Colorado
Page 28 of 60
Blank Page

Stream Visual Assessment Protocol (version 2) Colorado
Page 29 of 60
Element 6. Canopy Cover/Stream Shading
Description and Rationale In forested riparian areas, shading of the stream is important because it keeps water cool and limits algal growth. Cool water has a greater oxygen holding capacity than warm water. In many cases, when streamside trees are removed, the stream is exposed to the warming effects of the sun causing the water temperature to increase for longer periods during the daylight hours and for more days during the year. This shift in light intensity and temperature often causes a decline in the numbers of certain species of fish, insects, and other invertebrates and some aquatic plants. They may be replaced altogether by other species that are more tolerant of increased light intensity, lower dissolved oxygen, and warmer water temperature. For example, trout and salmon require cool, oxygen-rich water, and may rely on food organisms produced by detritus-based food chains. Loss of streamside vegetation that causes increased water temperature and decreased oxygen levels contributes to the decrease in abundance of trout and salmon from many streams that historically supported these species. Warm water species also benefit from canopy cover to keep streams from exceeding optimal temperatures. Increased light and the warmer water also promote excessive growth of submerged macrophytes (vascular plants) and algae that can cause a shift from a detritus-based to an algae-based food chain, thus altering the biotic community of the stream. Although some stream food webs are detritus-based, others (especially some warm water streams) are algae-based and require a certain amount of light to be naturally productive. Therefore, this element is particularly sensitive to the type of stream (stream class) and fish community that is being assessed and calibration of scoring may be necessary. Remember that many of the features of this element are highly affected by the degree of upstream shading. Therefore, the element is assessed for canopy over the entire property rather than at a single assessment reach. Choose the matrix appropriate for the stream and its
native fauna. For example, if the stream is a “trout stream,” use the matrix for Coldwater Streams. If the stream is naturally warmer than 70oF, use the matrix for warm water streams. »If the stream naturally has a herbaceous (non-woody) riparian plant community, then use the herbaceous matrix. A healthy herbaceous cover will overhang into the stream and the bank edge will often form a stable undercut, both of which provide the same benefits as mentioned for woody riparian canopy cover.
Elem
ent 6
Example: herbaceous riparian with healthy streambank vegetation that is overhanging into the stream.
Figure of a stable undercut.

Stream Visual Assessment Protocol (version 2) Colorado
Page 30 of 60
Element 6. Canopy Cover/Stream Shading Scoring Matrix: Natural plant community is dominated by Herbaceous Riparian Plants. >75% of the linear streambank, within the stream reach, has the water edge shaded by overhanging herbaceous vegetation or other natural features such as logs.
75–50% of the linear streambank, within the stream reach, has the water edge shaded by overhanging herbaceous vegetation or other natural features such as logs.
49–20% of the linear streambank, within the stream reach, has the water edge shaded by overhanging herbaceous vegetation or other natural features such as logs.
<20% of the linear streambank, within the stream reach, has the water edge shaded by overhanging herbaceous vegetation or other natural features such as logs.
10 9 8 7 6 5 4 3 2 1 0 Natural plant community is dominated by Woody Riparian Plants. >75% of water surface is shaded within the stream reach.
50–75% of water surface is shaded within the stream reach.
49–20% of water surface is shaded within the stream reach.
<20% of water surface is shaded within the stream reach.
10 9 8 7 6 5 4 3 2 1 0
What to look for:
For woody riparian plant communities, estimate the percent of the stream surface area that is shaded. This may require visual cover estimates at several points. Time of the year, time of the day, and weather can affect your observation of shading. Therefore, the relative amount of shade is estimated by assuming that the sun is directly overhead and the vegetation is in full leaf-out. To enhance accuracy of the assessment, aerial photographs taken during full leaf-out should be used to supplement your visual assessments.
For herbaceous riparian plant communities, estimate the percent of linear streambank with overhanging streambank vegetation or other natural features such as logs. Overhanging vegetation is often limited by activities such as livestock grazing, mowing, and rip rap.
Example: >75% Canopy Cover
shaded
Example: <5% Canopy Cover

Stream Visual Assessment Protocol (version 2) Colorado
Page 31 of 60
Element 7. Water Appearance Description and Rationale The water appearance assessment element compares turbidity, color, and other visual characteristics of the water with those of a reference stream. The assessment of turbidity is the depth to which an object can be clearly seen. Clear water indicates low turbidity. Cloudy or opaque water indicates high turbidity. Turbidity is caused mostly by particles of soil and organic and inorganic matter suspended in the water column. Streams often show some turbidity after a storm event because of soil and organic particles carried by runoff into the stream or suspended by turbulence.
Intrinsic characteristics of a watershed, such as geology and soils unaffected by human activities, should be considered as the reference conditions. For example, tea-colored water due to tannins from a natural process in bogs and wetlands may also affect clarity in some streams. Altered clarity due to natural processes would not receive low ratings.
Turbidity caused onsite, from upstream human affected activities, will receive the appropriate low ratings even though the cause of the turbidity may be out of the control of the landowner.
Element 7. Water Appearance Scoring Matrix
Very clear or clarity is appropriate to the site: submerged features in stream (rocks, wood) are visible at depths of 3 to 6 feet, ▪No motor oil sheen on surface or evidence of metal precipitates.
Slightly turbid, especially 2-5 days after a storm event, but clears afterwards: submerged features in stream (rocks, wood) are visible at depths of 1.5 to 3 feet, ▪No motor oil sheen on surface or evidence of metal precipitates.
Turbid most of the time: submerged features in stream are visible at depths of only .5 to 1.5 feet, and/or ▪Motor oil sheen is present on water surface, and/or ▪There is evidence of metal precipitates in stream.
Very turbid most of the time: submerged features in stream are visible only within .5 feet below surface, and/or ▪Motor oil sheen is present on the water surface or slackwater.
10 9 8 7 6 5 4 3 2 1 0
If the stream is not deep enough to evaluate using this approach (<3 ft deep), then score based on water appearance of the reference site.
What to Look For:
Turbidity. The deeper a submerged object in the water can be seen, reflects the amount of turbidity. This measure should not be taken 3-5 days after a storm or precipitation event, if the assessment occurs during this period document this on the data form.
Motor oil sheen. A stream should not smell like oil or have pronounced motor oil sheen on its surface.
Visual indictors of some low pH contaminants include the presence of metal precipitates on stream substrate. Common metal precipitates observed in streams under acidic conditions include iron, manganese, and aluminum which have a yellow (or orange or red), black, or white color, respectively. Metal precipitates, notably iron, can result in a thick floc that physically smothers biota and degrades habitat quality to the point that many fauna (particularly those species requiring interstitial spaces in rocks or accessible grazing surfaces to feed) are extirpated.
Elem
ent 7
Metal precipitates on substrates (low pH).

Stream Visual Assessment Protocol (version 2) Colorado
Page 32 of 60
Blank Page

Stream Visual Assessment Protocol (version 2) Colorado
Page 33 of 60
Element 8. Nutrient Enrichment Description and Rationale Nutrients are necessary for stream food webs by promoting algal and aquatic plant growth, which provide habitat and food for aquatic organisms. However, an excessive amount of algal and plant growth is detrimental to stream ecosystems. High levels of nutrients (especially phosphorus and nitrogen) lead to increased growth of algae and aquatic plants. Subsequently, respiration and decomposition of plant organic matter consume dissolved oxygen in the water, lowering the concentration of oxygen available to aquatic organisms, and possibly contributing to significant die-offs. A landowner may have seen fish gulping for air at the water surface during warm weather indicating a lack of dissolved oxygen. Streams respond differently
to nutrient loading. The presence of algal blooms - thick mats of algae and an overabundance of aquatic plants (i.e., macrophytes) - are often indicators that nutrients are high. However, the absence of such blooms may not always be indicative of low nutrient concentrations. Stream velocity, light availability, temperature and types of stable substrate present in a stream are important factors that affect algal and plant abundances. Water quality problems that arise from excess turbidity, herbicides, or salinity will also affect the abundance or absence of algae or macrophytes. If there is little or no algal growth, assess the factors described in the “what to look for” section, and summarize your findings accordingly.
Element 8. Nutrient Enrichment Scoring Matrix Slight to no algal growth present along the entire reach; clear water.
Moderate algal growth on substrates (i.e. streambed, submerged rocks, logs), ▪fairly clear or slightly greenish water.
Abundant algal growth on substrates, especially during warmer months and/or: ▪greenish water particularly in slow sections, ▪Slight odor of ammonia or rotten eggs, and/or ▪Sporadic growth of aquatic plants within slack water.
Thick algal mats dominating stream, and/or ▪Pea green water color, and/or ▪Strong odor of ammonia or rotten eggs and/or ▪Dense stands of aquatic plants widely dispersed.
10 9 8 7 6 5 4 3 2 1 0 What to look for:
Velocity: Streams with high velocity >.33 ft/sec and high concentrations of nutrients are typically not dominated by filamentous algae. Thus, the water may appear very clear yet still have high nutrient concentrations.
Light: If light is a limiting factor, due to shading from riparian vegetation, look for algal growth on rocks and boulders in reaches exposed to light.
Temperature: Most algae grow more rapidly at higher temperatures. Within a range of 32° F to 77° F, increasing temperature by 18° F typically doubles the rate of algal growth.
Substrate: Low complexity of substrate reduces filamentous algal growth.
Macrophyte Presence: The presence of dense stands of aquatic macrophytes may be an indicator of nutrient availability. Diversity within the aquatic plant community should be noted and considered. Some species typically associated with springs, such as water cress, may not be associated with heavy nutrient loading. Clear water and a diverse, dispersed aquatic plant community are optimal for this characteristic.
Elem
ent 8

Stream Visual Assessment Protocol (version 2) Colorado
Page 34 of 60
Blank Page
Stream Visual Assessment Protocol (version 2) Colorado
Page 35 of 60
Element 9. Manure or Human Waste Presence
Description and Rationale Manure and human waste increase nutrients and biochemical oxygen demand in streams which alter food webs and nutrient cycles of stream/riparian ecosystems. Ask the property manager if and when livestock have access to the stream. Manure from livestock contaminates water if livestock have direct
access to the stream or runoff from corrals, pastures, or paddocks is not diverted away from the stream. Similarly, wastewater piped or diverted directly to a stream is a health risk to aquatic species and humans. Score this element on the entire property and for all assessments.
Element 9. Manure or Human Waste Scoring Matrix
▪Livestock do not have access to stream, ▪No pipes or concentrated flows discharging animal waste or sewage directly into stream or its floodplain.
▪Livestock access to the stream is controlled and/or limited to small watering or crossing areas, ▪No pipes or concentrated flows discharging animal waste or sewage directly into stream or its floodplain.
▪Livestock have unlimited access to stream during some portion of the year, and/or ▪Manure is noticeable in stream, and/or ▪Pipes or concentrated flows discharge treated animal waste or sewage directly into stream.
▪Livestock have unlimited access to stream for a majority of the year, and/or ▪Manure is noticeable in stream and/or ▪Pipes or concentrated flows discharge untreated animal waste or sewage directly into stream.
10 9 8 7 6 5 4 3 2 1 0 What to look for:
Indications of livestock droppings in or adjacent to the stream channel.
Features such as fences, water gaps, and hardened crossings that limit livestock access to stream.
Areas with slow moving water and sunlight with unusually dense vegetation or algal blooms.
Pipes or concentrated flow areas that may be dumping livestock or human waste directly into the stream.
Elem
ent 9

Stream Visual Assessment Protocol (version 2) Colorado
Page 36 of 60
Blank Page

Stream Visual Assessment Protocol (version 2) Colorado
Page 37 of 60
Element 10. Pools Description and Rationale Regardless of the stream channel type, pools are important resting and feeding habitat for fish. Streams with a mix of shallow and deep pools offer diverse habitat for different species. In fish-bearing streams, a general rule of thumb to distinguish deep pools from shallow pools is this: a deep pool is 2 times deeper than the maximum depth of its upstream riffle, while a shallow pool is less than 2 times deeper than the maximum depth of its upstream riffle. This general rule may not apply to extremely high gradient streams, dominated by cascades, however. Continuous pools (those not separated by riffles, wood jams, rock “steps”, or fast-water) provide less diverse habitat and are indicative of poor stream structure and should not be considered for scoring in the first 3 boxes (only the last). Fish use such cover to rest, hide from predators, catch food items in the swirling currents that occur around submerged structures, and avoid territorial conflicts. Isolated pools occur when stream flows are so low that portions of the stream are essentially de-watered temporarily. If deep enough, these isolated
pools serve as refuges for stranded fish and other aquatic species until rains restore continuous flow in the system and re-connect the pools to their temporarily dry riffles. Fish are often limited by the amount of available cover in pools, such as submerged logs, boulders, tree roots and undercut banks. Stream alteration often reduces the amount and complexity of pools, thus degrading fish habitat. On the other hand, beavers often create pools in streams which may add habitat diversity and enhance pool habitats; however, their effects may also inundate riffles and other shallow water habitats. Thus, it is important to assess SVAP stream reaches in the correct context, i.e., in relation to local reference conditions. Remember, you are assessing representative reaches of streams throughout the area and if conditions should change dramatically within the property due to alteration, or other influences affecting the structure and function of the stream, additional reaches should be assessed.
Note: Only one pool morphology type (low gradient OR high gradient) should be used per assessment reach. Element 10. Pools.
Low-gradient streams (<2% slope)
▪More than two deep pools (>2.5 ft) separated by riffles, each with greater than 30% of the pool bottom obscured by depth, wood, or other cover, ▪Shallow pools also present.
▪One or two deep pools separated by riffles, each with greater than 30% of the pool bottom obscured by depth wood, or other cover, ▪At least one shallow pool present.
▪Pools present but shallow (<2 times maximum depth of the upstream riffle), ▪Only 10–30% of pool bottoms are obscured due to depth or wood cover.
▪Pools absent, but some slow water habitat is available ▪No cover discernible or ▪Reach is dominated by shallow continuous pools or slow water.
10 9 8 7 6 5 4 3 2 1 0 High-gradient streams (>2% slope)
▪More than three deep pools separated by boulders or wood, each with greater than 30% of the pool bottom obscured by depth, wood, or other cover.
▪Two to three deep pools, each with greater than 30% of the pool bottom obscured by depth wood or other cover; at least one shallow pool present. For small streams, pool
▪Pools present but relatively shallow, with only 10–30% of pool bottoms obscured by depth or wood cover. For small streams, pool bottoms may not be completely obscured by
▪Pools absent.
Elem
ent 1
0

Stream Visual Assessment Protocol (version 2) Colorado
Page 38 of 60
For small streams, pool bottoms may not be completely obscured by depth, but pools are deep enough to provide adequate cover for resident fish, ▪Shallow pools also present.
bottoms may not be completely obscured by depth, but pools are deep enough to provide some cover for resident fish. ▪At least one shallow pool also present.
depth, but pools are deep enough to provide minimal cover for resident fish. ▪No shallow pools present.
10 9 8 7 6 5 4 3 2 1 0
What to look for: Low-Gradient Streams (<2%) Scoring Matrix
The number of pools per assessment reach is estimated based on walking the stream or probing from the streambank with a stick or pole. You should find deep pools on the outside of meander bends. Pools are typically separated by riffles or other shallow water habitats. In drier climates, deep pools may be temporarily isolated from their riffles, yet still provide important refuge habitat. Pools are formed by obstructions in the stream channel such as fallen trees, accumulations of wood (jams), beaver dams, boulders, root wads, rocky outcrops, beaver dams, and accumulated plant debris.
Assess pool cover by estimating the percent of the pool bottom that is obscured by cover features, or depth, assuming you are positioned directly over the feature looking straight down at the stream bottom. In shallow, clear streams a visual inspection may provide an accurate estimate.
What to look for: High-Gradient Streams (>2%) Scoring Matrix
In high-gradient streams energy is dissipated by alternating slow and fast water conditions with step/pools and rapids/scour pools. Step/pools operate similar to stair steps with water dropping vertically over nearly complete channel obstructions (often a large rock and/or large wood) scouring out small depressions, or plunge pools (Hunter, 1991). Streams with step/pool conditions usually have gradients >4% and pools are spaced at 1 pool every 1.5 to 4 bankfull channel widths. Pool spacing decreases as gradient increases (Rosgen, 1996).
Streams with gradients between 2 and 4% are often rapids and lateral scour pool dominated. Scour pool spacing is typically 1 pool every 4 to 5 bankfull channel widths and is created by channel confinements and wood or sediments.
Plunge pools and scour pools are important aquatic habitat features providing resting and hiding cover for fish and aquatic species. With these pools, turbulence, large rock, wood, and the depth of water all contribute hiding cover for fish.

Stream Visual Assessment Protocol (version 2) Colorado
Page 39 of 60
Element 11. Barriers to Aquatic Species Movement Description and Rationale Most aquatic organisms move around their habitats, or undertake daily, seasonal, or annual migrations. For example, anadromous trout and salmon spawn and rear in freshwater, move to marine environments to grow to adulthood, and return to freshwater after a period of months or years to reproduce and die (Groot and Margolis, 1991). Other fish commonly use estuaries, river mouths, and the lower reaches of rivers within a span of a few days for feeding, sheltering, or as refuge from predators (Gross et al., 1988). Still others use headwater streams for spawning, and downstream lakes or rivers for feeding as they mature. Consequently, barriers that block the movement of fish or other aquatic organisms are important components of stream assessment.
Instream features or water management practices may create barriers that limit or prohibit the passage of aquatic organisms either seasonally or annually. Passage barriers may prevent the movement or migration of fish; deny access to important breeding or foraging habitats, and isolate populations of fish and other aquatic animals. Both natural and manmade barriers occur within river and stream systems, and natural physical barriers include waterfalls, cascades, and large rapids. Common manmade physical barriers include dams, diversions, culverts, weirs, excessively high grade control structures or buried sills with broad crests. Chemical and biological barriers such as water quality and quantity (e.g., temperature and low stream flows) and predation from non-native species also exist in many rivers across the United States. However, these types of passage problems are often seasonal and can be difficult to identify with limited field time and site-specific data.
Passage barriers are typically categorized by characteristics such as water velocity, water depth, and barrier height in relation to the passage requirements of a given species and/or life stage.
Three commonly-used barrier classes are: • Partial – impassable to some species or certain age classes all or most of the time;
• Temporary – impassable during some times to all or most species and/or age classes
(e.g., during low flow conditions);
• Complete – impassable to all fish at all times.
For example, a poorly designed or damaged culvert may be a temporary barrier to upstream migrating adults when flows are high because velocities within the culvert barrel exceed their natural swimming capabilities. Some highly migratory fishes like Pacific salmonids can leap six feet or more to bypass a waterfall, whereas shad in the same river will be faced with a complete barrier (Bell, 1990; Haro and Kynard, 1997). Many State and Federal Agencies have laws that are applicable to this element. Conservationists should become familiar with state-applicable regulations as part of the Preliminary Assessment. Score this element for all assessments.
Elem
ent 1
1

Stream Visual Assessment Protocol (version 2) Colorado
Page 40 of 60
Element 11. Barriers to Aquatic Species Movement Scoring Matrix When addressing this element, assess the entire stream length on the landowner’s property. Be sure to detail in the notes the species and life stages of aquatic organisms for which you are evaluating barriers.
No artificial barriers that prohibit movement of aquatic organisms during any time of the year.
Physical structures, water withdrawals and/or water quality seasonally restrict movement of aquatic species.
Physical structures, water withdrawals and/or water quality restrict movement of aquatic species throughout the year.
Physical structures, water withdrawals and/or water quality prohibit movement of aquatic species.
10 9 8 7 6 5 4 3 2 1 0 What to look for:
Note the presence of natural barriers along the assessment reach, their size.
Beaver dams generally do not prevent fish migration and should not be identified as passage barriers unless supporting information exists.
Livestock and/or equipment crossings can be passage barriers if water flows fast and shallow (less than 6 inches) across smooth or uniform surfaces at least half as wide (from upstream to downstream) as the bankfull width. For example, a 12-foot wide hardened vehicle ford that crosses a stream with a bankfull width of 20 feet is likely a temporary passage barrier.
Low-head dams are most likely temporary or complete barriers, especially if outfitted with a concrete apron that covers the streambed along the entire downstream face.
Culverts can be especially problematic to migratory aquatic organisms. Unless specifically designed with passage purposes in mind, most culverts are partial upstream passage barriers for the smallest life stages of native fish. Culverts should be scored as temporary or complete passage barriers if the culvert:
alignment doesn’t match the stream width is less than bankfull width slope is greater than channel slope is not countersunk is perched (elevated) above the outlet pool inlet is plugged with debris inlet or outlet shows sign of erosion or instability

Stream Visual Assessment Protocol (version 2) Colorado
Elements 12 / 13. Fish/Aquatic Invertebrate Habitat Complexity Description and Rationale Assessing Fish Habitat Complexity The dynamic features of stream corridors create diverse habitat types and conditions for fish and other aquatic species. Quality fish habitat is a mosaic of different types of habitats created by various combinations of water quality and quantity, water depth, velocity, wood, boulders, riparian vegetation, and the species that inhabit stream corridors. The greater the variety of habitat features, the more likely a stream is to support a diversity of aquatic species. Fish require these complex habitats with diverse types of hiding, resting, and feeding cover in parts of the stream and variable flow features. For example, deep pools (with slower currents) provide cover, thermal refuge, and a place to rest. Riffles (with faster currents) provide benthic invertebrates to prey on. Fast water is well-aerated, providing more oxygen to the stream ecosystem. The more types of different structural features, the more resilient the habitat is to natural disturbances (such as floods) as well as human perturbations (such as water withdrawals). The dynamic nature of instream habitat features assures fish and other species are able to find suitable areas to rear, feed, grow, hide, and reproduce during the course of their life histories. Fish habitat features: Logs/Large wood, deep pools, other pools (i.e. scour, plunge, shallow, pocket) overhanging vegetation, boulders, cobble, riffles, undercut banks, thick root mats, dense macrophyte beds, backwater pools, and other off-channel habitats
Description and Rationale Assessing Aquatic Invertebrate Habitat Four functional groups characterize the feeding functions of most aquatic invertebrates: shredders, collectors, grazers, and predators. Some species can be placed in more than one functional feeding group. The groups are typically present in all streams, although the dominance of groups will vary from headwater streams to larger streams and rivers. These functional feeding groups help predict the location and diverse substrate needs of specific invertebrates within the stream. Substrates are materials that provide a base for invertebrates to live and colonize. In a healthy stream, substrates are varied, free of sediment, abundant, and in place long enough to allow colonization by invertebrates. High stream velocities, high sediment loads, and frequent flooding may deplete substrate or cause it to be unsuitable habitat, at least temporarily until re-colonization occurs. Wood and riffle areas, with available boulders or cobbles, support the bulk of the invertebrate community in temperate streams (Benke et al., 1984). Wood typically supports a more diverse invertebrate community, while boulders and cobbles within riffles typically support higher numbers (abundance) of species. High numbers of habitat types for fish often equate to high invertebrate habitat types. The scale of habitat assessment is necessarily much smaller for invertebrates because their range of mobility limits the size of their habitat, or microhabitat. Therefore, an array of different types of habitat should be found within a smaller area of the reach. If the riparian area for the stream you are assessing naturally supports or should support woody vegetation, use Element 12a matrix. If the riparian area is or should be primarily herbaceous vegetation, use Element 12b matrix.
Elem
ent 1
2 &
13

Stream Visual Assessment Protocol (version 2) Colorado
Element 12. Fish Habitat Complexity Scoring 10 or more habitat features available, at least one of which is considered optimal in reference sites.
8 to 9 habitat features available.
6 to 7 habitat features available.
4 to 5 habitat features available.
Less than 4 habitat features available.
10 9 8 7 6 5 4 3 2 1 0 Element 13. Aquatic Invertebrate Habitat Complexity Scoring
At least 9 habitat features present, ▪A combination of wood with riffles should be present and suitable in addition to other types of habitat.
8 to 6 habitat features, ▪Site may be in need of more wood or reference habitat features and stable wood-riffle sections.
5 to 4 habitat features present
3 to 2 habitat features present
None to 1 habitat feature present
10 9 8 7 6 5 4 3 2 1 0 What to look for: Each habitat feature must be present in appreciable amounts to score. Features include:
Logs, large wood. Fallen trees or parts of trees that are submerged in the water and large enough to remain in the assessment reach during normal flows. Minimum 2/reach.
Small wood accumulations. Submerged accumulations of small wood pieces, twigs, branches, leaves, and roots. Though likely to be temporary components of stream habitats, their pieces will continue to provide structural complexity as the debris moves within the reach. Minimum 1/reach.
Deep pools. Areas of slow water with smooth surface and deep enough to provide protective cover for fish species likely to be present in the stream. Minimum 2/reach.
Secondary pools (i.e., scour, plunge, pocket pools) – pools formed by boulders or wood that divert water and scour depressions below turbulent flows. Minimum 4/reach.
Overhanging vegetation. Tree branches, shrub branches, or perennial herbaceous vegetation growing along the streambank and extending outward over the stream’s surface, providing shade and cover. Minimum 3/reach.
Large boulders. Submerged or partially submerged large rocks (> 20" diameter) Minimum 3/reach if no wood; minimum 2/reach if wood present.
Small boulder clusters. Groups of 2 or more smaller rocks (>10 inches and < 20 inches in diameter) interspersed relatively close together in the channel. Minimum 3/reach.
Cobble riffles. Fast, “bubbly” water flowing amongst and over small rocks between 2 and 10 inches in diameter. Minimum 2/reach.
Undercut banks. Water-scoured areas extending horizontally beneath the surface of the bank, forming underwater pockets used by fish for hiding and thermal cover. Minimum 3/reach or 25% of bank area.
Thick root mats. Mats of roots and rootlets, generally from trees but sometimes from mature dense shrubs at or beneath the water surface. Minimum 3/reach.
Macrophyte beds. Beds of emergent, submerged, or floating leaf aquatic plants thick enough to serve as cover. Minimum 1/reach.
Off-channel habitats. Side-channels, floodplain wetlands, backwaters, alcoves. Minimum 2/reach.

Stream Visual Assessment Protocol (version 2) Colorado
Element 14. Aquatic Invertebrate Community Description and Rationale This important element reflects the ability of the stream to support aquatic invertebrates such as crayfish, mussels, dragonflies, and caddisflies. However, successful assessments require knowledge of the life cycles of some aquatic insects and other macroinvertebrates and the ability to identify them. The presence of a diversity of intolerant macroinvertebrate species (pollution sensitive) indicates healthy, resilient stream conditions. Macroinvertebrates such as stoneflies, mayflies, and caddisflies are sensitive to pollution and do not tolerate polluted water. These intolerant orders of insects comprise Group I. Group II
macroinvertebrates are facultative, meaning they can tolerate limited pollution. This group includes damselflies, aquatic sowbugs, and crayfish. The dominant presence of Group III macroinvertebrates, including midges, craneflies and leeches without the presence of Group I, suggests the water is significantly polluted. The presence and abundance of only one or two species from Group I species in a reach community does not generally indicate diversity is good. As with all elements in the SVAP, comparisons with reference conditions, or those found in least-impaired streams in the area, are encouraged.
Element 14. Aquatic Invertebrate Community Scoring Matrix
▪Invertebrate community is diverse and well represented by Group I or intolerant species, ▪One or two species do not dominate.
▪Invertebrate community is well represented by Group II or facultative species, and Group I species are also present, ▪One or two species do not dominate.
▪Invertebrate community is composed mainly of Groups II and III and/or ▪One or two species of any group may dominate.
▪Invertebrate community composition is predominantly Group III species and/or ▪only one or two species of any group is present and abundance is low.
10 9 8 7 6 5 4 3 2 1 0
What to look for:
Figure 6 contains illustrations for each of the three groups of macroinvertebrates with the listing of invertebrate taxonomic order. This rating is qualitative and therefore potential biases should be avoided to provide accurate representation of each site.
Collect macroinvertebrates by picking up cobbles, gravel, leaf packs, silt, fine woody debris, and other submerged objects in the water. Sample all types of potential insect habitat (refer to Insect/Invertebrate Habitat Element) for an equal amount of time to reduce biases and improve accuracy.
A healthy and stable invertebrate community will be consistent in its proportional representation (evenness) of species, though individual species abundance may vary in magnitude. Note the kinds of macroinvertebrates (group type), approximate number of each species, and relative abundance of each species sampled. Determine if one or two species dominate the aquatic invertebrate community. An abundance of an individual species, such as caddisflies or snails, is often equated to a tolerance of stress and lower diversity.
Elem
ent 1
4

Stream Visual Assessment Protocol (version 2) Colorado

Stream Visual Assessment Protocol (version 2) Colorado

Stream Visual Assessment Protocol (version 2) Colorado
Blank Page

Stream Visual Assessment Protocol (version 2) Colorado
Element 15. Riffle Embeddedness Description and Rationale Embeddedness measures the degree to which gravel and cobble substrates are surrounded by fine sediment. It relates directly to the suitability of the stream substrate as habitat for macroinvertebrates, fish spawning, and egg incubation. Riffles are areas, often downstream of a pool, where the water is breaking over rocks, cobbles, gravel, or other
substrate material on the bed of a stream, causing surface agitation. Riffles are critical for maintaining high species diversity and abundance of insects for most streams and for serving as spawning and feeding grounds for some fish species. This element is sensitive to regional landscape differences and should therefore be related to locally established reference conditions.
Only assess this element if riffles or swift-flowing water and coarse substrates are a natural feature that should be present. Element 15. Riffle Embeddedness Scoring Matrix
Gravel or cobble substrates are <10% embedded
Gravel or cobble substrates are 10–20% embedded
Gravel or cobble substrates are 21–30% embedded
Gravel or cobble substrates are 31-–0% embedded
Gravel or cobble substrates are >40% embedded
10 9 8 7 6 5 4 3 2 1 0
What to look for:
This element should be used only in riffle areas and in streams where this is a natural feature.
The measure is the depth to which objects are buried by sediment. This assessment is made by picking up particles of gravel or cobble with your fingertips at the fine sediment layer. Pull the particle out of the bed and estimate what percent of the particle was buried.
Some streams have been so smothered by fine sediment that the original stream bottom is not visible. Test for complete burial of a streambed by probing with a measuring stick. Does substrate move easily when you move the substrate around with your feet? If not, substrate material is likely > 40% embedded.
Elem
ent 1
5

Stream Visual Assessment Protocol (version 2) Colorado
Blank Page

Stream Visual Assessment Protocol (version 2) Colorado
Element 16. Salinity Description and Rationale The origin of elevated salinity levels in streams is often associated with irrigation of salt laden soils, dryland crop/fallow systems that produce saline seeps, oil and gas well operations, and animal waste. Salt accumulation in streambanks can cause break down of soil structure, decreased infiltration
of water, and toxicity. High salinity in streams affects aquatic vegetation, macro-invertebrates, and fish. If observed impacts of salt are a product of natural weathering processes of soil and geologic material un-influenced by humans, this element should not be scored.
Element 16. Salinity Scoring Matrix Do not assess this element unless elevated salinity levels caused by people are suspected.
▪No wilting, bleaching, leaf burn, or stunting of riparian vegetation, ▪No streamside salt-tolerant vegetation present.
▪Minimal wilting, bleaching, leaf burn, or stunting of riparian vegetation, ▪Some salt-tolerant streamside vegetation.
▪Riparian vegetation may show significant wilting, bleaching, leaf burn, or stunting, ▪Dominance of salt-tolerant streamside vegetation.
▪Severe wilting, bleaching, leaf burn, or stunting; presence of only salt tolerant riparian vegetation, ▪Most streamside vegetation is salt tolerant.
10 9 8 7 6 5 4 3 2 1 0 What to look for:
High salinity levels can cause a “burning “or “bleaching” of riparian vegetation. Wilting, loss of plant color, discoloration of leaf margins, decreased productivity and stunted growth are visible signs.
Other indicators include whitish salt accumulations on streambanks and displacement of salt intolerant vegetation by more tolerant species.
Elem
ent 1
6

Stream Visual Assessment Protocol (version 2) Colorado
Literature Cited Allan, J.D. 1995. Stream Ecology: structure and function of running waters. Chapman and Hall, Inc., New York. Bell, M.C. 1990. Fisheries handbook of engineering requirements and biological criteria. Fish Passage
Development and Evaluation Program, U. S. Army Corps of Engineers, North Pacific Division. Portland, Oregon, 290 pp.
Benke, A. C., T. C. Van Arsdall, Jr., D. M. Gillespie, and F. K. Parrish. 1984. Invertebrate productivity in a subtropical blackwater river: the importance of habitat and life history. Ecological Monographs 54:25-63.
Booth, D.B. 1990. Stream-channel incision following drainage-basin urbanization. Water Resources Bulletin, 26: 407-417.
Booth, D.B. and C. R. Jackson, 1997, Urbanization of aquatic systems-degradation thresholds, stormwater detention, and limits of mitigation: Journal of American Water Resources Association: v. 33, no. 5, p. 1077-1090.\
Calow, P. and G.E. Petts. 1994. The Rivers Handbook: Hydrological and Ecological Principles; Volume One and Two, Blackwell Scientific Publications. Oxford, United Kingdom.
Forshay, K.J. and E.H. Stanley. 2005. Rapid nitrate loss and denitrification in a temperate river floodplain. Biogeochemistry 75:43-64.
Giller, P.S. and B. Malmqvist. 1998. The Biology of Streams and Rivers. Oxford University Press, Oxford, UK. 296 pages.
Groot, C., and L. Margolis. 1991. Pacific Salmon Life Histories. University of British Columbia Press. Vancouver, BC.
Gross, M.R., R.M Coleman, and R.M. McDowall. 1988. Aquatic productivity and the evolution of diadromous fish migration. Science 239: 1291-1293.
Gurnell, A. M., K.J. Gregory, and G. E. Petts. 1995. The role of coarse woody debris in forest aquatic habitats: implications for management. Aquatic Conservation 5:143-166.
Haro, A., and B. Kynard. 1997. Video evaluation of passage efficiency of American shad and sea lamprey in a modified Ice Harbor fishway. North American Journal of Fisheries Management 17:981–987.
Hooke, J.M. and C.E. Redmond. 1992. Causes and nature of river planform change. Pages 559- 571 in Dynamics of Gravel Bed Rivers, P. Billi et al. (Editors). John Wiley, New York, NY.
Hunter, C.J. 1991. Better Trout Habitat, a guide to stream restoration and management. Island Press, Washington D.C. 320 pp.
Jones, J.A. and G.E. Grant. 1996. Long-term stormflow responses to clearcutting and roads in small and large basins, western Cascades, Oregon. Water Resources Research. 32: 959-974.
Junk, W.J., P.B. Bayley and R.E. Sparks. 1989. The flood pulse concept in river-floodplain systems. Pp. 110-127, in: D.P. Dodge (ed.), Proceedings of the International Large River Symposium. Can. Spec. Publ. Fish. Aquat. Sci., 106.
Karr, J.R., K.D. Fausch, P.L. Angermier, P.R. Yant, and I.J. Schlosser.1986. Assessing biological integrity in running waters: a method and its rational. Illinois National History Survey. Special Publication 5, Champaign, IL.
Lane, E.W. 1955. The importance of fluvial geomorphology in hydraulic engineering. Proc. Am. Soc. Civ. Eng., 81(1).
Leopold, L. B. 1994. A View of the River. Harvard University Press, Cambridge, MA. 298 pages. Leopold, L.B., M.G. Wolman and J.P. Miller. 1964. Fluvial processes in geomorphology. W.H. Freeman and
Company, San Francisco, CA. Matthews, W.J. 1998. Patterns in freshwater fish ecology. Chapman and Hall, International Thompson Publishing,
New York, NY. Maxwell, J.R., C.J. Edwards, M.E. Jenson, S.J. Paustiam, H. Parrott, and D.M. Hill. 1995. A hierarchical

Stream Visual Assessment Protocol (version 2) Colorado
framework of aquatic ecological units in North America (Nearctic Zone). Forest Service, General Technical Report NC-176, North Central Forest Experiment Station, MN. 72 pp.
Meyer, J. L. 1997. Stream Health: Incorporating the Human Dimension to Advance Stream Ecology . Journal of the North American Benthological Society 16: New Concepts in Stream Ecology: Proceedings of a Symposium (Jun., 1997), pp. 439-447.
Montgomery, D.R. and J.R. Buffington. 1993. Channel classification, prediction of channel response, and assessment of channel condition. Report TFW-SH10-93-002 prepared for the SHAMW committee of the Washington State Timber/Fish/Wildlife Agreement. 84 pp.
Pearsons, T.N. , Li, H.W., and Lamberti, G.A. 1992. Influence of habitat complexity on resistance to flooding and resilience of stream fish assemblages. Transactions of the American Fisheries Society 121: 427-436.
Platts, W.S. 1991. Livestock grazing. p. 389-423. In: W.R. Meehan, (ed.), Influences of Forest and Rangeland Management on Salmonid Fishes and Their Habitats. American Fisheries Society Special Pub. 19. Bethesda, Md.
Poff, N.L. and J.V. Ward. 1989. Implications of streamflow variability and predictability for lotic community structure: A regional analysis of streamflow patterns. Canadian Journal of Fisheries and Aquatic Sciences 46: 1805-1817.
Poff, N.L., J.D. Allan, M.B. Bain, J.R. Karr, K.L. Prestegaard, B.D. Richter, R.E. Sparks, and J.C. Stromberg. 1997. The Natural Flow Regime: A paradigm for river conservation and restoration. Bioscience 47: 769-784.
Pons, L. 2003. Helping states slow sediment movement: A high-tech approach to Clean Water Act sediment requirements. Ag. Research Mag. 51(12): 12-14.
Rosgen, D.L. 1994. A classification of natural rivers. Catena, Vol. 22. pp. 169-199 Rosgen, D. 1996. Applied river morphology. Wildland Hydrology, Pagosa Springs, CO. 352 pages. Schlosser, I. J.1982. Fish community structure and function along two habitat gradients in a headwater stream.
Ecological Monographs 52: 395-414. Schueler, Thomas R. 1994. The importance of imperviousness. Watershed Protection Techniques. 1(3): 100-111. Schumm, S.A., Harvey, M.D., and Watson, C. C., (1984). Incised Channels: Morphology, Dynamics, and Control”,
Water Resource Publication, Littleton, Co. Simon, A., A. Curini, S.E. Darby, and E.J. Langendoen. 2000. Bank and near-bank processes in an incised
channel. Geomorphology 35(3-4): 193-217. Thorne, C.R. 1982. Processes and mechanisms of river bank erosion. Pages 227-259 in: Gravel-Bed Rivers, R.D.
Hey, J.C. Bathurst, and C.R. Thorne (Editors) John Wiley and Sons, Ltd., New York, NY. Tickner, D.P., P.G. Angold, A.M. Gurnell, and J.O. Mountford. 2001. Riparian plant invasions:
hydrogeomorphological control and ecological impacts. Progress in Physical Geography, 25(1): 22-52. U.S. Environmental Protection Agency (EPA), 2003, Level III ecoregions of the Continental United States
(revision of Omernik, 1987): Corvallis, Oregon, USEPA - National Health and Environmental Effects Research Laboratory, Map M-1, various scales
Waters, T.F. 1995. Sediment in streams: Sources, biological effects and controls. American Fisheries Society Monograph 7, Bethesda, Maryland.
Williams, G. P. 1978. Bankfull discharge of rivers. Water Resources Research 14:1141–1154. Wolman, M.G. and L.B. Leopold. 1957. River floodplains: Some observations on their formation. USGS
Professional Paper 282-C. U.S. Geological Survey, Washington, DC. Wolman, M.G. and J.P. Miller. 1960. Magnitude and frequency of forces in geomorphic processes. Journal of
Geology 68(1): 54-74. Wolman, M.G., and R. Gerson. 1978. Relative scales of time and effectiveness of climate in watershed
geomorphology. Earth Surface Processes and Landforms, 3: 189–208.

Stream Visual Assessment Protocol (version 2) Colorado
Glossary
Active channel width: The width of the stream at the bankfull discharge. Permanent vegetation generally does not become established in the active channel. Active floodplain: That part of a floodplain that is frequently inundated with water. Aggradation: Geologic process by which a stream bottom or flood plain is raised in elevation by the deposition of material. Alluvial: Deposited by running water, such as sediments. Bankfull discharge: The stream discharge (flow rate, such as cubic feet per second) that forms and controls the shape and size of the active channel and creates the floodplain. This discharge generally occurs once every 1.5 years on average. Bankfull flow: discharge where water just begins to leave the stream channel and spread onto the floodplain. Bankfull flow is roughly equivalent to channel-forming (conceptual) and effective (calculated) discharge for alluvial streams in equilibrium, and generally occurs every one to two years (on average). Bankfull stage: The stage at which water starts to flow over the flood plain; the elevation of the water surface at bankfull discharge Baseflow: The portion of streamflow that is derived from natural storage of precipitation that percolates to ground water and moves slowly through substrate before reaching the channel. Baseflow sustains streamflow during periods of little or no precipitation and is the average stream discharge during low flow conditions. Benthos: Bottom-dwelling or substrate-oriented organisms. Boulders: Large rocks measuring more than 10 inches across. Channel: With respect to streams, a channel is a natural depression of perceptible extent that periodically or continuously contains moving water. It has a definite bed and banks that serve to confine the stream’s water. Channel form: The morphology of the channel is typically described by (1) thread (single or multiple channels in valley floor), and sinuosity (amount of curvature in the channel). Channel roughness: Physical elements of a stream channel upon which flow energy is expended including coarseness and texture of bed material, the curvature of the channel, and variation in the longitudinal profile. Channelization: Straightening of a stream channel to make water move faster. Cobbles: Medium-sized rocks which measure 2.5 to 10 inches across. Confined channel: A channel that does not have access to a flood plain. Concentrated flow: Undispersed flow, usually flowing directly from an unbuffered area of overland flow; concentrated flow generally contains sediments and/or contaminants from areas beyond the stream corridor. Degradation: Geologic process by which a stream bottom is lowered in elevation due to the net loss of substrate material. Often called downcutting. Detritus: Materials such as leaves, twigs, or branches that enter a stream from the uplands or riparian area. Downcutting: See Degradation. Ecoregion: A geographic area defined by similarity of climate, landform, soil, potential natural vegetation, hydrology, or other ecologically relevant variables. Embeddedness: The degree to which an object is buried in steam sediment. Emergent plants: Aquatic plants that extend out of the water. Ephemeral stream: A stream with a channel that is above the water table at all times and thus carries water only during and immediately after a rain event. Floodplain: The level area of land near a stream channel, constructed by the stream in the present climate, and overflowed during moderate flow events (after Leopold, 1994). Flow augmentation: Artificially adding water to a stream channel with timing and magnitude that disrupts the natural flow regime. Examples include irrigation deliveries, trans-basin diversions, or wastewater from irrigated
Stream Visual Assessment Protocol (version 2) Colorado
lands, treatment plants, or commercial facilities. Fluvial: A feature of or pertaining to the action of moving water. Forb: Any broad-leaved herbaceous plant other than those in the Gramineae (Poceae), Cyperacea, and Juncaceae families (Society for Range Management1989). Gabions: A wire basket filled with rocks; used to stabilize streambanks and control erosion. Geomorphology: The study of the evolution, process, and configuration of landforms. Glacial Flour: Finely powdered rock, produced produced by the motion of glaciers. Glide: A fast water habitat type that has low to moderate velocities, no surface agitation, and a U-shaped, smooth, wide bottom. Gradient: Slope calculated as the amount of vertical rise over horizontal run expressed as ft/ft or as percent (ft/ft * 100). Grass: An annual to perennial herb, generally with round erect stems and swollen nodes; leaves are alternate and two-ranked; flowers are in spikelets each subtended by two bracts. Gravel: Small rocks measuring 0.825 to 2.5 inches across. Habitat: The area or environment in which an organism lives. Herbaceous: Plants with non-woody stems. Hydrology: The study of the properties, distribution, and effects of water on the Earth's surface, soil, and atmosphere. Hyporheic: Below the surface of the streambed, including interstitial spaces. Incised channel: A channel with a streambed lower in elevation than its historic elevation in relation to the flood plain. Intermittent stream: A stream that flows only certain times of the year, such as when it receives water from springs, groundwater or surface runoff. Lateral migration: The adjustment of a stream channel from side to side often involving the recession of a streambank. In a braided river system both streambanks may be recessing due to excessive channel filling and limited bedload transport capabilities, e.g. Photo 15. Macrophyte bed: A dense mat of aquatic plants. Macrotopography: Depositional features within a floodplain developed by water flow and greater than 6 inches than the average land surface of the floodplain. Microtopography: Features within a floodplain developed by water flow and less than 6 inches than the average land surface of the floodplain. Meander: A winding section of stream with many bends that is at least 1.2 times longer, following the channel, than its straight-line distance. A single meander generally comprises two complete opposing bends, starting from the relatively straight section of the channel just before the first bend to the relatively straight section just after the second bend. Macroinvertebrate: A spineless animal visible to the naked eye or larger than 0.5 mm. Natural flow regime: the full range of daily, monthly, and annual streamflows critical to sustaining native biodiversity and integrity in a freshwater ecosystem. Important flow regime characteristics include natural variations in streamflow magnitude, timing, duration, frequency, and rates of change (see Poff et al. 1997 for further detail). Nickpoint: The point where a stream is actively eroding (downcutting) to a new base elevation. Nickpoints migrate upstream (through a process called headcutting). Oligotrophic: Having little or no nutrients and thus low primary production. Perennial stream: A steam that typically flows continuously throughout the year. Point bar: A gravel or sand deposit on the inside of a meander; actively mobile deposits. Pool: Deeper area of a stream with slow-moving water. Reach: A section of stream (defined in a variety of ways, such as the section between tributaries or a section with consistent characteristics).

Stream Visual Assessment Protocol (version 2) Colorado
Riffle: A shallow section in a stream where water is breaking over rocks, wood, or other partly submerged debris and producing surface agitation. Riparian Areas: Riparian areas are transitional areas between terrestrial and aquatic ecosystems and are distinguished by gradients in biophysical conditions, ecological processes, and biota. They are areas through which surface and subsurface hydrology connect waterbodies with their adjacent uplands. They include those portions of terrestrial ecosystems that significantly influence exchanges of energy and matter with aquatic ecosystems. Riprap: Rock material of varying size used to stabilize streambanks and other slopes. Run: A fast-moving section of a stream with a defined thalweg and little surface agitation. Scouring: The erosive removal of material from the stream bottom and banks. Sedge: A grass-like, fibrous-rooted herb with a triangular to round stem and leaves that are mostly three-ranked and with close sheaths; flowers are in spikes or spikelets. Stormwater runoff: overland runoff from a precipitation event not absorbed by soil, vegetation, or other natural means. Substrate: The mineral or organic material that forms the bed of the stream; the surface on which aquatic organisms live. Surface fines: That portion of streambed surface consisting of sand/silt (less than 6 mm). Thalweg: The line followed by most of the streamflow. The line that connects the lowest or deepest points along the streambed. Turbidity: Murkiness of water caused by particles, such as fine sediment and algae. Water control structures: any physical feature located in or adjacent to a stream used to control the direction, magnitude, timing, and frequency of water for instream or out-of-stream uses. Examples include dams, pumps, water treatment or power plant outfalls, gated culverts, standpipes, subsurface drains, and ring wells. Watershed: A ridge of high land dividing two areas that are drained by different river systems. The land area draining to a waterbody or point in a river system; catchment area, drainage basin, drainage area.

Stream Visual Assessment Protocol (version 2) Colorado
References Appendix 1 – Stream Visual Assessment Protocol Data Form An Excel format with fill-able entry and autocalculation is available as a separate document.
Appendix 2 – Additional References f or Further Reading Aquatic Invertebrates and Habitat Benke, A. C. and J. B. Wallace. 2003. Influence of wood on invertebrate communities in streams and rivers. Pages
149-177 in S. V. Gregory, K. L. Boyer and A. Gurnell, editors. The Ecology and Management of Wood in World Rivers. American Fisheries Society, Bethesda, MD.
Gregory, Brian M. 2005. Microhabitat Preferences by Aquatic invertebrates Influence Bioassessment Metrics in Piedmont Streams of Georgia and Alabama. Proceedings of the 2005 Georgia Water Resources Conference.
Taylor, C. A., M. L. Warren, J. F. Fitzpatrick, H. H. Hobbs, R. F. Jezerinac, W. L. Pflieger, and H. W. Robison. 1996. Conservation status of crayfishes of the United States and Canada. Fisheries 21(4): 25-38. Vannote, R.L., G.W. Minshall, K.W. Cummins, J.R. Sedell, and C.E. Cushing. 1980 “The River Continuum
Concept”. Canadian Journal of Fisheries and Aquatic Sciences 37(1):130-137 Bank Condition Belsky, A. J., A. Matzke, and S. Uselman. 1999. Survey of livestock influences on stream and riparian ecosystems
in the Western United States. Journal of Soil Water Conservation 54:419-431. Clary, W. P., and J. W. Kinney. 2002. Streambank and vegetation response to simulated cattle grazing. Wetlands
22:139-148. Hooke, J.M. 1979. An analysis of the processes of river bank erosion. Journal of Hydrology. 42: 39-62. Hooke, J.M. 1980. Magnitude and distribution of rates of river bank erosion. Earth Surfaces and Processes. 5:
143-157. Kauffman, J.B., and Krueger, W.C., 1984, Livestock impacts on riparian ecosystems and streamside management
implications—a review: Journal of Range Management, 37: 430-438. Lawler, D. M. 1993. The measurement of river bank erosion and lateral channel change: A review. Earth Surface
Processes and Landforms 18: 777-821. Trimble, S.W. 1997. Contribution of stream channel erosion to sediment yield from an urbanizing watershed.
Science 278: 1442-1444 Waters, T. F. 1995. Sediment in Streams: Sources, Biological Effects, and Control. American Fisheries Society
Monograph 7., Bethesda, MD. Barriers to Aquatic Species Movement Clay, C.H. 1995. Design of Fishways and Other Fish Facilities. Second Edition. CRC Press, Inc. Boca Raton, FL.
248 pp. Graf, W. L. 1999. Dam nation: A geographic census of American dams and their large-scale hydrologic impacts.
Water Resources Research 35:1305-1311. Gross, M.R., R.M Coleman, and R.M. McDowall. 1988. Aquatic productivity and the evolution of diadromous fish
migration. Science 239: 1291-1293 Jungwirth, M., S. Schmutz, and S. Weiss, editors. 1998. Fish Migration and Fish Bypasses. Fishing News Books,
Oxford, UK. 438 pp. Lang, M., M. Love, and W. Trush. 2004. Improving fish passage at road crossings. Final report to the National
Marine Fisheries Service, produced in cooperation with Humboldt State University Foundation under NMFS contract 50ABNF800082. Arcata, CA. 128 pp.
Monk, B., Weaver, D., Thompson, C. & Ossiander, F. 1989. Effects of flow and weir design on the passage behavior of American shad and salmonids in an experimental fish ladder. North American Journal of Fisheries Management 9: 60–67.
NRCS. 2006. Fish passage and screening designs. Technical Supplement 14-N to NEH-654 – Stream Restoration

Stream Visual Assessment Protocol (version 2) Colorado
Design Handbook. Taylor, R.N. and M. Love. 2003. Fish passage evaluation at stream crossings. Part IX in: California Stream
Habitat Restoration Manual, 3rd edition, 1998. Prepared by G. Flosi, S. Downie, J. Hopelain, M. Bird, R. Coey, and B. Collins. Sacramento, CA. 100 electronic pp.
Washington Department of Fish and Wildlife (WDFW). 2000. Fishway guidelines for Washington State. Olympia, WA. 57 pp.
WDFW. 2000. Fish passage barrier and surface water diversion screening and prioritization manual. WDFW Habitat Program, Environmental Restoration Division, Salmon Screening, Habitat Enhancement and Restoration Section, Olympia, WA. 158 pp.
WDFW. 2003. Design of road culverts for fish passage. Olympia, WA. 110 pp. Channel Condition Leopold, L. B. 1994. A View of the River. Harvard University Press, Cambridge, MA. Leopold, L. B., Wolman, M. G., and Miller, J. P. 1964. Fluvial processes in geomorphology. W. H. Freeman and
Company, San Francisco. Schumm, S.A., M.D. Harvey, and C.C. Watson. 1984. Incised Channels: Morphology, Dynamics and Control.
Water Resources Publications. Digital Keys to Aquatic Insects Digital Key to Aquatic Insects. http://www.waterbugkey.vcsu.edu/ Fish Habitat Complexity Allan, J. D., and A. S. Flecker. 1993. Biodiversity conservation in running waters. BioScience 43:32-43 Bayley, P. B. 1991. The flood pulse advantage and the restoration of river-floodplain systems. Regulated Rivers:
Research and Management 6: 75-86 Dolloff, C. A. and M. L. Warren, Jr. 2003. Fish relationships with large wood in small streams. Pages 179-193 in S.
V. Gregory, K. L. Boyer and A. Gurnell, editors. The Ecology and Management of Wood in World Rivers. American Fisheries Society, Bethesda, MD.
Fausch, K.D., C.L. Hawkes, and M.G. Parsons. 1988. Models that predict standing crop of stream fish from habitat variables: 1950-85. Gen. Tech. Rept. PNWGTR-213. U.S. Dept. Agriculture, Forest Service, Pacific Northwest Research Station, Portland, Oregon. 52 p.
Fausch, K. D., C. E. Torgerson, C. V. Baxter, and H. W. Li. 2002. Landscapes to riverscapes: bridging the gap between research and conservation of stream fishes. Bioscience 52: 483-498.
FISRWG (Federal Interagency Stream Restoration Working Group). 1998. Stream Corridor Restoration: Principles, Processes and Practices. National Technical Information Service, U. S. Department of Commerce, Springfield, VA. Also published as NRCS, U.S. Department of Agriculture (1998) Stream Corridor Restoration: Principles, Processes, and Practices. National Engineering Handbook (NEH), Part 653. Washington, D.C.
Gregory, S. V., K. L. Boyer, and A. Gurnell. 2003a. The Ecology and Management of Wood in World Rivers. American Fisheries Society, Bethesda, MD.
.Hawkins, C.P., R.H. Norris, J.N. Hogue, and J.W. Feminella. 2000. Development and evaluation of predictive models for measuring the biological integrity of streams. Ecological Applications 10:1456-1477.
Junk, W.J., P.B. Bayley, and R.E. Sparks. 1989. The flood pulse concept in river-floodplain systems. Pages 110-127 in D. P. Dodge, editor. Proceedings of International Large River Symposium (LARS), Toronto, Ontario, September 14-21, 1986. Canadian Special Publication of Fisheries and Aquatic Sciences.
Karr, J. R., K.D. Fausch, P.L. Angermeier, P.R. Yant, and I.J. Schlosser. 1986. Assessing Biological Integrity in Running Waters: A Method and its Rationale. Special Publication 5. Illinois Natural History Survey, Champaign.
Maser, C. and J. R. Sedell. 1994. From the Forest to the Sea: The Ecology of Wood in Streams, Rivers, Estuaries , and Oceans. St. Lucie Press, Delray Beach, FL.
Poff, N. L., and J. V. Ward. 1990. Physical habitat template of lotic systems: recovery in the context of historical pattern of spatiotemporal heterogeneity. Environmental Management 14: 629-645.

Stream Visual Assessment Protocol (version 2) Colorado
Poff, L. N., J. D. Allan, M.B. Bain, J. R. Karr, K. L. Prestegaard, B. D. Richter, R. E. Sparks, and J. C. Stromberg. 1997. The natural flow regime: a paradigm for river conservation and restoration. Bioscience 47(11):769-784.
Reich, M., J. L. Kershner, and R. C. Wildman. 2003. Restoring streams with large wood: a synthesis. Pages 355-366 in S. V. Gregory, K. L. Boyer and A. Gurnell, editors. The Ecology and Management of Wood in World Rivers. American Fisheries Society, Bethesda, Maryland.
Schlosser, I. J. 1987. A conceptual framework for fish communities in small warmwater streams. In W. J. Matthews and D. C. Heins, editors. Community and Evolutionary Ecology of North American Stream Fishes. Norman, Oklahoma and London: University of Oklahoma.
Sedell, J.R., G.H. Reeves, F.R. Hauer, J.A. Stanford and C.P. Hawkins. 1990. Role of refugia in recovery from disturbances: modern fragmented and disconnected river systems. Environmental Management 14:711-724
Shields, F. D., Jr. and Milhous, R. T. 1992. Sediment and aquatic habitat in river systems. Final Report, American Society of Civil Engineers Task Committee on Sediment Transport and Aquatic Habitat. Journal of Hydraulic Engineering 118(5):669-687.
Shields, F. D., Jr., Knight, S. S., and Cooper, C. M. 1998. Rehabilitation of aquatic habitats in warmwater streams damaged by channel incision in Mississippi. Hydrobiologia 382:63-86.
Townsend, C. R. 1989. The patch dynamics concept of stream community ecology. Journal of the North American Benthological Society 8:36-50.
USEPA (U. S. Environmental Protection Agency). 2000. Water Quality Conditions in the United States: The 1998 National Water Quality Inventory Report to Congress. Report No. EPA841-R-00-001,US EPA, Washington, D. C.
Vannote, R.L., Minshall, G. W., Cummins, K. W., Sedell, J. R., and Cushing, C. E. 1980. The river continuum concept. Canadian Journal of Fisheries and Aquatic Sciences 37(1):130-137.
Wang, L. and Lyons, J. 2003. Fish and benthic macroinvertebrate assemblages as indicators of stream degradation in urbanizing watersheds. In T. P. Simon (ed.), Biological response signatures: indicator patterns using aquatic communities. Regulated Rivers: Research & Management. 17:311-323.
Ward, J.V. and J.A. Stanford. 1983. The intermediate disturbance hypothesis: an explanation for biotic diversity patterns in lotic ecosystems. Pages 347-356 in T.D. Fontaine and S.M. Bartell, editors. Dynamics of lotic ecosystems. Ann Arbor Press, Ann Arbor, MI, USA.
White, D. S. 1993. Perspectives on defining and delineating hyporheic areas. Journal of the North American Benthological Society 12:61-69.
Williams, J. E., J. E. Johnson, D. A. Hendrickson, S. Contreras-Balderas, J. D. Williams, M. Navarro-Mendoza, D. E. McAllister, and J. E. Deacon. 1989. Fishes of North America endangered, threatened, or
of special concern. Fisheries 14: 3-20. Williams, J. D., M. L. Warren Jr., K. S. Cummings, J. L. Harris, and R. J. Neves. 1993. Conservation status of freshwater mussels of the United States and Canada. Fisheries 18: 6-22. Yount, J. D., and G. J. Niemi. 1990. Recovery of lotic communities and ecosystems from disturbance--a narrative
review of case studies. Environmental Management 14:547-569. Hydrologic Alteration Andrews, E.D., 1984. Bed-material Entrainment and Hydraulic Geometry of Gravel-Bed Rivers in Colorado.
Geological Society of America Bulletin 95, 371-378. Gore, J.A. and G.E. Petts. 1989. Alternatives in Regulated River Management. CRC Press, Inc. Boca Raton,
Florida. Gregory, S.V., F.J. Swanson, W.A. McKee, and K.W. Cummins. 1991. An ecosystem perspective of riparian
areas. Bioscience 41: 540-551. Hill, M.T., W.S. Platts, and R.L. Beschta. 1991. Ecological and geomorphological concepts for instream and out-
of-channel flow requirements. Rivers 2(3): 198-210. Hynes H.B.N. 1975. The stream and its valley. Verhandlungen, Internationale Vereinigung fur theoretische und
Aufewandte Limnologie 19:1-15. Jackson, W. L.; Beschta, R. L. 1992. Instream flows for rivers: maintaining stream form and function as a basis for
protecting dependent uses. In: Jones, M. E.; Laeanen, A., eds. Interdisciplinary approaches in hydrology and hydrogeology. St. Paul, MN: American Institute of Hydrology: 524–53.

Stream Visual Assessment Protocol (version 2) Colorado
Ligon, F. K., W. E. Dietrich and W. J. Trush. 1995. Downstream ecological effects of dams. Bioscience 45 (3): 183-192.
Middleton, B. A. 2002. Flood Pulsing in Wetlands: Restoring the Natural Hydrological Balance. John Wiley and Sons, New York, NY.
Molles, M. C., C. S. Crawford, L. M. Ellis, H. M. Valett, and C. N. Dahm. 1998. Managed flooding for riparian ecosystem restoration. BioScience 48: 749-756.
Nesler, T.P., R.T. Muth, and A.F. Wasowicz. 1988. Evidence for baseline flow spikes as spawning cues for Colorado Squawfish in the Yampa River, Colorado. American Fisheries Society Symposium 5: 68-79.
Platts, W.S. and R.L. Nelson. 1985. Impacts of rest-rotation grazing on stream banks in forested watersheds in Idaho. North Amer. J. Fisheries Manage. 5: 547-556.
Power, M. E., A. Sun, G. Parker, W. E. Dietrich and J. T. Wootton. 1995. Hydraulic food chain models. BioScience 45: 159-167.
Resh, V.H., A.V. Brown, A.P. Covich, M.E. Gurtz, H.W. Li, G.W. Minshall, S.R. Reice, A.L. Sheldon, J.B Wallace and R. Wissmar. 1988. The role of disturbance in stream ecology. Journal of the North
American Benthological Society 7: 433-455. Richter, B.D., J.V. Baumgartner, J. Powell, and D.P. Braun. 1996. A method for assessing hydrologic alteration
within ecosystems. Conservation Biology 10: 1163-1174. Schlosser, I.J. 1985. Flow regime, juvenile abundance, and the assemblage structure of stream fishes. Ecology
66:1484-1490. Schmidt, Larry J.; Potyondy, John P. 2004. Quantifying channel maintenance instream flows: an approach for
gravel-bed streams in the Western United States. General Technical Report RMRS-GTR-128. Fort Collins, CO: U.S. Department of Agriculture, Forest Service, Rocky Mountain Research Station. 33 pp.
Simon, A. 1989. A model of channel response in distributed alluvial channels. Earth Surface Processes and Landforms 14: 11-26.
Sparks, R.E. 1995. Need for ecosystem management of large rivers and their floodplains. Bioscience 45: 168-182. Stanford, J.A., J.V. Ward, W.J. Liss, C.A. Frissell, R.N. Williams, J.A. Lichatowich and C.C. Coutant. 1996. A
general protocol for restoration of regulated rivers. Regulated Rivers 12: 391-413. Troendle, C.A. and R.M. King. 1987. The effect of partial cutting and clearcutting on the Deadhorse Creek
watershed. Journal of Hydrology 90: 145-157. Ward J.V. and J.A. Stanford, Editors. 1979. The Ecology of Regulated Streams. Plenum Press, New York, NY. 398
pp. Welcomme, R.L. 1992. River conservation: Future prospects. Pages 454-462 in P.J. Boon, R. Calow and G. E. Petts, editors. River Conservation and Management. John Wiley and Sons, New York, New York. Whiting, P.J. 2002. Streamflow necessary for environmental maintenance. Annual Reviews of Earth and Planetary
Science 30 181-206. Wilcock, P.R., G.M. Kondolf, W.V.G. Matthews, and A.F. Barta. 1996. Specification of sediment maintenance
flows for a large gravel-bed river. Water Resources Research 32: 2911- 2921. Williams, G.P., and M.G. Wolman. 1984. Downstream effects of dams on alluvial rivers. U.S. Geological Survey
Professional Paper No. 286. 83 pp. Quantitative Stream Assessments USDA, NRCS. 2007. Part 654 Stream Restoration Design National Engineering Handbook, Chapter 3 - Site
Assessment and Investigation. Reference Conditions Hughes, R. M., D. P. Larsen, and J. M. Omernik. 1986. Regional reference sites: a method for assessing stream
potentials. Environmental Management 10:629-635. Hughes, R. M., 1995. Defining acceptable biological status by comparing with reference conditions. In Davis, W. S.
& T. P. Simon (eds), Biological Assessment and Criteria: Tools for Water Resource Planning. Lewis Publ., Boca Raton, FL: 31–47.
Reynoldson, T.B., R.H. Norris, V.H. Resh, K.E. Day, and D.M. Rosenberg. 1997. The reference condition: a comparison of multimetric and multivariate approaches to assess water-quality impairment using benthic macroinvertebrates. Journal of the North American Benthological Society 16:833-852

Stream Visual Assessment Protocol (version 2) Colorado
Riparian Areas Baker, M.B., Jr., P.F. Ffolliott, L.F DeBano, and D.G. Neary. 2004. Riparian areas of the Southwestern United
States: hydrology, ecology, and management. Lewis Publishers. Baxter, C. V., K. D. Fausch, and W. C. Saunders. 2005. Tangled webs: reciprocal flows of invertebrate prey link
streams and riparian areas. Freshwater Biology 50: 201-220 Bolton, S. M. and Shellberg, J. 2001. Ecological issues in floodplains and riparian corridors. Final White Paper
prepared for Washington State Transportation Boyer, K. L., D. R. Berg, and S. V. Gregory. 2003. Riparian management for wood in rivers. Pages 407-420 in S.
V. Gregory, K. L. Boyer and A. Gurnell, editors. The Ecology and Management of Wood in World Rivers. American Fisheries Society, Bethesda, MD.
Briggs, Mark K. 1996. Riparian Ecosystem Recovery in Arid Lands: Strategies and References. The University of Arizona Press. 159 pp.
Chambers J.C. and J.R. Miller. 2004. Great Basin Riparian Ecosystems: Ecology, Management, and Restoration. Island Press.
Gregory, S.V., F.J. Swanson, A. McKee, and K.W. Cummins. 1991. Ecosystem perspectives of riparian areas. Bioscience 41:540-551.
Huggenberger, P., E Hoehn, R. Beschta, and W. Woessner. 1998. Abiotic aspects of channels and floodplains in riparian ecology. Freshwater Biology 40: 407-425.
Malanson, G. P. 1993. Riparian Landscapes. Cambridge University Press, Cambridge, UK 296 pp. Naiman, R.J. and H. Decamps, 1997. The Ecology of Interfaces: Riparian Areas. Annual Review of Ecology and
Systematics 28:621-658. Naiman, R.J., H. Decamps, and M.E. McClain, 2005. Riparia: Ecology, Conservation, and Management of
Streamside Communities. Elsevier, Inc. London, United Kingdom, 430 pp. NRC (National Research Council), 2002. Riparian Areas: Functions and Strategies for Management . National
Academy Press, Washington, D.C. Stromberg, J. C. 2001. Restoration of riparian vegetation in the south-western United States: importance of flow
regimes and fluvial dynamism. Journal of Arid Environments 49 (1): 17-34. Ward, J. V., K. Tockner, and F. Schiemer. 1999. Biodiversity of floodplain river ecosystems: ecotones and
connectivity. Regulated Rivers: Research and Management 15:125-139 Wichert, G. A. and D. J. Rapport. 1998. Fish community structure as a measure of degradation and rehabilitation of
riparian systems in an agricultural drainage basin. Environmental Management 22: 425-443. Winward, A. H. 2000. Monitoring the vegetation resources in riparian areas. General Technical Report. RMRS-
GTR-47. Fort Collins, CO: U.S. Department of Agriculture, Forest Service, Rocky Mountain Research Station.
Riparian Plant Guidebooks Field Guide for Identification and Use of Common Riparian Woody Plants of the Intermountain West
http://www.plant-materials.nrcs.usda.gov/pubs/idpmcpu7428.pdf Stream Classification Bryce, S.A., and S. E. Clarke. 1996. Landscape-level ecological regions: linking state-level ecoregion frameworks
with stream habitat classifications. Environmental Management 20:297-311 Frissell, C.A., W.J. Liss, C.E. WarrenNM, and M.D. Hurley. 1986. A hierarchical framework for stream habitat
classification: viewing streams in a watershed context. Environmental Management. 10: 199-214. Hawkes, H.A. 1975. River zonation and classification. Pages 312-374 in B.A. Whitton, editor. River Ecology.
University of California Press, Berkeley Kondolf, G. M. 1995. Geomorphological stream channel classification in aquatic habitat restoration: uses and
limitations. Aquatic Conservation: Marine and Freshwater Ecosystems 5:127-141. Montgomery, D. R., and J. M. Buffington. 1993. Channel classification, prediction of channel response, and
assessment of channel condition. Washington State Timber, Fish, and Wildlife Page 67. Rosgen, D.L. 1994. A classification of natural rivers. Catena, Vol. 22. pp. 169-199 Thorne, C. R. 1997. Channel types and morphological classification. Applied Fluvial Geomorphology for River
Engineering and Management. John Wiley and Sons, Chichester, United Kingdom, 176-222.

Stream Visual Assessment Protocol (version 2) Colorado
Water Appearance Stevenson, R. J. and J. P. Smol. 2002. Use of algae in environmental assessments. In: J. D. Wehr and R. G. Sheath, editors. Freshwater Algae in North America: Classification and Ecology. Academic Press,
San Diego Watershed Health and Assessment Cushing, B. and J. Allen. 2001. Streams: their ecology and life. Academic Press, San Diego, CA. Karr, James R. 1999. Defining and measuring river health. Fresh Water Biology 41: 221-234. Kondolf, G. M. and Downs, P. W. 1996. Catchment approach to planning river channel restoration. In Brookes, A.
and Shields, F. D., Jr. (Eds.). 1996. River Channel Restoration. John Wiley and Sons, Chichester, U.K., 129-148.
National Research Council. 1992. Restoration of Aquatic Ecosystems. National Academy Press, Washington, D.C. National Research Council. 2002. The Missouri River Ecosystem: Exploring the Prospects for Recovery. National
Academy Press, Washington, D. C. Stanford, J. A. and Ward, J. V. 1992. Management of aquatic resources in large catchments: recognizing
interactions between ecosystem connectivity and environmental disturbance. Pages 91-124 in R. J. Naiman, editor. Watershed Management. Springer- Verlag, New York, NY.
Wang, L., Lyons, J., Kanehl, P., and Bannerman, R. 2001. Impacts of urbanization on stream habitat and fish across multiple spatial scales. Environmental Management. 28(2):255-266.
Ward, J.V., and J.A. Stanford. 1995. Ecological connectivity in alluvial river ecosystems and its disruption by flow regulation. Regulated Rivers 11:105-119.
Ward, J. V., K. Tockner, U. Uehlinger, and F. Malard. 2001. Understanding Natural Patterns and Processes in River Corridors as the Basis for Effective River Restoration. Regulated Rivers: Research & Management. 17:311-323.