Submitted to: Colorado State Board of Education...Submitted to: Colorado State Board of Education...
65
Submitted to: Colorado State Board of Education By: Dr. Katy Anthes, Commissioner of Education February 2017 Colorado Department of Education 201 E. Colfax Ave., Denver, CO 80203 303-866-6600
Transcript of Submitted to: Colorado State Board of Education...Submitted to: Colorado State Board of Education...

Submitted to:
Colorado State Board of Education
By:
Dr. Katy Anthes, Commissioner of Education
February 2017
Colorado Department of Education
201 E. Colfax Ave., Denver, CO 80203 303-866-6600

2

3
Julesburg Re-1 School District will enter its 6th year of being Accredited with a Priority Improvement
Plan on July 1, 2017. In addition, Destinations Career Academy of Colorado, a multi-district online school
authorized by the district, is entering its 6th year of being in Priority Improvement or Turnaround status. This
report constitutes CDE’s formal recommendation for the school district and for the online school. The State
Board of Education is required, by law, to direct action to the district’s local school board prior to June 30,
2017.
CDE Recommendation
Pursuant to the Education Accountability Act of 2009, the Commissioner of Education is required to
provide a recommendation to the State Board of Education for districts and schools at the end of the
accountability clock. For both the district and school level action, the Commissioner recommends partial
closure for Destinations Career Academy of Colorado in Julesburg Re-1 School District based upon a review
of the district’s data, leadership, culture, academic systems, and Unified Improvement Plan. Specifically, the
Commissioner recommends that district close the middle school portion
(grades 6-8) of Destinations Career Academy. The Commissioner’s
conversations with district leadership, as well as many Department staff
conversations over the past several months also informed this
recommendation. In addition, the Department took into consideration
the State Review Panel’s final recommendation and the district’s own
proposal to close the middle grades of the online school.
Background
Julesburg Re-1 School District serves approximately 600 students, and is physically located in far
northeast Colorado. Compared to the state as a whole, Julesburg Re-1 School District has a higher
percentage of economically disadvantaged students and lower percentages of minority students and English
learners. In 2016-17, 55% of the district’s students qualified for free or reduced-price lunch, 35% were
minorities, and 25% were classified as English learners.
Julesburg Re-1 operates three schools: two traditional, brick-and-mortar schools that serve students
from the local community, and one online school that enrolls students from across the state. One of the
brick-and-mortar schools, Julesburg Elementary School, serves students in Kindergarten through 6th grade.
The other, Julesburg High School, serves students in grades 7 through 12. Destinations Career Academy of
Colorado, a multi-district online school, serves students in grades 6 through 12. The online school was
formerly known as Insight School of Colorado at Julesburg.
Julesburg Re-1 was Accredited with a Priority Improvement Plan from 2010 through 2014, and in
2016 received an Accredited with Priority Improvement: Low Participation rating. Since 2010, the district’s
overall performance has largely been dictated by the performance of the online school. Both Julesburg
Elementary School and Julesburg High School maintained Performance Plans each year from 2010 through
2014. In contrast, Destinations Career Academy of Colorado earned a Turnaround Plan in 2010 and 2011,
and a Priority Improvement Plan in each year from 2012 through 2014. Neither Julesburg Elementary School

4
nor Julesburg High School had a sufficient amount of data to determine a performance rating in 2016 due to
participation rates. Destinations Career Academy again earned a Priority Improvement Plan in 2016.
Table 1: Performance Ratings for Julesburg School District and its Schools, 2010-2016
2010 2011 2012 2013 2014 2016
District Priority
Improvement Priority
Improvement Priority
Improvement Priority
Improvement Priority
Improvement
Priority Improvement:
Low Participation
Julesburg Elementary School
Performance Performance Performance Performance Performance Insufficient
Data
Julesburg High School
Performance Performance Performance Performance Performance Insufficient
Data
Destinations Career Academy
Turnaround Turnaround Priority
Improvement Priority
Improvement Priority
Improvement
Priority Improvement:
Low Participation
Key Conditions for Success
Based on conversations with district and school leaders, a thorough review of state data, and a review
of the district’s Unified Improvement Plan (UIP), it is clear to the Department that the district’s most
significant challenges are focused in the operation and performance of their online school, Destinations
Career Academy of Colorado. The Department believes that the following conditions must be in place for
the online school to see successful outcomes for its students. These conditions are pulled from the district’s
Major Improvement Strategies in the district’s UIP, thus the school and district are already on their way
toward implementing these strategies.
Focus on the High School Career and Technical Education Mission. Closing the middle school portion
of the school will permit school leaders and staff to concentrate their attention on fulfilling the mission of
the high school to prepare all students for successful careers. The high school began offering career
pathways in Health Sciences, Business and IT in the 2016-17 school year. The school is pursuing formal
Career and Technical Education (CTE) certification for the programs and its instructors, and the school will
offer additional pathways focused on agriculture and STEM next year. The CTE pathways, if implemented
well, can be a mechanism for improving student engagement and graduation rates at the high school.
Academic Systems. The online school, including the high school grades, continues to see students
falling below state expectations on academic achievement and academic growth in both English language
arts (ELA) and math, according to the state performance frameworks. As mentioned in the district’s UIP,
Destinations Career Academy needs to continue to focus on implementing data-driven instruction to identify
gaps in student learning and target interventions to those students. Another strategy the school should
continue to pursue is using class attendance data and other course progress data to track student success

5
and provide support where needed to keep students engaged in the online school throughout the school
year.
District systems of support. The district is working in collaboration with school leadership to support
the needed improvements at the online school. District leadership recognizes the need to close the middle
grades of the school to focus on the high school, which has seen improvements in the past several years in
student achievement, dropout rates and graduation rates. To ensure that the high school continues to
improve and stays off of the accountability clock, the district should continue to engage with school
leadership and with the management organization, K12, Inc. on monitoring the progress of student
outcomes and the implementation of the CTE pathways. School leadership has established a regular
schedule for reviewing student data with school staff, with district staff and with K12. Those progress
monitoring processes should continue to be implemented with fidelity.
Rationale for Recommendation
CDE is recommending partial school closure for Julesburg School District based on the key conditions
needed for success, the State Review Panel recommendation, staff conversations with the district and the
district’s own proposal for closure. The Department has reviewed the district’s draft school closure plan and
finds that the plan meets the statutory requirements for a school closure plan and provides a clear process
for communicating with staff, families and the community about the closure. The plan also conveys that the
district will support affected families in transitioning to a different school, whether that school be their local
district-run school, a charter school or a different online school.
The State Review Panel’s evaluation, conducted in spring 2015, recommended giving the school an
additional two years “to provide evidence that they have clearly defined the purpose of the school and to
identify students they can serve within the system of programming and services offered versus those they
cannot serve to ensure students achieve their goals.” The Panel concluded that if the school was able to do
that, there should be signs of improvement in student data. It has been nearly two years since that
recommendation was written, and CDE finds that there have been incremental improvements reported for
the high school, but not for the middle school. While the graduation rate is still extremely low, it doubled in
two years from 15.2% in 2014 to 36.2% in 2016. The high school also earned enough points on the state
performance framework that it would have received an Improvement plan type in 2016 if the middle school
results are removed (according to CDE calculations). The high school’s rating in 2014 would have been
Priority Improvement if considered separate from the middle school. Further, the school has refined its
mission to focus on high school career and technical education (CTE) pathways, and there is reason to
believe that the CTE focus fills a need in the online choice community.
For these reasons, the Department concludes that, as the Panel noted, the school has identified that
they can continue serving and offering value to high school students, whereas the school is not well
positioned to continue serving middle school students. When looking at the data for the middle school
portion of the online school, the middle school dropped from Priority Improvement to Turnaround from
2014 to 2016. In addition, there are a number of online schools that have higher ratings according to the
state School Performance Frameworks that could be options for the middle school students (see Table 2).
Specifically, there are eight schools that serve middle school grades that earned Performance Plans in 2016.

6
Table 2. 1-Year School Performance Framework Ratings for Online Schools Serving Middle School Grades
Online Schools serving Middle Grades1
2016 For multi-district online schools, is
there a geographic component? Notes Rating Points
PSD GLOBAL ACADEMY* Performance Plan 100.0% Yes, Fort Collins Students are required to attend 1-2 days a week
TCA COLLEGE PATHWAYS* Performance Plan 83.3% Yes, Colorado Springs
Students are required to attend face to face class 2 hours per week
ACADEMY CALVERT K-8 ONLINE SCHOOL* Performance Plan 75.0%
Optional, Colorado Springs
Face to face component is optional for those in the Colorado Springs area
COLORADO DIGITAL ACADEMY - MIDDLE* Performance Plan 62.5% No
BRANSON SCHOOL ONLINE* Performance Plan 57.9% No
SPRINGS STUDIO FOR ACADEMIC EXCELLENCE* Performance Plan 57.9%
Optional, Colorado Springs
Face to face component is optional for those in the Colorado Springs area
GRAND RIVER ACADEMY Performance Plan 57.5% n/a; single district online
Serves students in Mesa County Valley 51
COLORADO CONNECTIONS ACADEMY* Performance Plan 56.8% No
PEAK VIRTUAL ACADEMY Improvement Plan 50.0% n/a; single district online
Serves students in Montrose County RE-1J
ELEVATE ACADEMY* Priority Improvement Plan 39.3%
Yes, Learning centers located in various districts
Daily attendance is required. Learning centers located in Denver, Colorado Springs, and Aurora
ACHIEVE ONLINE* Priority Improvement Plan 39.0%
Optional, Colorado Springs
Face to face component is optional for those in the Colorado Springs area
COLORADO PREP ACADEMY* Priority Improvement Plan 38.6% No
ENGAGE ONLINE ACADEMY* Priority Improvement Plan 37.5% Optional, Greeley
Face to face component is optional for those in the Greeley area
HOPE ONLINE LEARNING ACADEMY MIDDLE SCHOOL*
Priority Improvement Plan 37.3%
Yes, Learning centers located statewide
Daily attendance is required at learning centers.
JEFFCO'S 21ST CENTURY VIRTUAL ACADEMY*
Priority Improvement Plan 35.0% Lakewood
Face to face attendance required once per week
ROCKY MOUNTAIN DIGITAL ACADEMY* Turnaround Plan 32.8% No
DESTINATIONS CAREER ACADEMY OF COLORADO* Turnaround Plan 32.5% No
1 Only includes those schools that enough data to determine a separate rating at the middle school level in 2016.
*Denotes multi-district online school

7
Alternative pathway options
CDE has also reviewed the other potential pathway options—innovation status, conversion of a
district-run school to a charter school, district reorganization and external management. At this juncture,
CDE does not recommend that Julesburg School District seek innovation status for Destinations Career
Academy of Colorado because there are not district or state policies that are preventing the school from
implementing the needed turnaround efforts. As a multi-district online school, Destinations Career Academy
already receives a great deal of flexibility and autonomy under the state statute. Similarly, converting the
online school to an online charter school would not fundamentally change current practices and would not
solve the underlying performance problems.
Destinations Career Academy is already operated by an external management organization, K12,
Inc. The school was under two different management operators from 2008 until 2011, when it was then
acquired by K12. CDE has not found evidence that changing the management entity at this juncture would
result in any better outcomes. The current school management has put some promising initiatives into
place, particularly around the CTE pathways for the high school, data-driven instruction and regular progress
monitoring. Changing school management may disrupt current systems in a way that would be more
harmful than beneficial at this time.
The State Review Panel also recommended that the current management organization remain in
place to continue the “promising changes” being implemented, with the caveat that a “failure to make
meaningful improvements within the next two years would indicate a larger systemic problem; in that case,
the [Panel] recommends closure.” As mentioned above, the performance has not improved at the middle
school level in the past two years, while outcomes have incrementally improved for the high school. Thus,
CDE recommends partial closure with the current management organization, K12, remaining in place for the
operation of the high school.
Summary of Pathways that Meet Necessary Conditions for Improvement
District/School Pathway CDE
Recommendation
Additional
Options
CDE Does Not
Recommend
Innovation School Status X
Conversion to a Charter School X
External Management Partner X
School Closure X
District Reorganization X
CDE Recommendation Report Outline
The next sections of this report provide supporting evidence and documentation for the statements
made above. First, a summary of state data trends is provided, followed by a review of the district and
school’s systems and conditions. A summary of the Julesburg School District Unified Improvement Plan is
included, as is an overview of the state and federal grants provided to the district over the past several
years. Lastly, the report includes an evaluation by CDE staff of the State Review Panel’s report and the
school district’s plan for closing the middle school of Destinations Career Academy of Colorado.
8
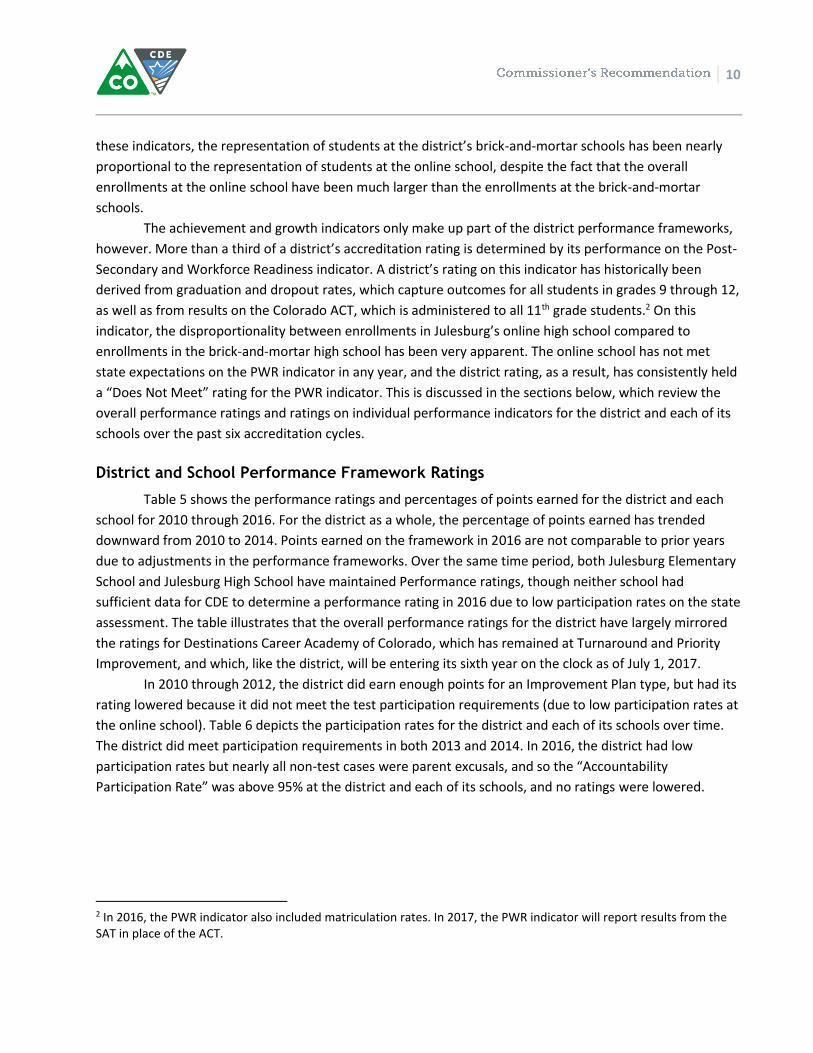
Overview
Julesburg Re-1 School District serves approximately 600 students, and is physically located in
northeast Colorado. Compared to the state as a whole, Julesburg Re-1 School District has a higher
percentage of economically disadvantaged students and lower percentages of minority students and English
learners. In 2016-17, 55% of the district’s students qualified for free or reduced-price lunch, 35% were
minorities, and 25% were classified as English learners.
Julesburg Re-1 operates three schools: two traditional, brick-and-mortar schools that serve students
from the local community, and one online school that enrolls students from across the state. One of the
brick-and-mortar schools, Julesburg Elementary School, serves students in Kindergarten through 6th grade.
The other, Julesburg High School, serves students in grades 7 through 12. Destinations Career Academy of
Colorado, the online school, serves students in grades 6 through 12. The online school was formerly known
as Insight School of Colorado at Julesburg. Specific information about the enrollment and demographics of
the different schools is included below.
Julesburg Re-1 was Accredited with a Priority Improvement Plan from 2010 through 2014, and in
2016 received an Accredited with Priority Improvement: Low Participation rating. Since 2010, the district’s
overall performance has largely been dictated by the performance of the online school. Both Julesburg
Elementary School and Julesburg High School maintained Performance Plans each year from 2010 through
2014. In contrast, Destinations Career Academy of Colorado earned a Turnaround Plan in 2010 and 2011,
and a Priority Improvement Plan in each year from 2012 through 2014. Neither Julesburg Elementary School
nor Julesburg High School had a sufficient amount of data to determine a performance rating in 2016 due to
participation rates. Destinations Career Academy earned a Priority Improvement Plan in 2016, triggering the
school to enter Year 6 on July 1, 2017.
District and School Enrollment Patterns
Understanding why Destinations Career Academy of Colorado has a determinant effect on
Julesburg’s overall district performance rating depends in part on understanding how student enrollments
are distributed between schools within the district. In 2016-17, more than half of Julesburg’s students were
enrolled at Destinations Career Academy: 347 students, compared to 133 at Julesburg Elementary School
and 109 at Julesburg High School.1 The 347 online students are considered to be Julesburg’s students since
the district authorizes the online school; however, only a handful of the online school’s students live within
the district’s boundaries.
Table 3 shows the enrollments across Julesburg’s three schools from the 2010-2011 school year
through the 2016-17 school year. While the enrollment numbers at the brick-and-mortar schools have
remained relatively stable over this time period, enrollments at the online school have actually declined
1 The percentage of students qualifying for free or reduced-price lunch at Destinations Career Academy is similar to the percentages at the brick-and-mortar schools. The percentages of minority students and English learners are also similar.

9
significantly, so that they now represent a proportionally smaller share of the overall district enrollments. At
highest point, more than 85% of the district’s students were enrolled in the online school.
Table 3. Julesburg Re-1 Pupil Membership Counts
2011 2012 2013 2014 2015 2016 2017
Destinations Career Academy 1,527 628 885 683 522 381 347
Julesburg Elementary School 146 115 137 138 150 146 133
Julesburg High School 114 112 105 98 94 101 109
District Total 1,787 855 1127 919 766 628 589
Percent of district students enrolled in Destination’s Career Academy
85.5% 73.5% 78.5% 74.3% 68.1% 60.7% 58.9%
When it comes to understanding the impact of Destinations Career Academy on Julesburg’s district
performance rating, the overall enrollment numbers only tell part of the story. It is also necessary to look at
the distribution of enrollments across grade levels within Destinations Career Academy. Table 4 shows that
the majority of students at the online school have been enrolled in grades 10 through 12. While the
concentration of students in these grade levels has become less extreme as the overall enrollments at the
school have declined, the pattern was particularly pronounced up through the 2014-15 school year.
The distribution of student enrollments at Destinations Career Academy has a significant influence
on Julesburg’s district-level performance outcomes due to the structure of the indicators that are used to
determine performance ratings. For years 2010 through 2014, the frameworks reflected the achievement
and growth of students only in grades 3 through 10 (grades in which the state assessment was
administered). The 2016 framework reflects the achievement and growth of only those students in grades 3
through 9. Because of this, a large proportion of students enrolled at Destinations Career Academy have not
been represented in the achievement and growth metrics used to rate district performance outcomes. On
Table 4. Destinations Career Academy Pupil Membership Counts and Percentages by Grade
Grade Level
2010-11 2011-12 2012-13 2013-14 2014-15 2015-2016 2016-17
# Percent # Percent # Percent # Percent # Percent # Percent # Percent
Grade 6 0 0.0% 0 0.0% 0 0.0% 17 2.5% 29 5.6% 18 4.7% 22 6.3%
Grade 7 0 0.0% 6 1.0% 26 2.9% 25 3.7% 41 7.9% 49 12.9% 40 11.5%
Grade 8 0 0.0% 10 1.6% 40 4.5% 51 7.5% 56 10.7% 50 13.1% 63 18.2%
Grade 9 169 11.1% 42 6.7% 63 7.1% 56 8.2% 55 10.5% 44 11.5% 47 13.5%
Grade 10
417 27.3% 109 17.4% 205 23.2% 157 23.0% 90 17.2% 65 17.1% 47 13.5%
Grade 11
468 30.6% 189 30.1% 252 28.5% 188 27.5% 113 21.6% 69 18.1% 69 19.9%
Grade 12
473 31.0% 272 43.3% 299 33.8% 189 27.7% 138 26.4% 86 22.6% 59 17.0%
School Total
1,527 628 885 683 522 381 347
10
these indicators, the representation of students at the district’s brick-and-mortar schools has been nearly
proportional to the representation of students at the online school, despite the fact that the overall
enrollments at the online school have been much larger than the enrollments at the brick-and-mortar
schools.
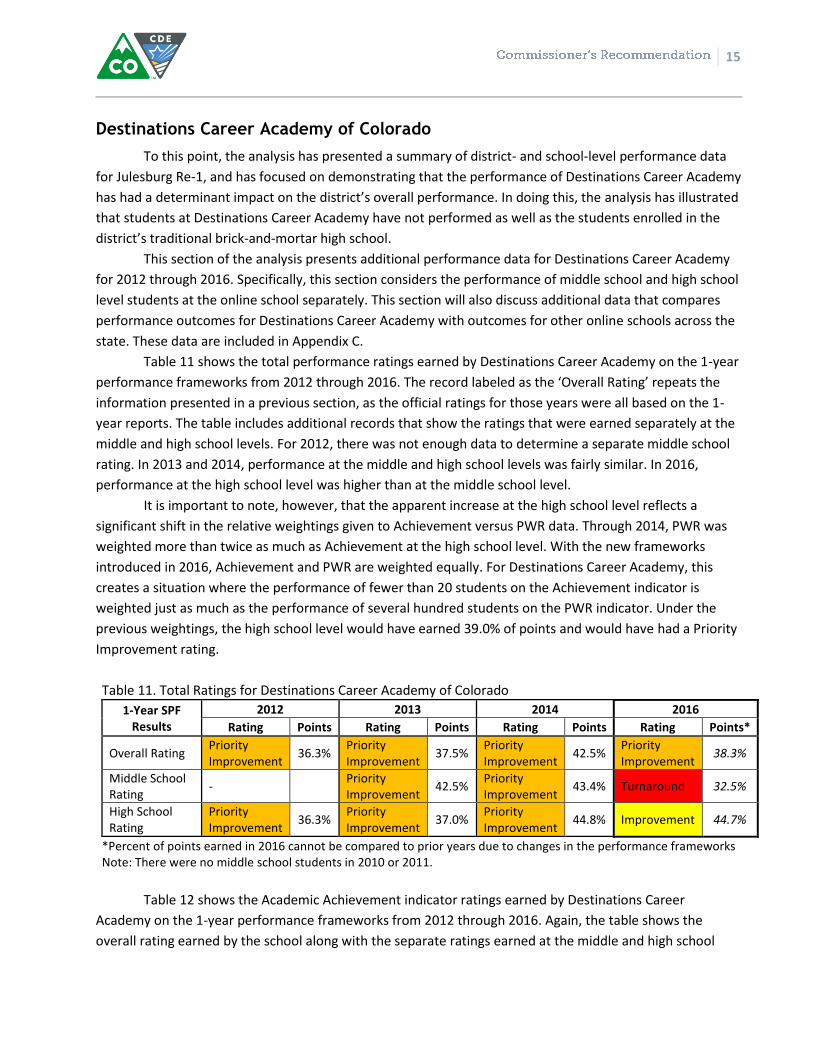
The achievement and growth indicators only make up part of the district performance frameworks,
however. More than a third of a district’s accreditation rating is determined by its performance on the Post-
Secondary and Workforce Readiness indicator. A district’s rating on this indicator has historically been
derived from graduation and dropout rates, which capture outcomes for all students in grades 9 through 12,
as well as from results on the Colorado ACT, which is administered to all 11th grade students.2 On this
indicator, the disproportionality between enrollments in Julesburg’s online high school compared to
enrollments in the brick-and-mortar high school has been very apparent. The online school has not met
state expectations on the PWR indicator in any year, and the district rating, as a result, has consistently held
a “Does Not Meet” rating for the PWR indicator. This is discussed in the sections below, which review the
overall performance ratings and ratings on individual performance indicators for the district and each of its
schools over the past six accreditation cycles.
District and School Performance Framework Ratings
Table 5 shows the performance ratings and percentages of points earned for the district and each
school for 2010 through 2016. For the district as a whole, the percentage of points earned has trended
downward from 2010 to 2014. Points earned on the framework in 2016 are not comparable to prior years
due to adjustments in the performance frameworks. Over the same time period, both Julesburg Elementary
School and Julesburg High School have maintained Performance ratings, though neither school had
sufficient data for CDE to determine a performance rating in 2016 due to low participation rates on the state
assessment. The table illustrates that the overall performance ratings for the district have largely mirrored
the ratings for Destinations Career Academy of Colorado, which has remained at Turnaround and Priority
Improvement, and which, like the district, will be entering its sixth year on the clock as of July 1, 2017.
In 2010 through 2012, the district did earn enough points for an Improvement Plan type, but had its
rating lowered because it did not meet the test participation requirements (due to low participation rates at
the online school). Table 6 depicts the participation rates for the district and each of its schools over time.
The district did meet participation requirements in both 2013 and 2014. In 2016, the district had low
participation rates but nearly all non-test cases were parent excusals, and so the “Accountability
Participation Rate” was above 95% at the district and each of its schools, and no ratings were lowered.
2 In 2016, the PWR indicator also included matriculation rates. In 2017, the PWR indicator will report results from the SAT in place of the ACT.

11
Table 5. Julesburg Re-1 District and School Performance Framework Ratings
2010 2011 2012 2013 2014 2016
District Rating
Priority Improvement*
Priority Improvement*
Priority Improvement*
Priority Improvement
Priority Improvement
Priority Improvement:
Low Participation
% Points 56.0% 58.3% 52.5% 49.3% 47.5% 39.2%**
Julesburg Elementary School
Rating Performance Performance Performance Performance Performance Insufficient
Data
% Points 77.7% 76.5% 70.9% 71.9% 59.5% -
Julesburg High School
Rating Performance Performance Performance Performance Performance Insufficient
Data
% Points 77.6% 83.2% 80.1% 73.6% 82.4% -
Destinations Career Academy
Rating Turnaround Turnaround Priority
Improvement Priority
Improvement Priority
Improvement
Priority Improvement:
Low Participation
% Points 37.3% 34.3% 36.3% 37.5% 42.5% 38.3%**
* Ratings were decreased one level (from Improvement to Priority Improvement) in 2010, 2011 and 2012 due to the district not meeting the 95% participation rate requirement. **Percent of points earned in 2016 cannot be compared to prior years due to changes in the performance frameworks.
Table 6. Julesburg Re-1 District and School Actual Participation Rates
2010 2011 2012 2013 2014 2016
District
ELA/Reading 88.3% 90.4% 92.7% 98.1% 98.7% 37.2%
Math 88.2% 90.2% 92.5% 98.7% 98.8% 37.8%
Science 86.5% 90.5% 91.6% 98.9% 99.4% 36.6%
Julesburg Elementary School
ELA/Reading 100.0% 100.0% 100.0% 100.0% 99.5% 15.6%
Math 100.0% 100.0% 100.0% 100.0% 100.0% 15.6%
Science 100.0% 100.0% 100.0% 100.0% 100.0% 16.7%
Julesburg High School
ELA/Reading 100.0% 100.0% 100.0% 100.0% 100.0% 13.0%
Math 100.0% 100.0% 100.0% 100.0% 99.5% 13.2%
Science 100.0% 100.0% 100.0% 100.0% 100.0% 14.7%
Destinations Career Academy
ELA/Reading 79.6% 85.9% 89.5% 96.8% 98.1% 67.0%
Math 79.4% 85.7% 89.1% 97.9% 98.2% 68.0%
Science 77.5% 86.4% 89.0% 98.5% 98.6% 50.0%
Note: Red shading indicates that the 95% participation requirement was not met for more than one content area. Grey shading indicates that the actual participation rate is below 95%, but the rating was not lowered, as the accountability participation rate met the 95% requirement. The accountability participation rate excludes parent excuses from the denominator.

12
District and School Academic Performance Trends
Table 7, below, shows the ratings earned for Julesburg Re-1 and each of its schools on the Academic
Achievement, Academic Growth, and Post-Secondary and Workforce Readiness indicators from 2010
through 2016. On the Academic Achievement indicator, Julesburg Elementary School and Julesburg High
School maintained “Meets” ratings from 2010 through 2014. Destinations Career Academy had a “Does Not
Meet” rating on the Academic Achievement indicator in 2010, and Approaching” ratings from 2011 through
2014; in 2016 the school earned a “Does Not Meet” rating again. The district’s rating on the Achievement
indicator tracked the ratings of the brick-and-mortar schools from 2010 through 2012, but fell to
“Approaching” in 2013 and 2014 and “Does Not Meet” in 2016.
Table 7. Julesburg Re-1 District and School Indicator Ratings
District/School Indicator 2010 2011 2012 2013 2014 2016
District
Academic Achievement Meets Meets Meets Approaching Approaching
Does Not Meet
Academic Growth Meets Meets Meets Approaching Approaching Approaching
PWR Does Not Meet
Does Not Meet
Does Not Meet
Does Not Meet
Does Not Meet
Does Not Meet
Julesburg Elementary School
Academic Achievement Meets Meets Meets Meets Meets
Insufficient Data
Academic Growth Meets Meets Meets Approaching Approaching
Insufficient Data
PWR - - - - - -
Julesburg High School
Academic Achievement Meets Meets Meets Meets Meets
Insufficient Data
Academic Growth Meets Exceeds Exceeds Meets Meets
Insufficient Data
PWR Meets Meets Meets Meets Meets Meets
Destinations Career Academy of Colorado
Academic Achievement
Does Not Meet Approaching Approaching Approaching Approaching
Does Not Meet
Academic Growth Approaching
Does Not Meet Approaching Approaching Approaching Approaching
PWR Does Not Meet
Does Not Meet
Does Not Meet
Does Not Meet
Does Not Meet
Does Not Meet
In 2016, neither Julesburg Elementary School nor Julesburg High School had enough data to
determine ratings on the Academic Achievement indicator. For the two schools combined, fewer than 20
students had valid scores on the 2016 Math and English Language Arts assessments based on the non-
participation in the assessments. More than two-thirds of the scores used to determine the district’s 2016
Academic Achievement rating came from students at Destinations Career Academy. Thus, the district’s 2016
rating on the Academic Achievement rating was consistent with the rating earned by Destinations Career
Academy—both earned a “Does Not Meet” rating.
On the Academic Growth indicator, Julesburg Elementary School earned “Meets” ratings from 2010
through 2012 and an “Approaching” Rating in 2013 and 2014. Julesburg High School had a “Meets” rating in

13
2010, “Exceeds” ratings in 2011 and 2012, and “Meets” ratings in 2013 and 2014. Except for a “Does Not
Meet” rating in 2011, Destination Career Academy maintained an “Approaching” rating on the Academic
Growth indicator across the 2010 through 2016 time period.
In 2016, the district rating was more heavily influenced by Destinations Career Academy, as neither
Julesburg Elementary School nor Julesburg High School had enough data to determine growth ratings due to
non-participation. Both the district and Destinations Career Academy had an “Approaching” rating on the
Academic Growth indicator in 2016.
As noted above, more than a third of a district’s accreditation rating is determined by its
performance on the Post-Secondary and Workforce Readiness (PWR) indicator. It is with this indicator that
Destinations Career Academy has the greatest impact on Julesburg’s district rating. Table 7 shows that
Julesburg High School has earned “Meets” ratings on the PWR indicator in every year from 2010 through
2016. In contrast, Destinations Career Academy has earned a “Does Not Meet” rating each year. While one
might expect that the district ratings would fall somewhere in between the ratings of these two schools,
because of enrollment trends they have in fact mirrored the ratings of the online high school directly, which
is described in more detail below.
Post-Secondary and Workforce Readiness (PWR) Data
Examining the graduation rates for Julesburg Re-1 School District and its two high schools helps to
illustrate why Destinations Career Academy has a determinant influence on Julesburg’s district-level
performance. Table 8 shows the graduation rates for the 4-, 5-, 6-, and 7-year cohorts from 2012 through
2015, which is the data set used for the 2016 performance frameworks. The table includes the
denominators, or student base counts, associated with each rate. The vast majority of students represented
in the district’s graduation rates are associated with Destinations Career Academy (210 students in 2015);
only a small proportion of students come from Julesburg High School (14 students in 2015). Thus, while the
district graduation rates have tended to be slightly higher than those of Destinations Career Academy, they
have been far lower than the rates for Julesburg High School. In nearly all cases, the rates for the online high
school and for the district have been below 30%, which contributes to the “Does Not Meet” ratings on the
PWR indicator.
The dropout rates for Julesburg Re-1 School District and its two high schools tell a similar story.
Table 9 shows the single-year dropout rates for the 2011-12 school year through the 2014-15 school year.
Dropout rates are incorporated into the performance frameworks on a lagged basis, so it is the 2014-15
rates that were used for the 2016 frameworks. As seen in Table 9, the dropout rates for the district are
largely determined by the rates at Destinations Career Academy.
Together, graduation and dropout rates accounted for two-thirds of the ratings assigned to the PWR
indicator on the 2010 through 2014 frameworks. While the weight given to these two metrics has decreased
somewhat with the incorporation of matriculation rates into the 2016 frameworks, they still have a very
strong influence on the overall indicator rating. Moreover, there is a direct correlation between the low
graduation rates and high dropout rates exhibited at Destinations Career Academy and low rates of
matriculation. Indeed, the school earned a “Does Not Meet” rating for its matriculation rate on the 2016

14
framework, as did the district. Of the 119 students represented in the district’s matriculation rate, 106 came
from Destinations Career Academy.
The final data element included under the PWR Indicator is the mean scale score on the Colorado
ACT, which is administered annually to all 11th graders in the state. Here, the performance of students at
Destinations Career Academy has been much more consistent with the performance of students at
Julesburg High School, although still lower. It should be noted, however, that the number of students tested
on the Colorado ACT at Destinations Career Academy is far lower than the number of students enrolled in
11th grade at the school.
Table 8. Julesburg Re-1 Graduation Rates
School/ District Anticipated Year
of Graduation
Years to Graduate
4-Year 5-Year 6-Year 7-Year
Base Rate Base Rate Base Rate Base Rate
Julesburg High School
2012 24 87.5% 24 87.5% 24 87.5% 24 87.5%
2013 25 96.0% 25 96.0% 25 96.0%
2014 16 81.3% 16 81.3%
2015 14 92.9%
Destinations Career Academy
2012 453 16.8% 452 22.1% 444 23.6% 444 24.1%
2013 341 15.2% 326 20.6% 325 22.8%
2014 303 17.8% 300 23.3%
2015 210 36.2%
District
2012 477 20.3% 476 25.4% 468 26.9% 468 27.4%
2013 366 20.8% 351 25.9% 350 28.0%
2014 319 21.0% 316 26.3%
2015 224 39.7%
Table 9. Julesburg Re-1 1-Year Dropout Rates
School/ District 2012 2013 2014 2015
Base Rate Base Rate Base Rate Base Rate
Julesburg High School 88 0.0% 84 1.2% 71 0.0% 76 1.3%
Destinations Career Academy 1228 27.8% 1029 30.0% 821 15.3% 600 16.7%
District 1380 24.7% 1218 26.3% 1018 12.8% 829 13.6%
District dropout rates include grades 7-12; school dropout rates include grades 9-12.
Table 10. Julesburg Re-1 Colorado ACT Composite Scores
School/ District 2013 2014 2015 2016
# of Students
Composite Score
# of Students
Composite Score
# of Students
Composite Score
# of Students
Composite Score
Julesburg High School 16 18.5 17 18.6 13 19.8 14 21.1
Destinations Career Academy 88 17.2 76 18.1 44 18.7 21 19.4
15
Destinations Career Academy of Colorado
To this point, the analysis has presented a summary of district- and school-level performance data
for Julesburg Re-1, and has focused on demonstrating that the performance of Destinations Career Academy
has had a determinant impact on the district’s overall performance. In doing this, the analysis has illustrated
that students at Destinations Career Academy have not performed as well as the students enrolled in the
district’s traditional brick-and-mortar high school.
This section of the analysis presents additional performance data for Destinations Career Academy
for 2012 through 2016. Specifically, this section considers the performance of middle school and high school
level students at the online school separately. This section will also discuss additional data that compares
performance outcomes for Destinations Career Academy with outcomes for other online schools across the
state. These data are included in Appendix C.
Table 11 shows the total performance ratings earned by Destinations Career Academy on the 1-year
performance frameworks from 2012 through 2016. The record labeled as the ‘Overall Rating’ repeats the
information presented in a previous section, as the official ratings for those years were all based on the 1-
year reports. The table includes additional records that show the ratings that were earned separately at the
middle and high school levels. For 2012, there was not enough data to determine a separate middle school
rating. In 2013 and 2014, performance at the middle and high school levels was fairly similar. In 2016,
performance at the high school level was higher than at the middle school level.
It is important to note, however, that the apparent increase at the high school level reflects a
significant shift in the relative weightings given to Achievement versus PWR data. Through 2014, PWR was
weighted more than twice as much as Achievement at the high school level. With the new frameworks
introduced in 2016, Achievement and PWR are weighted equally. For Destinations Career Academy, this
creates a situation where the performance of fewer than 20 students on the Achievement indicator is
weighted just as much as the performance of several hundred students on the PWR indicator. Under the
previous weightings, the high school level would have earned 39.0% of points and would have had a Priority
Improvement rating.
Table 11. Total Ratings for Destinations Career Academy of Colorado
1-Year SPF Results
2012 2013 2014 2016
Rating Points Rating Points Rating Points Rating Points*
Overall Rating Priority Improvement
36.3% Priority Improvement
37.5% Priority Improvement
42.5% Priority Improvement
38.3%
Middle School Rating
- Priority Improvement
42.5% Priority Improvement
43.4% Turnaround 32.5%
High School Rating
Priority Improvement
36.3% Priority Improvement
37.0% Priority Improvement
44.8% Improvement 44.7%
*Percent of points earned in 2016 cannot be compared to prior years due to changes in the performance frameworks Note: There were no middle school students in 2010 or 2011.
Table 12 shows the Academic Achievement indicator ratings earned by Destinations Career
Academy on the 1-year performance frameworks from 2012 through 2016. Again, the table shows the
overall rating earned by the school along with the separate ratings earned at the middle and high school

16
levels. For 2012, there was not enough data to determine a separate middle school rating on the
Achievement indicator. In 2013 and 2014, performance (percent of points earned) at the middle school level
was higher than performance at the high school level. In 2016, high school students performed better on the
Academic Achievement indicator than middle school students.
Table 12. Achievement Ratings for Destinations Career Academy of Colorado
1-Year SPF Results 2012 2013 2014 2016
Rating Points Rating Points Rating Points Rating Points*
Overall Achievement Rating Approaching 37.5% Approaching 40.6% Approaching 45.8% Approaching 41.0% Middle School Achievement - Approaching 43.8% Approaching 50.0%
Does Not Meet 25.0%
High School Achievement Approaching 37.5% Approaching 37.5% Approaching 41.7% Approaching 58.3%
*Percent of points earned in 2016 cannot be compared to prior years due to changes in the performance frameworks.
Table 13 shows the Academic Growth indicator ratings earned by Destinations Career Academy on
the 1-year performance frameworks from 2012 through 2016. For 2012, there was not enough data to
determine a separate middle school rating on the Growth indicator. In 2013, performance, as measured by
the percent of points earned, at the middle school level was identical to performance at the high school
level. In 2014, high school students performed higher than middle school students on the Academic Growth
indicator. In 2016, there was not enough data to determine a separate high school rating (only 9th graders
were tested in 2016 as compared to 9th and 10th graders in 2012-2014).
Table 13. Growth Ratings for Destinations Career Academy of Colorado
1-Year SPF Results 2012 2013 2014 2016
Rating Points Rating Points Rating Points Rating Points*
Overall Growth Rating Approaching 41.7% Approaching 41.7% Approaching 45.8% Approaching 37.5%
Middle School Growth - Approaching 41.7% Approaching 41.7% Approaching 37.5%
High School Growth Approaching 41.7% Approaching 41.7% Approaching 50.0% -
*Percent of points earned in 2016 cannot be compared to prior years due to changes in the performance frameworks.
Comparison of Destinations Career Academy to Other Colorado Online Schools
Tables included in Appendix C show the performance ratings of other non-Alternative Education
Campus (AEC) online schools in the state that serve students at the middle and high school levels. As of the
2016-17 school year, there were 40 online schools in Colorado that serve middle and high school students.
Six of these schools were newly opened, so only 33 would potentially have had ratings generated by the
2016 frameworks. Of these 33, 11 did not have a sufficient amount of data to determine a rating. Of the 23
online schools that did have enough data for CDE to determine an overall performance rating on the 2016

17
framework, Destinations Career Academy ranked 17th in terms of the total percentage of points earned
across the Academic Achievement, Academic Growth, and Post-Secondary and Workforce indicators. At this
overall level, which combines middle and high school results, eight online schools earned more than 53.0%
of the total possible points, designating them with a Performance plan type. Six others earned between
43.0% and 52.9% of points, designating them with an Improvement Plan type. Another six online schools
earned between 34.0% and 41.9% of points, designating them with a Priority Improvement plan type.
Finally, three online schools earned fewer than 34.0% of total points, putting them in Turnaround status.
The tables included in the appendix show that Destination Career Academy’s performance in 2016 relative
to other online schools was generally consistent with its performance from 2012 through 2014.
Looking specifically at the middle school level, Destinations Career Academy’s performance in 2016
placed it at the very bottom of the rankings for online schools across the state in terms of the total
percentage of points earned across the Achievement and Growth indicators. There were 16 schools with
enough data to determine a separate rating at the middle school level, and Destinations Career Academy
ranked 16th.
Looking specifically at the high school level, Destinations Career Academy’s performance in 2016
placed it near the bottom of online schools with data in terms of the total percentage of points earned
across the Achievement, Growth, and Post-Secondary and Workforce Readiness indicators. There were 16
schools with enough data to determine a separate rating at the high school level, and Destinations Career
Academy ranked 14th.
Achievement Ratings Compared to Other Online Schools
The tables in Appendix C provide additional context for Destinations Career Academy by showing
the school’s performance on individual performance indicators relative to the performance of other online
schools. There were 21 online schools that had enough data for CDE to determine an overall rating on the
Academic Achievement indicator on the 2016 performance framework. Destinations Career Academy
ranked 17th out of 21 in terms of the percentage of points earned on the Achievement indicator. It was
among 12 online schools that earned an Approaching rating on the Achievement indicator.
Looking only at the performance of middle school students, there were 16 online schools that had
enough data for CDE to determine an overall rating on the Academic Achievement indicator on the 2016
performance framework. Destinations Career Academy ranked 14th in terms of the percentage of points
earned on the Achievement indicator. It was among three online schools that earned a “Does Not Meet”
rating on the Achievement indicator at the middle school level.
Looking only at the performance of high school students, there were 18 online schools that had
enough data for CDE to determine an overall rating on the Academic Achievement indicator on the 2016
performance framework. Destinations Career Academy ranked 12th in terms of the percentage of points
earned on the Achievement indicator. It was among eight online schools that earned an “Approaching”
rating on the Achievement indicator at the high school level.

18
Growth Ratings Compared to Other Online Schools
There were 13 online schools that had enough data for CDE to determine an overall rating on the
Academic Growth indicator on the 2016 performance framework. Destinations Career Academy ranked 11th
out of 13 in terms of the percentage of points earned on the Growth indicator. It was among nine online
schools that earned an “Approaching” rating on the Achievement indicator.
Looking only at the performance of middle school students, there were 12 online schools that had
enough data for CDE to determine an overall rating on the Academic Growth indicator. Destinations Career
Academy ranked 9th out of 12 in terms of the percentage of points earned on the Growth indicator. It was
among three online schools that earned an “Approaching” rating on the Growth indicator at the middle
school level.
Destinations Career Academy high school level did not have enough data for CDE to determine an
overall rating on the Academic Growth indicator on the 2016 performance framework. On the 2014
framework, the school earned 50% of points on the Growth indicator, which ranked 9th out of 11 schools
with sufficient data for that year. In 2014, it was one of two schools that earned an “Approaching” rating on
the Growth indicator at the high school level.
PWR Ratings Compared to Other Online Schools
There were 27 online schools that had enough data for CDE to determine an overall rating on the
Post-Secondary and Workforce Readiness indicator on the 2016 performance framework. Destinations
Career Academy ranked 21st in terms of the percentage of points earned on the Post-Secondary and
Workforce Readiness indicator. It was among 14 (out of 27) online schools that earned a “Does Not Meet”
rating on the Post-Secondary and Workforce Readiness indicator.
This section is designed to provide a summary of a qualitative review of district and school systems
and conditions. Research on school turnaround shows that certain conditions are essential in establishing a
strong foundation for rapid school improvement.3 Schools on track to improve student achievement are
likely to show strong evidence of highly-functioning leadership, culture, academic systems, district support
structures and board and community relationships.
Based on site visits to the Julesburg School District over several years, the CDE Field Manager found
the education of children in the brick and mortar schools to be of good quality. Julesburg Elementary School
and Julesburg High School have a strong school culture, solid instructional practices, and a community that is
3 Public Impact. (2008). School Turnaround Leaders: Competencies for Success; Mass Insight Education & Research Institute. (2007). The Turnaround Challenge: Why America’s best opportunity to dramatically improve student achievement lies in our worst-performing schools; Player, D. Hitt, D.H. and W. Robinson, W. (2014). District Readiness to Support School Turnaround. University of Virginia Partnership for Leaders in Education.

19
supportive of its schools. As discussed above, the district’s priority improvement rating is linked to the rating
of the online school, Destinations Career Academy of Colorado. Thus, the following evaluation of systems
and conditions relates to the operation of the online school.
Leadership & Staff
Superintendent Shawn Ehnes has been leading Julesburg School District for over 15 years.
Teri Cady has worked with Destinations Career Academy since August 2013 and became the Head of
School in January 2016.
As the management entity, K12 Inc. is an involved partner with Julesburg staff. According to the
State Review Panel, K12 provides leadership around improvement strategies and is in regular
contact with school and district leaders and board of education members.
Also according to the State Review Panel, “the relationship of the district, K12 leadership, and the
[school] leadership team was not well defined” when the Panel visited in 2015.
Destinations Career Academy teachers live and work from various locations across Colorado.
School Culture
While Destinations Career Academy students live in different locations across the states, the school
offers face-to-face events in different locations, including field trips, school clubs, college visits and
other extra-curricular activities.
Student mobility has been a significant issue for the school with 50 to 70 percent of students being
new to the school each year, according to CDE data.
The online school focuses on a culture of career readiness and has recently implemented eight
career pathways in business management and administration, health sciences and information
technology (IT). Counselors work with students to select a career pathway that drives their academic
and career goals.
Additionally, the school is developing chapters of career-based student organizations to strength the
culture of the school and increase student engagement. Examples of such associations are DECA,
which is a national association for high school students interested in market, finance, hospitality and
business, and HOSA, an organization for students interested in health professions.
Academic Systems
K12, Inc. provides Destinations Career Academy with the online learning platform, the curriculum,
support on student data, and other professional development.
The school is aligning its programming with the newly-established career and technical education
(CTE) pathways and courses in business, health and IT. The school intends to create additional CTE
pathways in the coming years.
The online program includes both synchronous (all students are online at the same time) and
asynchronous (students log on at different times) course options. All students are required to
participate in at least some synchronous courses where instruction is “live” and students can
interact with one another and with the instructor through chat boxes and audio.

20
Students are assessed with course-specific assessments as well as formative benchmark
assessments.
The district also uses STAR 360 as an interim assessment tool.
Destinations Career Academy requires that each student have a “learning coach” at or near their
home to support their learning and hold them accountable to completing their work. Middle school
students tend to need more adult supervision and facilitation than high school students, and,
therefore, this model is more critical to their success.
District Support and Flexibility
The district has allocated attention and support to its online school and has remained involved in
the operation of the school in partnership with the school’s management organization, K12.
The district offers Destinations Career Academy online courses to its Julesburg High School students
as an option for acceleration and to provide additional elective courses. This arrangement benefits
the high school students who can take one or two supplemental, online courses, and it also provides
a linkage between the district’s two schools.
Board and Community Relations
The State Review Panel interviewed the Julesburg Board of Education and found the board members
have “high pride in the district and a clear commitment to a quality education for students.”
According to the Superintendent, the local school board of education and the community have been
supportive of the online school since its inception.
Having the online school authorized by Julesburg School District brings additional revenue into the
rural community to support an extended school day, summer school at the elementary level, arts
and music programming, among other initiatives.4
The board of education regularly receives updates (at least monthly) from district and school
leadership on local data concerning student progress and on the efforts to improve outcomes.
The board has been involved in considering options for Destinations Career Academy as the school
as progressed on the accountability clock.
Julesburg Re-1 School District submitted their UIP in January 2017 on time. Because Julesburg is a district with enrollment less than 1000 students, they submitted a “combined” plan, meaning both district- and all school-level requirements are included within one plan. CDE staff members reviewed the plan and found it to be in good order with minimal required changes. A summary of CDE feedback over time can be found in Appendix B.
4 As described in the 2015 State Review Panel report and in the Chalkbeat article, “More students choicing out of district,” Jan. 18, 2011. http://www.chalkbeat.org/posts/co/2011/01/18/more-students-choicing-out-of-district/

21
Current School UIP Summary
The following items were pulled directly from the school’s Unified Improvement Plan submitted to CDE in January 2017. The district refers to Destinations Career Academy of Colorado as “CODCA.”
Where are students continuing to struggle most?
Priority Performance Challenges: Specific statements about the district’s performance challenges (not budgeting, staffing curriculum, instruction, etc.), with at least one priority identified for each performance indicator(Achievement , Growth, Growth Gaps, PWR) where the district did not meet federal, state and/or local expectations.
1. CODCA: Middle and High School PARCC ELA scores are below State expectations and is a focus
of improvement at CODCA.
2. CODCA: Middle and High School PARCC Math scores are below State expectations and is a
focus of improvement at CODCA.
3. CODCA: Middle School CMAS Science scores are below State expectations and is a focus of
improvement at CODCA.
4. CODCA: While improving, graduation rates and dropout rates are below expectation and a
focus area at the school.
5. Julesburg ES: Student growth in Writing.
6. Julesburg ES: Student growth in Math, with special emphasis on Minority students.
7. Julesburg ES: Students with Disabilities (Growth) in Reading, Writing and Math.
8. Julesburg MS/HS: Student growth in Language Usage/Writing.
9. Julesburg MS/HS: Math Achievement at all grade levels.
Why is the school continuing to have this problem(s)?
Root Causes: Statements describing the deepest underlying cause, or causes, of performance challenges, that, if dissolved, would result in elimination, or substantial reduction of the performance challenge(s).
1. CODCA needs to continue to improve upon an effective MTSS model across all subject areas at
both the MS and HS levels, ensuring thorough data analysis, effective differentiated
instruction, and progress monitoring of student interventions.
2. CODCA needs to continue its purposeful writing and math intervention models to include the
following criteria: student identification through fall assessments in STAR360 and curricular
assessments, specific small group intervention classrooms targeting fundamental skills and
academic needs, school accountability measures for student attendance, and quality teacher
instruction at all intervention sessions.
3. CODCA needs to continue its intentional cycle of student data analysis, reflection, and
adaptation of action steps resulting from analysis of student data.
4. CODCA needs to fully develop its CTE program, the Career Academy, to offer students a
unique, individualized and meaningful school environment. This program will allow students to
take career based courses, gain experience in a career field, and participate in career based
student organizations.

22
5. Julesburg ES: A need for greater emphasis on grammar (capitalization, punctuation,
organization, and spelling and its application) with application to written work.
6. Julesburg ES: A need for students to include multiple details to support ideas in both the short-
constructed responses items and the extended response items on the state assessment.
7. Julesburg ES: Grouping of students to meet individual needs with grade-level material (within
our existing daily schedule) so students will receive targeted instruction based on individual
needs
8. Julesburg ES: Students on IEPs are not showing the growth and achievement expected and this
is possibility related to the complexity of the curriculum used and not enough practice time on
skills needed.
9. Julesburg ES: Students needing to catch up requiring additional time for reteach and skills
practice.
10. Julesburg MS/HS: A need to identify struggling students at the beginning of the school year and
begin in class and out of class targeted interventions.
11. Julesburg MS/HS: A need to enhance the MTSS Process, utilization of intervention resources
and acquisition of additional intervention resources.
12. Julesburg MS/HS: A need to enhance vertical articulation of curriculum/academic content
standards/assessment between elementary and jr. high school, especially in math.
13. Julesburg MS/HS: A need to enhance utilization of Aims Web progress monitoring and NWEA
Assessments to determine if interventions are improving student academic performance.
What action is the school taking?
Major Improvement Strategies: An overall approach that describes a series of related actions intended to result in improvements in performance.
1. CODCA will fully develop its CTE program, the Destinations Career Academy, providing 8 career
course pathways for students (and more in future years), student career based organizations,
and work experience opportunities to all high school students.
2. CODCA administration and staff will continue to implement engaging and data-driven
instruction across all subject areas at both middle and high schools.
3. CODCA administration and staff will continue to implement a continuous cycle of progress
monitoring of school data, resulting in modifying improvement action steps as necessary.
4. Julesburg ES will continue Implementation of the Walk-To-Read Literacy Block.
5. Julesburg ES will adopt a research Validated/Needs Based Tier Three English Language Arts
Curriculum for Identified Tier 3 Students.
6. Julesburg ES will continue alignment of our School-Wide Writing Program.
7. Julesburg ES will continue a targeted academic skills After-School Intervention (4th-6th Grades)
(Aspire)
8. Julesburg MS/HS will strengthen implementation of aligned curriculum, instruction and
assessment with Colorado Academic Standards with focus on vertical articulation of curriculum

23
and assessments between 6th and 7th grade in core subject areas (math, science, language
arts).
9. Julesburg MS/HS will develop process/system/practices/activities that actively engage teachers
in the consistent analysis and utilization of Student Learning Outcome (SLO) assessment data
(Classroom Assessments, NWEA, and Aims Web) to drive their decisions about what
content/curriculum to teach or not teach and inform their decisions about the need for the
implementation of differentiated/targeted intervention instructional strategies to meet the
needs of their struggling and advanced learners.
History of Supports Available from the State on UIP Development
The school has had access to universal and targeted supports from CDE on its UIP development.
Universal supports include regional trainings held each spring and fall and access to many resources (e.g.,
quality criteria, UIP Handbook, online tutorials, sample plans) on CDE’s website. CDE has also worked
directly with the district and the online school on their plan development.
The Department’s records indicate that Julesburg has not applied for a competitive funding
opportunity over the past five years, with the exception of a small Race to the Top Early Childhood
Readiness grant. Through that grant, the district was awarded approximately $650.00 over three school
years from 2013-14 to 2015-16. The grant supported the development and expansion of early childhood
(pre-K) education programs.
Department staff reviewed the State Review Panel’s final recommendation report, which was based
on their 2015 document review and one and a half-day site visit. The Panel conducted an evaluation for both
the district and for Destinations Career Academy of Colorado (formerly Insight School of Colorado). This
summary provides a synthesis of both of these reports and the Department’s response to some of the
findings.
The State Review Panel recommendation for both Julesburg Re-1 School District and Destinations
Career Academy of Colorado (formerly Insight School of Colorado) was in favor of the continuation of the
management partnership with K-12, Inc. for Destinations Career Academy. The Panel’s reasoning was that
K12 only took over the management of the school two years prior to the State Review Panel evaluation and
needed more time to implement key structure and systems to increase student outcomes. The school had a
tumultuous leadership period prior to K12, Inc. taking over; the Panel felt that additional time was
warranted for the school to demonstrate achievement gains. Specifically, the Panel recommended that
school be given two more years (until 2017) to:

24
“provide evidence they have clearly defined the purpose of the school and to identify students they
can serve within the system of programming and services offered versus those they cannot serve to
ensure students achieve their goals. The school also needs to be able to provide evidence of positive
benefit by collecting and reporting measures of school effectiveness including reenrollment rates,
student and parent engagement and satisfaction, and cohort achievement and graduation rates. If
[Destinations Career Academy] is unable to demonstrate positive changes in these performance
indicators, the SRP recommends the school’s closure.”
The State Review Panel evaluation was conducted in spring 2015, and thus it has been nearly two
years since that recommendation was written. CDE finds that there have been incremental improvements
reported for the high school. While the graduation rate is still extremely low, it doubled in two years from
15.2% in 2014 to 36.2% in 2016. The high school also earned enough points on the state performance
framework to be rated as Improvement in 2016, up from Priority Improvement the year before (according to
CDE’s calculations). Further, the school has refined its mission to focus on career and technical education
pathways. For these reasons, the Department concludes that as the Panel noted, the school has identified
that they can continue serving and offering value to high school students, whereas the school is not well
positioned to continue serving middle school students.
The Panel found the school to be “Developing” in the areas of adequate leadership to implement
change and demonstrating an infrastructure to support improvement efforts (see Table 14 below); however,
the capacity of the personnel to plan effectively for appropriate action and to engage productively with
external partners was rated as “Not Effective.” The likelihood of positive returns on state investments of
assistance and support to improve the performance within the current management structure and staffing
was also rated as “Not Effective.” The district, on the other hand, was rated as “Developing” on four of the
five criteria and as effective on the fifth criteria concerning returns on state investments of support (see
Table 15).
In regards to the sixth criteria that assesses the need for a district to remain in operation, the Panel
found that there is a need for the district to remain open as it serves a small population in an isolated rural
community, and the district’s brick and mortar schools are rated as Performance. In regards to the online
school, however, the Panel stated that there is not a necessity for Destinations Career Academy to remain in
operation to serve students. The Panel wrote: “While the school staff indicated there are students for whom
this school is necessary because of their remote location or need for flexible school schedules, there was no
data provided or other documentation to suggest a clear picture of students who enroll and reasons for
choosing [Destinations Career Academy]. As a result, it is not possible to determine that this is the best
option for these students.” The State Review Panel also cited the high level of student turnover each year in
its rationale for the rating.
The Panel did not recommend Innovation status for the district or the school because there is no
evidence that the online school needs additional flexibility. The Panel noted, “By its very nature, as an online
school, [Destinations Career Academy] already enjoys significant autonomy and flexibility in terms of hours
of attendance, length of school year and personnel. As a result, it is not clear that [Destinations Career
Academy] would benefit from Innovation Status.”

25
For the same reasons, the Panel did not recommend charter status for the Julesburg School District
or Destinations Career Academy. The Panel stated, “The school is already an online choice option for
Julesburg students and for students and their families living across Colorado. Therefore, it is not clear how
conversion to a charter would benefit the school or district at this time.”
The Panel did not recommend school closure at this time because they found evidence to suggest
that with stability in the management organization and school leadership, and with a refined school mission,
the school could start showing signs of student success. Instead, as discussed above, the Panel recommends
allowing K12, Inc. to operate the school for “an additional period of two years to manifest their
improvement potential.”
Lastly, the Panel did not recommend district reorganization for the Julesburg School District
because it was found to be “Developing” or “Effective” on the Panel’s rubric. Moreover, the closest
neighboring district is over 30 miles away and the brick and mortar schools within Julesburg are rated the
same as those within neighboring districts—at Performance.
Table 14: State Review Panel Site Visit Summary: Insight School of Colorado at Julesburg (now Destinations Career Academy of Colorado)
SRP Site Visit Summary Capacity Level*
1. The leadership is adequate to implement change to improve results. Developing
2. The infrastructure is adequate to support school improvement. Developing
3. There is readiness and apparent capacity of personnel to plan effectively and lead the implementation of appropriate action to improve student academic performance.
Not Effective
4. There is readiness and apparent capacity to engage productively with and benefit from the assistance provided by an external partner.
Not Effective
5. There is likelihood of positive returns on state investments of assistance and support to improve the performance within the current management structure and staffing.
Not Effective
6. There is necessity that the school/district remain in operation to serve students. No
*Capacity levels include: Not Effective, Developing, Effective and Highly Effective
Table 15: State Review Panel Site Visit Summary: Julesburg Re-1 School District
SRP Site Visit Summary Capacity Level*
1. The leadership is adequate to implement change to improve results. Developing
2. The infrastructure is adequate to support school improvement. Developing
3. There is readiness and apparent capacity of personnel to plan effectively and lead the implementation of appropriate action to improve student academic performance.
Developing
4. There is readiness and apparent capacity to engage productively with and benefit from the assistance provided by an external partner.
Developing
5. There is likelihood of positive returns on state investments of assistance and support to improve the performance within the current management structure and staffing.
Effective
6. There is necessity that the school/district remain in operation to serve students. Yes
*Capacity levels include: Not Effective, Developing, Effective and Highly Effective
26
The Department has reviewed a draft of the school closure plan and finds that it follows the
statutory guidance concerning school closure (see below for a copy of the guidance). There is a clear
rationale, and a thoughtful communication plan and transition plan. The district is planning to notify the
middle school families currently enrolled in the online school (grades 6 and 7) through written
communication and individual meetings in late March through April/May as needed.
The district described in their closure plan that they will follow up with the affected families in the
summer to ensure all students have been enrolled in a new school. The plan demonstrates intent on the
part of the district to work with current 6th and 7th grade families to ensure that they become enrolled in a
new school that best fits their needs (the 8th graders will have the option of staying in the school for 9th
grade). The plans states:
“For our students in 6th and 7th grades we will discuss schooling options with the family to include the following:
If the student would like to remain in an online school model, we will work with the family
to understand other online school options and assist family with enrollment into school of
their choice.
If the student would like to return to a local district school, we will work with the family to
be sure enrollment is seamless into that school.
If the student would like to attend a charter or another school of choice option, we will
explore varying options together and also assist in enrollment as we are able.
For any student utilizing CODCA’s Special Services, such as an IEP, ALP, and/or 504, we will
ensure all documentation follows the student to the new school and will assist in the
transition of the student into the new environment.
CODCA leadership will stay in touch through email/phone with all of these families as the
year progresses, ensuring they are aware of options to return to CODCA once in the high
school grades.”
Statutory School Closure Plan Requirements C.R.S. 22-11-307 (5) (a) If a local school board or the institute decides or is directed by the state board to close a public school because of low performance, the school district and the institute must develop and update as necessary a school closure plan that implements evidence-based best practices during the school closure process to ensure that students who are enrolled in the public school that is closed are fully supported in enrolling in the successor public school, if any, or in another public school. The local school board or the institute shall make the school closure plan and any updates available in writing to the staff of the public school, the local teachers association, if any, the parents of students enrolled in the public school, and the community surrounding the public school. At a minimum, the school closure plan must include:
(I) A plan for communicating in writing with parents, school staff, the local teachers association, if any, and the community surrounding the public school as early as possible after the local school

27
board or the institute decides to close the public school and at regular intervals throughout the closure process; (II) The procedures or mechanisms by which the local school board and the institute will solicit and consider input on the school closure process from the staff of the public school, the local teachers association, if any, the parents of the students enrolled in the public school, and the community surrounding the public school; (III) A timeline for closing the public school that includes or is updated to include all major steps and decision points in completing the school closure and starts no later than the decision to close and continues at least through the reassignment of students and the opening of a new public school, if applicable; and (IV) A plan for reassigning students to other public schools, which must, to the fullest extent practicable, take into account parents' choice concerning the public schools to which students are reassigned.
28
State law requires that the Colorado State Board of Education and the Colorado Department of
Education hold all districts and schools accountable for student performance (C.R.S. 22-11-101 et al.).
The state annually evaluates student performance in districts and schools through a set of consistent,
objective measures, and then uses this information to inform rewards, sanctions, and supports. Districts
and schools assigned to a Priority Improvement or Turnaround plan have the lowest performing student
outcomes of all districts and schools in Colorado, according to the state’s primary accountability tool—
the District and School Performance Framework (DPF/SPF) reports. The DPF and SPF reports are based
on key Performance Indicators that the state has determined to be most indicative of how prepared
students are for college and career: achievement, growth, and postsecondary and workforce readiness,
which each indicator including the disaggregated results for different student groups. Districts and
schools on Priority Improvement or Turnaround plans tend to be falling short of state expectations for
students in each of these areas. Guidance on the 2016 School and District Performance Frameworks can
be accessed at: http://www.cde.state.co.us/accountability/performanceframeworksresources.
Pursuant to the Education Act of 2009, Article 11 of Title 22, C.R.S., a district or the Charter
School Institute (Institute) may not remain Accredited with Priority Improvement Plan or Accredited
with Turnaround Plan for longer than five consecutive years before the State Board removes the
district’s/Institute’s accreditation. In State Board of Education rules, 1 CCR 301-1, section 5.07, the
calculation of the five consecutive years begins July 1 of the summer immediately following the fall in
which the district/Institute is notified that it is Accredited with Priority Improvement Plan or Accredited
with Turnaround Plan.
The Education Act of 2009, Article 11 of Title 22, C.R.S., outlines similar consequences for
schools. Schools may not implement a Priority Improvement or Turnaround Plan for longer than five
consecutive years before the district or Institute is required to restructure or close the school. According
to State Board of Education rules, 1 CCR 301-1, section 10.05, the calculation of the five consecutive
years begins July 1 of the summer immediately following the fall in which the school is notified that it
must implement a Priority Improvement or Turnaround Plan.
These statutory timelines are referred to as the “Accountability Clock.” The processes associated
with each typical year of the clock, from the notification/planning Year 0 to the final Year 6, including
actions directed by the State Board of Education at the end of the Accountability Clock, are detailed in
the timeline below.
Following the passage of HB15-1323, accreditation ratings and school plan types were not
assigned in Fall 2015. As a result, the 2015-16 school year was removed from the calculation of five
consecutive school years for both school districts and individual schools. This one year pause means that
the 2016-17 school year resumes where the 2014-15 school year left off in terms of the accountability
clock.
The Accountability Clock is in effect for a district or school as long as it is assigned a Priority
Improvement or Turnaround Plan. The Accountability Clock stops for a district or school once the State
Board adopts an SPF/DPF with a rating of Improvement or higher. At that point, the district or school
would be considered to have exited Priority Improvement or Turnaround status. If a district or school is
on Turnaround and moves to Priority Improvement the Accountability Clock continues and is not reset.

29
If a school or district receives a plan type of Priority Improvement or Turnaround for more than
five consecutive years, then the State Board of Education must direct an action to the local board of
education. The State Board has discretion to take action prior to the end of the Accountability Clock for
schools and districts with Turnaround plans.
Schools and districts on the Accountability Clock for any period of time should be implementing
research-based strategies of appropriate scope and intensity to improve student outcomes. After five
consecutive years, the local board will be directed by the State Board of Education as to which strategy,
or pathway, to pursue. This may include school closure, converting schools to a charter school, working
with an external management partner, seeking innovation status for a school or group of schools, or
district reorganization. In considering appropriate actions, the State Board will refer to
recommendations from the State Review Panel and from the Commissioner of Education. School
districts may also provide a proposal for their preferred pathway to the State Board.
For more information on the accountability clock, please visit: http://www.cde.state.co.us/accountability/accountability_clock.
Since 2010, the district has been Accredited with a Priority Improvement plan, with CDE conducting
annual reviews of the UIP. Following the review of the UIP, CDE provides feedback to the district and
requires, in some cases, that changes be made to the plan before it is publicly posted or within the next
year. Over time, the feedback from CDE to the district regarding its UIP has shifted emphasis from
strengthening specific elements within the plan (e.g. root cause and trend analysis) to ensuring that all
systems (the online school and brick and mortar schools) are addressed within the plan. While the plan
meets many of the quality criteria, there has been more concern about the plan’s emphasis on the
online school. CDE has continually requested that the plan be revised to include more information about
the district as a whole, rather than solely focusing on the online school. In 2015-16 the UIP included this
requested information.
School Year
Required Changes
Summary of Required Changes
2016-17 Yes, minimal
The plan responds to CDE’s request to migrate to the UIP Online System, thus strengthening alignment throughout the plan. This is especially important to the district since they write a combined plan (both brick and mortar schools and the online school are included within the same plan). Due to the district’s challenges with participation on the State Assessment, CDE recommends that the district continue to implement strong local assessments and corresponding data collection processes. Other recommendations include strengthening root causes and root cause verification (supported with local data), as well as incorporating outcome-based implementation benchmarks to ensure effective progress monitoring.
2015-16 Yes, minimal
The plan responds to CDE’s feedback requesting inclusion of state-mandated requirements pertaining to the district and all district schools (not just the online school). CDE recognizes the unique challenges faced in writing a
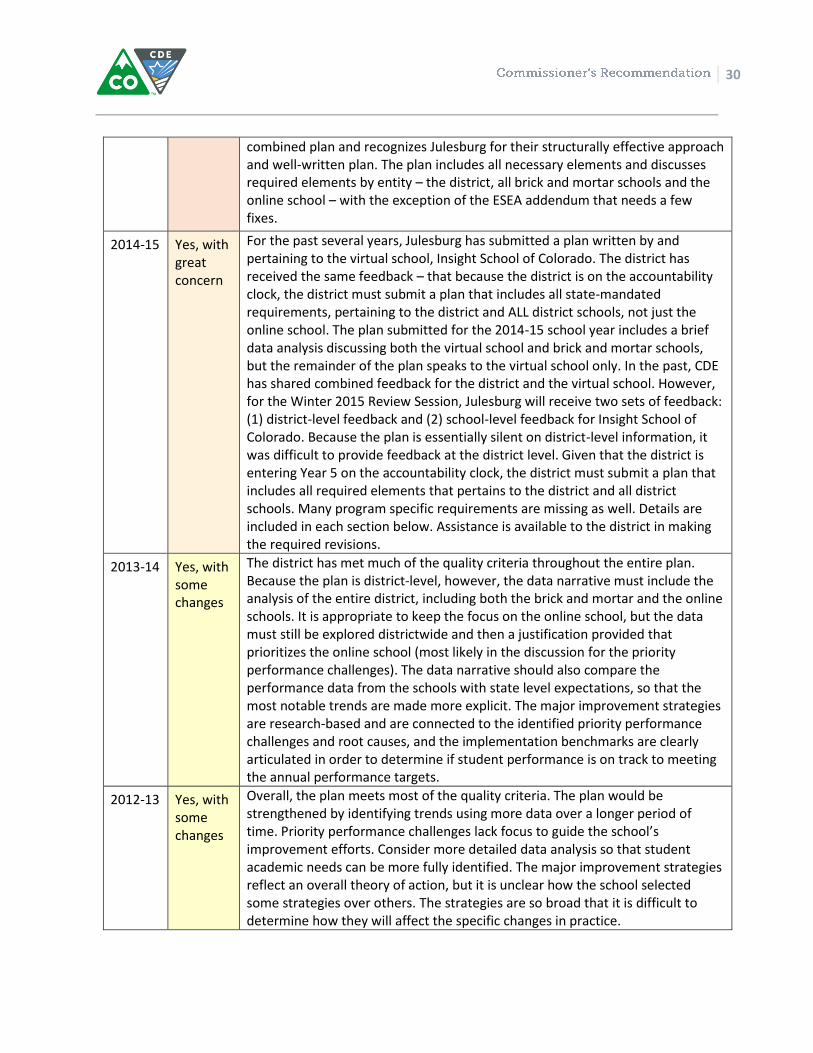
30
combined plan and recognizes Julesburg for their structurally effective approach and well-written plan. The plan includes all necessary elements and discusses required elements by entity – the district, all brick and mortar schools and the online school – with the exception of the ESEA addendum that needs a few fixes.
2014-15 Yes, with great concern
For the past several years, Julesburg has submitted a plan written by and pertaining to the virtual school, Insight School of Colorado. The district has received the same feedback – that because the district is on the accountability clock, the district must submit a plan that includes all state-mandated requirements, pertaining to the district and ALL district schools, not just the online school. The plan submitted for the 2014-15 school year includes a brief data analysis discussing both the virtual school and brick and mortar schools, but the remainder of the plan speaks to the virtual school only. In the past, CDE has shared combined feedback for the district and the virtual school. However, for the Winter 2015 Review Session, Julesburg will receive two sets of feedback: (1) district-level feedback and (2) school-level feedback for Insight School of Colorado. Because the plan is essentially silent on district-level information, it was difficult to provide feedback at the district level. Given that the district is entering Year 5 on the accountability clock, the district must submit a plan that includes all required elements that pertains to the district and all district schools. Many program specific requirements are missing as well. Details are included in each section below. Assistance is available to the district in making the required revisions.
2013-14 Yes, with some changes
The district has met much of the quality criteria throughout the entire plan. Because the plan is district‐level, however, the data narrative must include the analysis of the entire district, including both the brick and mortar and the online schools. It is appropriate to keep the focus on the online school, but the data must still be explored districtwide and then a justification provided that prioritizes the online school (most likely in the discussion for the priority performance challenges). The data narrative should also compare the performance data from the schools with state level expectations, so that the most notable trends are made more explicit. The major improvement strategies are research‐based and are connected to the identified priority performance challenges and root causes, and the implementation benchmarks are clearly articulated in order to determine if student performance is on track to meeting the annual performance targets.
2012-13 Yes, with some changes
Overall, the plan meets most of the quality criteria. The plan would be strengthened by identifying trends using more data over a longer period of time. Priority performance challenges lack focus to guide the school’s improvement efforts. Consider more detailed data analysis so that student academic needs can be more fully identified. The major improvement strategies reflect an overall theory of action, but it is unclear how the school selected some strategies over others. The strategies are so broad that it is difficult to determine how they will affect the specific changes in practice.

31
2011-12 Yes, with some changes
Overall, the plan met most of the quality criteria. Consider reframing the root cause for student engagement to explain what the adults in the district need to do to better engage students in the learning process. Consider the role the district plays in interacting with parents regarding their role in the online education process. (Definition of “root cause” includes conditions that are within the control of the district.) Insight (the online school) is mentioned in the plan, however the district’s relationship with Insight regarding the plan development process and role in ownership of performance is unclear. The efforts described in the major improvement strategies could be enhanced to respond to the specific needs of online environments. Consider referring to http://www.inacol.org/research/nationalstandards/iNA COL_CourseStandards_2011.pdf as a resource. Some action steps provided are broad, spanning the majority of the year, or they are actions that are taken annually. While this is important, the plan could also provide more detail on the specific steps that will be taken in an initial year of laying the groundwork for recurring annual actions.

32

Rating Points Rating Points Rating Points Rating Points
Overall Rating Priority Improvement 36.3% Priority Improvement 37.5% Priority Improvement 42.5% Priority Improvement 38.3%
Middle School Rating - Priority Improvement 42.5% Priority Improvement 43.4% Turnaround Plan 32.5%
High School Rating Priority Improvement 36.3% Priority Improvement 37.0% Priority Improvement 44.8% Improvement 44.7%
*Indicates Multi-District Online
Rating Points Rating Points Rating Points Rating Points
TCA COLLEGE PATHWAYS* Performance 94.2% Performance 84.2% Performance 98.5% Performance Plan 88.6%
PSD GLOBAL ACADEMY* Priority Improvement 59.3% Improvement 52.4% Improvement 50.4% Performance Plan 80.8%
COLORADO DIGITAL ACADEMY - MIDDLE* - - - Performance Plan 62.5%
SPRINGS STUDIO FOR ACADEMIC EXCELLENCE* Priority Improvement 43.5% Performance 74.6% Performance 66.8% Performance Plan 60.8%
ACADEMY CALVERT K-8 ONLINE SCHOOL* Improvement 47.6% Improvement 56.4% Performance 61.2% Performance Plan 60.0%
DENVER ONLINE HIGH SCHOOL* Priority Improvement 35.2% Improvement 55.0% Improvement 47.6% Performance Plan 58.3%
BRANSON SCHOOL ONLINE* Improvement 52.2% Improvement 53.6% Priority Improvement 57.5% Performance Plan 57.7%
COLORADO VIRTUAL ACADEMY (COVA)* Priority Improvement 38.6% Priority Improvement 38.6% Priority Improvement 42.7% Performance Plan 55.5%
ACADEMY ONLINE* Performance 75.1% Performance 100.0% Improvement 50.0% Improvement Plan 52.8%
PEAK VIRTUAL ACADEMY - Priority Improvement 50.0% Improvement 48.8% Improvement Plan 51.8%
VALIANT ACADEMY* - - Performance 62.8% Improvement Plan 50.0%
COLORADO CONNECTIONS ACADEMY* Improvement 48.7% Improvement 50.8% Improvement 54.1% Improvement Plan 49.9%
JEFFCO'S 21ST CENTURY VIRTUAL ACADEMY* Priority Improvement 55.9% Turnaround 37.1% Turnaround 43.2% Improvement Plan 49.7%
GRAND RIVER ACADEMY Priority Improvement 37.2% Priority Improvement 37.6% Improvement 49.2% Improvement Plan 46.8%
ST. VRAIN GLOBAL ONLINE ACADEMY Turnaround 25.1% Priority Improvement 33.4% Priority Improvement 40.2% Priority Improvement Plan 40.7%
COLORADO PREP ACADEMY* - - Improvement 53.2% Priority Improvement Plan 39.2%
DESTINATIONS CAREER ACADEMY OF COLORADO* Priority Improvement 36.3% Priority Improvement 37.5% Priority Improvement 42.5% Priority Improvement Plan 38.3%
ROCKY MOUNTAIN DIGITAL ACADEMY* - - - Priority Improvement Plan 37.4%
HOPE ONLINE LEARNING ACADEMY MIDDLE SCHOOL* - - Turnaround 36.0% Priority Improvement Plan 37.3%
ELEVATE ACADEMY* - - - Priority Improvement Plan 36.7%
PIKES PEAK ONLINE SCHOOL* - - Turnaround Plan 32.8%
ENGAGE ONLINE ACADEMY* - - Turnaround 25.2% Turnaround Plan 32.5%
MONTE VISTA ON-LINE ACADEMY* Performance 61.6% Improvement 57.6% Priority Improvement 43.6% Turnaround Plan 28.8%
EDISON ACADEMY* Performance 62.6% Performance 87.4% Performance 100.0% Insufficient Data (PWR Only)
EDCSD: COLORADO CYBER SCHOOL* Priority Improvement 48.9% Turnaround 42.1% Improvement 60.5% Insufficient Data (PWR Only)
BOULDER UNIVERSAL* Priority Improvement 50.0% Improvement 66.6% Priority Improvement 55.1% Insufficient Data (PWR Only)
BOLT ACADEMY - - Improvement 50.0% Insufficient Data (PWR Only)
SOUTHWEST COLORADO E-SCHOOL* Improvement 50.0% Improvement 52.4% Turnaround 25.1% Insufficient Data (PWR Only)
CANON ONLINE ACADEMY - Turnaround 25.1% Turnaround 25.1% Insufficient Data (PWR Only)
WORLD ACADEMY - - Turnaround 25.1% Insufficient Data (PWR Only)
CENTER VIRTUAL ACADEMY - Turnaround 25.1% - Insufficient Data (PWR Only)
HOLYOKE ALTERNATIVE SCHOOL - - - Insufficient Data (PWR Only)
V.I.L.A.S. ONLINE SCHOOL* Turnaround 27.7% Turnaround 25.1% Performance 68.8% Insufficient Data
MOUNTAIN VIEW VIRTUAL* - - - Insufficient Data
AIM GLOBAL* - - - New School
IMMERSION SCHOOLS SCIENCE TECHNOLOGY ARTS* - - - New School
Total Ratings for All Online Schools
Total Ratings for Destinations Career Academy of Colorado20162012 2013 2014
1-Year SPF Results
2014 20161-Year SPF Results
2012 2013

ACHIEVE BLENDED LEARNING ACADEMY - - - New School
PEYTON ONLINE ACADEMY* - - - New School
PIKES PEAK EARLY COLLEGE* - - - New School
COLORADO CONNECTIONS ACADEMY @ DURANGO* - - - New School
*Indicates Multi-District Online
Rating Points Rating Points Rating Points Rating Points
PSD GLOBAL ACADEMY* Priority Improvement 55.6% Performance 83.2% Performance 83.2% Performance Plan 100.0%
TCA COLLEGE PATHWAYS* Performance 92.5% Performance 81.3% Performance 94.5% Performance Plan 83.3%
ACADEMY CALVERT K-8 ONLINE SCHOOL* Improvement 47.2% Performance 72.3% Performance 80.7% Performance Plan 75.0%
COLORADO DIGITAL ACADEMY - MIDDLE* - - - Performance Plan 62.5%
BRANSON SCHOOL ONLINE* Improvement 58.6% Priority Improvement 45.6% Improvement 62.6% Performance Plan 57.9%
SPRINGS STUDIO FOR ACADEMIC EXCELLENCE* Priority Improvement 37.5% Performance 70.3% Improvement 53.2% Performance Plan 57.9%
GRAND RIVER ACADEMY Priority Improvement 38.9% Turnaround 26.6% Improvement 54.2% Performance Plan 57.5%
COLORADO CONNECTIONS ACADEMY* Improvement 47.5% Improvement 51.1% Improvement 57.7% Performance Plan 56.8%
PEAK VIRTUAL ACADEMY - - Priority Improvement 41.6% Improvement Plan 50.0%
ELEVATE ACADEMY* - - - Priority Improvement Plan 39.3%
COLORADO PREP ACADEMY* - - Improvement 48.5% Priority Improvement Plan 38.6%
ENGAGE ONLINE ACADEMY* - - - Priority Improvement Plan 37.5%
HOPE ONLINE LEARNING ACADEMY MIDDLE SCHOOL* - - Turnaround 36.0% Priority Improvement Plan 37.3%
JEFFCO'S 21ST CENTURY VIRTUAL ACADEMY* - - Turnaround 33.3% Priority Improvement Plan 35.0%
ROCKY MOUNTAIN DIGITAL ACADEMY* - - - Turnaround Plan 32.8%
DESTINATIONS CAREER ACADEMY OF COLORADO* - Priority Improvement 42.5% Priority Improvement 43.4% Turnaround Plan 32.5%
EDCSD: COLORADO CYBER SCHOOL* Improvement 61.2% Priority Improvement 47.3% Improvement 75.2% Insufficient Data
V.I.L.A.S. ONLINE SCHOOL* Turnaround 28.2% - Performance 68.8% Insufficient Data
MONTE VISTA ON-LINE ACADEMY* Improvement 58.4% - Improvement 58.4% Insufficient Data
VALIANT ACADEMY* - - Turnaround 36.3% Insufficient Data
HOLYOKE ALTERNATIVE SCHOOL - - - Insufficient Data
ACADEMY ONLINE* - - - Insufficient Data
EDISON ACADEMY* - - - Insufficient Data
BOULDER UNIVERSAL* - - - Insufficient Data
SOUTHWEST COLORADO E-SCHOOL* - - - Insufficient Data
CANON ONLINE ACADEMY - - - Insufficient Data
WORLD ACADEMY - - - Insufficient Data
AIM GLOBAL* - - - New School
COLORADO CONNECTIONS ACADEMY @ DURANGO* - - - New School
ACHIEVE BLENDED LEARNING ACADEMY - - - New School
IMMERSION SCHOOLS SCIENCE TECHNOLOGY ARTS* - - - New School
*Indicates Multi-District Online
Total Middle School Ratings for All Online School2014 2016
1-Year SPF Results2012 2013

High School Ratings for All Online Schools
Rating Points Rating Points Rating Points Rating Points
TCA COLLEGE PATHWAYS* Performance 93.2% Performance 87.6% Performance 100.0% Performance Plan 98.9%
BRANSON SCHOOL ONLINE* Improvement 53.3% Performance 65.8% Improvement 65.6% Performance Plan 78.5%
SPRINGS STUDIO FOR ACADEMIC EXCELLENCE* Priority Improvement 45.3% Performance 71.1% Performance 70.0% Performance Plan 69.0%
ACADEMY ONLINE* Performance 75.1% Performance 100.0% Improvement 50.0% Performance Plan 62.7%
PSD GLOBAL ACADEMY* Improvement 62.6% Priority Improvement 37.4% Improvement 53.8% Performance Plan 62.5%
COLORADO CONNECTIONS ACADEMY* Improvement 56.9% Improvement 57.7% Performance 60.9% Performance Plan 58.5%
DENVER ONLINE HIGH SCHOOL* Priority Improvement 35.2% Improvement 55.0% Improvement 47.6% Performance Plan 58.3%
GRAND RIVER ACADEMY Priority Improvement 42.0% Improvement 51.8% Priority Improvement 48.9% Performance Plan 57.2%
COLORADO PREP ACADEMY* - - Improvement 58.3% Performance Plan 56.4%
ROCKY MOUNTAIN DIGITAL ACADEMY* - - - Performance Plan 56.3%
COLORADO VIRTUAL ACADEMY (COVA)* Priority Improvement 46.5% Priority Improvement 43.5% Improvement 50.7% Performance Plan 55.5%
ELEVATE ACADEMY* - - - Improvement Plan 46.4%
JEFFCO'S 21ST CENTURY VIRTUAL ACADEMY* Priority Improvement 55.9% Turnaround 37.1% Priority Improvement 47.0% Improvement Plan 45.3%
DESTINATIONS CAREER ACADEMY OF COLORADO* Priority Improvement 36.3% Priority Improvement 37.0% Priority Improvement 44.8% Improvement Plan 44.7%
ST. VRAIN GLOBAL ONLINE ACADEMY Turnaround 25.1% Priority Improvement 33.4% Priority Improvement 40.2% Priority Improvement Plan 40.7%
PIKES PEAK ONLINE SCHOOL* - - - Turnaround Plan 32.8%
EDISON ACADEMY* Performance 62.6% Performance 87.4% Performance 100.0% Insufficient Data (PWR Only)
VALIANT ACADEMY* - - Performance 100.0% Insufficient Data (PWR Only)
EDCSD: COLORADO CYBER SCHOOL* Turnaround 38.8% Turnaround 41.2% Priority Improvement 59.8% Insufficient Data (PWR Only)
BOULDER UNIVERSAL* Priority Improvement 50.0% Improvement 66.6% Priority Improvement 55.1% Insufficient Data (PWR Only)
PEAK VIRTUAL ACADEMY - Priority Improvement 50.0% Priority Improvement 50.0% Insufficient Data (PWR Only)
BOLT ACADEMY - - Improvement 50.0% Insufficient Data (PWR Only)
MONTE VISTA ON-LINE ACADEMY* Performance 61.4% Improvement 57.6% Priority Improvement 37.4% Insufficient Data (PWR Only)
ENGAGE ONLINE ACADEMY* - - Turnaround 25.2% Insufficient Data (PWR Only)
SOUTHWEST COLORADO E-SCHOOL* Improvement 50.0% Improvement 52.4% Turnaround 25.1% Insufficient Data (PWR Only)
CANON ONLINE ACADEMY - Turnaround 25.1% Turnaround 25.1% Insufficient Data (PWR Only)
WORLD ACADEMY - - Turnaround 25.1% Insufficient Data (PWR Only)
HOLYOKE ALTERNATIVE SCHOOL - - - Insufficient Data (PWR Only)
CENTER VIRTUAL ACADEMY - Turnaround 25.1% - Insufficient Data
MOUNTAIN VIEW VIRTUAL* - - - Insufficient Data
ACHIEVE BLENDED LEARNING ACADEMY - - - New School
AIM GLOBAL* - - - New School
COLORADO CONNECTIONS ACADEMY @ DURANGO* - - - New School
IMMERSION SCHOOLS SCIENCE TECHNOLOGY ARTS* - - - New School
PEYTON ONLINE ACADEMY* - - - New School
PIKES PEAK EARLY COLLEGE* - - - New School
*Indicates Multi-District Online
1-Year SPF Results2012 2013 2014 2016

Rating Points Rating Points Rating Points Rating Points
Overall Approaching 37.5% Approaching 40.6% Approaching 45.8% Approaching 41.0%
Middle School - Approaching 43.8% Approaching 50.0% Does Not Meet 25.0%
High School Approaching 37.5% Approaching 37.5% Approaching 41.7% Approaching 58.3%
Rating Points Rating Points Rating Points Rating Points
PSD GLOBAL ACADEMY* Approaching 54.2% Exceeds 87.5% Meets 80.6% Exceeds 95.0%
TCA COLLEGE PATHWAYS* Exceeds 96.9% Exceeds 96.9% Exceeds 100.0% Exceeds 91.7%
ACADEMY ONLINE* - - - Exceeds 87.5%
COLORADO VIRTUAL ACADEMY (COVA)* Approaching 50.0% Approaching 50.0% Approaching 44.4% Meets 75.0%
DENVER ONLINE HIGH SCHOOL* Does Not Meet 25.0% Approaching 58.3% Meets 66.7% Meets 66.7%
ACADEMY CALVERT K-8 ONLINE SCHOOL* Approaching 42.9% Approaching 60.7% Meets 75.0% Meets 62.5%
COLORADO DIGITAL ACADEMY - MIDDLE* - - - Meets 62.5%
BRANSON SCHOOL ONLINE* Meets 66.7% Meets 64.6% Meets 63.9% Approaching 60.9%
GRAND RIVER ACADEMY Approaching 45.8% Approaching 43.2% Approaching 41.7% Approaching 58.3%
SPRINGS STUDIO FOR ACADEMIC EXCELLENCE* Approaching 54.5% Approaching 60.4% Approaching 61.1% Approaching 52.3%
COLORADO CONNECTIONS ACADEMY* Approaching 60.4% Approaching 58.3% Approaching 50.0% Approaching 51.5%
ST. VRAIN GLOBAL ONLINE ACADEMY - - Approaching 58.3% Approaching 50.0%
JEFFCO'S 21ST CENTURY VIRTUAL ACADEMY* Meets 68.8% Approaching 50.0% Approaching 45.8% Approaching 50.0%
PEAK VIRTUAL ACADEMY - - Approaching 45.8% Approaching 50.0%
ROCKY MOUNTAIN DIGITAL ACADEMY* - - - Approaching 47.4%
COLORADO PREP ACADEMY* - - Approaching 55.6% Approaching 46.5%
DESTINATIONS CAREER ACADEMY OF COLORADO* Approaching 37.5% Approaching 40.6% Approaching 45.8% Approaching 41.0%
PIKES PEAK ONLINE SCHOOL* - - - Approaching 40.7%
ENGAGE ONLINE ACADEMY* - - Does Not Meet 25.0% Approaching 37.5%
HOPE ONLINE LEARNING ACADEMY MIDDLE SCHOOL* - - Does Not Meet 25.0% Does Not Meet 25.0%
ELEVATE ACADEMY* - - - Does Not Meet 25.0%
*Indicates Multi-District Online
Only schools with 2016 data are included
Rating Points Rating Points Rating Points Rating Points
PSD GLOBAL ACADEMY* Approaching 50.0% Meets 83.3% Meets 83.3% Exceeds 100.0%
TCA COLLEGE PATHWAYS* Exceeds 93.8% Exceeds 93.8% Exceeds 100.0% Meets 83.3%
ACADEMY CALVERT K-8 ONLINE SCHOOL* Approaching 41.7% Meets 66.7% Meets 75.0% Meets 75.0%
COLORADO DIGITAL ACADEMY - MIDDLE* - - - Meets 62.5%
BRANSON SCHOOL ONLINE* Meets 62.5% Meets 68.8% Meets 66.7% Approaching 51.0%
JEFFCO'S 21ST CENTURY VIRTUAL ACADEMY* - - Approaching 50.0% Approaching 50.0%
Achievement Ratings for Destinations Career Academy of Colorado
1-Year SPF Results2012 2013 2014 2016
2014 2016
1-Year SPF Results2012 2013 2014 2016
1-Year SPF Results2012 2013
Middle School Achievement Ratings for Online Schools
Overall Achievement Ratings for Online Schools

GRAND RIVER ACADEMY Approaching 50.0% Does Not Meet 31.3% Approaching 41.7% Approaching 50.0%
PEAK VIRTUAL ACADEMY - - Approaching 41.7% Approaching 50.0%
SPRINGS STUDIO FOR ACADEMIC EXCELLENCE* Approaching 50.0% Meets 68.8% Approaching 58.3% Approaching 49.1%
COLORADO CONNECTIONS ACADEMY* Approaching 56.3% Approaching 50.0% Approaching 58.3% Approaching 48.3%
COLORADO PREP ACADEMY* - - Approaching 50.0% Approaching 45.3%
ROCKY MOUNTAIN DIGITAL ACADEMY* - - - Approaching 38.8%
ENGAGE ONLINE ACADEMY* - - - Approaching 37.5%
DESTINATIONS CAREER ACADEMY OF COLORADO* - Approaching 43.8% Approaching 50.0% Does Not Meet 25.0%
HOPE ONLINE LEARNING ACADEMY MIDDLE SCHOOL* - - Does Not Meet 25.0% Does Not Meet 25.0%
ELEVATE ACADEMY* - - - Does Not Meet 25.0%
*Indicates Multi-District Online
Only schools with 2016 data are included
Rating Points Rating Points Rating Points Rating Points
TCA COLLEGE PATHWAYS* Exceeds 100.0% Exceeds 100.0% Exceeds 100.0% Exceeds 100.0%
ACADEMY ONLINE* - - - Exceeds 87.5%
BRANSON SCHOOL ONLINE* Meets 62.5% Meets 75.0% Meets 66.7% Meets 83.3%
PSD GLOBAL ACADEMY* - - Exceeds 91.7% Meets 75.0%
COLORADO VIRTUAL ACADEMY (COVA)* Approaching 50.0% Approaching 50.0% Approaching 50.0% Meets 75.0%
GRAND RIVER ACADEMY Approaching 41.7% Approaching 56.3% Does Not Meet 33.3% Meets 75.0%
ROCKY MOUNTAIN DIGITAL ACADEMY* - - - Meets 75.0%
COLORADO PREP ACADEMY* - - Meets 66.7% Meets 72.3%
DENVER ONLINE HIGH SCHOOL* Does Not Meet 25.0% Approaching 58.3% Meets 66.7% Meets 66.7%
SPRINGS STUDIO FOR ACADEMIC EXCELLENCE* Meets 62.5% Approaching 56.3% Meets 66.7% Approaching 58.3%
COLORADO CONNECTIONS ACADEMY* Meets 68.8% Meets 68.8% Approaching 50.0% Approaching 58.3%
DESTINATIONS CAREER ACADEMY OF COLORADO* Approaching 37.5% Approaching 37.5% Approaching 41.7% Approaching 58.3%
ACHIEVE ONLINE* Does Not Meet 33.3% Does Not Meet 25.0% Does Not Meet 33.3% Approaching 58.3%
ST. VRAIN GLOBAL ONLINE ACADEMY - - Approaching 58.3% Approaching 50.0%
JEFFCO'S 21ST CENTURY VIRTUAL ACADEMY* Meets 68.8% Approaching 50.0% Approaching 41.7% Approaching 50.0%
70 ONLINE - - Approaching 41.7% Approaching 50.0%
PIKES PEAK ONLINE SCHOOL* - - - Approaching 40.7%
ELEVATE ACADEMY* - - - Does Not Meet 25.0%
*Indicates Multi-District Online
Only schools with 2016 data are included
High School Achievement Ratings for Online Schools2013 2014 2016
1-Year SPF Results2012
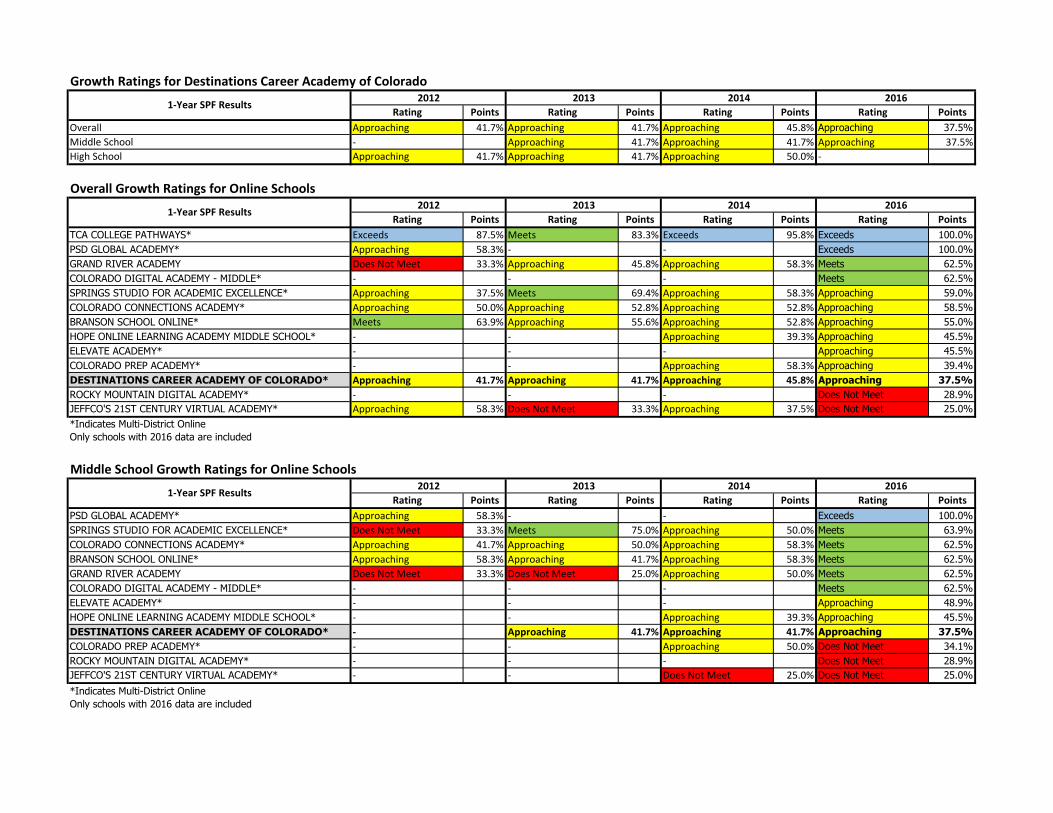
Rating Points Rating Points Rating Points Rating Points
Overall Approaching 41.7% Approaching 41.7% Approaching 45.8% Approaching 37.5%
Middle School - Approaching 41.7% Approaching 41.7% Approaching 37.5%
High School Approaching 41.7% Approaching 41.7% Approaching 50.0% -
Rating Points Rating Points Rating Points Rating Points
TCA COLLEGE PATHWAYS* Exceeds 87.5% Meets 83.3% Exceeds 95.8% Exceeds 100.0%
PSD GLOBAL ACADEMY* Approaching 58.3% - - Exceeds 100.0%
GRAND RIVER ACADEMY Does Not Meet 33.3% Approaching 45.8% Approaching 58.3% Meets 62.5%
COLORADO DIGITAL ACADEMY - MIDDLE* - - - Meets 62.5%
SPRINGS STUDIO FOR ACADEMIC EXCELLENCE* Approaching 37.5% Meets 69.4% Approaching 58.3% Approaching 59.0%
COLORADO CONNECTIONS ACADEMY* Approaching 50.0% Approaching 52.8% Approaching 52.8% Approaching 58.5%
BRANSON SCHOOL ONLINE* Meets 63.9% Approaching 55.6% Approaching 52.8% Approaching 55.0%
HOPE ONLINE LEARNING ACADEMY MIDDLE SCHOOL* - - Approaching 39.3% Approaching 45.5%
ELEVATE ACADEMY* - - - Approaching 45.5%
COLORADO PREP ACADEMY* - - Approaching 58.3% Approaching 39.4%
DESTINATIONS CAREER ACADEMY OF COLORADO* Approaching 41.7% Approaching 41.7% Approaching 45.8% Approaching 37.5%
ROCKY MOUNTAIN DIGITAL ACADEMY* - - - Does Not Meet 28.9%
JEFFCO'S 21ST CENTURY VIRTUAL ACADEMY* Approaching 58.3% Does Not Meet 33.3% Approaching 37.5% Does Not Meet 25.0%
*Indicates Multi-District Online
Only schools with 2016 data are included
Rating Points Rating Points Rating Points Rating Points
PSD GLOBAL ACADEMY* Approaching 58.3% - - Exceeds 100.0%
SPRINGS STUDIO FOR ACADEMIC EXCELLENCE* Does Not Meet 33.3% Meets 75.0% Approaching 50.0% Meets 63.9%
COLORADO CONNECTIONS ACADEMY* Approaching 41.7% Approaching 50.0% Approaching 58.3% Meets 62.5%
BRANSON SCHOOL ONLINE* Approaching 58.3% Approaching 41.7% Approaching 58.3% Meets 62.5%
GRAND RIVER ACADEMY Does Not Meet 33.3% Does Not Meet 25.0% Approaching 50.0% Meets 62.5%
COLORADO DIGITAL ACADEMY - MIDDLE* - - - Meets 62.5%
ELEVATE ACADEMY* - - - Approaching 48.9%
HOPE ONLINE LEARNING ACADEMY MIDDLE SCHOOL* - - Approaching 39.3% Approaching 45.5%
DESTINATIONS CAREER ACADEMY OF COLORADO* - Approaching 41.7% Approaching 41.7% Approaching 37.5%
COLORADO PREP ACADEMY* - - Approaching 50.0% Does Not Meet 34.1%
ROCKY MOUNTAIN DIGITAL ACADEMY* - - - Does Not Meet 28.9%
JEFFCO'S 21ST CENTURY VIRTUAL ACADEMY* - - Does Not Meet 25.0% Does Not Meet 25.0%
*Indicates Multi-District Online
Only schools with 2016 data are included
Middle School Growth Ratings for Online Schools
1-Year SPF Results2012 2013 2014 2016
Overall Growth Ratings for Online Schools
1-Year SPF Results2012 2013 2014 2016
Growth Ratings for Destinations Career Academy of Colorado
1-Year SPF Results2012 2013 2014 2016
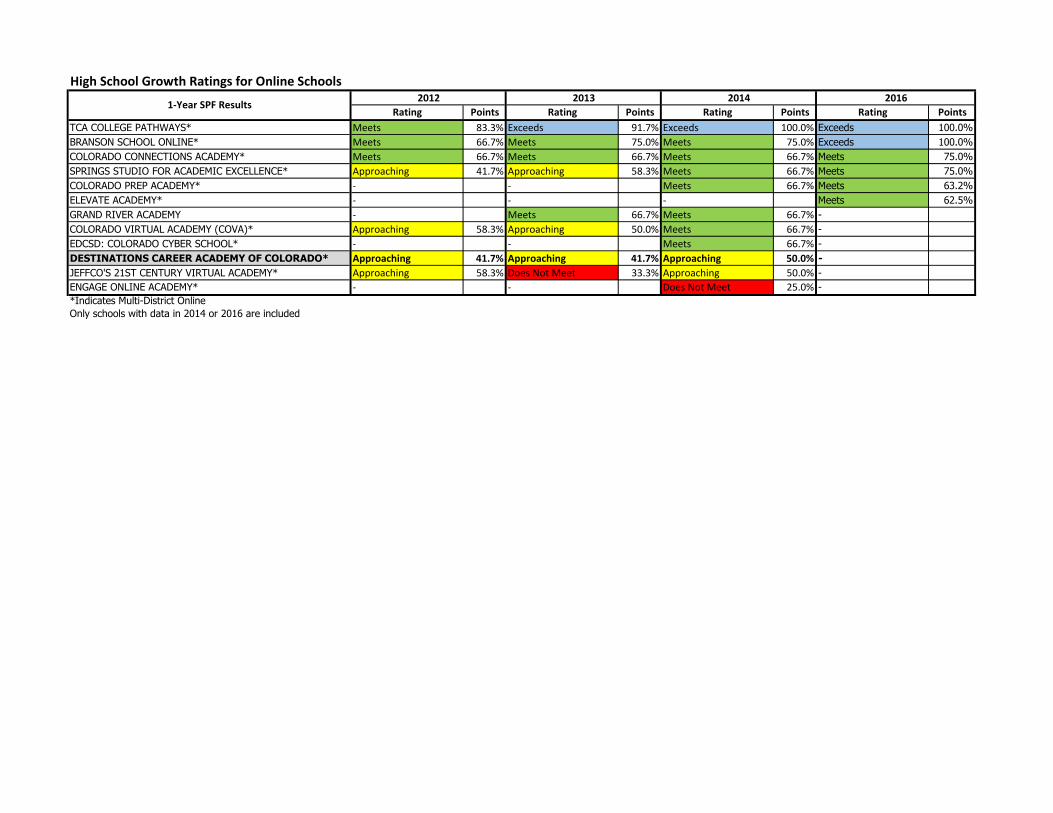
Rating Points Rating Points Rating Points Rating Points
TCA COLLEGE PATHWAYS* Meets 83.3% Exceeds 91.7% Exceeds 100.0% Exceeds 100.0%
BRANSON SCHOOL ONLINE* Meets 66.7% Meets 75.0% Meets 75.0% Exceeds 100.0%
COLORADO CONNECTIONS ACADEMY* Meets 66.7% Meets 66.7% Meets 66.7% Meets 75.0%
SPRINGS STUDIO FOR ACADEMIC EXCELLENCE* Approaching 41.7% Approaching 58.3% Meets 66.7% Meets 75.0%
COLORADO PREP ACADEMY* - - Meets 66.7% Meets 63.2%
ELEVATE ACADEMY* - - - Meets 62.5%
GRAND RIVER ACADEMY - Meets 66.7% Meets 66.7% -
COLORADO VIRTUAL ACADEMY (COVA)* Approaching 58.3% Approaching 50.0% Meets 66.7% -
EDCSD: COLORADO CYBER SCHOOL* - - Meets 66.7% -
DESTINATIONS CAREER ACADEMY OF COLORADO* Approaching 41.7% Approaching 41.7% Approaching 50.0% -
JEFFCO'S 21ST CENTURY VIRTUAL ACADEMY* Approaching 58.3% Does Not Meet 33.3% Approaching 50.0% -
ENGAGE ONLINE ACADEMY* - - Does Not Meet 25.0% -
*Indicates Multi-District Online
Only schools with data in 2014 or 2016 are included
High School Growth Ratings for Online Schools
1-Year SPF Results2012 2013 2014 2016

Rating Points Rating Points Rating Points Rating Points
Overall Does Not Meet 31.7% Does Not Meet 31.3% Does Not Meet 31.3% Does Not Meet 30.9%
Rating Points Rating Points Rating Points Rating Points
TCA COLLEGE PATHWAYS* Exceeds 100.0% Meets 83.3% Exceeds 100.0% Exceeds 96.4%
EDISON ACADEMY* Meets 62.5% Exceeds 87.5% Exceeds 100.0% Meets 85.0%
SPRINGS STUDIO FOR ACADEMIC EXCELLENCE* Approaching 50.0% Meets 83.3% Meets 83.3% Meets 71.7%
PEAK VIRTUAL ACADEMY - Approaching 50.0% Approaching 50.0% Approaching 53.6%
VALIANT ACADEMY* - - Exceeds 100.0% Approaching 50.0%
DENVER ONLINE HIGH SCHOOL* Approaching 39.3% Approaching 53.6% Approaching 39.3% Approaching 50.0%
PSD GLOBAL ACADEMY* Meets 62.5% Approaching 37.5% Approaching 37.5% Approaching 50.0%
BRANSON SCHOOL ONLINE* Does Not Meet 32.1% Approaching 46.4% Approaching 55.8% Approaching 45.0%
JEFFCO'S 21ST CENTURY VIRTUAL ACADEMY* Approaching 48.1% Approaching 40.4% Approaching 39.3% Approaching 40.6%
EDCSD: COLORADO CYBER SCHOOL* Approaching 37.5% Approaching 37.5% Approaching 50.0% Approaching 39.3%
GRAND RIVER ACADEMY - Does Not Meet 25.0% Approaching 37.5% Approaching 39.3%
ACADEMY ONLINE* Meets 75.0% Exceeds 100.0% Approaching 50.0% Approaching 37.5%
ROCKY MOUNTAIN DIGITAL ACADEMY* - - - Approaching 37.5%
COLORADO CONNECTIONS ACADEMY* Approaching 41.7% Approaching 46.4% Approaching 53.6% Does Not Meet 36.8%
MONTE VISTA ON-LINE ACADEMY* Does Not Meet 33.3% Approaching 50.0% Approaching 37.5% Does Not Meet 36.1%
COLORADO VIRTUAL ACADEMY (COVA)* Does Not Meet 31.7% Does Not Meet 31.3% Does Not Meet 31.7% Does Not Meet 36.1%
BOULDER UNIVERSAL* Approaching 50.0% Meets 66.7% Approaching 55.0% Does Not Meet 33.3%
BOLT ACADEMY - - - Does Not Meet 33.3%
COLORADO PREP ACADEMY* - - Approaching 50.0% Does Not Meet 31.3%
ST. VRAIN GLOBAL ONLINE ACADEMY Does Not Meet 25.0% Does Not Meet 33.3% Does Not Meet 32.7% Does Not Meet 31.3%
DESTINATIONS CAREER ACADEMY OF COLORADO* Does Not Meet 31.7% Does Not Meet 31.3% Does Not Meet 31.3% Does Not Meet 30.9%
SOUTHWEST COLORADO E-SCHOOL* - Approaching 50.0% Does Not Meet 25.0% Does Not Meet 25.0%
CANON ONLINE ACADEMY - Does Not Meet 25.0% Does Not Meet 25.0% Does Not Meet 25.0%
WORLD ACADEMY - - Does Not Meet 25.0% Does Not Meet 25.0%
ENGAGE ONLINE ACADEMY* - - Does Not Meet 25.0% Does Not Meet 25.0%
HOLYOKE ALTERNATIVE SCHOOL - - - Does Not Meet 25.0%
PIKES PEAK ONLINE SCHOOL* - - - Does Not Meet 25.0%
*Indicates Multi-District Online
Only schools with 2016 data are included
PWR Ratings for Destinations Career Academy of Colorado
1-Year SPF Results2012 2013 2014 2016
PWR Ratings for Online Schools
1-Year SPF Results2012 2013 2014 2016

41

INTRODUCTIONLAST UPDATED: 2/17/2017
This dashboard has been designed to display state data for district staff to support effective systems analysis and improvement planning. It is organized by tabs across thetop of the screen. All tabs were updated with more recent data. For additional support with planning, see resources found here:http://www.cde.state.co.us/uip/uip_trainingandsupport_resources. In addition to text provided on the screen, information related to the data can be found by hovering thecursor over the elements of the report.
Questions, please contact Hai Huynh at [email protected]
SELECT DISTRICT
JULESBURG RE-1
DISTRICT INFORMATION
Ddst Name Address City, State, ZipJULESBURG RE-1 102 WEST 6TH STREET JULESBURG, CO 80737
District Contact Information
County Web Site District NumberSEDGWICK www.julesburg.org 2862
District Contact Information
Full Name EmailShawn Ehnes [email protected]
Superintendent Information
bautsch_b
Typewritten Text
bautsch_b
Typewritten Text
For an interactive view of the data, please visit CDE's SchoolView District and School Dashboards at http://www.cde.state.co.us/schoolview
bautsch_b
Typewritten Text
bautsch_b
Typewritten Text
bautsch_b
Typewritten Text
Julesburg Re-1 School District
bautsch_b
Typewritten Text
bautsch_b
Typewritten Text
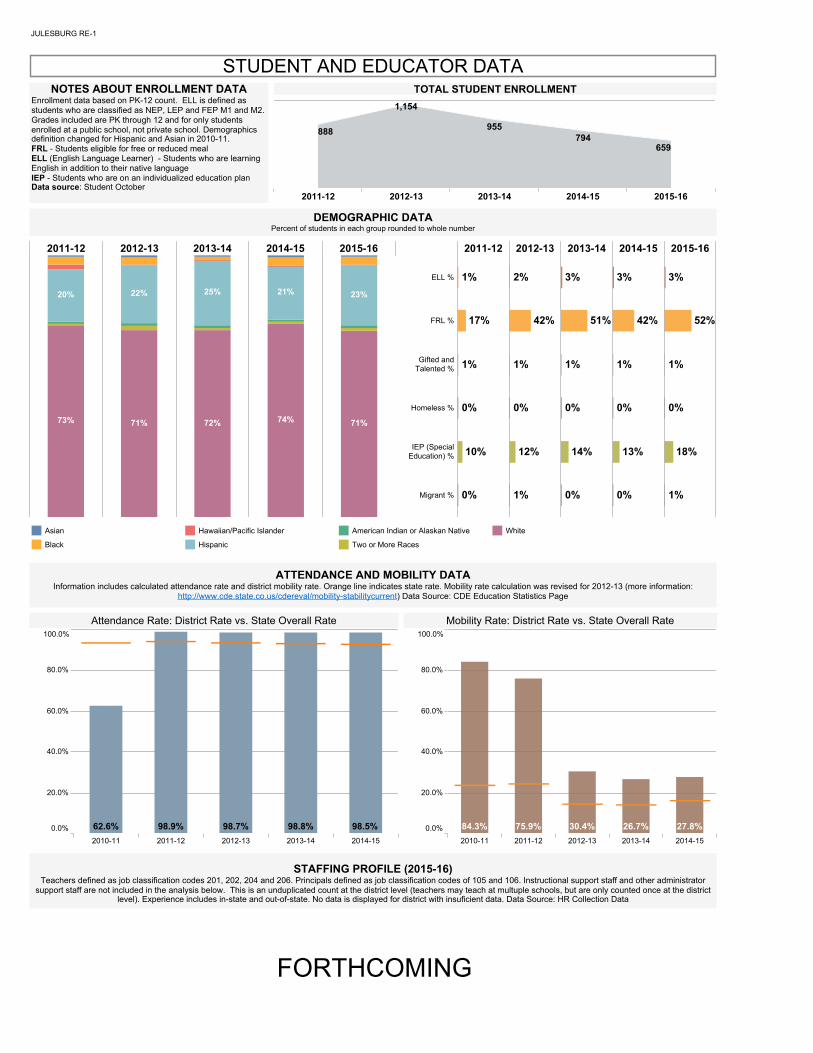
JULESBURG RE-1
STUDENT AND EDUCATOR DATANOTES ABOUT ENROLLMENT DATA
Enrollment data based on PK-12 count. ELL is defined asstudents who are classified as NEP, LEP and FEP M1 and M2.Grades included are PK through 12 and for only studentsenrolled at a public school, not private school. Demographicsdefinition changed for Hispanic and Asian in 2010-11.FRL - Students eligible for free or reduced mealELL (English Language Learner) - Students who are learningEnglish in addition to their native languageIEP - Students who are on an individualized education planData source: Student October
TOTAL STUDENT ENROLLMENT
2011-12 2012-13 2013-14 2014-15 2015-16
888 955794
1,154
659
DEMOGRAPHIC DATAPercent of students in each group rounded to whole number
2011-12 2012-13 2013-14 2014-15 2015-16
20% 22% 25% 21% 23%
73% 71% 72% 74% 71%
2011-12 2012-13 2013-14 2014-15 2015-16
ELL %
FRL %
Gifted andTalented %
Homeless %
IEP (SpecialEducation) %
Migrant %
17%
10%
1%
1%
0%
0%
42%
12%
2%
1%
0%
1%
51%
14%
3%
1%
0%
0%
42%
13%
3%
1%
0%
0%
52%
18%
3%
1%
0%
1%
Asian
Black
Hawaiian/Pacific Islander
Hispanic
American Indian or Alaskan Native
Two or More Races
White
ATTENDANCE AND MOBILITY DATAInformation includes calculated attendance rate and district mobility rate. Orange line indicates state rate. Mobility rate calculation was revised for 2012-13 (more information:
http://www.cde.state.co.us/cdereval/mobility-stabilitycurrent) Data Source: CDE Education Statistics Page
2010-11 2011-12 2012-13 2013-14 2014-15
0.0%
20.0%
40.0%
60.0%
80.0%
100.0%
62.6% 98.9% 98.7% 98.8% 98.5%
Attendance Rate: District Rate vs. State Overall Rate
2010-11 2011-12 2012-13 2013-14 2014-15
0.0%
20.0%
40.0%
60.0%
80.0%
100.0%
84.3% 75.9% 30.4% 26.7% 27.8%
Mobility Rate: District Rate vs. State Overall Rate
STAFFING PROFILE (2015-16)Teachers defined as job classification codes 201, 202, 204 and 206. Principals defined as job classification codes of 105 and 106. Instructional support staff and other administratorsupport staff are not included in the analysis below. This is an unduplicated count at the district level (teachers may teach at multuple schools, but are only counted once at the district
level). Experience includes in-state and out-of-state. No data is displayed for district with insuficient data. Data Source: HR Collection Data
District State
Number of Teachers
Average Years of Education Experience (in-state and out-of-state) - Teachers
Average Years Teaching (in-state and out-of-state) - Teachers
Teacher Turnover Rate (%) 17
10
10
52,926
9
14
14
1,881
Teacher StatisticsDistrict State
Number of Principals
Avg Years as Principal (At current school and any school)
Avg Years of Education Experience (in-state and out-of-state) - Principals
Avg Years of Teaching Experience (in-state and out-of-state) - Principals
Principal Turnover Rate (%) 1,440
647
937
333
216,936
1,333
811
1,093
421
2,827
Principal Statistics
FORTHCOMING

ENGLISH LANGUAGE ARTS MATH
650 700 750 800 850Mean Scale Score
650 700 750 800 850Mean Scale Score
ALL GRADES ALL STUDENTS 723 718
CMAS PARCC - MATH AND ENGLISH LANGUAGE ARTSThe following visual displays CMAS PARCC mean scale scores for math and English language art by grade and student group for 2015-16 school year. The visual includes the following elements: (1)state mean scale score presented as a vertical line in orange, (2) district mean scale score presented as a plus sign, (3) district mean scale score color coded based on the proportion of students who
took the assessments, and lastly (4) color band that identifies scores meeting assessment benchmark/state standards.
Category/S..Grade Year SCIENCE
300 350 400 450 500 550 600 650 700 750 800 850 900Mean Scale Score
ALLSTUDENTS
05 2014
08 2014
2015
2016
11 2016
595
611
558
526
626
CMAS - SCIENCEThe following visual displays of CMASS science mean scale scores by student group, grade, and year. The visual includes the following three elements: (1) state mean scale score presented as avertical line in orange, (2) district mean scale score presented as a plus sign, and finally (3) the district mean scale score color coded based on the proportion of students who took the assessment.
5 10 15 20 25 30 35
COMPOSITE ALLSTUDENTS
2012
2013
2014
2015
2016
18.8
17.4
18.2
19.0
20.1
COLORADO ACTThe chart below displays the results from the Colorado ACT, including the overall (composite) score, English, Math, Reading and Science disaggregated by student group. The plussigns represent the district's ACT results and the orange lines represent the state average. For groups that meet the minimum N-count threshold (i.e., at least 16 students took and
received a valid test score), the results are displayed below. Cursor mouse over each bar to see detailed results.
SUBJECTCOMPOSITE
ENGLISH
MATH
READING
SCIENCE
CATEGORYALL STUDENTS
School LevelALL GRADES
ASSESSMENT DATA - DISTRICT RESULTS
JULESBURG RE-1
Particpation Color Key95% or greater, High Particpation
Between 85% and 94%, Caution
Below 85%, Inference Difficult
No Participation Data

Growth metrics provide another view of the performance of a school, district or group of students. While achievement is focused on the performance at a point in time, growth provides an indication ofwhat happens in-between the assessments. Looking at both achievement and growth results provides a more in-depth picture of performance.
Growth rates for individual students are calculated by analyzing students’ Colorado Measures of Academic Success (CMAS) scores in English Language Arts and Math over consecutive years. Astudent's growth percentile (ranging from 1 to 99) indicates how a student’s performance changed over time, relative to students with a similar score history on the state assessments. School and districtgrowth rates are determined by the growth percentiles from individual students, specifically the median (or score in the middle) student growth percentile. Median Growth Percentiles (MGP) arecalculated for the whole school, by grade, and by different student groups. Higher median growth percentiles indicate higher growth rates for the typical students in those groups. Please note that growthrates are independent of achievement levels (students at all achievement levels are just as likely to have high growth as low growth). As a point of reference, the state median growth percentile for anygrade, overall, is 50. In rare cases, state median growth percentiles may vary slightly.
Missing data in the table reflect fewer than 20 students in the group; their data is not shown in the table (the cells are blank) to ensure data privacy and appropriate interpretation of results. Foradditional definitions and information go to: www.cde.state.co.us/accountability/coloradogrowthmodel
ENGLISH LANGUAGE ARTSDISTRICT
2016STATE
2016
MATHDISTRICT
2016STATE
2016All Students
English Learners, No
English Learners, Yes
Ethnicity, American Indian or Alaska Native
Ethnicity, Asian
Ethnicity, Black
Ethnicity, Hawaiian/Pacific Islander
Ethnicity, Hispanic
Ethnicity, Two or More Races
Ethnicity, White
FRL, No
FRL, Yes
Gender, Female
Gender, Male
Gifted, No
Gifted, Yes
Grade, 04
Grade, 05
Grade, 06
Grade, 07
Grade, 08
Grade, 09
IEP, No
IEP, Yes
Migrant, No
Migrant, Yes
Minority, No
Minority, Yes
Performance, At or Above Benchmark
Performance, Below Benchmark 36.0
34.0
42.0
40.0
48.0
42.0
40.0
31.5
44.0
30.0
53.5
42.0
41.0
40.0
50.0
50.0
49.0
51.0
45.0
50.0
38.0
51.0
50.0
50.0
50.0
50.0
50.0
50.0
60.0
49.0
45.0
55.0
47.0
52.0
51.0
51.0
48.0
50.0
48.0
59.0
47.0
50.0
50.0
50.0
48.0
25.0
46.0
41.5
40.0
40.5
41.5
46.0
32.0
35.5
47.0
46.0
44.0
41.5
50.0
50.0
47.0
53.0
42.0
50.0
40.0
51.0
49.0
50.0
50.0
50.0
50.0
50.0
60.0
49.0
49.0
51.0
46.0
53.0
53.0
51.0
46.0
53.0
46.0
59.0
46.0
47.0
51.0
50.0
GROWTH DATA
JULESBURG RE-1
50
1.0 99.0Median Growth Percentile

ACCOUNTABILITYSELECT A DISTRICTJULESBURG RE-1
Please note that the displays on this tab will not be updated with new data in 2015-16, but will remain in the dashboard for reference. Because of the stateassessment transition and the passage of H.B. 15-1323, school accountability measures are affected. The following website provides additional details on theaccountability system during the transition: http://www.cde.state.co.us/accountability/impact-of-assessment-transition-on-school-and-district-accountability
2010 2011 2012 2013 2014
1 Year1 Year1 Year1 Year1 Year
The below table indicates the plan type used (1-year or 3-year) Select a Data Time Span1 Year
44.849.347.547.255.3
DPF % Points Earned
2010 2011 2012 2013 2014
PriorityImprovement
PriorityImprovement
PriorityImprovement
PriorityImprovement
PriorityImprovement
DPF Accreditation Rating
2010 2011 2012 2013 2014Schools: Turnaround
Schools: Priority Improvement
Schools: Improvement
Schools: Performance 2010
2010
2010
2001
3
1
School Plan Type (Including AECs, only official results)
Year 5
Year Entering Priority Improvement or Turnaround
DPF Key Indicator Ratings OverallNumber indicates percentage points earned on key indicator. Color of bar represents key performance indicator rating. Drop down menu at top of page indicates data time span. Data
Source: District Performance Framework
Achievement Data by EMH LevelPercent of students scoring Proficient and Advanced. Color of bar represents rating forsub-indicator. Drop down menu at top of page indicates data time span. Data Source:
District Performance Framework
Achievement %
2010 2011 2012 2013 2014
54.5
72.563.6
50.0
61.4
Growth %
2010 2011 2012 2013 2014
52.858.3
50.0
69.461.1
Postsecondary %
2010 2011 2012 2013 2014
33.3 33.3 31.7 31.3 31.3
Growth Gaps %
2010 2011 2012 2013 2014
56.3 58.750.0 51.252.1
Does Not Meet Approaching Meets Exceeds Hover over bars to view indicator rating or use color coding.
Growth Data by EMH LevelMedian student growth percentile. Color of bar represents rating for sub-indicator. Dropdown menu at top of page indicates data time span. MAGP can be found on Performance
tab. Data Source: District Performance Framework
ELEMENTARY
2010
2011
2012
2013
2014
80.3
74.6
86.3
86.4
68.5
Ach - Read
2010
2011
2012
2013
2014
73.478.0
80.0
88.1
70.3
Ach - Math
2010
2011
2012
2013
2014
62.1
64.0
50.0
50.9
54.2
Ach - Write
2010
2011
2012
2013
2014
0.0
Ach - Science
ELEMENTARY
2010
2011
2012
2013
2014
474960
4441
MGP - Read
2010
2011
2012
2013
2014
5858
323441
MGP - Math2010
2011
2012
2013
2014
5347
52
3741
MGP - Write
2010
2011
2012
2013
2014
MGP - ELP
MIDDLE
2010
2011
2012
2013
2014
71.681.1
86.2
67.3
70.5
Ach - Read
2010
2011
2012
2013
2014
56.8
73.0
72.4
37.646.4
Ach - Math
2010
2011
2012
2013
2014
66.7
65.978.4
79.3
50.5
Ach - Write
2010
2011
2012
2013
2014
56.8
52.9
36.0
Ach - Science
MIDDLE
2010
2011
2012
2013
2014
4656
49
72
43
MGP - Read
2010
2011
2012
2013
2014
3344
5244
51
MGP - Math
2010
2011
2012
2013
2014
4658
49
74
38
MGP - Write
2010
2011
2012
2013
2014
MGP - ELP
HIGH
2010
2011
2012
2013
2014
56.7 69.0
62.9
66.7
63.3
Ach - Read
2010
2011
2012
2013
2014
16.6
16.5
13.1
15.5 22.0
Ach - Math
2010
2011
2012
2013
2014
32.4
32.7 45.5
37.1
33.3
Ach - Write
2010
2011
2012
2013
2014
28.6
30.3
33.8
33.8
Ach - Science
HIGH
2010
2011
2012
2013
2014
565546
5341
MGP - Read
2010
2011
2012
2013
2014
3239
444342
MGP - Math
2010
2011
2012
2013
2014
3439 4341
47
MGP - Write
2010
2011
2012
2013
2014
MGP - ELP
Growth Gaps Data Post Secondary and Workforce Readiness Data
Use the Performance Tab for interactive diagnostic ongrowth gaps. View median and adequate growthpercentile by sub-group, by EMH level, and by subjectfor 2008-2012 academic years.
Use the Performance Tab
2010 2011 2012 2013 2014
Grad Rating Does Not MeetDoes Not MeetDoes Not MeetDoes Not MeetDoes Not Meet
Dropout Rating Does Not MeetDoes Not MeetDoes Not MeetDoes Not MeetDoes Not Meet
ACT Rating ApproachingApproachingApproachingApproachingApproaching

PERFORMANCE
Growth: Median and Adequate Growth PercentilesThis interactive visual allows users to view MGP and AGP by Sub-group, by Subject, and by EMH level.
Data Source: Data Lab & CDE Calculated; District level inclusion/exclusion
Achievement: Percentage of Students Scoring Proficient or AboveThis interactive visual allows users to compare percentage of students proficient and advanced by sub-group.
Results within the shaded area do not meet state expectations.Data Source: Data Lab & CDE Calculated; District level inclusion/exclusion
FRL
2009-10 2010-11 2011-12 2012-13 2013-140
20
40
60
80
100
Growth Percentile
50.000
Use the quick filters tocontrol what data is shown
on the chart.
Select a Subject:(choose one)Math
Reading
Writing
Select an EMH Level:(choose one)A. Elementary
B. Middle
C. High
Select a Sub-group:(choose one)All Students
ELL
FRL
IEP
Minority
MGP MAGP Color Key:Median Adequate Growth P..
Median Growth Percentile
Use the quick filters to control whatdata is shown on the chart.
Select a Subject:(choose one)Math
Reading
Writing
Select an EMH Level:(choose one)A. Elementary
B. Middle
C. High
Select Sub-groups:(choose multiple)All Students
ELL
FRL
IEP
Minority
VariableAll Students
ELL
FRL
IEP
Minority
2009-10 2010-11 2011-12 2012-13 2013-140
10
20
30
40
50
60
70
80
90
100
75.073.7
76.5
78.0
59.5
81.6
89.7
66.7
89.7
45.5
52.4
69.6 69.9
59.3
Data Time Span:(select 3 Year if no data appears)1 Year
Please note that the displays on this tab will not be updated with new data in 2015-16, but will remain in the dashboard forreference. Because of the state assessment transition and the passage of H.B. 15-1323, school accountability measuresare affected. The following website provides additional details on the accountability system during the transition:http://www.cde.state.co.us/accountability/impact-of-assessment-transition-on-school-and-district-accountability
SELECT A DISTRICTJULESBURG RE-1
bautsch_b
Typewritten Text
Math Performance Data: Elementary Level

PERFORMANCE
Growth: Median and Adequate Growth PercentilesThis interactive visual allows users to view MGP and AGP by Sub-group, by Subject, and by EMH level.
Data Source: Data Lab & CDE Calculated; District level inclusion/exclusion
Achievement: Percentage of Students Scoring Proficient or AboveThis interactive visual allows users to compare percentage of students proficient and advanced by sub-group.
Results within the shaded area do not meet state expectations.Data Source: Data Lab & CDE Calculated; District level inclusion/exclusion
FRL
2009-10 2010-11 2011-12 2012-13 2013-140
20
40
60
80
100
Growth Percentile
50.00
Use the quick filters tocontrol what data is shown
on the chart.
Select a Subject:(choose one)Math
Reading
Writing
Select an EMH Level:(choose one)A. Elementary
B. Middle
C. High
Select a Sub-group:(choose one)All Students
ELL
FRL
IEP
Minority
MGP MAGP Color Key:Median Adequate Growth P..
Median Growth Percentile
Use the quick filters to control whatdata is shown on the chart.
Select a Subject:(choose one)Math
Reading
Writing
Select an EMH Level:(choose one)A. Elementary
B. Middle
C. High
Select Sub-groups:(choose multiple)All Students
ELL
FRL
IEP
Minority
VariableAll Students
ELL
FRL
IEP
Minority
2009-10 2010-11 2011-12 2012-13 2013-140
10
20
30
40
50
60
70
80
90
100
43.8
55.6
46.4
37.0
30.4
6.3
24.1
41.7
66.772.4
73.0
Data Time Span:(select 3 Year if no data appears)1 Year
Please note that the displays on this tab will not be updated with new data in 2015-16, but will remain in the dashboard forreference. Because of the state assessment transition and the passage of H.B. 15-1323, school accountability measuresare affected. The following website provides additional details on the accountability system during the transition:http://www.cde.state.co.us/accountability/impact-of-assessment-transition-on-school-and-district-accountability
SELECT A DISTRICTJULESBURG RE-1
bautsch_b
Typewritten Text
Math Performance Data: Middle Level

PERFORMANCE
Growth: Median and Adequate Growth PercentilesThis interactive visual allows users to view MGP and AGP by Sub-group, by Subject, and by EMH level.
Data Source: Data Lab & CDE Calculated; District level inclusion/exclusion
Achievement: Percentage of Students Scoring Proficient or AboveThis interactive visual allows users to compare percentage of students proficient and advanced by sub-group.
Results within the shaded area do not meet state expectations.Data Source: Data Lab & CDE Calculated; District level inclusion/exclusion
FRL
2009-10 2010-11 2011-12 2012-13 2013-140
20
40
60
80
100
Growth Percentile
50.00
Use the quick filters tocontrol what data is shown
on the chart.
Select a Subject:(choose one)Math
Reading
Writing
Select an EMH Level:(choose one)A. Elementary
B. Middle
C. High
Select a Sub-group:(choose one)All Students
ELL
FRL
IEP
Minority
MGP MAGP Color Key:Median Adequate Growth P..
Median Growth Percentile
Use the quick filters to control whatdata is shown on the chart.
Select a Subject:(choose one)Math
Reading
Writing
Select an EMH Level:(choose one)A. Elementary
B. Middle
C. High
Select Sub-groups:(choose multiple)All Students
ELL
FRL
IEP
Minority
VariableAll Students
ELL
FRL
IEP
Minority
2009-10 2010-11 2011-12 2012-13 2013-140
10
20
30
40
50
60
70
80
90
100
19.622.4
45.0
11.2 14.3
22.9
8.0
16.216.2
7.1
21.8
5.2
12.96.512.4
0.00.00.00.0
Data Time Span:(select 3 Year if no data appears)1 Year
Please note that the displays on this tab will not be updated with new data in 2015-16, but will remain in the dashboard forreference. Because of the state assessment transition and the passage of H.B. 15-1323, school accountability measuresare affected. The following website provides additional details on the accountability system during the transition:http://www.cde.state.co.us/accountability/impact-of-assessment-transition-on-school-and-district-accountability
SELECT A DISTRICTJULESBURG RE-1
bautsch_b
Typewritten Text
Math Performance Data: High Level
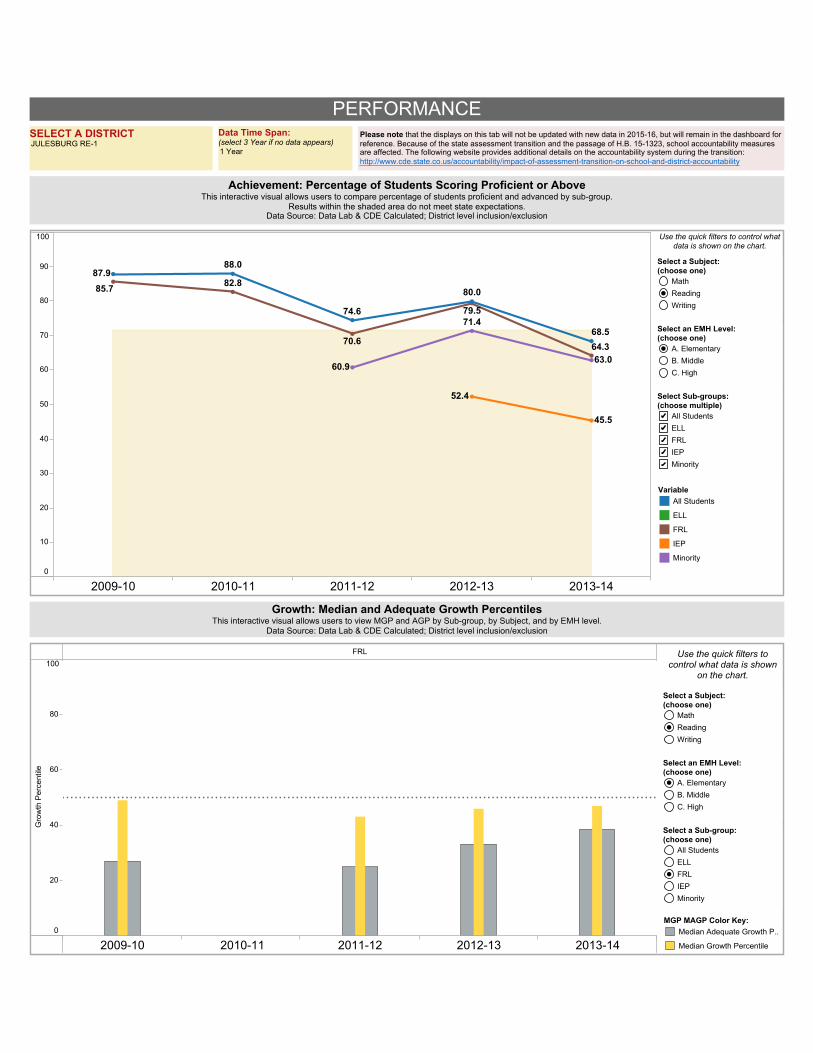
PERFORMANCE
Growth: Median and Adequate Growth PercentilesThis interactive visual allows users to view MGP and AGP by Sub-group, by Subject, and by EMH level.
Data Source: Data Lab & CDE Calculated; District level inclusion/exclusion
Achievement: Percentage of Students Scoring Proficient or AboveThis interactive visual allows users to compare percentage of students proficient and advanced by sub-group.
Results within the shaded area do not meet state expectations.Data Source: Data Lab & CDE Calculated; District level inclusion/exclusion
FRL
2009-10 2010-11 2011-12 2012-13 2013-140
20
40
60
80
100
Growth Percentile
50.00
Use the quick filters tocontrol what data is shown
on the chart.
Select a Subject:(choose one)Math
Reading
Writing
Select an EMH Level:(choose one)A. Elementary
B. Middle
C. High
Select a Sub-group:(choose one)All Students
ELL
FRL
IEP
Minority
MGP MAGP Color Key:Median Adequate Growth P..
Median Growth Percentile
Use the quick filters to control whatdata is shown on the chart.
Select a Subject:(choose one)Math
Reading
Writing
Select an EMH Level:(choose one)A. Elementary
B. Middle
C. High
Select Sub-groups:(choose multiple)All Students
ELL
FRL
IEP
Minority
VariableAll Students
ELL
FRL
IEP
Minority
2009-10 2010-11 2011-12 2012-13 2013-140
10
20
30
40
50
60
70
80
90
100
80.0
79.5
63.064.3
74.6
70.668.5
82.8
45.5
52.4
60.9
71.4
87.988.0
85.7
Data Time Span:(select 3 Year if no data appears)1 Year
Please note that the displays on this tab will not be updated with new data in 2015-16, but will remain in the dashboard forreference. Because of the state assessment transition and the passage of H.B. 15-1323, school accountability measuresare affected. The following website provides additional details on the accountability system during the transition:http://www.cde.state.co.us/accountability/impact-of-assessment-transition-on-school-and-district-accountability
SELECT A DISTRICTJULESBURG RE-1
bautsch_b
Typewritten Text
Reading Performance Data: Elementary Level

PERFORMANCE
Growth: Median and Adequate Growth PercentilesThis interactive visual allows users to view MGP and AGP by Sub-group, by Subject, and by EMH level.
Data Source: Data Lab & CDE Calculated; District level inclusion/exclusion
Achievement: Percentage of Students Scoring Proficient or AboveThis interactive visual allows users to compare percentage of students proficient and advanced by sub-group.
Results within the shaded area do not meet state expectations.Data Source: Data Lab & CDE Calculated; District level inclusion/exclusion
FRL
2009-10 2010-11 2011-12 2012-13 2013-140
20
40
60
80
100
Growth Percentile
50.000
Use the quick filters tocontrol what data is shown
on the chart.
Select a Subject:(choose one)Math
Reading
Writing
Select an EMH Level:(choose one)A. Elementary
B. Middle
C. High
Select a Sub-group:(choose one)All Students
ELL
FRL
IEP
Minority
MGP MAGP Color Key:Median Adequate Growth P..
Median Growth Percentile
Use the quick filters to control whatdata is shown on the chart.
Select a Subject:(choose one)Math
Reading
Writing
Select an EMH Level:(choose one)A. Elementary
B. Middle
C. High
Select Sub-groups:(choose multiple)All Students
ELL
FRL
IEP
Minority
VariableAll Students
ELL
FRL
IEP
Minority
2009-10 2010-11 2011-12 2012-13 2013-140
10
20
30
40
50
60
70
80
90
100
69.6
86.2
68.9 66.165.6
81.1
67.0
18.8
51.7
70.876.2
Data Time Span:(select 3 Year if no data appears)1 Year
Please note that the displays on this tab will not be updated with new data in 2015-16, but will remain in the dashboard forreference. Because of the state assessment transition and the passage of H.B. 15-1323, school accountability measuresare affected. The following website provides additional details on the accountability system during the transition:http://www.cde.state.co.us/accountability/impact-of-assessment-transition-on-school-and-district-accountability
SELECT A DISTRICTJULESBURG RE-1
bautsch_b
Typewritten Text
Reading Performance Data: Middle Level
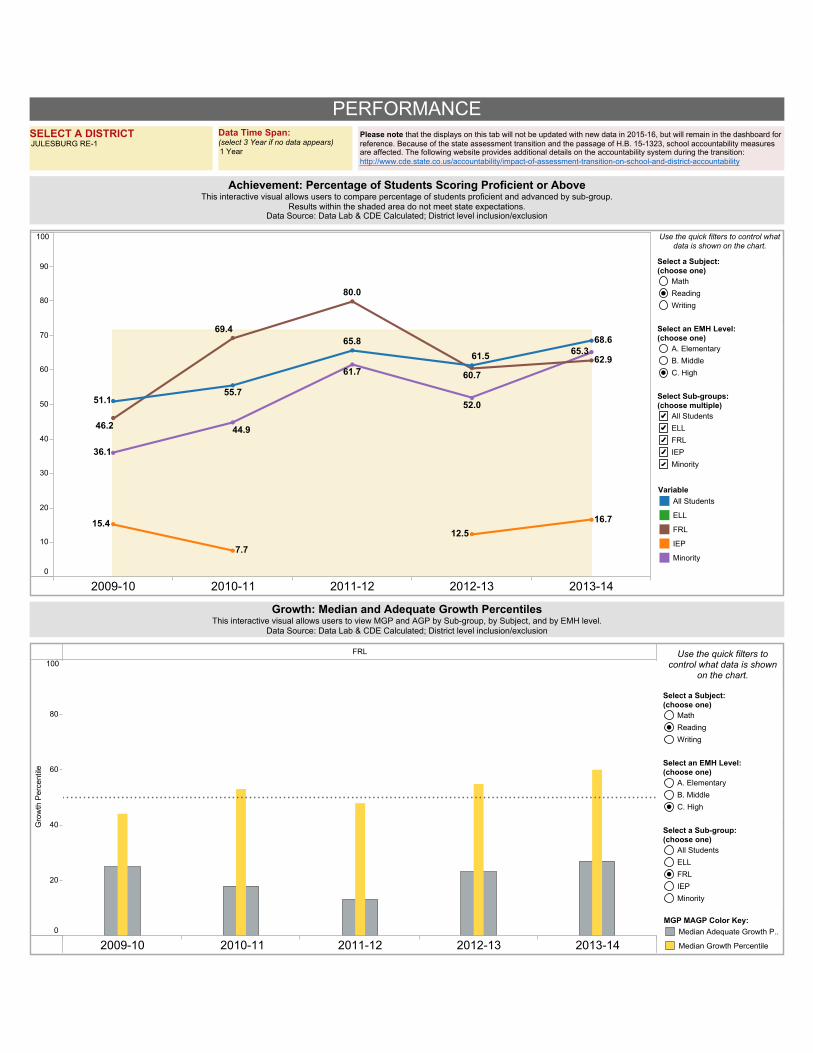
PERFORMANCE
Growth: Median and Adequate Growth PercentilesThis interactive visual allows users to view MGP and AGP by Sub-group, by Subject, and by EMH level.
Data Source: Data Lab & CDE Calculated; District level inclusion/exclusion
Achievement: Percentage of Students Scoring Proficient or AboveThis interactive visual allows users to compare percentage of students proficient and advanced by sub-group.
Results within the shaded area do not meet state expectations.Data Source: Data Lab & CDE Calculated; District level inclusion/exclusion
FRL
2009-10 2010-11 2011-12 2012-13 2013-140
20
40
60
80
100
Growth Percentile
50.00
Use the quick filters tocontrol what data is shown
on the chart.
Select a Subject:(choose one)Math
Reading
Writing
Select an EMH Level:(choose one)A. Elementary
B. Middle
C. High
Select a Sub-group:(choose one)All Students
ELL
FRL
IEP
Minority
MGP MAGP Color Key:Median Adequate Growth P..
Median Growth Percentile
Use the quick filters to control whatdata is shown on the chart.
Select a Subject:(choose one)Math
Reading
Writing
Select an EMH Level:(choose one)A. Elementary
B. Middle
C. High
Select Sub-groups:(choose multiple)All Students
ELL
FRL
IEP
Minority
VariableAll Students
ELL
FRL
IEP
Minority
2009-10 2010-11 2011-12 2012-13 2013-140
10
20
30
40
50
60
70
80
90
100
52.0
62.9
60.7
69.4
61.5
46.2 44.9
36.1
80.0
12.5
55.7
61.7
51.1
65.8
15.4
7.7
65.368.6
16.7
Data Time Span:(select 3 Year if no data appears)1 Year
Please note that the displays on this tab will not be updated with new data in 2015-16, but will remain in the dashboard forreference. Because of the state assessment transition and the passage of H.B. 15-1323, school accountability measuresare affected. The following website provides additional details on the accountability system during the transition:http://www.cde.state.co.us/accountability/impact-of-assessment-transition-on-school-and-district-accountability
SELECT A DISTRICTJULESBURG RE-1
bautsch_b
Typewritten Text
Reading Performance Data: High Level

PERFORMANCE
Growth: Median and Adequate Growth PercentilesThis interactive visual allows users to view MGP and AGP by Sub-group, by Subject, and by EMH level.
Data Source: Data Lab & CDE Calculated; District level inclusion/exclusion
Achievement: Percentage of Students Scoring Proficient or AboveThis interactive visual allows users to compare percentage of students proficient and advanced by sub-group.
Results within the shaded area do not meet state expectations.Data Source: Data Lab & CDE Calculated; District level inclusion/exclusion
FRL
2009-10 2010-11 2011-12 2012-13 2013-140
20
40
60
80
100
Growth Percentile
50.000
Use the quick filters tocontrol what data is shown
on the chart.
Select a Subject:(choose one)Math
Reading
Writing
Select an EMH Level:(choose one)A. Elementary
B. Middle
C. High
Select a Sub-group:(choose one)All Students
ELL
FRL
IEP
Minority
MGP MAGP Color Key:Median Adequate Growth P..
Median Growth Percentile
Use the quick filters to control whatdata is shown on the chart.
Select a Subject:(choose one)Math
Reading
Writing
Select an EMH Level:(choose one)A. Elementary
B. Middle
C. High
Select Sub-groups:(choose multiple)All Students
ELL
FRL
IEP
Minority
VariableAll Students
ELL
FRL
IEP
Minority
2009-10 2010-11 2011-12 2012-13 2013-140
10
20
30
40
50
60
70
80
90
100
37.0
51.755.2
40.5
54.556.457.1
36.4
28.6
65.363.1
42.950.8
27.3
50.7
Data Time Span:(select 3 Year if no data appears)1 Year
Please note that the displays on this tab will not be updated with new data in 2015-16, but will remain in the dashboard forreference. Because of the state assessment transition and the passage of H.B. 15-1323, school accountability measuresare affected. The following website provides additional details on the accountability system during the transition:http://www.cde.state.co.us/accountability/impact-of-assessment-transition-on-school-and-district-accountability
SELECT A DISTRICTJULESBURG RE-1
bautsch_b
Typewritten Text
Writing Performance Data: Elementary Level
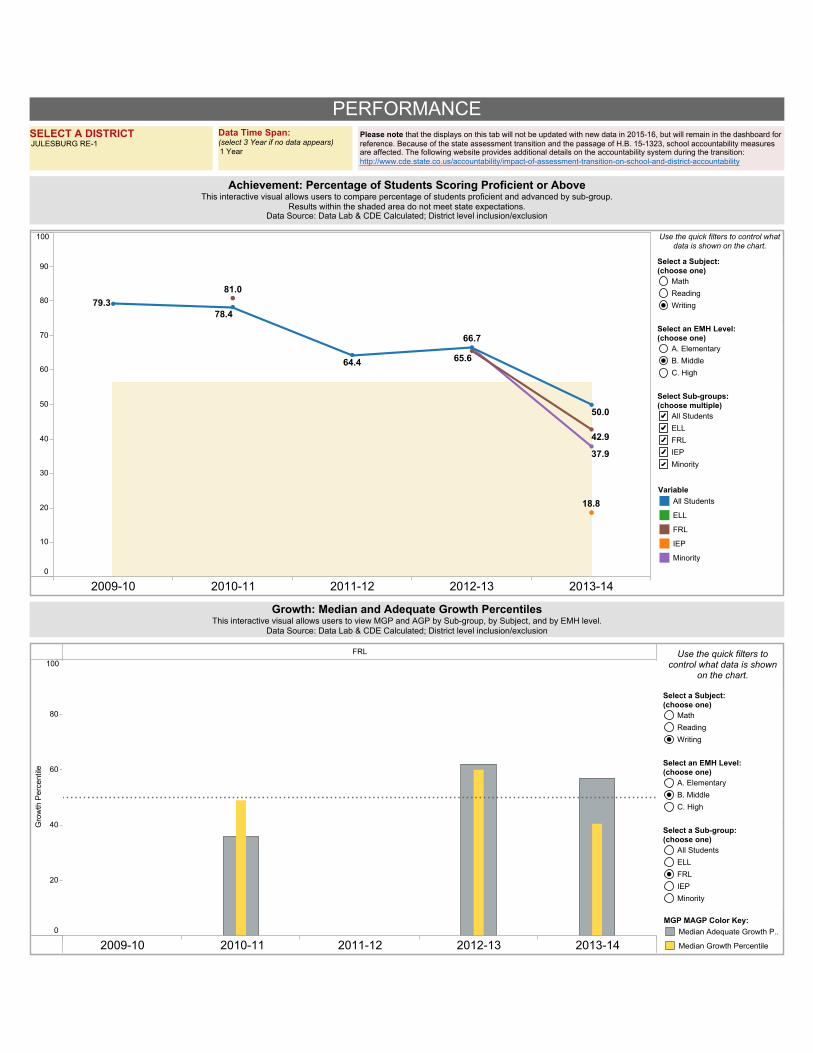
PERFORMANCE
Growth: Median and Adequate Growth PercentilesThis interactive visual allows users to view MGP and AGP by Sub-group, by Subject, and by EMH level.
Data Source: Data Lab & CDE Calculated; District level inclusion/exclusion
Achievement: Percentage of Students Scoring Proficient or AboveThis interactive visual allows users to compare percentage of students proficient and advanced by sub-group.
Results within the shaded area do not meet state expectations.Data Source: Data Lab & CDE Calculated; District level inclusion/exclusion
FRL
2009-10 2010-11 2011-12 2012-13 2013-140
20
40
60
80
100
Growth Percentile
50.00
Use the quick filters tocontrol what data is shown
on the chart.
Select a Subject:(choose one)Math
Reading
Writing
Select an EMH Level:(choose one)A. Elementary
B. Middle
C. High
Select a Sub-group:(choose one)All Students
ELL
FRL
IEP
Minority
MGP MAGP Color Key:Median Adequate Growth P..
Median Growth Percentile
Use the quick filters to control whatdata is shown on the chart.
Select a Subject:(choose one)Math
Reading
Writing
Select an EMH Level:(choose one)A. Elementary
B. Middle
C. High
Select Sub-groups:(choose multiple)All Students
ELL
FRL
IEP
Minority
VariableAll Students
ELL
FRL
IEP
Minority
2009-10 2010-11 2011-12 2012-13 2013-140
10
20
30
40
50
60
70
80
90
100
65.6
66.7
64.4
50.0
78.4
18.8
37.9
81.0
42.9
79.3
Data Time Span:(select 3 Year if no data appears)1 Year
Please note that the displays on this tab will not be updated with new data in 2015-16, but will remain in the dashboard forreference. Because of the state assessment transition and the passage of H.B. 15-1323, school accountability measuresare affected. The following website provides additional details on the accountability system during the transition:http://www.cde.state.co.us/accountability/impact-of-assessment-transition-on-school-and-district-accountability
SELECT A DISTRICTJULESBURG RE-1
bautsch_b
Typewritten Text
Writing Performance Data: Middle Level

PERFORMANCE
Growth: Median and Adequate Growth PercentilesThis interactive visual allows users to view MGP and AGP by Sub-group, by Subject, and by EMH level.
Data Source: Data Lab & CDE Calculated; District level inclusion/exclusion
Achievement: Percentage of Students Scoring Proficient or AboveThis interactive visual allows users to compare percentage of students proficient and advanced by sub-group.
Results within the shaded area do not meet state expectations.Data Source: Data Lab & CDE Calculated; District level inclusion/exclusion
FRL
2009-10 2010-11 2011-12 2012-13 2013-140
20
40
60
80
100
Growth Percentile
50.00
Use the quick filters tocontrol what data is shown
on the chart.
Select a Subject:(choose one)Math
Reading
Writing
Select an EMH Level:(choose one)A. Elementary
B. Middle
C. High
Select a Sub-group:(choose one)All Students
ELL
FRL
IEP
Minority
MGP MAGP Color Key:Median Adequate Growth P..
Median Growth Percentile
Use the quick filters to control whatdata is shown on the chart.
Select a Subject:(choose one)Math
Reading
Writing
Select an EMH Level:(choose one)A. Elementary
B. Middle
C. High
Select Sub-groups:(choose multiple)All Students
ELL
FRL
IEP
Minority
VariableAll Students
ELL
FRL
IEP
Minority
2009-10 2010-11 2011-12 2012-13 2013-140
10
20
30
40
50
60
70
80
90
100
38.8 35.1
60.0
31.5
36.332.1 32.0
5.6
45.2
22.0
7.7
21.4
36.7
22.0
0.0
26.9
34.0
11.5
18.6
Data Time Span:(select 3 Year if no data appears)1 Year
Please note that the displays on this tab will not be updated with new data in 2015-16, but will remain in the dashboard forreference. Because of the state assessment transition and the passage of H.B. 15-1323, school accountability measuresare affected. The following website provides additional details on the accountability system during the transition:http://www.cde.state.co.us/accountability/impact-of-assessment-transition-on-school-and-district-accountability
SELECT A DISTRICTJULESBURG RE-1
bautsch_b
Typewritten Text
Writing Performance Data: High Level

Class of
GRADUATION COMPLETION
4 5 6 7 4 5 6 7
2012
2013
2014
2015
20.3% 25.4% 26.9% 27.4% 33.1% 44.3% 48.3% 48.7%
20.8% 25.9% 28.0% 29.0% 36.8% 38.9%
21.0% 26.3% 28.8% 35.1%
39.7% 42.9%
Student GroupALL
ELL
FRL
IEP
MIN
2012 2013 2014 20150.0%
5.0%
10.0%
15.0%
20.0%
25.0%
24.7% 26.3% 12.8% 13.6%
Dropout RatesThe percentage of students enrolled in grades 7-12 who leave school during a single year. It iscalculated by dividing the number of dropouts by a membership base, which includes all studentswho were in the membership any time during the year and did not enroll in a different Colorado
school.
Graduation and Completion RatesColorado calculates ‘on-time’ graduation as the percent of students who graduate from high school four years after entering ninth grade. The rates presented in this report reflect the best of the 4-, 5-,6-, and 7-year graduation rates at the overall and disaggregated levels, based on end of year state submission reporting. The four-year rate for this report is based on 2015 graduates. For graduation,ELL students include only NEP and LEP. Please visit the department's website at http://www.cde.state.co.us/cdereval/gradcurrentdefinitions#sthash.asD4R2qV.dpuf for additional information.
The orange line represents the state average for each year.ELL: English Language Learners | FRL: Free and Reduced Luch Eligible | IEP: Special education students on individualized education plan | MIN: Minority students
POSTSECONDARY WORKFORCE READINESS
ALL CTE 2 YEAR 4 YEAR
20..
20..
20..
20..
20..
20..
20..
20..
0.0%
20.0%
40.0%
60.0%
80.0%
100.0%
25.2% 26.9% 1.4% 5.9% 12.9% 13.4% 10.8% 7.6%
Matriculation RatesAll 2015 high school graduates that enroll in a Career & Technical Education (CTE) program, 2-YearHigher Education Institution, or 4-Year Higher Education Institution during the subsequent academicyear. The rate also includes all high school graduates that earned a Career & Technical Educationcertificate or a college degree while they were still enrolled in high school. The matriculation data
includes both in-state and out-of-state enrollments. For more information:http://www.cde.state.co.us/accountability/matriculation_guidance_and_faq_7_25_16
JULESBURG RE-1

Fiscal Year
FY12 FY13 FY14 FY15 FY16
7,167
6,240
7,459
6,259
7,653
6,473
7,831
6,816
8,219
7,246
Per Pupil Funding Before and After Negative Factor
Fiscal YearFY12
FY13
FY14
FY15
FY16
85.45%
86.62%
84.08%
82.25%
78.44%
14.55%
13.38%
15.92%
17.75%
21.56%
State and Local Share / As Percentage
Local Share State Share
Per-Pupil Funding Before Negative Factor
Per Pupil Funding After Negative Factor
FY12 FY13 FY14 FY15 FY16
Total Formula At-Risk Funding
Total Program Before Negative Factor
Negative Factor
Total Program After Negative Factor
Property Taxes
Specific Ownership Taxes
State Share
Required Categorical Buyout From Total Program $0.00
$3,590,250.98
$96,474.83
$890,148.23
$4,576,874.04
($614,088.14)
$5,190,962.18
$307,878.88
$0.00
$4,296,683.40
$107,845.49
$819,568.26
$5,224,097.15
($778,342.22)
$6,002,439.37
$226,348.68
$0.00
$4,954,931.60
$73,222.77
$865,015.47
$5,893,169.84
($1,074,466.20)
$6,967,636.04
$398,159.32
$0.00
$5,829,801.38
$51,663.46
$848,490.39
$6,729,955.23
($1,290,753.70)
$8,020,708.93
$417,389.45
$0.00
$4,623,001.71
$58,305.98
$728,962.20
$5,410,269.89
($803,767.40)
$6,214,037.29
$247,097.54
Public School Finance Act Funding
FY12 FY13 FY14 FY15 FY16
Total Funded Pupil Count
At-Risk Pupil Count
ASCENT Pupil Count
Colorado Preschool Program Count FTE
Multi District On-line Pupil Count 380
8
0
293
632
522
7
0
240
767
669
8
0
426
910
833
8
0
478
1,075
627
8
0
290
867
Pupil Count
FY12 FY13 FY14 FY15 FY16
Assessed Valuation
Base Funding
Categorical Buyout Mill Levy (Final)
District percent of at-risk pupils
Equalization Mill Levy (Final)
Inflation
On-Line Funding 7,588
0
27
0
0
6,292
32,968,453
7,381
0
27
0
0
6,121
30,354,380
7,180
0
27
0
0
5,954
32,037,610
7,046
0
27
0
0
5,843
31,425,570
6,795
0
27
0
0
5,635
26,998,600
Funding Components
FISCALJULESBURG RE-1
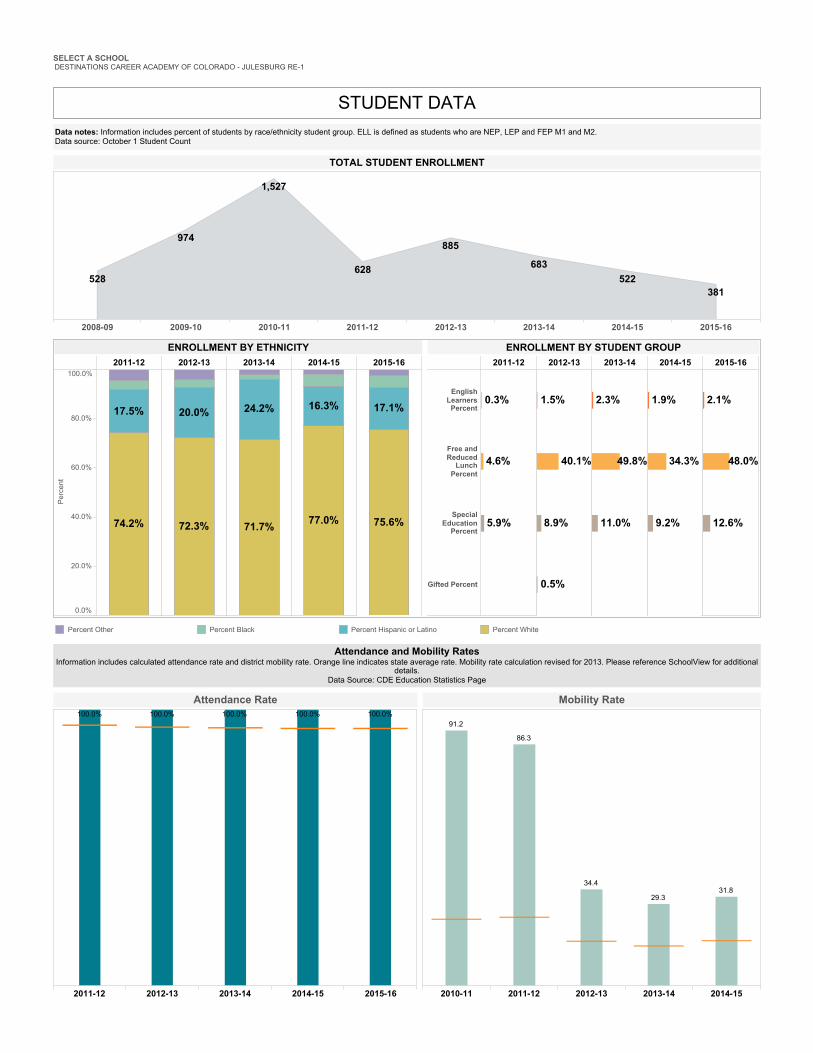
2011-12 2012-13 2013-14 2014-15 2015-16
0.0%
20.0%
40.0%
60.0%
80.0%
100.0%
Percent
17.5%
74.2%
20.0%
72.3%
24.2%
71.7%
16.3%
77.0%
17.1%
75.6%
ENROLLMENT BY ETHNICITY2011-12 2012-13 2013-14 2014-15 2015-16
EnglishLearnersPercent
Free andReducedLunchPercent
SpecialEducationPercent
Gifted Percent
0.3%
4.6%
5.9%
40.1%
1.5%
8.9%
0.5%
49.8%
11.0%
2.3%
34.3%
1.9%
9.2%
48.0%
12.6%
2.1%
ENROLLMENT BY STUDENT GROUP
Attendance and Mobility RatesInformation includes calculated attendance rate and district mobility rate. Orange line indicates state average rate. Mobility rate calculation revised for 2013. Please reference SchoolView for additional
details.Data Source: CDE Education Statistics Page
2008-09 2009-10 2010-11 2011-12 2012-13 2013-14 2014-15 2015-16
1,527
683
885
628
974
528 522381
TOTAL STUDENT ENROLLMENT
Percent Other Percent Black Percent Hispanic or Latino Percent White
2011-12 2012-13 2013-14 2014-15 2015-16
100.0% 100.0% 100.0% 100.0% 100.0%
Attendance Rate
2010-11 2011-12 2012-13 2013-14 2014-15
91.2
86.3
34.4
29.331.8
Mobility Rate
Data notes: Information includes percent of students by race/ethnicity student group. ELL is defined as students who are NEP, LEP and FEP M1 and M2.Data source: October 1 Student Count
STUDENT DATA
SELECT A SCHOOLDESTINATIONS CAREER ACADEMY OF COLORADO - JULESBURG RE-1
bautsch_b
Typewritten Text
School-level Data: Destinations Career Academy of Colorado
bautsch_b
Typewritten Text
bautsch_b
Typewritten Text
bautsch_b
Typewritten Text
bautsch_b
Typewritten Text

ENGLISH LANGUAGE ARTS MATH
650 700 750 800 850Mean Scale Score
650 700 750 800 850Mean Scale Score
ALL GRADES ALL STUDENTS 721 715
CMAS PARCC - MATH AND ENGLISH LANGUAGE ARTSThe following visual displays CMAS PARCC mean scale scores for math and English language art by grade and student group for 2015-16 school year. The visual includes the following elements: (1)state mean scale score presented as a vertical line in orange, (2) school mean scale score presented as a plus sign, (3) school mean scale score color coded based on the proportion of students whotook the assessments, and lastly (4) color band that identifies scores meeting assessment benchmark/state standards.
Category/S..Grade Year SCIENCE
300 350 400 450 500 550 600 650 700 750 800 850 900Mean Scale Score
ALLSTUDENTS
08 2014
2015
2016
11 2016
590
553
504
626
CMAS - SCIENCEThe following visual displays of CMASS science mean scale scores by student group, grade, and year. The visual includes the following three elements: (1) state mean scale score presented as avertical line in orange, (2) school mean scale score presented as a plus sign, and finally (3) the school mean scale score color coded based on the proportion of students who took the assessment.
5 10 15 20 25 30 35
COMPOSITE ALLSTUDENTS
2012
2013
2014
2015
2016
18.7
17.2
18.1
18.7
19.4
COLORADO ACTThe chart below displays the results from the Colorado ACT, including the overall (composite) score, English, Math, Reading and Science disaggregated by student group. The plussigns represent the school's ACT results and the orange lines represent the state average. For groups that meet the minimum N-count threshold (i.e., at least 16 students took andreceived a valid test score), the results are displayed below. Cursor mouse over each bar to see detailed results.
SUBJECTCOMPOSITE
ENGLISH
MATH
READING
SCIENCE
CATEGORYALL STUDENTS
ASSESSMENT DATA - SCHOOL RESULTS
SELECT A SCHOOLDESTINATIONS CAREER ACADEMY OF COLORADO - JULESBURG RE-1
Particpation Color Key95% or greater, High Particpation
Between 85% and 94%, Caution
Below 85%, Inference Difficult
No Participation Data

ENGLISH LANGUAGE ARTSSCHOOL
2016DISTRICT
2016STATE
2016
MATHSCHOOL
2016DISTRICT
2016STATE
2016ALL STUDENTS All Students
GRADE LEVEL 06
07
08
09
ENGLISH LEARNERS English Learners (NEP, LEP, FEP)
Non-English Learners
FREE AND REDUCEDLUNCH (FRL)
FRL-Eligible
Non-FRL
GENDER Female
Male
GIFTED Gifted and Talented
Non-Gifted and Talented
INDIVIDUALIZEDEDUCATION PLAN (IEP)
On IEP
Non-IEP
MIGRANT Migrant
Non-Migrant
MINORITY Minority
Non-Minority
PERFORMANCE LEVEL At or Above Benchmark
Below Benchmark
RACE/ETHNICITY American Indian or Alaska Native
Asian
Black
Hispanic
White
Hawaiian/Pacific Islander
Two or More Races
38.0 43.0 50.0 40.0 43.0 50.0
42.0
50.0
50.0
50.0
50.0
40.5
49.0
50.0
50.0
50.0
40.0 44.0 50.0
50.0
43.5 46.0 51.0
47.0
54.0
30.0
54.0
30.0
52.0
48.0
46.0
35.5
48.0
35.5
54.0
46.0
31.5
43.0
33.0
49.0
45.0
55.0
46.0
30.0
48.0
32.0
48.0
52.0
38.0 43.0 48.0
60.0
40.0 43.0 49.0
59.0
44.0 49.0 51.0
40.0
35.5 40.0 51.0
39.0
38.0 43.0 50.0
45.0
40.0 43.0 50.0
42.0
41.0 43.0 51.0
49.0
44.0 48.0 53.0
47.0
35.0 40.0 50.0
50.0
46.0 48.0 50.0
50.0
41.0 43.0
51.0
49.0
51.0
48.0
48.0
59.0
47.0
44.0 48.0
51.0
49.0
53.0
46.0
46.0
58.0
46.0
Growth metrics provide another view of the performance of a school, district or group of students. While achievement is focused on the performance at a point in time, growth provides an indication ofwhat happens in-between the assessments. Looking at both achievement and growth results provides a more in-depth picture of performance.
Growth rates for individual students are calculated by analyzing students’ Colorado Measures of Academic Success (CMAS) scores in English Language Arts and Math over consecutive years. Astudent's growth percentile (ranging from 1 to 99) indicates how a student’s performance changed over time, relative to students with a similar score history on the state assessments. School and districtgrowth rates are determined by the growth percentiles from individual students, specifically the median (or score in the middle) student growth percentile. Median Growth Percentiles (MGP) arecalculated for the whole school, by grade, and by different student groups. Higher median growth percentiles indicate higher growth rates for the typical students in those groups. Please note that growthrates are independent of achievement levels (students at all achievement levels are just as likely to have high growth as low growth). As a point of reference, the state median growth percentile for anygrade, overall, is 50. In rare cases, state median growth percentiles may vary slightly.
Missing data in the table reflect fewer than 20 students in the group; their data is not shown in the table (the cells are blank) to ensure data privacy and appropriate interpretation of results. Foradditional definitions and information go to: www.cde.state.co.us/accountability/coloradogrowthmodel
SELECT A SCHOOLDESTINATIONS CAREER ACADEMY OF COLORADO - JULESBURG RE-1
1.0 99.0Median Growth Percentile
50

Class of
GRADUATION COMPLETION
4 5 6 7 4 5 6 7
2011-12
2012-13
2013-14
2014-15
16.8% 22.1% 23.6% 24.1% 29.6% 41.4% 45.5% 45.9%
15.2% 20.6% 22.8% 24.0% 32.2% 34.5%
17.8% 23.3% 25.7% 32.3%
36.2% 39.5%
Student Grou..ALL
ELL
FRL
IEP
MIN
2011-12 2012-13 2013-14 2014-150.0%
10.0%
20.0%
30.0%
27.8% 30.0% 15.3% 16.7%
Dropout RatesThe percentage of students enrolled in grades 7-12 who leave school during a single year. It iscalculated by dividing the number of dropouts by a membership base, which includes all studentswho were in the membership any time during the year and did not enroll in a different Coloradoschool.
Graduation and Completion RatesColorado calculates ‘on-time’ graduation as the percent of students who graduate from high school four years after entering ninth grade. The rates presented in this report reflect thebest of the 4-, 5-, 6-, and 7-year graduation rates at the overall and disaggregated levels, based on end of year state submission reporting. The four-year rate for this report is based on2015 graduates. For graduation, ELL students include only NEP and LEP. Please visit the department's website athttp://www.cde.state.co.us/cdereval/gradcurrentdefinitions#sthash.asD4R2qV.dpuf for additional information.The orange line represents the state average for each year.ELL: English Language Learners | FRL: Free and Reduced Luch Eligible | IEP: Special education students on individualized education plan | MIN: Minority students
POSTSECONDARY WORKFORCE READINESS
ALL CTE 2 YEAR 4 YEAR
2014-15 2014-15 2014-15 2014-150.0%
20.0%
40.0%
60.0%
80.0%
100.0..
21.7% 5.7% 8.5% 7.5%
Matriculation RatesAll 2015 high school graduates that enroll in a Career & Technical Education (CTE) program, 2-YearHigher Education Institution, or 4-Year Higher Education Institution during the subsequent academicyear. The rate also includes all high school graduates that earned a Career & Technical Educationcertificate or a college degree while they were still enrolled in high school. The matriculation dataincludes both in-state and out-of-state enrollments. For more information:http://www.cde.state.co.us/accountability/matriculation_guidance_and_faq_7_25_16
SELECT A SCHOOLDESTINATIONS CAREER ACADEMY OF COLORADO - JULESBURG RE-1

ACCOUNTABILITYSelect a SchoolINSIGHT SCHOOL OF COLORADO AT JULESBURG - JULESBURG RE-1
Please note that the displays on this tab will not be updated with new data in 2015-16, but will remain in the dashboard forreference. Because of the state assessment transition and the passage of H.B. 15-1323, school accountability measuresare affected. The following website provides additional details on the accountability system during the transition:http://www.cde.state.co.us/accountability/impact-of-assessment-transition-on-school-and-district-accountability
Select a data time span(For longitudinal data analysis, select either 1-year or 3-year)1 Year
SPF Key Indicator Ratings OverallNumber indicates percentage points earned on key indicator. Color of bar represents key performance indicator rating. Drop down menu at top of page indicates data time span. Data
Source: School Performance FrameworkColor Key
Exceeds Meets Approaching Does Not Meet
Achievement DataPercent of students scoring Proficient and Advanced. Color of bar represents rating for
sub-indicator. Drop down menu at top of page indicates data time span. Data Source: SchoolPerformance Framework
Growth DataMedian student growth percentile. Color of bar represents rating for sub-indicator. Drop
down menu at top of page indicates data time span. MAGP can be found onPerformance tab. Data Source: School Performance Framework
Growth Gaps DataUse the Performance Tab forinteractive diagnostic on growthgaps. View median and adequategrowth percentile by sub-group,by EMH level, and by subject for2008-2014 academic years.
Post Secondary and Workforce Readiness Data
Graduation Rating
ACT Rating
Dropout Rating
2010 2011 2012 2013 2014
A. OVERALL
C. MIDDLE
D. HIGH
37.545.840.6
43.850.0
37.5 37.531.3
41.7
25.0
Achievement %
2010 2011 2012 2013 2014
45.841.7 41.7
41.7 41.7
41.7 41.7 41.733.3
50.0
Growth %
2010 2011 2012 2013 2014
38.933.3
57.1
40.0
38.941.733.3 33.3
66.7
Growth Gaps %
2010 2011 2012 2013 2014
31.7 31.3 31.3
33.3 33.3 31.7 31.3 31.3
Postsecondary %
2010
2011
2012
2013
2014
C. MIDDLE
D. HIGH
67.6
61.1
56.359.6 63.2
65.1
53.1
Ach - Read
2010
2011
2012
2013
2014
23.7 31.0
12.5
10.8
8.3
7.3 9.2
Ach - Math
2010
2011
2012
2013
2014
47.9
47.4
42.8
28.7
31.0
27.2
29.1
Ach - Write
2010
2011
2012
2013
2014
47.6
22.8 31.4
23.4
26.2
Ach - Science
2010
2011
2012
2013
2014
C. MIDDLE
D. HIGH
4542
55
39
484644
MGP - Read
2010
2011
2012
2013
2014
28
24
29
39 38
30 32
MGP - Math
2010
2011
2012
2013
2014
36
4138
43
3336
42
MGP - Write
2010
2011
2012
2013
2014
MGP - ELP
SPF Plan Type2010 2011 2012 2013 2014
A. OVERALL
C. MIDDLE
D. HIGHTurnaroundPlan Turnaround Priority
Improvement
PriorityImprovement
PriorityImprovement
PriorityImprovement
PriorityImprovement
PriorityImprovement
PriorityImprovement
PriorityImprovement
2010 2011 2012 2013 2014A. OVERALL
C. MIDDLE
D. HIGH 44.8
43.4
42.5
37.0
42.5
37.5
36.3
36.3
32.237.3
SPF % Points Earned
The data in this tab relates to the traditional School Performance Framework. Data forschools that are AEC is not available. For AEC schools, please reference your SPF reporton SchoolView.org. The display below will indicate whether the school you've selected isan AEC.
2010 2011 2012 2013 2014NONONONONO
The below table indicates the plan type used (1-year or 3-Year)
2010 2011 2012 2013 2014A. OVERALL
C. MIDDLE
D. HIGH 1 Year
1 Year
1 Year
1 Year
1 Year
1 Year
1 Year
1 Year
1 Year
1 Year1 Year
Year 5
Year Entering Priority Improvement or Turnaround
2010 2011 2012 2013 2014Does Not MeetDoes Not MeetDoes Not MeetDoes Not MeetDoes Not Meet
ApproachingApproachingApproachingApproachingApproaching
Does Not MeetDoes Not MeetDoes Not MeetDoes Not MeetDoes Not Meet

STUDENT PERFORMANCESelect a SchoolINSIGHT SCHOOL OF COLORADO AT JULESBURG - JULESBURG RE-1
Please note that the displays on this tab will not be updated with new data in 2015-16, but will remain in thedashboard for reference. Because of the state assessment transition and the passage of H.B. 15-1323, schoolaccountability measures are affected. The following website provides additional details on the accountabilitysystem during the transition: http://www.cde.state.co.us/accountability/impact-of-assessment-transition-on-school-..
Achievement: Percentage of Students Scoring Proficient or AboveThis interactive visual allows users to compare percentage of students proficient and advanced by sub-group.
Data Source: Data Lab; School-level inclusion/exclusion rules
2008-09 2009-10 2010-11 2011-12 2012-13 2013-140.0
10.0
20.0
30.0
40.0
50.0
60.0
70.0
80.0
90.0
100.0
Percent Proficient Advanced
8.811.4
17.912.0
15.0
6.9
13.4
2.3
7.1 11.14.00.01.2
6.4
6.00.0
Use the quick filters tocontrol what data is shown
on the chart.
Select a Subject:(choose one)Math
Reading
Writing
Select a Sub-group(choose one or many)All Students
ELL
FRL
IEP
Minority
Sub-group Color KeyAll Students
ELL
FRL
IEP
Minority
Growth: Median and Adequate Growth PercentilesThis interactive visual allows users to view MGP and AGP by Sub-group, by Subject, and by EMH level. Yellow bar should exceed green bar.
Data Source: Data Lab & CDE Calculated; School-level inclusion/exclusion rules
2008-09 2009-10 2010-11 2011-12 2012-13 2013-140
10
20
30
40
50
60
70
80
90
Growth Percentile
33
17
30 30 3031
50
Use the quick filters tocontrol what data isshown on the chart.
Select a Subject:(choose one)Math
Reading
Writing
Select a Sub-group(choose one)All Students
ELL
FRL
IEP
Minority
Growth Color KeyMedian Growth Percen..
Adequate Growth Perc..
bautsch_b
Typewritten Text
Math Performance Data: Destinations Career Academy of Colorado

STUDENT PERFORMANCESelect a SchoolINSIGHT SCHOOL OF COLORADO AT JULESBURG - JULESBURG RE-1
Please note that the displays on this tab will not be updated with new data in 2015-16, but will remain in thedashboard for reference. Because of the state assessment transition and the passage of H.B. 15-1323, schoolaccountability measures are affected. The following website provides additional details on the accountabilitysystem during the transition: http://www.cde.state.co.us/accountability/impact-of-assessment-transition-on-school-..
Achievement: Percentage of Students Scoring Proficient or AboveThis interactive visual allows users to compare percentage of students proficient and advanced by sub-group.
Data Source: Data Lab; School-level inclusion/exclusion rules
2008-09 2009-10 2010-11 2011-12 2012-13 2013-140.0
10.0
20.0
30.0
40.0
50.0
60.0
70.0
80.0
90.0
100.0
Percent Proficient Advanced
47.8
58.0
50.9
60.6
55.555.4
31.3
10.515.0
44.840.9
70.4
52.0
5.0
57.1
64.1
20.0
59.0
63.8
Use the quick filters tocontrol what data is shown
on the chart.
Select a Subject:(choose one)Math
Reading
Writing
Select a Sub-group(choose one or many)All Students
ELL
FRL
IEP
Minority
Sub-group Color KeyAll Students
ELL
FRL
IEP
Minority
Growth: Median and Adequate Growth PercentilesThis interactive visual allows users to view MGP and AGP by Sub-group, by Subject, and by EMH level. Yellow bar should exceed green bar.
Data Source: Data Lab & CDE Calculated; School-level inclusion/exclusion rules
2008-09 2009-10 2010-11 2011-12 2012-13 2013-140
10
20
30
40
50
60
70
80
90
Growth Percentile
4436
46 4739
51
50
Use the quick filters tocontrol what data isshown on the chart.
Select a Subject:(choose one)Math
Reading
Writing
Select a Sub-group(choose one)All Students
ELL
FRL
IEP
Minority
Growth Color KeyMedian Growth Percen..
Adequate Growth Perc..
bautsch_b
Typewritten Text
Reading Performance Data: Destinations Career Academy of Colorado

STUDENT PERFORMANCESelect a SchoolINSIGHT SCHOOL OF COLORADO AT JULESBURG - JULESBURG RE-1
Please note that the displays on this tab will not be updated with new data in 2015-16, but will remain in thedashboard for reference. Because of the state assessment transition and the passage of H.B. 15-1323, schoolaccountability measures are affected. The following website provides additional details on the accountabilitysystem during the transition: http://www.cde.state.co.us/accountability/impact-of-assessment-transition-on-school-..
Achievement: Percentage of Students Scoring Proficient or AboveThis interactive visual allows users to compare percentage of students proficient and advanced by sub-group.
Data Source: Data Lab; School-level inclusion/exclusion rules
2008-09 2009-10 2010-11 2011-12 2012-13 2013-140.0
10.0
20.0
30.0
40.0
50.0
60.0
70.0
80.0
90.0
100.0
Percent Proficient Advanced
26.126.3
29.8 29.7
43.9
28.2
38.133.7
28.1
28.1
10.0 8.0
33.6
24.221.9
15.0
37.0
16.9
18.2
5.3
Use the quick filters tocontrol what data is shown
on the chart.
Select a Subject:(choose one)Math
Reading
Writing
Select a Sub-group(choose one or many)All Students
ELL
FRL
IEP
Minority
Sub-group Color KeyAll Students
ELL
FRL
IEP
Minority
Growth: Median and Adequate Growth PercentilesThis interactive visual allows users to view MGP and AGP by Sub-group, by Subject, and by EMH level. Yellow bar should exceed green bar.
Data Source: Data Lab & CDE Calculated; School-level inclusion/exclusion rules
2008-09 2009-10 2010-11 2011-12 2012-13 2013-140
10
20
30
40
50
60
70
80
90
Growth Percentile
3643
3338
2939
50
Use the quick filters tocontrol what data isshown on the chart.
Select a Subject:(choose one)Math
Reading
Writing
Select a Sub-group(choose one)All Students
ELL
FRL
IEP
Minority
Growth Color KeyMedian Growth Percen..
Adequate Growth Perc..
bautsch_b
Typewritten Text
Writing Performance Data: Destinations Career Academy of Colorado