Submission to the Police Pay and Remuneration Body to the Police Pay and Remuneration Body ... 7.3...
233
Submission to the Police Pay and Remuneration Body on behalf of the Police Federation of England and Wales (PFEW) and the Police Superintendents’ Association of England and Wales (PSAEW)
Transcript of Submission to the Police Pay and Remuneration Body to the Police Pay and Remuneration Body ... 7.3...
Submission to the
Police Pay and
Remuneration Body
on behalf of
the Police Federation
of England and Wales
(PFEW)
and
the Police Superintendents’
Association
of England and Wales
(PSAEW)
9th January 2014
To: The Chair of the Police Remuneration Review Body. Dear Mr Lebrecht, We are pleased to enclose the first submission to the Police Remuneration Review
Body. This is a joint submission provided on behalf of the Police Federation of
England and Wales (PFEW), and the Police Superintendents’ Association of
England and Wales (PSAEW).
These are challenging times for officers. They face a changing social environment,
with emerging crime patterns, at a time when government spending policy has meant
“doing more with less”. Recent amendments to the remuneration system - such as
those introduced following the Winsor Review, and the change from a final salary to
a career average pension scheme - coupled with pay uplifts that are well below
inflation, have resulted in a significant reduction in officers’ remuneration packages.
We are well aware of the government policy with regard to pay, and have shaped our
recommendation for an uplift this year accordingly. However, we welcome the Police
Remuneration Review Body’s focus on an evidence base for remuneration. In our
submission, we have offered constructive suggestions for future evidence
requirements, and we identify priorities for the future, including issues within the
current remuneration system that need to be addressed. We have provided evidence
that makes a case for increased future uplifts.
We look forward to a productive working relationship in the years ahead.
Andy Fittes, General Secretary of PFEW
Police Federation
of England and Wales
Ffederasiwn Heddlu
Lloegr a Chymru
and
Superintendents’ Association
of England and Wales
Tim Jackson, National Secretary of
PSAEW

Contents
1 EXECUTIVE SUMMARY ............................................................................... 8
Preparation ................................................................................................ 8 1.1
Core principles of our submission .............................................................. 8 1.2
Data quality and monitoring change ......................................................... 10 1.3
The Home Secretary’s remit letter ........................................................... 13 1.4
The Home Secretary’s remit letter – our response................................... 15 1.5
The London Lead ..................................................................................... 18 1.6
Differentiation of pay and allowances at local and regional level ............. 20 1.7
Observations ............................................................................................ 20 1.8
The five year remit ................................................................................... 22 1.9
Staff Association overarching concerns ................................................ 22 1.10
The Home Secretary’s remit letter: list of priorities ............................... 24 1.11
Issues that relate to particular elements of the remuneration system ... 25 1.12
SECTION 1: BACKGROUND TO POLICING AND CURRENT CONTEXT ................................. 26
2 What is the nature of policing in England and Wales? ................................. 27
Introduction .............................................................................................. 27 2.1
The Peelian principles and policing by consent ....................................... 27 2.2
The Office of Constable ........................................................................... 28 2.3
The framework within which officers serve .............................................. 30 2.4
Skills and knowledge required to be a police officer ................................ 37 2.5
The day-to-day job ................................................................................... 39 2.6
Summary ................................................................................................. 44 2.7
3 How has the nature of policing changed? .................................................... 46
Introduction .............................................................................................. 46 3.1
Social context of policing and crime ......................................................... 46 3.2
Political influences and police reform ....................................................... 49 3.3
Economic influences ................................................................................ 52 3.4
Police workforce numbers over time ........................................................ 54 3.5
Demand for policing over time ................................................................. 61 3.6
Summary ................................................................................................. 62 3.7

Questions arising ..................................................................................... 63 3.8
SECTION 2: OFFICIAL WORKFORCE DATA ......................................................... 64
4 Workforce data: are the current workforce data robust enough to evaluate
pay against the outcomes of ‘sufficient, capable and motivated’ officers? ... 65
Introduction .............................................................................................. 65 4.1
Data comprehensiveness ........................................................................ 66 4.2
Data accuracy and uniformity .................................................................. 79 4.3
Transparency ........................................................................................... 84 4.4
Summary ................................................................................................. 87 4.5
Questions arising ..................................................................................... 87 4.6
Recommendations ................................................................................... 88 4.7
SECTION 3: KEY EVIDENCE 2014 ................................................................................ 90
5 Objective evidence regarding the numbers of officers recruited and retained
.................................................................................................................... 91
Introduction .............................................................................................. 91 5.1
Summary ................................................................................................. 97 5.2
Questions Arising ..................................................................................... 97 5.3
6 External context: Government pay policy and impact on police perception
evidence: workforce surveys ....................................................................... 98
Introduction .............................................................................................. 98 6.1
PFEW WORKFORCE SURVEY 2014 ................................................... 100 6.2
Survey Methodology .............................................................................. 100 6.3
Police workforce profile .......................................................................... 101 6.4
Officers’ morale and motivation.............................................................. 102 6.5
Capability and training: opportunities for training and development ....... 107 6.6
Indicators of future police workforce sufficiency ..................................... 108 6.7
Police Officers’ Psychological Contract with the police service .............. 110 6.8
Psychological Contract breach and intention to leave ............................ 112 6.9
Differences between demographic groups ......................................... 115 6.10
Benchmarking ..................................................................................... 118 6.11
PSAEW PERSONAL RESILIENCE SURVEY 2014 ........................... 121 6.12
Survey Methodology ........................................................................... 121 6.13
Motivation and Job Engagement ........................................................ 121 6.14
Training and development: indicators of future workforce capability .. 122 6.15
Indicators of current and future workforce sufficiency ......................... 123 6.16
Summary ............................................................................................ 125 6.17
Questions arising ................................................................................ 127 6.18
7 External context: Government pay policy and impact on police pay .......... 128
7.1 Introduction .............................................................................................. 128
Government pay policy .......................................................................... 129 7.2
Impact on police pay: pay settlements ................................................... 130 7.3
Impact on police pay: average earnings ................................................ 134 7.4
Pension changes: impact on total and lifetime remuneration ................. 143 7.5
Summary ............................................................................................... 144 7.6
Questions arising ................................................................................... 145 7.7
Recommendations ................................................................................. 146 7.8
8 The London Lead ...................................................................................... 147
Introduction ............................................................................................ 147 8.1
The case for the London Lead, and PFEW position............................... 148 8.2
The PFEW position ................................................................................ 153 8.3
Summary ............................................................................................... 154 8.4
Questions Arising ................................................................................... 156 8.5
Recommendations ................................................................................. 156 8.6
9 Regionalisation of pay: Observations ........................................................ 157
Introduction ............................................................................................ 157 9.1
Existing arrangements and their derivation ............................................ 157 9.2
What is known about the benefits of the existing system? ..................... 159 9.3
What do other organisations do? ........................................................... 160 9.4
Other factors in pay systems ................................................................. 163 9.5
Risks of further pay regionalisation ........................................................ 164 9.6
Summary ............................................................................................... 167 9.7
Questions arising ................................................................................... 168 9.8
Recommendations ................................................................................. 169 9.9
SECTION 4: THE FIVE YEAR REMIT .................................................................... 170
10 The Remit Letter – five year considerations .............................................. 171

Introduction ......................................................................................... 171 10.1
PFEW and PSAEW overarching concerns for the coming five years . 172 10.2
Conclusions ........................................................................................ 181 10.3
Pay uplifts in the next five years ......................................................... 182 10.4
Summary: Our overarching priorities for the next five years ............... 182 10.5
The Home Secretary’s remit letter: list of priorities ............................. 183 10.6
On-call ................................................................................................ 184 10.7
Summary ............................................................................................ 186 10.8
Questions arising ................................................................................ 186 10.9
Recommendation 7a .......................................................................... 187 10.10
Summary ............................................................................................ 189 10.12
Questions arising ................................................................................ 189 10.13
Recommendation 7b .......................................................................... 189 10.14
Buy-out of Sergeants’ casual overtime ............................................... 190 10.15
Previous overtime buy-out .................................................................. 191 10.16
Staff association position .................................................................... 194 10.17
Summary ............................................................................................ 194 10.18
Questions arising ................................................................................ 195 10.19
Recommendation 7c ........................................................................... 196 10.20
Management of officers on limited duties and the value of the 10.21
deployment component of the x-factor ............................................................ 196
The x-factor payment .......................................................................... 197 10.22
Summary ............................................................................................ 199 10.23
Questions arising ................................................................................ 199 10.24
Recommendation 7d .......................................................................... 199 10.25
Feasibility of attaining a greater degree of coherence between the terms 10.26
and conditions of police officers and police staff ............................................. 200
Summary ............................................................................................ 201 10.27
Questions arising ................................................................................ 201 10.28
Recommendation 7e .......................................................................... 201 10.29
Staff Association priorities: existing elements of the pay system ........ 201 10.30
Constables’ pay scale (for officers who joined after 1 April 2013) ...... 202 10.31
Summary ............................................................................................ 203 10.32
Questions arising ................................................................................ 204 10.33

Recommendation 7f ........................................................................... 204 10.34
Pay progression .................................................................................. 205 10.35
Summary ............................................................................................ 207 10.36
Questions arising ................................................................................ 207 10.37
Recommendation 7g .......................................................................... 207 10.38
Skills thresholds .................................................................................. 208 10.39
Summary ............................................................................................ 209 10.40
Questions arising ................................................................................ 209 10.41
Recommendation 7h .......................................................................... 210 10.42
Away from home overnight allowance ................................................ 210 10.43
Summary ............................................................................................ 211 10.44
Questions arising ................................................................................ 211 10.45
Recommendation 7i ............................................................................ 211 10.46
Motor Vehicle Allowances ................................................................... 212 10.47
Summary ............................................................................................ 212 10.48
Questions arising ................................................................................ 213 10.49
Recommendation 7j ............................................................................ 213 10.50
Equality issues .................................................................................... 213 10.51
Summary ............................................................................................ 215 10.52
Questions arising ................................................................................ 216 10.53
Recommendation 7k ........................................................................... 216 10.54
Annex 1.1 - Police Remuneration Review Body (PRRB) remit letter .................. 217
Annex 2.1 - Robert Peel’s Nine Principles of Policing ......................................... 219
Annex 4.1 Workforce planning evidence base: required data ............................. 221
Annex 4.2: Gender and BME reference list ......................................................... 226
Annex 4.3: Data sources for Graph 4.1 and Graph 4.2 ....................................... 228
Annex 10.1 - Legal context ................................................................................. 229

8
1 EXECUTIVE SUMMARY
Preparation 1.1
This submission has been prepared by the Police Federation of 1.1.1
England and Wales (PFEW), and the Police Superintendents’
Association of England and Wales (PSAEW)1 for the Police
Remuneration and Review Body (PRRB). Separate submissions may
be made in whole or in part in future years, dependent on the scope
of the remit letter.
This is the first year during which the PRRB has operated. In 1.1.2
preparing our submission, we have taken into account the PRRB’s
request to provide education on the nature of policing; evidence to
justify our case for a fair and meaningful pay rise for officers; the
PRRB’s broad Terms of Reference; and the remit letter from the
Home Secretary to the PRRB Chair, dated 3rd November 2014.
Core principles of our submission 1.2
In July 2013 the Staff Associations were asked to outline what we 1.2.1
would wish to see included in the remit letter to the PRRB. PFEW
stated then:
“The core principles we would wish to see embedded in the pay and
conditions of officers are as follows:
• pay and conditions should support the advancement of a police
service that is representative of the public it serves, with a pay system
that attracts and retains officers of differing genders, ethnicity, and
age groups;
1 Any use of the term “We” throughout this document refers to both organisations.

9
• they should be designed so as to ensure that officers believe there
to be organisational justice: such as fair pay, appropriately distributed;
• they should be designed based on evidence of need, (especially
where changes are considered), and of what works in attracting,
retaining, and motivating officers of the right calibre, and on objective
evaluation.”
The PSAEW supported these aims, and further stated:
“We are concerned that the public sector pay freeze followed by
below-inflation pay rises together with the freeze on incremental
progression has led to a reduction in the living standards of police
officers when compared with other sectors. We would wish this to be
considered and addressed by the PRRB at the earliest opportunity.
We also consider it important that an effective comparison is made
between the pay and conditions of service of police officers and those
roles undertaken within other professions which are of similar
significance and comparable responsibility, to ensure that police
officers are not disadvantaged and are properly rewarded for what
they do”.
The Staff Associations are united in wanting to have a pay system
that reflects the responsibilities and workload carried, while facilitating
the need for officers to be deployed across a broad spectrum of
activities.

10
These remain the core principles behind our submission. They form 1.2.2
themes that run throughout.
We believe that officers have had a turbulent period, (there having 1.2.3
been significant changes following the Winsor Review, and a pay
freeze for most of our members,) and that it is not in the interests of
the service to continue this turbulence.
Furthermore, the reduction in numbers of officers over the last several 1.2.4
years has meant significant changes to the role. We recognise the
need for the public sector to make savings. However, we believe that
too often the need for savings has been cited as being an imperative
that overrides all others. We believe that it is important to also focus
on the need to support the attraction and retention of officers of an
appropriate calibre to serve the public interests, and to give stronger
consideration to the impacts on public service, and on the likely make-
up of the police service in the 5-10 year timeframe, rather than on
simple number and cost reduction in the short-term.
Data quality and monitoring change 1.3
We further believe that the national evidence base of Human 1.3.1
Resources data currently retained to manage the police service
reward and recognition system is not fit for purpose. In particular, we
believe:
the data are not sufficiently comprehensive;
the data lack transparency, especially at national level;
the data are not consistently collated, resulting in potentially
inaccurate interpretation.
11
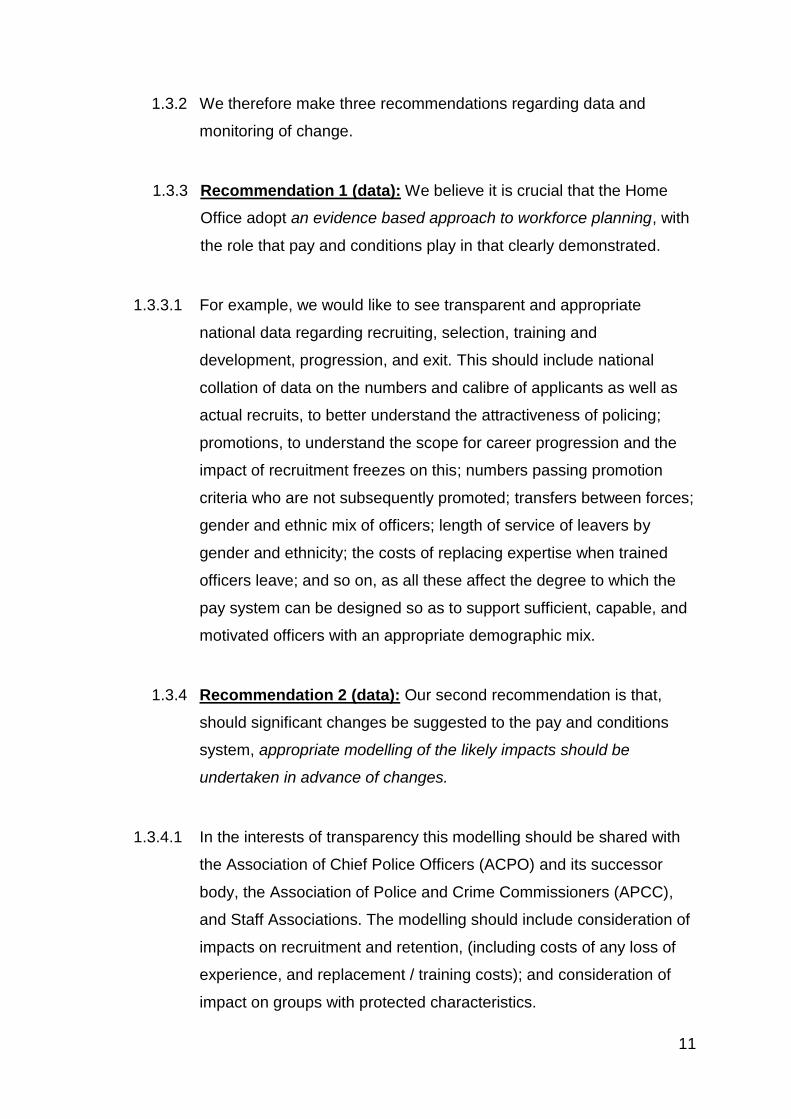
We therefore make three recommendations regarding data and 1.3.2
monitoring of change.
Recommendation 1 (data): We believe it is crucial that the Home 1.3.3
Office adopt an evidence based approach to workforce planning, with
the role that pay and conditions play in that clearly demonstrated.
1.3.3.1 For example, we would like to see transparent and appropriate
national data regarding recruiting, selection, training and
development, progression, and exit. This should include national
collation of data on the numbers and calibre of applicants as well as
actual recruits, to better understand the attractiveness of policing;
promotions, to understand the scope for career progression and the
impact of recruitment freezes on this; numbers passing promotion
criteria who are not subsequently promoted; transfers between forces;
gender and ethnic mix of officers; length of service of leavers by
gender and ethnicity; the costs of replacing expertise when trained
officers leave; and so on, as all these affect the degree to which the
pay system can be designed so as to support sufficient, capable, and
motivated officers with an appropriate demographic mix.
Recommendation 2 (data): Our second recommendation is that, 1.3.4
should significant changes be suggested to the pay and conditions
system, appropriate modelling of the likely impacts should be
undertaken in advance of changes.
1.3.4.1 In the interests of transparency this modelling should be shared with
the Association of Chief Police Officers (ACPO) and its successor
body, the Association of Police and Crime Commissioners (APCC),
and Staff Associations. The modelling should include consideration of
impacts on recruitment and retention, (including costs of any loss of
experience, and replacement / training costs); and consideration of
impact on groups with protected characteristics.

12
Recommendation 3 (data): Our third key recommendation, related to 1.3.5
1 and 2, is that recent changes be monitored for their impact, to check
whether the intended benefits have in fact accrued, and to check
whether there have been unintended consequences, before further
significant change is embarked upon.
1.3.5.1 In the main body of this submission a number of changes that should
be monitored are outlined. Two are cited in brief here:
Constables’ pay scale: We believe the spine point move (worth £5.5
thousand to each officer, or approximately 18% of their salary) at the
top end of the Constables’ pay scale is disproportionate to the
incoming Advanced Skills Threshold assessment, and creates an
unjust pay scale. Further, we believe the reduction of pay at the
bottom of the scale (to £19,000) may negatively impact the calibre of
recruits.
Removal of final salary pension: We believe that the impact of
pensions on the total remuneration package must also be considered.
We believe the removal of the final salary pension schemes and
replacement with the career average (Career Average Revalued
Earnings: CARE) scheme will impact on aspirations with regard to
length of service. We see no evidence that the Home Office have
modelled the likelihood of officers choosing to leave mid-career, once
the “golden handcuffs” of a final salary pension are removed. Whilst
some turnover of officers is to be expected and creates opportunities
for recruiting, we are concerned that this pension change will cause a
loss of experience that is costly to replace. This is likely to result in
additional training requirements for the police service, and will take
supervisors away from the front-line in order to conduct assessments.

13
1.3.5.2 These – and other – recent changes need to be monitored using an
appropriate data set, and action taken should the overall impact prove
to be more negative than positive.
1.3.5.3 Considerations regarding the evidence base have shaped our
response to several of those issues raised in the Home Secretary’s
remit letter – both those noted for the first remit, and those aspects
from the Winsor Review that the PRRB has been asked to consider in
the longer term.
The Home Secretary’s remit letter 1.4
The remit letter is at Annex 1.1.The following issues were raised by 1.4.1
the Home Secretary for the PRRB’s consideration:
(This year)
What adjustments should be made to pay and allowances for
officers up to and including Chief Superintendent (with regard to the
Government policy that public sector pay awards in 2015/2016
average up to 1%)?
Should the “London Lead” for Inspecting ranks in the London forces
be retained?
Observations on the level and scope of existing arrangements for
differentiation of officer pay and allowances at the regional and
local level.
(Longer term – five years)
The review of the national on-call allowance.
Consideration of the gap between the Constable and Sergeant pay
scales, and between the Inspector and Chief Inspector scales.

14
Whether there is a case for the buy-out of Sergeants’ casual
overtime.
The impact of changes to the management of officers on limited
duties, including review of the deployment component of the x-
factor.
The feasibility of creating a greater degree of coherence between
the terms and conditions of police officers and staff.

15
The Home Secretary’s remit letter – our response 1.5
In response to the remit letter, as to what adjustments should be 1.5.1
made for officers up to and including Chief Superintendent, we have
considered evidence of whether current pay and conditions attract
sufficient, capable, and motivated officers, and evidence of the impact
of recent pay freeze and austerity.
In the absence of clear evidence from the Home Office as to whether 1.5.2
policies attract and retain the right calibre of officers, we have focused
on survey responses and economic data. (The Home Office do not
routinely collect and report on numbers of applicants and reasons for
leaving. Despite the fact that more officers have left during the
austerity cuts than were projected, there is no systematic analysis of
why that has been the case).
In particular, we have collected evidence from members that 1.5.3
demonstrate a link between the negative impact on morale of recent
changes, including the Winsor Review and austerity measures, and
intention to leave. Modelling of the impact on the psychological
contract, and its relationship to intention to leave, shows that on a five
point scale for each unit increase in perceived contract breach the
odds of officers planning to leave the police increased by 89%. We
also benchmarked police morale and perceptions of fairness of
treatment against the Armed Forces, using the same questions, and
the NHS. Both were substantially lower in the police (59% of police
officers rated their own morale as low, while 28% Armed Forces
personnel did; 51% of police were dissatisfied with basic pay,
compared to 37% of Armed Forces personnel; 44% of police officers
felt they were not treated fairly, compared to 15% of Armed Forces
personnel).

16
It is not clear why the perceptions in the police differ so much from 1.5.4
other organisations. However, there has been a period of significant
change, with some decisions not evidenced or monitored, (e.g. the
reduction in Constables’ starting salary to £19,000) and others clearly
different to treatment in other organisations (e.g. the pay freeze). We
are concerned that there should be no further divisive changes to the
pay system that are not evidenced, so that officers can understand
the rationale for any change, and the Home Office can monitor
impacts.
Our analysis of the wider economic climate shows that total real pay 1.5.5
for federated ranks as a whole is estimated to have fallen 11.5% over
the whole period, 2010-14, and Superintendents’ pay by 11.7%. At the
same time, officers are being asked to contribute a higher proportion
of their income to their pensions, meaning that the overall reward
package has reduced. The change to the career average pension
scheme from the final salary scheme means that the lifetime earnings
for officers will decline considerably.
We believe that to attract and retain the right calibre of officers, the 1.5.6
police service needs to provide pay and conditions that are fair, reflect
the nature and responsibilities of the role, and enable officers to
maintain a responsible standard of living.

17
We believe that over the last few years a combination of a difficult 1.5.7
economic climate and officers’ own motivation to serve has protected
the police service to large extent from officer wastage, (although the
numbers leaving have been higher than HMIC projections). However,
we also believe that the service is entering a period of challenging
recruitment and retention with a more buoyant economy. Furthermore,
we are concerned that the impact on service effectiveness and on
costs of replacing expertise when trained officers leave has not been
taken fully into account. We trust that the PRRB will consider these
factors and will ensure that any determinations are in this context.
Over the coming years, we recommend that officers are given pay 1.5.8
uplifts that enable them to maintain their standard of living, rather than
falling behind, as has been the case in the last few years. However,
for this financial year we have taken into account the Government’s
view that pay increases in the public sector should average 1%. We
recognise the difficulties faced across the public sector. For that
reason, we ask for an uplift in this financial year of 1% for all.
Recommendation 4 (remit): In this financial year we ask for an uplift 1.5.9
of 1% for all, including officers who receive an increment: to basic
pay, existing regional allowances, and all allowances that are normally
included in uplifts, such as Dog Handlers’ allowance. This is based on
our recognition of the Government’s intent, and the need for public
sector austerity; and our concern that there should be no further
divisive pay changes, such as increases for some but not others,
without there being an evidence base modelling likely impact.
However, over time, we also recommend that the economic data we
have provided be considered in future pay uplifts, as demonstrating
the need to make appropriate adjustments to ensure officers are not
left behind others when the UK economy is more buoyant. We ask
that the PRRB consider this at the earliest opportunity.

18
The London Lead 1.6
The London Lead has been reviewed in the past, and on each 1.6.1
occasion it was considered that the role in London was sufficiently
different to that outside to justify its continuance.
Evidence from reports provided by the Metropolitan Federation 1.6.2
support this contention, arguing that the London area is the most
complex to police. This is partly because of the need for specialised
roles, and supervision of these; and the levels of responsibility, spans-
of-control, complexity of issues and workloads of London Inspecting
ranks are in excess of those elsewhere.
We acknowledge that Winsor stated that such considerations should 1.6.3
be properly evaluated. We believe that to comply with Winsor’s
proposal, a study needs to be conducted systematically comparing
London policing, using a systematic job evaluation scheme, and
assessing knowledge, skills, and attributes required, to other forces
and regions. PFEW is not aware of any such study, although there is
a study that demonstrates that London Inspectors have lower well-
being and job satisfaction than elsewhere. We believe that such a
study is the responsibility of the Home Office: it should not be left to
officers themselves to fund such work, through contributions to
PFEW.
Until such time as data are supplied that provide a formal evaluation, 1.6.4
we do not believe there is a case for removing the London Lead. To
do so would further contribute to perceptions of unfairness in the pay
system, and would cause considerable hardship to those officers
affected.

19
Recommendation 5 (remit): We agree with Winsor that this issue 1.6.5
needs systematic evaluation. Until such time as that is complete, we
recommend retention of the London Lead. An uplift commensurate
with the overall uplift is recommended: that is an uplift of 1%.

20
Differentiation of pay and allowances at local and regional level 1.7
There are a number of allowances currently paid to officers in London 1.7.1
and the South East. These are similar to arrangements in other public
sector, and some private sector, organisations.
London payments were originally to compensate for the higher cost of 1.7.2
living. They have subsequently been said to assist with recruitment
and retention. The South East payments arose because officers were
being drawn into the Metropolitan Police Service at the expense of
surrounding forces.
We know of no formal, systematic evaluation of the benefits of the 1.7.3
existing system, relating extra payments to numbers and calibre of
recruits, or numbers retained. Until such an evaluation is conducted,
we believe it is inappropriate to change the existing system, other
than to give an appropriate uplift.
Observations 1.8
There are a number of risks in regionalising pay. The biggest for the 1.8.1
police currently is that the devolution of policing – and pay – to
Scotland and Wales will result in an uncoordinated approach, and
loss of officers from bordering services to either Scotland or Wales
(or, indeed, vice versa) depending on which service sets the higher
salaries. This may also cause pay drift. There is a need to consider
mutual aid, collaboration, and interoperability in any regional pay
system in policing. Further regionalisation would need to take into
account equality concerns. The need for appropriate administration
and governance processes to be set up is likely to be costly and offset
any intended saving. This is especially true for police pay, which is set
out in Regulations.

21
We would like to understand what consideration the Home Office has 1.8.2
given to issues around regionalisation.
Recommendation 6 (remit): The current regional allowances should 1.8.3
be retained, until such time as an evaluation is undertaken of these,
and an evidence base provided, should any change be deemed
necessary. In the meantime, an uplift commensurate with the overall
uplift is recommended: that is, an uplift of 1%.

22
The five year remit 1.9
The Home Secretary’s remit letter suggests a number of priorities for 1.9.1
the next five years. However the Staff Associations were also asked
to state priorities. Our response therefore comprises three parts:
firstly, our overarching concerns; secondly, our response to the Home
Secretary’s priorities for the next five years, as stated in the remit
letter; and thirdly, some issues specific to particular elements of the
remuneration system, that we believe must be addressed.
Staff Association overarching concerns 1.10
We believe there is a need to ensure the pay system reflects a 1.10.1
number of considerations:
it should attract and retain officers who are representative of the
public served;
it should be designed so as to ensure officers believe there is
organisational justice within the system;
it should be designed, based on evidence of need, and what works;
it should facilitate deployability to a range of roles and requiring a
range of skills;
it should appropriately recognise the skills, knowledge, and
attributes, and workload required.

23
With regard to the longer term, five year considerations, we believe 1.10.2
our Recommendations 1-3 (data) also cover what is needed to
address these. (That is, the Home Office should adopt an evidence
based approach to workforce planning, with comprehensive,
transparent, and reliable data; modelling of any proposed changes
should be undertaken in advance of changes; and recent changes
should be monitored for their impact, to check whether the intended
benefits have in fact accrued, and to check whether there have been
unintended consequences, before further significant change is
embarked upon).
The recent changes to the pay system have been wide-ranging. We 1.10.3
would not wish to see further turbulence caused by changes that are
not evidence based.
We believe that to achieve such a system, existing anomalies need to 1.10.4
be addressed. These include the need for a clear rationale for each
element of the remuneration package, and a comparison to jobs with
similar knowledge, skills, and attribute requirements; consideration of
the appropriateness of pay for differing ranks, and whether a single
spine point based method for each rank addresses the different
organisational and personal drivers of pay; and consideration of how
changes to one element impact on the package overall, and its
efficacy.
We ask that the Home Office gives a clear statement of the aims of 1.10.5
the pay system; what it should achieve as a whole, and how elements
contribute; and how changes will be monitored in future. In earlier
chapters we made a case for an evidence based system with
transparent, comprehensive, and reliable data.

24
Until this has been achieved, we ask that the economic data we have 1.10.6
provided be used at the earliest opportunity to make appropriate
uplifts to ensure officers are not left behind when the economy is more
buoyant, and when the current cap of a 1% uplift is removed.
We have listed within the body of our submission specific questions 1.10.7
that we believe need to be addressed in order to determine next steps
with regard to some specific ongoing changes within the pay system.
The Home Secretary’s remit letter: list of priorities 1.11
With regard to those issues raised in the Home Secretary’s remit 1.11.1
letter, our recommendations are as follows:
Recommendation 7a: On-call allowance should be reviewed in the
light of clear management data, and this should be a priority.
Recommendation 7b: We recommend that the gap between pay
scales (Constables to Sergeants, and Inspectors to Chief
Inspectors) should not be reviewed in isolation. The total pay scale
end-to-end needs to be considered, based on credible data.
Recommendation 7c: We are opposed to the buy-out of
Sergeants’ overtime. We believe that overtime will always be
necessary, and better management of it is the key to ensuring a fair
and efficient system. The buy-out of Inspectors’ overtime has
resulted in unforeseen consequences that should be reviewed and
taken into account. The PSAEW opposition to the buy-out is based
on the view of these senior officers that overtime is an effective
management tool.
Recommendation 7d: We understand that the PAB will review the
impact of Limited Duties arrangements once they have been
implemented. In order for the review body to review the value of the
deployability component of the x-factor, definitive labour market

25
evidence will be required. This would normally include comparison
data, from organisations with similar requirements. In the absence
of such data, how does the Home Office intend to value the
deployability component?
Recommendation 7e: We would like a better understanding of
what a greater degree of coherence between the terms and
conditions of officers and staff might mean. We believe that any
move to place officers on contracts of employment would be
inconsistent with the Office of Constable, and cannot support any
recommendation that goes that far.
Issues that relate to particular elements of the remuneration 1.12
system
We raise a small number of specific issues, that we believe should be 1.12.1
prioritised.
Recommendations 7f – 7k Relate to matters that the PFEW and
PSEAW believe should be considered alongside those issues
raised by the Home Secretary in the remit latter. These are: the
impact of the reduction in Constables’ starting salaries; pay
progression; skills thresholds; Away from Home Overnight
Allowance; Motor Vehicle Allowances; and Equality issues.

26
SECTION 1: BACKGROUND TO POLICING
AND CURRENT CONTEXT
This section is in two chapters. The aim is to give the PRRB context regarding
policing today.
The first chapter includes background on policing, such as the Peelian principles and
Office of Constable. We describe how the terms and conditions under which officers
serve impact on the ethos of policing.
It also includes some detail on the roles undertaken by officers, using data gathered
from observations of shifts, and job evaluations.
The second chapter describes recent changes in policing. In particular, the changing
nature of crime, and the level of skills required to deal with this, are outlined. An
academic study, the “Time for Justice” report, is used to define how the role has
changed for Inspectors, and to give an account of the demands of the job. Police
workforce numbers between 2010 and 2014 are also examined within the context of
these changes, highlighting issues in regards to national data collection and
reporting.

27
2 What is the nature of policing in England and Wales?
Introduction 2.1
The purpose of this chapter is to provide context of what policing is 2.1.1
like in England and Wales. It will explain the principles on which
policing in the UK is based and the unique status of officers. The
chapter will outline the framework within which officers serve, the
skills required to be an officer and it will paint a picture of the
demands of policing, both in terms of the job and the impact it has on
officers and their families.
The Peelian principles and policing by consent 2.2
Since modern policing began in 1829 there have been fundamental 2.2.1
principles that define the function and purpose of policing. These
principles have evolved over the years but the basics and core
objectives have stood the passage of time. The principles are known
as Robert Peel’s Nine Principles of Policing (see Annex 2.1), though
they are likely to have been written by the first Commissioners of the
Police of the Metropolis. When introduced, the principles created a
policing philosophy “unique in history and throughout the world
because it derived not from fear but almost exclusively from public co-
operation with the police, induced by them designedly by behaviour
which secures and maintains for them the approval, respect and
affection of the public”.2 Generally, this philosophy is known as
policing by consent.
2 A New Study of Police History by Charles Reith, London: Oliver and Boyd, 1956, pg. 140.

28
Policing by consent is the idea that the police can only function 2.2.2
because of the support given to it by the public. In December 2012
the Home Secretary confirmed this principle continues to lie at the
heart of British policing3. The PFEW and PSAEW believe policing by
consent to be a sacrosanct construct and have argued robustly
against reforms that threaten the principle.
The Office of Constable 2.3
As well as policing by consent being a unique policing philosophy, the 2.3.1
“Office of Constable” is also unique.
The term Office of Constable can be found in the sworn oath that 2.3.2
every member of a police force must make upon appointment, as per
Schedule 4 of the Police Act 1996:
“I…do solemnly and sincerely declare and affirm that I will well and 2.3.3
truly serve the Queen in the Office of Constable, with fairness,
integrity, diligence and impartiality, upholding fundamental human
rights and according equal respect to all people; and that I will, to the
best of my power, cause the peace to be kept and preserved and
prevent all offences against people and property; and that while I
continue to hold the said office I will, to the best of my skill and
knowledge, discharge all the duties thereof faithfully according to law.”
3 Response to freedom of information request as to what the Home Secretary means by “Policing by Consent”
https://www.gov.uk/government/publications/policing-by-consent Ref 25060 Pub. 10 December 2012

29
Upon making this declaration, officers are presented with a warrant 2.3.4
card that gives them the authority to carry out the functions described
in the oath. As such, police officers hold a unique status within
society; they are not employees, but office holders sworn to serve the
Queen. They are independent legal officials with a significant degree
of authority and discretionary power. They are expected to discharge
the duties of the Office of Constable at all times, whether or not they
are on duty, as failure to do so could result in misconduct or even
criminal proceedings. As Lord Denning stated in 1968, as holders of
the Office of Constable, police officers are “answerable to the law and
to the law alone.” 4
Because of the unique status of the Office of Constable, police 2.3.5
officers are empowered to resist unlawful orders as well as any undue
political pressure. As Shami Chakrabarti, Director of Liberty, noted in
an article in Policing UK 2013:
“The value of our policing model was never as evident than during the 2.3.6
handling of August 2011’s riots. In the face of knee-jerk advice from
armchair-Constables, police chiefs were robust in rejecting calls for
military intervention, water cannon and plastic bullets – used
previously with disastrous impact in Northern Ireland – and instead
redeployed and inflated the number of officers on the street to good
effect.
As tensions simmered in our own towns and cities and politicians 2.3.7
sought to explain the events, the political and operational
independence of the police meant that expertise and non-partisanship
led the response. Blanket punishments were resisted, rights were
protected and legitimacy maintained.” 5
4 Regina -v- Commissioner of Police of the Metropolis, Ex parte Blackburn [1968] 2 QB 118; [1968] 1 All ER 763;
[1968] 2 WLR 893 5 Chakrabarti, S. (2013) Preserving rights and building legitimacy. Policing UK 2013, pg. 82-83

30
The PFEW and PSAEW believe that this independence is as 2.3.8
essential for police officers as it is for judges and magistrates within a
democratic criminal justice system. Just as judges should not be
distracted from deciding cases purely on the basis of the relevant
facts and laws6, police officers should not be distracted from acting
independently by other pressures or interests.
The framework within which officers serve 2.4
The nature of police service has shaped the framework of terms and 2.4.1
conditions within which police officers serve. The framework is
designed both to support the central features of British Policing and to
reflect the realities of police service. In particular:
Terms and Conditions
The terms and conditions under which police officers serve are 2.4.2
contained in regulations made under the Police Act 1996.
This reflects the constitutional significance of the role of police 2.4.3
officers.
Probationary period
Police officers have a much longer probationary period (two years) 2.4.4
than in most other professions.
This is because of the significant authority, responsibility and 2.4.5
accountability inherent in the Office of Constable. It is intended to
ensure that police forces have a proper opportunity to determine
whether or not newly appointed Constables are suitable to hold the
relevant powers and responsibilities, and are suited to a career as a
police officer.
6Judiciary of England and Wales website http://www.judiciary.gov.uk/about-the-judiciary/the-judiciary-in-detail/jud-acc-ind/independence, attached at Annex D.

31
Termination of service
Once an officer has successfully completed the probationary period, 2.4.6
there is careful but sufficient regulation of the way in which service
can be terminated by the force.
Police officers can be required to leave the service on the grounds of 2.4.7
poor performance, poor attendance or for disciplinary reasons.
Officers can also be compulsorily retired on the grounds of ill health or
age.
There is no power to make police officers compulsorily redundant. 2.4.8
Regulation A19 of the Police Pensions Regulations 1987, and the
equivalent provision in the Police Pensions Regulations 2006, allow
for compulsory retirement on the grounds of efficiency of the force.
These provisions are available for use in very specific circumstances
(and in particular, where an officer is entitled to an immediate full
pension).
These restrictions on the way in which service can be terminated have 2.4.9
a dual function:
They underpin the independence of the Office of Constable. Police
officers can exercise their powers in the knowledge that they are
answerable to the law, but without fearing that their service could
be terminated for their actions; and
They form part of a package which helps secure and retain a body
of officers who can deliver policing by consent.

32
Promotion
The police service is a rank based organisation. Officers currently 2.4.10
must progress through each of the ranks if they want to be promoted.
(Although the introduction of Direct Entry Superintendents and Chief
Constables will change this). This rewards both experience and
knowledge. However, the organisation is structured as such that most
people joining will be “career Constables” (i.e. they will remain at the
lowest rank for their entire career). This means that pay structures
need to be sufficient to ensure that experienced officers at all levels
are retained.
7
7 Winsor Review of Pay and Conditions: Final Report, Vol 1, pg 123.
Figure 2.1: Percentage of officers at each rank (excluding secondees)

33
Pensions
In each of the three police pension schemes, which either exist or will 2.4.11
be created,8 there are lower retirement ages for police officers than
exist for ordinary employment. This reflects the physical and mental
demands of the role and the importance of the pension as part of
officers’ conditions of service.
Industrial action
Police officers are unable to take any form of industrial action. Any act 2.4.12
calculated to induce a police officer to withhold his or her services is a
criminal offence.
The ability to take industrial action would be difficult to reconcile with 2.4.13
the Office of Constable. However, the recent Winsor proposal to
introduce compulsory severance prompted the PFEW to ballot its
members on whether the PFEW ought to seek industrial rights. Out of
133,108 officers eligible to vote, some 56,333 took part in the ballot,
with 45,651 (34% of all officers) voting in favour and 10,681 voting
against. These results demonstrated the frustration of officers, but did
not reach the required threshold for the PFEW to take action.
8 The Police Pension Scheme 1987, the New Police Pension Scheme 2006, and the Career Average
Pension Scheme 2015.

34
Lawful orders
Police officers must obey lawful orders, including orders requiring 2.4.14
them to perform duties at any time and in any place.
This ensures that police forces can respond to any policing need at 2.4.15
any time. It also helps ensure policing by consent as police officers
perform, and are seen to perform, a range of duties in the
communities in which they serve.
Restrictions on the private lives of officers
Unlike ordinary employees, the unique status of the Office of 2.4.16
Constable places restrictions on the private lives of police officers and
their families. These include:
abstaining from any activity which is likely to interfere with the
impartial discharge of their duties, or which is likely to give rise to
the impression amongst members of the public that it may so
interfere;
not taking any active part in politics and officers are specifically
prevented from joining the British National Party, Combat 18 and
the National Front;
getting permission from their chief officer for their place of
residence;
not wilfully refusing or neglecting to discharge any lawful debt;
not taking on any employment or business interest outside of
policing without the express consent of their Chief Constable.
These business restrictions can also apply to a partner, spouse or
relative residing with the officer.

35
These restrictions are designed to ensure public confidence in the 2.4.17
impartiality of police officers. The PFEW and PSAEW wholly support
the need for officers to be demonstrably impartial, but clearly these
restrictions go far beyond those in other professions.
In addition to the above, police officers are not allowed to wilfully 2.4.18
neglect to perform their duty as it would result in an offence of
misconduct in a public office. As such, police officers are expected to
discharge their duties at all times, whether or not they are on duty.
Psychological contract
Police officers accept the framework described above (whereby they 2.4.19
must obey lawful orders, including the need to be available 24/7, and
are restricted from taking industrial actions, etc.) in return for terms
and conditions that recognise the responsibilities they carry. This
reciprocal arrangement gives rise to expectations regarding working
conditions that are often referred to as a “psychological contract”.9
The framework set out above means: 2.4.20
officers have a high degree of confidence that so long as they carry
out their duties properly and efficiently their position is secure, and
this ensures that the independence of the Office of Constable is
protected;
forces attract and retain high calibre officers who accept the
inherent risks of policing and the flexibility of postings;
officers are encouraged to remain in service so that experienced
officers are retained, thus creating an effective workforce;
9 Argyris, C. (1960). Understanding Organisational Behaviour. Homewood: Dorsey; Rousseau D.M. (1995). Psychological Contracts in Organisations: Understanding Written and Unwritten Agreements. Sage Publication.

36
the costs associated with continually having to select and train
large proportions of the workforce are minimised, which is
particularly important in times of austerity;10
workforce planning for each force is easier; and
the service is representative of the public it serves, including a
spread of ages, rather than mainly younger personnel, and the
profile of the service best supports policing by consent.
It is worthy to note that where psychological contracts are breached 2.4.21
there is a “direct and negative effect on the organisation”,11 as workers
are likely to leave the organisation, seek to have more “voice” such as
by demanding representation, or become disaffected.12
It is our contention that following turbulent years during the Winsor 2.4.22
Review and the public sector pay freeze, officers’ psychological
contracts have repeatedly been breached. This view helped to form
our submission principles, including that any further change should be
evidence based. It has also helped to shape our recommendation
regarding this year’s pay uplift.
10
Boyd, E., Geoghegan, R., and Gibbs, B. Policy Exchange (2011) Cost of the Cops: Manpower and deployment in policing. The cost of training in the first two years of service was estimated at £15,000. Winsor quoted the full costs calculation from this study as being £80,000 per officer, in the first two years of service. 11
George, C. (2009) The Psychological Contract. P. 27 Open University Press. 12
G Turnley, W. H. & D.C. Feldman. (1999) “The Impact of Psychological Contract Violations on Exit, Voice, Loyalty, and Neglect.” Human Relations 52(7): 895–922.

37
Skills and knowledge required to be a police officer 2.5
The skills and knowledge required to be a police officer are many and 2.5.1
varied. When a person joins a force as a police officer in the rank of
Constable, they have to undertake the Initial Police Learning and
Development Programme (IPLDP). This is a comprehensive, 2 year
programme that aims to train student officers to become efficient and
Constables of good conduct. (Please note that for other entry routes,
such as the fast track to Inspector scheme, the initial learning
requirements vary slightly). The programme is a mixture of classroom
and work-based learning and officers are placed into their local
communities to engage with them. Specifically, the IPLDP comprises
of:
80 hours’ Community Engagement (including a placement).
Independent Patrol.
Minimum Qualification (Diploma in Policing).
Officer Safety Training.
First Aid Training.
The mandatory qualification that officers must attain is the Level 3 2.5.2
Diploma in Policing; it consists of 10 units and is available under
Ofqual's Qualifications Credit Framework (QCF). The 10 units are as
follows:
Gather and submit information that has the potential to support law
enforcement objectives.
Provide an initial response to incidents.
Arrest, detain or report individuals.
Conduct priority and volume investigations.
Interview victims and witnesses in relation to priority and volume
investigations.
Interview suspects in relation to priority and volume investigations
Search individuals and their personal property.

38
Carry out systematic searches of vehicles, premises and open
areas.
Manage conflict.
Provide initial support to victims, survivors and witnesses and
assess their need for further support.
Also, in addition to the above, the initial learning curriculum introduces 2.5.3
many aspects of other learning programmes at the initial/first
responder level, such as Professionalising the Investigation Process
(PIP) Level 1, forensics, mental ill health, and equality and human
rights13.
Clearly, the IPLDP is a comprehensive programme designed to equip 2.5.4
student officers with the broad skills and knowledge they will need to
become efficient and well-conducted Police Constables. The use of a
mandatory qualification also highlights the necessity of these skills
and knowledge in policing.
The components of the IPLDP are also to be reassessed at the 4 and 2.5.5
7 year points for Constables, and it will be essential that they are able
to demonstrate all the skills, knowledge, and aptitudes that underpin
these. This applies to all Constables. This demonstrates the need for
all to be deployable in a wide range of circumstances. Conversely, it
shows there might be unintended consequences of introducing pay for
specialist skills.
13
College of Policing website, Initial Police Learning, http://www.college.police.uk/en/12881.htm [accessed on 10 December 2014]
39
The day-to-day job 2.6
Being a police officer is a demanding job. As mentioned previously, 2.6.1
officers can be directed to work in any role or location within the force
(or even outside the force area) by their Chief Constable. The nature
of policing by consent is also such that officers face a risk of serious
injury or death in carrying out their duties, whether on or off duty.14
Even as recently as August 2014 the UK’s terrorist level was raised to
‘severe’ on the basis of concerns over an attack inspired by extremists
in Syria and Iraq and, in October 2014, four men were arrested in
London over allegations that they were plotting to shoot dead police
officers or soldiers in the capital.15 In addition, many roles require shift
work and officers can be recalled to duty from a rest day or annual
leave, all of which can impact on their private lives.
The quotes below are from case studies the PFEW conducted in 2011 2.6.2
of officers on the front line. They describe the realities of the job and
begin to paint a picture of what officers face day-to-day:
“Over the years I have lost count of the number of times I have had to
put myself between violent offenders and members of the public. I do,
however, remember every fatal road traffic collision I have attended
during the time I was a traffic patrol officer together with the families I
have had to break that news to and then give support. Being a police
officer is not just a job, I am a police officer 24/7, 365 days a year. To
me and my family it is a way of life!”
(Sergeant, Cambridgeshire)
14
The Police Roll of Honour Trust lists over 60 deaths on duty in the UK since 2008. http://www.policememorial.org.uk/index.php?page=annual-roll-of-honour 15
Dodd, V and Quinn, B (2014) “Four men charged with terror offences after London raids”, The Guardian, 17 October [Online]. Available at: http://www.theguardian.com/uk-news/2014/oct/17/four-men-charged-terror-arrests-london (Accessed 20 October 2014)

40
“I have been spat on, assaulted and called every name imaginable by
people who called for the police to help them! I have carried body
parts from the side of roads and half an hour later told the family of
that person their son is dead. I have been at the scene of a double
child murder and then gone home and sat watching my kids sleep.”
(Officer, North Wales)
In addition to this, staff members from the PFEW recently spent a day 2.6.3
observing officers from Hampshire. Table 2.1 below summarises the
issues that the officers had to deal with; it highlights the breadth of
roles officers do and the incidents they deal with.
Table 2.1: Summary of incidents during PFEW staff observations of officer shifts
Observation 1 Observation 2 Observation 3
Details
Early shift (7am-3pm) with a
two-man Targeted Police Team
(TPT) crew in Basingstoke.
Early shift (7am-4pm) with a
Roads Patrol Unit in
Whitchurch.
Early shift (7am-4pm) with a
Response Unit in Eastleigh.
Summary of day
1. Road traffic incident –
officers breathalysed the driver
and investigated the cause of
the accident.
2. Broken down vehicle –
attendance to check if safe.
3. Missing person – follow up
intelligence of location of
missing boy.
4. Domestic violence incident
– attend scene and search for
suspect who had fled.
5. Rape – Take details from
victim and arrange appropriate
handover.
1. Speeding motorists – stop
and issue penalties.
2. Search for known banned
driver.
3. Traffic incidents –
implement rolling roadblocks.
4. Traffic collision – no offence
committed, but a driver became
angry so officers diffused the
situation.
5. Suspected robbery &
pedestrian on the highway –
pursuit vehicles required,
though this team was stood
down.
1. Visibility – Driving to crime
hotspots to be visible to the
public.
2. Incident in a pub – person
self-harming following dispute
with staff. Diffuse the situation.
3. Southampton Airport – Walk
around for visibility (deterrent)
and general patrol.
4. General enquiries - Talk to
staff at half-way house about
suspected grooming victim;
follow up intelligence about
missing patient from hospital.
5. Arrest an individual who has
caused criminal damage –
Taser deployed due to resisting
arrest and aggression.

41
While the above focusses on the federated ranks, Superintendents 2.6.4
and Chief Superintendents also have demanding and variable roles.
They are the senior operational leaders in the service, operating at
both the strategic and the tactical levels, and are the bridge by which
policies and procedures get translated into practice. Below are three
examples that give a cross-section of the types of role performed
Superintendents and Chief Superintendents. They list the
responsibilities of each member and give an indication of the
managerial responsibilities these officers have:
Table 2.2: Roles and responsibilities of Superintendent ranks
Rank: Superintendent Force: Avon and Somerset
Population served: 750,000 No. of officers/staff: 600
Role: Deputy Area Commander for Somerset Policing Area
Main responsibilities: Uniform policing across the county of Somerset;
leadership development; training and change management; partnership
working; rural crime lead; media cadre
Specialist skills: Trained firearms, public order and CBRN commander
Other: Commanded police response to the major flooding 2014 and
Glastonbury Festival 2014
Rank: Detective Superintendent Force: Thames Valley
Population served: 2.7m (across 3 counties) No. of officers/staff: 300
Role: Head of Protecting Vulnerable People
Main responsibilities: Operational lead for all investigations into child
abuse, domestic abuse (inc. Honour-Based Violence, forced marriage,
abuse in care homes) and ‘on line’ indecent images of children;
management of registered sex offenders and victims of rape; and
vulnerable adults and missing persons
Specialist skills: Strategic firearms commander, negotiator and PIP3
investigator
Other: ‘On call’ as part of Force SIO rota and informal 24/7 ‘on call’ for
Dept.

42
Rank: Chief Superintendent Force: West Yorkshire
Population served: 760,000 No. of officers/staff: 1900
Role: District Commander, Leeds BCU
Main responsibilities: Policing in Leeds (209 sq. miles), including
Response, CID, Safeguarding and Neighbourhoods. Also the lead for
Leeds Community Safety Partnership.
Specialist skills: Trained firearms and public order commander
Other: Silver Commander for Leeds United Football Club, divisional shift
cover
Rank: Detective Chief Superintendent Force: MPS
Role: National Co-ordinator – Domestic Extremism (Specialist Operations)
Main responsibilities: National responsibility for countering the threat of
domestic extremism and preventing disorder including:
Extreme Right Wing; Environmental Activists; Animal Rights; English
Defence League; Anti-Fascism
Works closely with Counter Terrorism networks and UK police forces
(particularly Special Branches) and operates across nine regions. He has
set up the intelligence cell for the NATO Summit
Deputy to the national lead on ‘open-source’ intelligence.
Commands large number of London-based and regionally-based including:
MPS and seconded police officers, police staff, technical and social media
experts
Manages risk, safety and welfare of u/c officers (Operation Herne)
‘On call’ as Authorising Officer for CHIS (Covert Human Intelligence
Sources and RIPA (Regulation of Investigatory Powers Act)
Set up and commanded Operation Withen (post riots investigation) with
1,000 staff leading to 5,000 arrests and 4,000 subsequent convictions

43
The examples above clearly demonstrate how demanding the job is 2.6.5
across different ranks. For Superintendents, the variation in roles is
widening. This is partly because the Superintendents have seen the
largest cut in numbers by rank (in proportion terms, with around 25%
reduction in their numbers between June 2010 and December 2014,
from 1,666 to 1,273), and those that remain having to take on
additional responsibilities. This has been exacerbated by the fact that
many Chief Superintendents’ roles have been removed, and at least
two services (Northamptonshire and Wilshire) have removed the Chief
Superintendent rank from their structure, meaning some
Superintendents are now undertaking roles previously filled by
Superintendents. It is also partly because in order to cope with budget
cuts, many police services have moved away from the Basic
Command Unit (BCU) of policing. Where it has been retained, BCUs
have often been merged, leaving Superintendents with increasing
spans of command and responsibilities. Overall, we believe the pay
bill has been supressed by these impacts, with officers being paid at
Superintendents’ rates for work previously done by Chief
Superintendents, and higher ranks.
Police officers are expected to have the skills to tackle many diverse 2.6.6
situations and officers, at any rank, are expected to be able to be
deployed to any role within that rank. Often, officers have to work
independently and need to think quickly in high pressure situations.
They also regularly deal with difficult and dangerous situations.

44
Summary 2.7
Police officers accept many challenging conditions, such as the risk of 2.7.1
death or injury; restrictions on their private lives; and the need to be
available 24/7. In return, there is an expectation that they will be
afforded terms and conditions that recognise the responsibilities they
carry. As mentioned in section 2.4, this gives rise to the notion of a
“psychological contract” between the officer and the force; a breach of
which could have a negative impact on forces. In chapter 6 we
demonstrate potential breaches of the psychological contract by
focusing on the changes to pay and conditions brought about as a
result of Tom Winsor’s review and the Government’s public sector pay
policy.
The skills and knowledge required to be a police officer include those 2.7.2
that underpin the 10 units of the Diploma in Policing. These include
gathering information for law enforcement; making arrests;
interviewing victims and witnesses; interviewing suspects; searches;
managing conflict; and providing support to victims and assessing
their need for further support. These require a detailed and up-to-date
knowledge of the law and associated procedures, as well as inter-
personal skills such as tact and sensitivity. Any role within policing
requires all these skills, and often more. The fact that these 10
components are to be reassessed at the 4 and 7 year points for
Constables, demonstrates the diversity required in each and every
role.

45
This variety is demonstrated in the small number of cases studies we 2.7.3
have provided, showing the day-to-day role of officers. In a small
number of observations over only three days, PFEW staff witnessed
officers dealing with traffic incidents, domestic violence, suspected
robberies, and making an arrest using Taser because of the
suspect’s aggression.
For managers at Superintendent and above, the variation between 2.7.4
roles can be substantial. The span of command can vary widely. The
reduced numbers in Superintendent and Chief Superintendent roles;
the changing legislation; increasing scrutiny and accountability;
devolvement of responsibilities from ACPO ranks; and the
suppression of salary by removing some ranks and moving
responsibilities downwards; all have caused significant changes to the
roles fulfilled at this rank. This has been so great as to cause the
PSAEW to consider whether the current pay structure is fit for
purpose.

46
3 How has the nature of policing changed?
Introduction 3.1
Over time the necessary skills and experience required to be an 3.1.1
effective police officer have gradually changed and will continue to do
so in response to on-going shifts in the external socio-political
landscape. For the purpose of this document, these external
influences can be broken down roughly, into the following three
categories:
Social Context for Policing and Crime;
Political Influence and Police Reform, and;
Economic Influences.
The pressures above are not the only things to have caused changes 3.1.2
over time, and are just some of the many influences on the demands
facing the police workforce. This chapter will examine how these
pressures have evolved since 2010 and will finish with an analysis of
the changing numbers of the police workforce and demand statistics.
Social context of policing and crime 3.2
The social context of policing and the nature of crime are constantly 3.2.1
evolving. In order for the police to keep up with public expectations
and emerging criminal threats, officers’ job requirements also change.
In recent years, two of the most notable alterations to the social
context of policing have been the changing nature of crime and the
reduced public spending across partner agencies and other
emergency services.

47
Changing Nature of Crime
Although the overall crime numbers reported by the Home Office (HO) 3.2.2
have been consistently falling since 2010, some types of crime have
actually increased. Sexual assaults, for example, have increased by
20% between the financial years ending in 2013 and 201416. Cyber-
crime has also been increasing and is likely to carry on doing so as
technology continues to grow and adapt17. This topography of
changing crime directly impacts on the skills needed by police officers
to be effective, emphasising the need for officers to have a greater
understanding of subjects such as modern technology and how it can
be used to commit crime. Her Majesty’s Inspectorate of Constabulary
(HMIC) sum it up eloquently by stating that in order for officers to be
both productive and effective they ‘require new skills to meet the ever
changing threats and to keep abreast of the scale and pace of change
in technology’18.
With local and national drives towards increasing the numbers of 3.2.3
body-worn cameras, GPS systems, improved databases and
upgrading computer systems, officers will now have to have a greater
understanding of data protection, specialist equipment and bespoke
software.
16
Office of National Statistics.(2014). Crime statistics, period ending: March 2014. Retrieved from: http://www.ons.gov.uk/ons/rel/crime-stats/crime-statistics/period-ending-march-2014/index.html 17
Her Majesty’s Inspectorate of Constabulary. (2014). Core Business: An inspection into crime prevention, police attendance and the use of police time. Retrieved from: http://www.justiceinspectorates.gov.uk/hmic/wp-content/uploads/core-business.pdf 18
Her Majesty’s Inspectorate of Constabulary. (2014). Policing in Austerity: Meeting the Challenge, page 101. Retrieved from: http://www.justiceinspectorates.gov.uk/hmic/wp-content/uploads/policing-in-austerity-meeting-the-challenge.pdf

48
Partner Agencies
Another high profile change within the social context of policing can 3.2.4
be seen in the recent trend towards officers being used as a ‘catch all’
emergency service. According to HMIC, provisional data for the
financial year ending 2014 shows that only approximately one third of
the incidences recorded on the police service’s command and control
systems are related to crime or antisocial behaviour19. Partner
agencies appear to be struggling with reductions to their own budgets,
resulting in gaps to their services and the use of the police in their
absence. HMIC highlights particular concerns regarding police
involvement in incidents where the primary responsibility should lie
with mental health teams, or with the ambulance service. Officers
have provided examples of when they have transported injured and ill
people to hospital due to a lack of ambulances20, and are often the
first point of contact with someone who is experiencing a mental
health crisis21.
For example, every year the police cells are used as ‘places of safety’ 3.2.5
for some 11,000 people22 even though the Home Office and the
Department of Health both agree that this should only happen under
exceptional circumstances23. This highlights the burgeoning need for
officers to have a greater understanding of mental health, as well as a
need to work more closely with their partner agencies, requiring
additional skills in multi-disciplinary working, negotiation and
influence.
19
Her Majesty’s Inspectorate of Constabulary. (2014). Core Business: An inspection into crime prevention, police attendance and the use of police time. Retrieved from: http://www.justiceinspectorates.gov.uk/hmic/wp-content/uploads/core-business.pdf 20
Her Majesty’s Inspectorate of Constabulary. (2014). Policing in Austerity: Meeting the Challenge. Retrieved from: http://www.justiceinspectorates.gov.uk/hmic/wp-content/uploads/policing-in-austerity-meeting-the-challenge.pdf 21
The Sainsbury Centre for Mental Health. (2008). Briefing 36: The police and mental health. Retrieved from: http://www.centreformentalhealth.org.uk/pdfs/briefing36_police_and_mental_health.pdf 22
The Sainsbury Centre for Mental Health. (2008). Briefing 36: The police and mental health. Retrieved from: http://www.centreformentalhealth.org.uk/pdfs/briefing36_police_and_mental_health.pdf 23
Home Office.(2008). Police Stations As Places Of Safety [Circular, 007 / 2008]. Retrieved from: https://www.gov.uk/government/publications/police-stations-as-places-of-safety

49
As highlighted above, there has been a clear shift in the dynamics 3.2.6
within the social context of policing over the last few years, with police
officers required to possess more and more skills. In order to support
adequate recruitment and retention of officers, this ever increasing
requisite needs to be recognised and rewarded by the Government.
Political influences and police reform 3.3
Over the last few years there have been a number of large scale 3.3.1
reforms and changes to policing that have directly affected the job
requirements for police officers. Some of these reforms have had
internal drivers, whilst others have been powered by political will.
For example, HMIC have previously emphasised that modern ways of 3.3.2
working promoted by political reform, such as increased partnership
working24, often require officers to have additional skill sets, such as
proficiency in negotiation and influence25.
However, one of the largest drivers for police change in recent years 3.3.3
has been the Winsor Review26. In 2012 the Winsor Review set out
121 recommendations after an assessment of police pay and
conditions. Although the majority of the recommendations referred to
police officers’ pay and pensions, the review has also affected
officers’ job requirements. One of the recommendations was to
increase the educational and experience-based prerequisites for
successful application to the police service:
24
Police Reform and Social Responsibility Act, c13.(2011). Retrieved from: http://www.legislation.gov.uk/ukpga/2011/13/pdfs/ukpga_20110013_en.pdf 25
Her Majesty’s Inspectorate of Constabulary. (2014). Policing in Austerity: Meeting the Challenge, page 35. Retrieved from: http://www.justiceinspectorates.gov.uk/hmic/wp-content/uploads/policing-in-austerity-meeting-the-challenge.pdf 26
Winsor, T. (2012). Independent Review of Police Officer and Staff Remuneration and Conditions. Final report, 2. Retrieved from:
http://webarchive.nationalarchives.gov.uk/20130312170833/http:/www.review.police.uk/publications/part-2-report/
50
“An additional qualification should be added to the list required for
appointment to a police force in Regulation 10 of the Police
Regulations 2003. Candidates eligible for appointment to a police
force should have either a Level 3 qualification, or a police
qualification which is recognised by the sector skills council, Skills for
Justice, or service as a Special Constable or service as a PCSO”27
As potential recruits must now be able to afford additional education 3.3.4
and/or spend time (possibly unpaid) working as a special Constable or
a Police Community Support Officer (PCSO), this review has also
indirectly affected the financial requirements for recruits. The Winsor
Review was also the driving force behind the recent implementation of
annual fitness tests, directly affecting the physical requirements for
being an officer.
Interestingly, although the Winsor report raised the bar in relation to 3.3.5
the entry requirements for police officers, it also reduced officers’
starting salaries by approximately £4,000. This effectively equates to
asking for more, but paying less, and we fear that these changes will
have a detrimental effect on recruitment.
The PFEW workforce survey supports these fears as it highlighted 3.3.6
that officers have noticed these changes to their profession without
financial recompense. One officer noted:
“We are also being expected to take on more roles and
responsibilities for no extra pay.”
27
Recommendation 3: Winsor, T. (2012). Independent Review of Police Officer and Staff Remuneration and Conditions. Final report, 2, 631. Retrieved from:
http://webarchive.nationalarchives.gov.uk/20130312170833/http:/www.review.police.uk/publications/part-2-report/

51
According to the Time for Justice report (2012)28, there have been 3.3.7
several other additional reforms that have recently led to an increase
in requirements specifically for the rank of Inspector. These include
the increased deployment of Inspectors as Senior Investigating
Officers, and the devolution of command responsibilities from
Superintendents to both Inspectors and Chief Inspectors as a result of
replacing divisions with Basic Command Units (BCU), and then
mergers of BCUs. These changes, (and other recent changes, not
noted in the Time for Justice report, such as the decline in numbers of
Superintendents), have increased the level of operational
responsibility resting upon the shoulders of Inspectors and Chief
Inspectors, highlighting a potential increase in the skills and abilities
needed to work effectively in this rank. More specifically, an increase
in operational responsibility may require advanced decision-making,
time management, and team leadership skills.
Although there are many ways in which external authorities will 3.3.8
continue to drive changes to officers job requirements, funding
remains one of the key instruments of power and influence over
organisational change within the police.
28
Turnbull, P., and Wass, V. (2012). Time for Justice? Long Working Hours and the Well-Being of Police Inspectors. Retrieved from: http://www.polfed.org/documents/Time-for-Justice-report-low-res.pdf

52
Economic influences 3.4
The Comprehensive Spending Review (CSR) delivered in 2010 3.4.1
stipulated that police funding would be reduced by 14% before the
end of the 2015 financial year. Although the spending review specified
that these savings should be made from “efficiencies in IT,
procurement and back office function,”29 in reality, these savings have
appeared to have translated into a 19.47% reduction in police support
staff and an 11.01% reduction in police officers overall30. This drop in
the police workforce has had a significant effect on officers, often
increasing their workloads, responsibilities and number of working
hours. It is worth noting that the reduction in numbers has been
disproportionate for some ranks: for example the Superintending
ranks have reduced by around 25%.
Increased workloads due to staff reductions have been reported by 3.4.2
police officers across the service during the PFEW Pay Review
Survey. A good example of this is eloquently illustrated by the below
quote:
“I have suffered increased pension contributions, loss of CRTP
(staged), loss of £3k SPP per year on top of my OCU losing 25% staff
& virtually all police staff support. I have to do far more administrative
work to compensate on top of having to cover the work of the posts
lost (3 DI's to 2 DI's on my team) plus a reduction of 8 teams to 6
which means more work, less resources, and more frequent weekend
working.”
29
Her Majesty’s Treasury. (2010). Spending review 201. Page 54. Retrieved from: https://www.gov.uk/government/uploads/system/uploads/attachment_data/file/203826/Spending_review_2010.pdf 30
Home Office. (2014). Police Workforce, England and Wales, 31 March 2014 [data tables]. Retrieved from: https://www.gov.uk/government/statistics/tables-for-police-workforce-england-and-wales-31-march-2014

53
These changes highlight a potential increase in the skills and abilities 3.4.3
needed to work effectively as an officer. For example, more advanced
skills in time management and decision-making which may prove
pivotal when dealing with heavy workloads and competing demands.
The recent reduction in police staff has also increased officers’
administrative duties. This addition to their role not only detracts time
from policing, but also requires officers to master supplementary skills
in administrative proficiencies such as data entry, word processing
and information management.
Due to a decreased workforce, officers are also often driven to 3.4.4
working longer hours in order to manage the sheer volume of work
and as a couple of respondents to the PFEW workforce survey
pointed out:
“Our rest days can be cancelled at short notice, leave periods can be
blocked, dependant on events and you are expected / ordered to work
long hours.”
“Officer numbers are decreasing all the time which puts more
responsibility and pressure onto serving officers.”
Similarly, over a quarter of officers who responded to the PFEW Pay 3.4.5
Survey were found to be dissatisfied with their working hours and / or
felt that their hours were unfair. However, as highlighted in the Time
for Justice report31, the officers who are most likely to be dissatisfied
with their working hours are Inspectors. This may be caused by the
overtime ‘buyout’ in 1994, with some Inspectors feeling that they are
often given longer working hours as they are seen as a ‘free resource’
when compared with lower ranks which are not salaried.
31
Turnbull, P., and Wass, V. (2012). Time for Justice? Long Working Hours and the Well-Being of Police Inspectors. Retrieved from: http://www.polfed.org/documents/Time-for-Justice-report-low-res.pdf

54
HMIC have also acknowledged that since 2010, many forces have 3.4.6
reduced Chief Officer and supervisory posts in order to reduce
management costs32. Consequently, management and higher-ranking
officers have specifically noticed an increase in their supervisory
workloads and levels of responsibilities33. To fulfil these roles
effectively, officers may have needed to further advance their abilities
in areas such as people management, communication and decision-
making.
Police workforce numbers over time 3.5
In order to maintain the safety of the public and the police officers 3.5.1
themselves, it is essential to manage and plan workforces so that
there are always enough officers to meet the policing demand. This
principle was broadly recognised in the recent HMIC report, “Policing
In Austerity: Meeting the Challenge”, HMIC recognised that it is
essential to ensure that there are sufficient warranted officers in order
to meet operational planning and resilience needs34.
32
Her Majesty’s Inspectorate of Constabulary. (2014). Policing in Austerity: Meeting the Challenge. Retrieved from: http://www.justiceinspectorates.gov.uk/hmic/wp-content/uploads/policing-in-austerity-meeting-the-challenge.pdf 33
Her Majesty’s Inspectorate of Constabulary. (2014). Core Business: An inspection into crime prevention, police attendance and the use of police time. Retrieved from: http://www.justiceinspectorates.gov.uk/hmic/wp-content/uploads/core-business.pdf 34
Her Majesty’s Inspectorate of Constabulary. (2014). Policing in Austerity: Meeting the Challenge. Retrieved from: http://www.justiceinspectorates.gov.uk/hmic/wp-content/uploads/policing-in-austerity-meeting-the-challenge.pdf

55
Graph 3.1 and Table 3.1 both illustrate that since 2010, the total 3.5.2
police workforce has decreased by 14.37%. During this time period,
the number of police officers has reduced by 11.01%, whilst the
number of police staff has reduced by 19.47%35. It is important to view
the reduction in police staff and police officers in combination; a
reduction in one group can have a noticeable knock-on effect upon
the other. Reduction in police officer numbers can result in police staff
undertaking tasks that fall outside of their job role36, whilst reduction in
police staff can pull police officers away from frontline duties. The
impact of the heavier reduction in police staff can therefore have a
direct effect upon the demands placed on officers.
Table 3.2 shows the police workforce reduction as a proportion and 3.5.3
illustrates that the greatest reduction was during the 2011/12 financial
year, when the total police workforce shrank by 5.63%.
Unsurprisingly, this increase is echoed by the trend in police officer
double time working across the same time period. Since overtime is
more costly than basic hours, workforce reductions may have had an
unintended impact on the services overall costs37
35
Home Office. (2014). Police Workforce, England and Wales, 31 March 2014 [data tables]. Retrieved from: https://www.gov.uk/government/statistics/tables-for-police-workforce-england-and-wales-31-march-2014 36
Her Majesty’s Inspectorate of Constabulary. (2014). Core Business: An inspection into crime prevention, police attendance and the use of police time. Retrieved from: http://www.justiceinspectorates.gov.uk/hmic/wp-content/uploads/core-business.pdf 37
Office of Manpower Economics, PNB Census of Earnings, Hours and Length of Service. Data available from PFEW on request.

56
Table 3.1: Total police workforce (2010 – 2014) 38
Staff Type March %
Reduction 2010 2011 2012 2013 2014
Total
Workforce 244497.07 233255.20 220121.28 213631.50 209361.88
14.37%
Police
Staff 79596.09 74010.13 67472.32 65508.62 64096.91
19.47%
Police
Officers 143734.44 139109.61 134100.02 129583.79 127909.30
11.01%
Graph 3.1: Total police workforce (2010 – 2014)39
38
Home Office. (2014). Police Workforce, England and Wales, 31 March 2014 [data tables]. Retrieved from: https://www.gov.uk/government/statistics/tables-for-police-workforce-england-and-wales-31-march-2014 39
Home Office. (2014). Police Workforce, England and Wales, 31 March 2014 [data tables]. Retrieved from: https://www.gov.uk/government/statistics/tables-for-police-workforce-england-and-wales-31-march-2014
25000.00
75000.00
125000.00
175000.00
225000.00
275000.00
2010 2011 2012 2013 2014
March
Total Workforce
Police Staff
Officers

57
Table 3.2: Annual police workforce reductions on previous year as a
proportion (2010 – 2014 financial years)40
Staff Type % Reduction on previous year
2010-11 2011-12 2012-13 2013-14
Total Workforce 4.60% 5.63% 2.95% 2.00%
Police Staff 7.02% 8.83% 2.91% 2.15%
Police Officers 3.22% 3.60% 3.37% 1.29%
Although reductions to the police workforce has slowed since 2012, 3.5.4
there continues to be an annual decrease in the number of police
officers and police staff, and the turnover rate for the police workforce
as a whole (i.e. the number of individuals leaving the police service)
has increased from 5% in 2010 to 8% in 201441.
What is not clear from national police workforce statistics in their 3.5.5
present form, is the reason for the reduction in the police workforce
since 2010. In part, this decrease is likely to be the consequence of
the deliberate workforce planning strategies of individual forces.
However it may also be due to an increase in voluntary turnover as
more staff choose to leave the police service. It is worth noting that
although the turnover for officers only has stayed fairly stable since
2010 (see Graph 5.1 in Chapter 5), we are currently unable to tell
whether these service exits are voluntary or mandatory and thus there
still could be an increase in officers leaving voluntarily. Furthermore,
while it might be expected that voluntary turnover would decline
during the recession, there is no evidence that this has been the case.
40
Home Office. (2014). Police Workforce, England and Wales, 31 March 2014 [data tables]. Retrieved from: https://www.gov.uk/government/statistics/tables-for-police-workforce-england-and-wales-31-march-2014 41
Home Office. (2014). Police Workforce, England and Wales, 31 March 2014 [data tables]. Retrieved from: https://www.gov.uk/government/statistics/tables-for-police-workforce-england-and-wales-31-march-2014

58
Data collated at a national level also do not currently differentiate 3.5.6
between the extent to which police turnover is planned and
unplanned. This creates a serious gap in the HO’s ability to
understand recruitment, management, and retention needs of the
police work force and to adjust their policies accordingly.
Graph 3.2: Annual police workforce reduction as a percentage since 201042
At the same time as the number of police officers has reduced, the 3.5.7
size of the population in England and Wales has increased43.
Between 2010 and 2014, the number of police officers per 100,000
population decreased by 14.39%. These data clearly illustrate that the
police service is now serving a larger population than it was in 2010,
yet doing so with fewer officers.
42
Home Office. (2014). Police Workforce, England and Wales, 31 March 2014 [data tables]. Retrieved from: https://www.gov.uk/government/statistics/tables-for-police-workforce-england-and-wales-31-march-2014; 43
Office of National Statistics. (2013). Population Estimates for England and Wales - Mid-2012. Retrieved from: http://www.ons.gov.uk/ons/rel/pop-estimate/population-estimates-for-england-and-wales/index.html
75.00%
80.00%
85.00%
90.00%
95.00%
100.00%
2011 2012 2013 2014
Total Workforce
Total Staff
Total Officers

59
Table 3.3: Police officers per capita (2010 -2014; Home Office Forces)44
The United Nations Office for Drugs and Crime annually publishes 3.5.8
workforce data for police personnel at a national level. The most
recent international data is shown in Graph 3.3 and indicates that
England and Wales had fewer frontline police personnel per capita in
2012-2013 than Australia and many other countries in Western
Europe. In addition, Graph 3.4 highlights that the reduction in the
number of Police Officers in England and Wales between the 2009-
2010 and 2012-2013 financial years was greater than the reduction in
frontline police personnel in other comparator nations including the
United States, France and Germany. Furthermore, other countries
such as Australia and Canada have actually increased their size of
their police workforce, over the same period.
44
Home Office. (2014). Police Workforce, England and Wales, 31 March 2014 [data tables]. Retrieved from: https://www.gov.uk/government/statistics/tables-for-police-workforce-england-and-wales-31-march-2014
Police Officers March %
Reduction 2010 2011 2012 2013 2014
Per 100,000 Population 264 254 243 231 226 14.39%
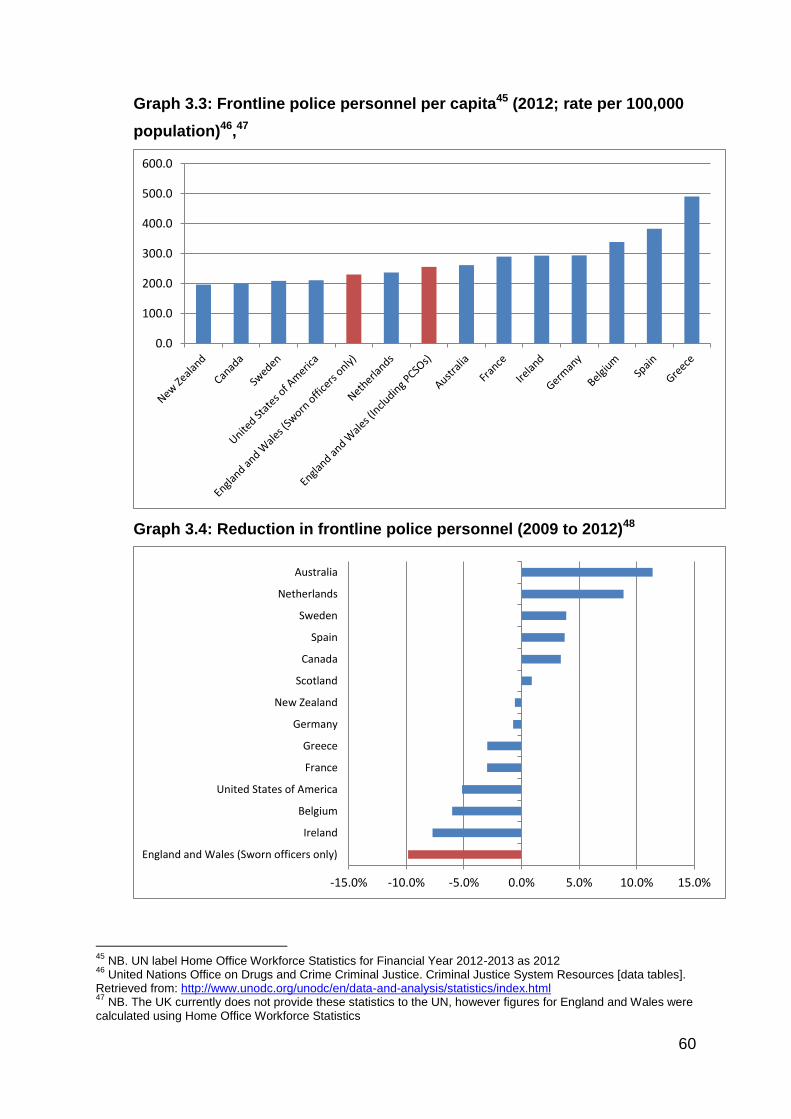
60
Graph 3.3: Frontline police personnel per capita45 (2012; rate per 100,000
population)46,47
Graph 3.4: Reduction in frontline police personnel (2009 to 2012)48
45
NB. UN label Home Office Workforce Statistics for Financial Year 2012-2013 as 2012 46
United Nations Office on Drugs and Crime Criminal Justice. Criminal Justice System Resources [data tables]. Retrieved from: http://www.unodc.org/unodc/en/data-and-analysis/statistics/index.html 47
NB. The UK currently does not provide these statistics to the UN, however figures for England and Wales were calculated using Home Office Workforce Statistics
0.0
100.0
200.0
300.0
400.0
500.0
600.0
-15.0% -10.0% -5.0% 0.0% 5.0% 10.0% 15.0%
England and Wales (Sworn officers only)
Ireland
Belgium
United States of America
France
Greece
Germany
New Zealand
Scotland
Canada
Spain
Sweden
Netherlands
Australia

61
Demand for policing over time 3.6
The number of crimes committed (per 1,000 population) and the total 3.6.1
number of 999 calls have decreased in England and Wales since
201049. Although this could partially be explained by the introduction
of the Police 101 service in 201250, UN statistics indicate that this is
possibly reflective of a broader downward trend in crime, particularly
in Europe. However, certain crimes in England and Wales have
increased during this period. For example, sexual offences have been
increasing per 1,000 population since 2012, and have increased by
20% between the financial years ending in 2013 and 201451. The
investigation and prosecution of complex crimes such as these are
particularly time and labour intensive, a factor not captured by overall
crime figures or captured in a way that could feed into a national
demand and capacity analysis. To help determine demands, this
deficit in data capture should be addressed along with the publication
of data regarding number of calls to the 101 service.
As previously mentioned in paragraph 3.2.4, HMIC have also 3.6.2
recognised that there has been an increase in the time that police
officers are required to spend responding to demand which could
more appropriately be dealt with by other services. Responsibilities
such as these, along with other more traditional police duties (such as
providing crowd control and crime prevention work), are also not
currently captured in a meaningful way.
48
NB. The UN uses nationally reported statistics to compile its analysis, therefore there is likely to be some slight variation the timing of data collection between countries, for example UN label Home Office Workforce Statistics for Financial Year 2009/10 as 2009, 2010/11 as 2010, 2011/12 as 2011 and 2012-2013 as 2012. 49
Her Majesty’s Inspectorate of Constabulary.(2014). Value for money profile data, 2014 – annual data return [data tables]. Retrieved from: http://www.justiceinspectorates.gov.uk/hmic/data/value-for-money-data/; HMIC.(2010). Underlying data [data tables]. Retrieved from: http://www.justiceinspectorates.gov.uk/hmic/data/value-for-money-data/ 50
Home Office.(2013). Helping the police fight crime more effectively [webpage]. Retrieved from: https://www.gov.uk/government/policies/helping-the-police-fight-crime-more-effectively/supporting-pages/implementing-101-the-police-non-emergency-number 51
Office of National Statistics.(2014). Crime statistics, period ending: March 2014. Retrieved from: http://www.ons.gov.uk/ons/rel/crime-stats/crime-statistics/period-ending-march-2014/index.html

62
Summary 3.7
Throughout the past four years of austerity and reform, the police 3.7.1
service has risen to the challenge with officers taking on more
responsibilities; larger workloads; and extending their existing skill
sets to meet the needs of both the service and the public. However,
without a corresponding increase in appropriate support, training and
remuneration, officers may find it difficult to continue to fulfil these
increasing requirements in the future.
Declines in police workforces and a growing population in England 3.7.2
and Wales have reduced the number of police officers per capita by
14.39% since 2010. Comparing the decline in police personnel for
England and Wales with other countries shows that our police service
has suffered from more workforce decline than many other
comparator countries.
The decline in the police workforce and growth in labour intensive 3.7.3
crimes and additional ‘hidden’ duties have resulted in an increase in
officers’ workloads, and thus their individual levels of responsibility.
As discussed at the beginning of this chapter, the necessary skills and 3.7.4
experience required to be an effective police officer have also
gradually increased over time, and will continue to do so in response
to external influences. Changes to the entry requirements, fitness
testing and the numerous external influences have also expanded the
skill set required to work effectively in a modern police role.

63
There is a considerable deficit in terms of the police workforce data 3.7.5
that is currently collected and reported. This makes it very difficult to
assess demand and capacity issues, restricting the Home Office’s
ability to model, plan and manage the police workforce. Due to the
extent of our concerns regarding the current data deficits, Chapter 4 is
dedicated to discussing these in depth.
Although there are some serious challenges in regards to the 3.7.6
nationally held data, the evidence outlined in the text above highlights
the increased level of skill and responsibility required in working
effectively as a modern police officer. To date, none of these changes
have been reflected in pay and conditions. If these changes continue
to go unrecognised, it may become increasingly difficult to maintain
officers’ psychological contracts with the service. In turn, this may
make it more challenging to ensure that there are sufficient, capable
and motivated officers serving within the police service.
Questions arising 3.8
How are changing requirements being captured, and reflected in the
rewards, or in reward planning?
How has the reduction in officer numbers affected the ability of the
police to serve the public, and how has it affected the workload and
skills required by individual officers?
How do we know what police are doing in their roles, and whether
they are being recompensed properly for their efforts? Currently, there
seems to be no national mechanism for systematic monitoring of
these.

64
SECTION 2: OFFICIAL
WORKFORCE DATA
This section contains an analysis of the workforce data provided by official sources.
The aim is to demonstrate to the PRRB that the evidence base for changes to pay
and conditions is not well elucidated.
In this section we discuss the comprehensiveness, transparency, and accuracy of
existing data. We also compare it to data used in other public sector organisations.
Going forward, we recommend changes so that:
an evidence based approach to workforce planning is adopted, with
appropriate and transparent data;
should significant changes be suggested to pay and conditions, then
appropriate modelling of likely impacts should be undertaken; and
recent changes should be monitored for their impact, to check whether
intended and unintended consequences have accrued.
65
4 Workforce data: are the current workforce data robust enough
to evaluate pay against the outcomes of ‘sufficient, capable
and motivated’ officers?
Introduction 4.1
The majority of the workforce data we examine within this document 4.1.1
was collated from two main sources: Her Majesty’s Inspectorate of
Constabulary (HMIC)52, and the Home Office (HO)53. To the best of
our knowledge these data have been interpreted appropriately and
accurately.
However, we have noticed a number of challenges with these data 4.1.2
sets in terms of accuracy, comprehensiveness and transparency. This
is a key concern as these challenges may impact upon the validity of
any conclusions that are drawn from the data.
We recognise that in many cases the data collected at force level are 4.1.3
more comprehensive. For example, some forces run attitudinal
surveys. However, given the current national pay system and the
need for officers’ pay and conditions to be legislated in Regulations
and Determinations, our concern is that the lack of comprehensive
data at a national level means that national policies cannot be
properly evaluated. Nor can the impact at force level be compared,
when the data are different at that level.
52 Her Majesty’s Inspectorate of Constabulary.(2014). Value for money profile data, 2014 – annual data return [data tables]. Retrieved from: http://www.justiceinspectorates.gov.uk/hmic/data/value-for-money-data/; HMIC.(2010). Underlying data [data tables]. Retrieved from: http://www.justiceinspectorates.gov.uk/hmic/data/value-for-money-data/ 53 Home Office. (2014). Police Workforce, England and Wales, 31 March 2014 [data tables]. Retrieved from: https://www.gov.uk/government/statistics/tables-for-police-workforce-england-and-wales-31-march-2014

66
As part of our PRRB submission, we have been asked to comment on 4.1.4
whether the existing pay system ensures sufficient, capable and
motivated personnel. In order to achieve this, however, we must also
evaluate whether the national workforce data currently published by
HMIC and the HO are; comprehensive, accurate, and transparent
enough to allow such meaningful evaluation.
Data comprehensiveness 4.2
To ensure appropriate, effective, and evidence-based workforce 4.2.1
planning, both data collection and analysis should always be driven by
need. Although this can be accomplished by working through stages
similar to that in Table 4.1 , there are some data that are almost
always appropriate to collect and analyse, such as: overall numbers
(joiners, leavers, and so on); the age, gender, and ethnic profile of the
service as a whole; length of service; and predictions of the likelihood
of leaving and plans for redressing any gaps.
Table 4.1: Typical stages of workforce planning
Identification of planning needs;
Identification of appropriate measures (or indicators) that will be able to
accurately gauge performance against the organisations planning needs;
Data collection and analysis;
Development of change strategy and action plan, and;
Evaluation of outcomes using performance measures/ indicators.

67
Although the Home Office collects data on police officers, their 4.2.2
measures (or data series) do not appear to be based on adequate
workforce planning requirements.
Good examples of a comprehensive data collection are the Ministry of 4.2.3
Defence’s national and official statistics. The MoD collects and
releases a series of monthly, quarterly and annual personnel reports
for both military and civilian departments. They also collect and
produce information on health statistics, equipment, activities, as well
as finance and economics.
When specifically comparing the personnel data reported by the MoD 4.2.4
for the Armed Forces and the HO for the police, there is a marked
difference. Table 4.2 gives a top level comparison guide between the
services personnel reporting.

68
Table 4.254: Top level comparison between the MoD55 and HO56 workforce
reports
Frequency
MoD Armed forces workforce reports and data
HO Police workforce reports and data
Annual
Top level report for Armed services
Tri-service personnel bulletin
Reserves and cadets strengths
Maternity report
Redundancy program statistics Quarterly
Top level report for Armed services
Royal Navy and Royal Marines quarterly pocket brief
Monthly
Top level report for Armed services
Royal Navy and Royal Marines monthly personnel statistics
Biannual (March and September releases)
Police workforce England and Wales
Information Categories Included in Report(s)
Strength and Liabilities: numbers and proportions
Branch, specialisation and arm information: workforce numbers and percentages
Rank information (paid): workforce numbers and percentages
Intake (Joiners) from ‘Civil Life’ or ‘Another Service’
Outflow (leavers) information: rates and exit reasons
Voluntary outflow information: rates and exit reasons
Promotion information
Training information
Gender information: workforce numbers and percentages
Ethnicity information: workforce numbers and percentages
Top level budget information
Regular length of service (LoS) information
Gains to strength: by branch
Strength: numbers and proportions
Workforce area, Force: numbers and percentages
Rank information (paid) : workforce numbers and percentages
Joiners: rates and proportions
Leavers: rates and proportions
Gender information: workforce numbers and percentages
Ethnicity information: workforce numbers and percentages
54
Please note: this table is a top level report assessment only. If you would like to see a copy of either of these reports, please use the links in the footnotes 55 and 56 55
Information taken from reports contained within the webpage detailing MoD statistics by topic on the Government website: https://www.gov.uk/government/statistics/mod-national-and-official-statistics-by-topic 56
Information taken from the reports within the webpage detailing the Home Office Police workforce England and Wales statistics on the government website: https://www.gov.uk/government/collections/police-workforce-england-and-wales

69
As previously mentioned, Table 4.2 shows notable differences in the 4.2.5
frequency and scope of the regular workforce reports from each
service. More specifically, the MoD include additional data on;
planned workforce numbers; exit reasons for both voluntary and
mandatory outflow (leavers); maternity and paternity leave;
promotions; as well as training and skill mixes. The MoD attempts to
provide information on those aspects of pay and conditions that are
key motivators, enablers, and retention factors. The national level of
data collection for the police does not appear to include these
elements in a comprehensive way.
Given the deficits highlighted by the above comparison, we have 4.2.6
serious concerns over the frequency and scope of the data currently
available. Although we understand that it is not within the PRRB’s
remit to plan and/or monitor the police workforce, the workforce data
mentioned throughout this chapter is essential for exploring whether
the existing pay and conditions ensure the recruitment and retention
of sufficient, capable and motivated officers.
Deficits in the comprehensiveness of the data will be considered 4.2.7
below specifically in reference to the themes of; Sufficient, Capable
and Motivated. Please note: a full evaluation matrix between what is
currently available and what we believe to be essential data for
accurate and effective police workforce planning can be found in
Annex 4.1.
70
Sufficiency
As stated in Chapter 2 police officers accept many challenging 4.2.8
conditions, but with an expectation that they will be afforded terms
and conditions that recognise the responsibilities they carry. This
reciprocal arrangement gives rise to expectations regarding working
conditions that are often referred to as a “psychological contract”57 .
Although sufficient recruitment, retention and motivation of capable 4.2.9
officers cannot be ensured solely by pay, it is nonetheless a critical
factor which appears in many employee motivation theories58 and
forms part of an officer’s psychological contract with the service.
There are two issues regarding the sufficiency of officers that we 4.2.10
consider pertinent here. The first is whether the overall numbers of
officers are sufficient to meet the demands of policing. Whilst
appreciating that it is not within the Pay Review Body’s remit to
increase the numbers, the relevance here is that decreasing numbers
means increasing workload: and that should be rewarded. Not only is
the service as a whole “doing more with less”, but each individual
officer is having to do so.
57
Argyris, C. (1960) Understanding Organisational Behaviour. Homewood :Dorsey; Rousseau D.M. (1995). Psychological Contracts in Organisations: Understanding Written and Unwritten Agreements. Sage Publication. 58
Rainlall, S. (2004). A review of employee motivation theories and their implications for employee retention within organizations. The Journal of American Academy of Business, 9, 21-26.Retrieved from:
ftp://118.139.161.3/pub/moodledata/113/Ramlall_2004.pdf
71
The second issue is whether pay is sufficient to attract officers of an 4.2.11
appropriate calibre into service, and then retain them. Within this, it is
also important to consider whether the pay is sufficient to attract and
retain officers who reflect the public they serve. This means, for
example, attracting officers from differing socio-economic
backgrounds, genders, and ethnicity, and retaining officers that reflect
a range of ages. We found twenty-six studies59 that addressed the
consequences of either black and minority ethnic (BME) or gender
representativeness in the police, (or both). A number of these suggest
that perceptions of police legitimacy and trustworthiness increase
when a police service is more representative in terms of ethnicity and
gender. Some research also suggests a representative service also
has a positive effect on performance.
Overall sufficiency
There is a general feeling within the police service that there are a 4.2.12
sufficient number of applicants and no current recruiting difficulties. If
this is the case, it is likely that this is partially due to the effects of
locally planned workforce reductions and the influence of the recession.
The recent austerity and shrinking job market may have caused a
reduction in competitive remuneration. Therefore, it would be worth
noting that officers who haven’t left during recession may well leave
upon economic upturn. Recent research has found a correlation
between unemployment rates, consumer confidence and voluntary
turnover rates; suggesting that as economic fears recede, voluntary
turn over rises60.
59
References for these are supplied at Annex 4.2 60
Schwartz, J. and Erickson, R. (2009). Prepare Now Or Lose Your Best Employees Soon [webpage]. Retrieved from: http://www.forbes.com/2009/08/12/talent-employees-retention-leadership-ceonetwork-deloitte.html

72
This being said, data required to actually evidence staff sufficiency and 4.2.13
recruitment efficiency on a national level is simply not available through
the HO. Unlike the MoD, the HO do not provide information on actual
workforce vs. planned workforce numbers. This means that currently
the data reveals how many people are employed, rather than how
many posts are filled.
A key area in terms of defining whether the number of officers is 4.2.14
sufficient is the national levels of demand and capacity. As mentioned
in Chapter 3 however, there is currently very little public data that can
be used to evaluate police demand. 999 call data and crime figures
alone are not an adequate representation of the demands placed on
the police. It would be helpful if data regarding the ‘hidden’
responsibilities of police, such as crowd control and inter-agency
support, were captured in a meaningful way as it would enable a fuller
understanding of national demand and capacity.
Insights from other professions, such as nursing, indicate that it is 4.2.15
possible to produce recommended minimum staffing levels and that
implementation of these recommendations can have an impact on a
range of positive outcomes at both an individual and organisational
level61. Although there are obvious intrinsic differences between
nursing and policing, the viability such a project within a policing
context should be explored.
We believe that there needs to be a shift away from the position taken 4.2.16
in the last few years, when the number of officers has been determined
by affordability, to a position where the number of officers is based on
the demands of policing. We have, and will continue, to argue for
greater numbers of officers. However, we understand that the overall
numbers of officers is outside the remit of the PRRB.
61
Royal College of Nursing. (2012). Mandatory Nurse staffing. Policy Briefing, 03/12. Retrieved from: http://www.rcn.org.uk/__data/assets/pdf_file/0009/439578/03.12_Mandatory_nurse_staffing_levels_v2_FINAL.pdf

73
Recruitment and retention
If an organisation fails to offer what potential applicants view as proper 4.2.17
recompense for the level of responsibility and skill required for the role,
it may deter them from applying. This is especially pertinent given the
recent reduction in police workforce and the Winsor recommendation to
increase entry requirements62. This recommendation was implemented
alongside a reduction to the starting salary; highlighting the recent and
damaging ‘more for less’ attitude towards policing. As previously
mentioned, the reductions in the police workforce also seem to support
this sort of attitude, as there are inevitable knock-on effects on
individual workloads and responsibilities.
To better understand and monitor the attractiveness of policing as a 4.2.18
job, we need to know the number, and calibre, of applicants that apply
for each position, as well as those who are actually recruited. Ideally,
we would also know whether the applicants and recruits were internally
or externally sourced; and if they were internally sourced, why they
moved roles. For example, was it a promotion or did they transfer to
another area?
Similarly, to understand retention we need to know the level of planned 4.2.19
and unplanned turnover; we also need to know whether leavers exited
the service, or just their role, as well as their underlying reasons for
leaving.
62
Recommendation 3 & 5 from: Winsor, T. (2012) Independent Review of Police Officer and Staff Remuneration and Conditions, Final report, 2, 631.
74
There is currently no accessible information regarding number of 4.2.20
applicants for each vacancy, nor the profile of applicants (age, gender,
qualifications, ethnicity, etc.) at a national level or in any central
repositories that would allow comparison of the experiences of different
forces. This means that it is difficult to gauge whether there are
sufficient and capable officers, and whether legislation regarding
workforce diversity is being properly enacted.
Although the HO does collect data on exit reasons, this information is 4.2.21
not currently part of their standardised reporting. This evidence is
absolutely key in evaluating the impact of policies designed to manage
service retention and talent flow.
Furthermore, there has been a recent focus on the need for force 4.2.22
“resilience”, and this argument is being used to underpin the rationale
for officers on restricted duties to be potentially exited from service.
Unfortunately, data that could inform us of the size and scope of this
issue are not currently available on the Home Office website. More
specifically, it would be helpful to have details on: whether police
services are unable to meet commitments currently, what commitments
these are, and what role those on restricted duties play in this; the type
of restricted duties officers are performing; the reasons for officers
being on restricted/recuperative duties (e.g. injury, illness, disability);
whether or not this was a result of working as a police officer; and the
reasons for restrictions ( e.g. management, medical).
Recent discussions with the Home Office have revealed that some of 4.2.23
these key pieces of data, such as number and quality of applicants for
each vacancy, are no longer being collected though the Annual Data
Requirements (ADR)63. However, if the data do not allow for policies to
be evaluated, then how can these policies be justified, and the cost-
impacts calculated?
63
P. Spreadbury (personal communication, 17 November 2014)

75
We understand that the HO ADRs are not solely driven by workforce 4.2.24
planning and that there are competing data priorities; however, we
would argue that the lack of adequate, appropriate and accurate
workforce data such as this will affect the HO’s understanding of policy
effectiveness, and our ability to effectively represent our members’
interests.
As such, we believe that the PFEW is a key stakeholder in the ADR 4.2.25
collected by the HO and consequently should be invited to attend and
contribute to their annual review of the ADR. This would offer us the
opportunity to engage with the HO and present feedback on data
priorities to help shape a more effective and evidence based workforce
plan.
Capable
Beyond ensuring that there are sufficient police officers, it is also critical 4.2.26
that officers are both motivated and capable, in order to carry out their
role effectively. Changes to the existing pay and remuneration
packages are also likely to have an impact on the performance64 of
existing employees. There is also a possibility that changes to these
systems could have a negative impact on staff turnover intentions65,
and consequently organisational performance66.
64
T. Newburn. (1999). Understanding and preventing police corruption: lessons from the literature. Policing and
Reducing Crime Unit, Research, Development and Statistics Directorate, Police Research Series, 110, 20. 65
Miceli, M.P., and Mulvey, P.W. (2000). Consequences of Satisfaction with Pay System: Two Field Studies. Industrial Relations, 39, 62-87. doi:10.1111/0019-8676.00153 66
Heavey, A. L., Holwerda, J. A., & Hausknecht, J. P. (2013). Causes and consequences of collective turnover: A meta-analytic review. Journal of Applied Psychology, 98, 3, 412.

76
National statistics, however, are currently not able to capture these 4.2.27
issues. Fortunately, the PFEW’s workforce survey conducted in Spring
2014 sheds considerable light on officers’ attitudes towards their work,
their current pay and conditions, and the police service in general.
Chapter 6 details the key findings from this survey in order to address
the main themes of Sufficient, Capable and Motivated.
It would be good practice for the HO to hold data on the numbers and 4.2.28
profile of individuals with specific skills. Even though there is an
increasing pressure to undertake mutual aid activities, and
collaboration, the HO does not currently report any data pertaining to
the calibre of recruits or existing officers. This makes it impossible for
us to determine whether capable candidates are being attracted to the
service; officers are offered the opportunity to gain appropriate skills;
and whether those who are skilled are being retained. Collecting and
reporting this data would facilitate effective capacity planning and
maintenance.
There is also little quantitative, and no qualitative, information captured 4.2.29
at a national level regarding how long officers remain in service;
whether those leaving are likely to be higher calibre; and what the
reasons are for leaving. This makes it extremely difficult to understand
the rationale for some of the policies suggested by the HO.
Unlike the MoD, the HO does not publish data on wastage during 4.2.30
probation. This means that it is difficult to measure the impact of
changes to key areas such as recruiting standards. Information such as
this is essential in order to understand whether the current pay and
conditions facilitate the recruitment and retention of officers who are
able to deal with the challenging nature of police training, and the
demands of the job.

77
Although it is likely that the College of Policing will collect such data in 4.2.31
the future, there is no transparent plan as to how this will be used in
analysis or planning, and it might be expected that ongoing policy
evaluation should take such data into account.
The pipeline showing the flow of officers through the ranks is also not 4.2.32
clear, meaning that officers often enter service with expectations that
they will be promoted that cannot be met. The PFEW workforce survey
showed that 12.1% of Constables and 15.5% of Sergeants passed their
promotion boards, but there was no position open for them to move
into.67In addition, there is currently no data offered centrally to assess
how many individuals are in receipt of Acting Up allowance for acting in
a higher rank. Given austerity pressures not to promote, this would be a
useful measure both to understand the promotion pipeline, and to
understand whether those in rank are fully prepared for the job, in the
interests of the public.
The recent implementation of the Fast Track and Direct Entry schemes 4.2.33
has been designed to increase access to higher ranks for capable
individuals. However, their introduction to date has been piecemeal and
seemingly without any analysis being undertaken to investigate how the
restriction of ACPO access opportunities for existing officers will impact
on the retention of existing talent.
67
Boag-Munroe, F., Knapper, S., and Elliot-Davies, M. (2015) Police Officers’ Promotion Prospects and Intention to Leave the police service:The mediating effects of perceived organisational support and personal morale. Paper presented at the British Psychological Society’s Division of Occupational Psychology Conference, Glasgow 7-9
th
January 2015.

78
Motivated
As with performance, changes to the existing pay and remuneration 4.2.34
packages are likely to have an impact on the morale68 and turnover
intentions69 of existing employees.
Unlike other public sector agencies, there is currently no national level 4.2.35
collection of attitudinal data regarding the motivation of officers. An
example of good practice in this regard is the Armed Forces, who
routinely collect measures of motivation and attitudes towards pay and
allowances, and who use this to help shape their policy. The Armed
Forces Continuous Attitude Surveys (AFCAS) have been running for
several years. Perception data from these surveys can be matched to
the package of pay and allowances attained by each individual, through
the Joint Personnel Administration system.
This makes it possible for the Armed Forces to understand which pay 4.2.36
and allowances have the effects that they are intended to. For example,
it allows analysis of whether particular rewards incentivise individuals to
develop skills, stay in service, and undertake particular duties, and so
on.
68
Smith, J, C. (2013). Pay growth, fairness and job satisfaction : Implications for nominal and real wage rigidity. Working Paper. Coventry, UK: University of Warwick, Department of Economics. Retrieved from: http://wrap.warwick.ac.uk/56589 69
Miceli, M.P., and Mulvey, P.W. (2000). Consequences of Satisfaction with Pay System: Two Field Studies.
Industrial Relations, 39, 62-87. doi:10.1111/0019-8676.00153

79
Data accuracy and uniformity 4.3
Whilst using the data provided by the HO and HMIC to help understand 4.3.1
national trends in police staffing, we have observed some problems
with the data auditing process prior to publication. In some cases these
problems have led to significant errors in nationally published data.
Although the relevant bodies are generally helpful and responsive to
our queries, we are concerned over the time and effort it has taken to
address and rectify some errors once identified.
A good example of this are the sickness figures for Cleveland Police. 4.3.2
Using the workforce and sickness data collected by the HO, we
examined the number of officers on sick leave70 as a proportion of each
Force’s total workforce. This allowed us to compare sickness figures
between Forces, irrespective of the differences in their workforce size.
However, on acquiring the data it appeared that the figures for
Cleveland were disproportionate compared with the rest of the Forces.
Graphs 4.1 and 4.2 highlight these inconsistencies by illustrating that in 4.3.3
2013, the reported proportion of staff on long term sick leave (LTS) was
22.88%. This is over 20% higher than both the average amongst other
forces and the next highest force figure.
They also show that the 2010 figures for short and medium term 4.3.4
sickness (SMTS) are equally as concerning. The reported proportion of
staff on SMTS leave for Cleveland was 35.83%, which is over 30%
higher than both the average amongst other forces and the next
highest force figure.
70
NB data is taken as a headcount on the 31st (of March each year.)

80
Graph 4.1: Staff on long term sick leave as a proportion (2010 – 2014; includes
police officers, staff including s.38+9 and PCSOs )71
*Average across all PFEW forces excluding Cleveland
Graph 4.2: Staff on short or medium term sick leave as a proportion of the
police workforce (2010 – 2014; includes police officers, police staff including
s.38+9 and PCSOs)72
*Average across all PFEW forces excluding Cleveland
71
Calculated using data from the documents listed in Annex 4.3: 72
Calculated using data from the documents listed in Annex 4.3:
2010 2011 2012 2013
Cleveland 4.83% 9.30% 12.53% 22.88%
AVERAGE* 3.12% 1.21% 1.49% 1.40%
Highest 8.28% 2.54% 6.24% 2.32%
Lowest 1.61% 0.00% 0.00% 0.39%
0%
5%
10%
15%
20%
25%
30%
35%
40%
45%P
rop
ort
ion
of
wo
rkfo
rce
2010 2011 2012 2013
Cleveland 35.83% 2.71% 5.84% 2.19%
AVERAGE* 1.74% 1.67% 1.96% 1.56%
Highest 3.41% 2.66% 3.79% 3.51%
Lowest 0.00% 0.00% 0.50% 0.00%
0%
5%
10%
15%
20%
25%
30%
35%
40%
45%
Pro
po
rtio
n o
f w
ork
forc
e

81
When queried in June 2014, the HO acknowledged the sickness figures 4.3.5
for Cleveland as incorrect73, yet 6 months later these errors have still
not been fully explained or amended within the publically available data
tables on the HMIC website.
We recognise that austerity measures have hit the support functions for 4.3.6
officers as well as officers themselves. However, we believe that the
public deserve to have a police service that is designed, supported, and
held to account based on accurate and up-to-date data.
In addition to errors within the published data sets, we have also 4.3.7
observed several other difficulties regarding comparing and
understanding the data produced by HMIC and the HO. Currently these
organisations do not practice a uniform approach when reporting police
workforce data or crime statistics. There are many differences in how
they report this information and these divergences are not always
effectively sign posted. This can make comparison between data
sources lengthy and problematic. Guidance notes on exclusion and
inclusion criteria used for each data series are usually held in a
separate document, whilst key information is not always clear and, in
some instances, is lacking.
For example, Table 4.3 shows that when comparing the historical 4.3.8
figures from the 2014 and the 2013 data sets for crime per 1,000
populations, the numbers do not match for each concordant year. This
unexplained fluctuation indicates that there is some variation in how the
HMIC numbers were calculated in 2013 and 2014, but the nature and
extent of these variations is not clearly signposted.
73
E. Woods (personal communication, 26 June 2014)

82
In addition, crime statistics data are reported by the HO as a frequency 4.3.9
(the actual number of incidents) and includes (some) incidents of fraud;
whereas HMIC reports crimes as a rate (per 1,000 population) and
does not include fraud74.
This lack of consistency and clarity makes it challenging to interrogate, 4.3.10
understand, and use the data appropriately. With these difficulties in
mind, we would like to see a greater integration and compatibility
between the collection and presentation of data by HMIC and the HO;
this will help develop a more reliable evidence base.
Table 4.375: Crimes per 1,000 population over time by data set
Crimes per 1000 population According to the 2014
Crime and ASB data set
According to the 2013
Crime and ASB data set
12 months to June 2013 60.74 61.22
12 months to June 2012 65.15 65.40
12 months to June 2011 69.31 69.49
74
Data taken from Her Majesty’s Inspectorate of Constabulary ‘Crime and Anti-Social Behaviour’ [data sets]. Retrieved from: http://www.justiceinspectorates.gov.uk/hmic/data/crime-and-policing-comparator-data/ 75
Her Majesty’s Inspectorate of Constabulary.(2014).Crime and ASB – June 2011/12/13/14 [data table]. Retrieved from: http://www.justiceinspectorates.gov.uk/hmic/data/crime-and-policing-comparator-data/ ; Her Majesty’s Inspectorate of Constabulary.(2014). Crime and ASB – June 2010/11/12/13 [data table]. Retrieved from: http://www.justiceinspectorates.gov.uk/hmic/data/crime-and-policing-comparator-data/

83
Additionally, there are some data series and key statistics related to 4.3.11
workforce strength collected by the HO and published by HMIC, that
are not fit for purpose in their present form. In particular, we note
limitations with the reporting of sickness absence data. For instance,
sickness absence is only reported by HMIC, and is done so as a
headcount of police officers on long-term sick leave and short-term sick
leave on the 31st March each year. Snapshot data of this kind is not
truly representative of sickness absence over the entire year. For
example, it does not capture the number of days lost to sickness nor
the number of officers who are absent through sickness within a given
year.
More broadly we feel that the use of a “snapshot” model to capture data 4.3.12
at one particular point in time presents challenges for accurate
assessments of whether the current police workforce is sufficient to
meet demand. For example, population fluctuations in some areas of
the country, in particular in regions with high levels of seasonal tourism
can significantly distort police officers per capita calculations, and
underestimate the demand for policing as a consequence. In addition,
the use of broad statistics such as number of leavers, without drilling
further into reasons for leaving, again prevents firmer conclusions being
drawn.
We do, however, recognise that all data are reliant on accurate 4.3.13
reporting, and that this often sits at a force level, rather than with
national organisations. As noted above, this is something that has
recently been highlighted by HMIC within the context of crime-
recording: however the same principles should also apply to police
workforce reporting, to effectively analyse police workforce strength as
well as demand for policing.

84
Transparency 4.4
A final concern with regard to the data that are collected is with regard 4.4.1
to the transparency of data. As previously mentioned, recent
discussions with the HO has revealed that much of the data they collect
are not currently disseminated through regular reports76.
Sickness data, for example, are collected by the HO and reported by 4.4.2
HMIC in their ‘Value for Money’ data sets. As previously mentioned, the
current document bases the sickness figures on an unrepresentative
“snapshot” methodology77. However recent discussions with the HO
revealed that other, more appropriate measures, such as ‘Total
Contracted Hours Lost to Sickness’ are collected but not currently used
in HMIC reports.
A more critical example of the challenges of data transparency is the 4.4.3
PNB Pay Census, which has run since 2010. This was the only
nationally collated measure of actual pay and allowances paid to
officers. From 2010 to 2014 the costs of this census were shared
between the HO and Staff Associations, even though the data are
required by law to monitor equality issues. There have been a number
of occasions when the analysis undertaken by the Staff Associations
has been used by both sides to reach agreements over the best way
forward on a change of policy. These have included modelling the
savings made by the two year pay freeze; the costing of resuming
incremental progression, and modelling of options; savings of changing
the rate of overtime payments; impacts of pension savings; and equal
pay issues.
76
P. Spreadbury (personal communication, 17 November 2014) 77
Please see section 4.3

85
Unfortunately now that the HO will be funding data collection, there has 4.4.4
been no consultation over what data are to be collected. Furthermore,
the HO has stated that there is no intention to share the data, other
than summaries.
This lack of transparency leaves the Staff Associations in a difficult 4.4.5
position, in that there are likely to be approaches by members over
concerns about losses of pay that the Staff Associations cannot
adequately answer for members. This is likely to increase distrust;
leave the Staff Associations unable to understand policy changes and
impacts; and make it more difficult for the Associations to be supportive
of HO initiatives. It will also mean the burden of analysis and
interpretation of data will fall even more to the HO. Overall, these
unintended consequences are not likely to be in the public interest.

86
Obviously these concerns apply to the ongoing management of 4.4.6
officers: comprehensive, transparent, and reliable data is needed for
that. Additionally, these concerns apply to the future planning of
changes to the way officers are managed. How can policies be
determined unless robust data are available, and are used to help
assess the likely impacts, both expected and unintended? Other large
public sector bodies, such as the MoD, conduct detailed analysis of
planned changes, using extant data and qualitative data to assess
likely workforce impacts. An example is the MoD’s New Employment
Model. By contrast, the Home Office does not appear to have a
scheme in place to model the likely impacts of future changes. This
means that change is enacted that may cause negative as well as
positive impacts, and makes the prediction of even the most essential
information, such as numbers of officers, difficult. An example is with
regard to the introduction of the new pension scheme: the Staff
Associations would expect predictions regarding likely increased officer
turnover, the length of service of officers affected, and a plan for
replacing experience and training. We are not aware of any such
modelling.
The concerns also apply to the assessment of recent changes. For 4.4.7
example, the changes made following the Winsor Review were wide-
reaching. The Staff Associations have lobbied for these to be
assessed: however, in many cases there seem to be no plans to do so.
(This is expanded on in Chapter 10).
87
Summary 4.5
As described throughout this chapter, there are significant challenges in 4.5.1
evaluating the role of pay in workforce behaviour due to concerns with
the current availability, accuracy and transparency of the HO and HMIC
data. These concerns are supported by the lack of scope and
frequency in the data provided by the HO when compared with other
public services.
In order to effectively represent our members’ interests in matters of 4.5.2
pay and conditions, we need access to key information that is currently
unavailable to us78. These deficits also make it difficult to understand or
have full confidence in the national workforce plan for policing.
The HO do not currently treat PFEW and PSAEW as key stakeholders
and in some cases are suggesting that we will not have the access we
previously had to strategic data. Although we understand the Annual
Data Returns (ADRs) are used for more than workforce planning and
that these requirements must be prioritised, we feel that there should
be a system to enable us to give regular feedback to the HO. This will
help to shape more efficient reporting and provide access to the
necessary information needed for us to supply the PRRB with
appropriate and evidence-based recommendations.
Questions arising 4.6
How can the HO adequately plan the police workforce without holding
key information on recruitment, retention and skill mix?
How can the HO evaluate the effects of pay and conditions changes
without key information on recruitment, retention and skill mix?
How can we evaluate the current pay and conditions and/or make
recommendations for future changes without adequate access to
accurate data?
78
Please see Annex 4.1 for a full list of data requirements and their accompanying rationales

88
Recommendations 4.7
Recommendation 1 (data): We believe it is crucial that the HO adopt 4.7.1
an evidence based approach to workforce planning, with the role that
pay and conditions play in that clearly demonstrated.
For example, we would like to see appropriate data regarding 4.7.2
recruiting, selection, training and development, progression, and exit.
This should include national collation of data on the numbers and
calibre of applicants as well as actual recruits, to better understand
the attractiveness of policing; promotions, to understand the scope for
career progression and the impact of recruitment freezes on this;
numbers passing promotion criteria who are not subsequently
promoted; transfers between forces; length of service of leavers by
gender and ethnicity; the costs of replacing expertise when trained
officers leave; and so on, as all these affect the degree to which the
pay system can be designed so as to support sufficient, capable, and
motivated officers with an appropriate demographic mix.
Data should be comprehensive, accurate, and transparent: in 4.7.3
particular data should be shared with ACPO, the APCC, and Staff
Associations.
89
Recommendation 2 (data): Our second recommendation is that, 4.7.4
should significant changes be suggested to the pay and conditions
system, appropriate modelling of the likely impacts should be
undertaken in advance of changes.
In the interests of transparency this modelling should also be shared. 4.7.5
The modelling should include consideration of impacts on recruitment
and retention, (including costs of any loss of experience, and
replacement / training costs); and consideration of impact on groups
with protected characteristics.
Recommendation 3 (data): Our third key recommendation, is that 4.7.1
recent changes be monitored for their impact, to check whether the
intended benefits have in fact accrued, and to check whether there
have been unintended consequences, before further significant
change is embarked upon.
Again, policy evaluations such as these should be shared. 4.7.2

90
SECTION 3: KEY EVIDENCE 2014
The PFEW and PSAEW submission contains three key sources of information:
Objective evidence of recruitment / retention.
Perceptual evidence: a workforce survey.
External evidence: wider economic changes and their impact on pay.
Through this evidence we will demonstrate that:
The HO evidence base regarding recruitment and retention is poor,
particularly in regard to forward projections and modelling these.
The changes that have occurred in the last few years, following the Winsor
Review and austerity measures, have caused officers to have low morale and
have caused a breach of the psychological contract. Both of these have been
demonstrated in previous academic studies to relate to increased intention to
leave: a finding that is replicated in our workforce study.
These significant changes and the churn caused also lead us to recommend
that there be no further substantial changes to the pay system until such time
as they are well-evidenced.
The external economic climate, including inflation, coupled with austerity
measures such as the pay freeze, has caused a substantial decline in the real
value of officers’ pay.

91
5 Objective evidence regarding the numbers of officers recruited
and retained
Introduction 5.1
There are several key areas which need to be considered in order to build a 5.1.1
clear picture of recruitment, retention and talent flow within the police
service.
As discussed in depth within Chapter 4, the majority of the data required for 5.1.2
meaningful analysis of the police workforce recruitment and retention
patterns are not currently reported by the HO or HMIC. Nonetheless, Table
5.1 depicts the regularly reported evidence on the key recruitment and
retention questions mentioned in Chapter 4. As previously mentioned,
although the HO does collect additional data, the HO does not currently
disseminate these through standard publications.
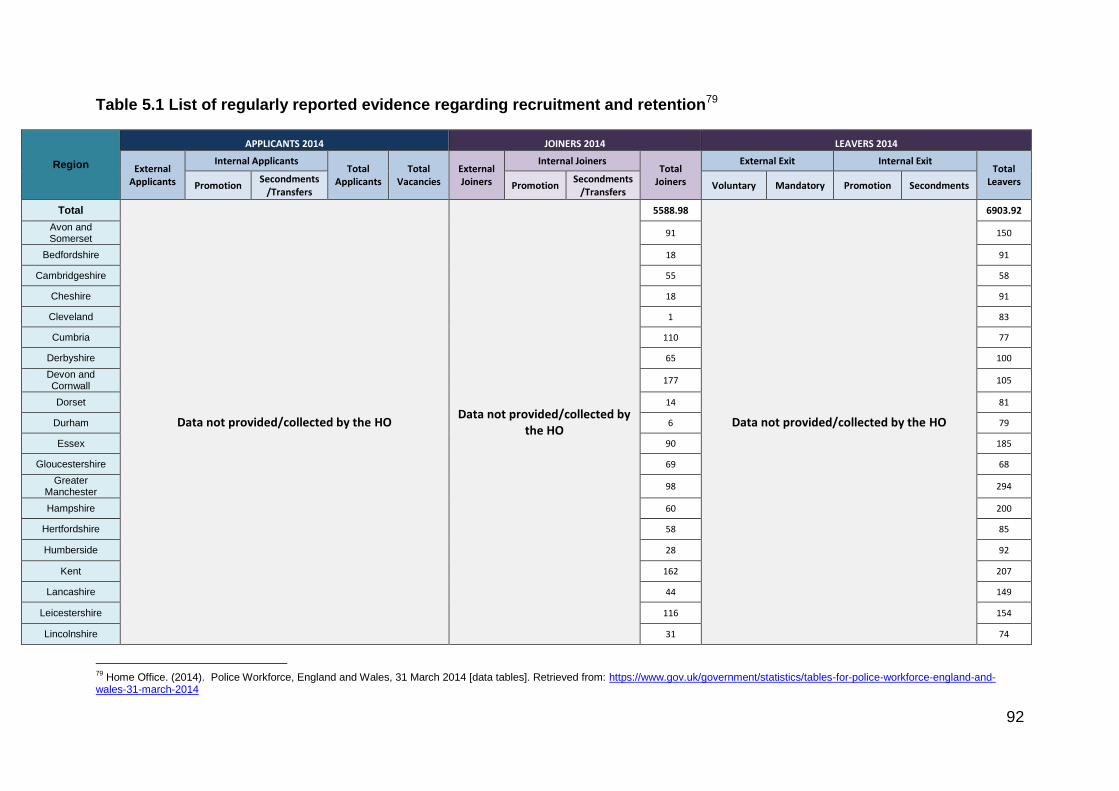
92
Table 5.1 List of regularly reported evidence regarding recruitment and retention79
Region
APPLICANTS 2014 JOINERS 2014 LEAVERS 2014
External Applicants
Internal Applicants Total
Applicants Total
Vacancies External Joiners
Internal Joiners Total
Joiners
External Exit Internal Exit Total
Leavers Promotion Secondments
/Transfers Promotion
Secondments /Transfers
Voluntary Mandatory Promotion Secondments
Total
Data not provided/collected by the HO Data not provided/collected by
the HO
5588.98
Data not provided/collected by the HO
6903.92
Avon and Somerset
91 150
Bedfordshire 18 91
Cambridgeshire 55 58
Cheshire 18 91
Cleveland 1 83
Cumbria 110 77
Derbyshire 65 100
Devon and Cornwall
177 105
Dorset 14 81
Durham 6 79
Essex 90 185
Gloucestershire 69 68
Greater Manchester
98 294
Hampshire 60 200
Hertfordshire 58 85
Humberside 28 92
Kent 162 207
Lancashire 44 149
Leicestershire 116 154
Lincolnshire 31 74
79
Home Office. (2014). Police Workforce, England and Wales, 31 March 2014 [data tables]. Retrieved from: https://www.gov.uk/government/statistics/tables-for-police-workforce-england-and-wales-31-march-2014

93
Region
APPLICANTS 2014 JOINERS 2014 LEAVERS 2014
External Applicants
Internal Applicants Total
Applicants Total
Vacancies External Joiners
Internal Joiners Total
Joiners
External Exit Internal Exit Total
Leavers Promotion Secondments
/Transfers Promotion
Secondments /Transfers
Voluntary Mandatory Promotion Secondments
London, City of 29 63
Merseyside
Data not provided/collected by the HO Data not provided/collected by
the HO
255
Data not provided/collected by the HO
204
Metropolitan Police
2343 1772
Norfolk 119 76
Northamptonshire 32 61
Northumbria 99 204
North Yorkshire 103 76
Nottinghamshire 175 107
South Yorkshire 107 130
Staffordshire 28 114
Suffolk 89 55
Surrey 89 113
Sussex 107 146
Thames Valley 302 263
Warwickshire 39 37
West Mercia 14 119
West Midlands 0 328
West Yorkshire 47 229
Wiltshire 28 56
Dyfed-Powys 59 53
Gwent 26 69
North Wales 65 86
South Wales 124 122

94
Historical joiners’ and leavers’ data are represented in Graph 5.1, and 5.1.3
although the number of officers leaving the service has stayed fairly
stable since 2010, the numbers who joined the police service dropped
considerably between 2011 and 2013. This most likely indicates a
reduction in locally planned recruitment (in response to the 2010
Spending Review80): but in some cases we believe there has been a
reduction in capable applicants, with some recruitment targets not
having been met. (For example, the numbers accepted on a recent
Direct Entry scheme are much lower than expected). However, this
distinction cannot properly be made from the available data as there is
no application data (such as the number or calibre of applicants per
vacancy), or planned workforce data/models. Nor does the HO
differentiate between those who have joined from an external or internal
applicant pool within their joiners’ data.
In addition, the available data from the HO on outflow do not differentiate 5.1.4
between planned and unplanned turnover, nor do they distinguish
between officers who have exited the service voluntarily or for another
reason such as retirement.
80
Her Majesty’s Treasury. (2010). Spending review 201. Retrieved from: https://www.gov.uk/government/uploads/system/uploads/attachment_data/file/203826/Spending_review_2010.pdf
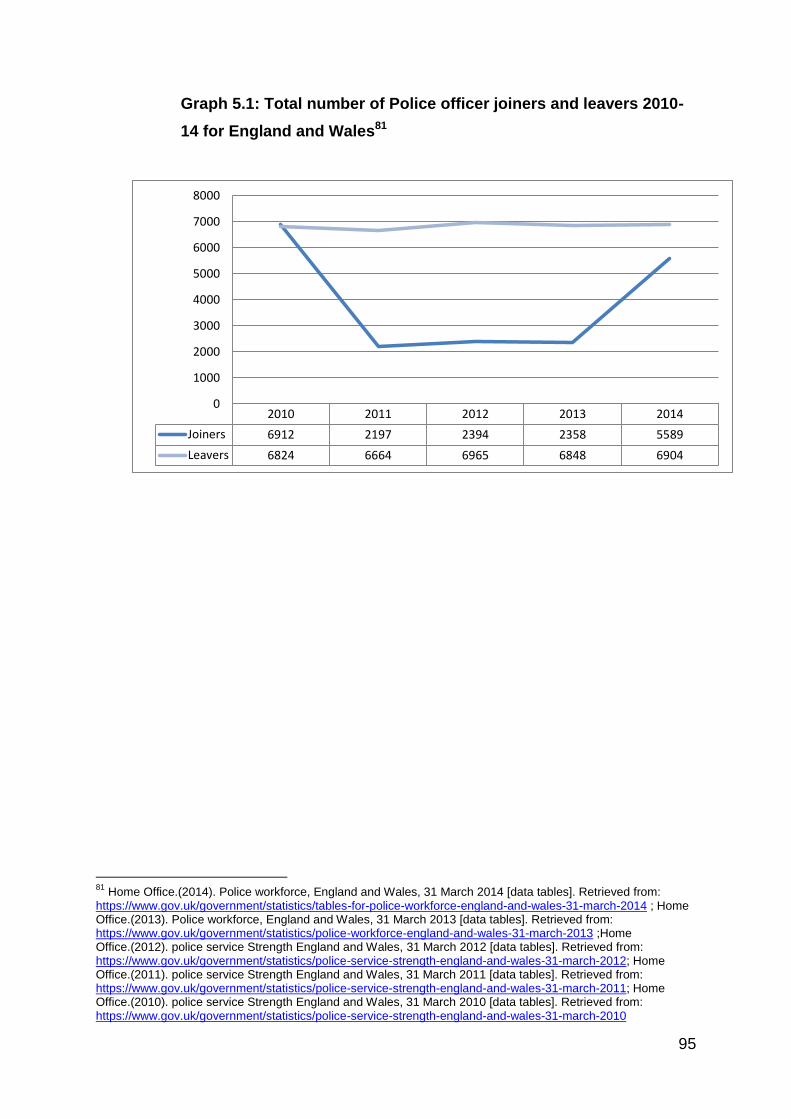
95
Graph 5.1: Total number of Police officer joiners and leavers 2010-
14 for England and Wales81
81
Home Office.(2014). Police workforce, England and Wales, 31 March 2014 [data tables]. Retrieved from: https://www.gov.uk/government/statistics/tables-for-police-workforce-england-and-wales-31-march-2014 ; Home Office.(2013). Police workforce, England and Wales, 31 March 2013 [data tables]. Retrieved from: https://www.gov.uk/government/statistics/police-workforce-england-and-wales-31-march-2013 ;Home Office.(2012). police service Strength England and Wales, 31 March 2012 [data tables]. Retrieved from: https://www.gov.uk/government/statistics/police-service-strength-england-and-wales-31-march-2012; Home Office.(2011). police service Strength England and Wales, 31 March 2011 [data tables]. Retrieved from: https://www.gov.uk/government/statistics/police-service-strength-england-and-wales-31-march-2011; Home Office.(2010). police service Strength England and Wales, 31 March 2010 [data tables]. Retrieved from: https://www.gov.uk/government/statistics/police-service-strength-england-and-wales-31-march-2010
2010 2011 2012 2013 2014
Joiners 6912 2197 2394 2358 5589
Leavers 6824 6664 6965 6848 6904
0
1000
2000
3000
4000
5000
6000
7000
8000

96
However, some interesting inferences can be made from the Direct Entry 5.1.5
(Superintendent) data. The Direct Entry (Superintendent) scheme
derived from Recommendation 19 in the 2012 Winsor Review82. There
was significant interest in the programme, and out of the initial 888
applicants83, 46 candidates were entered into the scheme. Only 13 of
those 46 applicants passed the national assessment centre, and
according to the Policing Minister, Mike Penning, this was a lower
number than had been hoped for84. In fact, fewer than 10 applicants
were subsequently entered into service, with some withdrawing.
The large discrepancies in the number of applicants, candidates and 5.1.6
final appointees, may indicate that those who are currently applying to
the scheme are not of a high enough calibre. Thus, we must ask the
question: why is the Direct Entry (Superintendents) Scheme not
attracting the right applicants? There also need to be questions asked
about the efficiency of a scheme where nearly 900 applications need to
be processed, only for fewer than 10 suitable candidates to be found.
Although there are clearly some gaps in the available data that make it 5.1.7
difficult to evaluate the current resourcing model, the level of overtime
worked by officers may indicate that it may be flawed. For example,
within the financial year 2012-13, officers worked over 100 hours of
overtime on average85 roughly one extra (eight hour) shift a month.
82
Recommendation 19; Winsor, T. (2012). Independent Review of Police Officer and Staff Remuneration and Conditions, Final report, 1, 20 Retrieved from: http://webarchive.nationalarchives.gov.uk/20130312170833/http:/www.review.police.uk/publications/part-2-report/ 83
West Yorkshire Police Federation. (2014). Direct entry: Nearly 50 applicants for superintendent role [web page]. Retrieved from: http://www.wypf.polfed.org/2014/07/03/direct-entry-nearly-50-applicants-for-superintendent-role/ 84
College of Policing.(2014). Direct entry to superintendent assessment centre results announced [press release]Retrieved from: http://college.pressofficeadmin.com/component/content/article/45-press-releases/772 85
Office of Manpower Economics, PNB Census of Earnings, Hours and Length of Service.

97
Summary 5.2
As highlighted throughout both the current and preceding chapters, the 5.2.1
police workforce data available from the HO and HMIC are currently
poor in both quality and quantity. Although there are data in regards to
joiner and leaver numbers, it would be unwise to use these to draw
conclusions given their considerable limitations. Consequently, these
deficits have restricted our ability to understand and model any potential
patterns in police recruitment and retention.
However, data that are available indicate that recruitment on the Direct 5.2.2
Entry (Superintendent) scheme and overtime appears to indicate that
there may be some challenges in recruiting the right candidates and
having sufficient officers to cope with the current workload.
The HO and HMIC should work together to address these deficits and 5.2.3
promote a more evidence based approach to workforce planning.
Questions Arising 5.3
The questions arising from Chapter 4 also apply here, but more
specifically:
How can the HO monitor recruitment and retention when the data
do not distinguish between internal and external
appointments/moves?
How can the HO monitor recruitment and retention if the numbers of
filled vs unfilled posts are unknown?.
How can the HO monitor whether officers and recruits are capable if
information regarding their skill mix and qualifications are unknown?
98
6 External context: Government pay policy and impact on police
perception evidence: workforce surveys
Introduction 6.1
At present, data are not collected by the Home Office on police 6.1.1
officers’ motivation, morale or attitudes towards the police. Although
individual forces do conduct their own engagement surveys, a
proactive understanding of police officers’ opinions, experiences and
intentions at a national level (for example regarding their intention to
leave or views on current training or promotion provisions) is lacking.
This is in contrast to other public services, such as the NHS and the
Armed Forces, where reliable and representative data on workforce
attitudes have been collected for many years.
To address the lack of national data on police officers’ opinions, 6.1.2
experiences and intentions, PFEW and PSAEW independently
conducted two surveys of all their members in Spring 2014.
PFEW’s survey provided an insight into its members’ views on many 6.1.3
aspects of their pay and conditions. The first part of this chapter
presents an overview of these findings. The full research report is
available on request from PFEW.
The key considerations in designing the PFEW workforce survey were 6.1.4
to test various hypotheses about the relationships between changes
to pay and conditions, morale, the status of officers’ psychological
contracts, and intention to leave the service. To that end, we designed
the study using measures that have been tested elsewhere for their
validity and reliability. We borrowed items from the Armed Forces
Continuous Attitude Survey, to facilitate comparisons. These issues
are discussed in the chapter that follows.

99
Findings from the PFEW workforce survey have also been peer-6.1.5
reviewed and have been presented at The British Psychological
Society’s Division of Occupational Psychology Conference in Glasgow
in January 201586.
PSAEW’s survey addressed the personal resilience of 6.1.6
Superintendents and Chief Superintendents. Findings from this survey
are presented in the second part of this chapter. The full report can be
obtained on request from PSAEW.
This survey addressed a range of issues relating to the health and 6.1.7
wellbeing of the Superintending rank. Of particular relevance for the
current focus on questions of sufficiency, capability and motivation are
Police Superintendents’ experiences and opinions in relation to their
attitudes towards their role, their perceptions of training, development
and feedback and their current working demands and availability of
resources.
86
Boag-Munroe, F., Knapper, S. and Elliott-Davies, M. (2015) Police Officers’ Promotion Prospects and Intention to Leave the police service: The mediating effects of perceived organisational support and personal morale, Paper presented at the British Psychological Society’s Division of Occupational Psychology Conference, Glasgow, 7 – 9
th January 2015.
100
PFEW WORKFORCE SURVEY 2014 6.2
Survey Methodology 6.3
The PFEW workforce survey was designed with a view to obtaining 6.3.1
federated rank members’ views on their current pay and conditions,
and their attitudes to their work and the police service in general.
The survey was accessible to members via the PFEW website and 6.3.2
was publicised both centrally and locally through Joint Branch Boards
(JBBs). The total number of responses after data cleansing was
32,606, this represents a response rate of 25.6% across England and
Wales.
In addition to demographic information the survey also gathered 6.3.3
information on individual officers’ pay and pensions. This allowed for
the reporting of breakdowns on pay elements lost by officers under
the Winsor Review and Government public sector pensions’ policy.
As well as questions on overall morale, fairness and attitudes towards 6.3.4
their work and the police service, respondents were asked specific
questions regarding how these various changes to pay and pensions,
and other service wide changes impact on their own morale.
The survey also established information on officers’ views of the 6.3.5
service as an employer, including their own future prospects for
promotion, satisfaction with their training opportunities, working hours,
workload and likelihood of staying in the police service. This gives
some indication of future retention issues.

101
The items used to capture data on key psychological constructs 6.3.6
measured in this survey were derived from pre-existing and pre-
validated scales (for example officers’ psychological contracts87). In
addition, a number of items were adopted from the Armed Forces
Continuous Attitude Survey (AFCAS) (for example relating to
workload and morale), to allow external comparisons to be drawn.
Police workforce profile 6.4
Although demographic information on police officers is collected by 6.4.1
the Home Office, PFEW’s survey captured a range of further
demographic details not presently published at a national level. This
provides further insight into the profile of the current police
workforce88.For example:
65% of Constables are over 35 and 56% have been in their current 6.4.2
rank for over 10 years.
27% of officers have a degree or a higher degree, whilst a further 9% 6.4.3
have other professional qualifications such as accountancy, teaching
or nursing.
36% of female officers are under 35. The proportion of male officers 6.4.4
under 35 is 26%.
Factors such as these are likely to play a role in determining whether 6.4.5
officers feel that their pay and benefits are fair and motivating.
Therefore, if more thorough data were to be collected in this way, this
could have an important bearing on future remuneration policy.
87
Coyle‐Shapiro, J., & Kessler, I. (2000). Consequences of The Psychological Contract for the Employment
Relationship: A Large Scale Survey. Journal of Management Studies, 37(7), 903-930. 88
A comparison of the composition of the survey sample with the actual workforce population based on most recent Home Office/HMIC and PNB Census data suggests that the survey was fairly representative of the workforce as a whole. (Full details of the representativeness analysis are presented in Annex X?)
102
Key findings
Officers’ morale and motivation 6.5
Feeling undervalued by the police service and the public
Two thirds of officers say that they are proud to be in the police. This 6.5.1
is despite the fact that fewer than one in seven officers feel that they
are valued in the police and just under 22% of officers believe that
they are respected by society at large. In addition, only 18% of officers
believe that the police service considers their best interests when it
makes decisions that affect them, and less than 4% feel that the
service cares about their opinions.
Many officers’ comments also highlighted a sense of being an “easy 6.5.2
target” for savings and having been disproportionally affected by
recent public sector cuts. For example, officers told us that:
“I enjoy my job. I wouldn't do anything else. However, not as an
individual but as a whole, I feel the police are undervalued and
unpopular and are therefore easy to mess about financially”.
(Constable, 20 – 25 Years’ Service)
“We are busy dealing with issues in the community and putting their
needs before ours, hoping that someone will take care of our needs.
They say we should see our profession as a vocation, taking pride
and passion in what we do above everything else, and indeed we
should, but it shouldn't be stated in order to cover financial failings”.
(Constable, 10 – 15 Years’ Service)

103
“I left behind a military career to join the Police and I love my job. The
financial aspect of it though is getting worse. I know numerous
colleagues who have left to join the private sector due to far more
attractive pay and conditions. The colleagues that have left were
really good Bobbies. I understand that the country is in a financial
mess, but we have been financially affected too much.”
(Sergeant, 15 – 20 Years’ Service)
“Doing more, but receiving less”
Fairness in the remuneration level overall as well as in recent pay 6.5.3
increases received appears to be a significant issue for a large
proportion of officers. Over two thirds of officers say that they do not
receive fair pay for the responsibilities they have in their job or
compared to employees doing similar work in other organisations.
92% of officers do not believe that they have received pay increases
which maintain their standard of living. For instance:
“I am a manager of both risk and people. Based on the decisions I
make and the number of people I manage my pay would be much
greater in the private sector”
(Sergeant, 10 – 15 Years’ Service)
“The expectation now is to be all things to all people, I am a first aider,
a mental health nurse, a social worker, a teacher and lastly a crime
investigator. I feel that all of the aforementioned groups are rewarded
much more handsomely for the work they do”
(Constable, 5-10 Years’ Service)
“I don't expect a pay rise above inflation but to be increasingly worse
off year on year is neither motivating nor fair.”
(Sergeant 20 – 25, Years’ Service)

104
At the same time as experiencing a real-terms decrease in pay, 6.5.4
officers also report an increase in their workload, with a majority of
officers telling us that they are overworked. 72% of officers have
experienced an increase in their workload over the last twelve months
with 57% now feeling that their workload is too high. In their
comments, officers typically do not see these as separate issues, and
instead have emphasised a sense of “doing more, but receiving less”.
For example:
“I have suffered increased pension contributions, loss of CRTP
(staged), loss of 3k SPP per year on top of my OCU losing 25% staff
and virtually all police staff support. I have to do far more
administrative work to compensate on top of having to cover the work
of the posts lost (3 DI's to 2 DI's on my team) plus a reduction of 8
teams to 6 which means more work, less resources, and more
frequent weekend working.”
(Chief Inspector, 25 – 30 Years’ Service)
Impact of recent reforms on take-home pay
Remuneration is currently a pressing concern for officers. Only 12% of 6.5.5
officers say they rarely think about salary and promotion at the
moment and less than 10% say that they are not concerned about
exactly what they are paid, as long as they can do what they enjoy.
This is perhaps understandable given that 72% of officers also say 6.5.6
that they have been affected by three or more of the recent reforms to
pay and pensions. Officers tell us that these reforms have had a
significant impact upon their take home pay over the last few years:

105
“As a result of losing SPP, a reduction in on-call allowance and
changes to overtime rates I estimate that I have lost 15% of my
income prior to 2010. With salary freezes, a freeze on attaining pay
point 10 for Constable, inflation rises and not to mention just missing
out on CTRP, I estimate that I am 20% a month worse off in real
terms.”
(Constable, 10 – 15 Years’ Service)
“Both my husband and I were in receipt of CRTP, the removal of it has
seen our monthly household income reduce by almost £400 per
month, on top of this we are having to pay increased amounts into the
pension scheme, we are both significantly worse off than we were
before”
(Sergeant, 15 - 20 Years’ Service)
Impact of recent reforms on morale
Personal morale is low for a majority of officers; around three in five 6.5.7
officers say that their morale is currently low. Officers are most likely
to attribute a decline in their morale to changes to remuneration. This
includes reforms introduced as a consequence of the Winsor Review
such as changes in overtime and rest day payments (91%) and the
loss of CRTP and SPP (76%).
A large proportion of officers tell us that pension reforms have also 6.5.8
had a damaging effect on their morale. For example 87% say that the
increase in the normal pension age has reduced their morale and
75% say their morale is lower as a consequence of the introduction of
the Career Average Revalued Earnings (CARE) pension scheme. The
impact of pension changes on morale in particular was repeatedly
emphasised within officers’ comments. For example:

106
“The change in relation to terms and conditions in particular pensions
has had a dramatic impact upon morale”.
(Inspector, 20 – 25 Years’ Service)
“We have had SPP taken from us, CRTP is being taken from us. We
have had a two year pay freeze, a 1% rise last year and a planned 1%
rise this year. In addition to this our pension contributions have
increased two years on the run and are due to increase again in April
2014. We are being forced into a new pension scheme no-one would
choose to join, that sees us working longer to get less out and for less
time. We have been hit in the pocket on all levels and morale as a
result is seriously affected.”
(Sergeant, 15 – 20 Years’ Service).
The number of losses experienced by officers as a consequence of 6.5.9
the Winsor reforms was found to have a significant impact upon their
morale89. Our analysis indicated that there was a significant decrease
in morale for each additional loss experienced, up to four losses90.
However there was no significant difference in the morale of officers
who had experienced four losses, compared to officers who had
experienced five losses91. What cannot be determined from this
analysis however is whether this represents a “floor effect” in officers’
morale or whether further losses would be associated with even lower
morale.
89
(f = 22.62, p < .001), controlling for demographic variables 90
LSD pairwise contrasts, all p values < 0.05 91
(p = 0.88)

107
The proportion of officers who attribute a reduction in their morale to 6.5.10
changes to remuneration is in stark contrast to the proportion who
says that their morale has reduced because of other recent changes
not linked to remuneration, such as higher selection standards (25%)
and introduction of fitness testing (21%). This highlights the fact that
officers are not adverse to change per se, and the majority have seen
some of the recent changes in a positive or neutral light. However
changes to remuneration have had a strong negative impact upon
officers’ morale.
Capability and training: opportunities for training and development 6.6
73% of officers say that they want to be provided with more 6.6.1
opportunities to increase their skills and knowledge, and 51% do not
believe that they receive support when they want to learn new skills.
“I am certainly considering leaving due to the restrictions on training
and my own personal development within the force, which I feel has
been impacted upon by staff cut backs and limited opportunity for
promotion/specialist skills.”
(Constable, 5 – 10 Years’ Service)
Arguably even more concerning than a lack of support for officers’ 6.6.2
longer-term development, over one third of officers say that their force
does not provide sufficient training in relation to their current
responsibilities: 37% say that they do not receive adequate training for
their role and 34% say that the training they receive is not up-to-date.

108
“The main factor currently is the lack of training and the lack of ability
to change role, develop professionally and gain promotion. This runs
parallel to increased responsibility and increased workload. I no
longer feel that I am providing the service I used to provide to
complainants of crime or completing work to the standard that I expect
of myself simply because of lack of resources and time to do so
effectively”.
(Constable, 5 – 10 Years’ Service)
Indicators of future police workforce sufficiency 6.7
Recruitment and retention challenges
15% of officers told us that they are either actively seeking alternative 6.7.1
employment or intend to leave the police service within two years. In
total, two thirds of officers say that they intend to remain within the
service until pension age. Moreover, only one in eight officers would
recommend joining the police service to others. Officers’ comments
reinforce these findings, for example:
“The general feeling amongst officers regardless of service is that
they would leave if given the opportunity. A very large amount of
officers including myself are starting to work/train in other areas with a
view to leaving the service”.
(Sergeant, 10 – 15 Years’ Service)
“As an Inspector with 26 years’ service, I am lucky that some of these
issues do not apply to me, so my own morale is unaffected. However I
once would have recommended policing as a career to others, which I
will no longer do.”
(Inspector, 25 – 30 years’ service)
109
“I graduated university with a Masters [degree] 6 years ago. Since
then most of my classmates earn 50-100% more than I do in the
police. I was aware the pay would be lower when I joined, but not as
low as it is. My pay has been frozen, my allowances and pension cut
and inflation has cut away at what I do earn. I fail to see why anyone
graduating now would consider joining the police, especially now that
the starting salary has been lowered yet further.”
(Constable 3 – 5 Years’ Service)
There is a significant relationship between officers’ morale and their 6.7.2
intention to leave the police service. Our statistical analysis indicated
that for every one unit decrease in morale (measured on a five point
scale from very high to very low), the odds of officers intending to
leave the police service within the next two years increased by 130%92.
Removal of the “Golden Handcuffs”
As noted in section 6.5.8 above, more than three quarters of officers 6.7.3
say that their morale has declined because of recent changes to their
pension. Moreover, the majority of officers (62%) say that they are
dissatisfied with their pension. In addition to the negative impact
pension reforms have had on morale, officers’ responses within the
pay survey indicate that they feel that changes to pensions have
removed the “golden handcuffs” that previously bound officers to the
police service. For instance:
“The changes to the pension scheme have in essence unlocked the
‘golden handcuffs’ I would have retired at 52 years of age on a full
pension. I now have to work until 60 years of age for a reduced
pension. I am actively looking for alternative employment out of the
police.”
(Sergeant, 15 - 20 years’ service)
92
(Exp(B) = 2.30; p < 0.001), controlling for demographic variables.

110
This view is supported by our statistical analysis. Officers who are 6.7.4
dissatisfied with their pension are more than twice as likely to intend
to leave within two years than are officers who are satisfied with their
pension93.
Police Officers’ Psychological Contract with the police service 6.8
A psychological contract refers to the reciprocal exchange relationship 6.8.1
that exists between two parties regarding the mutual obligations
towards each other94. As can be seen in Figure 6.1, police officers’
psychological contracts with the police service are likely to be made
up of many different aspects, including the perceived equity of their
pay and benefits.
Figure 6.1: Content of psychological contract95
93
(Exp(B) = 2.13, p < 0.001), controlling for demographic variables. 94
Guest, D.E. & Conway, N. (2002) Pressure at work and the psychological contract. London: CIPD; Rousseau D.M. (1995) Psychological Contracts in Organisations: Understanding Written and unwritten Agreements. Sage Publication. 95
Herriot, P., Manning, W. E. G., & Kidd, J. M. (1997). The content of the psychological contract. British Journal of Management, 8(2), 151-162.
Responsible and supportive management
Recognition
Equitable Pay
Safe and friendly work environment
Job Security Discretion in
conducting job role
Communication and consultation
Consideration of personal needs
Fairness in HR procedures
Adequate training
Fairness and consistency in
benefits system
Fairness in application of
rules
Psychological Contract
Content

111
The aspects of the psychological contract highlighted in Figure 6.1 6.8.2
above correspond to what researchers have termed the
“transactional” psychological contract, reflecting the sense of whether
or not an organisation has fulfilled their promised obligations in
relation to pay and benefits.96 These obligations are currently
particularly salient to officers in the aftermath of the Winsor Review
and the public sector pay freeze as well as the changes to officers’
pensions. For instance, the following comment is reflective of officers’
views about the elements of their remuneration that have been taken
away from them in recent years:
“The biggest impact for me is that I will now not receive the package
(earnings, pay progression and pension) I signed up for. In simple
terms this is a breach of trust and in any other field would be
tantamount to a breach of contract.”
(Constable with 3-5 years’ service)
Although the losses to pay and benefits officers have recently 6.8.3
experienced represent only one element of their psychological
contract with the police service, it is especially important to take note
of changes that they are likely to represent a significant “step-change”
in the psychological contract officers hold with the Service. Research
suggests that there are certain threshold points in an individual’s
perceptions of the extent to which their psychological contract has
been breached. After these threshold points, further breach of the
psychological contract can have a more negative impact upon work-
related attitudes such as trust and intention to leave97. The losses
experienced by officers as a consequence of recent reforms are likely
to be one such threshold point, any subsequent breaches are
therefore likely to be felt even more strongly by officers in future.
96
Robinson, S. L., Kraatz, M. S., & Rousseau, D. M. (1994). Changing obligations and the psychological
contract: A longitudinal study. Academy of Management Journal, 37(1), 137-152. 97
Rigotti, T. (2009). Enough Is Enough? Threshold Models for The Relationship Between Psychological Contract
Breach And Job-Related Attitudes. European Journal of Work And Organizational Psychology, 18(4), 442-463.

112
Psychological Contract breach and intention to leave 6.9
In addition to determining whether officers’ morale was a significant 6.9.1
predictor of their intention to leave the police service, we also looked
to establish whether officers’ perceptions of their psychological
contact with the police service also predicted their intention to leave.
Measured on a five point scale (with one equalling a wholly positive
perception of their psychological contract and five equalling a wholly
negative perceptions of their psychological contract), for each unit
increase, the odds of officers planning to leave the Police increased
by 89%98.
We also assessed whether psychological contract breach might also 6.9.2
have an indirect effect on officers’ intention to leave by influencing
their attitude towards the police service more generally. The model of
psychological contract breach presented in Figure 6.2 has been
developed by Zhao and colleagues from the combined findings of a
range of prior research studies99. This model shows that a person will
typically respond to a breach in their psychological contract with an
affective (or emotional) response; and it will directly influence attitudes
such as organisational commitment and intention to leave. These
affective responses to psychological contract breach play an
important role in shaping attitudes towards the organisation, which in
turn are key factors in their actual behaviour.
98
(Exp(B) = 1.89; p < 0.001), controlling for demographic variables 99
Zhao, H. A. O., Wayne, S. J., Glibkowski, B. C., & Bravo, J. (2007). The impact of psychological contract breach on work‐ related outcomes: a meta‐ analysis. Personnel Psychology, 60(3), 647-680.

113
Figure 6.2: The impact of psychological contract breach on work‐related
outcomes (adapted from Zhao et al. 2007)
This model can help us to understand the potential consequences 6.9.3
when police officers hold negative perceptions of their psychological
contract with the police service. In particular it can be taken to indicate
that when officers hold negative perceptions of their psychological
contract, they are more likely to report low morale and both this, and
their perception of the psychological contract itself, will prompt them to
ultimately choose to leave the police service.
We applied the model to officers’ intention to leave the Service in 6.9.4
Figure 6.3, and tested the first three steps in this sequence using the
data collected within the workforce survey. Our findings match Zhao et
al.’s model, showing that officers’ perceptions of their psychological
contract directly predicted officers’ intention to leave the Service.
However officers’ perceptions of their psychological contract also
indirectly predicted intention to leave by negatively affecting their
personal morale100.
100
All paths significant at p < .001, controlling for demographic variables
Affect
Psych. Contract
Breach Attitude
Behaviour

114
Figure 6.3: Observed relationship between police officers’ psychological
contracts, morale and intention to leave the police service
This finding is important because it indicates that officers who have 6.9.5
experienced changes to their psychological contract in the recent past
(for example because of the Winsor Review) are more likely to
experience low morale, more likely to plan to leave and thus ultimately
may be more likely to actually leave the police service. A greater
awareness of factors such as officers’ perceptions of their
psychological contract or their morale could be early indicators of
potential workforce turnover.
As we note in the following section, experienced officers are most likely 6.9.6
to have been affected by recent changes, more likely to experience low
morale and more likely to intend to leave the police service. There is
therefore a danger that the Service will lose experienced officers that
are difficult to replace.
Such analysis also demonstrates the value of survey data in evaluating 6.9.7
policy, and the potential for the Home Office to conduct better
workforce modelling and forward planning.
Morale Psych.
Contract Intention
to Leave Leaving
NB, shaded out circles not explicitly tested within the analysis

115
Differences between demographic groups 6.10
Length of service
Mid-career officers are most likely to have been affected by the losses 6.10.1
brought about by recent changes to remuneration. More than eight in
ten officers with between 5 and 15 years’ service have been affected
by three or more losses brought about by either the Winsor reforms or
recent changes to pensions. Many officers’ comments emphasis the
impact that this has had on them, for example:
“I have 11 years’ service now and therefore, was expecting to be on the
top pay scale and applying for my CRTP. I have been frozen on Pay
scale 9 and because I joined in the month of January, will not be on the
top scale until I have 12 years’ service. Financially, I am thousands of
pounds a year down on what I was expecting to be on at this stage of
my career, contrary to what I signed up for.”
(Constable, 10 – 15 Years’ Service)
In particular, the forthcoming changes to the pension scheme have 6.10.2
unsettled officers. Three quarters of officers with between 5 and 15
years’ service say that they are dissatisfied with their pension and 91%
of officers in this group say that their morale has declined because of
the introduction of the CARE scheme.
These changes have the potential to impact on the overall demographic 6.10.3
profile of the service, as the removal of the “golden handcuffs” of a final
salary scheme, and its replacement with a career average scheme
(CARE) in April 2015 is likely to mean that officers are less likely to feel
tied into service. We have seen no evidence that the Home Office has
modelled the likely effect of this.

116
The effect of the losses officers have experienced appears to be 6.10.4
reflected in their morale, and just under two thirds of officers in the 5 to
15 years’ service group say that their personal morale is low. With the
exception of officers approaching pension age, these officers are also
most likely to be intending to leave within the next two years. For
example in the 10 to 15 years’ service group, one in four officers says
that they plan to leave the service. Sample comments include:
“Having 14 years’ service the swap to CARE pension scheme has
made me think about whether to stay in the police. I would consider
leaving the Police for another job, since the retirement age is now no
longer appealing. Having expected to leave at 55 and now staying until
60, paying more into my pension and not receiving the same back, has
left me looking at some of the financial benefits of working in private
industry.”
(Inspector, 10 – 15 Years’ Service)
Statistical analysis indicated that officers with 10 to 15 years’ service 6.10.5
are in fact 97% more likely to plan to leave the service within two years
than officers with under 5 years’ service101. In addition, officers with
between 5 and 10 years’ service are 81% more likely to intend to leave
the police service than their colleagues with under 5 years’ service102.
Rank
Constables are more likely to express lower satisfaction and lower 6.10.6
morale than any other rank. Two out of three Constables are
dissatisfied with their pay, 21% intend to leave the service within two
years and 63% report low personal morale, almost double the
proportion of Chief Inspectors who say that their morale is low. Officers’
comments highlight that a range of factors contribute to these attitudes,
for instance:
101
(Exp(B) = 1.97, p < 0.001), controlling for other demographic variables 102
(Exp(B) = 1.81, p < 0.001), controlling for other demographic variables
117
“Being a Constable for 10 years now I have seen morale gradually drop
and hit the low it is at the moment. More and more officers don't feel
protected either physically, mentally or financially, there are ever
decreasing numbers in terms of officers on the front line which in turn
makes us feel less and less safe and forever chasing our own tails to
get the job done”
(Constable, 10 – 15 Years’ Service)
Our statistical analysis showed that Constables have an increased 6.10.7
odds of intending to leave the police service within the next two years.
In particular, the odds of Constables intending to leave the police
service are 25% greater than their colleagues in the Inspecting ranks103.
A smaller proportion of Sergeants than Constables express low morale 6.10.8
and an intention to leave the service. Nonetheless, just over half of all
Sergeants still told us that their morale is currently low. Moreover, 59%
do not feel that they are paid fairly for their responsibilities and one in
six Sergeants plan to leave the police service within two years.
Sergeants’ comments on the whole indicate a similar set of concerns to
those expressed by other ranks, for example:
“The Abolition of SPP and CRTP reductions including the pension
increases and pension reform and reduction in overtime rates have
made a significant impact on morale. As a Custody Sergeant it is
noticeable that frontline officers have now lost their commitment to this
profession and are not willing to put that little bit extra in that has
always been integral.”
(Sergeant, 20 – 25 Years’ Service)
103
(Exp(B) = 1.25, p < 0.05), controlling for other demographic variables

118
Inspecting ranks are least likely to report low morale and least likely to 6.10.9
plan to leave the service. However issues regarding working hours
were raised by many officers, with Inspecting ranks expressing greater
dissatisfaction with their working hours than other ranks. Over half of
Chief Inspectors and one in three Inspectors said that they are
dissatisfied with their working hours, and more than 80% have seen an
increase in their workload over the last year. For example, Inspectors
tell us that:
“I am working long hours with reducing pay (phasing out of CRTP
payments, no SSP). My staff are paid overtime, I am not. I do not get
time in lieu, but have to negotiate with my command team to claw some
hours back but this will never amount to the extra hours I work. This
reduces my morale considerably, impacts on my home life significantly
and is no doubt affecting my health negatively”. (Inspector, 20 – 25
Years’ Service)
“As a newly promoted Inspector I was amazed at what you lose on
promotion in comparison to the small pay rise. In comparison to other
Public Sector roles, e.g. teaching, and the private sector, pay is poor for
the amount of stress, responsibility and hours worked.”
(Inspector, 5 – 10 Years’ Service)
Benchmarking 6.11
Findings from the PFEW’s workforce survey were compared to results 6.11.1
from the NHS Staff Survey 2013 and the Armed Forces Continuous
Attitude Survey (AFCAS) 2014. Many questions in the PFEW survey
were adapted from the AFCAS survey, and contained essentially the
same wording, albeit there was a need to replace the name of each
Service with the police service. The NHS items differed in wording.
This analysis allowed a certain degree of benchmarking to be
conducted with other public service organisations.

119
Fair Treatment: 44% of police officers in the PFEW workforce survey 6.11.2
disagreed with the statement “I am treated fairly”. This compares to
15% of Armed Forces personnel in the AFCAS 2014 survey who said
that they were not treated fairly. Although the NHS staff survey did not
ask respondents to report on global perceptions of fairness, this
question was asked within the context of career development. In
response to this question, the proportion of NHS staff who said that
they did not receive fair treatment within the context of career
progression was 8%.
Satisfaction with remuneration: Police officers in the PFEW’s 6.11.3
workforce survey were more dissatisfied with their basic pay than
respondents in other public organisations in 2013/14. 51% of police
officers reported that they were currently dissatisfied with their basic
pay, in contrast to 35% of NHS staff and 37% of Armed Forces
personnel.
Workload: 57% of officers in the PFEW workforce survey said that 6.11.4
their workload had been too high over the last 12 months and 72%
said that their workload had increased during this period. When Armed
Forces personnel were asked about their workload in the AFCAS 2014
survey, 46% of respondents said that their workload had been too
high. 44% of employees within the NHS said that they were currently
unable to meet the conflicting demands on their time at work.
Morale: 59% of police officers rated their morale as low in the PFEW 6.11.5
workforce survey. Responses from police officers in 2014 indicate that
morale is considerably lower than in other public organisations.
AFCAS 2014 found that 28% of Armed Forces personnel said their
morale was low. Although the NHS staff survey did not ask staff to
report their morale, only 15% of respondents in this survey said that
they did not look forward to going to work and 8% said that they were
not enthusiastic about their job.
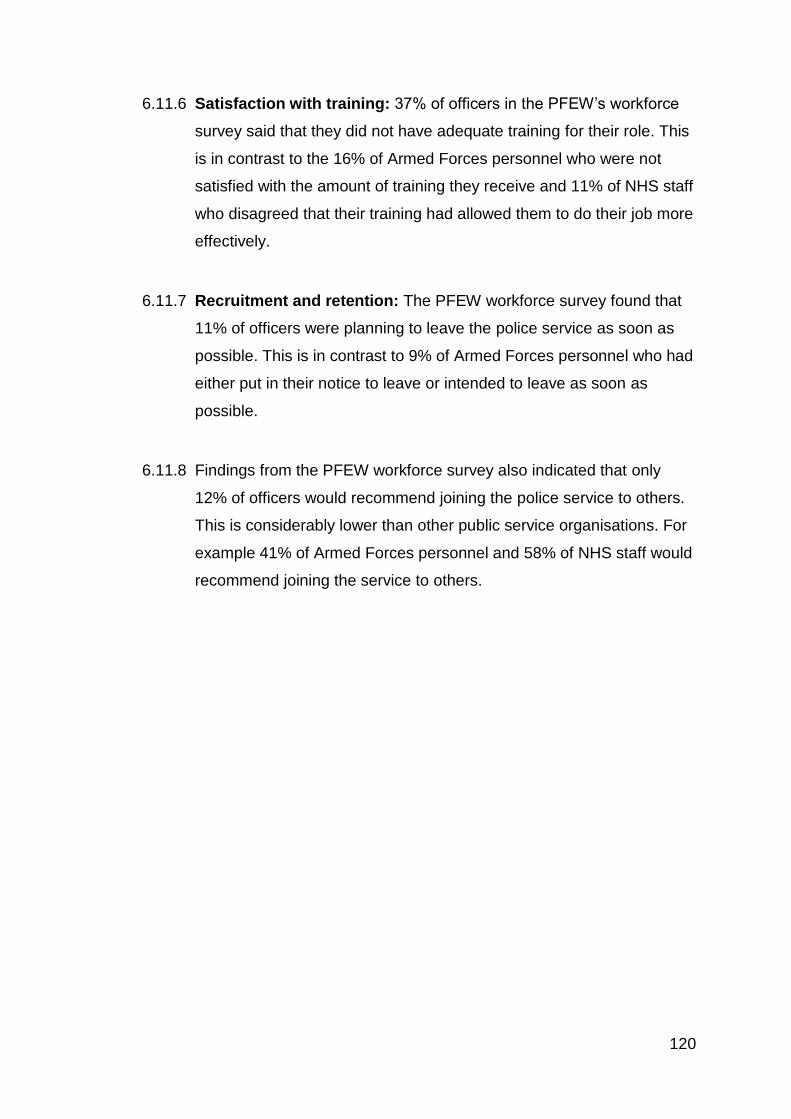
120
Satisfaction with training: 37% of officers in the PFEW’s workforce 6.11.6
survey said that they did not have adequate training for their role. This
is in contrast to the 16% of Armed Forces personnel who were not
satisfied with the amount of training they receive and 11% of NHS staff
who disagreed that their training had allowed them to do their job more
effectively.
Recruitment and retention: The PFEW workforce survey found that 6.11.7
11% of officers were planning to leave the police service as soon as
possible. This is in contrast to 9% of Armed Forces personnel who had
either put in their notice to leave or intended to leave as soon as
possible.
Findings from the PFEW workforce survey also indicated that only 6.11.8
12% of officers would recommend joining the police service to others.
This is considerably lower than other public service organisations. For
example 41% of Armed Forces personnel and 58% of NHS staff would
recommend joining the service to others.

121
PSAEW PERSONAL RESILIENCE SURVEY 2014 6.12
Survey Methodology 6.13
PSAEW’s Personal Resilience Survey was designed to capture 6.13.1
information on the health and wellbeing of the Superintending ranks,
including their working conditions, performance management and
development, and how they feel about their jobs. The survey report is
available in full from PSAEW, on request.
The survey was conducted using an online questionnaire, sent 6.13.2
electronically to all PSAEW members and available for a period of three
weeks. 1,033 responses were received, representing response rate of
81.4%.
This survey is the sixth conducted by PSAEW on this topic, allowing 6.13.3
findings from 2014 to be compared to the findings from previous years.
Key Findings
Motivation and Job Engagement 6.14
92% of respondents said that they get a “buzz” from working in the 6.14.1
Superintending ranks, and that it is exciting and rewarding work.
Moreover, 96% see being in the police service as a vocation, whilst
79% said that being a Superintendent is an important part of who they
are. This indicates that the majority of Superintendents and Chief
Superintendents are engaged within their role and experience a high
level of intrinsic motivation within their work.

122
On the other hand, 55% of respondents said that they work hard 6.14.2
because they don’t want to be seen as weak. This proportion has
increased by 7% since 2009. External pressure to work as hard as
possible therefore appears increasingly to be a motivating factor for
many members of the Superintending ranks. Such pressure however is
a cause for concern, particularly given that 45% of respondents say
that they enjoy their work less now than they did a year ago; and the
proportion of respondents who say that they get a buzz from their work
or see their role as an important part of who they are have both
declined since 2011.
In this regard, respondents also highlight concerns for the recruitment 6.14.3
of new officers to the police service. For instance:
“National changes to policing are undermining the values of the service
resulting in officers joining as ‘just another job and see how it goes for a
few years’ rather than a vocation”.
Training and development: indicators of future workforce capability 6.15
Concerns regarding issues relating to performance management and 6.15.1
development are also highlighted within the survey. 50% of
respondents said that they did not receive helpful feedback on their
performance and only 59% felt that they received all the training they
required to do their job. For example one respondent reported that:
“I have been offered no career development and my PDR was
submitted without me even seeing it or having a chance to comment on
it. Notably there was no development in it”
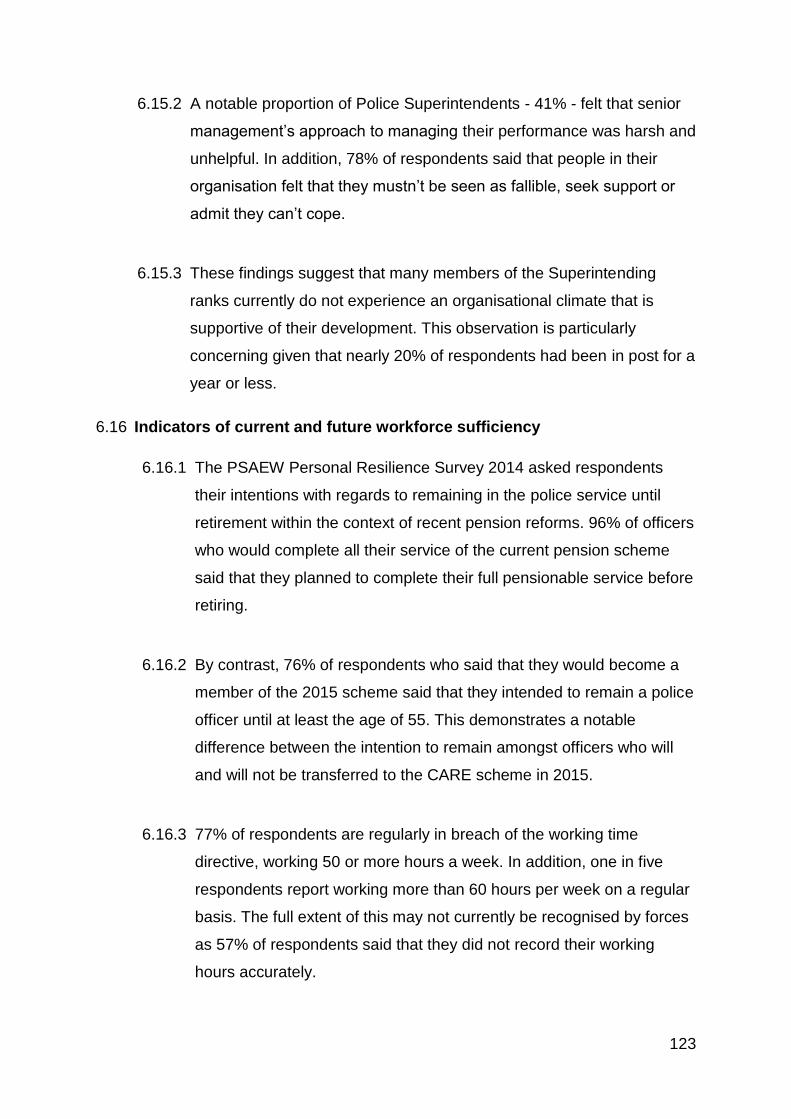
123
A notable proportion of Police Superintendents - 41% - felt that senior 6.15.2
management’s approach to managing their performance was harsh and
unhelpful. In addition, 78% of respondents said that people in their
organisation felt that they mustn’t be seen as fallible, seek support or
admit they can’t cope.
These findings suggest that many members of the Superintending 6.15.3
ranks currently do not experience an organisational climate that is
supportive of their development. This observation is particularly
concerning given that nearly 20% of respondents had been in post for a
year or less.
Indicators of current and future workforce sufficiency 6.16
The PSAEW Personal Resilience Survey 2014 asked respondents 6.16.1
their intentions with regards to remaining in the police service until
retirement within the context of recent pension reforms. 96% of officers
who would complete all their service of the current pension scheme
said that they planned to complete their full pensionable service before
retiring.
By contrast, 76% of respondents who said that they would become a 6.16.2
member of the 2015 scheme said that they intended to remain a police
officer until at least the age of 55. This demonstrates a notable
difference between the intention to remain amongst officers who will
and will not be transferred to the CARE scheme in 2015.
77% of respondents are regularly in breach of the working time 6.16.3
directive, working 50 or more hours a week. In addition, one in five
respondents report working more than 60 hours per week on a regular
basis. The full extent of this may not currently be recognised by forces
as 57% of respondents said that they did not record their working
hours accurately.
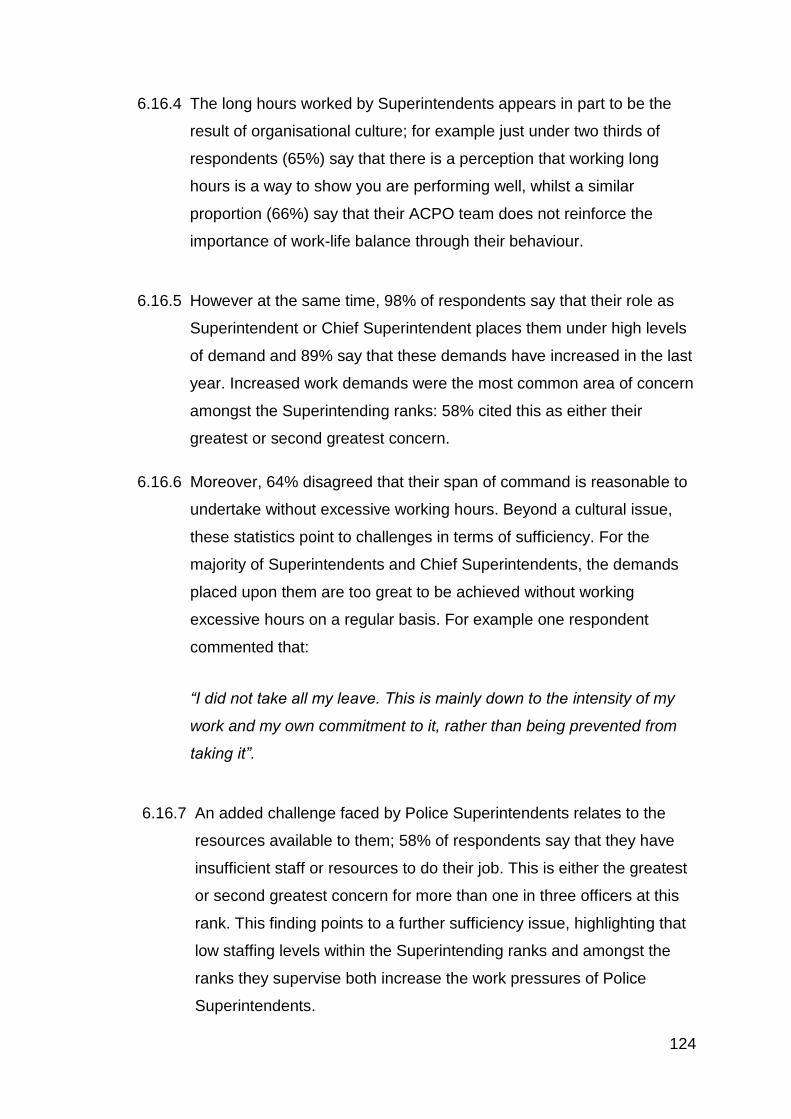
124
The long hours worked by Superintendents appears in part to be the 6.16.4
result of organisational culture; for example just under two thirds of
respondents (65%) say that there is a perception that working long
hours is a way to show you are performing well, whilst a similar
proportion (66%) say that their ACPO team does not reinforce the
importance of work-life balance through their behaviour.
However at the same time, 98% of respondents say that their role as 6.16.5
Superintendent or Chief Superintendent places them under high levels
of demand and 89% say that these demands have increased in the last
year. Increased work demands were the most common area of concern
amongst the Superintending ranks: 58% cited this as either their
greatest or second greatest concern.
Moreover, 64% disagreed that their span of command is reasonable to 6.16.6
undertake without excessive working hours. Beyond a cultural issue,
these statistics point to challenges in terms of sufficiency. For the
majority of Superintendents and Chief Superintendents, the demands
placed upon them are too great to be achieved without working
excessive hours on a regular basis. For example one respondent
commented that:
“I did not take all my leave. This is mainly down to the intensity of my
work and my own commitment to it, rather than being prevented from
taking it”.
An added challenge faced by Police Superintendents relates to the 6.16.7
resources available to them; 58% of respondents say that they have
insufficient staff or resources to do their job. This is either the greatest
or second greatest concern for more than one in three officers at this
rank. This finding points to a further sufficiency issue, highlighting that
low staffing levels within the Superintending ranks and amongst the
ranks they supervise both increase the work pressures of Police
Superintendents.

125
Summary 6.17
PFEW Workforce Survey
Issues of fair treatment repeatedly arise in officers’ responses within 6.17.1
this survey. Officers tell us they don’t want special treatment, they just
want to feel valued and fairly treated.
Extensive changes have been made to officers’ pay and conditions 6.17.2
over the last few years. These changes have affected the take-home
pay of a large number of officers and have often had a negative impact
on morale and motivation. The recent changes to remuneration were
cited as causing morale to decline. For example, 91% of officers said
this was at least in part due to overtime and rest day payments
changes; 76% cited loss of CRTP and SPP; 87% cited the increase in
pension age, and 75% the introduction of the CARE pension scheme.
Our analysis also indicated that there was a significant relationship 6.17.3
between officers’ perceived breach of psychological contract, their
morale and their intention to leave the Service. For example, for every
one unit decrease in morale the odds of officers intending to leave
increased by 130% and for each unit increase in psychological
contract breach, the odds of officers planning to leave the Police
increased by 89%.

126
Comparisons with other organisations such as the NHS and the Armed 6.17.4
Forces suggest a number of areas - including morale, perceived fair
treatment and the proportion of officers’ who would recommend joining
the police to others - which are of particular cause for concern for the
police service. In all cases the numbers of police officers giving
negative responses are substantially higher than in other public sector
bodies. (59% of police officers state they have low personal morale,
compared with 28% of Armed Forces respondents; 44% of police
officers disagree that they are treated fairly, compared to 15% of
Armed Forces personnel; and 12% of police officers would
recommend joining to others, compared to 41% of Armed Forces).
This survey offers a snapshot of morale in the service at this time. 6.17.5
However, by including items specifically about recent changes, it also
allows a measure of the relationship between these and morale, the
psychological contract, and intention to leave. As such it is a valuable
tool for evaluating the policies that have brought about change to pay
and conditions. The Home Office might consider adopting a similar
survey, funded by the employer rather than members. In addition, by
relating policies to likely turnover, the survey offers a way to forecast
manpower levels for the future, and consider recruiting needs and
development needs for those officers who will be needed to replace
leavers.
PSAEW Personal Resilience Survey
On the whole, members of the Superintending ranks report 6.17.6
engagement in, and positive attitudes towards, their role within the
police service. However respondents indicate that the demands and
scope of their role puts them under significant pressure in terms of the
hours they are required to work. This raises questions regarding
workforce sufficiency, which may be underestimated by senior
managers due to Superintendents either under-recording the hours
worked, or not recording them at all.

127
The greatest or second greatest concern for more than one in three 6.17.7
Superintendents and Chief Superintendents is a lack of staff and
resources to do their job effectively. This reflects a further important
workforce sufficiency issue that currently has a notable impact upon the
Superintending ranks.
The findings from this survey also highlight challenges regarding the 6.17.8
development and performance management of Police Superintendents.
A lack of effective support for development could point to future
capability issues; particularly given that almost one in five respondents
had been in post for less than a year.
Questions arising 6.18
Given the importance of survey data in helping to manage the
workforce, and understand the impact of policies, does the Home Office
have any plans to conduct national surveys?

128
7 External context: Government pay policy and impact on police
pay
7.1 Introduction
The Coalition Government’s 2010 Comprehensive Spending Review, 7.1.1
which introduced a substantial 20% real terms cut in central
Government funding to the police service in England and Wales in
the four years from March 2011 to March 2015, impacted on
workforce numbers. This Government has also had a major impact
on police officers’ pay through the Winsor reforms. It is set to cut
police funding by a further 4.9% in real terms for the financial year
2015-16.104These cuts in funding are substantial, given that the
police budget for England and Wales represents only 1.3% of total
public expenditure.105 Police cuts have also coincided with the
Government’s public sector pay policy of a two year freeze on pay
settlements, and further two years of a 1% pay cap.
Below, we set out both the real value of police pay settlements and 7.1.2
the cumulative effects of pay restraint, pay reform and inflation on
officers’ average pay over recent years.
104
HMIC, Policing in Austerity: Meeting the challenge, July 2014, p32 and p128. Available from HMIC website, http://www.justiceinspectorates.gov.uk/hmic/wp-content/uploads/policing-in-austerity-meeting-the-challenge.pdf ; see also Home Secretary’s statement on 2015-16 funding https://www.gov.uk/government/news/spending-round-security-the-foundation-of-prosperity-says-home-secretary 105
Total central government spend on police was £8.8bn in 2012-2013 (also reported by CIPFA in that year), whereas total current public expenditure (Resource DEL plus AME) was £664.5bn for that year, see HM Treasury, Spending Review 2010 (Cm 7942). Available from HM Treasury website, https://www.gov.uk/government/uploads/system/uploads/attachment_data/file/203826/Spending_review_2010.pdf

129
Government pay policy 7.2
Since 2013 Quarter 1, the UK economy has continued to grow in 7.2.1
every quarter resulting in annual growth of 2.7% in 2013 and 2.3% in
the first three quarters of 2014.106 Total growth for 2014 is estimated
by the Office for Budget Responsibility (OBR) to be 3% and 2.4% in
2015107. However, economic improvement has not been felt by
employees, especially public sector employees, where real earnings
have remained suppressed due largely to the Government’s
continuing public sector pay policy.
The Government’s two year pay freeze announced in 2010 covered 7.2.2
all public sector staff by 2011, including the police. This pay freeze
was replaced in 2013 by a pay cap, under which basic pay increases
must not exceed 1% on average. This pay policy has coincided with
a period of relatively high inflation - between 3% and 5%.This
contrasts with an earlier period of pay restraint: in 1993-94 the
Conservative Government stipulated a limit of 1.5% on public sector
pay increases, but that was at a time when the Retail Prices Index
(RPI) for that financial year averaged about 1.7%).108
Income Data Services (IDS) also remarked that unlike many incomes 7.2.3
policies of the past, there has been no attempt to offset control of pay
with stronger control of inflation. In the same article IDS also noted
that initially the Treasury was considering a pay cap of 2%, which
would at least have been in line with the Bank of England’s
Consumer Prices Index (CPI) inflation target.
106
ONS, Gross Domestic Product Preliminary Estimate, Q3 (July-September) 2014, 24 October 2014, table 1, p2. Available from ONS website, http://www.ons.gov.uk/ons/dcp171778_381573.pdf 107
Office for Budget Responsibility, Economic and fiscal outlook, December 2014 (Cm 8966), p58. Available from
OBR website, http://cdn.budgetresponsibility.independent.gov.uk/December_2014_EFO-web513.pdf) 108
IDS, Government incomes policies: past and present, 12 February 2013. Available from IDS website, https://ids.thomsonreuters.com/pay-reward/features-analysis/government-incomes-policies-past-and-present
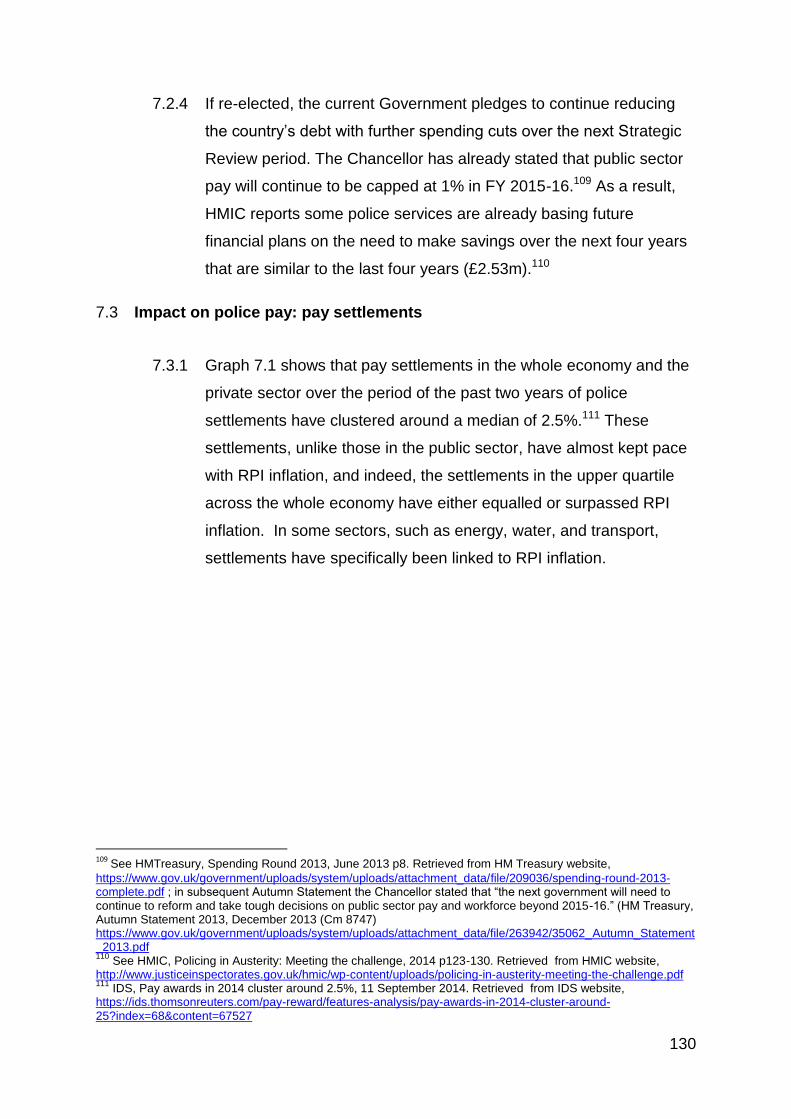
130
If re-elected, the current Government pledges to continue reducing 7.2.4
the country’s debt with further spending cuts over the next Strategic
Review period. The Chancellor has already stated that public sector
pay will continue to be capped at 1% in FY 2015-16.109 As a result,
HMIC reports some police services are already basing future
financial plans on the need to make savings over the next four years
that are similar to the last four years (£2.53m).110
Impact on police pay: pay settlements 7.3
Graph 7.1 shows that pay settlements in the whole economy and the 7.3.1
private sector over the period of the past two years of police
settlements have clustered around a median of 2.5%.111 These
settlements, unlike those in the public sector, have almost kept pace
with RPI inflation, and indeed, the settlements in the upper quartile
across the whole economy have either equalled or surpassed RPI
inflation. In some sectors, such as energy, water, and transport,
settlements have specifically been linked to RPI inflation.
109
See HMTreasury, Spending Round 2013, June 2013 p8. Retrieved from HM Treasury website,
https://www.gov.uk/government/uploads/system/uploads/attachment_data/file/209036/spending-round-2013-complete.pdf ; in subsequent Autumn Statement the Chancellor stated that “the next government will need to continue to reform and take tough decisions on public sector pay and workforce beyond 2015-16.” (HM Treasury, Autumn Statement 2013, December 2013 (Cm 8747) https://www.gov.uk/government/uploads/system/uploads/attachment_data/file/263942/35062_Autumn_Statement_2013.pdf 110
See HMIC, Policing in Austerity: Meeting the challenge, 2014 p123-130. Retrieved from HMIC website, http://www.justiceinspectorates.gov.uk/hmic/wp-content/uploads/policing-in-austerity-meeting-the-challenge.pdf 111
IDS, Pay awards in 2014 cluster around 2.5%, 11 September 2014. Retrieved from IDS website, https://ids.thomsonreuters.com/pay-reward/features-analysis/pay-awards-in-2014-cluster-around-25?index=68&content=67527

131
Graph 7.1: Whole economy and private sector median pay settlements
and RPI inflation, May 2012 to September 2014 (IDS)112
112
Source: IDS Pay Data. Available from IDS website, https://ids.thomsonreuters.com/pay-reward
1.0
1.5
2.0
2.5
3.0
3.5
4.0
Whole economy Private sector
RPI inflation Whole economy upper quartile
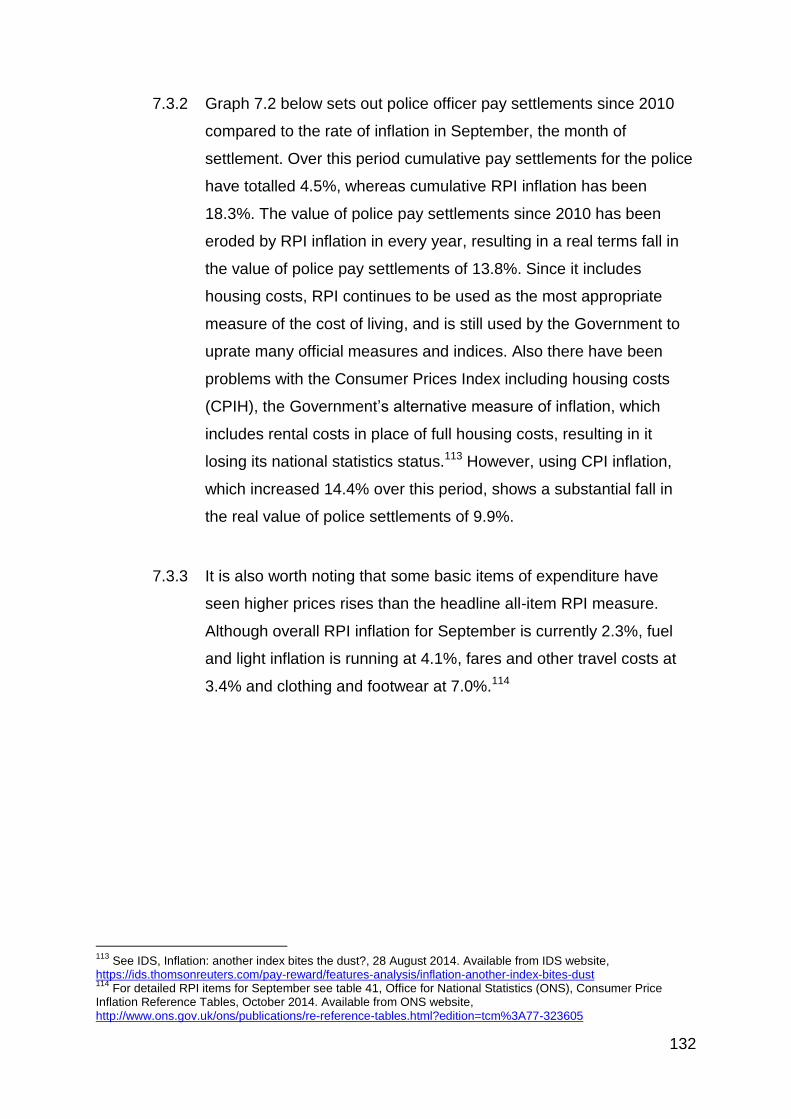
132
Graph 7.2 below sets out police officer pay settlements since 2010 7.3.2
compared to the rate of inflation in September, the month of
settlement. Over this period cumulative pay settlements for the police
have totalled 4.5%, whereas cumulative RPI inflation has been
18.3%. The value of police pay settlements since 2010 has been
eroded by RPI inflation in every year, resulting in a real terms fall in
the value of police pay settlements of 13.8%. Since it includes
housing costs, RPI continues to be used as the most appropriate
measure of the cost of living, and is still used by the Government to
uprate many official measures and indices. Also there have been
problems with the Consumer Prices Index including housing costs
(CPIH), the Government’s alternative measure of inflation, which
includes rental costs in place of full housing costs, resulting in it
losing its national statistics status.113 However, using CPI inflation,
which increased 14.4% over this period, shows a substantial fall in
the real value of police settlements of 9.9%.
It is also worth noting that some basic items of expenditure have 7.3.3
seen higher prices rises than the headline all-item RPI measure.
Although overall RPI inflation for September is currently 2.3%, fuel
and light inflation is running at 4.1%, fares and other travel costs at
3.4% and clothing and footwear at 7.0%.114
113
See IDS, Inflation: another index bites the dust?, 28 August 2014. Available from IDS website, https://ids.thomsonreuters.com/pay-reward/features-analysis/inflation-another-index-bites-dust 114
For detailed RPI items for September see table 41, Office for National Statistics (ONS), Consumer Price Inflation Reference Tables, October 2014. Available from ONS website, http://www.ons.gov.uk/ons/publications/re-reference-tables.html?edition=tcm%3A77-323605

133
Graph 7.2: Police officer pay settlements compared to RPI and CPI inflation, 2010-14
Furthermore, there is evidence that RPI inflation is set to rise to about 7.3.4
3% after 2015. The Conservative Party is committed to continuing
public sector pay restraint into 2015 and 2016 if it wins the next
election, and the Chancellor of the Exchequer has said a future
Conservative Government would continue to restrain public sector
pay beyond 2016. The main opposition party is also committed to
delivering further public spending savings. If the 1% pay cap does
continue for a further two years (2015 and 2016) alongside Office for
Budgetary Responsibility (OBR) projected RPI inflation rates of
approximately 2.3% for September 2015 and approximately 2.9% for
September 2016, the real terms value of a 1% police settlement over
2015 and 2016 would fall a further 3.25%. This would equate to an
overall fall in the value of police settlements of approximately 17%
since 2010. 115
115
Calculated as follows: FY2010-14, -13.75% + FY2014-16, -3.25% = -17%.
0%
1%
2%
3%
4%
5%
6%
2010 2011 2012 2013 2014
Po
lice
pay
ris
e c
om
par
ed
to
Se
pte
mb
er
infl
atio
n
RPI September CPI September Police pay rise

134
In this context, it needs to be remembered that about 50% of all 7.3.5
federated rank officers are already at the top of their scale, and rely
on the annual uplift as their only pay increase.
Impact on police pay: average earnings 7.4
In addition to low pay settlements for the police since 2010, there has 7.4.1
been a two year incremental progression freeze, which was imposed
on the police but not on any other public sector group with the
exception of civil servants in a number of Government departments
where progression was found to be non-contractual.116
Furthermore, there have been actual pay cuts introduced as a result 7.4.2
of the Winsor recommendations on police pay reform. Constables
and Sergeants have had a reduction in some overtime payments. All
federated ranks have lost Special Priority Payments (SPPs) (annual
amounts normally between £500 and £3,000 - exceptionally up to
£5,000). There have been freezes on new applications for
Competence Related Threshold Payments (CRTPs), (annual amount
of £1,212), which have been completely phased out from 1 April
2013. The Superintending ranks have seen the suspension of
performance related bonuses and double increments prior to their
abolition from 1 April 2014.
We have used average nominal pay data from the Police Negotiating 7.4.3
Board (PNB) Census of Earnings and Hours for 2010 to 2013 as the
basis for calculating the fall in average real pay for each federated
and Superintending rank officer. In this calculation 2009-10 was
selected as the base year. We have compared both basic pay and
total pay for full-time officers, as reported in the PNB Pay Census for
each year.
116
See IDS, Pay in Central Government 2012-2013, 25 April 2013. Available from IDS website, https://ids.thomsonreuters.com/pay-reward/features-analysis/pay-in-central-government-201213

135
RPI inflation rates are presented as averages for each financial year, 7.4.4
and are based on the 12 month rate published every month by the
Office for National Statistics (ONS)117 Over the three years following
2009-2010, RPI inflation has been 5.0% for the FY 2010-11, 4.8% for
the FY 2011-12 and 3.1% for the FY 2012-13. Although not
presented here, a similar trend of falling real earnings occurs even
when the CPI inflation figures of 3.5%, 4.3% and 2.7% are used.
It should be noted that this analysis for the period up until March 7.4.5
2013 is likely to understate the current impact on police pay, since it
covers only some of the changes to pay arising from the Winsor
Review. It excludes the impact on earnings of the full effect of the
abolition of SPPs from 1 April 2012 (pro-rated payments continued to
be made until December 2012); the phasing out of CRTPs over three
years from 1 April 2013 (only the suspension of new applications
occurred in 2012-13); the final year (2013-14) of the two year
progression freeze; the final year (2013-14) of the two year
suspension of Superintending ranks’ performance related bonuses
and double increments payments; and the reduced pay scale for new
Constable entrants from 1 April 2013. It also excludes the impact on
police pay of the two year public sector 1% pay cap in September
2013 and 2014.
117
FY average calculated from monthly figures in table 43, Office for National Statistics (ONS), Consumer Price Inflation Reference Tables, October 2014. Available from ONS website, http://www.ons.gov.uk/ons/publications/re-reference-tables.html?edition=tcm%3A77-323605

136
We have attempted to capture this further impact on officers’ pay in 7.4.6
section 7.4.15 below. We have projected forward the pay elements
making up total pay, and removed those that no longer apply in 2013-
14, allowing - where necessary - for the 1% pay uprate for that year.
These figures were then summed to produce an overall estimate of
total pay for 2013-14. We then applied to this figure the average
inflation rate for the FY 2013-14, to arrive at an estimate of the value
of officers’ real pay in that year. It should also be noted that it has not
been possible to estimate further earnings loss, due to the final year
of the progression freeze, nor to take into account the effect on
earnings of the additional on-call payment which came into effect on
1st April 2013. Since this is based on projected figures rather than
actual PNB data for 2013-14, which has still to be collected, we have
reported figures separately for the periods 2010-13 and 2010-14 so
as to avoid any confusion.
Although many of Winsor’s changes to pay are only now having full 7.4.7
effect, we can illustrate the effect of some of the changes effective
from 1 April 2012. For example the two year incremental progression
freeze or suspension started on 1st April that year. Also SPP
payments were abolished at the same time, (although since this was
paid in the calendar year to December 2012 some payments were
made in December for the period January-March). Rest day working
paid at double time was reduced to time and a half from 1st April
2012.

137
Usually there is a yearly increase on average basic pay for each 7.4.8
cohort as officers progress to the next incremental point. But in 2012-
2013 average basic pay (nominal) actually fell -0.51% for Inspectors,
-0.40% for Chief Inspectors, -0.98% for Superintendents and -0.40%
for Chief Superintendents. For Sergeants there was little change
(+0.01%) and for Constables there was a slight increase of +0.81%
as progression continued for those officers on the first three points of
the Constables’ pay scale. Because many other elements of pay are
related to such increases in basic pay (such as overtime and the new
pay element for unsocial hours) nominal total pay also shows decline
– Sergeants’ -0.24%, Inspectors’ -0.53%, Chief Inspector’s -1.02%,
Superintendents’ -0.92% and Chief Superintendents’ -0.19%. Again
Constables’ total pay increased slightly by +0.80%.
The pay of all federated ranks officers was affected by SPPs, and 7.4.9
Constables’ and Sergeants’ by the overtime changes. In the previous
FY 2011-12 the average SPP payment to a member of the federated
ranks was £873 per recipient (averaging £347 per officer in force),
but in 2012-13 this had fallen to £303 (averaging £131 per officer in
force, pro-rata-ed). Likewise, total overtime payments for Constables
fell from £3,152 per recipient (£2,941 per officer) in 2011-12 to
£2,739 per recipient (£2,556 per officer) in 2012-13. There was a
similar reduction for Sergeants from £3,910 per recipient (£3,577 per
officer) in 2011-12 to £3,456 (£3,140) in 2013-14.

138
New pay scales were introduced for Superintendents and Chief 7.4.10
Superintendents from the week of 1 April 2014. The Superintendents’
scale reduced from five to four points, with an increase of around
£1,000 to the top of the scale point. The Chief Superintendents’ scale
remained at three points, but each point was uplifted by around
£3,000. However, funding for these changes came from discontinuing
performance pay for Superintending ranks, and removing the Post-
Related Allowance (PRA) of £5,001 per annum (non-pensionable)
which had been paid to Chief Superintendents in up to 30% of roles.
This meant an uplift for some, but for many experienced officers, in
the most demanding posts, a reduction of approximately £2,000 per
year.
Whilst recent pay changes have impacted on officers’ pay over the 7.4.11
whole period 2010-13, RPI inflation has also reduced the real terms
value of all officers’ pay. We have taken from the PNB Census the
figure for average basic pay and average total pay (nominal) in each
FY year from 2009-10 to 2012-13 for full-time officers in each rank.
We have then calculated the nominal percentage increase from one
year to the next and set this against RPI inflation for each year so as
to arrive at the real terms value of officers’ pay in each year, and
cumulatively across the period. Over this period the recent changes
in pay and inflation have together reduced the real terms value of full-
time Constables’ average basic pay by approximately 6% (from
£31,601 in 2009-10 to £29,665 in 2012-13), and total pay118 by
about 8% (from £38,125 to £35,002 ). The fall in real earnings has
been somewhat less for Constables than other ranks, no doubt in
part due to the first three points of the Constables’ pay scale being
exempt from the progression freeze.
118
Total pay as recorded by PNB includes all additional payments and allowances including replacement
allowance. Total pay includes location payments, London Weighting, all overtime, public holidays, CRTP, SPP, replacement allowance, all other allowances, and since 2013 unsocial hours, overnight allowance and hardship allowance payments. For superintending ranks total pay has also included bonus payments such as performance and post-related payments. Since the 2010 base data excluded ‘other additional allowances’ (dog handler payments etc.), the total pay figure for 2011-13, which included such payments was adjusted accordingly.

139
The real pay of Sergeants and Inspectors fell by a similar amount – 7.4.12
basic by approximately 8% and 9% respectively, and total pay by
approximately 11% for both ranks. Chief Inspectors’ pay fell by about
9% (basic) and 12% (total), whilst for Superintendents and Chief
Superintendents basic pay and total pay both fell by about 9%. For all
federated ranks basic pay fell about 7% and total pay about 9% (see
Graphs 7.3 – 7.6 below)119.
A real terms fall of 8.5% in the average (mean) annual gross pay of 7.4.13
all full-time UK public sector employees based on data from the
Annual Survey of Hours and Earnings (ASHE) suggests that
Inspectors and Chief Inspectors have seen slightly higher falls than
the public sector generally.120
As mentioned above, PNB pay data only goes up to the FY 2012-13, 7.4.14
so it is possible that further erosion of police pay has occurred in the
past 18 months when the below inflation 1% pay cap has been in
operation for the police (September 2013 and September 2014). The
full effect of the abolition of SPPs has yet to be felt (pro-rata-ed
payments were made up until December 2012). The phasing out of
CRTPs has started. There has been a continuation of the 2-year
freeze on incremental progression. The full effect of the suspension
of Superintending rank bonuses will have been felt.
119
ASHE data on Annual Gross Pay in the UK as a whole shows similar falls to those for total pay for two groups
of police officers identified: sergeants and below (although the large number of jobs reported suggests inclusion of police staff) and senior police officers (inspectors and above). ASHE data suggests the pay of sergeants and below fell 10.5% in real terms, whilst senior officers pay fell about 11%. Annual gross pay includes basic, incentive, bonus, overtime and shift pay (see table 14.7a). Available from ONS website, http://www.ons.gov.uk/ons/publications/all-releases.html?definition=tcm%3A77-21502
120
Annual gross pay is close to total pay in that it includes incentive and bonus payments, overtime and shift pay (see above).

140
Graph 7.3: Average basic pay in real terms for federated ranks, 2009-
10 to 2012-13 and 2013-14 (projected) (at 2009-2010 prices)
Graph 7.4: Average total pay in real terms for federated ranks, 2009-10
to 2012-13 and 2013-14 (projected) (at 2009-10 prices)
£20,000
£25,000
£30,000
£35,000
£40,000
£45,000
£50,000
£55,000
£60,000
2009/10 2010/11 2011/12 2012/13 2013/14
Constable Sergeant Inspector Chief Inspector
£25,000
£30,000
£35,000
£40,000
£45,000
£50,000
£55,000
£60,000
£65,000
£70,000
2009/10 2010/11 2011/12 2012/13 2013/14
Constable Sergeant Inspector Chief Inspector

141
Graph 7.5: Average basic pay in real terms for Superintending Ranks,
2009-10 to 2012-13 and 2013-14 (projected) (at 2009-10 prices)
Graph 7.6: Average total pay in real terms for Superintending Ranks,
2009-10 to 2012-13 and 2013-14 (projected) (at 2009-10 prices)
£50,000
£55,000
£60,000
£65,000
£70,000
£75,000
£80,000
2009/10 2010/11 2011/12 2012/13 2013/14
Superintendents Chief Superintendents
£55,000
£60,000
£65,000
£70,000
£75,000
£80,000
£85,000
£90,000
2009/10 2010/11 2011/12 2012/13 2013/14
Superintendents Chief Superintendents

142
Although PNB pay data has not yet been collected for FY 2013-2014, 7.4.15
it is possible to project forward one year from 2012-2013 and
estimate the likely further erosion of officers’ real pay. For this
exercise we have added 1% to all basic pay rates in 2012-2013 and
those other elements of pay affected by the 1% award for September
2013 (i.e. London Weighting, overtime, public holiday pay, and
unsocial hours). On the other hand, we have excluded SPP
payments, Superintendent performance related bonuses and
reduced CRTPs by 25% as per the Police Arbitration Tribunal (PAT)
decision of December 2012121 subsequently embodied in Police
Regulations. From this we can produce a reasonable estimate of
basic and total pay for each rank.
The dotted line in graphs 7.3 – 7.6 represents our estimate of further 7.4.16
decline in officers’ real pay up to March 2014 (before the resumption
of incremental progression on 1 April 2014). Our estimate suggests
that the real terms value of full-time Constables’ average basic pay is
likely to have fallen a further 2% since 2012-2013 (i.e. 8% overall
since 2009-2010). Likewise, Constables’ total pay is likely to have
fallen further by about 3% (i.e. nearly 11% since 2009-2010). Basic
and total pay for other ranks show a similar additional fall in value
since 2012-2013. For example, total real pay for federated ranks as a
whole is estimated to have fallen 11.5% over the whole period, 2010-
14, and Superintendents’ pay by 11.7%. Although not strictly
comparable with PNB data, provisional ASHE data for 2013/14 would
seem to confirm this continued real terms fall in the pay of police
officers (i.e. Sergeants and below, and Inspectors and above)122.
121
Decision of the Police Arbitration Tribunal (PAT): Winsor Report Part 2, December 2012 (ACAS 108/2012-13), recommendation 83 p33. 122
Although ASHE figures for annual gross pay are not strictly comparable to PNB earnings data, the most recent provisional ASHE median pay figures for 2014 confirm a continuing fall in the value of police pay for both sergeants and below (-13.6% since 2010) and inspectors and above (-13,1% since 2010). These figures are slightly higher fall than our estimate for 2013/14 and may also reflect the effect of the second year of the progression freeze, which we were not able to model for in our estimate. Available from ONS website, http://www.ons.gov.uk/ons/publications/all-releases.html?definition=tcm%3A77-21502

143
Pension changes: impact on total and lifetime remuneration 7.5
There have been a number of changes to police pensions, with more 7.5.1
imminent.
The change from a final salary pension scheme to a career average 7.5.2
scheme (Career Average Revalued Earnings: CARE) is perhaps the
most significant. This change means that officers’ pensions will be
worth considerably less in the future, and so their lifetime
remuneration package is significantly reduced. The PFEW survey
demonstrates that this is of substantial concern. Whilst the major
impact will not be on take home salary in the immediate future,
officers are concerned about the overall loss.
Another change to pensions that directly impacts on take-home pay 7.5.3
is the change to the contribution rates. As part of the Government’s
reform of public service pensions, the contribution rates for existing
police pension scheme members increased annually from April 2012
to April 2014. Tiered contribution rates, based on a member's salary,
have also been introduced. Members of the Police Pension Scheme
(PPS) 1987 have therefore seen their pension contributions increase
from 11% in March 2012 to either 14.25% or 15.05% (depending on
salary). Members of the New Police Pension Scheme (NPPS) 2006
have seen their pension contribution increase from 9.5% in March
2012 to between 11% and 12.75%. At the time of writing the Home
Office is consulting with the PABEW on contribution rates from 1 April
2015 for members of the PPS 1987, NPPS 2006 and the new CARE
Police Pension Scheme (PPS) 2015. It is proposed that from 1 April
2015 the member contribution rates for the new CARE PPS 2015
scheme will be between 12.44% and 13.78. So all members are
having to pay more of their salaries into their pensions, and in some
cases the increase has been as much as 4.05%.

144
Summary 7.6
There has been a real terms cut in central Government funding to the 7.6.1
police service in England and Wales in the four years from March
2011 to March 2015. Since 2013 the UK economy has grown in
every quarter, with annual growth of 2.7% in 2013, and 2.3% in the
first three quarters of 2014. The pay policy of a pay freeze and cap
has coincided with a period of relatively high inflation (3-5%). There
has been no attempt to offset control of pay with stronger control of
inflation. In addition, police officers have suffered pension
contribution increases. Pay settlements in the whole economy, and
private sector, in the last two years have clustered around a median
of 2.5%. Many of the settlements have been linked to RPI inflation –
especially in the sectors of water, energy, and transport. So, the
public sector, and policing in particular, is out of kilter with these
sectors.
Over the period since 2010 to now, cumulative police pay settlements 7.6.2
have been 4.55%, whereas RPI inflation has been 18.3%. This has
meant a real terms fall in the value of police pay settlements of about
13.8%. Even comparing pay rises with CPI inflation, which increased
14.4% over this period, shows a substantial fall in the value of police
pay. At the same time, basic items of expenditure have increased:
although RPI was 2.3% in September, fuel and light inflation was
4.1% ; fares and travel 3.4%; and clothing / footwear 7.0% .
If the pay cap continues for another two years, this will result in an 7.6.3
overall fall in the real terms value of police settlements of about 17%
since 2010 (-13.8% plus a further - 3.25% in 2015 and 2016).
The progression freeze was imposed on the police but no other 7.6.4
public sector group. Actual pay cuts have included overtime pay (cut
by £413 per recipient), CRTPs (cut by £303 per recipient from 1st
April 2013), SPPs (loss of £873 per recipient by 1st April 2013.

145
Over the period 2010 – 2014 we estimate that federated ranks have 7.6.5
had a real terms reduction in pay of 11.5%, and Superintendents’ pay
by 11.7%.
Two key changes to pensions have also had a significant impact on 7.6.6
the total remuneration package, particularly over the whole lifetime,
including post retirement. These are the change to a CARE scheme
from a final salary scheme, and changes to contribution rates.
Questions arising 7.7
This above section well illustrates the need for more timely pay data 7.7.1
in the future, which can be made available to all the sides. To date
the collection of data for the PNB Census has always commenced
about eight months after the end of the pay period. This results in the
delivery of the completed data tables about a year after the end of
the relevant financial year. There have often been further delays and
revisions after this date resulting in final data tables appearing up to
one and a half years after the end of the relevant financial year.
Ideally 2013-14 pay data should already be available and we should
not have to rely on an estimate.

146
Recommendations 7.8
Recommendation 4 (remit): In this financial year we ask for an uplift 7.8.1
of 1% for all. This is based on: our recognition of the Government’s
intent, and the need for public sector austerity; and our concern that
there should be no further divisive pay changes, such as increases
for some but not others, without there being an evidence base
modelling likely impact. We also recommend that the economic data
we have provided be considered in future pay uplifts, as
demonstrating the need to make appropriate adjustments when the
UK economy is buoyant. Over the coming years, we recommend that
officers are given pay uplifts that enable them to maintain their
standard of living, rather than falling behind as has been the case in
the last few years.

147
8 The London Lead
Introduction 8.1
The London Lead has existed for approximately one hundred years. 8.1.1
There was variation in the pay for ranks above Sergeant between
forces until the Desborough Report in 1919. This report recommended
standardisation of pay across regions, except for London Inspectors.
Desborough concluded that even though overall the principle of 8.1.2
standardisation of pay was to be desired, there was a rationale for
additional payments to London Inspectors. This was that Inspectors
and Chief Inspectors in London carry a level and a range of
responsibilities not found anywhere else in the UK. This was
subsequently confirmed by the Oaksey Review (1948), the Royal
Commission (1962), the Edmund-Davies Report (1978) and the
Sheehy Report (1993). All these reports endorsed the view that the
job weight of London Inspectors and Chief Inspectors differs by such
a degree that an additional payment is justified. The London Lead
differs from the London Allowance and other regional payments, as it
is justified in terms of the nature of the job rather than the regional
cost of living.
In his Independent Review of Police Office Pay and Conditions, Tom 8.1.3
Winsor Reviewed the London Lead. He considered submissions from
a number of bodies, following which he stated that
“the evidence [was] not conclusive, since, in the absence of a job
evaluation exercise, it is not possible to the accuracy of the argument
that Inspectors in the London forces have significantly greater
responsibilities, spans of control, and workloads than their
counterparts in other forces”.123
123
Winsor, T. (2012). Independent Review of Police Officer and Staff Remuneration and Conditions. Final report, 2. (Paragraph 7.1.278) Retrieved from:
http://webarchive.nationalarchives.gov.uk/20130312170833/http:/www.review.police.uk/publications/part-2-report/

148
Winsor therefore recommended that 8.1.4
“The London Lead for the Inspecting ranks in the London forces
should be maintained in the short-term. The police pay review body
should consider the London Lead in its first review…”
(Recommendation 57)
“when it will have the opportunity of receiving fuller and perhaps more
persuasive evidence on the issue”.124
The case for the London Lead, and PFEW position 8.2
The Inspecting ranks
The Inspecting ranks are of fundamental importance to successful 8.2.1
service delivery. They have a key managerial role and provide a vital
link between senior managers and operational police officers,
ensuring performance delivery.
The Demands of policing London
London itself creates a number of unique policing challenges. London 8.2.2
is among the most densely populated cities in Europe, with a
population of 8.2 million125 – 15% of England and Wales’ population.
In addition to the residents, 790,000126 commute into London for work,
either daily or weekly, while 16.8 million overseas tourists127 and 262
million UK visitors128 come to London annually. It is the most
ethnically diverse city in the UK.
124
Winsor, T. (2012). Independent Review of Police Officer and Staff Remuneration and Conditions. Final report, 2. (Paragraph 7.1.278) Retrieved from: http://webarchive.nationalarchives.gov.uk/20130312170833/http:/www.review.police.uk/publications/part-2-report/ 125
Office for National Statistics. (2011). 2011 Census [Data file]. Available from NOMIS website,
https://www.nomisweb.co.uk/ 126
Ibid 127
Office for National Statistics. (2014). Travel Trends, 2013 [Data file]. Available from the ONS website, http://www.ons.gov.uk 128 Visit England. (2014). The GB Day Visitor: Statistics 2013 [Annual Report]. Available from Visit England’s
website, http://www.visitengland.org/

149
39% of state secondary school children do not speak English as their 8.2.3
first language (this rises to 69% in Tower Hamlets)129. And it is also
home to the major non-Christian religious groups – 57% of England’s
Jewish population live in London as do 51% of Hindus, 38% of
Muslims, 30% of Sikhs and 34% of Buddhists130.
Additionally, there are extremes of socio-economic status across the 8.2.4
city. Although average London household incomes are the highest in
the UK, London also houses the highest proportion of children living in
workless households and in income poverty of any region in the UK.
In 2013 over a fifth of London children (383,000, aged 0-18) lived in
households where at least one adult was claiming a key social
security benefit131. Similarly, it is the region with the highest proportion
of rough sleepers in the UK132 While there are parts of London with
high employment rates, there are also parts where the employment is
lower than in most UK regions. Unemployment is concentrated in the
East End, especially Hackney, Newham and Tower Hamlets. Such
extremes of social and economic experience make for a highly
complex, demanding and sometimes volatile policing environment, as
the August 2011 riots demonstrated.
There are also strategic and tactical demands of policing the capital 8.2.5
city. London is the centre of Government and diplomatic activity; a
global centre of finance; the location of the main royal residences; the
major centre for royal events; a major tourist destination; a major
national and international transport hub; the focus of a wide range of
political demonstrations and protests; the highest profile UK target for
potential terrorist attacks; and a key location for organised crime.
129
Department for Education. (2013). Schools, pupils and their characteristics: January 2013 [Data file]. Available from the Government’s website, https://www.gov.uk/ 130
Office for National Statistics. (2011). 2011 Census [Data file]. Available from NOMIS website,
https://www.nomisweb.co.uk/ 131
Department for Work and Pensions. (2013). Children in out-of-work benefit households statistics: 31 May 2013 [Data file]. Available from the Government’s website, https://www.gov.uk/ 132
Department for Communities and Local Government. (2014). Rough sleeping in England: autumn 2013 [Data file]. Available from the Government’s website, https://www.gov.uk/

150
This working environment requires a distinctive set of decision-making 8.2.6
abilities on the part of the Inspectors and Chief Inspectors who police
the city. The following paragraphs give an illustration of the kind of
work being undertaken by the London Inspecting ranks in some of
those roles.
Counter-terrorist policing
The London area is allocated about 50% of the total UK counter-8.2.7
terrorism budget. This underlines the greater threat which the
Inspecting ranks in London have to deal. The Government’s counter-
terrorist Prevent Strategy133 locates 16 of the 25 ‘priority areas’ in
London. By far the greater proportion of specialist counter-terrorist
police officers are London, and the Metropolitan force leads and co-
ordinates the UK counter-terrorist policing.
Protection-policing
Approximately 1000 officers are permanently devoted to ‘protection-8.2.8
policing’. The Diplomatic Protection Group covers 190 embassies and
diplomatic missions with 6000 diplomats (and their 16,500
dependants). Nearly all of this work involves Inspectors running
armed teams on 24/7 schedules.
Public order policing
The preservation of social order is regarded as the fundamental 8.2.9
function of an effective police force. The August 2011 riots and looting
demonstrated how fragile this can be. These riots required virtually all
of the Metropolitan Police Service and City of London Inspecting
ranks to work round the clock for almost two days, with extended
tours of duty thereafter.
133
Home Office. (2011). Prevent Strategy. Retrieved December 11, 2014, from
https://www.gov.uk/government/uploads/system/uploads/attachment_data/file/97976/prevent-strategy-review.pdf

151
London routinely hosts a wide variety of public events. Examples 8.2.10
include the Notting Hill Carnival; football matches involving 15 major
football league clubs; numerous political protests, trade union
demonstrations and other protest events. All such events require pro-
active public order policing, involving strategic and tactical planning.
The Inspecting ranks conduct the key operational roles in this.
Serious crime policing
Approximately 19% of all crime was committed within the London area 8.2.11
in the year to June 2014134. There were 207,000 arrests during 2012-
2013135, each of which has to be recorded, processed and regularly
reviewed according to a rigid set of bureaucratic routines in order to
ensure ‘due process’. The Inspecting ranks are responsible for
ensuring the integrity of this process.
London is also a focus for extensive serious and organised crime. The 8.2.12
Metropolitan and City forces have a number of highly specialised
teams dedicated to particular forms of crime. The City specialises in
financial and economic crime, such as fraud. The Metropolitan has
specialised units covering armed robberies (the Flying Squad);
kidnapping; drug dealing; people and sex trafficking; and child abuse
– which includes a sub-unit dealing with paedophile crimes. It is
important to understand the complexity and variety of such
specialised units and their workloads. For example, there are 18 Child
Abuse Investigation Teams each dealing with about 100 referrals per
month, all requiring extensive investigation and sensitivity. It is not
unusual for Detective Chief Inspectors to oversee the investigation of
between 1000 and 2000 crimes while supervising some 450 officers
while Detective Inspectors supervise between 20 and 70 officers.
134
Office for National Statistics. (2014). Crime in England and Wales, year ending June 2014 [Data file]. Available from the ONS website, http://www.ons.gov.uk 135
Home Office. (2014). Police powers and procedures England and Wales 2012 to 2013 [Data file]. Available
from the Government’s website, https://www.gov.uk/

152
Comparisons with CID operations in other forces are problematic 8.2.13
without an independently conducted research project.
Daily response policing
A typical response team Inspector supervises 45-50 officers (rising to 8.2.14
60 on night-shift). These supervisory ratios are believed to be
considerably higher than elsewhere. Although the Metropolitan has a
similar proportion of Inspectors to other forces, a far higher
percentage are abstracted for specialist duties (as detailed above).
Although comparisons are not easy, there are indicative data which 8.2.15
suggest that London Inspecting ranks routinely carry a significantly
greater workload than elsewhere. Over one weekend (25th-28th
March, 2011), the Metropolitan Police received 4443 calls requiring an
‘immediate response’. This is an average of 139 calls for each
operational command unit. During the same time-frame, South
Yorkshire dealt with 642 such calls averaging 107 calls per command
area while, in Northumbria, the average was 21 calls per response
Inspector.

153
The PFEW position 8.3
The PFEW believes that the pay system should demonstrate 8.3.1
organisational justice. Officers in significant management roles should
be rewarded appropriately for their skills, knowledge, attributes, hours
worked, sacrifices made, responsibilities, span of command, and the
risks and demands of the job. We agree with Winsor’s position that
these should be properly evaluated, through a systematic job
analysis. In order to fully evaluate whether there are differences
between forces or regions, including London, this would need to be
conducted in a number of locations and statistically reliable
comparisons made. PFEW is not aware of any such study, although
there has been a study conducted on behalf of the Inspectors’ Branch
Boards of the Metropolitan and City of London Police Federations136
that assesses the work-related well-being, job-satisfaction, and burn-
out of the Inspecting ranks in the capital compared to other major
cities and the rest of England and Wales. This study concludes that
Inspecting ranks in the capital work more hours; have more rest days
cancelled; experience a greater impact on work-related well-being;
and have lower job satisfaction. These are indicators of significant
differences between the roles of Inspectors in the capital and
elsewhere. It is not clear from the study what the exact links are
between these largely wellbeing related outcomes and job content,
and we believe that relationship is worthy of further exploration:
however, as an indicative study we believe this work is notable.
We believe that definitive work to assess the difference in job content 8.3.2
between London and elsewhere is the responsibility of the
Government Department in charge of policing: the Home Office. We
do not believe it should be left for officers themselves to fund the
collection of such data, via the PFEW.
136
Cookson, G., and Williams, P, King’s College London: Investigating the London Lead, Final Report August
2014.

154
Until such time as data are collected as part of a formal job 8.3.3
evaluation, we do not believe that there is a case for removing the
London Lead, and there is some evidence through the Cookson and
Williams study that the Inspecting role in London differs from that
elsewhere. To remove the London Lead would save the Home Office
an insubstantial amount of money, (approx. £3,400,000 assuming
1,700 Metropolitan Inspectors) but would cause considerable hardship
to those officers who are currently in receipt of the payment. In
addition, the removal of this payment might have unintended
consequences, such as turnover of Inspectors. As the job market
improves in London, officers in the Inspecting ranks are leaving for
other jobs. The PFEW Metropolitan Inspectors’ Branch Board is able
to give examples of Inspectors who have left to join security
businesses, particularly in Canary Wharf, for significantly higher
salaries. Such turnover is costly to the service in terms of experience
loss, and the need to train replacements.
PFEW are not aware of any studies undertaken to gather either 8.3.4
qualitative information from Inspectors as to their likely reaction to
such a change, nor quantification of the likely cost-benefits. We would
expect to see this information before removal of this payment is
considered.
Summary 8.4
The London Lead has been reviewed in the past, and on each 8.4.1
occasion has been continued because the role appears to be different
in London compared to other regions.

155
The Metropolitan Inspectors’ Branch Board argues that 8.4.2
The London Area is the most complex and demanding policing
environment in the UK; and many of the problems are rarely
encountered elsewhere.
Policing in London demands a far wider range of specialised units
and technical skills than are found elsewhere in the UK. Some units
are unique to London and, in consequence, the Metropolitan and
City forces have evolved to become a national and international
resource of policing expertise.
The levels of responsibility, spans-of-control, complexity of
problems and the workloads of the London Inspecting ranks are far
in excess of those experienced by colleagues elsewhere in the UK.
We believe the pay system should demonstrate organisational justice. 8.4.3
Officers in significant management roles should be rewarded
appropriately for what they do.
We acknowledge that Winsor stated that the demands of the role 8.4.4
should be properly evaluated. We believe that to comply with Winsor’s
proposal, a study needs to be conducted systematically comparing
London policing to other forces and regions. PFEW is not aware of
any such study. We believe that such a study is the responsibility of
the Home Office: it should not be left to officers themselves to fund
such work, through contributions to PFEW.
Until such time as data are provided that provide a formal evaluation, 8.4.5
we do not believe there is a case for removing the London Lead. To
do so would further contribute to perceptions of unfairness in the pay
system, and would cause considerable hardship to those officers
affected.
156
Questions Arising 8.5
Have the Home Office conducted an evaluation comparing the role
of the London Inspectors to others?
What data does the HO have on this?
What kind of evaluation, if any, is planned?
Recommendations 8.6
Recommendation 5 (remit) is that the London Lead should be 8.6.1
retained. It should be uplifted by 1%, in line with other elements of the
remuneration package.

157
9 Regionalisation of pay: Observations
Introduction 9.1
In this year, we have been asked to provide “observations on the level 9.1.1
and scope of existing arrangements for differentiation of officer pay
and allowances at the regional and local level”. 137
Existing arrangements and their derivation 9.2
The current framework for police officers’ pay includes five location-9.2.1
based payments:
London Allowance and London Transitional Supplement,
London Weighting,
South East England Allowance,
South East England Transitional Supplement.
London Allowance is payable to members of the Metropolitan police 9.2.2
service and City of London Police at a rate determined by the
Commissioner or force with regard to location and retention needs.
The maximum rate is £4,338 a year, for those appointed on or after
September 1994, and not receiving a replacement (housing)
allowance. It is £1,011 per annum in other cases. It is non-
pensionable.
London Transitional Supplement is paid to members of the City of 9.2.3
London or Metropolitan Police who joined before September 1994 and
who receive a replacement allowance equivalent to housing
allowance. It is a maximum of £1,000 a year.
137
PRRB Remit Letter, from the Home Secretary, the Rt Hon Theresa May MP, to David Lebrecht, Chair of the PRRB, dated 3
rd November 2014.

158
London Weighting is part of pensionable pay for Metropolitan and City 9.2.4
of London Officers. It is currently £2,325 per annum, and is
pensionable.
South East England Allowance and South East England Transitional 9.2.5
Supplement were introduced in 2001.138 The South East Allowance
for officers appointed on or after 1 September 1994 and not receiving
a bonus allowance was originally set at £2,000 annually in forces
bordering the Metropolitan police service i.e. Essex, Hertfordshire,
Kent, Surrey and Thames Valley, and at £1,000 in Bedfordshire,
Hampshire and Sussex.
The South East Transitional Supplement is an allowance paid to 9.2.6
officers joining prior to 1 September 1994, and receiving half rate
housing allowance or flat rate transitional rent allowance in
Hertfordshire, Kent, and Surrey. The allowance increased payment of
half rate housing allowance or flat rate transitional allowance in these
services to a maximum of £2,000.
From April 2013 Chief Constables have had discretion over whether 9.2.7
to pay officers regional allowances. This applies to all regional
allowances other than London weighting.
The most recent Pay Census data covers the period April 2012 to 9.2.8
March 2013. It is not yet possible to tell whether Chief Constables
have exercised their discretion to pay these allowances: this will
become clearer in the next Pay Census data, when new starters from
April 2013 will show in the data set.
138
Home Office Circular 11/2001 implemented on 1 April 2001 introduced the SE Allowance, and HO Circular 39/2001 introduced the SE Transitional Supplement. Both implemented 1 April 2001. See also Reg. 34 Annex U, para 6 in The Police Regulations 2003 (amended 2012).

159
The London Weighting and Allowances were originally intended to 9.2.9
compensate for the higher cost of living in the capital. Over time,
these have also been said to be necessary for recruitment and
retention purposes.
The South East Allowances were brought in in 2001 partly in 9.2.10
response to the fact that services around London were losing officers
to the Metropolitan police, as they were attracted by the higher
salaries there.
Winsor appeared to be in favour of a zoning approach, but with uplifts 9.2.11
to base pay rather than as allowances. This has been implemented
within some Government departments (Ministry of Justice,
Department for Work and Pensions). Based on the example from
Winsor, Gloucester and Northants would receive the same allowance
as Sussex and Kent).
It is also worth noting that the Metropolitan Police and City of London 9.2.12
police offer concessionary travel for officers. However, this is being
phased out. There is concern that this may have an impact on
recruitment and retention, especially when the high costs of housing
in the area are considered.
What is known about the benefits of the existing system? 9.3
Generally speaking, there are numerous systems for regionalising 9.3.1
pay. These include payment of allowances, and incorporating extra
payments into the existing basic pay. Regional pay systems can
range from centrally controlled systems (e.g. zones or regional
allowances) to fully devolved systems, with control over pay
arrangements vested in local employers.
160
The police services in England and Wales, therefore, essentially have 9.3.2
a system of four zones, these being London, two South East zones,
and the rest of England and Wales.
This is similar to other roles in the public sector, where the most 9.3.3
common approach is to use a national pay structure with additional
payments to compensate for cost of living in London and the South
East.
To the best of our knowledge, there has been no systematic, formal 9.3.4
evaluation of the benefits of the existing police system, relating the
extra payments to numbers and calibre of recruits, and numbers
retained, nor to incumbents’ perceptions of fairness of pay. It is
therefore difficult to justify any changes to the existing arrangements.
Further, we are not aware of any analysis to check whether the 9.3.5
introduction of the two zones of South East Allowance was successful
in preventing haemorrhaging of offers to the Metropolitan Police.
What do other organisations do? 9.4
In schools, there are separate pay scales for London and the ‘fringe’ 9.4.1
around the capital, and there have been changes to these in recent
years to reflect recruitment and retention difficulties in London and the
South East.

161
In the prison service, ‘locality’ payments were introduced in 2001 to 9.4.2
replace the previous system of London weighting and London
allowances, as there were recruitment and retention difficulties on the
fringes surrounding London. The number of zones was progressively
increased from three to four in 2003, and then to six in 2006.
However, the Prison Service Pay Review Body (PSPRB) expressed
concerns about the operation of the locality payments. We understand
that in 2012 the National Offender Management System (NOMS)
proposed replacing the existing Locality Pay Allowance with a basic
national pay range with London enhancements: inner and outer
London scales being respectively £3,800 and £2,500 a year higher
than the national scale. Both NOMS and the unions requested that
those proposals be given an opportunity to 'bed in' before considering
whether any additional local pay flexibilities are needed. The Prison
Service Pay Review Body supported that view139 and recommended
implementing the NOMS proposals before further consideration.
139
Author Peter Knight, Prison Service Pay review Body Report on Local Pay in England and Wales 2012, pub. The Stationary Office,. (2012)

162
At the Department for Work and Pensions (DWP), under a structure 9.4.3
introduced in 2001, in addition to the inner and outer London and
national pay scales, there is a separate ‘specified location pay zone’,
meaning that there are four zones in total. There are also separate
pay scales for specialist roles.
In 2007 a new structure was introduced at the Ministry of Justice 9.4.4
based on five zones: ‘inner London’; ‘outer London and SE hotspots’;
‘hotspots’, ‘national plus’ and ‘national’. Under an agreement reached
in 2010 the national band was effectively removed and the number of
bands was reduced to four.
The NHS reached an agreement in 1998 to bring in local pay under 9.4.5
the “Agenda for Change”140. However, in recent years we understand
that consequences arising from the localised system have meant that
a shift away from localisation and pay has become more centralised.
Other systems that balance central and local control of pay include 9.4.6
flexible grading (used for police staff) and indexing systems (linked to
local market conditions). However, key considerations in any change
to existing arrangements would be whether these offer less flexibility
than the existing schemes, and whether the administrative burden is
likely to be increased.
Work conducted by Incomes Data Services141 suggests that the 9.4.7
differentials between regions outside London in known localised
systems tend to be insubstantial.
140
Reported in Incomes Data Services, An Examination of Location-based Pay, Contribution / Performance- related Pay and Comparability of Police officers’ Pay. (2011). 141
(ibid)

163
Other factors in pay systems 9.5
It is inappropriate to consider the issue of regional pay in isolation 9.5.1
from other potential features of the pay system. For example, other
organisations sometimes take into account performance, skills,
market pay, or competency related pay. Many of these have been
considered for the police service, and dismissed as inappropriate.
For example, it is worth noting that the police currently operates a 9.5.2
system where pay is based on rank rather than on skills. This is in
order to ensure deployability between roles and forces (when there
are mutual aid or collaboration requirements, for example). It is an
important consideration that officers are posted into roles rather than
choosing for themselves, and this can be expected to contribute to the
perception that rank based pay is a fairer mechanism than some
others might be.
That said, following the Winsor Review, the service has accepted a 9.5.3
system that will be partly competency based. Constables, for
example, will be subject to assessments to access spine points 4 and
7 of the pay scale.
In essence, then, evolving police pay system is a hybrid one already, 9.5.4
incorporating length of service (experience), competency, and
regional pay. However, some of these elements are new or subject to
very recent change (competency elements, and discretionary regional
allowances). It will be important to properly evaluate the impact of
these changes before introducing any additional change.
164
Risks of further pay regionalisation 9.6
An Uncoordinated approach
We believe, however, that the devolution of policing that has already 9.6.1
occurred in Scotland, and Northern Ireland, and the anticipated
devolution of policing in Wales (following the Silk Commission, and
the vote on 3rd December 2014 to implement the six Silk
recommendations on policing, including the devolution of pay142),
means there is a likelihood of further regionalisation. We are
concerned that this could happen in an uncontrolled way, with
Scottish and Welsh police services setting their rate independently of
the English services. Regional pay zones can create “cliffs” which can
pull people away from neighbouring regions: the services that border
Scotland and Wales could lose officers to them. This is a
phenomenon that is well-recognised in regional pay systems: Clarks,
for example, conducts regular reviews to try and avoid stores
“cannibalising” staff against one another. It has already happened in
policing, with the Metropolitan Police attracting officers from
surrounding forces, resulting in the South East Allowances.
There is, therefore, a danger that the services that border Scotland 9.6.2
(Northumbria, Cumbria) and Wales (Cheshire, Shropshire,
Hertfordshire, and Gloucestershire) will, if unchecked, suffer from a
loss of officers to Scotland and Wales.
142
The Silk Commission’s Part 2 Report (March 2014), Chapter 10.

165
Furthermore, the overall impact on the pay bill is likely to be a rise. 9.6.3
Local pay determination can increase the possibility of salary “arms
races” where regions look to pay more and more to be attractive to
applicants and “creep” as regions pay more to compete with
neighbouring areas with higher rates of pay. Paying different
individuals different amounts for the same role can be particularly
challenging when there is cross-jurisdictional working. This leads to
difficulties in terms of what rate to pay, and could lead to different
team members being paid different rates. It can also lead to
interoperability issues.
Operational Effectiveness
There is a further danger to the operational effectiveness of policing, 9.6.4
posed by regionalisation of pay: that is that officers will be unwilling to
take part in mutual aid for forces where the rate of pay is lower than
their own. Collaboration between forces may also be affected, as
officers being paid different rates to work on the same cases, doing
the same tasks, may feel aggrieved.
Equality issues
It must be recognised that any regional pay system would need to be 9.6.5
“equality proofed” with care taken to ensure that those with protected
characteristics are not adversely affected.
In particular, there is greater pay inequality within the private than 9.6.6
public sectors, modelling public sector pay on private sector
assumptions could undo the work done to ensure equal pay within the
public sector.
166
Devolving pay decisions to a local level is likely to decrease 9.6.7
transparency and increase mistakes and omissions which increase
the likelihood of equal pay challenges, particularly if data is not
available at a local level to justify decisions.
Administration and Governance
Any form of devolved decision making (i.e. any system other than a 9.6.8
UK wide framework) would need appropriate administration and
governance to support it. This is likely to include consultation and
dispute resolution mechanisms. The costs in terms of time and
resources have the potential to be greater than any savings made
from reductions to the salary bill. It will be worth monitoring the cost of
running a PNB in Scotland alongside the PRRB.
It should be remembered that the pay of officers has a legal basis, 9.6.9
and is set out in Regulations and Determinations. This is partly to
protect officers because they are not employees. It means that
officers are able to have recourse to legal action should pay not be
administered in accordance with the Regulations. This adds an
additional layer of complexity to the likely costs and resources needed
to administer any further regionalisation of pay.
Furthermore, depending on the system of regionalisation, there may 9.6.10
also be a need to take into account local labour market conditions,
and benchmark salaries against these, or local cost of living. Again,
this is likely to create extra administrative burden, and a need for
specialist Human Resources skills, that might offset any potential
savings.

167
Summary 9.7
There are a number of allowances currently paid to officers in London 9.7.1
and the South East.
London payments were originally to compensate for the higher cost of 9.7.2
living. They have subsequently been said to assist with recruitment
and retention. The South East payments arose because officers were
being drawn into the Metropolitan force at the expense of surrounding
forces.
We know of no formal, systematic evaluation of the benefits of the 9.7.3
existing system, relating extra payments to numbers and calibre of
recruits, or numbers retained. Until such an evaluation is conducted,
we believe it is inappropriate to change the existing system, other
than to give an appropriate uplift.
There are a number of risks in regionalising pay. The biggest for the 9.7.4
police currently is that the devolution of policing – and pay – to
Scotland and Wales will result in loss of officers from bordering
services to either Scotland or Wales (or, indeed, vice versa)
depending on which service sets the higher salaries.
There is a need to consider mutual aid, collaboration, and 9.7.5
interoperability in any regional pay system in policing.
Further regionalisation would need to take into account equality 9.7.6
concerns.
The need for appropriate administration and governance processes to 9.7.7
be set up is likely to be costly and offset any intended saving. This is
especially true for police pay, which is set out in Regulations.

168
Questions arising 9.8
There is a clear need to evaluate the existing regional allowances. 9.8.1
This evaluation might consider:
What is the intention of the allowances?
To what extent are they successful (e.g. what role do they play in
attraction and retention)?
What do other organisations aiming to recruit and retain similar
calibre of personnel do?
What is the basis for the value of the allowances? 143
More broadly, similar analysis should be undertaken for the whole of 9.8.2
England and Wales. In particular:
Are there regions where recruitment and retention are particularly
challenging?
If so, what is the role of pay in this?
Finally, the biggest risk in regionalisation of pay currently is that the 9.8.3
devolution of pay in policing to Scotland, and potentially Wales, will
create an uncoordinated approach. This could adversely affect
deployability, and could impact on the recruiting and retention to
forces along national borders. It could cause pay drift, in the same
way that the introduction of allowances for the Metropolitan Police
Service ultimately meant that surrounding zones needed to be given
allowances to ensure recruitment and retention. For that reason we
ask:
What consideration has the Home Office given to this issue?
143
Some of these questions have been suggested by the National Crime Agency Pay review Body’s recommendation regarding whether allowances payable for specialist and technical skills should be introduced.
169
What work has been done, on behalf of bordering forces, to
evaluate likely impacts, and any requirements for pay uplifts there?
Recommendations 9.9
Recommendation 6 (remit) is that the current regional allowances 9.9.1
should be retained, until such time as an evaluation is undertaken of
these. In the meantime, an uplift commensurate with the overall uplift
is recommended: that is, an uplift of 1%.

170
SECTION 4: THE FIVE YEAR REMIT
In this section, first, we discuss issues that we originally requested be included in the
remit letter. We believe that in the next five years there is a need to ensure the pay
system reflects a number of considerations. It should:
attract and retain officers who are representative of the public served;
be designed to ensure officers believe there is organisational justice;
be designed based on evidence of need, and what works;
facilitate deployability to a range of roles and requiring a range of skills;
appropriately recognise the skills, knowledge, attributes, and workload
required.
As a first step, we would like to see a clear statement from the Home Office of the
aims for the pay system: what it should achieve, and how monitoring against these
aims will be conducted in the future. In the next five years, the Home Office should
adopt an evidence based approach to workforce planning, and remuneration, with
comprehensive, transparent, and reliable data; modelling of proposed changes in
advance; and monitoring of recent changes for their impact.
At the earliest opportunity within these five years, we ask that officers’ loss of income
caused by the pay freeze and inflation be redressed.
Second, we also discuss those aspects of pay and conditions that have been raised
by the Home Office for consideration in the next five years. These are:
On-call allowance
The gap between Constables’ and Sergeants’ pay scales, and between
Inspectors’ and Chief Inspectors’ scales
Buy-out of Sergeants’ overtime
Management of officers on limited duties, and the value of the deployment
component of the x-factor
The feasibility of attaining greater coherence between the terms and
conditions of police officers and police staff
Third, we raise a number of other issues that we believe are outstanding, and
worthy of monitoring over the coming five years. These are:
The Constables’ pay scale (for officers joining after 1 April 2013)
Pay progression
Skills thresholds
Away from Home Overnight allowance
Motor Vehicle Allowance
Equality issues

171
10 The Remit Letter – five year considerations
Introduction 10.1
The Home Secretary’s remit letter asked for the Review Body’s 10.1.1
comments on priorities for a five year programme including some
issues deferred by the Winsor Review for the PRRB’s consideration.
This chapter is in three parts. 10.1.2
It begins by outlining our overarching priorities for the pay system 10.1.3
overall, and what aspects of the remuneration system we would like to
be reviewed as a priority over the coming 5 years. Second, we then
provide comments on the priorities for a five year programme
highlighted in the remit letter. Third, we list further additional specific
areas of concern that we would wish to see included in the five year
work programme.
The Winsor Review (2012) amounted to a wide-ranging overhaul of 10.1.4
police officer terms and conditions. The past few years have been
characterised by significant change for officers, the full impact of
which remains to be seen. Many changes to officers’ pay and
conditions have already been made but some issues, such as
threshold assessments and limited duty, are still to be implemented.
The recent changes, while comprehensive, have not necessarily
resulted in consistency or clarity regarding the intent behind some
elements of the remuneration package. We believe that further major
change – unless backed up by robust and transparent evidence -
would be unpalatable at the present time and would not be in the
interests of the service.

172
PFEW and PSAEW overarching concerns for the coming five years 10.2
We believe that any further change that is not fully evidence based 10.2.1
will have a further impact on officers’ perceptions of organisational
justice. (See Chapter 6).
We believe there is a need to ensure the pay system reflects a 10.2.2
number of considerations:
it should attract and retain officers who are representative of the
public served;
it should be designed so as to ensure officers believe there is
organisational justice within the system;
it should be designed based on evidence of need, and what
works;
it should facilitate deployability to a range of roles and requiring a
range of skills;
it should appropriately recognise the skills, knowledge, and
attributes, and workload required.

173
As a first step, we would like to see a clear statement from the Home 10.2.3
Office of the aims for the pay system: what it should achieve as a
whole, and how elements within it contribute to that, and how
monitoring against these aims will be conducted in the future. We
believe that a strategic overview is needed, and it may be that overall
direction may be aided by the work of the ACPO Workforce Planning
Business Area, as well as other initiatives.
We believe that there are a number of anomalies within the current 10.2.4
system, and that these need to be addressed in a systematic manner.
Some of these have been raised as concerns in discussions of the
topics that the PRRB has already been asked to consider. For
example:
It is not clear what the rationale is that underpins the basic pay. It
certainly has not kept up with inflation, and it is not clear how it
compares to jobs with similar skills, knowledge, and attributes
requirements.
A related point is that the current system whereby pay is largely
rank based, with spine points, assumes that the same drivers
underpin pay for all ranks: this may not be the case. Those in
different ranks have very dissimilar career expectations, and the
roles may vary to differing extents. Similarly, the service needs to
encourage different career patterns (e.g. to encourage many
Constables to have whole careers at a single rank, but to
incentivise a very small proportion of officers to aim for ACPO
ranks), and this may not be best achieved by the current system.
It is not clear what is being rewarded by some elements of
remuneration. For example, the components of the x-factor are not
clearly elucidated, and the rationale for some elements of the
remuneration package means they are not necessarily distinct.

174
In the recent past it would appear that some elements of the
remuneration system have been changed without due
consideration being given to the impact on the overall
remuneration package. Consideration does not seem to have
been given to whether adequate ameliorative action is needed to
continue to recruit and retain the appropriate calibre of officers, to
maintain a perception of organisational justice and fairness in the
system, and to motivate officers. An example is the introduction of
the CARE scheme.
Perhaps the best way to explain some of these concerns is to outline 10.2.5
some current and emerging career pattern and pay drivers for two
ranks: Constables and Superintending ranks. These have been
chosen as being the ranks at the lower and upper end of the
promotion and pay spectrum of officers represented in this
submission. However, the argument also applies to other ranks, and
we believe is consistent with our recommendations on issues such
consideration of the gaps between rank pay scales.

175
Constables
Constables form the vast majority of the police service: around 77%. 10.2.6
This means that most officers serve their entire careers as
Constables. Because the service requires so many, and because it is
efficient for them to be experienced and to be representative of the
public served, it is appropriate for the pay system to encourage
retention of officers willing to remain at this rank for their whole career.
That is why the PFEW was keen to ensure as many officers as
possible have access to the top of the Constable pay scale, rather
than limiting it to specialist skills, as Winsor recommended. All are
required to be able to fulfil the 10 units of the Policing Diploma, and to
have the required knowledge, skills, and attributes for competent
performance of the associated tasks. In recognition of the fact that
police services need to ensure that Constables (and other federated
ranks) are widely deployable, the newly designed skills thresholds
include reassessment of the 10 Policing Diploma components.
Overtime is paid, so that services can have a flexible workforce willing
to undertake extra duties and cope with surges of demand. The pay
system also recognises that experience is vital, and that professional
development is expected: again, the design of the skills assessments
recognises this.
Key changes for Constables have included reduction in their numbers; 10.2.7
and the need to investigate different types of crime (e.g. fewer
traditional crimes such as burglary, but more crimes such as sexual
violence). It would be appropriate to consider whether the changing
workload requirements and skills needed are adequately rewarded.

176
In summary, then, the pay system needs to reward long service and 10.2.8
experience as a Constable; protect deployability and flexibility on
behalf of services, (and this can mitigate against having a system that
only rewards certain skills); and encourage development throughout
the whole career. The changing workload and skills requirement also
needs to be considered: but a particular tension exists within the set
of factors that drive pay, between the need to maintain deployability
and flexibility, and the need to reward skills.
Superintending ranks144
Superintending ranks make up less than 1% of the police service. 10.2.9
Officers in these ranks have experienced at least four promotions
through the ranks, and can therefore be expected to be driven, and
motivated by the potential for still further career progression. Yet the
likelihood of promotion has been much diminished in recent years
both by the reduction in numbers of Chief Superintendent roles, and
Chief Officer ranks above these. Furthermore, this will be exacerbated
by the introduction of Direct Entry Superintendents and Chief
Constables, for these recruits will take up a proportion of the
remaining promotion opportunities. Consideration needs to be given
as to whether this loss of opportunity, and the motivation promotion
prospects afford, needs to be balanced by a positive change in the
remuneration system.
144
The case made here for reviewing the Superintending ranks’ remuneration is endorsed by both the PSAEW and the Superintendents’ Association of Northern Ireland (SANI).

177
The austerity measures have affected the numbers of Superintending 10.2.10
ranks disproportionately, with a reduction in their numbers of
approximately 25% in just over three years. This has resulted in
significant changes to many roles. Like the Constables,
Superintending ranks have had to deal with the changing landscape
of policing, including changing crimes, that has come from largely
external pressures such as social and economic change, and
increased scrutiny and accountability. However, they have also had
to deal with the managerial issues associated with changes resulting
from internal pressures, such as restructuring, downsizing,
collaboration, and regionalisation. Firstly, a number of police services
have eliminated the Chief Superintendent rank, meaning that some
Superintendents are performing roles previously filled at a higher
rank, and with a higher salary. Additionally, in many services, there
has been a devolvement of responsibility of those functions
traditionally carried out at Chief Officer rank to members of the
Superintending ranks. Secondly, a number of services have also
changed either away from the BCU structure, which was a consistent
model of policing across the UK, and created a force-wide functional
model of command, or, where the BCU model has been retained,
BCUs have been merged to create larger commands or “super-
BCUs”. One of the consequences of these two actions is that there is
now much more variability in the range of responsibilities and spans
of command undertaken by officers who are designated as being at
the same rank, and on the same pay scale. The data provided at
Table 2.2 show that Superintendents can have spans of command
covering several hundred officers and staff, or several thousand; they
may have overall responsibility for protecting vulnerable people, or
responsibility policing large and complex territorial policing areas, and
in some cases, they have jurisdictions that are larger than those of
some Assistant Chief Constable / Commander ranks. This suggests
two key issues that need to be addressed within the pay system for
Superintending ranks: the significant and changing skills and
responsibilities required; and the variability. It cannot be right that

178
salary is only determined by length of service in the rank, and that all
roles currently designated at these ranks attract the same salary
levels, despite these variations. We believe that, whilst rewarding
experience in the rank is important, the system of remuneration
needs to recognise the differing requirements of roles, to ensure
fairness; to incentivise officers to undertake the more arduous roles;
and to help to ensure that Superintendents are incentivised to
develop their skills ready for the next stage of their career. Within the
current system, why should any Superintendent with comparatively
narrower responsibilities move to a role with much broader and more
demanding responsibilities? There is no additional reward for so
doing, yet the service as a whole could lose out by failing to
incentivise people to develop further. Likewise, why should officers
below the rank of Superintendent currently apply for a promotion, if
the only roles available are those with extremely high and increasing
workloads and requirements, (perhaps even previously designated as
Chief Superintendent) yet the pay differential is the same as for roles
where the requirement is less? It is crucial for the service as a whole
that officers aspire to the rank of Superintendent: otherwise talent is
wasted and the service to the public is diminished. This needs to be
recognised in the reward system.

179
A related point is that the pay system needs to be adequate to attract 10.2.11
candidates of the required calibre to be Direct Entry Superintendents.
The purpose of the direct Entry scheme is to attract high performing
individuals with a proven track record of leadership and delivery into
the police service at a senior level. The selection process for the
initial cohort of the Direct Entry scheme attracted nearly 900
applicants, but resulted in fewer than 10 appointments, far fewer than
required. This is an unusually high number of unsuitable candidates.
One explanation might be that the salary was in line with the
expectations of candidates of lower experience and calibre than the
roles required. Work needs to be undertaken to understand the
expectations of Direct Entry applicants with regard to pay, and to
benchmark the remuneration package for this rank with that offered in
roles with comparable responsibilities.
The forthcoming pensions’ changes will also have a disproportionate 10.2.12
impact on Superintending ranks. Pension is deferred salary, and, as
such, is an important part of the remuneration package. The CARE
scheme calculation as career average instead of final salary means
that instead of rewarding officers who have reached Superintending
ranks with a salary based on their last years’ service, the pension will
be determined by how long the officer took to get to the higher ranks.
For Superintending ranks, the reduction will be significant. Officers
will be expected to contribute approximately 13.7% of their salary, but
will receive a pension worth approximately 20% of their final salary.
Under the 1987 scheme officers contribute 15.05% of their salary to
receive a pension worth approximately 66% of final salary. This
reduction can be expected to create a considerable disincentive for
highly able people to remain for a full career and achieve this rank.
180
In summary, some key drivers for the pay system for Superintending 10.2.13
ranks include: the need to reward the additional responsibilities they
face due to reducing numbers; increasing spans of command;
changes in legislation; increasing scrutiny and accountability (e.g.
protecting vulnerable people, covert investigations) and the level of
personal / professional risk that brings; devolvement of
responsibilities from higher ranks; and the need to acknowledge the
variation in roles at the same rank, caused by the creation of super-
commands and the reduction in numbers, and elimination - in some
services - of the Chief Superintendent rank. Additionally, the
remuneration system must be able to attract Direct Entry
Superintendents of an appropriate calibre. There is already a
suggestion that it currently cannot. Finally, whilst the impact of the
CARE scheme will be felt by all, the impact is disproportionate on
higher ranks who will lose more of their pension benefits when
viewed as a proportion of their salary.

181
Conclusions 10.3
There is a significant challenge in designing a pay system that 10.3.1
addresses these drivers appropriately at each rank. We believe this
must be explicitly addressed, and would like this to be a priority within
the 5 year remit.
We believe the lack of clarity over what is being rewarded by some 10.3.2
elements of remuneration leads to perceptions of unfairness. In some
cases, this may even result in legal challenges. We are concerned
this may be the case with regard to the x-factor calculation. With
regard to some regional allowances, the rationale has blurred over
time: are they intended to compensate for cost of living, or particular
aspects of the roles, or both? We would like to see a clear statement
of what is rewarded by each element of the remuneration system.
This should be linked to a job evaluation so that there is transparency
over whether all aspects are rewarded appropriately. This should be a
priority within the next 5 years.
We are concerned that the significant losses to members that may 10.3.3
occur as a result of the introduction of the CARE scheme should be
adequately compensated for in the remuneration package.
Consideration should be given to this at the earliest opportunity.
182
Pay uplifts in the next five years 10.4
In chapter 7 we noted that pay settlements since 2010 have totalled 10.4.1
4.55%, with RPI at 18.3%.The continuation of the pay cap in 2015 will
exacerbate this. Between 2010 and 2013 RPI has reduced the value
of Constables’ pay by about 6%.
Whilst we acknowledge that in this year the Pay Review Body has 10.4.2
been required to keep within the Government’s 1% cap, we believe
that this policy is likely to damage the service’s ability to recruit and
retain officers of an appropriate calibre. We recommend that the
economic data we have provided be considered in future pay uplifts,
as demonstrating the need to make appropriate adjustments to
ensure officers are not left behind others when the UK economy is
more buoyant. We ask that the PRRB consider this at the earliest
opportunity, and certainly as a priority within the five year plan.
Summary: Our overarching priorities for the next five years 10.5
The recent changes to the pay system have been wide-ranging. We 10.5.1
would not wish to see further turbulence caused by changes that are
not evidence based. However, we believe that officers deserve a
remuneration system that attracts and retains officers who are
representative of the public served; ensure officers believe there is
organisational justice within the system; is based on evidence of
need, and what works; facilitates deployability to a range of roles and
requiring a range of skills; appropriately recognises the skills,
knowledge, and attributes, and workload required

183
We believe existing anomalies in the system need to be addressed. 10.5.2
These include the need for a clear rationale for each element of the
remuneration package, and a comparison to jobs with similar
knowledge, skills, and attribute requirements; consideration of the
appropriateness of pay for differing ranks, and whether a single spine
point based method for each rank addresses the different
organisational and personal drivers of pay; and consideration of how
changes to one element impact on the package overall, and its
efficacy.
We ask that the Home Office gives a clear statement of the aims of 10.5.3
the pay system; what it should achieve as a whole, and how elements
contribute; and how changes will be monitored in future. In earlier
chapters we made a case for an evidence based system with
transparent, comprehensive, and reliable data.
Until this has been achieved, we ask that the economic data we have 10.5.4
provided be used at the earliest opportunity to make appropriate
uplifts to ensure officers are not left behind when the economy is more
buoyant, and when the current cap of a 1% uplift is removed.
The Home Secretary’s remit letter: list of priorities 10.6
The Home Secretary’s remit letter outlines a number of changes, 10.6.1
largely introduced as a result of the Winsor Review. We agree that
some of these should be priorities: including the on-call allowance;
and the management of officers on limited duties and the value of the
deployment element of the x-factor. (Others that we would like to see
included, but currently are not, are the fairness of the Constables’ pay
scale; pay progression; skills thresholds; and equality issues).
There are also a number of issues included in the current five year 10.6.2
remit that we do not believe should be priorities.

184
On-call 10.7
The Staff Associations have lobbied for an on-call allowance for some 10.7.1
years, to compensate officers for the restrictions placed on them for
being on-call. Officers on-call must remain contactable, geographically
located so that they can respond quickly, and fit for duty at all times.
This can place restrictions on the officer’s family too. Another
consideration was to encourage police services not to use on-call
unnecessarily, causing undue disruption to officers’ lives.
Winsor recommended that a national on-call allowance for the 10.7.2
federated ranks should be introduced, with £15 paid for each daily
occasion of on-call, after the officer in question had undertaken 12 on-
call sessions in a year. A national on-call allowance was introduced
on 1 April 2013 following a Police Arbitration Tribunal (PAT) in 2012
which modified Winsor’s recommendations, removing the requirement
for 12 unpaid sessions. The award was based on an assurance by the
Official Side that on call would remain a voluntary not a mandatory
activity.
The PAT commented on the paucity of reliable data on the incidence 10.7.3
of on-call and said that the matter should be reviewed two years after
being introduced, in the light of progress made on data collection.
Winsor also recommended that the allowance should be reviewed by 10.7.4
the new Police Pay Review Body in its first triennial review, when
better management data would be available.
Evidence jointly gathered by the Official and Staff Sides of the PNB in 10.7.5
2008 from a sample of forces found that on average officers in on-call
roles were placed on-call on 50 to 60 occasions during the course of
the year, but in some forces the average was as high as 130
occasions.

185
Prior to its abolition many forces used Special Priority Payments 10.7.6
(SPPs) to compensate officers for being on-call. SPPs were paid at a
rate of £500-£3,000 per annum. These have now been abolished.
In 2011 an on-call allowance was introduced for police officers in 10.7.7
Scotland, at a rate of £23 per session, with no qualifying sessions.
The guidance that accompanied the introduction of the allowance in 10.7.8
Scotland requires forces to give full and fair consideration to both
welfare and operational requirements before a role can be identified
as having an on-call requirement. No such framework exists in
England and Wales.
We are not aware of further work by the Home Office to consider 10.7.9
whether the on-call allowance has been successful in reducing the
usage of on-call, nor whether the allowance is considered by
recipients to be fair recompense. Nor are we aware of any work to
determine whether the differing arrangements in Scotland are more
appropriate.

186
Summary 10.8
In summary, therefore, we believe that the use of on-call should be 10.8.1
reviewed in the light of clear management data and that this should be
done as a priority. We do not believe there is any evidence that £15
per on-call session sufficiently incentivises officers to undertake on-
call voluntarily, nor that it provides sufficient disincentive for forces to
rely on the use of on-call in order to help achieve a reasonable work-
life balance for officers.
Questions arising 10.9
For the Review Body to consider this matter the following questions 10.9.1
would need to be addressed:
How many officers are required to be on-call, how often, by
what rank, by role, by gender, by other protected
characteristics, full time/part time?
Are officers on-call on rest days, public holidays, annual leave
days, free days?
How are roles designated as having an on-call requirement?
Have forces undertaken an EIA on on-call roles?
Has use of on-call reduced since the introduction of the
allowance?
Has it remained voluntary or how many roles have an on-call
requirement included in the person specification for the role
thus blurring the lines between voluntary and mandatory?

187
Recommendation 7a 10.10
PFEW recommends that the use of on-call should be reviewed in light 10.10.1
of clear management data as a priority, that the rate of the allowance
should be reviewed and consideration be given to an annual uprating
mechanism and a national framework for the operation of on-call.
The gap between Constable and Sergeant pay scales and between 10.11
Inspector and Chief Inspector scales
The PRRB has been asked to give initial comments on increasing 10.11.1
the gap between Constable and Sergeant pay scales and between
Inspector and Chief Inspector scales.
In his review, Winsor stated that pay differentials should reflect the 10.11.2
changes in the weight of the job and serve as a sufficiently attractive
reward to encourage the best candidates to seek promotion into a
more demanding rank. We agree with this statement. As part of the
psychological contract any pay system must feel fair and pay must be
commensurate with the requirements of a job, the skills that officers
possess and the weights of the jobs they do.
Constable to Sergeant
Sergeants are the first managerial rank in the police service and are 10.11.3
crucial to the effectiveness of policing. Sergeants are taking on
greater managerial and leadership responsibilities particularly given
the changes to incremental progression arrangements and linking
pay to performance. Currently, the difference between the
Constables’ maximum and the Sergeants’ minimum is £1,272, a gap
of 3.4%. (The gap between the top of the Constables’ and the top of
the Sergeants’ scale is 12%).

188
Inspector to Chief Inspector
The difference between the Inspectors’ maximum and the Chief 10.11.4
Inspectors’ minimum is £1,059, a gap of 2%.The gap between the top
of each scale is 6%. There is anecdotal evidence that this gap does
not reflect the job weight for the Chief Inspector role, however it is
unclear what robust evidence exists to support this view.
It would be helpful if the Home Office could clarify why it has 10.11.5
identified these two particular gaps and explain what evidence it
holds on job weighting by rank, vacancies, promotions and
benchmarking data that would enable the PRRB to consider this
matter.
We contend that these gaps should not be looked at in isolation. It is 10.11.6
important that the pay scale is considered in its totality from
Constable through to Chief Inspector, and on to Chief Superintendent
and above. This would require a proper evaluation of roles on a rank
basis to establish relative job weightings taking into account the skills,
knowledge and aptitudes required and an examination of
benchmarking data to better understand whether these gaps are
typical.
In view of the changing nature and roles of the Superintending ranks, 10.11.7
we would also wish to review whether the difference between their
current pay scales and the remuneration of Assistant Chief
Constables / Commanders is appropriate – particularly when the non-
pay benefits of the latter are taken into account. (Albeit it is accepted
that these vary between police services).

189
Summary 10.12
It is unclear why the differentials between these roles have been 10.12.1
chosen for consideration. We do not believe it is appropriate to look
at these differentials in isolation.
Questions arising 10.13
Why have these roles been selected for consideration? Is
consideration being given to differentials across the pay system?
Has the Home Office gathered data to determine whether the pay
differentials are sufficient to encourage officers to aim for promotion,
or are they a disincentive?
How can the gaps between pay scales be quantified in the absence of
systematic job evaluation, taking into account the skills, knowledge,
and aptitudes required in each rank?
How can the gaps between pay scales be qualified in the absence of
comprehensive benchmarking data?
Recommendation 7b 10.14
We recommend that the gap between the Constables’ and Sergeants’ 10.14.1
pay scales and the Inspectors’ and Chief Inspectors’ pay scales
should not be considered in isolation. The total pay scale end-to-end
needs to be considered based on comprehensive job weighting and
benchmarking data.

190
Buy-out of Sergeants’ casual overtime 10.15
The Review Body has been asked to consider whether there is a 10.15.1
case for the buy-out of Sergeants’ casual overtime and whether it
should be a priority in the five yearwork programme.
When Winsor referred to casual overtime in his recommendation he 10.15.2
included all overtime payments paid at time and one third (i.e. not
payments for working on rest days, public holidays or free days). This
is different to the way in which the term casual overtime is generally
used in the police service.145
We assume that in this case the PRRB has been asked to consider 10.15.3
the buy-out of all overtime paid at time and one third. However, we
would like clarification.
We believe that overtime is a necessary consequence of the nature 10.15.4
of policing work and that utilising existing officers in this way helps
reduce the need to recruit more officers. Overtime is often the most
efficient way of dealing with immediate needs and providing
resources for emergency or public order situations. The bill for
overtime for Constables and Sergeants is approximately 4% of the
officer pay bill and 20% of that is made up of overtime paid to the
Sergeant rank. The total cost of overtime for Sergeants is
approximately £55.5 million per year. Not all officers receive this, but
those who do receive an average of £3,400 per year.146
145
Casual overtime usually refers to overtime when an officer is not informed at the start of their shift that they will be required to stay on at the end of their shift. (In such circumstances the first half-hour is not paid, on the first four occasions in a week: this is known as the half-hour disregard). 146
These figures are calculated from the Office of Manpower Economics, PNB Census of Earnings, Hours and Length of Service. Data available from PFEW on request.

191
Winsor stated that there is a lack of available data from which to 10.15.5
calculate the rate of an overtime buy-out for Sergeants. He did not
consider the available data to be sufficiently robust to recommend a
change in his report. However, he recommended that the Annual
Data Returns from forces should include separate breakdowns of
overtime hours worked, and total overtime spend for Constables and
Sergeants. Whilst data returns do now breakdown overtime by rank it
is not possible to distinguish types of overtime undertaken by
Sergeants alone.
We argue, however, that the monetary value should not be the sole 10.15.6
criterion when considering the buy-out of Sergeants’ overtime. This
would require the collection and analysis of overtime data to identify
the drivers for overtime and what overtime is predictable, and data
regarding the potential impact on officers’ workloads and work-life
balance.
Previous overtime buy-out 10.16
An overtime buy-out has already been implemented within the 10.16.1
Inspecting ranks and has resulted in unforeseen consequences that
have had a detrimental effect on Inspectors and Chief Inspectors.
The Time for Justice Report (2012)147 highlights some serious 10.16.2
concerns resulting from the buyout. Overtime pay was ‘bought out’ of
Inspectors’ contracts in 1994, in essence removing the entitlement to
payment for overtime, as well as compensation for working public
holidays and rest days. This was in return for a £3,000 increase in
pensionable pay148.
147
Turnbull, P., & Wass, V. (2012). Time for Justice? Long Working Hours and the Well-Being of Police Inspectors. Cardiff Business School. Retrieved from: http://www.polfed.org/documents/Time-for-Justice-report-low-res.pdf 148
Turnbull, P., & Wass, V. (2012). Time for Justice? Long Working Hours and the Well-Being of Police Inspectors. Cardiff Business School. Retrieved from: http://www.polfed.org/documents/Time-for-Justice-report-low-res.pdf
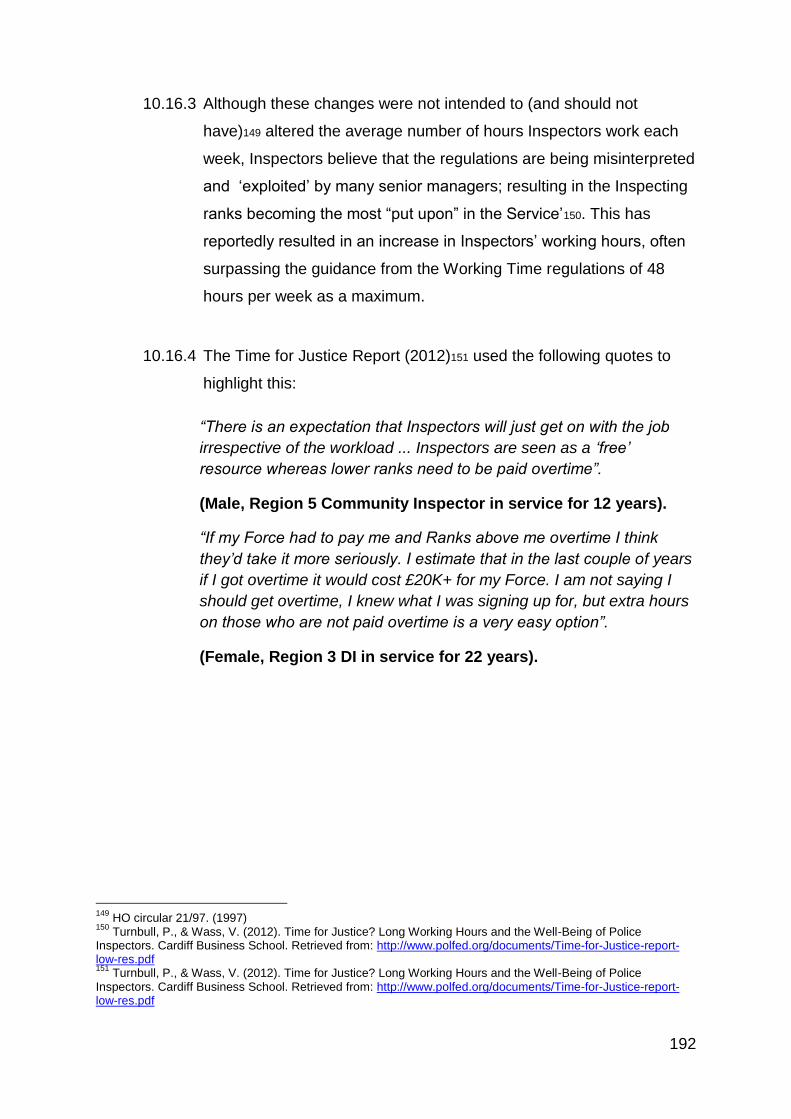
192
Although these changes were not intended to (and should not 10.16.3
have)149 altered the average number of hours Inspectors work each
week, Inspectors believe that the regulations are being misinterpreted
and ‘exploited’ by many senior managers; resulting in the Inspecting
ranks becoming the most “put upon” in the Service’150. This has
reportedly resulted in an increase in Inspectors’ working hours, often
surpassing the guidance from the Working Time regulations of 48
hours per week as a maximum.
The Time for Justice Report (2012)151 used the following quotes to 10.16.4
highlight this:
“There is an expectation that Inspectors will just get on with the job
irrespective of the workload ... Inspectors are seen as a ‘free’
resource whereas lower ranks need to be paid overtime”.
(Male, Region 5 Community Inspector in service for 12 years).
“If my Force had to pay me and Ranks above me overtime I think
they’d take it more seriously. I estimate that in the last couple of years
if I got overtime it would cost £20K+ for my Force. I am not saying I
should get overtime, I knew what I was signing up for, but extra hours
on those who are not paid overtime is a very easy option”.
(Female, Region 3 DI in service for 22 years).
149
HO circular 21/97. (1997) 150
Turnbull, P., & Wass, V. (2012). Time for Justice? Long Working Hours and the Well-Being of Police Inspectors. Cardiff Business School. Retrieved from: http://www.polfed.org/documents/Time-for-Justice-report-low-res.pdf 151
Turnbull, P., & Wass, V. (2012). Time for Justice? Long Working Hours and the Well-Being of Police Inspectors. Cardiff Business School. Retrieved from: http://www.polfed.org/documents/Time-for-Justice-report-low-res.pdf

193
Substantial increases in working hours may have serious 10.16.5
psychological and physical health consequences. According to
Virtanen, Heikkilä, Jokela, Ferrie, Batty, Vahtera, and Kivimäki,
(2012)152 some studies suggest associations between longer working
hours and a range of problems, including fatigue153 (;increased
cortisol levels154;elevated blood pressure155;carotid intima-media
thickness156;anxiety and depression157;type 2 diabetes158, being
overweight159, and mortality 160. As police are already at high-risk of
negative health effects due to working in shifts patterns161, these
consequences should be taken seriously and considered carefully.
152
Virtanen, M., Heikkilä, K., Jokela, M., Ferrie, J. E., Batty, G. D., Vahtera, J., & Kivimäki, M. (2012). Long working hours and coronary heart disease: a systematic review and meta-analysis. American journal of epidemiology, 176(7), 586-596. http://aje.oxfordjournals.org/content/176/7/586.full 153
Health and Safety Executive (2006).Managing shift work http://www.hse.gov.uk/pubns/priced/hsg256.pdf 154
Lundberg U, Hellström B. (2012). Workload and morning salivary cortisol in women. Work Stres,16, 4, 356-363. 155
Hayashi T, Kobayashi Y, Yamaoka K, et al .(1996). Effect of overtime work on 24-hour ambulatory blood pressure. J Occup Environ Med , 38, 10, 1007-1011. 156
Krause N, Brand RJ, Kauhanen J, et al. Work time and 11-year progression of carotid atherosclerosis in middle-aged Finnish men. Prev Chronic Dis 2009;6(1):A13. (http://www.cdc.gov/pcd/issues/2009/Jan/pdf/07_0270.pdf). 157
Shields M. Long working hours and health. Health Rep 1999;11(2):33-48: Virtanen M, Ferrie JE, Singh-Manoux A, et al. Long working hours and symptoms of anxiety and depression: a 5-year follow-up of the Whitehall II Study. Psychol Med 2011;18:1-10: Virtanen M, Stansfeld SA, Fuhrer R, et al. Overtime work as a predictor of major depressive episode: a 5-year follow-up of the Whitehall II Study. PLoS One 2012;7(1):e30719. doi:10.1371/journal.pone.0030719. 158
Kawakami N, Araki S, Takatsuka N, et al. (1999). Overtime, psychosocial working conditions, and occurrence of non-insulin dependent diabetes mellitus in Japanese men. J Epidemiol Community Health, 53,6, 359-363. 159
Escoto KH, French SA, Harnack LJ, et al. Work hours, weight status, and KH, French SA, Harnack LJ, et al. Work hours, weight status, and weight-related behaviors: a study of metro transit workers. Int J Behav Nutr Phys Act 2010;7:91. (http://www.ijbnpa.org/content/7/1/91); Lallukka T, Lahelma E, Rahkonen O, et al .(2008). Associations of job strain and working overtime with adverse health behaviors and obesity: evidence from the Whitehall II Study, Helsinki Health Study, and the Japanese Civil Servants Study. Soc Sci Med, 66, 8,1681-1698. 160
O’reilly, D., & Rosato, M. (2013). Worked to death? A census-based longitudinal study of the relationship between the numbers of hours spent working and mortality risk. International journal of epidemiology, 42, 6, 1820-1830. 161
Health and Safety Executive. (2006) Managing Shift Work: http://www.hseni.gov.uk/hsg256_managing_shift_work.pdf

194
Staff association position 10.17
We believe that it is important to understand the reasons for overtime. 10.17.1
This will help forces identify peak days and times, to better match
demand for resources, and to improve workforce planning, thereby
reducing the need for predictable overtime. However, overtime is also
often the most efficient way of dealing with immediate needs and
providing resources for emergency or public order situations. In such
circumstances officers should be recompensed appropriately:
particularly given the strain on individual officers and the impact on
work-life balance.
PFEW is opposed to a buy-out of overtime for Sergeants. Overtime 10.17.2
should remain as a separate remuneration package for Sergeants.
PSAEW is also opposed. As senior managers within the service,
Superintendents consider that payment of overtime is an effective
management tool, and have no wish to see it bought out.
Summary 10.18
Overtime is a necessary feature of police work, and can be helpful to 10.18.1
manage peaks and troughs of work. As such, it should be properly
and fairly recompensed. We believe the requirement to pay overtime
encourages services to consider their resourcing needs in advance,
and plan properly.
The overtime buy-out for Inspecting ranks has resulted in unforeseen 10.18.2
consequences that have had a detrimental effect on Inspectors and
Chief Inspectors.

195
If overtime buy-outs are be examined we recommend a full review 10.18.3
regarding the efficacy of the buy-out. Its consequences for Inspecting
ranks should be further examined as well, paying particular attention
to the unforeseen consequences and highlighting any lessons that
can be learned. As one Inspector commented:
“I do believe it unfair however, that whilst overtime was bought out
many years ago, there has been no review of this position since. That
is scandalous.”
(Male, Inspector)
Questions arising 10.19
Should the PRRB decide to give this matter consideration then the 10.19.1
following questions must be considered as a part of that process:
How do the Home Office define ‘casual overtime’, and does the
remit letter actually refer to all Sergeants’ overtime?
What are the main reasons for overtime? Is the information
collected by police services and the Home Office?
What has been the impact on the Inspecting ranks of their buy-
out in terms of workload, well-being, morale and motivation?
What has been the impact on Sergeants seeking promotion?
Should an overtime buy-out be enacted, what safeguards will
there be to prevent excessive workloads and protect the health,
safety and welfare of officers?
Has consideration been given to increasing part-time and flexible
working opportunities as a direct means to provide additional
resources at time of peak demand (which do not attract higher
rates of payment)?
What would the impact be on officers in roles with large overtime
requirements, such as Firearms officers? Would they be more
likely to leave? Has the HO modelled the likely impact on
particular roles?
What will be the implications for ensuring sufficient volunteers for
overtime if there is no incentive? How will forces select fairly who
will do it? Are there EIA considerations?

196
Recommendation 7c 10.20
We recommend that overtime should remain as a separate 10.20.1
remuneration package for Sergeants. Any change should include a
full analysis, including consideration of the unforeseen consequences
that have been observed by Inspectors.
Management of officers on limited duties and the value of the 10.21
deployment component of the x-factor
The Winsor Review (2012) set out specific recommendations on the 10.21.1
procedure for determining the circumstances in which an officer may
be placed on restricted duty (now called limited duty), the
arrangements which a Chief Constable may make for these officers,
and the adjustments to pay. The core of Winsor’s proposals was:
officers who are on restricted duty should have their deployability
and capability to exercise police powers assessed one year after
being placed on restricted duty;
those who are not deployable and not capable of work which
requires the Office of Constable should have their pay reduced
(by loss of the deployment component of the x-factor); and
after a further year, if they remain not deployable and not capable
of work which requires the Office of Constable, then they should
be removed from police service, and given ill health retirement or
a staff role as most appropriate.

197
The matter went to the Police Arbitration Tribunal (PAT) and the PAT 10.21.2
ruled in favour of the Official Side proposal. However, the specific
detail of the scheme is still under discussion. These discussions are
being conducted in the Police Advisory Board, and centre on the
need for police services to determine which roles need to be fully
deployable for resilience to be maintained. Following these
discussions the Home Office will provide draft Regulations and
Determinations to put the scheme into effect. The PAB is not
considering the level of the x-factor. It remains to be seen if the new
provisions will be implemented in a way that is fair and in line with
equality legislation. Once the changes are implemented it will be vital
to monitor the impact they have on officers: we believe this will fall
under the PAB remit.
The x-factor payment 10.22
With regards to the deployment component of the x-factor, Winsor 10.22.1
acknowledged that this is the hardest factor to quantify as there is no
definitive labour market evidence on which to base quantification.
However, he reasoned that “the fact that police officers can be
redeployed at any time, to any place, into any role, when required by
the Chief Constable means that all of those role-specific aspects of
the x-factor are latent in the Office of Constable”162. He suggested
two general approaches to valuing the x-factor. The first is to identify
factors that are peculiar to policing, and give a value to the total. The
second approach is to identify those elements of the x-factor that
some officers do not meet, and establish a value for those. Winsor
argued that a number of factors have been identified within previous
reviews (by Desborough (1920), Oaksey (1949), the Royal
Commission (1960), and Sheehy (1993)) on which there is broad
agreement.
162
Winsor Review of Police Officer and Staff Remuneration and Conditions – Final Report, pg 430.

198
In conducting an initial valuation of the x-factor, Winsor was guided 10.22.2
by the analysis of Professor Disney. Amongst other things, Professor
Disney noted that jobs incurring exposure to stress tend to attract a
premium of 8-9% over jobs not seen as stressful. Police officer roles
were deemed to be particularly stressful, and the report implies this
figure for that particular component of the x-factor. For the
deployment component, however, there was “no definitive labour
market evidence”163. Nonetheless, a preliminary figure of 8% of a
Constable’s salary was chosen. Whilst a rationale is given for using
Constables to benchmark, it is not clear why 8% was chosen.
We have had no sight of the Home Office’s proposals for valuation of 10.22.3
the deployment component of the x-factor in future. We believe that a
fair and transparent process is needed.
We believe that financially penalising officers who become unfit for 10.22.4
certain aspects of the role could have unintended consequences. It
could potentially lead to a more risk-averse culture among officers,
which would be contrary to the public interest. This should be taken
into account in determining the level of the deployability component of
the x-factor.
163
Winsor Review of Police Officer and Staff Remuneration and Conditions – Final Report, pg 444.

199
Summary 10.23
The changes to the arrangements for management of officers on 10.23.1
limited duty are significant. We therefore believe that it will be vital
that there is consideration of the impact of the changes to the
management of officers on limited duties.
Winsor said the deployability element of the x-factor was particularly 10.23.2
hard to calculate, there being no “definitive labour market evidence”.
It should be reviewed from time to time to take into account changes
to policing. In order to do this the PRRB will require evidence on
which to base any quantification. In the absence of comparative
labour market data (such as exists for jobs deemed stressful), to
determine the deployability component, what evidence can the Home
Office provide to justify the value of the deployability component of
the x-factor?
Questions arising 10.24
In this case, all questions should be broken down by rank, protected 10.24.1
characteristics, role and time period.
How can the deployment factor of the x- factor be quantified in
the absence of comparative labour market data, establishing the
premium normally paid for deployability?
Recommendation 7d 10.25
In order for the review body to review the value of the deployability 10.25.1
component of the x-factor, definitive labour market evidence will be
required. This would normally include comparison data, from
organisations with similar requirements. In the absence of such data,
how does the Home Office intend to value the deployability
component?
200
Feasibility of attaining a greater degree of coherence between the terms 10.26
and conditions of police officers and police staff
The police Staff Associations will not comment on the terms and 10.26.1
conditions of police staff. Police officers are not “employees” in the
usual sense. They are public servants holding a “common law”
office, namely that of Constable. The range of rights and remedies
available to police officers is therefore different to the range of rights
and remedies available to employees, such as police staff.
Police officers do not work under contracts of employment. The 10.26.2
contractual rights of employees derive from their individual contracts
of employment. By contrast, the terms and conditions of police
officers are set out in Police Regulations and Determinations 2003
(as amended). Issues of conduct and performance are dealt with by
the Police (Conduct) Regulations 2012, Police (Complaints and
Misconduct) Regulations 2012 and Police (Performance) Regulations
2012 (as amended). Officers cannot, except in circumstances where
they may have been victimised as a result of making a claim under
the Public Interest Disclosure Act 1998 take claims of constructive or
unfair dismissal. A summary of the legal context for officers with
regard to employment law is at Annex 10.1.
However, in some aspects of employment legislation, police officers 10.26.3
are “deemed to be employees” and have rights under the following
Acts:
Equality Act 2010
Employment Rights Act 1996 (insofar as claims relating to health
and safety and whistleblowing” are concerned)
Part Time Worker (Prevention of Less Favourable Treatment)
Regulations 2000
Working Time Regulations 1998

201
Summary 10.27
The Office of Constable is and must remain the bedrock of British 10.27.1
policing and nothing should be done that would jeopardise this. It
ensures the operational independence of Chief Constables and
enables police officers to discharge their duties without fear or favour.
To move police officers onto contracts of employment would be
inconsistent with the Office of Constable because they would become
employees.
Questions arising 10.28
How would greater coherence between the terms and conditions
of police officers and police staff be of benefit to the public and
the service?
How would the Home Office ensure that the Office of Constable
remains the bedrock of British policing?
Recommendation 7e 10.29
We believe that to move police officers onto contracts of employment 10.29.1
would be inconsistent with the Office of Constable and any proposal
to do so should be rejected.
Staff Association priorities: existing elements of the pay system 10.30
In addition to the issues raised in the remit letter we ask the PRRB to 10.30.1
consider whether the following matters should also be included in the
five year work programme:

202
Constables’ pay scale (for officers who joined after 1 April 2013) 10.31
A new Constables’ pay scale for officers who joined after 1 April 2013 10.31.1
was introduced following a PAT award, which accepted a proposal by
the Official Side of PNB that modified Winsor’s recommendation.
The new pay scale now has a lower starting salary for officers of 10.31.2
£19,383 per annum compared to £23,727 per annum under the scale
for officers currently in service. (Chief Constables have discretion
over the exact starting salary, and the lower figure should only be for
those with no policing experience). In addition, the incremental steps
are uneven with an increase of over £4,000 to the penultimate pay
point and over £5,500 to the top pay point.
In its award the PAT acknowledged Staff Side’s contention that the 10.31.3
Official Side’s pay scale was unbalanced, because of the steep
incremental steps between pay points 5, 6 and 7. Furthermore, the
size of the proposed incremental steps did not appear to be
underpinned by a full analysis. Staff Side had argued that the
relatively limited value of incremental progression of £8,000 between
point 0 and point 5 on the pay scale, compared with the much larger
increase of over £9,500 between point 5 and point 7, was
disproportionate to any increased skills and abilities at those later
points in service.
Another area of concern for the Staff Side in relation to the proposed 10.31.4
pay scale was a likely increase in the gender pay gap in basic pay for
serving Constables. This had been 5.7% in 2009 and 6.6% in 2011.
Quoting data from the 2011 PNB Census of Earnings, Hours and
Length of Service, the Staff Side said that the Official Side’s
proposals would widen the gender pay gap further to between 7.5%
and 8.1% in favour of men.

203
Staff Side asserted that the reduction in the starting salary from 10.31.5
£23,259 to £19,000, (figures correct at the time the reduction was
introduced), in both Winsor and the Official Side proposal was likely
to have an impact on the ability of the service to recruit people of the
right calibre and maturity. In this context, the Scarman Report had
highlighted the need for the police service to attract mature recruits.
The Staff Side said that the average age of new recruits, in times
when forces were recruiting, was 27 years but in the Staff Side’s view
the proposed starting salary was set at too low a level to attract
mature applicants. While the Tribunal was not persuaded by the Staff
Side’s argument that the Official Side’s pay scale would deter more
mature applicants or that it would fail to attract graduate applicants, it
appeared to the Tribunal that an assessment of the impact of the new
entrant salary levels should be undertaken with this issue in mind,
after a period of operation.
Summary 10.32
PFEW remains concerned that the Constables’ pay scale for those 10.32.1
recruited after 1 April 2013 is unbalanced, will contribute to a
widening of the gender pay gap and may impact on the ability of the
service to attract mature applicants or graduate applicants. PFEW
asks that the Review Body consider undertaking an assessment of
the impact of the new entry levels on the ability of the Service to
attract mature applicants and graduate applicants; to examine the
incremental steps in the pay scale and to consider whether these
reflect the skills and abilities required at those points; and to consider
the impact on gender pay gap.

204
Questions arising 10.33
In doing so, the review body will need data on: 10.33.1
What starting salaries have forces used?
Numbers of applications
What calibre of recruit is presenting? (Experience of policing,
qualifications, skills, etc)?
What is the average age of recruits?
An equality impact assessment should be undertaken
What evidence is available to justify the incremental steps
between pay points 5, 6 and 7?
What qualitative evidence will be gathered on the perceived
fairness of the scale?
Recommendation 7f 10.34
The major reduction in starting salary for Constables from 1 April 10.34.1
2013 of over £4,000 will impact on the quality of candidates attracted
to the police service. In addition, the uneven incremental steps and,
in particular, the jump in the last pay point on scale of approximately
£5,500 has created an unbalanced pay scale. These changes must
be monitored and action should be taken to address any negative
impact.
205
Pay progression 10.35
Whereas in the past pay progression has largely occurred at the end 10.35.1
of each additional year served - on the assumption this brings
additional experience - progression based on assessments of
performance is being introduced. There will be differing assessments
for particular spine points for example 4 and 7 for Constables, (see
para 10.33 on skills thresholds), but for most the norm will be to use
the Performance and Development Review (PDR).
An agreement was reached at the PNB arising from Winsor’s 10.35.2
recommendation 84. The PNB agreed that, subject to a number of
caveats, pay progression for officers in the federated ranks should be
subject to a satisfactory box marking in the annual appraisal. Those
officers who receive a box marking of ‘satisfactory contribution’ or
above should advance by one pay increment; those who receive an
‘unsatisfactory contribution’ box marking should remain on the same
point for a further year. The agreement detailed that this should be
introduced for Sergeants, Inspectors and Chief Inspectors in 2014-15
and for Constables in 2015-16. However, the agreement has not yet
been implemented. (Superintending ranks have had incremental pay
progression linked to satisfactory PDR gradings since 2004).
At the same time that the PNB agreement was under discussion, 10.35.3
there was consideration of Winsor’s recommendation that the College
of Policing amend the PDR model to make it fit for use as the basis of
contribution-related pay in the police service. As a result the PNB felt
it appropriate to attach a number of caveats to the PNB agreement,
these included:

206
The provision of training for line managers should be achieved in
advance of the introduction of the changes.
The use of forced distribution (discretionary): placing an officer in
the bottom 10% of the distribution would not result in the
automatic denial of incremental progression.
Implementation of the changes to the pay progression
arrangements would be based on a PDR model developed by the
College of Policing.
Pay progression would operate on an assumption of competence
unless there was evidence to the contrary: in the absence of a
PDR progression would be automatic.
Any denial of progression would only occur if an officer was
subject to formal unsatisfactory performance at the time of their
appraisal.
At the time of writing, the College of Policing has provided some 10.35.4
guidance on the PDR. No standardised national system has been
designed. Regulations are to be drafted. It is not clear to what extent
some of the safeguards the PNB agreement captured will actually be
in place.

207
Summary 10.36
We believe there is a need to monitor the impact of the new 10.36.1
assessing competency framework on incremental pay progression
across England and Wales, once it is implemented. It is vital that it is
implemented in a fair and consistent manner across all forces in
England and Wales. This is a key issue for police officers and any
inconsistencies or lack of clarity in how the system should operate will
create discord amongst officers. It is vital that the caveats agreed by
the PNB are implemented fully.
It is not yet clear how the implementation will be monitored. While the 10.36.2
College of Policing has a role to play, it would seem appropriate for
the PRRB to oversee the impacts on pay, and in particular the
impacts on pay equality.
Questions arising 10.37
What is the impact on officers: how many officers receive an
annual increment, how many do not? How is this broken down
by gender, BME, age etc
Are the PNB’s caveats being adhered to?
Recommendation 7g 10.38
We recommend that the Review Body consider the impact of the 10.38.1
changes to pay progression for officers in the federated ranks,
including the impact on incremental pay progression of officers with
protected characteristics.
208
Skills thresholds 10.39
The Home Secretary directed PNB to reach agreement on the pay 10.39.1
consequences of the Winsor proposals for Foundation and Specialist
(now referred to as ‘Advanced’) Skills Thresholds; the detail of the
schemes themselves is a matter for the College of Policing.
The College proposals are for a more comprehensive scheme of 10.39.2
continuing professional development which builds on, but goes
beyond, the recommendations of the Winsor Report. These
assessments cover all officers and all roles, such that no officer
would be denied the opportunity to reach their scale maximum. They
include assessment of the 10 components of the Policing Diploma,
which demonstrates the degree to which all officers are expected to
be able to fulfil a very wide range of tasks, demonstrating broad
knowledge, skills, and aptitudes.
Much of the detail which will be needed to enable Regulations and 10.39.3
Determinations dealing with the pay consequences of the schemes to
be drafted is not yet available. The detail will need to be tested
through pilots organised by the College. However, the PNB did agree
that incremental pay progression at relevant points on the pay scale
should be dependent upon success in the threshold assessments.
The relevant points on the pay scale are:
Foundation skills threshold – 4th point on Constables’ pay scale
Advanced skills threshold –7th (final) pay point of all police officer pay
scales up to and including the rank of chief superintendent.

209
Summary 10.40
The pay consequences of failing a threshold assessment will be 10.40.1
substantial. It will be important for the continuing impact of the
schemes to be monitored to guard against any risk of a
disproportionate number of officers with protected characteristics not
attempting or not succeeding in assessment for progression to the
scale maximum. The College of Policing is conducting a pilot project
over one year to make preliminary judgements on, and amendments
to, the assessment process. However, there will not be adequate
numbers of certain groups (e.g. those with protected characteristics)
to conduct definitive analysis; not all police services are taking part in
the pilot, so evidence of the scheme’s operation in some services will
be lacking, and it will not be possible to ensure the process is
standard throughout; and it would be appropriate for an organisation
that does not design the process to oversee the results of evaluation
of the scheme. While the College of Policing is responsible for
monitoring the pilot, it is not yet clear who will be responsible for
monitoring the implementation. It seems appropriate that the PRRB
should have a role in this, because of the pay implications.
Questions arising 10.41
How many officers have been assessed (by rank, and by
protected characteristics)?
How many officers have been successful broken down (by rank,
and by protected characteristics)?
What evidence is available to demonstrate any impact on officers
with protected characteristics?

210
Recommendation 7h 10.42
PFEW and PSAEW ask that the review body consider the impact of 10.42.1
the threshold assessments on incremental pay progression including
the impact on incremental pay progression of officers with protected
characteristics.
Away from home overnight allowance 10.43
This allowance was introduced following a Police Arbitration Tribunal 10.43.1
in 2012 which modified Winsor’s recommendation on compensation
for officers held in reserve away from their normal place of duty.
The PAT set out that there should be an element of additional 10.43.2
compensation for officers who are held in reserve and unable to
return home (whether this is in their own force or on mutual aid
operations) and the Tribunal calculated, by reference to the hourly
rate for an 8-year Constable), that an amount of £50 should be paid
as an ‘Away From Home Overnight Allowance’.
Following the PAT award a Regulation 34, Annex U was amended to 10.43.3
make provision for the payment of the Away from Home Overnight
Allowance. This included a definition of held in reserve which states
that a member is held in reserve ‘if the member is serving away from
his normal place of duty (whether because the member has been
provided for the assistance of another police force under section 24
of the Police Act 1996 or otherwise) and is required to stay in a
particular, specified place rather than being allowed to return home.
However, when the provision was put into Determinations, a caveat
was introduced which prevented the allowance being paid if the
officer is serving away from his or her normal place of duty by reason
of carrying out routine enquiries or being on a training course.

211
The inclusion of the term ‘routine enquiries’ has caused great 10.43.4
difficulties for forces and was the subject of much discussion at the
PNB prior to its abolition. The term is not defined in the Determination
and inconsistencies have arisen across England and Wales.
Unfortunately the PNB was unable to agree on any guidance on this
matter and at the time of writing this submission the Home Office is
consulting on a revised Determination that is intended to bring further
clarity to the provision. However, PFEW believes that the
amendments proposed by the Home Office may not provide the
clarity that it being sought and may well confuse forces further.
Summary 10.44
PFEW believes that it is vital to monitor the payment of the allowance 10.44.1
and also to monitor the impact of any future changes to the wording
of the Determination. In addition, the value of the allowance should
be kept under review to ensure that it provides sufficient recompense
to officers who are held in reserve and unable to return home.
Questions arising 10.45
How many officers receive the away from home overnight
allowance broken down by rank, gender, role?
What are the reasons for making the payment?
Recommendation 7i 10.46
PFEW asks that the review body review the Away from Home 10.46.1
Overnight allowance and monitor any impact of any changes to the
provisions for making the payment.

212
Motor Vehicle Allowances 10.47
Motor Vehicle Allowances (MVAs) have not been reviewed since 10.47.1
2010. Historically, the allowances for police officers have followed
the local Government rates and in 2010 a new PNB agreement was
reached which increased the allowances in accordance with the
increase being given to local government workers. This didn’t actually
take effect until April 2012 and the allowances for police officers have
not been uprated since then as the local government rates have not
been reviewed. This is because the Local Government Employers’
Side wish to agree an alternative method of recompense.
It seems unsatisfactory that the rates for MVAs for police officers 10.47.2
remain unchanged while an alternative method of recompense for
another group of workers is being sought on which police officers’
representatives will have no input. Regulation 34, Annex U, provides
that a Chief Constable may authorise a police officer to use his or her
own motor vehicle where the officer’s duties require it. We believe
that it is essential that officers who are required to use their own cars
for police duties should receive a MVA that reflects the costs to
officers of using their own vehicles.
Summary 10.48
MVAs have not been reviewed since 2010. As things currently stand, 10.48.1
MVAs for police officers who are required to use their own vehicle for
work will not be reviewed until negotiations within local government
are concluded.
We ask the Review Body to consider whether there is a case for 10.48.2
ensuring there is a mechanism to adjust MVAs for officers, outside
the local government provision.

213
Questions arising 10.49
How many officers are designated essential or casual car users?
What information is available on mileage?
Recommendation 7j 10.50
We ask that the current rates of MVAs be reviewed and the review 10.50.1
body consider whether there is a case for a new formula for
recompensing officers who use their own vehicle for police duties.
Equality issues 10.51
10.52.1 The PNB spent time looking at equality issues through 10.51.1
the Gender Equality and Work Life Balance working group.
Through this working group the PNB commissioned an Equal Pay
Audit of the gender outcomes of the pay arrangements for police
officers’ in England, Wales, Scotland and Northern Ireland in 2009,
2011 and 2012.
The pay audits were completed using the same methodology from 10.51.2
the Equality and Human Rights Commission’s (EHRC) Equal Pay
Toolkit and used data from the PNB Pay and Earnings Census. The
EHRC’s toolkit recommends that an organisation should investigate
any pay gap that is more that 5% or more than 3% if there is a
pattern of difference at most or all levels of an organisation.
Equality of terms legislation (ie, equal pay) is part of the Equality Act 10.51.3
2010. It requires that men and women are paid the same for
performing the same work, work rated as equivalent under a job
evaluation scheme and work that is of equal value. If there is a
difference in pay an employer must show that the whole of the
difference is the result of a material factor that is not related to sex.

214
In 2012, the audit found that the pay gap in respect of basic pay and 10.51.4
total pay for full-time federated officers had increased at almost every
rank since the 2011 audit. The Constables’ basic pay gap was 7.6%
in favour of men having increased one percentage point since 2011
without any real changes to the pay structure. The pay gap for
Constables’ total pay was 11.3%.164
The pay gap in basic and total pay is the greatest at Constable then 10.51.5
reduces at every rank up to Chief Inspector, rises slightly at
Superintendent and then falls to the smallest gap at Chief
Superintendent: 0.6% basic pay and 1.4% total pay.
An equal pay audit has not been carried out using the latest 10.51.6
information from the latest PNB Census. The PRRB will need this
information in order to consider the impact of recent changes to pay
and allowances.
The 2012 audit also showed a reduction in the number of part-time 10.51.7
officers, of almost 3,000. There were 8,502 part-time officers in 2011
but just 5,301 in 2012. The reduction represented 38% of those
working part-time in 2011; the vast majority of whom were women.
This could be linked to difficulties in retaining women officers if they 10.51.8
find it difficult to secure flexible working patterns.
Police officers can apply for part-time working under the Police 10.51.9
Regulations 2003. However, the right to request flexible working,
under the Employment Rights Act 1996, does not apply to police
officers. Many forces do have policies and procedures in place which
allow them to consider requests for flexible working; however, this is
by no means consistent across England and Wales.
164
PNB. (2012) Police Negotiating Board Equal Pay Audit 2012

215
Flexible working should provide benefits to both officers and the 10.51.10
force as a whole and should be another tool with which a force can
provide a comprehensive demand-led service to the public. It should
also provide a way to retain valuable experience. However, it is
unclear if sufficient regard is being given to requests to work part-
time or flexibly. Anecdotal evidence suggests that opportunities to
work part-time or flexibly are on the decrease. Whilst forces have
polices in place to enable all officers to apply for part-time working in
reality officers are being discouraged from even considering applying
for such working. As a result, forces could lose many talented
officers from the service, most of whom are women, but also for
promotion to higher ranks. This is contrast to the Service’s stated
aims of seeing more women and BME officers seeking and being
successful in promotion processes and that the Service reflects the
communities it serves.
Summary 10.52
PFEW and PSAEW believe that equal pay audits should continue to 10.52.1
be carried out and that the PRRB should consider the equality impact
assessment (EIA) of any recommendations it makes to the Home
Secretary, to address the gender pay gap and to monitor the levels of
part-time and flexible working in the Service.

216
Questions arising 10.53
Who will carry out the equal pay audits?
What is the gender pay gap for 2013?
How many officers work part-time broken down by gender, rank,
age, disability, length of service?
Recommendation 7k 10.54
We recommend that full consideration be given to equality issues and that
equal pay audits continue to be undertaken. The Review Body should consider
the EIA of any recommendations made.

217
Annex 1.1 - Police Remuneration Review Body (PRRB) remit letter

218

219
Annex 2.1 - Robert Peel’s Nine Principles of Policing
1) To prevent crime and disorder, as an alternative to their repression by military
force and severity of legal punishment.
2) To recognise always that the power of the police to fulfil their functions and
duties is dependent on public approval of their existence, actions and
behaviour and on their ability to secure and maintain public respect.
3) To recognise always that to secure and maintain the respect and approval of
the public means also the securing of the willing co-operation of the public in
the task of securing observance of laws.
4) To recognise always that the extent to which the co-operation of the public
can be secured diminishes proportionately the necessity of the use of physical
force and compulsion for achieving police objectives.
5) To seek and preserve public favour, not by pandering to public opinion; but by
constantly demonstrating absolutely impartial service to law, in complete
independence of policy, and without regard to the justice or injustice of the
substance of individual laws, by ready offering of individual service and
friendship to all members of the public without regard to their wealth or social
standing, by ready exercise of courtesy and friendly good humour; and by
ready offering of individual sacrifice in protecting and preserving life.
6) To use physical force only when the exercise of persuasion, advice and
warning is found to be insufficient to obtain public co-operation to an extent
necessary to secure observance of law or to restore order, and to use only the
minimum degree of physical force which is necessary on any particular
occasion for achieving a police objective.

220
7) To maintain at all times a relationship with the public that gives reality to the
historic tradition that the police are the public and that the public are the
police, the police being only members of the public who are paid to give full
time attention to duties which are incumbent on every citizen in the interests
of community welfare and existence.
8) To recognise always the need for strict adherence to police-executive
functions, and to refrain from even seeming to usurp the powers of the
judiciary of avenging individuals or the State, and of authoritatively judging
guilt and punishing the guilty.
9) To recognise always that the test of police efficiency is the absence of crime
and disorder, and not the visible evidence of police action in dealing with
them.

221
Annex 4.1 Workforce planning evidence base: required data
Matrix of information relevant to pay and conditions that should be collated and reported on a regular basis by the Home Office
and/or HMIC in order to; inform decision making, monitor and plan the police workforce, and promote evidence based policies.
Measure Basic break down by
Provided by Requested Improvements /Additions Rationale for Data collection Gender Ethnicity Rank Force Age LoS
Basic Demographics
HO
Increased frequency of reports
Age and disability breakdown
LoS is only provided by force, this should also be provided by gender and ethnicity and rank
Diversity purposes
Comparing workforce profiles
Joiners
NA
HO &
HMIC
Increased frequency of report
Age and ethnicity breakdown
Breakdown between internal (i.e. promotion, secondment, transfer) and external recruitment
Qualifications of appointed persons
Diversity purposes
Recruitment monitoring
Talent flow monitoring
Leavers
HO &
HMIC
Increased frequency of report
Age, ethnicity and length of service
Breakdown between voluntary and mandatory turnover
Breakdown between internal (i.e. promotion, secondment, transfer) and external outflow
Breakdown by reason (inc. more detail on medical/normal retirements by rank, gender, age etc.)
165
Diversity purposes; examine gender and BME differences in respect of length of service on leaving
Retention monitoring
Talent flow monitoring
Planned workforce (total number of posts, fill
and unfilled)
No centralised standard reporting
Total number of filled posts and total number of unfilled posts
Breakdown by Force, rank, specialism
Recruitment and retention monitoring
165
Armed Forces/Fire service can be used as examples of good practice; they record much for detail, e.g., resignation due to harassment or discrimination, poor performance/efficiency, move to
other employment (including re-employment as support staff).
Key
Those that are currently published by the Home Office and/or HMIC
No currently published by the Home Office and/or HMIC

222
Measure Basic break down by
Provided by Requested Improvements /Additions Rationale for Data collection Gender Ethnicity Rank Force Age LoS
Applications received
No centralised standard reporting
Total number of applications received, total number of vacant posts and total number of applicants appointed
Breakdown by Force, rank, specialism, gender, ethnicity, qualifications/quality of applicants
Recruitment and retention monitoring
Diversity
HO &
HMIC
Ethnicity by rank is currently reported as a total number of minority ethnic officers per rank. Further detail on ethnicity required
Age and LoS breakdown
A full report/data is required on workforce characteristics identified by the Equality Act 2010
Annual equal pay audit
To meet legal requirement according to the Public Sector Equality Duty
Enable assessment of any disadvantages for groups under the Equality Act and to monitor any such pay gaps over time
Time of in Lieu
No centralised standard reporting
Number of days owed per officer
Broken down by, Force, ethnicity, gender and rank
Work force planning and monitoring. More specifically problems are reported with claiming outstanding days owed
Acting up
No centralised standard reporting
Number of officers acting up
Broken down by, Force, ethnicity, gender and rank
New regulation on payment arrangements; may need monitoring of numbers involved on a quarterly basis
Monitoring of the new acting up arrangements
Maternity/Paternity/Adoption leave
No centralised standard reporting
Numbers taking maternity, paternity and adoption leave
Numbers returning from such leave,
Numbers not returning (and why)
Broken down by Force, ethnicity, gender (where appropriate) and rank
Workforce resilience, planning and monitoring
Diversity purposes
Career breaks
No centralised standard reporting
Numbers taking career breaks Numbers returning from such leave,
Numbers not returning (and why)
Broken down by Force, ethnicity, gender and rank
Workforce resilience, planning and monitoring
Diversity purposes
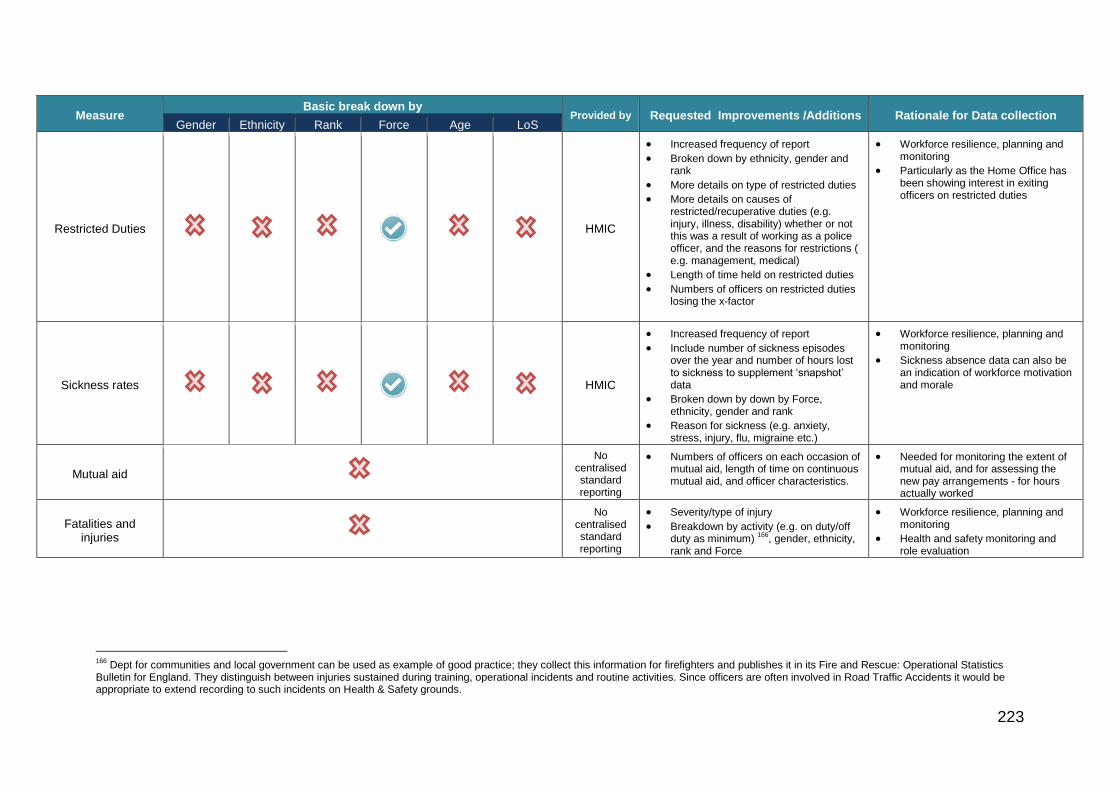
223
Measure Basic break down by
Provided by Requested Improvements /Additions Rationale for Data collection Gender Ethnicity Rank Force Age LoS
Restricted Duties
HMIC
Increased frequency of report
Broken down by ethnicity, gender and rank
More details on type of restricted duties
More details on causes of restricted/recuperative duties (e.g. injury, illness, disability) whether or not this was a result of working as a police officer, and the reasons for restrictions ( e.g. management, medical)
Length of time held on restricted duties
Numbers of officers on restricted duties losing the x-factor
Workforce resilience, planning and monitoring
Particularly as the Home Office has been showing interest in exiting officers on restricted duties
Sickness rates
HMIC
Increased frequency of report
Include number of sickness episodes over the year and number of hours lost to sickness to supplement ‘snapshot’ data
Broken down by down by Force, ethnicity, gender and rank
Reason for sickness (e.g. anxiety, stress, injury, flu, migraine etc.)
Workforce resilience, planning and monitoring
Sickness absence data can also be an indication of workforce motivation and morale
Mutual aid
No centralised standard reporting
Numbers of officers on each occasion of mutual aid, length of time on continuous mutual aid, and officer characteristics.
Needed for monitoring the extent of mutual aid, and for assessing the new pay arrangements - for hours actually worked
Fatalities and injuries
No centralised standard reporting
Severity/type of injury
Breakdown by activity (e.g. on duty/off duty as minimum)
166, gender, ethnicity,
rank and Force
Workforce resilience, planning and monitoring
Health and safety monitoring and role evaluation
166
Dept for communities and local government can be used as example of good practice; they collect this information for firefighters and publishes it in its Fire and Rescue: Operational Statistics Bulletin for England. They distinguish between injuries sustained during training, operational incidents and routine activities. Since officers are often involved in Road Traffic Accidents it would be appropriate to extend recording to such incidents on Health & Safety grounds.

224
Measure Basic break down by
Provided by Requested Improvements /Additions Rationale for Data collection Gender Ethnicity Rank Force Age LoS
Assaults
No centralised standard reporting
Severity of assault
Breakdown by gender, ethnicity, rank, Force and whether the assault was sustained on or off duty
Information on loan working status on at time of assault would be helpful given reducing staff numbers
Workforce resilience, planning and monitoring
Health and safety monitoring
Role evaluation
Workforce attitudes: Morale
No centralised standard reporting
Officer satisfaction in regards to various role related issues, such as pay and conditions
167
Broken down by gender and ethnicity
Workforce resilience, planning and monitoring
Especially important in the light of the changing nature of the service with fast-track promotion and direct entry
Inclusion of demographic characteristics will also allow for observing the attitudes of various sub-groups, including protected characteristics
Use of A19 and voluntary severance
No centralised standard reporting
Full demographics on gender, ethnicity, age and role in respect of both
Broken down by Force and rank
Workforce resilience, planning and monitoring
Also important given the Official Sides' reliance on both as a means of reducing the size of the workforce
Police Pensions Opt-out
No centralised standard reporting
Full demographics on gender, ethnicity, age, LoS
Broken down by Force and rank
In light of changes to police pensions, including contribution rates, need to make its monitoring more transparent as to the effect on opt-outs
Training
No centralised standard reporting
No. of officers trained with specific skill sets; broken down by gender, ethnicity and Force
Basic training . Including detailed breakdown on 'drop-out' rates by gender, ethnicity, age and qualifications on entry
Workforce resilience, planning and monitoring
Skill mix evaluation
Intangible benefits in terms of total reward
Equal opportunity for career progression/development through specialisms
167
Armed Forces can be used as a good example of this is the Armed Forces Continuous Attitude Surveys (AFCAS)

225
Measure Basic break down by
Provided by Requested Improvements /Additions Rationale for Data collection Gender Ethnicity Rank Force Age LoS
Roles
HO
Increased frequency of report Breakdown by gender, ethnicity and rank
Important in respect of equal opportunity for career progression/development through specialisms

226
Annex 4.2: Gender and BME reference list
Alderden, M. A., & Ullman, S. E. (2012). Gender difference or indifference? Detective decision
making in sexual assault cases. Journal of Interpersonal Violence, 27(1), 3 - 22.
Andrews, R., Ashworth, R., & Meier, K. J. (2014). Representative Bureaucracy and Fire Service
Performance. International Public Management Journal, 17(1), 1-24.
Andrews, R., & Johnston Miller, K. (2013). Representative bureaucracy, gender and policing: The
case of domestic violence arrests in England. Public Administration, 91(4), 998-1014.
Atkins, D. N., Fertig, A. R., & Wilkins, V. M. (2014). Connectedness and Expectations: How minority
teachers can improve educational outcomes for minority students. Public Management Review,
16(4), 503-526.
Barrick, K., Hickman, M. J., & Strom, K. J. (2014). Representative policing and violence towards the
police. Policing, 8(2), 193-204.
Beverlin, M. (2012). Symbolic representation in police traffic stops. Journal of Ethnicity in Criminal
Justice, 10(1), 41-70.
Bradbury, M. D., & Kellough, J. E. (2008). Representative bureaucracy: Exploring the potential for
active representation in local Government. Journal of Public Administration Research and Theory,
18(4), 697-714.
Brown, R. A., & Frank, J. (2006). Race and officer decision making: Examining differences in arrest
outcomes between black and white officers. Justice Quarterly, 23(1), 96-126.
Cao, L., & Huang, B. (2000). Determinants of citizen complaints against police abuse of power.
Journal of Criminal Justice, 28(3), 203-213.
Chappell, A. T., MacDonald, J. M., & Manz, P. W. (2006). The organizational determinants of police
arrest decisions. Crime & Delinquency, 52(2), 287-306.
Cochran, J. C., & Warren, P. Y. (2011). Racial, ethnic, and gender differences in perceptions of the
police: The salience of officer race within the context of racial profiling. Journal of Contemporary
Criminal Justice, 28(2), 206 - 227
Close, B. R., & Mason, P. L. (2006). After the traffic stops: Officer characteristics and enforcement
actions. Topics in Economic Analysis & Policy, 6(1).
Donohue III, J. J., & Levitt, S. D. (2001). The Impact of Race on Policing and Arrests. Journal of Law
and Economics, 44(2), 367-394.
Eitle, D., Stolzenberg, L., & D'Alessio, S. J. (2005). Police organizational factors, the racial
composition of the police, and the probability of arrest. Justice Quarterly, 22(1), 30-57.
Farrell, A., Ward, G., & Rousseau, D. (2009). Race effects of representation among federal court
workers: Does black workforce representation reduce sentencing disparities?. The Annals of the
American Academy of political and social science, 623(1), 121-133.
Gilliard-Matthews, S., Kowalski, B. R., & Lundman, R. J. (2008). Officer race and citizen-reported
traffic ticket decisions by police in 1999 and 2002. Police Quarterly, 11(2), 202-219.

227
Hickman, M. J., & Piquero, A. R. (2009). Organizational, Administrative, and Environmental
Correlates of Complaints About Police Use of Force: Does Minority Representation Matter?.
Crime & Delinquency, 55(1), 3-27.
Hur, Y. (2013). Racial diversity, is it a blessing to an organization? Examining its organizational
consequences in municipal police departments. International Review of Administrative Sciences,
79(1), 149-164.
Kennedy, B. (2014). Unraveling Representative Bureaucracy A Systematic Analysis of the Literature.
Administration & Society, 46(4), 395-421.
Lasley, J. R., Larson, J., Kelso, C., & Brown, G. C. (2011). Assessing the long-term effects of officer
race on police attitudes towards the community: a case for representative bureaucracy theory.
Police Practice and Research, 12(6), 474-491.
Lott, J. (2000). Does a helping hand put others at risk?: Affirmative action, police departments, and
crime. Economic Inquiry, 38(2), 239-277.
Marschall, M., & Shah, P. R. (2007). The attitudinal effects of minority incorporation examining the
racial dimensions of trust in urban America. Urban Affairs Review, 42(5), 629-658.
Meier, K. J., & Nicholson-Crotty, J. (2006). Gender, representative bureaucracy, and law
enforcement: The case of sexual assault. Public Administration Review, 66(6), 850-860.
Pitts, D. W. (2005). Diversity, representation, and performance: Evidence about race and ethnicity in
public organizations. Journal of Public Administration Research and Theory, 15(4), 615-631.
Riccucci, N. M., Van Ryzin, G. G., & Lavena, C. F. (in press). Representative Bureaucracy in Policing:
Does It Increase Perceived Legitimacy? Journal of Public Administration Research and Theory.
Sharp, E. B., & Johnson, P. E. (2009). Accounting for variation in distrust of local police. Justice
Quarterly, 26(1), 157-182.
Smith, B. W. (2003). The Impact of Police Officer Diversity on Police‐Caused Homicides. Policy
Studies Journal, 31(2), 147-162.
Sowa, J. E., & Selden, S. C. (2003). Administrative discretion and active representation: An expansion
of the theory of representative bureaucracy. Public Administration Review, 63(6), 700-710.
Sun, I. Y., & Payne, B. K. (2004). Racial differences in resolving conflicts: A comparison between Black
and White police officers. Crime & Delinquency, 50(4), 516-541.
Theobald, N. A., & Haider-Markel, D. P. (2009). Race, bureaucracy, and symbolic representation:
Interactions between citizens and police. Journal of Public Administration Research and Theory,
19(2), 409-426.
Weitzer, R. (2000). White, black, or blue cops? Race and citizen assessments of police officers.
Journal of Criminal Justice, 28(4), 313-324.
Wilkins, V. M., & Williams, B. N. (2008). Black or blue: Racial profiling and representative
bureaucracy. Public Administration Review, 68(4), 654-664.
Wilkins, V. M., & Williams, B. N. (2009). Representing blue: Representative bureaucracy and racial
profiling in the Latino community. Administration & Society, 40(8), 775-798.

228
Annex 4.3: Data sources for Graph 4.1 and Graph 4.2 Home Office.(2014). Police workforce, England and Wales, 31 March 2014 [data tables].
Retrieved from: https://www.gov.uk/Government/statistics/tables-for-police-workforce-
england-and-wales-31-march-2014
Home Office.(2013). Police workforce, England and Wales, 31 March 2013 [data tables].
Retrieved from: https://www.gov.uk/Government/statistics/police-workforce-england-and-
wales-31-march-2013
Home Office.(2012). police service Strength England and Wales, 31 March 2012 [data
tables]. Retrieved from: https://www.gov.uk/Government/statistics/police-service-strength-
england-and-wales-31-march-2012
Home Office.(2011). police service Strength England and Wales, 31 March 2011 [data
tables]. Retrieved from: https://www.gov.uk/Government/statistics/police-service-strength-
england-and-wales-31-march-2011
Home Office.(2010). police service Strength England and Wales, 31 March 2010 [data
tables]. Retrieved from: https://www.gov.uk/Government/statistics/police-service-strength-
england-and-wales-31-march-2010
Her Majesty’s Inspectorate of Constabulary.(2014). Value for money profile data, 2014 –
annual data return [data tables].
Her Majesty’s Inspectorate of Constabulary.(2013). Value for money profile data, 2013 –
annual data return [data tables].
Her Majesty’s Inspectorate of Constabulary.(2012). Value for money profile data, 2012 [data
tables].
Her Majesty’s Inspectorate of Constabulary.(2011). Joiners, leavers, sickness and long-term
absence 2011 - designated officer [data tables]. E, Woods (personal communication, 30 July
2014).
Her Majesty’s Inspectorate of Constabulary.(2010). Workforce [data tables].
All HMIC data listed above (excluding those sent via personal communication) were retrieved from:
http://www.justiceInspectorates.gov.uk/hmic/data/value-for-money-data/
https://www.gov.uk/government/statistics/tables-for-police-workforce-england-and-wales-31-march-2014

229
Annex 10.1 - Legal context
This Annex sets out those relevant legal obligations on the police service of England
and Wales, including anti-discrimination legislation. It provides a summary of recent
legislative changes to employment law which do not automatically apply to police
officers.
Equality and employment law
Police officers are not “employees” in the usual sense. They are public servants
holding a “common law” office, namely that of Constable. The range of rights and
remedies available to police officers is therefore different to the range of rights and
remedies available to employees, such as police staff.
Police officers do not work under contracts of employment. The contractual rights of
employees derive from their individual contracts of employment. In contrast, the
terms and conditions of police officers are set out in Police Regulations and
Determinations 2003 (as amended). Issues of conduct and performance are dealt
with by the Police (Conduct) Regulations 2012, Police (Complaints and Misconduct)
Regulations 2012 and Police (Performance) Regulations 2012 (as amended).
However, in some aspects of employment legislation, police officers are “deemed to
be employees” and have rights under the following Acts:
Equality Act 2010
Employment Rights Act 1996 (insofar as claims relating to health and safety
and whistleblowing” are concerned)
Part Time Worker (Prevention of Less Favourable Treatment) Regulations
2000
Working Time Regulations 1998
Officers cannot, except in circumstances where they may have been dismissed as a
result of making a protected disclosure or for carrying out health and safety activities,
take claims of constructive or unfair dismissal under the Employment Rights Act
1996.
Equality Act 2010
For the purposes of the Equality Act 2010 police officers are treated as employees of
the Chief Officer under whose direction and control they are serving. As in all walks
of life there are situations and circumstances that occur in the police service where
people are treated unfairly. That treatment can only be unlawful if it is on one or
more grounds identified by the Equality Act.

230
Protected characteristics – the Act sets out nine ‘protected characteristics’
that are covered by the law in some or all circumstances: namely, age,
disability, gender reassignment, marriage and civil partnership, pregnancy
and maternity, race, disability, sex, religion or belief and sexual orientation.
Equal pay – the Act provides for the provision of equal pay between women
and men who are undertaking like work, work of equal value or work rated as
equivalent.
Unlawful discrimination – the Act sets out four main types of unlawful
discrimination: direct discrimination, indirect discrimination, victimisation and
harassment.
Disability discrimination – the Equality Act 2010 provides disabled people with
protection from discrimination in a range of areas, including employment. It is
unlawful to discriminate against workers because of a physical or mental
disability or fail to make reasonable adjustments to accommodate a worker
with a disability. Under the Equality Act 2010 a person is classified as
disabled if they have a physical or mental impairment, which has a substantial
and long-term adverse effect on their ability to carry out normal day-to-day
activities. In addition to the four main types of discrimination, the Act
incorporates two specific types of discrimination in respect to disability:
discrimination arising from disability and duty to make reasonable
adjustments.
The Public Sector Equality Duty – the duty applies to all organisations listed in
the Act. All Chief Constables and police and crime commissioners are
covered as is the Home Office. There is a general equality duty set out in
s149 of the Act that requires those subject to the equality duty, in the exercise
of their functions, to have due regard to the need to:
o Eliminate unlawful discrimination, harassment and victimisation and other
conduct prohibited by the Act.
o Advance equality of opportunity between people who share a protected
characteristic and those who do not.
o Foster good relations between people who share a protected characteristic
and those who do not.
Specific duties are imposed by secondary legislation and require Chief Constables in
England and Wales to publish equality information to demonstrate their compliance
with the general PSED and equality objectives it should achieve to comply with the
PSED.
In some circumstances it may be lawful for an employer to treat people differently,
for example, if there is a genuine occupational requirement or to implement a policy

231
of positive action. In these circumstances an employer would need to show that the
measure adopted is a proportionate means of achieving a legitimate aim.
Part Time Workers (Prevention of Less Favourable Treatment) Regulations
2000
For the purposes of the Part Time Workers Regulations police officers are treated as
employees. Under these regulations a part time worker has the right not to be
treated by his or her employer less favourably than the employer treats a
comparable full time worker as regards the terms of his or her contract (Police
Regulations and Determinations 2003 in the case of police officers) or by being
subjected to any other detriment by any act, or deliberate failure to act, of his or her
employer. The protection only applies if the treatment is on the grounds that the
worker is a part time worker and the treatment is not justified on objective grounds.
Public Interest Disclosure Act 1998 (“whistleblowing”)
The Public Interest Disclosure Act 1998 protects workers (including police officers)
from being victimised and/or losing their job if they report suspected malpractice by
their employer, colleagues or third parties. Uniquely the provisions in respect of
unfair dismissal apply to police officers who, except for health and safety reasons,
are not able to bring claims of unfair dismissal in any other circumstances.
Working Time Regulations 1998
The Working Time Regulations 1998 (WTR) implement the European Working Time
Directive. The Directive is based on the need to ensure a better level of protection of
the safety and health of workers. The Regulations make express provision for the
police service. The main provisions give workers the right to:
a limit on average weekly working hours of 48
a limit on night workers average normal daily hours of 8
health assessments for night workers
a minimum daily rest period of 11 consecutive hours
a minimum weekly uninterrupted rest period of 24 hours (or 48 hours
per fortnight)
rest breaks at work (where the working day is more than 6 hours, an
uninterrupted period of not less than 20 minutes)
4 weeks paid annual leave

232
Working time is any time during which a worker is working, at the employer’s
disposal and carrying out the employer’s activity or duties and any period during
which the worker is receiving relevant training and any additional period which is to
be treated as working time under a relevant agreement for instance Regulation 22 of
Police Regulations 2003 provides that time spent in travel outside of rostered duty
hours to and from duty at a place other than the normal place of duty, should be
treated as duty time.
There are some exclusions in certain circumstances. This would generally happen
where the WTR conflict with the specialist characteristics of the police service such
as when a planned operation changes or there is an exceptional event. In view of
the health and safety basis of the Regulations these exceptions should be
interpreted in a very limited manner.
In addition, the WTR cannot be used to reduce existing provisions contained in
Police Regulations and determinations 2003.
Other relevant legislation
As explained above, police officers are officers of the crown and not employees in
the usual sense. When the Government introduces reforms to employment
legislation that apply to all workers, in most cases they do not apply to police officers.
Recent examples of this include the Work and Families Act 2006, the Additional
Paternity Leave Regulations 2010 and most recently the Children and Families Act
2014.
When the Police Negotiating Board was in existence it provided a route for the Staff
Side to seek agreement that Police Regulations and determinations be amended to
ensure that police officers could benefit from the same entitlements as other
workers. Staff Side was instrumental in securing such agreement in the recent
cases of the Work and Families Act 2006 and the Additional Paternity Leave
Regulations 2010. This is a vital undertaking that ensures police officer terms and
conditions do not significantly lag behind the terms and conditions of other
employees throughout England and Wales. In addition, it helps to ensure a level of
consistency between police officers and partners who work in other sectors. For
example, if regulations and determinations were not amended it could mean that
partners of police officers (as well as the officers themselves) might not be able to
benefit from their statutory entitlements in the case of shared parental leave for
example.
The Children and Families Act 2014 remains outstanding in that it has not yet been
translated into Regulations and determinations. Before it was abolished the PNB
reached agreement that police officers should benefit from the entitlements
contained within the Act, unless otherwise justified, and it noted that the precise
detail of implementation would be considered by the newly formed Police

233
Consultative Forum. The Forum has recently written to the Home Office detailing the
provisions it would like to be included in Regulations and determinations.
In addition to this, police officers are not covered by the Right to Request Flexible
Working, as set out in the Flexible Working Regulations 2014. Whilst Police
Regulations place no restrictions on police officers applying to reduce their hours or
to work flexibly there is no provision under which an officer has a specific right to
request to work flexible hours or hours outside the usual shift pattern. However, a
refusal to allow an officer to work part time or flexibly could give rise to a separate
legal challenge of unlawful discrimination under the Equality Act 2010.