Submission: Exposure draft of the Carbon Pollution ...
28
Page 1 of 28 Submission: Exposure draft of the Carbon Pollution Reduction Scheme legislation Name/s of author/s: Foundation for Effective Markets and Governance ACN 094 694 078 c/-Regulatory Institutions Network Australian National University, A.C.T. 0200 Australia and National Consumer Policy Research Centre In conjunction with the Monash Centre for Regulatory Studies Law School, Monash University CLAYTON Victoria 3800 Contact person – Robin Brown The Foundation’s and the Centre’s involvement The Foundation and the Centre are partners in a project funded by the Consumer Advocacy Panel entitled: Attaining optimal carbon abatement rules through consumer advocacy: Learning from European Experience on the Regulation of Energy Short title: Consumers, Carbon and the European Experience The project is aimed at producing advocacy research papers, as well as research support for consumer group advocacy, in relation to the various current consultation processes relating to the development and implementation of climate change policies for the Australian energy markets. While the project involves consultation with consumer groups any opinions, conclusions and recommendations in this paper and future papers are to be attributed only to the project team members and not to any organisation consulted. Moreover, project team members recognise that certain organisations have special knowledge, particularly in the field of the needs and experiences of classes of consumers in Australia, especially those on fixed incomes and otherwise disadvantaged. Such organisations may well have their own developed views on appropriate solutions for the protection and advancement of the interests of particular classes of consumers. This project was funded by the Consumer Advocacy Panel (www.advocacypanel.com.au ) as part of its grants process for consumer advocacy projects and research projects for the benefit of consumers of electricity and natural gas. The views expressed in this document do not necessarily reflect the views of the Consumer Advocacy Panel or the Australian Energy Market Commission.
Transcript of Submission: Exposure draft of the Carbon Pollution ...

Page 1 of 28
Submission: Exposure draft of the Carbon Pollution Reduction Scheme legislation
Name/s of author/s:
Foundation for Effective Markets and Governance ACN 094 694 078 c/-Regulatory Institutions Network Australian National University, A.C.T. 0200 Australia and National Consumer Policy Research Centre In conjunction with the Monash Centre for Regulatory Studies Law School, Monash University CLAYTON Victoria 3800 Contact person – Robin Brown The Foundation’s and the Centre’s involvement The Foundation and the Centre are partners in a project funded by the Consumer Advocacy Panel entitled:
Attaining optimal carbon abatement rules through consumer advocacy: Learning from European Experience on the Regulation of Energy
Short title: Consumers, Carbon and the European Experience The project is aimed at producing advocacy research papers, as well as research support for consumer group advocacy, in relation to the various current consultation processes relating to the development and implementation of climate change policies for the Australian energy markets. While the project involves consultation with consumer groups any opinions, conclusions and recommendations in this paper and future papers are to be attributed only to the project team members and not to any organisation consulted. Moreover, project team members recognise that certain organisations have special knowledge, particularly in the field of the needs and experiences of classes of consumers in Australia, especially those on fixed incomes and otherwise disadvantaged. Such organisations may well have their own developed views on appropriate solutions for the protection and advancement of the interests of particular classes of consumers. This project was funded by the Consumer Advocacy Panel (www.advocacypanel.com.au) as part of its grants process for consumer advocacy projects and research projects for the benefit of consumers of electricity and natural gas. The views expressed in this document do not necessarily reflect the views of the Consumer Advocacy Panel or the Australian Energy Market Commission.

Page 2 of 28
Address: See above
Organisation: (if applicable)
See above
Phone: 02 62851667 Email: [email protected]
Fax:
Date of submission: 14 April 2009 Please read the confidentiality statement and choose from the options below.
Confidentiality statement All submissions will be treated as public documents, unless indicated otherwise below. Public submissions may be published in full on the Department of Climate Change website (www.climatechange.gov.au).
If your submission contains personal information of any third party individuals, please indicate below whether or not these individuals have consented to the publication of their information. If third parties have not consented to the publication of their information but you are happy for your submission to be made public, the Department will delete the personal information of third parties prior to publishing the submission on the Department of Climate Change website.
Any requests made under the Freedom of Information Act 1982 for access which is wholly or partly confidential will be determined in accordance with that Act.
Confidentiality
Please choose one of the options below by deleting the options that are not applicable.
3. I am/we are happy for this submission to be treated as a public document and understand that the submission may be published on the Department of Climate Change website
Personal Information
Please choose one of the options below by deleting the options that are not applicable.
1. This submission does not contain personal information of third party individuals.
Carbon Pollution Reduction Scheme Bill Part/s Division/s Clause/s Comment 1
1
3
We note that Professor Garnaut gave considerable attention to equity amongst Australian consumers in his report. We note that the Government has made clear its concern that climate change policy should operate equitably. However, it concerns us that the objects in the Exposure Draft of the proposed CPRS Bill do not include equity. We suggest that it is too often the case that policy development on climate change takes account of environmental and economic sustainability, but inadequately addresses social sustainability. We trust

Page 3 of 28
that the Government will address all three equally important legs of sustainability. We suggest that equity be reflected in the Bill’s objects.
1
1
3 (a) (ii)
We question the value of including in the bill the Government’s current target for emission reduction. It might be more appropriate to provide for the target to be set in the regulations pursuant to the legislation. Globally the setting of national targets is dynamic. Requiring Australia’s target to be changed by an amendment to an Act seems too cumbersome. Very soon, especially if the bill to be considered by the US Congress passes, a target of reducing emissions by 15% from 2000 levels by 2020 could be internationally very weak.
25
2
We consider that there will be a need for 2 to 3 year reviews rather than 5 year reviews of the proposed legislation. This is possible under the proposed provisions on special reviews which the Minister would be able to order. Changing targets, reducing the cap, introducing a floor price and including emission sources not covered could all result from special review, but this should be more explicit in the legislation.
25
4
359
The CPRS is likely to have profound effects on consumers, especially disadvantaged consumers. It is our very strong view that the Expert Advisory Committee should have a member with consumer policy experience. Such an appointment would greatly enhance the confidence of the community in the scheme. The legislation for the ACCC and the Productivity Commission provide precedents for this.
Consequential Amendments Bill Schedule Part/s Item/s Comment
Australian Climate Change Regulatory Authority Bill Part/s Division/s Clause/s Comment

Page 4 of 28
2
2
18(2)
Our comments in relation to the Expert Advisory Committee apply with the same force in relation to the membership of ACCRA
General comments
EU EMISSIONS TRADING SCHEME – LESSONS LEARNED
Introduction The Commentary to the Exposure Draft of the Carbon Pollution Reduction Scheme Bill 2009 opens with a quotation from the 2007 fourth assessment report from the Intergovernmental Panel on Climate Change (IPCC). It notes that climate change is the greatest social, economic and environmental challenge of our time. It goes on to state that scientific evidence confirms that human activities, such as burning fossil fuels coal, oil and natural gas), agriculture and land clearing, have increased concentration of greenhouse gases in the atmosphere. It further notes that this is affecting rainfall patterns, water availability, sea levels, storm activity, droughts and bushfire frequency, putting at risk Australian coastal communities, health outcomes, agriculture, tourism, heritage and biodiversity for current and future generations. To underline the seriousness of the situation and urgency of the need to change, the Garnaut Climate Change Review Final Report is called on to add to the bleak picture of Australia at the end of this century should greenhouse gas emissions continue unchecked. Garnaut predicts that in the absence of greenhouse gas emission abatement, there would be major declines in agricultural production across much of Australia. The reef system and biodiversity will be damaged. Coastal infrastructure would be at risk of damage and Australian export markets would have significantly lower economic activity feeding back into low prices for Australian exports and poorer terms of trade. The commentary then sets out the cost of inaction on climate change as leading to a 4°C temperature rise with widespread and severe consequences, including significant species extinction around the globe, increased danger of wildfire, real threats to food production, and severe health impacts, with dramatic increases in morbidity and mortality from heat waves, floods and droughts. A report from the Lowy Institute for International policy is cited as evidence for potential regional catastrophe. It notes that even if not catastrophic in themselves, the cumulative impact of rising temperature, sea levels and more mega-droughts on agriculture, freshwater and energy could threaten the security of states in Australia's neighbourhood by reducing their carrying capacity below a minimum threshold, thereby undermining the legitimacy and response capabilities of their governments and jeopardising the security of their citizens. The government's climate change strategy It thus comes as a great shock, to discover that the government has committed to medium-term national target range of reducing emissions by just 5% of 2000 levels by 2020, and a long-term

Page 5 of 28
Figure 1: Coverage of EU ETS
emissions reduction target of 60% below 2000 levels by 2050. By international standards, Australia's commitments are very low and highly dependent on future actions by other countries. The main plank of the government's strategy is reducing Australia's carbon pollution by between 5% and 15% of 2000 levels by 2020 and this principally through the implementation of the carbon pollution reduction scheme and expanded national renewable energy targets. To a large extent, the success of the government's climate change strategy rests on the efficacy of the carbon pollution reduction scheme the subject of the current bill. While Australia has had some limited experience of cap and trade schemes, the UK has operated a cap and trade scheme for carbon since 2001 and the countries which make up the European Union have operated the European Union emissions trading scheme since 2005. This submission describes something of the history and operations of the EU ETS and draws some lessons from its operation, which are relevant to the design and implementation of the Australian scheme. The European Union Emissions Trading Scheme (EU ETS) The European Union Emissions Trading Scheme (EU ETS) is arguably the world leader in a burgeoning trading market for environmental allowances. It is the corner-stone, carbon abatement strategy across the EU’s 27 member states and the main programme by which a carbon price is realised. With just over four years’ operation under its belt, it is now viewed as established. This paper provides an overview of the development of the EU ETS, as well as identifying some general lessons of the scheme for Australian policy-makers and business as design work progresses on the Carbon Pollution Reduction Scheme. Status The scheme was implemented in January 2005, and is now in its second phase. It trades allowances to cover CO2 emissions from permitted installations. It has two fundamental components: a cap on emissions set across participating sectors with individual governments adopting negotiated national caps; and a system for trading the ‘right to emit’. Sectors falling within the scheme account for approximately one half of all European carbon emissions with the electricity industry seen as a key polluter––see Figure 1. The total number of sites presently covered by the scheme is nearly 11,000. In the UK, almost 1,500 installations with combustion plant above 20MW, including all coal-fired power stations and most gas-fired stations, are required to operate within this cap.
Page 6 of 28
At a European level there are other targets and programmes. Firstly each member state has an energy efficiency reduction target, which calls for a 20% decrease in energy consumption by 20201, and there is a target for the EU as a whole to generate 20% of electricity from renewable energy sources by 2020. But all these other policies depend to varying degrees on the ETS and the robustness of the carbon price that it creates. After four full years the efforts centred on the EU ETS to move Europe to a low carbon economy seem to be producing carbon abatement benefits but also represent real costs to both the economy and consumers. Where they fall and the impact on competition, either for individual participants or consumers, or by sector on a single site or sector basis, are issues which need careful consideration during the policy development process, and they continue to be addressed by the European Commission and Member States governments. Standing The importance of the EU ETS to wider carbon trading systems and experience is borne out by Table 1. The basic facts are that the scheme accounted for two thirds of carbon volumes traded globally in 2007 and almost 80% of turnover. Although it is relatively early days for the development of market-based systems for environmental regulation, the profound change represented by the ETS implementation mean there is much happening in Europe that should assist policy makers elsewhere to develop climate change policies and carbon trading systems.
1 European Commission climate change fact sheet http://ec.europa.eu/climateaction/docs/climate-energy_summary_en.pdf

Page 7 of 28
Table 1: Global transaction volumes and values in carbon
Volume (Mt CO2e) Value (US$mn) Markets 2006 2007 2009
(est) 2006 2007 2009
(est) Voluntary OTC Market
14.3 42.1 58.5 258.4
CCX 10.3 22.9 38.3 72.4 Total Voluntary Markets
24.6 65.0 96.7 330.8
EU ETS 1,104 2,061 3,800 24,436 50,097 59,600 Primary CDM 537 551 6,887 6,887 Secondary CDM 25 240 8,384 8,384 Joint Implementation
16 41 141 495
New South Wales 20 25 225 224 Total Regulated Markets
1,702 2,918 40,072 66,087
Total Global Market
1,727 2,983 5,900 40,169 66,417 81,700
Source: New Carbon Finance (2008), The World Bank (2008), Point Carbon (2009), New Carbon Finance (2009) The scale of the development challenge facing the electricity sector is highlighted by the following statistics on the US, but these are not untypical for most developed economies. In 2006 the electric industry accounted for 70% of total 12.21MtSO2 emissions, 20% of 15.83Mt NOx emissions, 68% of 67.65 Mt mercury air emissions, and 40% of 6.15bn Mt CO2 emissions. As a polluter it is worse than other major sectors such as industry or transportation. Box 1 shows similar relationships for the UK. It is already clear that the passage of recent and future carbon regulation will also have significant impacts on worldwide environmental commodity markets. These metrics show why the electricity industry globally will be under sustained pressure from policy makers to help them deliver greenhouse gas abatement strategies: And market-based trading systems are the preferred instrument of choice for policy-makers internationally. Climate change strategies The climate change agenda in both the EU and the UK is, comparatively speaking, well-developed. We have noted other EU targets already; in the UK the Climate Change Programme rolled out since 2001has progressively applied carbon abatement incentives and sanctions across the economy. Important mechanisms include: a Renewables Obligation on electricity retailers to meet a defined level of supply to their
consumers from renewable sources; a regulatory carbon abatement obligations also on retailers; and

Page 8 of 28
a partial business energy tax with climate change agreements available to impacted sectors that provide exemptions in return for commitment to emissions reductions.
Indeed just recently the British Government introduced agreements between it and energy suppliers to introduce energy services in the small business sector with the ultimate aim of reducing carbon emissions from these customers. The key point here is that, with a new Carbon Reduction Commitment also being developed to be implemented from April 2010 which encourages emission reductions from large non energy intensive sector through a separate (although linked) cap and trade scheme, virtually all areas of the British economy are now covered by either a voluntary or mandatory scheme to reduce carbon emissions or to improve energy efficiency. Within this framework, carbon trading is the key to unlocking least-cost abatement opportunities and the rate of success—or lack of it—will be a key determinant of whether targets can be met. Further almost half of the carbon savings targeted for 2010 under the 2006 Climate Change Programme are expected to be derived from the EU ETS, as Figure 2 shows.
Page 9 of 28
Box 1 – UK Carbon profile
Government statistics show a steady fall in emissions from 1979 to the mid 1990s. This was due mainly to the displacement of coal in electricity generation by gas and nuclear power, but also a fall in industry emissions. Subsequently, there have been annual variations in emissions since the mid-1990s, but no clear trend has emerged. The latest verified figures are available for 20072, although provisional 2008 figures have been published. In 2007 (provisional estimates for 20083 are in square brackets) UK emissions of the basket of six greenhouse gases (GHG) covered by the Kyoto Protocol were 636.6[623.8]mtCO2e, 2.4% lower than 652.3mt CO2e in 2006. CO2 accounted for 85% or 542.6[531.8]mn tonnes of total UK GHG emissions in 2007, a decline of 1.5%[2%] on the previous year. Energy supply was the major source of emissions in 2007 with 40% of the total followed by road transport (22%) and business and residential consumption, at 16% and 14% respectively. The most recent GHG projections were published in February 20084. UK carbon emissions were forecast at 119-129 MtC in 2020 equating to a 20-26% reduction on 1990 levels. The 2020 figure, on these central estimates, of a 22% cut is also outside the proposed carbon budget entrenched in the Climate Change Act 2008, which requires cuts of at least 26%. The Government acknowledged that additional policies were needed to increase prospects for meeting targets, and the electricity sector will remain a key focus in achieving these reductions. Its contribution is set to remain at around 30%. Experience to date As part of the EU’s 1997 commitment to the Kyoto protocol it was agreed that the community would take on a burden sharing agreement across member states to reduce the amount of CO2 emitted over the period 2008-12 by 8% from 1990 levels, well-above the level agreed with other developed economies. Originally, the EU had posited a carbon tax as the preferred mechanism to encourage carbon emission reductions, but as we have seen a trading scheme preferred and underwritten by a directive. The scheme also permits participants to trade in validated credits from the developing world through Kyoto’s ‘clean development mechanism’.5
2 2007 Greenhouse Gas Emissions, Final Figures http://www.defra.gov.uk/ENVIRONMENT/statistics/globatmos/download/ghg_ns_20090203.pdf 3 2008 Greenhouse Gas Emissions, Provisional Figures http://www.defra.gov.uk/ENVIRONMENT/statistics/globatmos/download/ghg_ns_20090326.pdf 4 Updated Energy and Carbon Emissions Projections http://www.berr.gov.uk/files/file39580.pdf 5 It is also possible for developed countries within the trading scheme to sponsor carbon projects that provide a reduction in greenhouse gas emissions in other countries, as a way of generating tradable carbon credits. The Protocol allows this through Clean Development Mechanism (CDM) and Joint Implementation (JI) projects, in order to provide flexible mechanisms to aid regulated entities in meeting their compliance with their caps. The UNFCCC validates all CDM projects to ensure they create genuine additional savings and that there is no carbon leakage.
Page 10 of 28
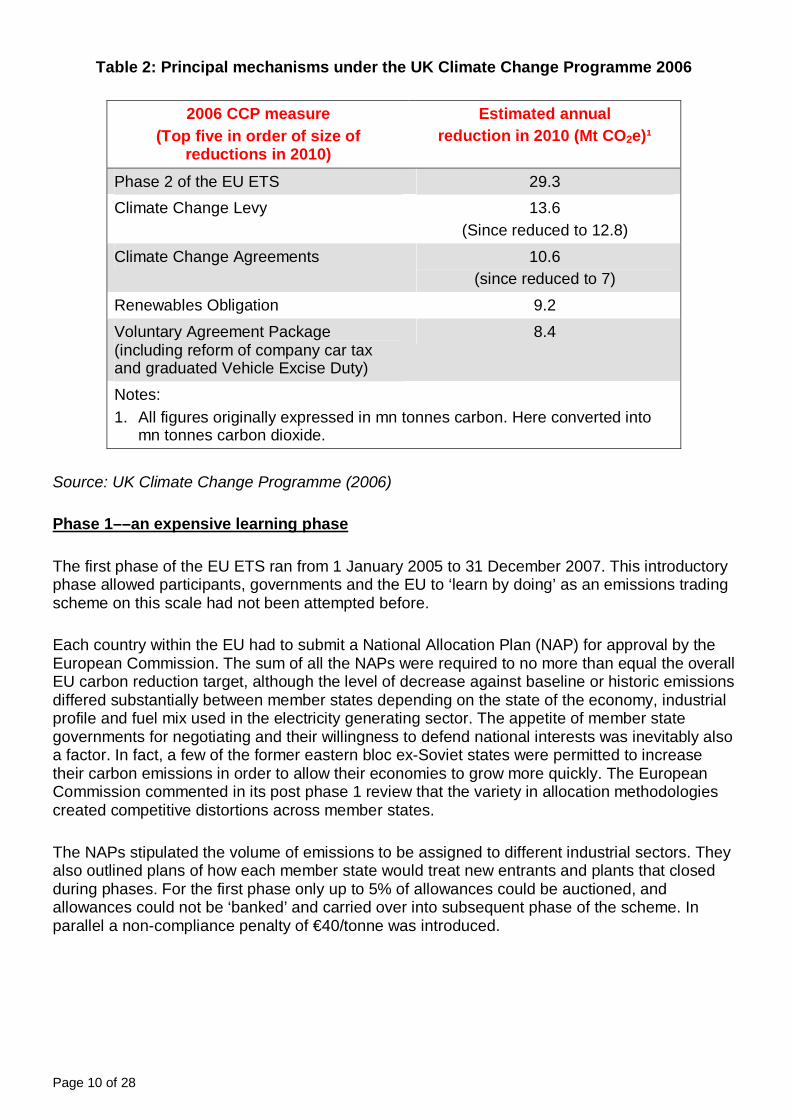
Table 2: Principal mechanisms under the UK Climate Change Programme 2006
2006 CCP measure
(Top five in order of size of reductions in 2010)
Estimated annual reduction in 2010 (Mt CO2e)¹
Phase 2 of the EU ETS 29.3 Climate Change Levy 13.6
(Since reduced to 12.8) Climate Change Agreements 10.6
(since reduced to 7) Renewables Obligation 9.2 Voluntary Agreement Package (including reform of company car tax and graduated Vehicle Excise Duty)
8.4
Notes: 1. All figures originally expressed in mn tonnes carbon. Here converted into
mn tonnes carbon dioxide. Source: UK Climate Change Programme (2006) Phase 1––an expensive learning phase The first phase of the EU ETS ran from 1 January 2005 to 31 December 2007. This introductory phase allowed participants, governments and the EU to ‘learn by doing’ as an emissions trading scheme on this scale had not been attempted before. Each country within the EU had to submit a National Allocation Plan (NAP) for approval by the European Commission. The sum of all the NAPs were required to no more than equal the overall EU carbon reduction target, although the level of decrease against baseline or historic emissions differed substantially between member states depending on the state of the economy, industrial profile and fuel mix used in the electricity generating sector. The appetite of member state governments for negotiating and their willingness to defend national interests was inevitably also a factor. In fact, a few of the former eastern bloc ex-Soviet states were permitted to increase their carbon emissions in order to allow their economies to grow more quickly. The European Commission commented in its post phase 1 review that the variety in allocation methodologies created competitive distortions across member states. The NAPs stipulated the volume of emissions to be assigned to different industrial sectors. They also outlined plans of how each member state would treat new entrants and plants that closed during phases. For the first phase only up to 5% of allowances could be auctioned, and allowances could not be ‘banked’ and carried over into subsequent phase of the scheme. In parallel a non-compliance penalty of €40/tonne was introduced.
Page 11 of 28
Box 2 – The Stern Review
The Stern Review6 was announced by the UK Government in July 2005 and set out to provide a report to the UK Government assessing the nature of the economic challenges of climate change and how they can be met, both in the UK and globally. The report from the review argued that establishing a global carbon price is essential to ensure that the full social costs imposed on the world and on future generations by GHG emissions are reflected in the prices of goods and services. As such, carbon pricing is the first essential element of climate change mitigation policy. The report said in principle a global carbon price could be imposed by either a carbon tax or a global cap and trade scheme. Both have theoretical advantages and disadvantages. A global carbon tax could provide a less volatile carbon price (which helps investment decisions) and more certainty on abatement costs. On the other hand a global cap and trade scheme may be preferable if exceeding the absolute emission reduction target implies major risks. In practice a global carbon market is more likely to emerge as the way forward because of the difficulties associated with coordinating taxation across national borders and because the expected evolution of the climate change policy framework towards absolute emission targets lends itself to emission trading. Nonetheless taxes have a role to play in pricing carbon at a national level. In sectors where there are large numbers of small emitters the transactions costs associated with emission trading may be undesirably high and a tax may be preferable. Finally, the report argued that policies to remove barriers to behaviour change are also needed to ensure that opportunities for cost-effective mitigation options are not missed because of other market failures, such as the lack of information, the complexity of the choices available or the high upfront cost and long payback period. Regulation, provision of information, financial incentives and loans are among the policies that can be employed to overcome these market failures. In the UK, for example, the total allowances allocated equated to 65MtCO2 (around 8% of all UK emissions) below projected emissions of installations covered by the scheme. The Government then allocated7 allowances across participating sectors, which it decided should receive allowances equivalent to projected emissions; the power sector would receive the rest. Therefore the electricity industry was responsible for delivering the savings which the UK expected during phase 1. The rationale for this decision was that the sector was considered to face limited international competition and have relatively large scope for low cost abatement opportunities. Unlike the UK, most member states submitted fairly lenient NAPs as national governments were either unsure of the success of the scheme or feared the possible detrimental impact the scheme could have on home-grown industries competing internationally. Other reasons for the submission of looser NAPs included uncertainty with, or lack of, robust historical emissions data within some member states and the argument that participants should be allowed during phase 1 to become accustomed with trading and compliance and that meaningful emission reductions should only begin in phase 2. At the time the European Commission had insufficient political power to insist that national targets should be tightened further. The result was that most
6 The Stern Review http://www.occ.gov.uk/activities/stern.htm 7 UK Phase 1 National Allocation Plan. http://www.defra.gov.uk/ENVIRONMENT/climatechange/trading/eu/operators/phase-1.htm

Page 12 of 28
of the tradable allowances, known as European Union Allowances (where one EUAs is equivalent to one tonne of CO2 emissions), were allocated to relevant installations for free.

Page 13 of 28
Table 3: Impact of EU ETS on total UK emissions
Source: UK Climate Change Programme Annual Report to Parliament, July 2008.
The staff of the European Commission has since commented that different levels of ambition for the ETS sector in member states translated into different allocations at sector and installation level. This practice resulted in the lack of a level playing field.8
Table 4: EU ETS Phase 1 results
2005 2006 2007 Phase 1 total Total 215.2 217.7 228.8 661.7 Power sector 135.7 135.6 136.0 407.3
Allocation of allowances (millions)
Other sector 79.5 82.3 92.9 254.7 Total 242.3 251.1 256.4 749.8 Power sector 172.2 181.5 177.9 531.6
Verified emissions (MtCO2)
Other sector 70.1 69.6 78.4 218.1 Total (27.1) (33.3) (27.6) (88.0) Power sector (36.5) (45.9) (41.9) (124.3)
Excess or (shortfall) of allowances (millions) Other sector 9.5 12.7 14.5 36.7
Source: UK Climate Change Programme Annual Report to Parliament, July 2008. Of course the whole point of the EU ETS is to reduce carbon emissions by creating a financial incentive on large emitters to become less carbon intensive. The introductory phase established that the value of carbon is governed, to varying degrees, by the:
8 The Commission’s impact assessment is here.
Base year
2005 2006 2007
(MtCO2e
) (MtCO2e
) Relative to base
year
(MtCO2e)
Relative to base
year
(MtCO2e)
Relative to base
year CO2 excluding EU ETS
592.4 555.2 -6.3% 554.5 -6.4% 543.7 -8.2%
CO2 including EU ETS
592.4 528.1 -10.9% 521.2 -12.0% 516.1 -12.9%
All greenhouse gases excluding EU ETS
779.9 655.5 -16.0% 652.3 -16.4% 639.4 -18.0%
All greenhouse gases including EU ETS
779.9 628.4 -19.4% 619.0 -20.6% 611.8 -21.6%

Page 14 of 28
tightness of cap (as per the aggregate NAP decisions); relative fuel prices (gas/coal); weather (impact on demand and availability of hydro plant); and regulation (including decisions on new entrant reserve, closure of plant rules, banking of
allowances rules etc.). But the dominating theme from phase 1 was the over-generous allocations by most governments. There are already clear lessons to be learned from this over-allocation. Further in 2005 traders anticipated a shift from coal to gas in the power generation sector to deliver the emission reduction required, and therefore estimated that the cost of carbon could be arbitraged between gas and coal prices. But this proved not to be the case, which in turn devalued EUAs. Another effect witnessed under phase 1 was that industrial emitters often resisted trading at the beginning of the phase as they either wanted to ensure their EUA allocation would actually cover their own compliance (which was the primary aim) or they did not have the capability to trade. This trend reversed to a degree once industrial emitters were satisfied they could cover their own emissions, but the allowance surplus entered the market just as demand for them from the power sector fell. The publication of emissions data for 2005 in the late spring of 2006 confirmed what many commentators already knew, namely that EUAs had been over-allocated, which immediately caused their value to more than halve as Figure 2 shows. To compound matters, as EUAs could not be banked and used for phase 2 of the scheme, the values fell further until they eventually became worthless. This volatility is generally considered to have had a very negative impact, and has been compounded by the disorderly release of information to the market. Some commentators believe that banking between phases would have greatly mitigated some of these risks. Another factor that increased volatility was the annual reporting cycle, which meant that data was unavailable until nearly half of the trading period had passed. This then curtailed opportunities to adjust emissions, if necessary.

Page 15 of 28
Figure 2: Carbon prices under the EU emissions trading scheme
Source: Point Carbon (August 2008) The effects of free allocation of allowances are still being debated. A number of studies point to the fact that the power sector has, on the whole, benefited greatly from the EU ETS to date. It is estimated that generators can pass through nearly the full marginal value of the allowances, despite receiving them largely for free. In this context, as free allocation of allowances is in essence a subsidy. The outcome was––and is, as the majority of allocations have continued to be on a free basis under phase 2––consumers pay more for their energy without a corresponding reduction in carbon emissions of an equivalent value. A study for the UK government concluded that “the combination of free allocations with full pass-through of marginal costs is estimated to result in increased profitability for the UK power generation sector of approximately £800mn/year over phase 1”. It commented further that “this represents a direct transfer of value from electricity consumers.”9 This transfer has aggravated negative distributional effects as power generators generally do not have the same exposure to loss of market share as other industries do. This behaviour though is a result of political process and not improper activity by the power sector, although had the power market been more competitive, many of these profits might have been competed away. Indeed the high energy prices seen in the UK during much of 2008, driven by higher global commodity prices and concerns over the effectiveness of wholesale markets, led to calls for a windfall tax on the industry from various political quarters. Although the UK Government rejected levying a windfall tax, it did negotiate a deal with generators and suppliers to fund a series of social community programmes aimed at low-income and vulnerable communities up until 2012. This initiative can be viewed as a claw-back of some of the value of the free allocation of carbon allowances.
Free allocation can also have other perverse effects. It can distort the merit order and encourage installations to maintain current emission levels as there are legitimate fears that allowance allocation could be reduced in the future when abatement costs may cost less. The rules governing how installations which close during phases can also create distortions as it can impact on decisions to close plant, and could encourage deviation from the least-cost option should EUAs be allocated to a carbon intensive plant which would have otherwise ceased
9 A debate is continuing in the UK about the merits of a windfall tax on upstream profits of power generators. Further the Spanish government is clawing back about €1.1bn from the 2006 revenues of the power companies.

Page 16 of 28
operation? Most member states prohibit installations retaining EUAs once operation has ceased, but as the value of free allowances can be passed through there were installations that could afford to continue operation without taking action to reduce emissions. In turn, this behaviour dampens the price signal for new, less polluting plant. When submitting NAPs all members states retained some allowances for a ‘new entrant reserve’ to allow for the inclusion of new plants becoming operational during the phase. The justification to give free allowances to new emitters is to ensure a level-playing field for all new emitters, and not penalise a particular sector. There were also concerns that if the trading market was not sufficiently liquid, or incumbents chose to hold onto EUAs, then new emitters may not have been able to buy sufficient number of allowances, hence acting as a barrier to new entrants. Some member states chose to apply benchmarks based on fuel type for new entrants. Often these varied between gas and coal. In Germany, for example, about twice as many allowances in the new entrant reserve were set aside for coal plant than gas. The rationale for this was Germany is phasing out its nuclear fleet and is concerned about fuel import dependency and has substantial coal and lignite reserves. The outcome of use of this method and other rules governing the new entrant reserve strategy was to make new coal plant financially more attractive than gas generators. It also created incentives to locate new, carbon intensive plants in countries with more generous new entrant allocation. Despite these concerns, the establishment of the scheme and its operation during phase 1 was generally considered a success, not least because it operates across so many sovereign states. The basic processes, systems, verification procedures, compliance systems and trading infrastructure have been developed at the national level; a simplified representation of the EU trading year is at Figure 3. Perhaps as important it has brought the cost of carbon for the first time to the board level in participating sectors. The European Directive enshrining the scheme in law was only passed in October 2003, which then gave member states just two months to transpose it into national law and then a further twelve months to prepare NAPs and implement systems. Despite the apparent haste, it is unlikely that the scheme format would have been much different if more time had been available.

Page 17 of 28
Figure 3: Typical emissions trading year
Of the 6.12bn EUAs issued during phase 1, almost 1bn were traded at an average price of €18/tonne generating around €18bn in revenue during 2006, and in 2007 the volume rose to about 1.6bn traded at an average price of €17.5/tonne generating around €28bn in revenue. To put this into perspective the EU has a GDP of €11tn a year. Phase 2––beginning to learn from experience The second phase of the EU ETS runs for almost twice as long as the first, from 1 January 2008 to 31 December 2012. The NAPs submitted for phase 2 found the European Commission in a position to insist that overall the targets for all the submissions had to be tightened by over 10%.10 Emission reductions both forecast and actually achieved in phase 1 enabled the overall target for phase 2 to be set with greater confidence. In parallel, the non-compliance penalty was increased to €100/tonne, and in a further real improvement over phase 1 banking is now permitted (but not at this stage borrowing). Perhaps less encouraging though was the outcome that only about 3% of all EUAs are to be auctioned. However, this figure is skewed by different approaches in individual member states, although Germany plans to auction 9% of allowances and the UK 7%. During 2009-10 the UK Government will hold ten auctions11 with volumes varying between 2mn-4.2mn allowances, and the first of these has already been held.12 As already noted, unlike the first phase, emitters are now permitted to bank a percentage of EUAs between years. Banking smoothes allowance price volatility between phases and arguably gives investors some comfort that the price of carbon can be factored into investment plans that exceed the number of years of each phase.
10 A summary of the phase 2 NAPs is at p9 of the IEA document Emissions trading : Trends and prospects (2007), at http://www.iea.org/textbase/papers/2007/ET_Trends&Prospects.pdf. 11 Defra EU ETS auctioning page http://www.defra.gov.uk/ENVIRONMENT/climatechange/trading/eu/operators/auctioning.htm 12 The first auction achieved a clearing price of €16.15 for 4mn EUAs in November 2008; the second auction achieved a clearing price of €10.98 for 4mn EUAs in March 2009.

Page 18 of 28
Figure 4: EUA prices April 08 - April 09
0
5
10
15
20
25
30
35
40
Apr-08
May-08
Jun-08
Jul-08
Aug-08
Sep-08
Oct-08
Nov-08
Dec-08
Jan-09
Feb-09
Mar-09
Apr-09
€/t
EUA09
EUA10
EUA11
EUA12
Any emissions trading scheme could encourage ‘leakage’—a situation where local industries relocate to economies with less stringent or no carbon reduction regimes because they cannot compete with industries elsewhere. In the case of the EU ETS these fears have not been as great as originally thought perhaps because of the extent of free allocations. Nevertheless the European Commission proposed in September 2008 that sectors at risk of ‘leakage’ should continue to receive free allocations for phase 3. Detailed criteria for assessing the sectors at risk are currently being developed and are schedule for publication before 31 December 2009. Over time as the overall cap is lowered and costs of compliance increase, this issue is likely to become a much more sensitive matter politically both at Community and member state level. The current global recession has seen the value of EUAs drop significantly over the last year or so, and at one point dipping below the psychologically important €10/t barrier – see Figure 4. The fall is largely due to lower demand for EUAs as demand for industrial output and energy fell as the financial downturn began to bite. This has been further compounded by many emitters liquidating their allowances as credit has become harder to obtain. Based on experience to date and the initial auctions, the UK Government Environmental Audit Committee13 has begun an inquiry into the role of emissions trading in delivering UK and international climate change objectives. Among the issues to be covered are the extent to which credits from developing nations and former Eastern Bloc countries actually represent cuts in emissions; whether emissions trading ought to be supplemented or replaced by a tax or regulation; the record of EU ETS phase 2 and prospects for phase 3; impacts of economic recession on the workings of the scheme; effects of the expansion of the EU ETS to encompass aviation; progress of cap and trade schemes in other countries (notably, the US), and the prospects for linking them; and whether a price floor and cap should be introduced to provide the necessary investment signals going forward. We pick up some of these design issues in the final section of the paper. Looking ahead––phase 3 plans The third phase of the EU ETS will run from January 2013 until December 2020. The Commission published a ‘Proposal for a Directive’ (in effect a green paper) in January 2008 as part of a formal review it is obligated to carry out. The proposals cover the inclusion of other greenhouse gases, in effect all major emitters not currently covered by the EU ETS, including 13 Environmental Audit Committee homepage www.parliament.uk/parliamentary_committees/environmental_audit_committee.cfm

Page 19 of 28
aviation (although specific industries such as agriculture and transport may be better suited to separate measures) and developing a EU-wide cap for emissions which will remove the need for Member States to produce NAPs. The ambition is that this will create a ‘harmonised’ free allocation of allowances process across Member States. The Commission has also stated14 that allowances will be reduced by 21% in 2020 over 2005 levels setting the average annual cap at 1.8bn tonnes between 2012 and 2020, with a constant annual reduction of 1.74% over the period. For the third phase starting in 2013, in a very important development announced in March 2008 as part of the UK Government’s annual budget, the power generation sector is to receive no free allocations and to obtain the allowances they require via auctions from the outset of phase 3. However the Commission has agreed that other Member States can seek derogation from this related to the interconnectivity of their electricity grid, share of a single fossil fuel in electricity production, and GDP/capita in relation to the EU-27 average. Other sectors are expected to follow suit but in a gradual, phased process. The level of auctioning of allowances for non-exposed industry will increase in a linear manner but rather than reaching 100% by 2020 as original posited, it will reach 70%, with a view to reaching 100% by 2027. A new provision will apply for phase 3 in case of excessive price fluctuations in the allowance market. If, for more than six consecutive months, the allowance price is more than three times the average price of allowances during the two preceding years on the European market, the Commission will convene a meeting with Member States. If it is found that the price evolution does not correspond to market fundamentals, the Commission may either allow Member States to bring forward the auctioning of a part of the quantity to be auctioned, or allow them to auction up to 25% of the remaining allowances in the new entrant reserve. The proceeds from auctioning 300mn EUAs from the new entrants reserve will be used to support up to 12 carbon capture and storage demonstration projects, which is intended to help demonstrate innovative renewable energy technologies. In terms of operation of the scheme, the European Commission has also proposed to create a centralised registry rather than national registries to reduce compliance complexity and costs for participants, which are generally considered to be high especially for smaller players. Perhaps the most ambitious proposal though is to improve links and trading possibilities between other emissions trading schemes worldwide, though details are as yet sketchy. If achieved, this should reduce instances of ‘leakage’ and help the true cost of carbon to be discovered. Of course carbon emissions have the same impact on climate change, regardless of where they are emitted. However, ss seen in the UK exchange fluctuations will present real challengers for the designers. The response date to the Commission’s proposals was September 2008, and the Government’s response should be published shortly. The expectation is that the new directive can be finalised by 2010. The arrangements across the three phases are shown in summary at Figure 5 below. 14 European Unions questions and answers on the revised EU emissions trading system http://europa.eu/rapid/pressReleasesAction.do?reference=MEMO/08/796&format=HTML&aged=0&language=EN&guiLanguage=en

Page 20 of 28
Figure 5: Overview of main features of EU ETS phases 1-3
Lessons There are many lessons to be learnt from the European experience, but the headline messages are: level of allowances: the undesirable impacts of over-allocation of allowances and a cap that
was too loose; method of allocation: free allocations of allowances means carbon rentals stay with the
company but can and do still increase the end-user cost of energy; products and power prices can be expected to reflect the marginal cost of carbon irrespective of the allocation method and can create windfalls;
efficient carbon prices: creating a carbon price of itself does not ensure that energy
participants will invest based on it; empirically allowance holders have not invested in low carbon: it is critical that the design of an emissions trading scheme must ensure carbon rentals are used for low carbon initiatives and not bolster profits or dividend payouts for shareholders, which is what has occurred in Europe; in turn to achieve this goal carbon prices must be pitched at a level that incentivises switching away from carbon-intensive technologies and which encourages generators to invest in cleaner replacement technologies;
unpredictable carbon prices: there is still continuing uncertainty as to how a credible, robust
and stable carbon price can be achieved that will deliver the carbon reductions that consumers are paying for, and these uncertainties have led to a debate on how greater price certainty can be achieved through enhancements to the scheme rules; and
interaction with other schemes:, it is unclear how will this carbon price be impacted with
development of other environmental trading systems.
Page 21 of 28
Some of these themes are developed below. Level of allocations Phase 1 allocations were too lax. While phase 2 allocations were more challenging, the market consensus is that the economic down-turn will also see carbon prices that at levels that do not encourage behavioural changes by generators. Investment in low carbon options is still being driven primarily by other incentives and regulatory obligations. If there are concerns about carbon leakage these should be addressed on a sector-specific basis, not through overly generally generous settlements. Free allocations and windfalls Phase 1 allocations were on a gifted basis; phase 2 incorporates a small element of auctioning, but in the wider scheme of things market participants do not as yet see the real cost of carbon. The position is set to change in phase 3, but the political fall-out from windfalls to industry is set to continue to 2013. In the UK, despite a relatively challenging cap compared to other member states, free EUA allocations to power generators of half to 70% of their requirements have earned significant windfall profits for generators. They have been able to pass through the full marginal cost of carbon into power prices. The view from the City is that full pass-through occurs where the wholesale power market is not competitive so, if market structures do not work as intended, then this will continue. Power markets more generally are susceptible to generators recovering marginal costs even if these costs do not materialise for some participants. The costs that British consumers bear as a result of this have been estimated to be in excess of £800mn a year during phase 1. The UK regulator, Ofgem, noted in January 200815 that British generators will be making a further windfall of between €9bn—€11bn over phase 2 of the scheme. Contrary to official statements, many of the beneficiaries are not directing these carbon rentals into low carbon investments. If carbon trading schemes allow participants to receive a windfall through free and/or over allocation then, as we’ve recently seen in the UK where utilities are now subject to levies to fund fuel poverty and community energy schemes, credibility suffers and the entire scheme becomes politicised with calls for taxes, price regulation, claw-back and so on. Similar debates have been apparent in Germany (where politicians have yet to act) and in Spain (where they have clawed-back some of the windfall benefit). Although there may be merits in such remedies, they are essentially symptoms of a failure to design the scheme appropriately. “Efficient” carbon prices Carbon prices have been volatile and prone to collapse. Forward prices are below levels considered to be necessary to incentivize different behaviours. There is already significant thinking on the extent to which minimum price levels need to be achieved and over what period for signals to stimulate low carbon investment to be maintained. A study by Cambridge University's Judge Business School (JBS), commissioned by the Government and to be published later this year, will argue that the EU ETS in its current form is 15 Ofgem press release http://www.ofgem.gov.uk/Media/PressRel/Documents1/Ofgem%202.pdf

Page 22 of 28
flawed and that the price of EUAs needs to be in excess of £85/t (about €75/t) if a sufficient range of low carbon technologies are to become viable. Previous studies have suggested that a price of between €30-50/t is required to make switching to even the most cost-effective renewable energy sources economically viable.16 Further some critics say that volatile prices emerging from emissions trading to date has probably diverted investment away from renewable-energy technology. In the UK a House of Commons Parliamentary Committee in 2007 reported that the power industry was holding onto its profits rather than investing them in low carbon energy generation. It also noted: “These profits have arisen because power companies have raised their prices to incorporate the market value of all the ETS allowances they have used to cover their emissions, even though the majority of these allowances were not purchased on the market but given to them, in their original allocations, entirely for free.”17 Related to this, ETS participants say investment decisions continue to be muddied by regulatory uncertainty. For example, compliance time-scales are generally out of sync with investment horizons. Unless there is at least a long-term mandatory or at least indicative target to give investors and management some comfort regarding the credibility of the scheme and commitment to it by governments, it will be hard to estimate permit values and the cost of carbon. A further factor––as recession bites, emissions trading will become less of an incentive to stop polluting. The market value of carbon credits is dropping as companies reduce manufacturing and send their permits rather than products off to market, reducing any market shortfall engineered into the phase 2 allocation decisions. In the case of the power sector, there is a collateral effect as the demand for their product––and hence their demand for permits––reduces. Supporting carbon prices A related issue is how to support such “efficient” prices. This is very topical given recent price movements. The recent collapse of EUAs to a low of €8 in February 2009 has led to growing calls for a floor to be imposed that would provide firms with greater confidence that investments in low carbon infrastructure will deliver long-term returns. For instance the IEA addressed this issue in a recent publication, which considered the impacts of a series of price caps and collars applied to carbon prices.18 The study concluded: “For similar emissions targets, introducing price floors slightly increases expected costs but betters the environmental results. For similar climate results, price floors allow for further reducing expected costs” .For price caps, they “would considerably reduce uncertainty on total abatement costs and expected abatement costs”. Overall “a proper combination of target with price cap and price floor can be designed to offer comparable probabilities of meeting a given temperature outcome at lower expected costs, and with much narrower uncertainty on total discounted abatement costs, than [a straight target].”
16 Different City analysts have suggested prices within this range, including Dresdener Bank and Merrill Lynch. 17 The EU Emissions Trading Scheme: Lessons for the Future, Second Report of Sessions 2006-07, House of Commons Environmental Audit Committee Report, paragraph 12. 18 Price caps and price floors in climate policy: A quantitative assessment, An IEA information paper (December 2008). The report considered two cases, case 1 a cap and at $110/tonne and floor at $35 and case 2 a cap at $150 and floor at $50 respectively over the period 2011-2020, rising in case 1 to a cap at $360 and a floor and $120 and case 2 a cap at $600 and a floor at $200 over the period 2041-2050 to deliver the G8 proposed objective of a 50% reduction in GHGs by 2050. Text quoted is from pages 8 and 33.

Page 23 of 28
In the UK various responses have been proposed. First Lord Turner, Chairman of the Committee on Climate Change called for a "floor price" on carbon allowances during a hearing of the Government’s Energy and Climate Change Select Committee on 4 March. Floor prices could be could be imposed as part of the EU ETS relatively easily by Governments setting a reserve price at auction. Others have called for a more radical restructuring of the arrangements. PricewaterhouseCoopers published a report on 23 March 2009 which argued that a hybrid carbon tax-and-trade scheme would provide firms with the certainty they require to invest in low-carbon technologies. The report assessed the merits of various carbon pricing mechanisms and concluded that there is a strong case for a hybrid model that combined the flexibility of cap-and-trade schemes with the certainty of a carbon tax by imposing a floor and ceiling price on carbon allowances. However, some commentators have remarked that such a hybrid scheme could undermine the markets ability to ensure the most cost-effective means of cutting emissions are those that attract the most investment. For instance, the JBS study referred to above will recommend that major reforms to the EU ETS are necessary and that the Government may need to impose a separate carbon tax on top of the trading scheme to deliver a clearer price signal to firms. Scheme interactions Interactions with other carbon abatement schemes (locally or regionally) can both undermine or support the trading scheme depending on the interaction. For instance phase 2 allows for the use of CDM and JI offsets for a total of 14% of the ETS cap. Many industrialists support this approach as it can open up cheaper procurement options as the associated allowances often trade at a discount to EUA prices; indeed there was a lot of pressure on national governments during the development of phase 2 to increase the portion that could be externally sourced. Interplay with other environmental schemes incentives also need to be taken into account. For instance, a study published in the scientific journal Nature in December 2008 claimed that nearly $6bn (A$9.2bn) already spent on projects to curb emissions of HFC-23, a greenhouse gas, had the same impact on the environment as would $132mn (A$ 203.7mn) worth of equipment upgrades. A different example is interaction with national schemes. Sometimes as in the UK national cap and trade scheme which operated between 2002 and 2005 have been developed to provide learning opportunities. Some parallel arrangements such as the Climate Change Agreements in Britain allow some sectors to avoid trading in the ETS. Others, as with the CRC referenced above, target other business sectors, and are designed with the stated intention of allowing evolution into a larger, integrated scheme, but over the shorter-term could create competing carbon allowance prices. As the IEA concluded in its 2007 assessment of trading schemes, “policy makers should pay attention to the relationship of ETS with other policies – those which are definitely complementary and should be part of the toolkit, and those which create redundancies at best, inconsistencies at worse”.19 We have prepared a summary of this useful paper which is appended below. Conclusion From an Australian perspective it is important to differentiate between the political rhetoric of the scheme’s designers and of the participating governments’ and companies’ claims of success. Probably the most striking conclusion is that after nearly five years of operation many of these
19 See footnote 10, at p15.

Page 24 of 28
fundamental design issues remain unresolved, and many of them will inevitably resurface during the development of phase 3. Unlike other more traditional commodities and markets, it is difficult to anticipate participant behaviour in the scheme and hence predict future price formation. Undoubtedly weaknesses in scheme design have exacerbated these uncertainties. However, despite these problems, it is now apparent that carbon costs are part of the investment and business decisions language, and are set to remain so, and this is the major success to date. Emissions trading schemes on their own are not the panacea to climate change. But such trading schemes are seen as a key element of the solution. Despite evident teething problems, the EU ETS is beginning to settle down and the development route is now clearly sign-posted. However a key question is whether, given the cost and complexity of the scheme and the undoubted design defects that customers have paid for, an approach based on taxation of energy use might have served policy-makers better.

Page 25 of 28
Appendix
Summary of IEA Report on Price Caps and Price Floors in Climate Policy The main principle that the report outlines is that where price caps and floors are used in conjunction with quantitative emissions limits it reduces the total abatement costs over the period and delivers similar environmental outcomes. The report is set out in three sections:
o No policy o Straight targets o Price caps and floors
I. No Policy In the event that the international community does not institute a policy, global emissions will continue to increase, and at best guess will hit 60 Gt CO2 by 2050. According to the report that would mean that there is a 50% chance that the earth would warm more than 3.16°C. II. Straight Targets There are two options the report looks at: reducing global emissions to half of 2005 levels and reducing global emissions to half of 1990 levels. a) Halving global emissions from 2005 levels The report assessed the total abatement cost (TAC) by giving each parameter a value considered most likely, as if there were no uncertainty at all. Under this model, the TAC for the first period (2011-2020) is USD 350 billion to achieve 94% of 2005 emissions; the marginal abatement cost (MAC) which is measured as $/t CO2 is USD 67 billion. The total cost in this best case scenario was USD 2 754 billion at net present value (NPV), and it would achieve a 50% reduction on 2005 levels, which would mean a total emissions output of 135.680 Gt CO2.
QuickTime™ and aTIFF (Uncompressed) decompressor
are needed to see this picture.
The report then attempts to model what would occur if there were uncertainties in the scenario. It ran 3 000 Monte Carlo simulations using Abatement Costs Temperature Changes Model (ACTC) to take uncertainties into account. When doing so, and taking the mean of the simulations, the TAC cost for the first period goes from USD 350 billion to 929 billion, which then causes the MAC to increase from USD 67 billion to 92 USD billion. The total cost also substantially increases from USD 2745 NPV to USD 7 885NPV.

Page 26 of 28
QuickTime™ and aTIFF (Uncompressed) decompressor
are needed to see this picture.
b) Halving global emissions from 1990 levels The TAC for this modelling is substantially higher than the previous model. The TAC for the first period is USD 658 billion which allows for a 120.5% on 1990 levels and includes an MAC of USD 88 billion. The total cost in the best case scenario is USD 4 283 billion NPV, and would mean a total emissions output of 105.120 Gt CO2 .
QuickTime™ and aTIFF (Uncompressed) decompressor
are needed to see this picture.
Running the 3000 Monte Carlo simulations through the second scenario creates similar outcomes. The mean for the models means that the TAC for the first period goes from USD 658 billion to USD 1 363, and the MAC increases from USD 88 billion to USD 116 billion. The total cost for the mean of the model is up from USD 4 283 billion to USD 10 171 billion.

Page 27 of 28
QuickTime™ and aTIFF (Uncompressed) decompressor
are needed to see this picture.
III. Price Caps and Price Floors a) Price ceilings The report first assesses a model only using price ceilings before then introducing price floors for the halving of emissions from 2005 levels. There are three brackets the report analyses. The first is a low cap was set roughly one-third less than the MAC with straight targets which is USD 40, 60, 80 and 100 for the respective periods. The TAC for the first period is actually a negative, USD- 34 billion, but that means the total emissions are 12 Gt CO2 over the target for that period. This leads on to a substantial increase of emissions in the final period leaving it 63% higher than the target for 2050 (222 Gt CO2 instead of 136 Gt CO2 . The TAC for the whole period is about one quarter of the best case scenario with straight targets at USD 645 billion NPV. This model, however, still leaves a median warming of 2.63°C which is better than no policy but still quite substantial. The medium cap sets targets the price at USD 80, 120, 180 and 260; the TAC for the first period is USD 246 billion, and the deviation from the target in that period is 5.6 Gt CO2, which is more than half less than the low cap scenario. The total cost with medium caps is USD 2 202 billion NPV, but the total emission would still be substantially higher than the 136 Gt CO2 target, estimated to be 174 Gt CO2. The high cap sets targets at USD 110, 150, 230, 350; the TAC for the first period is USD 428 billion, but it would still mean higher emissions than the target. The total cost of this model is 2 925 billion NPV, and the emissions would be 20% higher at 164 Gt CO2. b) Price caps with price floors The report assess a model with medium caps, and a price floor which is half of the cap i.e. USD 40, 60, 90 and 130. During the first period the total emissions is 260.1 Gt CO2 which is only 1% higher than the target, with a TAC of USD 297 billion. By 2050 global emissions would be higher than the target (160.5 Gt CO2 instead of 135.680 Gt CO2), although the modelling shows that the target would be reached in 43.7% of cases. The total cost for this model would be USD 2 292 billion NPV. Finally, the report assesses a model for halving emissions from 1990 levels with medium price caps and floors, at USD 110, 150, 240 and 360 for caps and USD 35, 50, 80 and 120 for floors. In the first period emissions would be slightly higher 256.8 Gt CO2 instead of 253 Gt CO2, but the TAC would be much less than with straight targets at USD 560 billion. By 2050, the total emissions would be just over the target at 138.75 Gt CO2 instead of 136 Gt CO2, this would have

Page 28 of 28
a total cost of USD 3 456 billion NPV. The very small differential in emissions by 2050 means that temperature change would be almost identical for straight caps as for price caps and ceilings, except that the cost would be substantially lower. Please return by 5pm (AEST) on 14 April 2009 to: The CPRS Exposure Draft Team Emissions Trading Division Department of Climate Change GPO Box 854 Canberra ACT 2601 Email: [email protected]