SUBJECTS' - dm5migu4zj3pb.cloudfront.netdm5migu4zj3pb.cloudfront.net/.../JCI58103694.pdf ·...
9
ALVEOLAR GAS TENSIONS, PULMONARY VENTILATION AND BLOOD PH DURING PHYSIOLOGIC SLEEP IN NORMAL SUBJECTS' By EUGENE D. ROBIN, ROBERT D. WHALEY, CHARLES H. CRUMP, AND DAVID M. TRAVIS (From the Department of Medicine, Harvard Medical School and the Medical Clinics of the Peter Bent Brigham Hospital, Boston, Mass.) (Submitted for publication January 23, 1958; accepted March 20, 1958) An increase in alveolar CO2 tension has been reported to accompany normal sleep (1, 2). The study of gas tensions during sleep has, however, been limited by two factors: 1) No accurate method of breath-to-breath anal- ysis has been available, so that only spot checks of alveolar CO2 tensions have been used to com- pare waking with sleeping levels. 2) Procedures for obtaining alveolar or ar- terial samples have been disturbing to the subjects. It has not been possible, therefore, to study deep sleep by these methods. The use of a rapid acting infrared CO, spectro- photometer has circumvented both of these limita- tions and permitted an accurate and continuous study of the alveolar CO2 changes that occur dur- ing sleep. This paper will deal with the magnitude and mechanism of CO2 retention during sleep, and with the changes that occur in pulmonary ventila- tion, respiratory gas exchange, mechanics of breathing and blood pH. METHODS Each subj ect reported to the laboratory late in the evening without special preparation. A comfortable bed in a dark environment was provided. The necessary manipulations for a control series of measurements (see below) were carried out. The subject was then allowed to fall asleep. No sedative drugs were used. All ob- servations were made with the subj ect in approximately the same body position. During the course of each study, the depth of sleep as judged by degree of consciousness, amount of motion and response to stimuli was fre- quently recorded. A tight-fitting face mask was used for the administra- tion and collection of gas. The mask was attached to a 1 This investigation was supported in part by a re- search grant (H-2243) from the National Heart Institute of the National Institutes of Health, Public Health Serv- ice, and in part by a grant from the Massachusetts Heart Association. low resistance valve with a small dead space. The ar- rangement was comfortable enough so that most sub- jects were able to sleep with the mask in place. During collection periods the system was frequently checked for leaks. Expired air was collected in Douglas bags and the volume measured in a Tissot spirometer. Alveolar CO. tensions were measured with a rapid acting infrared CO2 analyzer. It has been shown by Collier, Affeldt and Farr (3) and verified by our group that in subj ects without pulmonary disease, the peak end tidal CO2 tension measured by this apparatus is equal (plus or minus 2 mm. Hg) to arterial CO2 tension. This technique provided a breath-to-breath measurement of alveolar CO2 tension without distraction or discomfort to the subject. CO2 concentrations in expired air were measured by the same apparatus. The oxygen concentrations in expired air samples were measured with a Pauling oxygen analyzer. The volume of alveolar ventilation was calculated by the Bohr equation (4). Oxygen consumption, CO2 pro- duction, alveolar oxygen tension, and the expiratory ex- change ratio were calculated by standard methods (5, 6). The ventilatory response to CO2 was tested by the ad- ministration of CO2 mixtures. Each mixture was ad- ministered for at least fifteen minutes before expired air was collected. The response to CO2 was expressed as the ratio of the increment in alveolar ventilation to the in- crement in alveolar CO2. Appropriate vessels were intubated with No. 18 poly- vinyl catheters for the collection of blood. The catheter was filled with sodium-heparin solution diluted 1 to 10 with normal saline. Between periods of blood with- drawal, a sterile cap was placed on the catheter. In this manner blood could be obtained without disturbing or waking the subjects. Blood pH was measured by means of a Beckman pH meter. Readings were made at room temperature and converted to body temperature by the Rosenthal cor- rection factor (7). The oxygen content and saturation of arterial blood were determined by the technique of Van Slyke and Neill (8). The mechanics of breathing during the waking and sleeping states were studied by measurements of pul- monary compliance and mean airway resistance.2 These - These measurements were made by Dr. Roe E. Wells. 981
Transcript of SUBJECTS' - dm5migu4zj3pb.cloudfront.netdm5migu4zj3pb.cloudfront.net/.../JCI58103694.pdf ·...
ALVEOLARGAS TENSIONS, PULMONARYVENTILATION ANDBLOODPH DURING PHYSIOLOGIC SLEEP IN NORMAL
SUBJECTS'
By EUGENED. ROBIN, ROBERTD. WHALEY,CHARLESH. CRUMP,ANDDAVID M. TRAVIS
(From the Department of Medicine, Harvard Medical School and the Medical Clinics of thePeter Bent Brigham Hospital, Boston, Mass.)
(Submitted for publication January 23, 1958; accepted March 20, 1958)
An increase in alveolar CO2 tension has beenreported to accompany normal sleep (1, 2). Thestudy of gas tensions during sleep has, however,been limited by two factors:
1) No accurate method of breath-to-breath anal-ysis has been available, so that only spot checksof alveolar CO2 tensions have been used to com-pare waking with sleeping levels.
2) Procedures for obtaining alveolar or ar-terial samples have been disturbing to the subjects.It has not been possible, therefore, to study deepsleep by these methods.
The use of a rapid acting infrared CO, spectro-photometer has circumvented both of these limita-tions and permitted an accurate and continuousstudy of the alveolar CO2 changes that occur dur-ing sleep.
This paper will deal with the magnitude andmechanism of CO2 retention during sleep, andwith the changes that occur in pulmonary ventila-tion, respiratory gas exchange, mechanics ofbreathing and blood pH.
METHODS
Each subj ect reported to the laboratory late in theevening without special preparation. A comfortable bedin a dark environment was provided. The necessarymanipulations for a control series of measurements (seebelow) were carried out. The subject was then allowedto fall asleep. No sedative drugs were used. All ob-servations were made with the subj ect in approximatelythe same body position. During the course of each study,the depth of sleep as judged by degree of consciousness,amount of motion and response to stimuli was fre-quently recorded.
A tight-fitting face mask was used for the administra-tion and collection of gas. The mask was attached to a
1 This investigation was supported in part by a re-search grant (H-2243) from the National Heart Instituteof the National Institutes of Health, Public Health Serv-ice, and in part by a grant from the Massachusetts HeartAssociation.
low resistance valve with a small dead space. The ar-rangement was comfortable enough so that most sub-jects were able to sleep with the mask in place. Duringcollection periods the system was frequently checked forleaks.
Expired air was collected in Douglas bags and thevolume measured in a Tissot spirometer.
Alveolar CO. tensions were measured with a rapidacting infrared CO2 analyzer. It has been shown byCollier, Affeldt and Farr (3) and verified by our groupthat in subj ects without pulmonary disease, the peak endtidal CO2 tension measured by this apparatus is equal(plus or minus 2 mm. Hg) to arterial CO2 tension. Thistechnique provided a breath-to-breath measurement ofalveolar CO2 tension without distraction or discomfortto the subject. CO2 concentrations in expired air weremeasured by the same apparatus.
The oxygen concentrations in expired air samples weremeasured with a Pauling oxygen analyzer.
The volume of alveolar ventilation was calculated bythe Bohr equation (4). Oxygen consumption, CO2 pro-duction, alveolar oxygen tension, and the expiratory ex-change ratio were calculated by standard methods (5, 6).
The ventilatory response to CO2 was tested by the ad-ministration of CO2 mixtures. Each mixture was ad-ministered for at least fifteen minutes before expired airwas collected. The response to CO2 was expressed as theratio of the increment in alveolar ventilation to the in-crement in alveolar CO2.
Appropriate vessels were intubated with No. 18 poly-vinyl catheters for the collection of blood. The catheterwas filled with sodium-heparin solution diluted 1 to 10with normal saline. Between periods of blood with-drawal, a sterile cap was placed on the catheter. Inthis manner blood could be obtained without disturbingor waking the subjects.
Blood pH was measured by means of a Beckman pHmeter. Readings were made at room temperature andconverted to body temperature by the Rosenthal cor-rection factor (7).
The oxygen content and saturation of arterial bloodwere determined by the technique of Van Slyke andNeill (8).
The mechanics of breathing during the waking andsleeping states were studied by measurements of pul-monary compliance and mean airway resistance.2 These
- These measurements were made by Dr. Roe E. Wells.
981
E. D. ROBIN, R. D. WHALEY, C. H. CRUMP, AND D. M. TRAVIS
mm.Hg1
79.0-47.8-3 f. -' '._. ........
47.8 -
31.3 -
15.0-
0 -_
*;. N . ... ....
.... ... ......-. ..- 1..t I
Awoke Asleep
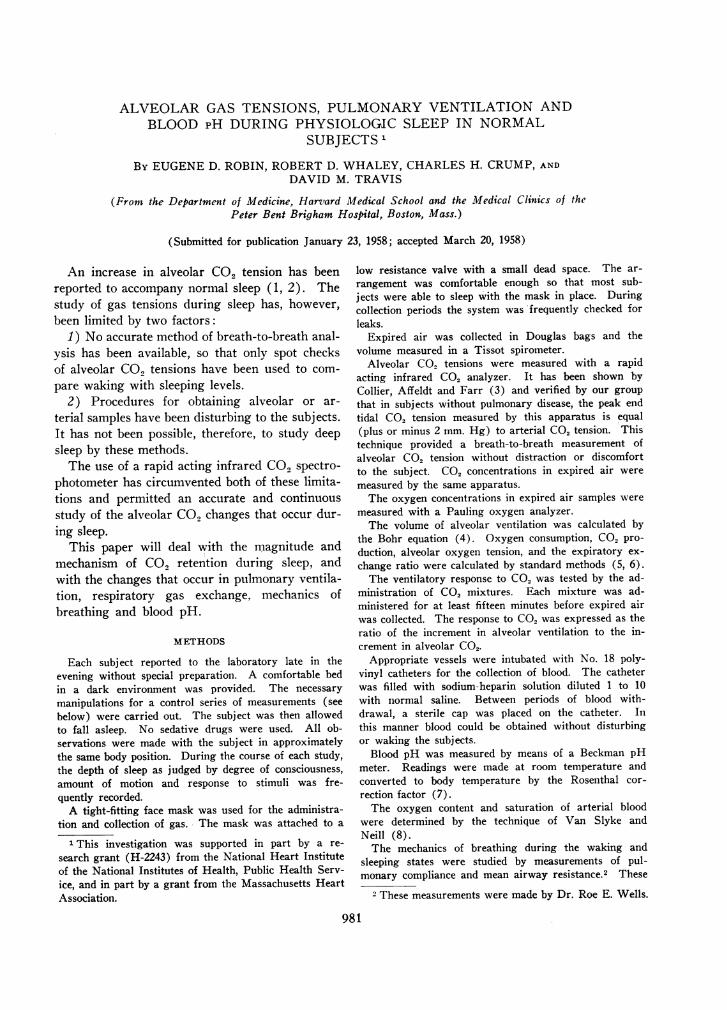
FIG. 1. A COMPARISONOF THE BREATH-TO-BREATHVARIATION OF ALVEOLARCARBONDIOXIDE TENSION DURING THE WAKINGAND SLEEPING STATES
measurements were made by the technique of Mead andWhittenberger (9). An intraesophageal balloon wasused for the measurement of intrathoracic pressure. Thesestudies were performed with the subj ect in the rightlateral decubitus position awake and asleep.
Using these methods, breath-to-breath alveolar CO.tensions were obtained before and during sleep in 14normal males. For comparison, 6 normal males werekept fully awake during the night and hourly alveolarCO2 tensions were determined.
The ventilatory response to C02, awake and asleep,was tested in 10 subjects.
In three subjects arterial blood pH was determined andin two of these subjects venous pH was determined si-multaneously. A consistent difference between arterialand venous pH was observed in the sixteen samples stud-ied in this way. Therefore, the pH studies made on fouradditional subjects were carried out on venous bloodonly to obviate the necessity of an indwelling arterial
TABLE I
A comparison of alveolar carbon dioxide tension awakeand one hour after the onset of sleep
Alveolar carbon dioxide tensionmm. Hg
Subject Awake Asleep
R. W. 41 44A. G. 37 41J. M. 41 47J.S. 38 40J. A. 42 46R. C. 43 45R. W. 40 41R. R. 40 45L. S. 42 450. B. 43 47E. R. 44 49
Mean 41.0 44.6p <0.001
catheter. Arterial oxygen saturations were determinedin two subjects.
Pulmonary compliance and mean airway resistancestudies were carried out in three subjects.
RESULTS
The changes that occurred with sleep may beconsidered under the following categories:
1) The breath-to-breath variation of alveolarCo2.
2) The level of alveolar CO2 tension.3) Alveolar oxygen tension and arterial oxygen
saturation.4) Total ventilation, alveolar ventilation, oxygen
consumption, CO. production and respira-tory exchange ratio.
5) Ventilatory response to CO,.6) Blood pH.7) Mechanics of breathing.8) Rhythm of respiration.
Changes in breath-to-breath variation of alveolarCO2 tension
An analysis of variance (10) was performedon the breath-to-breath variation of alveolar CO2tension in four representative subjects comparinga two minute period during the waking state witha similar period during the sleeping state.
During the waking state there was a meanbreath-to-breath variation of alveolar CO, ten-sion of 0.8 mm. Hg. Such variation reflectschanges in both metabolism and in the control ofventilation.
982

PULMONARYVENTILATION DURING PHYSIOLOGIC SLEEP
NORMALS55r
501
45
PA Cop
40mm.Hg.
35
Asleep
- I
Awake
III II I I I
mean
1 2 3 4 5 6 7
Subjects8 9 10
FIG. 2. PEAK ALVEOLAR CARBON DIOXIDEDURING SLEEP
During sleep these fluctuations virtished. The mean breath-to-breath vaito 0.2 mm. Hg. An example of this s1of respiration is shown in Figure 1.end tidal value of CO2 during each breato alveolar CO2 tension. The stability 4
CO2 tension during sleep is obvious.pearance of such stable respiration is aistic change that occurs with the onseIts time of appearance correlates welltroencephalographic changes indicating E
Changes in the level of alveolar CO, te
The infrared CO2analyzer provided ameasurements of alveolar CO2 tension dstudy. It is obviously not practical tocomplete data from each subject. Tomagnitude of the changes in alveolar Cduring sleep, three selected groups opresented:
a) A comparison of the average wallar CO2 tension with the average alvtension after one hour of sleep. Theseobtained by averaging the breath-to-br(of alveolar CO2 tension during a two i
riod while each subject was awake, an(
two minute period after the subject had Ifor one hour. These data are shown iThe mean increase in CO2 tension afteof sleep is 3.6 mm. Hg. This is a higcant change.
b) A comparison of the average waking alveolarCO2 tension with the highest alveolar CO, ten-sion attained and maintained for at least four con-secutive breaths during sleep. The peak valueobtained from four consecutive breaths insuredthat falsely high values produced by breath-hold-ing would not be included. These data are shown
6 ' , in Figure 2, and it can be seen that the peak in-&, crease may be as high as 14 mm. Hg (Subject 10).
The mean peak increase for the group is 9 mm.Hg which is a highly significant change.
c) Data illustrating the pattern of CO2 increaseduring several hours of sleep. These data, ob-
11 12 13 14 tained from three normal subjects, are shown inFigure 3. Alveolar CO2 tensions are plotted
TENSIONS along the ordinate and time in hours, along theabscissa. The straight lines connecting points in-dicate that continual CO2 analysis was performed
ually van- but only hourly measurements were charted.riation fell These data show considerable variation, apparentlytabilization changing with the level of consciousness of theThe peak subject, but the values are higher during sleep
Lth is equal than during waking. The peak rise in alveolarof alveolar CO2 tension tended to develop within the first one
The ap- to two hours of sleep. This is consistent with thecharacter- general belief that this period represents the time
*t of sleep. of deepest sleep (2).
sleep (11). These data from sleeping subjects may be com-
nsion X AsleepI Awake
bout 7,000 50
luring each 451 0 R. C.report the 40,1A-r- shecaenne tne
'02 tensionf data are
king alveo-reolar CO2
data wereeath valuesminute pe-d during abeen asleepin Table I.r one hourhly signifi-
35L
50
45PACOt
40mm.Hg.act.
R.W.
50 - _
45 -
40
35 .. . LI 12 1 2 3 4 5 6 7PM AM
8
M.W.
Hours
FIG. 3. HOURLYCHANGESIN ALVEOLARCARBONDIOXIDETENSION IN THREE NORMALSUBJECTS
983
I I I I I I I I
E. D. ROBIN, R. D. WHALEY, C. H. CRUMP, AND D. M. TRAVIS
40
35
45PACO?2
40mm.Hg..
35
45-
40 -
I BW35 [
301. I 1 I I I I L I I a
9 10 11 12 1 2 3 4 5 6 7 8 9 10 11 12
PM AM5
PM
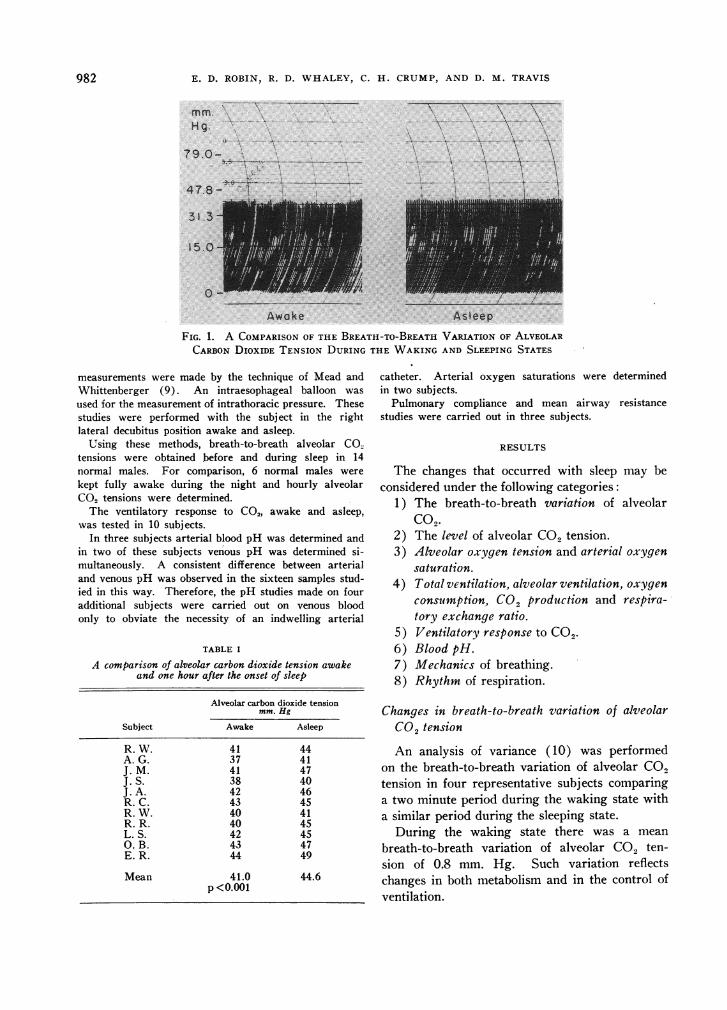
FIG. 4. HOURLY CHANGESIN ALVEOLAR CARBONDIOXIDE TENSION IN
WAKINGNORMALSAT NIGHT
pared with those shown in Figure 4. These dataare taken from three normal subjects, awake andfully conscious during a given night of study. Itcan be seen that alveolar CO2 tension in the non-sleeping subjects does not increase consistentlyduring the night. This finding indicates that thereis no normal diurnal cycle of alveolar CO2 tensionindependent of sleep.
Changes in alveolar oxygen tension and arterialoxygen saturation
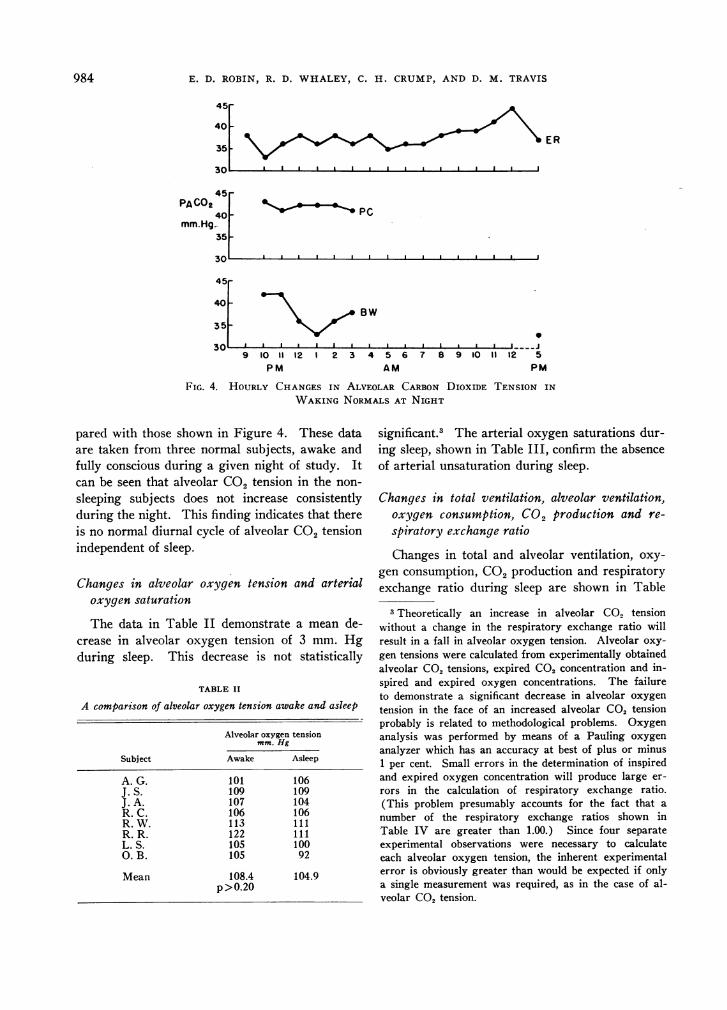
The data in Table II demonstrate a mean de-crease in alveolar oxygen tension of 3 mm. Hgduring sleep. This decrease is not statistically
TABLE II
A comparison of alveolar oxygen tension awake and asleep
Alveolar oxygen tensionmm. Hg
Subject Awake Asleep
A. G. 101 106J. S. 109 109J. A. 107 104R. C. 106 106R. W. 113 111R. R. 122 111L. S. 105 100O. B. 105 92
Mean 108.4 104.9p>O.20
significant.3 The arterial oxygen saturations dur-ing sleep, shown in Table III, confirm the absenceof arterial unsaturation during sleep.
Changes in total ventilation, alveolar ventilation,oxygen consumption, CO2 production and re-
spiratory exchange ratio
Changes in total and alveolar ventilation, oxy-
gen consumption, CO2 production and respiratoryexchange ratio during sleep are shown in Table
3 Theoretically an increase in alveolar CO2 tensionwithout a change in the respiratory exchange ratio willresult in a fall in alveolar oxygen tension. Alveolar oxy-gen tensions were calculated from experimentally obtainedalveolar CO2 tensions, expired CO2 concentration and in-spired and expired oxygen concentrations. The failureto demonstrate a significant decrease in alveolar oxygen
tension in the face of an increased alveolar CO2 tensionprobably is related to methodological problems. Oxygenanalysis was performed by means of a Pauling oxygen
analyzer which has an accuracy at best of plus or minus1 per cent. Small errors in the determination of inspiredand expired oxygen concentration will produce large er-
rors in the calculation of respiratory exchange ratio.(This problem presumably accounts for the fact that a
number of the respiratory exchange ratios shown inTable IV are greater than 1.00.) Since four separateexperimental observations were necessary to calculateeach alveolar oxygen tension, the inherent experimentalerror is obviously greater than would be expected if onlya single measurement was required, as in the case of al-veolar CO2 tension.
IR ER
984
45F
PULMONARYVENTILATION DURING PHYSIOLOGIC SLEEP
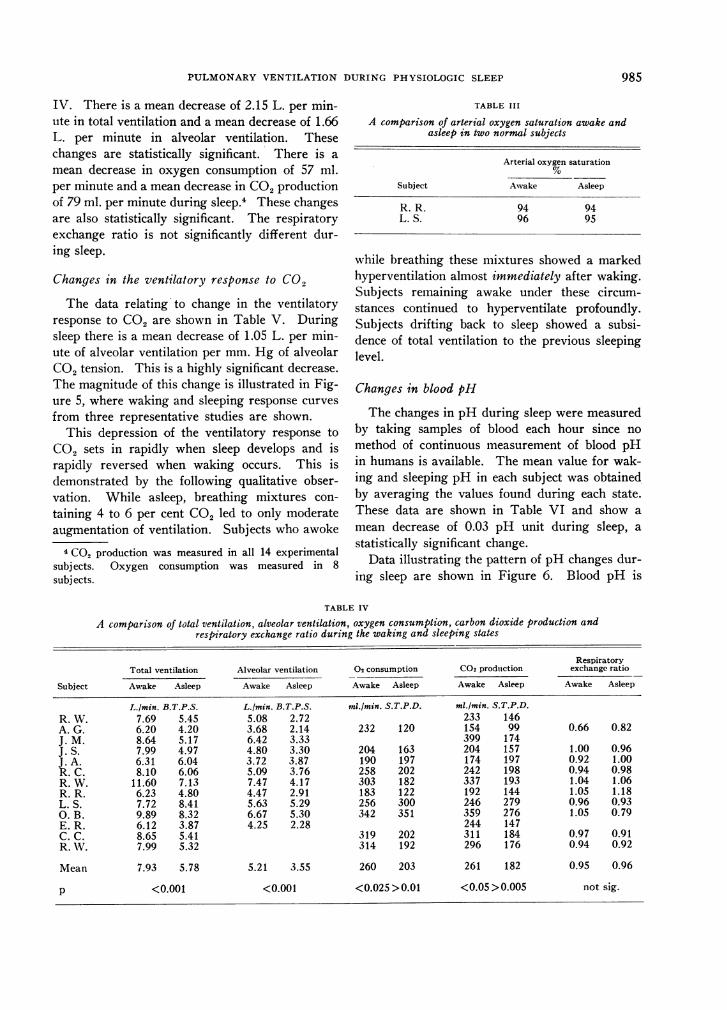
IV. There is a mean decrease of 2.15 L. per min-ute in total ventilation and a mean decrease of 1.66L. per minute in alveolar ventilation. Thesechanges are statistically significant. There is a
mean decrease in oxygen consumption of 57 ml.per minute and a mean decrease in CO2productionof 79 ml. per minute during sleep. These changesare also statistically significant. The respiratoryexchange ratio is not significantly different dur-ing sleep.
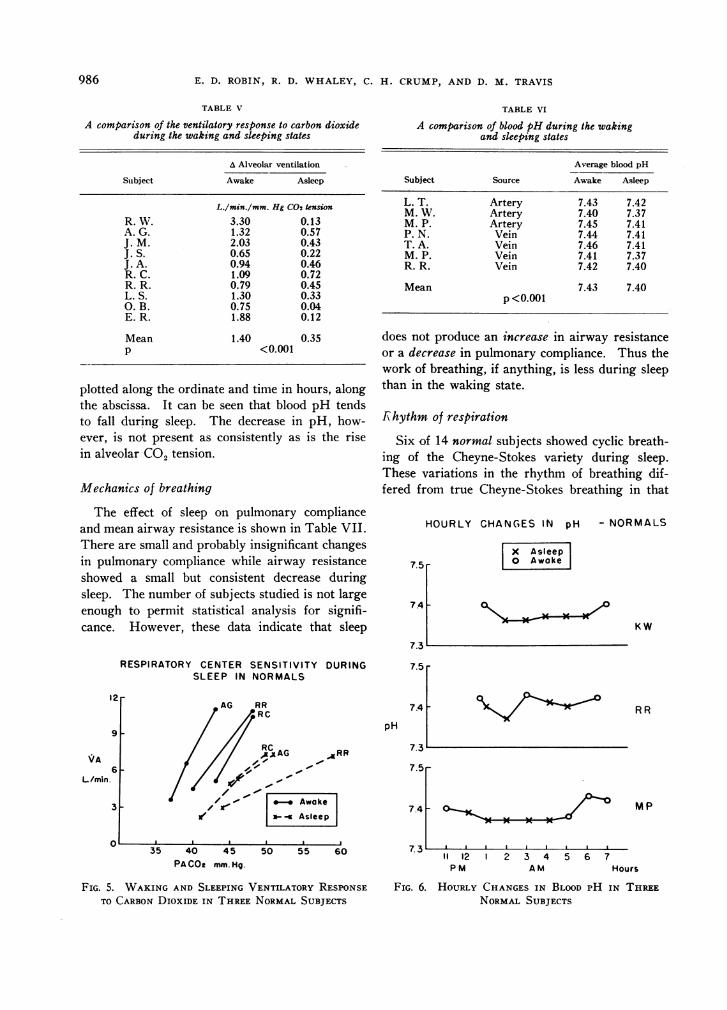
Changes in the ventilatory response to CO2
The data relating to change in the ventilatoryresponse to CO2 are shown in Table V. Duringsleep there is a mean decrease of 1.05 L. per min-ute of alveolar ventilation per mm. Hg of alveolarCO2 tension. This is a highly significant decrease.The magnitude of this change is illustrated in Fig-ure 5, where waking and sleeping response curves
from three representative studies are shown.This depression of the ventilatory response to
CO2 sets in rapidly when sleep develops and israpidly reversed when waking occurs. This isdemonstrated by the following qualitative obser-vation. While asleep, breathing mixtures con-
taining 4 to 6 per cent CO2 led to only moderateaugmentation of ventilation. Subjects who awoke
4 Co2 production was measured in all 14 experimentalsubj ects. Oxygen consumption was measured in 8subj ects.
TABLE III
A comparison of arterial oxygen saturation awake andasleep in two normal subjects
Arterial oxygen saturation
Subject Awake Asleep
R. R. 94 94L. S. 96 95
while breathing these mixtures showed a markedhyperventilation almost immediately after waking.Subjects remaining awake under these circum-stances continued to hyperventilate profoundly.Subjects drifting back to sleep showed a subsi-dence of total ventilation to the previous sleepinglevel.
Changes in blood pH
The changes in pH during sleep were measuredby taking samples of blood each hour since no
method of continuous measurement of blood pHin humans is available. The mean value for wak-ing and sleeping pH in each subject was obtainedby averaging the values found during each state.These data are shown in Table VI and show a
mean decrease of 0.03 pH unit during sleep, a
statistically significant change.Data illustrating the pattern of pH changes dur-
ing sleep are shown in Figure 6. Blood pH is
TABLE IV
A comparison of total ventilation, alveolar ventilation, oxygen consumption, carbon dioxide production andrespiratory exchange ratio during the waking and sleeping states
RespiratoryTotal ventilation Alveolar ventilation 02 consumption C02 production exchange ratio
Subject Awake Asleep Awake Asleep Awake Asleep Awake Asleep Awake Asleep
L.min. B.T.P.S. L.Imin. B.T.P.S. mi./min. S.T.P.D. mi./min. S.T.P.D.R. W. 7.69 5.45 5.08 2.72 233 146A. G. 6.20 4.20 3.68 2.14 232 120 154 99 0.66 0.82J. M. 8.64 5.17 6.42 3.33 399 174J. S. 7.99 4.97 4.80 3.30 204 163 204 157 1.00 0.96J. A. 6.31 6.04 3.72 3.87 190 197 174 197 0.92 1.00R. C. 8.10 6.06 5.09 3.76 258 202 242 198 0.94 0.98R. W. 11.60 7.13 7.47 4.17 303 182 337 193 1.04 1.06R. R. 6.23 4.80 4.47 2.91 183 122 192 144 1.05 1.18L. S. 7.72 8.41 5.63 5.29 256 300 246 279 0.96 0.930. B. 9.89 8.32 6.67 5.30 342 351 359 276 1.05 0.79E. R. 6.12 3.87 4.25 2.28 244 147C. C. 8.65 5.41 319 202 311 184 0.97 0.91R. V. 7.99 5.32 314 192 296 176 0.94 0.92
Mean 7.93 5.78 5.21 3.55 260 203 261 182 0.95 0.96
p <0.001 <0.001 <0.025 >0.01 <0.05 >0.005 not sig.
985
E. D. ROBIN, R. D. WHALEY, C. H. CRUMP, AND D. M. TRAVIS
TABLE V
A comparison of the ventilatory response to carbon dioxideduring the waking and sleeping states
A Alveolar ventilation
Subject Awake Asleep
L./min./mm. Hg C02 tension
R. W. 3.30 0.13A. G. 1.32 0.57J. M. 2.03 0.43J. S. 0.65 0.22J. A. 0.94 0.46R. C. 1.09 0.72R. R. 0.79 0.45L. S. 1.30 0.33O. B. 0.75 0.04E. R. 1.88 0.12
Mean 1.40 0.35P <0.001
plotted along the ordinate and time in hours, alongthe abscissa. It can be seen that blood pH tendsto fall during sleep. The decrease in pH, how-ever, is not present as consistently as is the risein alveolar CO, tension.
Mechanics of breathing
The effect of sleep on pulmonary complianceand mean airway resistance is shown in Table VII.There are small and probably insignificant changesin pulmonary compliance while airway resistanceshowed a small but consistent decrease duringsleep. The number of subjects studied is not largeenough to permit statistical analysis for signifi-cance. However, these data indicate that sleep
RESPIRATORY CENTER SENSITIVITY DURINGSLEEP IN NORMALS
12
9
VA6
L/min.
3r
TABLE VI
A comparison of blood pH during the wakingand sleeping states
Average blood pH
Subject Source Awake Asleep
L. T. Artery 7.43 7.42M. W. Artery 7.40 7.37M. P. Artery 7.45 7.41P. N. Vein 7.44 7.41T. A. Vein 7.46 7.41M. P. Vein 7.41 7.37R. R. Vein 7.42 7.40
Mean 7.43 7.40p <0.001
does not produce an increase in airway resistanceor a decrease in pulmonary compliance. Thus thework of breathing, if anything, is less during sleepthan in the waking state.
Rhythm of respiration
Six of 14 normal subjects showed cyclic breath-ing of the Cheyne-Stokes variety during sleep.These variations in the rhythm of breathing dif-fered from true Cheyne-Stokes breathing in that
HOURLY CHANGESIN pH - NORMALS
Aasleep| Awake|7.5 r
7.4
pH
RC, A. AG ARR
KW
7.31
7.5 -
7.4-
7.3
RR
7.5'el / !::' ,,
</3r .- | Awake|1 |- * Asleep | 7.4,-
12 2 3 4 5 6 7PM AlM I
MP
Hours
FIG. 5. WAKINGAND SLEEPING VENTILATORY RESPONSETO CARBONDIOXIDE IN THREENORMALSUBJECTS
FIG. 6. HOURLYCHANGESIN BLOOD PH IN THREENORMALSUBJECTS
35 40 45 50 55 60PACOt mm. Hg.
986

PULMONARYVENTILATION DURING PHYSIOLOGIC SLEEP
periods of hyperventilation alternated with hypop-nea rather than with apnea. In normal subjectsperiodic breathing was only found transiently. Nosubject demonstrated this variety of breathinglonger than one hour during a night of sleep.An example of this phenomenon is shown inFigure 7.
DISCUSSION
The increase in alveolar CO2 tension duringsleep is a consistent finding. Alveolar CO2 ten-sion may be increased by either of two mecha-nisms:
1) An increase in CO2 production.2) A decrease in alveolar ventilation.Since the data show that sleep is accompanied
by a decrease rather than an increase in CO2 pro-duction, the CO, retention of sleep is to be ex-plained by a decrease in alveolar ventilation.This decrease in alveolar ventilation is appar-ently related to a depression of respiratory cen-ter sensitivity to CO9. This is indicated by themarked decrease in the ventilatory response toCO2 observed during sleep.
The ventilatory response to CO2 may be ac-cepted, with some reservations, as a quantitativeexpression of respiratory center sensitivity to CO2(12, 13). The reservations are as follows:
1) Inhaled CO2stimulates the peripheral chemo-receptors in the aortic and carotid bodies as well asthe medullary chemoreceptors (14).
X Asletep
TABLE VII
Mechanics of breathing during sleep in three normal subjects
Pulmonary Mean airwaycompliance resistance
Subject Awake Asleep Awake Asleep
L./cm. H20 cm. HsO/L./sec.E. R. 0.238 0.179 2.18 1.48D. J. 0.164 0.203 2.03 1.09D. T. 0.177 0.201 2.40 1.42
2) The CO, tension and pH of arterial bloodand of the respiratory center are related but arenot necessarily equal. At present, techniques forthe measurement of intracellular pH and CO2 arenot available.
3) Any factor which modifies the volume ofventilation may modify the ventilatory responseto CO2. It has been shown by Cherniack andSnidal (15) in normal subjects that the ventilatoryresponse to CO, may be depressed by increasingairway resistance. Fritts, Fishman and Cour-nand (16) have suggested that the depressed ven-tilatory response to CO2 in emphysema may berelated to the increased work of breathing in thisdisorder.
Since pulmonary compliance is not decreasedand mean airway resistance is not increased bysleep, it appears that the depression of the ventila-tory response to CO2 during sleep is not relatedto impairment of the mechanics of breathing.
It therefore seems probable that the changes in
Awake--. .\ '.,
2
II'/! 1V
FIG. /D Bi i, ;-- ....D
FIG. 7. PERIODIC BREATHING IN A NORMALSUBJECT DURING SLEEP
987
E. D. ROBIN, R. D. WHALEY, C. H. CRUMP, AND D. M. TRAVIS
the ventilatory response to CO2 during sleeprepresent changes in respiratory center sensitivityto CO2. Since these changes take place withinseconds, it seems probable that they are mediatedneurogenically.
A working hypothesis to explain the respira-tory acidosis of sleep may be stated as follows:The sensitivity of the respiratory center to CO2 isdependent on, among other factors, afferent im-pulses coming to it from numerous areas in thenervous system. During the waking state thenumber of afferent impulses is relatively large,producing a brisk alveolar ventilation and result-ing in a normal waking alveolar CO2 tension.During sleep, the number of impulses is decreasedand the responsiveness of the respiratory centerconsequently decreases. The result is a decreasedlevel of alveolar ventilation and a rise in alveolarCO2 tension until a new steady state is achieved.
The elevated alveolar CO, tension during sleepreported here is in agreement with the findings ofmost previous studies (1, 2). Mills has reportedthat the elevation of alveolar CO, tension thattakes place during the night occurs as a result ofa normal diurnal cycle and is independent ofwhether or not the subject is sleeping (17). Ourfinding that normal subjects kept awake at nightshow no respiratory acidosis differs from the re-sults reported by Mills. It should be pointed outthat Mills studied only one subject (himself) dur-ing sleep. In addition, his technique of studyconsisted of utilizing a Haldane tube for the de-termination of alveolar CO, tensions. At varioustimes during the night an alarm clock roused himfrom sleep so that a sample of expired air might beobtained. In view of the rapid changes in CO,tensions that we have observed in the transitionfrom the sleeping to the waking state, it is doubt-ful that Mills' observations can be considered asrepresenting alveolar CO2 tensions during sleep.
Changes in the cerebral circulation have beeninvestigated by workers in the field of sleep. Itseems probable that the changes observed may berelated to changes in alveolar gas tensions. Thus,the increase in cerebral blood flow and decrease incerebral vascular resistance during sleep reportedby Mangold and co-workers (18) may be ac-counted for by the increase in alveolar CO2 ten-sion.
Doust and Schneider (19) have proposed a
theory which ascribes sleep to cerebral hypoxia.Using the technique of ear oximetry these authorsfound that arterial oxygen saturation decreasedprogressively during the process of sleep, reachingits lowest levels during deep sleep.
In our own studies a mean decrease of 3 mm.Hg in alveolar oxygen tension was found duringsleep, but this decrease was not statistically sig-nificant. The shape of the oxyhemoglobin disso-ciation curve is such that the saturation values forhighly saturated blood fall on the flat portion ofthe curve. Under these circumstances, even sub-jects who showed the greatest decrease in alveolaroxygen tension did not have a decrease of suffi-cient magnitude to produce arterial oxygen un-saturation. In the subject whose hemoglobin isunsaturated in the waking state the findings maybe different. Because of the shape of the oxy-hemoglobin dissociation curve a small decrease inalveolar oxygen tension may produce a significantdecrease in arterial oxygen saturation.
At any rate, no evidence of significant arterialoxygen unsaturation was found in our normalsubjects during sleep, and thus the hypoxic theoryof the genesis of sleep appears to be untenable.The possibility of a marked decrease in oxygensaturation during sleep in subjects who are moder-ately unsaturated while awake is under investiga-tion.
The data reported here do not in any sense de-fine the fundamental nature of the sleeping state.They lend themselves, however, to several gen-eralizations:
1 ) The basic changes associated with sleep arerapidly reversible. The rapidity of these changessuggests that neurogenic mechanisms play a de-cisive role in the genesis and maintenance of nor-mal sleep.
2) Sleep does not represent a static state. Thesleeping subject shows changes in the depth ofsleep, the number of bodily movements (2), al-veolar gas tensions, electroencephalographic pat-terns (11) and blood pH.
3) Theories of the genesis of sleep based onchanges in blood gas constituents are probablyuntenable.
SUMMARY
Physiologic sleep in the normal subject is as-sociated with a significant fall in total and alveolar
988

PULMONARYVENTILATION DURING PHYSIOLOGIC SLEEP
ventilation, with a significant rise in alveolar CO.tension, with a fall in CO2 production and oxygenconsumption, with a fall in ventilatory response toCO2, with a fall in blood pH, and with a considerableincidence of periodic breathing. Alveolar oxygentension, arterial oxygen saturation, respiratory ex-change ratio, and the mechanics of breathing arenot significantly altered by sleep.
The CO2 retention of sleep is related to a de-pression of respiratory center sensitivity. Thespeed of onset and reversal of this depression ofrespiratory center sensitivity suggests that it ismediated neurogenically.
REFERENCES
1. Hastings, A. B., and Eisele, C. W. Diurnal variationsin the acid-base balance. Proc. Soc. exp. Biol.(N. Y.) 1940, 43, 308.
2. Kleitman, N. Sleep and Wakefulness. Chicago,University of Chicago Press, 1939.
3. Collier, C. R., Affeldt, J. E., and Farr, A. F. Con-tinuous rapid infrared CO2 analysis. J. Lab. dlin.Med. 1955, 45, 526.
4. Bohr, C. Uber die Lungenathmung. Skand. Arch.Physiol. 1890, 2, 236.
5. Methods in Medical Research, J. H. Comroe, Jr.,Ed. Chicago, The Year Book Publishers, Inc.,1950, vol. 2.
6. Comroe, J. H., Jr., Forster, R. E., II, Dubois, A. B.,Briscoe, W. A., and Carlsen, E. The Lung;Clinical Physiology and Pulmonary Function Tests.Chicago, The Year Book Publishers, Inc., 1955.
7. Rosenthal, T. B. Effect of temperature on pH ofblood and plasma in vitro. J. biol. Chem. 1948,173, 25.
8. Van Slyke, D. D., and Neill, J. M. Determination ofgases in blood and other solutions by vacuum ex-
traction and manometric measurement. J. biol.Chem. 1924, 61, 523.
9. Mead, J., and Whittenberger, J. L. Evaluation ofairway interruption technique as a method formeasuring pulmonary airflow resistance. J. appl.Physiol. 1954, 6, 408.
10. Snedecor, G. W. Statistical Methods. Ames, IowaState College Press, 1956.
11. Tyler, H., Robin, E. D., Travis, D. M., Crump, C. H.,and Morin, F. Relationship between electroen-cephalographic changes and alveolar gas tensionsduring sleep. To be published.
12. Alexander, J. K., West, J. R., Wood, J. A., and Rich-ards, D. W. Analysis of the respiratory responseto carbon dioxide inhalation in varying clinicalstates of hypercapnia, anoxia, and acid-base de-rangement. J. dlin. Invest. 1955, 34, 511.
13. Gray, J. S. Pulmonary ventilation and its physio-logical regulation. Springfield, Charles C Thomas,1950.
14. Winterstein, H. Chemical control of pulmonary ven-tilation. I. The physiology of the chemoreceptors.New Engl. J. Med. 1956, 255, 216.
15. Cherniack, R. M., and Snidal, D. P. The effect ofobstruction to breathing on the ventilatory re-sponse to CO2. J. clin. Invest. 1956, 35, 1286.
16. Fritts, H. W., Jr., Fishman, A. P., and Cournand, A.Factors contributing to diminished ventilatory re-sponse to CO2 of patients with obstructive emphy-sema. Fed. Proc. 1957, 16, 41.
17. Mills, J. N. Changes in alveolar CO2 tension by nightand during sleep. J. Physiol. (Lond.) 1953, 122,66.
18. Mangold, R., Sokoloff, L., Conner, E., Kleinerman, J.,Therman, P. G., and Kety, S. S. The effects ofsleep and lack of sleep on the cerebral circulationand metabolism of normal young men. J. dlin.Invest. 1955, 34, 1092.
19. Doust, L. J. W., and Schneider, R. A. Studies onthe physiology of awareness: Anoxia and thelevels of sleep. Brit. med. J. 1952, 1, 449.
989