SUBJECT: SLOVER AND CACTUS WAREHOUSE SUPPLEMENTAL …
94
11182-03 AQ Memo April 26, 2019 Mr. Clark Neuhoff Alere Property Group 100 Bayview Circle, Suite 310 Newport Beach, CA 92660 SUBJECT: SLOVER AND CACTUS WAREHOUSE SUPPLEMENTAL AIR QUALITY ASSESSMENT Dear Mr. Clark Neuhoff: Urban Crossroads, Inc. is pleased to submit this Supplemental Air Quality Assessment for Slover and Cactus Warehouse (“Project”), which is located in the County of San Bernardino. This letter has been prepared to supplement information in Slover and Cactus Warehouse Air Quality Impact Analysis (“AQIA”) prepared in April 2019 by Urban Crossroads, Inc. PURPOSE A recent Supreme Court of California decision, Sierra Club v. County of Fresno (Friant Ranch), found an EIR inadequate and states that: The EIR should be revised to relate the expected adverse air quality impacts to likely health consequences or explain in meaningful detail why it is not feasible at the time of drafting to provide such an analysis, so that the public may make informed decisions regarding the costs and benefits of the Project. Although the analysis for this Project identifies a less than significant project level and cumulative impacts with regard to VOC and NOX, and PM10 emissions, the following assessment serves to provide an analysis in conformance with the Sierra Club v. County of Fresno (“Friant Ranch”) decision which further clarifies, amplifies, and augments the air quality analyzes already undertaken for the Project. As summarized in the AQIA, the Project’s construction-source operational-source emissions will not exceed applicable SCAQMD numeric regional mass daily thresholds (with implementation of applicable mitigation measures). BACKGROUND REGIONAL AIR QUALITY I MPROVEMENT The Project is within the jurisdiction of the SCAQMD. In 1976, California adopted the Lewis Air Quality Management Act which created SCAQMD from a voluntary association of air pollution control districts in Los Angeles, Orange, Riverside, and San Bernardino counties. The geographic area of which SCAQMD consists is known as the SCAB. SCAQMD develops comprehensive plans and regulatory programs for the region to attain federal standards by dates specified in federal law. The agency is also responsible for meeting state standards by the earliest date achievable, using reasonably available control measures.
Transcript of SUBJECT: SLOVER AND CACTUS WAREHOUSE SUPPLEMENTAL …

11182-03 AQ Memo
April 26, 2019 Mr. Clark Neuhoff Alere Property Group 100 Bayview Circle, Suite 310 Newport Beach, CA 92660
SUBJECT: SLOVER AND CACTUS WAREHOUSE SUPPLEMENTAL AIR QUALITY ASSESSMENT
Dear Mr. Clark Neuhoff:
Urban Crossroads, Inc. is pleased to submit this Supplemental Air Quality Assessment for Slover and Cactus Warehouse (“Project”), which is located in the County of San Bernardino. This letter has been prepared to supplement information in Slover and Cactus Warehouse Air Quality Impact Analysis (“AQIA”) prepared in April 2019 by Urban Crossroads, Inc.
PURPOSE
A recent Supreme Court of California decision, Sierra Club v. County of Fresno (Friant Ranch), found an EIR inadequate and states that:
The EIR should be revised to relate the expected adverse air quality impacts to likely health consequences
or explain in meaningful detail why it is not feasible at the time of drafting to provide such an analysis,
so that the public may make informed decisions regarding the costs and benefits of the Project.
Although the analysis for this Project identifies a less than significant project level and cumulative impacts with regard to VOC and NOX, and PM10 emissions, the following assessment serves to provide an analysis in conformance with the Sierra Club v. County of Fresno (“Friant Ranch”) decision which further clarifies, amplifies, and augments the air quality analyzes already undertaken for the Project.
As summarized in the AQIA, the Project’s construction-source operational-source emissions will not exceed applicable SCAQMD numeric regional mass daily thresholds (with implementation of applicable mitigation measures).
BACKGROUND
REGIONAL AIR QUALITY IMPROVEMENT
The Project is within the jurisdiction of the SCAQMD. In 1976, California adopted the Lewis Air Quality Management Act which created SCAQMD from a voluntary association of air pollution control districts in Los Angeles, Orange, Riverside, and San Bernardino counties. The geographic area of which SCAQMD consists is known as the SCAB. SCAQMD develops comprehensive plans and regulatory programs for the region to attain federal standards by dates specified in federal law. The agency is also responsible for meeting state standards by the earliest date achievable, using reasonably available control measures.

Mr. Clark Neuhoff Alere Property Group April 26, 2019 Page 2
11182-03 AQ Memo
SCAQMD rule development through the 1970s and 1980s resulted in dramatic improvement in Basin air quality. Nearly all control programs developed through the early 1990s relied on (i) the development and application of cleaner technology; (ii) add-on emission controls, and (iii) uniform CEQA review throughout the Basin. Industrial emission sources have been significantly reduced by this approach and vehicular emissions have been reduced by technologies implemented at the state level by CARB.
As discussed above, the SCAQMD is the lead agency charged with regulating air quality emission reductions for the entire Basin. SCAQMD created AQMPs which represent a regional blueprint for achieving healthful air on behalf of the 16 million residents of the South Coast Basin. The 2012 AQMP states, “the remarkable historical improvement in air quality since the 1970’s is the direct result of Southern California’s comprehensive, multiyear strategy of reducing air pollution from all sources as outlined in its AQMPs,” (1).
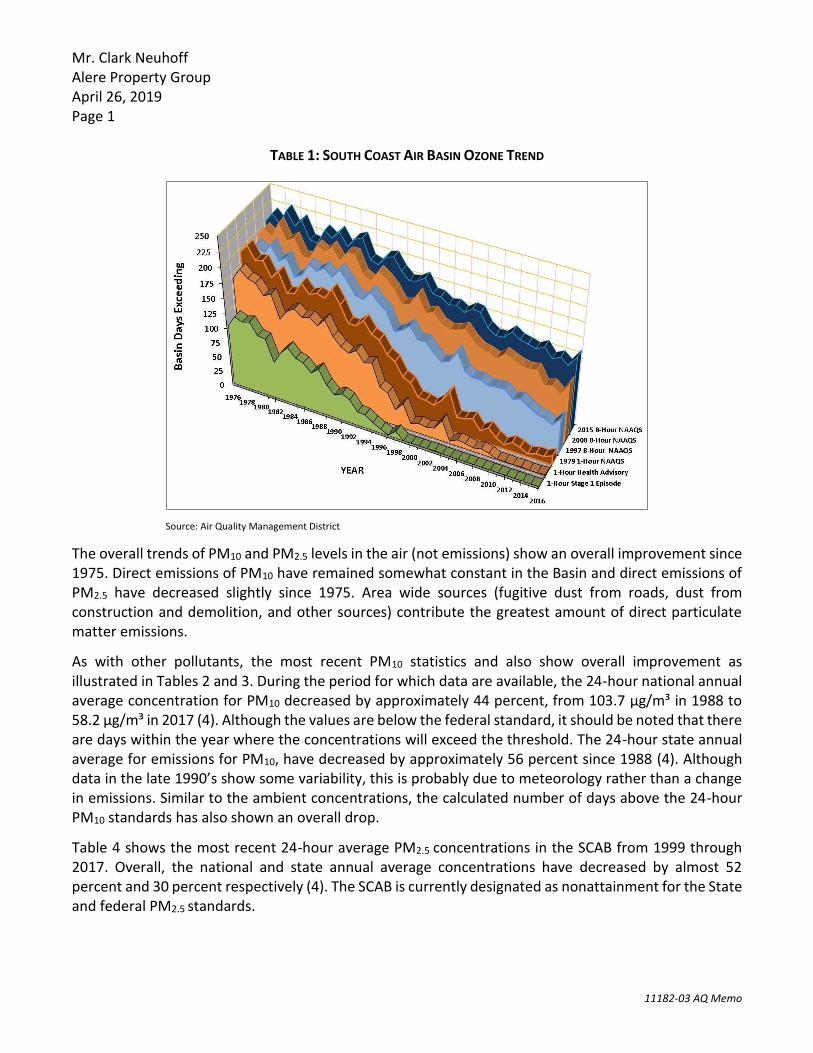
Ozone, NOX, VOC, and CO have been decreasing in the Basin since 1975 and are projected to continue to decrease through 2020 (2). These decreases result primarily from motor vehicle controls and reductions in evaporative emissions. Although vehicle miles traveled in the Basin continue to increase, NOX and VOC levels are decreasing because of the mandated controls on motor vehicles and the replacement of older polluting vehicles with lower-emitting vehicles. NOX emissions from electric utilities have also decreased due to use of cleaner fuels and renewable energy. Ozone contour maps show that the number of days exceeding the national 8-hour standard has decreased between 1997 and 2007. In the 2007 period, there was an overall decrease in exceedance days compared with the 1997 period. Ozone levels in the SCAB have decreased substantially over the last 30 years as shown in Table 1 (3). Today, the maximum measured concentrations are approximately one-third of concentrations within the late 70’s.
Mr. Clark Neuhoff Alere Property Group April 26, 2019 Page 1
11182-03 AQ Memo
TABLE 1: SOUTH COAST AIR BASIN OZONE TREND
Source: Air Quality Management District
The overall trends of PM10 and PM2.5 levels in the air (not emissions) show an overall improvement since 1975. Direct emissions of PM10 have remained somewhat constant in the Basin and direct emissions of PM2.5 have decreased slightly since 1975. Area wide sources (fugitive dust from roads, dust from construction and demolition, and other sources) contribute the greatest amount of direct particulate matter emissions.
As with other pollutants, the most recent PM10 statistics and also show overall improvement as illustrated in Tables 2 and 3. During the period for which data are available, the 24-hour national annual average concentration for PM10 decreased by approximately 44 percent, from 103.7 µg/m³ in 1988 to 58.2 µg/m³ in 2017 (4). Although the values are below the federal standard, it should be noted that there are days within the year where the concentrations will exceed the threshold. The 24-hour state annual average for emissions for PM10, have decreased by approximately 56 percent since 1988 (4). Although data in the late 1990’s show some variability, this is probably due to meteorology rather than a change in emissions. Similar to the ambient concentrations, the calculated number of days above the 24-hour PM10 standards has also shown an overall drop.
Table 4 shows the most recent 24-hour average PM2.5 concentrations in the SCAB from 1999 through 2017. Overall, the national and state annual average concentrations have decreased by almost 52 percent and 30 percent respectively (4). The SCAB is currently designated as nonattainment for the State and federal PM2.5 standards.

Mr. Clark Neuhoff Alere Property Group April 26, 2019 Page 2
11182-03 AQ Memo
TABLE 2: SOUTH COAST AIR BASIN AVERAGE 24-HOUR CONCENTRATION PM10 TREND1
Source: California Air Resource Board 1 Some year have been omitted from the table as insufficient data (or no) data has been reported. Years with reported value of “0” have also been omitted.
TABLE 3: SOUTH COAST AIR BASIN ANNUAL AVERAGE CONCENTRATION PM10 TREND1
Source: California Air Resource Board 1 Some year have been omitted from the table as insufficient data (or no) data has been reported. Years with reported value of “0” have also been omitted.
0.0
20.0
40.0
60.0
80.0
100.0
120.0
140.0
160.0
180.0
200.01
98
81
98
91
99
01
99
11
99
21
99
31
99
41
99
51
99
61
99
71
99
81
99
92
00
02
00
12
00
22
00
32
00
42
00
52
00
62
00
72
00
82
00
92
01
02
01
12
01
22
01
32
01
42
01
52
01
62
01
7
PM
10
(µg/
m3)
Year1
24-Hour Average Federal Standard
0.0
10.0
20.0
30.0
40.0
50.0
60.0
70.0
80.0
90.0
100.0
19
89
19
90
19
91
19
92
19
93
19
94
19
95
19
96
19
97
19
98
19
99
20
00
20
01
20
02
20
03
20
04
20
05
20
06
20
07
20
08
20
09
20
10
20
11
20
12
20
13
20
14
20
15
20
17
PM
10(µ
g/m
3)
Year1
Annual Average State Standard

Mr. Clark Neuhoff Alere Property Group April 26, 2019 Page 3
11182-03 AQ Memo
TABLE 4: SOUTH COAST AIR BASIN 24-HOUR AVERAGE CONCENTRATION PM2.5 TREND1
Source: California Air Resource Board 1 Some year have been omitted from the table as insufficient data (or no) data has been reported. Years with reported value of “0” have also been omitted.
TABLE 5: SOUTH COAST AIR BASIN ANNUAL AVERAGE CONCENTRATION PM2.5 TREND1
Source: California Air Resource Board 1 Some year have been omitted from the table as insufficient data (or no) data has been reported. Years with reported value of “0” have also been omitted.
0.0
10.0
20.0
30.0
40.0
50.01
99
9
20
00
20
01
20
02
20
03
20
04
20
05
20
06
20
07
20
08
20
09
20
10
20
11
20
12
20
13
20
15
20
16
20
17
PM
10
(µg/
m3 )
Year1
24-Hour Average Federal Standard
0.0
5.0
10.0
15.0
20.0
25.0
30.0
20
00
20
01
20
02
20
03
20
04
20
05
20
06
20
07
20
08
20
09
20
10
20
11
20
12
20
13
20
14
20
15
20
16
20
17
PM
10
(µg/
m3)
Year1
Annual Average State Standard

Mr. Clark Neuhoff Alere Property Group April 26, 2019 Page 4
11182-03 AQ Memo
While the 2012 AQMP PM10 attainment demonstration and the 2015 associated supplemental SIP submission indicated that attainment of the 24-hour standard was predicted to occur by the end of 2015, it could not anticipate the effect of the ongoing drought on the measured PM2.5.
The 2006 to 2010 base period used for the 2012 attainment demonstration had near-normal rainfall. While the trend of PM2.5- equivalent emission reductions continued through 2015, the severe drought conditions contributed to the PM2.5 increases observed after 2012. As a result of the disrupted progress toward attainment of the federal 24-hour PM2.5 standard, SCAQMD submitted a request and the U.S. EPA approved, in January 2016, a “bump up” to the nonattainment classification from “moderate” to “serious,” with a new attainment deadline as soon as practicable, but not beyond December 31, 2019.
In March 2017, the AQMD released the Final 2016 AQMP. The 2016 AQMP continues to evaluate current integrated strategies and control measures to meet the NAAQS, as well as, explore new and innovative methods to reach its goals. Some of these approaches include utilizing incentive programs, recognizing existing co-benefit programs from other sectors, and developing a strategy with fair-share reductions at the federal, state, and local levels (5). Similar to the 2012 AQMP, the 2016 AQMP incorporates scientific and technological information and planning assumptions, including the 2016 RTP/SCS and updated emission inventory methodologies for various source categories (6).
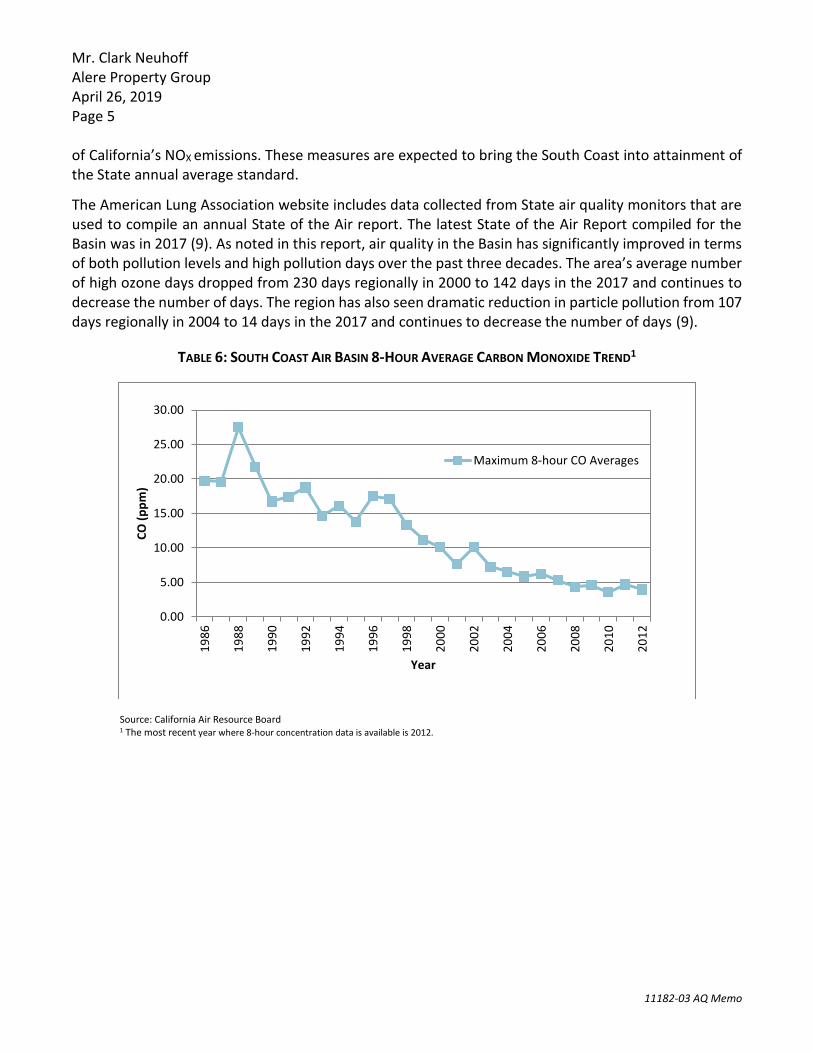
The most recent CO concentrations in the SCAB are shown in Table 6 (4). CO concentrations in the SCAB have decreased markedly — a total decrease of more about 80 percent in the peak 8-hour concentration since 1986. It should be noted 2012 is the most recent year where 8-hour CO averages and related statistics are available in the South Coast Air Basin. The number of exceedance days has also declined. The entire SCAB is now designated as attainment for both the state and national CO standards. Ongoing reductions from motor vehicle control programs should continue the downward trend in ambient CO concentrations.
Part of the control process of the SCAQMD’s duty to greatly improve the air quality in the Basin is the uniform CEQA review procedures required by SCAQMD’s CEQA Handbook (7). The single threshold of significance used to assess Project direct and cumulative impacts has in fact “worked” as evidenced by the track record of the air quality in the Basin dramatically improving over the course of the past decades. As stated by the SCAQMD, the District’s thresholds of significance are based on factual and scientific data and are therefore appropriate thresholds of significance to use for this Project.
The most recent NO2 data for the SCAB is shown in Tables 7 and 8 (4). Over the last 50 years, NO2 values have decreased significantly; the peak 1-hour national and state averages for 2017 is approximately 77 percent lower than what it was during 1963. The SCAB attained the State 1-hour NO2 standard in 1994, bringing the entire State into attainment. A new state annual average standard of 0.030 parts per million was adopted by the ARB in February 2007 (8). The new standard is just barely exceeded in the South Coast. NO2 is formed from NOX emissions, which also contribute to ozone. As a result, the majority of the future emission control measures will be implemented as part of the overall ozone control strategy. Many of these control measures will target mobile sources, which account for more than three-quarters
Mr. Clark Neuhoff Alere Property Group April 26, 2019 Page 5
11182-03 AQ Memo
of California’s NOX emissions. These measures are expected to bring the South Coast into attainment of the State annual average standard.
The American Lung Association website includes data collected from State air quality monitors that are used to compile an annual State of the Air report. The latest State of the Air Report compiled for the Basin was in 2017 (9). As noted in this report, air quality in the Basin has significantly improved in terms of both pollution levels and high pollution days over the past three decades. The area’s average number of high ozone days dropped from 230 days regionally in 2000 to 142 days in the 2017 and continues to decrease the number of days. The region has also seen dramatic reduction in particle pollution from 107 days regionally in 2004 to 14 days in the 2017 and continues to decrease the number of days (9).
TABLE 6: SOUTH COAST AIR BASIN 8-HOUR AVERAGE CARBON MONOXIDE TREND1
Source: California Air Resource Board 1 The most recent year where 8-hour concentration data is available is 2012.
0.00
5.00
10.00
15.00
20.00
25.00
30.00
19
86
19
88
19
90
19
92
19
94
19
96
19
98
20
00
20
02
20
04
20
06
20
08
20
10
20
12
CO
(p
pm
)
Year
Maximum 8-hour CO Averages

Mr. Clark Neuhoff Alere Property Group April 26, 2019 Page 1
11182-03 AQ Memo
TABLE 7: SOUTH COAST AIR BASIN 24-HOUR AVERAGE NITROGEN DIOXIDE TREND (BASED ON FEDERAL STANDARD)
Source: California Air Resource Board
TABLE 8: SOUTH COAST AIR BASIN 24-HOUR AVERAGE NITROGEN DIOXIDE TREND (BASED ON STATE STANDARD)
Source: California Air Resource Board
TOXIC AIR CONTAMINANTS (TACS) TRENDS
In 1984, as a result of public concern for exposure to airborne carcinogens, the CARB adopted regulations to reduce the amount of air toxic contaminant emissions resulting from mobile and area sources, such as cars, trucks, stationary products, and consumer products. According to the Ambient and Emission
0.0
100.0
200.0
300.0
400.0
500.0
600.0
700.0
800.01
96
3
19
65
19
67
19
69
19
71
19
73
19
75
19
77
19
79
19
81
19
83
19
85
19
87
19
89
19
91
19
93
19
95
19
97
19
99
20
01
20
03
20
05
20
07
20
09
20
11
20
13
20
15
20
17
NO
2(p
pb
)
Year
1-Hour Average (National) Federal Standard
0.0
100.0
200.0
300.0
400.0
500.0
600.0
700.0
800.0
19
63
19
65
19
67
19
69
19
71
19
73
19
75
19
77
19
79
19
81
19
83
19
85
19
87
19
89
19
91
19
93
19
95
19
97
19
99
20
01
20
03
20
05
20
07
20
09
20
11
20
13
20
15
20
17
NO
2(p
pb
)
Year
1-hour average (State) State Standard

Mr. Clark Neuhoff Alere Property Group April 26, 2019 Page 2
11182-03 AQ Memo
Trends of Toxic Air Contaminants in California journal article (10) which was prepared for CARB, results show that between 1990-2012, ambient concentration and emission trends for the seven TACs responsible for most of the known cancer risk associated with airborne exposure in California have declined significantly (between 1990 and 2012). The seven TACs studied include those that are derived from mobile sources: diesel particulate matter (DPM), benzene, and 1,3-butadiene; those that are derived from stationary sources: perchloroethylene and hexavalent chromium; and those derived from photochemical reactions of emitted VOCs: formaldehyde and acetaldehyde1. TACs data was gathered at monitoring sites from both the Bay Area and South Coast Air Basins, as shown on Exhibit A; Several of the sites in the SCAB include Reseda, Compton, Rubidoux, Burbank, and Fontana. The decline in ambient concentration and emission trends of these TACs are a result of various regulations CARB has implemented to address cancer risk.
Mobile Source TACs
CARB introduced two programs that aimed at reducing mobile emissions for light and medium duty vehicles through vehicle emissions controls and cleaner fuel. In California, light-duty vehicles sold after 1996 are equipped with California’s second-generation On-Board Diagnostic (OBD-II) system. The OBD II system monitors virtually every component that can affect the emission performance of the vehicle to ensure that the vehicle remains as clean as possible over its entire life and assists repair technicians in diagnosing and fixing problems with the computerized engine controls. If a problem is detected, the OBD II system illuminates a warning lamp on the vehicle instrument panel to alert the driver. This warning lamp typically contains the phrase Check Engine or Service Engine Soon. The system will also store important information about the detected malfunction so that a repair technician can accurately find and fix the problem. ARB has recently developed similar OBD requirements for heavy-duty vehicles over 14,000 lbs. CARB’s phase II Reformulated Gasoline (RFG-2) regulation, adopted in 1996, also led to a reduction of mobile source emissions. Through such regulations, benzene levels declined 88% from 1990-2012. 1,3-Butadiene concentrations also declined 85% from 1990-2012 as a result of the use of reformulated gasoline and motor vehicle regulations (10).
1 It should be noted that ambient DPM concentrations are not measured directly. Rather, a surrogate method using the coefficient of haze (COH) and
elemental carbon (EC) is used to estimate DPM concentrations.

Mr. Clark Neuhoff Alere Property Group April 26, 2019 Page 3
11182-03 AQ Memo
EXHIBIT A: CALIFORNIA TOXIC AIR CONTAMINANT SITES
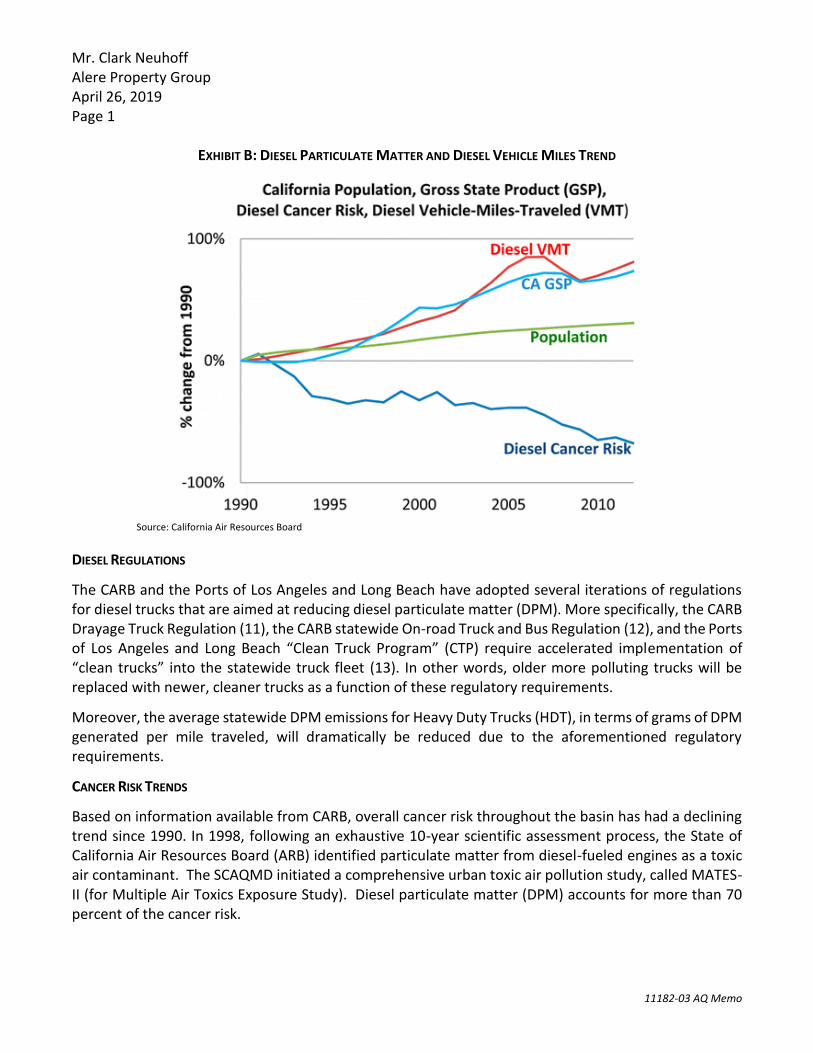
In 2000, CARB’s Diesel Risk Reduction Plan (DRRP) recommended the replacement and retrofit of diesel-fueled engines and the use of ultra-low-sulfur (<15ppm) diesel fuel. As a result of these measures, DPM concentrations have declined 68% since 2000, even though the state’s population increased 31% and the amount of diesel vehicles miles traveled increased 81%, as shown on Exhibit B. With the implementation of these diesel-related control regulations, ARB expects a DPM decline of 71% for 2000-2020.
Mr. Clark Neuhoff Alere Property Group April 26, 2019 Page 1
11182-03 AQ Memo
EXHIBIT B: DIESEL PARTICULATE MATTER AND DIESEL VEHICLE MILES TREND
Source: California Air Resources Board
DIESEL REGULATIONS
The CARB and the Ports of Los Angeles and Long Beach have adopted several iterations of regulations for diesel trucks that are aimed at reducing diesel particulate matter (DPM). More specifically, the CARB Drayage Truck Regulation (11), the CARB statewide On-road Truck and Bus Regulation (12), and the Ports of Los Angeles and Long Beach “Clean Truck Program” (CTP) require accelerated implementation of “clean trucks” into the statewide truck fleet (13). In other words, older more polluting trucks will be replaced with newer, cleaner trucks as a function of these regulatory requirements.
Moreover, the average statewide DPM emissions for Heavy Duty Trucks (HDT), in terms of grams of DPM generated per mile traveled, will dramatically be reduced due to the aforementioned regulatory requirements.
CANCER RISK TRENDS
Based on information available from CARB, overall cancer risk throughout the basin has had a declining trend since 1990. In 1998, following an exhaustive 10-year scientific assessment process, the State of California Air Resources Board (ARB) identified particulate matter from diesel-fueled engines as a toxic air contaminant. The SCAQMD initiated a comprehensive urban toxic air pollution study, called MATES-II (for Multiple Air Toxics Exposure Study). Diesel particulate matter (DPM) accounts for more than 70 percent of the cancer risk.

Mr. Clark Neuhoff Alere Property Group April 26, 2019 Page 2
11182-03 AQ Memo
In 2008 the SCAQMD prepared an update to the MATES-II study, referred to as MATES-III. MATES-III estimates the average excess cancer risk level from exposure to TACs is an approximately 17% decrease in comparison to the MATES-II study.
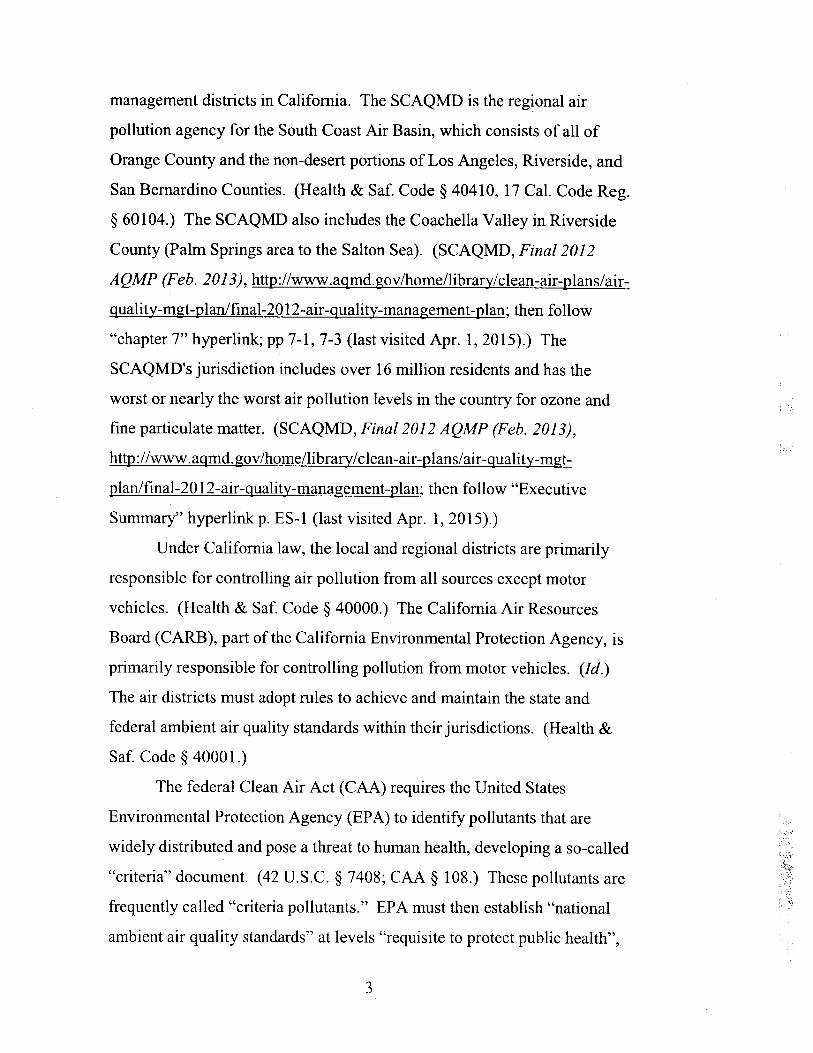
Nonetheless, the SCAQMD’s most recent in-depth analysis of the toxic air contaminants and their resulting health risks for all of Southern California was from the Multiple Air Toxics Exposure Study in the South Coast Air Basin, MATES IV,” which shows that cancer risk has decreased more than 55% between MATES III (2005) and MATES IV (2015) ( (14)).
In January 2018, as part of the overall effort to reduce air toxics exposure in the SCAB, SCAQMD began conducting the MATES V Program. MATES V field measurements will be conducted over a one-year period at ten fixed sites (the same sites selected for MATES III and IV) to assess trends in air toxics levels. MATES V will also include measurements of ultrafine particles (UFP) and black carbon (BC) concentrations, which can be compared to the UFP levels measured in MATES IV (15). The final report for the MATES V study will be available in Fall 2019.
SUPPLEMENTAL ASSESSMENT
SCAQMD ANALYSIS IN ITS BRIEF
As noted in the Brief of Amicus Curiae by the South Coast Air Quality Management District in the Friant Ranch case (April 6, 2015, Attachment A) (Brief), SCAQMD has among the most sophisticated air quality modeling and health impact evaluation capability of any of the air districts in the State, and thus it is uniquely situated to express an opinion on how lead agencies should correlate air quality impacts with specific health outcomes. (Brief at page App-2). SCAQMD receives as many as 60 or more CEQA documents each month (around 500 per year) in its role as commenting agency or an agency with "jurisdiction by law" over air quality. Brief at page 7. The SCAQMD staff provides comments on as many as 25 or 30 such documents each month. Ibid. Therefore, the AQIA and this Supplemental Assessment rely on SCAQMD expertise, thresholds, and guidance to disclose the Project's air quality impacts.
The SCAQMD discusses that it may be infeasible to quantify health risks caused by projects similar to the proposed Project, due to many factors. It is necessary to have data regarding the sources and types of air toxic contaminants, location of emission points, velocity of emissions, the meteorology and topography of the area, and the location of receptors (worker and residence). Brief at pages 9-10. The Brief states that it may not be feasible to perform a health risk assessment for airborne toxics that will be emitted by a generic industrial building that was built on "speculation" (i.e., without knowing the future tenant(s))2. Brief at page 10. Even where a health risk assessment can be prepared, however, the resulting maximum health risk value is only a calculation of risk--it does not necessarily mean anyone will contract cancer as a result of the Project. Ibid. The Brief also cites the author of the CARB methodology, which reported that a PM2.5 methodology is not suited for small projects and may yield
2 It should also be noted that the actual occurrence of specific health conditions are based on numerous other factors that are infeasible
to quantify, such as an individuals genetic predisposition, diet, exercise regiment, stress, and other behavioral characteristics.

Mr. Clark Neuhoff Alere Property Group April 26, 2019 Page 3
11182-03 AQ Memo
unreliable results (Brief at page 14). Similarly, SCAQMD staff does not currently know of a way to accurately quantify ozone-related health impacts caused by NOX or VOC emissions from relatively small projects. reached with respect to NOX or VOC emissions from relatively small projects, due to photochemistry and regional model limitations (Brief at page 12). The Brief concludes, with respect to the Friant Ranch EIR, that although it may have been technically possible to plug the data into a methodology, the results would not have been reliable or meaningful (Brief at page 15).
On the other hand, for extremely large regional projects (unlike the Proposed Project), the SCAQMD states that it has been able to correlate potential health outcomes for very large emissions sources – as part of their rulemaking activity, specifically 6,620 pounds per day of NOX and 89,180 pounds per day of VOC were expected to result in approximately 20 premature deaths per year and 89,947 school absences due to ozone (Brief, at page 12)
APPLICATION OF SCAQMD ANALYSIS TO THE PROPOSED PROJECT
The Brief makes it clear that SCAQMD does not believe that there must be a quantification of a project's health risks in all CEQA documents prepared for individual projects. Any attempt to quantify the proposed Project's health risks would be considered unreliable and misleading. The proposed Project is much less intense than the Friant Ranch project and has dramatically fewer air quality emissions, and the SCAQMD determined that an attempt to quantify the Friant Ranch health risks would be unreliable and misleading, due to the aforementioned factors. Also, the proposed Project does not generate anywhere near 6,620 pounds per day of NOX or 89,190 pounds per day of VOC emissions, which SCAQMD stated was a large enough emission to quantify ozone-related health impacts (see Pages 12-14 of SCAQMD Brief of Amicus Curiae). Therefore, the Project’s emissions are not sufficiently high enough to use regional modeling program to correlate health effects on a basin-wide level. Notwithstanding, as previously noted, the AQIA does include a site-specific localized impact analysis that does correlate potential project health impacts on a local level to immediately adjacent land uses (see Draft EIR p 4.2-3 discussing the general health impacts of NOX).
FURTHER DISCUSSION OF THE PROPOSED PROJECT'S HEALTH RISKS
The SCAQMD’s numeric regional thresholds are based in part on Section 180 (e) of the federal Clean Air Act (CAA) – it should be noted that the numeric regional mass daily thresholds have not changed since their adoption as part of the CEQA Air Quality Handbook published by SCAQMD in 1993 (over 20 years ago). The numeric regional mass daily thresholds are also intended to provide a means of consistency in significance determination within the environmental review process. Notwithstanding, simply exceeding the SCAQMD’s numeric regional mass daily thresholds does not constitute a particular health impact to an individual receptor. The reason for this is that the mass daily thresholds are in pounds per day emitted into the air whereas health effects are determined based on the concentration of emissions in the air at a particular receptor (e.g., parts per million by volume of air, or micrograms per cubic meter of air). State and federal ambient air quality standards were developed to protect the most susceptible population groups from adverse health effects and were established in terms of parts per million or micrograms per

Mr. Clark Neuhoff Alere Property Group April 26, 2019 Page 4
11182-03 AQ Memo
cubic meter for the applicable emissions.
For this reason, the SCAQMD developed a methodology to assist lead agencies in analyzing localized air quality impacts from a proposed project as they relate to carbon monoxide (CO), nitrogen oxides (NOX), particulate matter less than 2.5 microns in aerodynamic diameter (PM2.5) and particulate matter less than 10 microns in aerodynamic diameter (PM10). This methodology is collectively referred to as the localized significance thresholds (LSTs). The LSTs differ from the numeric regional mass daily thresholds since the LSTs are based on the amount of emissions generated from a project that are not expected to cause or contribute to an exceedance of the most stringent applicable federal or state ambient air quality standard, and are based on the ambient concentrations of the pollutant and the relative distance to the nearest sensitive receptor (the SCAQMD performed air dispersion modeling to determine what amount of emissions generated a particular concentration at a particular distance).
The AQIA evaluated the proposed Project’s localized impact to air quality for emissions of CO, NOX, PM10, and PM2.5 by comparing the proposed Project’s on-site emissions to the SCAQMD’s applicable LST thresholds (see Sections 3.6 and 3.7 of the AQIA). As evaluated in the AQIA Report, the Project would not result in emissions that exceeded the SCAQMD’s LSTs. Therefore, the Project would not be expected to exceed the most stringent applicable federal or state ambient air quality standards for emissions of CO, NOX, PM10, and PM2.5. It should be noted that the ambient air quality standards are developed and represent levels at which the most susceptible persons (children and the elderly) are protected from health-based impacts. In other words, the ambient air quality standards are purposefully set low to protect children, elderly, and those with existing respiratory problems.
Furthermore, as shown in the previous sections, air quality trends for both emissions of NOX, VOCs, and Ozone (which is a byproduct of NOX and VOCs) have been trending downward within the air basin even as development has increased over the last several years. Therefore, although the proposed Project will exceed the SCAQMD’s numeric thresholds for emissions of NOX this does not in itself constitute a basin-wide increase in health effects related to these pollutants.
As noted in the Brief of Amicus Curiae by the South Coast Air Quality Management District (April 6, 2015, Attachment A), the SCAQMD has acknowledged that for criteria pollutants it would be extremely difficult, if not impossible to quantify health impacts for various reasons including modeling limitations as well as where in the atmosphere air pollutants interact and form. Furthermore, as noted in the Brief of Amicus Curiae by the San Joaquin Valley Unified Air Pollution Control District (SJVAPCD) (April 13, 2015, Attachment B), SJVAPCD has acknowledged that currently available modeling tools are not equipped to provide a meaningful analysis of the correlation between an individual development project’s air emissions and specific human health impacts.3 (see Page 4 of SJVAPCD Brief of Amicus
3 This is even true for the scope of the Friant Ranch Project which includes the construction of approximately 2,500 single and multi-family residential
units, a commercial village center, a recreation center, trails, open space, a neighborhood electric vehicle network, parks and parkways, and 250,000 square feet of commercial space on 482 acres.

Mr. Clark Neuhoff Alere Property Group April 26, 2019 Page 5
11182-03 AQ Memo
Curiae).
For analytical purposes, the LSTs for emissions of NOX can be used as a surrogate to determine whether or not there would be a potential health impact related to emissions of VOCs (since there are no ambient air quality standards for VOCs). As shown above, LSTs for NOX would not exceed the applicable threshold and a less than significant impact to localized (adjacent) sensitive receptors would occur. It should be noted that impacts related to air quality in the general sense are based on a source-receptor relationship – in other words, the further away one moves from the source, the lower the concentration in the ambient air.
The proposed Project does not generate anywhere near 6,620 pounds per day of NOX or 89,190 pounds per day of VOC emissions. The Project would generate 58.15 pounds per day of NOX during construction and 28.97 pounds per day of NOX during operations (0.87 percent and 0.44 percent of 6,620 pounds per day, respectively). The Project would also generate 28.76 pounds per day of VOC emissions during construction and 7.27 pounds per day of VOC emissions during operations (0.03 percent and 0.01 percent of 89,190 pounds per day, respectively).
Therefore, the Project’s emissions are not sufficiently high enough to use a regional modeling program to correlate health effects on a basin-wide level. Further, SJVAPCD acknowledges the same: “…the Air District is simply not equipped to analyze and to what extent the criteria pollutant emissions of an individual CEQA project directly impact human health in a particular area…even for projects with relatively high levels of emissions of criteria pollutant precursor emissions.” (see Page 8 of SJVAPCD Brief of Amicus Curiae).
Notwithstanding, as previously noted, the AQIA does include a site-specific localized impact analysis that does correlate potential project health impacts on a local level to immediately adjacent land uses. The SCAQMD Brief of Amicus Curiae and SJVAPCD Brief of Amicus Curiae are incorporated by reference into this letter and into the environmental documentation for this Project, including all references therein.
Unfortunately, current scientific, technological, and modeling limitations prevent the relation of expected adverse air quality impacts to likely health consequences. For this reason, this Supplemental Air Quality Assessment explains in meaningful detail why it is not feasible to provide such a numerical analysis, but why health-based impacts are nonetheless anticipated to be less than significant.
Respectfully submitted, URBAN CROSSROADS, INC.
Haseeb Qureshi, Senior Associate

Mr. Clark Neuhoff Alere Property Group April 26, 2019 Page 6
11182-03 AQ Memo
REFERENCES
1. South Coast Air Quality Management District. Air Quality Management Plan. 2012.
2. California Air Resources Board. The California Almanac of Emissions and Air Quality. 2013.
3. South Coast AQMD. South Coast Air Basin Ozone Trend. [Online] http://www.aqmd.gov/docs/default-source/air-quality/south-coast-air-basin-smog-trend-ozone-chart.pdf.
4. California Air Resources Board. iADAM: Air Quality Data Statistics. [Online]
5. South Coast Air Quality Management District. Final 2016 Air Quality Management Plan (AQMP). [Online] March 2017. http://www.aqmd.gov/docs/default-source/clean-air-plans/air-quality-management-plans/2016-air-quality-management-plan/final-2016-aqmp/final2016aqmp.pdf?sfvrsn=11.
6. Southern California Association of Governments. 2016-2040 Regional Transportation Plan/Sustainable Communities Strategy. [Online] April 2016. [Cited: April 16, 2018.] http://scagrtpscs.net/Documents/2016/final/f2016RTPSCS.pdf.
7. South coast Air Quality Management District. CEQA Air Quality Handbook (1993). [Online] 1993. [Cited: November 13, 2013.] http://www.aqmd.gov/ceqa/oldhdbk.html.
8. California Environmental Protection Agency Air Resources Board. Nitrogen Dioxide- Overview. [Online] [Cited: April 16, 2018.] http://www.arb.ca.gov/research/aaqs/caaqs/no2-1/no2-1.htm.
9. American Lung Association. State of the Air Southern California Regional Summary. [Online] [Cited: April 16, 2018.] http://www.lung.org/local-content/california/documents/state-of-the-air/2017/sota-2017_southernca-fact.pdf.
10. Ralph Propper, Patrick Wong, Son Bui, Jeff Austin, William Vance, Alvaro Alvarado, Bart Croes, and Dongmin Luo. Ambient and Emission Trends of Toxic Air Contaminants in California. American Chemical Society: Environmental Science & Technology. 2015.
11. Air Resources Board. ARB's Drayage Truck Regulatory Activities. [Online] http://www.arb.ca.gov/msprog/onroad/porttruck/porttruck.htm.
12. —. Truck and Bus Regulation. On-Road Heavy-Duty Diesel Vehicles (In-Use) Regulation. [Online] http://www.arb.ca.gov/msprog/onrdiesel/onrdiesel.htm.
13. The Port of Los Angeles. Clean Truck Program. [Online] http://www.portoflosangeles.org/ctp/idx_ctp.asp.
14. South Coast Air Quality Management District. The Multiple Air Toxics Exposure Study IV. 2015.
15. —. Transfer Funds, Appropriate Funding, Execute Purchase Orders, Execute Contrat and Authorize Release of RFQs for the Fifth Multiple Air Toxics Exposure Study. South Coast Air Quality Management District. [Online] 2017. http://www.aqmd.gov/docs/default-source/Agendas/Governing-Board/2017/2017-jul7-009.pdf?sfvrsn=7.

Mr. Clark Neuhoff Alere Property Group April 26, 2019 Page 7
11182-03 AQ Memo
ATTACHMENT A


Mr. Clark Neuhoff Alere Property Group April 26, 2019 Page 8
11182-03 AQ Memo
ATTACHMENT B