Sub-SaharanAfrica RefineryStudy - World...
44
Extractive Industries for Development Series #12 July 2009 Sub-Saharan Africa Refinery Study Report Summary EnSys Energy & Systems, ICF International, James Hammitt, Lisa Robinson
Transcript of Sub-SaharanAfrica RefineryStudy - World...

Extractive Industries for Development Series #12July 2009
Sub-Saharan AfricaRefinery Study
Report Summary
EnSys Energy & Systems,ICF International,James Hammitt,Lisa Robinson
World Bank Group's Oil, Gas, and Mining Policy DivisionOil, Gas, Mining, and Chemicals DepartmentA joint service of the World Bank and the
International Finance Corporation
The Oil, Gas, and Mining Policy Division series publishes reviews and analysesof sector experience from around the world as well as new findings fromanalytical work. It places particular emphasis on how the experience andknowledge gained relates to developing country policy makers, communitiesaffected by extractive industries, extractive industry enterprises, and civil societyorganizations. We hope to see this series inform a wide range of interested partieson the opportunities as well as the risks presented by the sector.
The findings, interpretations, and conclusions expressed in this paper are entirelythose of the authors and should not be attributed in any manner to the WorldBank or its affiliated organizations, or to members of its Board of ExecutiveDirectors or the countries they represent. The World Bank does not guaranteethe accuracy of the data included in this publication and accepts noresponsibility whatsoever for any consequence of their use.

Extractive Industries for Development Series #12July 2009
Sub-Saharan AfricaRefinery Study
Report Summary
EnSys Energy & Systems,ICF International, JamesHammitt, Lisa Robinson

COPYRIGHT © 2009http://www.worldbank.org/ogmc (OR /oil OR /gas OR /mining)http://www.ifc.org/ogmc (OR /oil OR /gas OR /mining)Cover Photos: Oil rig, hematite-banded ironstone, LNG tanker
E x t r a c t i v e I n d u s t r i e s f o r D e v e l o p m e n t S e r i e s iii
Table of Contents
v Acknowledgements
vi List of Acronyms and Definitionsof terms Used in the Report
1 Introduction
3 Summary of the Main Results
10 Health Study Overview
19 Refinery Study Overview
29 SSA Refinery Project Results and Conclusions

S u b - S a h a r a n A f r i c a R e f i n e r y P r o j e c t
List of FiguresFigure 1: Relationship of the Health Study and the Refinery Study ................................... 2
Figure 2: Sub-Saharan Africa – Selected Regions ................................................................ 3
Figure 3:Modeled Reductions of PM2.5 (tons/year) for Vehicle Sources in Three Cities ....12Figure 4: Sub-Saharan Africa Refinery Regional Groupings.............................................. 22
List of TablesTable 1:Monetary Valuation of the Health Benefits derived from the improvement of fuels
quality................................................................................................................... 4
Table 2: Total SSA Refinery Investments from the Eight Cases (Billions of 2007$)............ 5
Table 3: Incremental SSA Refinery Investments from Moving to AFRI-4 Fuel Specifications(Billions of 2007$)................................................................................................ 5
Table 4: Five-Year and Ten-Year Net Present Value of Refinery Investment Costs versusHealth Benefits ..................................................................................................... 6
Table 5:Major Investments Proposed by the WORLD® Model for the 2020 Constrainedand Open Market Cases........................................................................................ 8
Table 6: Cities Modeled in the Health Study.................................................................... 11
Table 7: Air Pollutants and Related Health Effects ........................................................... 11
Table 8:Modeled Annual Average Total Particulate Matter Concentrations for Three Cities(population density greater than 1,000/km)........................................................ 11
Table 9: Major Differences between SSA Regions Reflected in Modeling Results ............. 17
Table 10: Health Study Regional Analysis Results Using Alternate 2-Stroke MotorcycleAssumptions ..................................................................................................... 18
Table 11: AFRI Standards for Sub-Saharan Africa Transportation Fuels ........................... 19
Table 12:WORLD® Model Constraints........................................................................... 24
Table 13: Modeling Case Descriptions ............................................................................. 25
Table 14: Refinery Throughputs of Regional Groupings in the Various Cases .................. 26
Table 15: Total Refinery Investments from the Eight Cases (Billions of 2007$) ............... 27
Table 16: Incremental Costs to Move to AFRI-4 Fuel Specifications (Billions of 2007$)...... 27
Table 17: Incremental Unit Costs for AFRI-4 Fuels in the Constrained and Open MarketCases................................................................................................................. 28
Table 18: Net Present Value of Refinery Supply Costs versus Health Benefits over 5 Years ... 27
Table 19: Net Present Value of Refinery Supply Costs versus Health Benefits over 10 Years.. 30
iv
E x t r a c t i v e I n d u s t r i e s f o r D e v e l o p m e n t S e r i e s v
Acknowledgements
This report has been funded by the Energy Sector Management AssistanceProgram (ESMAP) administered by the World Bank. The concept, terms ofreference and overall supervision of the project has been provided by a SteeringCommittee including representatives from the African Refiners Association(ARA), the United Nations Environment Program (UNEP), the InternationalPetroleum Industry Environmental Conservation Association (IPIECA), and theOil and Gas Policy Unit of theWorld Bank (COCPO) and from five governments:Kenya, Nigeria, Republic of South Africa, Republic of Congo and Côte d’Ivoire.The task team leader was Eleodoro Mayorga Alba, Principal Petroleum Economistof the World Bank.
ICF International was selected as consultant. The ICF International team included:Zeta Rosenberg, project leader and Refinery Study project manager, AmyRosenstein, Health Study project manager, Martin Tallett, EnSys, Refinery Studysubcontractor, Lisa Robinson, independent consultant, Health Study subcontractor,valuation section, and James Hammitt, Harvard School of Public Health, HealthStudy subcontractor, valuation section.
ICF International would like to thank two organizations and one individual whogenerously provided help for this report:
• The African Refiners Association whose Chairman Joel Dervain andmembers, particularly the Sub-Saharan Africa members, responded fully andrapidly to our many requests for data,
• CITAC Africa LLP who generously shared with us their extensive database onrefineries and petroleum usage in Africa. We would particularly like to thankMark Elliott of CITAC who provided us with many useful suggestions andcomments based on his many years of experience in the petroleum industryin Africa, and
• Jane Akumu from the Nairobi Office of UNEP, who went out of her way tofind us SSA emission data and studies.
Special thanks go to Esther Petrilli-Massey for managing production of theSummary Report in the Extractive Industries for Development Series.
NOTE: For copies of the full report, please send a message to:[email protected]
vi S u b - S a h a r a n A f r i c a R e f i n e r y P r o j e c t
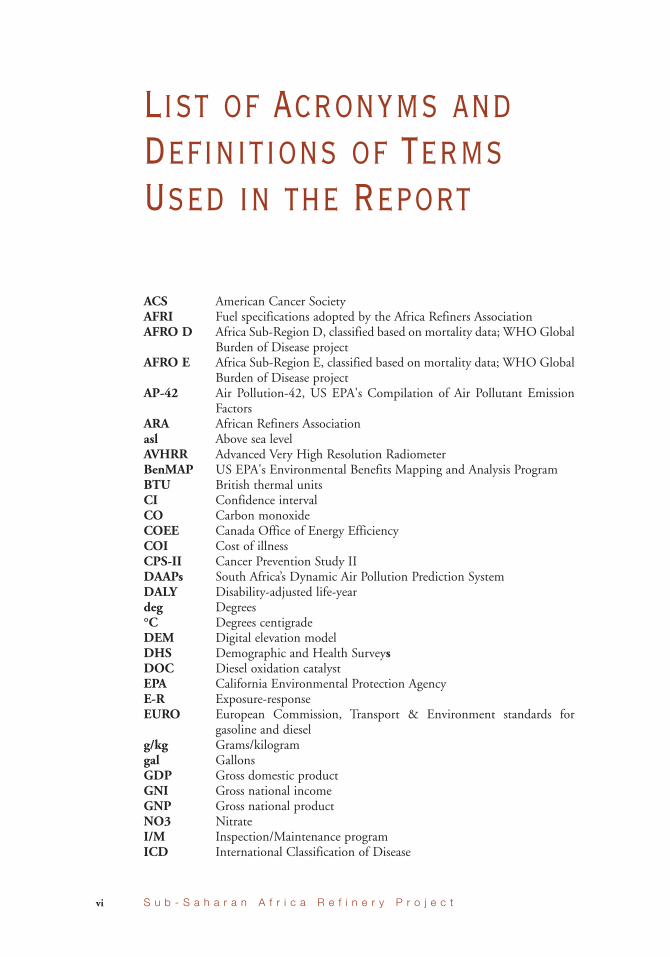
List of Acronyms andDefinitions of TermsUsed in the Report
ACS American Cancer SocietyAFRI Fuel specifications adopted by the Africa Refiners AssociationAFRO D Africa Sub-Region D, classified based on mortality data; WHOGlobal
Burden of Disease projectAFRO E Africa Sub-Region E, classified based on mortality data; WHO Global
Burden of Disease projectAP-42 Air Pollution-42, US EPA's Compilation of Air Pollutant Emission
FactorsARA African Refiners Associationasl Above sea levelAVHRR Advanced Very High Resolution RadiometerBenMAP US EPA's Environmental Benefits Mapping and Analysis ProgramBTU British thermal unitsCI Confidence intervalCO Carbon monoxideCOEE Canada Office of Energy EfficiencyCOI Cost of illnessCPS-II Cancer Prevention Study IIDAAPs South Africa’s Dynamic Air Pollution Prediction SystemDALY Disability-adjusted life-yeardeg Degrees°C Degrees centigradeDEM Digital elevation modelDHS Demographic and Health SurveysDOC Diesel oxidation catalystEPA California Environmental Protection AgencyE-R Exposure-responseEURO European Commission, Transport & Environment standards for
gasoline and dieselg/kg Grams/kilogramgal GallonsGDP Gross domestic productGNI Gross national incomeGNP Gross national productNO3 NitrateI/M Inspection/Maintenance programICD International Classification of Disease

viiE x t r a c t i v e I n d u s t r i e s f o r D e v e l o p m e n t S e r i e s
IMO International Maritime AssociationIPPS Industrial Pollution Projection SystemIR Incidence rateIVEM International Vehicle Emissions Modelkg Kilogramskm KilometersLAMATA Lagos Metropolitan Area Transport Authoritym Meters_g/m3 Micrograms per cubic meterm/s Minimum wind speedMARPOL International Convention for the Prevention of Pollution from ShipsMW Megawattsn NumberNO2 Nitrogen dioxideNOAA U.S. National Oceanographic and Atmospheric AdministrationNOx Nitrogen oxidesO3 OzoneOR Odds ratiop ProbabilityPM Particulate matterPM10 Particulate matter less than or equal to 10 micronsPM2.5 Particulate matter less than or equal to 2.5 micronsppm Parts per millionPPP Purchasing power parityPR Prevalence ratepsi Pound per square inchQALY Quality-adjusted life yearRFO Residual fuel oilRIVM Dutch National Institute for Public Health and the Environment
(Rijksinstituut voor Volksgezondheid en Milieu)RR Relative risk or risk ratioRSA Republic of South AfricaRVP Reid vapor pressureSCR Selective catalytic reductionSO2 Sulfur dioxideSO4 SulfateSSA Sub-Saharan Africat/y Metric tons/yeartpy Metric tons/yearTSP Total suspended particulatesUS EPA United States Environmental Protection AgencyUNEP United Nations Environment ProgrammeUSAID U.S. Agency for International DevelopmentVKT Vehicle kilometers traveledVOC Volatile organic compoundsVSL Value per statistical lifeVSLY Value per statistical life yearWGS UTM World geodetic system universal transverse MercatorWHO World Health OrganizationWRAP Western Regional Air Partnership (US)WTP Willingness to pay

S u b - S a h a r a n A f r i c a R e f i n e r y P r o j e c tviii
1E x t r a c t i v e I n d u s t r i e s f o r D e v e l o p m e n t S e r i e s
Introduction
TheWorld Bank and the African Refiners Association (ARA), with the concurrenceof the United Nations Environment Program (UNEP) and International PetroleumIndustry Environmental Conservation Association (IPIECA), wish to encourage theimplementation of policies to promote health and improved urban air qualitythrough better fuel quality, greater intra-regional trade of fuel products ofstandardized quality, and increased investments in the refining industry. The Sub-Saharan Africa Refinery Project evaluated the change necessary to improve fuelspecifications and the impacts on refining operations and costs, air quality, andhealth. The study compared the costs of improving the quality of fuels produced inSub-Saharan Africa (SSA) to the potential health benefits to the people in urbanareas of the region.
This is one of the first studies of these issues in SSA. Although there areuncertainties associated with the data, which are further compounded by the globalrecession, the project provides an estimate of the potential for health benefitsassociated with cleaner fuels, as well as the potential costs to the SSA refiningindustry to upgrade its conversion capacity and ensure clean fuel supply incompetitive conditions.
The study consists of two parts that interact as shown in Figure 1.
In order to make decisions regarding the future of the SSA refining industry, theHealth Study estimates health and monetary benefits associated with improved fuelspecification and vehicle emission controls, by region, which in turn are comparedto the costs to the refining industry, as developed in the Refinery Study.
The project methodology was presented by ICF International and approved by theWorld Bank and the ARA Steering Committee. In some cases, the project has been
Health Study: To estimate the reductions in air emissionsassociated with improved fuel specifications and vehicle emissioncontrols, analyze the impact of the change on human health, andestimate the health benefits in economic terms.Refinery Study: To outline the upgrades necessary in the SSArefining sector to respond to global market and clean fuelstrends, and to clarify the associated costs.

2 S u b - S a h a r a n A f r i c a R e f i n e r y P r o j e c t
limited by the availability and quality of data. Associated methodologicaluncertainties are discussed at length in the report, and must be kept in mind whenreviewing the results.
Model air pollutantreductions resulting frombetter fuels and vehicles,and vehicle controls.
Estimate health impactsof improved air quality.
Determine monetaryvalue of health benefits.
Health StudyHealth and
monetary benefitsof improved fuels
DecisionPoint
Refinery StudyCosts forchanging
manufacturingprocesses toimprove fuelsproduction
OtherConsiderations
Estimate future petroleum demand.
Determine SSA refineryassumptions and constraints.
Specify cases for 2010,2015, and 2020.
Run the World® GlobalDownstream Model.
FigureE-1:Relationshipof theHealthStudyandtheRefineryStudy
3E x t r a c t i v e I n d u s t r i e s f o r D e v e l o p m e n t S e r i e s
1. Summary of the MainResults
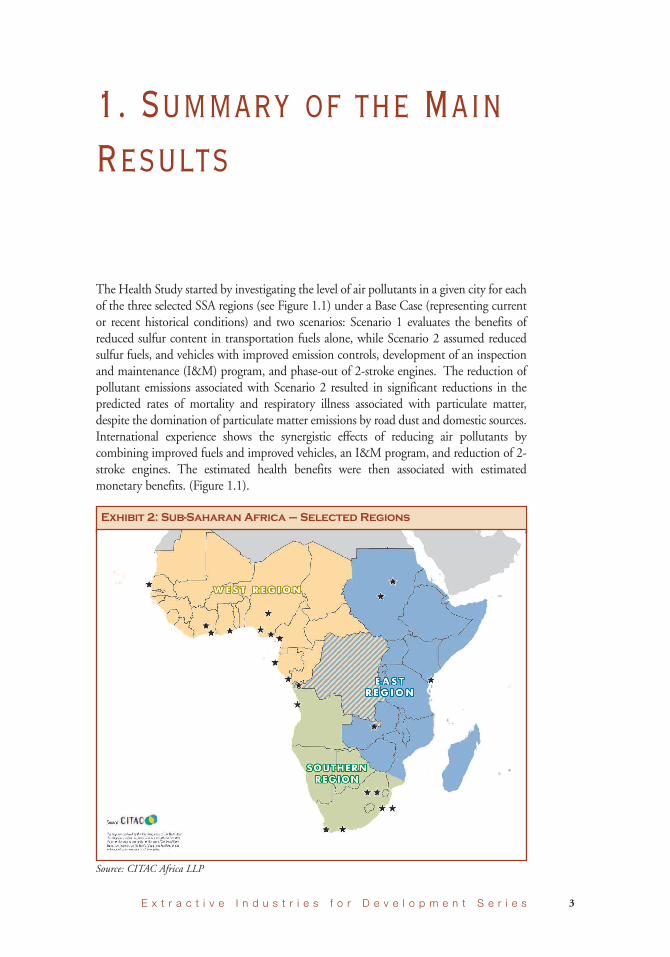
The Health Study started by investigating the level of air pollutants in a given city for eachof the three selected SSA regions (see Figure 1.1) under a Base Case (representing currentor recent historical conditions) and two scenarios: Scenario 1 evaluates the benefits ofreduced sulfur content in transportation fuels alone, while Scenario 2 assumed reducedsulfur fuels, and vehicles with improved emission controls, development of an inspectionand maintenance (I&M) program, and phase-out of 2-stroke engines. The reduction ofpollutant emissions associated with Scenario 2 resulted in significant reductions in thepredicted rates of mortality and respiratory illness associated with particulate matter,despite the domination of particulate matter emissions by road dust and domestic sources.International experience shows the synergistic effects of reducing air pollutants bycombining improved fuels and improved vehicles, an I&M program, and reduction of 2-stroke engines. The estimated health benefits were then associated with estimatedmonetary benefits. (Figure 1.1).
Exhibit 2: Sub-Saharan Africa – Selected Regions
Source: CITAC Africa LLP

4 S u b - S a h a r a n A f r i c a R e f i n e r y P r o j e c t
There are significant benefits to be obtained by reducing the causes of airpollution. As the Health study shows, improving the quality of fuels is one of thekey steps. The Southern region’s lower benefits reflect the fact that South Africanfuels already meet higher fuel standards, while the West region’s higher benefitsreflect the higher populations and average incomes in that region. What is alsoapparent from the table is that while there are benefits from only improving thequality of the transportation fuels, there are significant benefits from thesynergistic impact of improved fuels, improved vehicles, an I&M program, andreductions of 2-stroke engines.
Most SSA refineries are not equipped to produce ultra low sulfur fuels. The RefineryStudy modeled investments and operating costs associated with the improvement offuels quality for eight different cases reflecting the economic results both in the caseof an “open market” in which the SSA refineries would be fully exposed to globalcompetition, and in the case of a “constrained market” in which all existing SSArefineries would be protected and remain in operation. Apart from the Base Case(2010), for each projected year (2015 and 2020) two cases were run: in the firstrefiners kept current fuel standards and in the second refiners moved to improvedfuel standards, namely the ARA recommended AFRI-4 (see Table 1.2). Bycomparing the two cases in each year the incremental costs of moving to morestringent fuel specifications could be identified. Because of the impact of thecurrent global recession two economic cases were constructed in order to reflect therealities of the global economy: the cases were favorable and unfavorable growth. Inthe unfavorable case, GDP growth in SSA was lowered and certain other factors thatinfluence the economic health of the SSA refineries were tightened. The details arediscussed in the Refinery report.
SSAWest RegionBase CaseScenario 1Scenario 2
SSA East RegionBase CaseScenario 1Scenario 2
SSA Southern RegionBase CaseScenario 1Scenario 2
Total AnnualBenefitMillion $2007
-6404,500
-3401,300
-0252
5-Year NPVBillion$2007
-2.618
-1.45.3
-01.0
10-Year NPVBillion$2007
-4.532
-2.49.0
-01.8
Table 1: Monetary Valuation of the Health Benefits derived from theimprovement of fuels quality

5E x t r a c t i v e I n d u s t r i e s f o r D e v e l o p m e n t S e r i e s
Table 1.2 shows the total investment costs facing the SSA refining industry in allcases, while Table 1.3 shows the incremental costs of moving from current fuelspecifications to AFRI-4 standards in 2015 and 2020. The costs are those facingrefineries.
The incremental capital costs at port terminals that must expand to cope withincreased exports/imports are not included and neither are the incremental costs ofconsumer distribution infrastructure.
Costs arising from increased regulations and the setting up of an I&M program arealso not included.
The combined benefits estimated in the Health Study, using the Scenario 2assumptions, and the costs estimated in the Refinery Study, using the open marketscenario, Case 222, the most challenging to the SSA refinery sector, are shown inTable 4 as net present value, extrapolated over both a 5-year period and a 10-yearperiod.
Year
2015
2020
2020
Description
Open Market
Constrained
Open Market
SSATotal
1.25
3.27
2.33
WestTotal
0.45
2.12
1.44
SouthernTotal
0.26
0.40
0.31
EastTotal
0.53
0.75
0.59
Table 1.3: Incremental SSA Refinery Investments from Movingto AFRI-4 Fuel Specifications (Billions of 2007$)
Case
210
215
216
224
220
221
222
223
Description
Base
Open MarketUnfavorable
Open MarketUnfavorable
Constrained
Constrained
Open Market
Open Market
Open MarketUnfavorable
Year
2010
2015
2015
2020
2020
2020
2020
2020
AFRISpecifications
Current
Current
AFRI-4
Current
AFRI-4
Current
AFRI-4
AFRI-4
SSATotal
0.06
1.89
3.14
5.40
8.67
5.32
7.65
6.19
WestTotal
0.01
0.02
0.47
3.19
5.31
3.07
4.51
2.98
SouthernTotal
0.05
0.28
0.54
0.60
1.00
0.59
0.90
0.64
EastTotal
-
1.60
2.13
1.61
2.36
1.66
2.25
2.56
Table 1.2: Total SSA Refinery Investments from the EightCases (Billions of 2007$)

6 S u b - S a h a r a n A f r i c a R e f i n e r y P r o j e c t
While the answer to the cost benefit analysis indicates a clear incentive to implementAFRI-4 standards, and to do so swiftly, the answer to the question about the SSArefiners’ ability to function in the competitive global refining market is morecomplex. The global refining scenario underlying these cases is one of slack refiningcapacity through much of the period to 2020. Thus the SSA refiners in an openmarket will be faced with considerable competition from imports from the MiddleEast and India, regions with growing refinery capacity, and from Europe and theUnited States, regions with curtailed domestic demand. The implications are thatSSA refineries will have to focus on costs and efficiency to function effectively in theopen market. There is, if the slackness continues throughout the period, substantialpotential for refinery closures in Europe and the United States, which, should theyoccur, will substantially improve the outlook for the SSA refineries who have investedin upgrading and de-sulphurisation capacity. However, this cannot be relied upon toreduce the potential for large import volumes foreseen in the Refinery Study. Anoutcome is that SSA refineries that currently have economic problems and do notinvest may well be overwhelmed by future intense competition.
Among the important assumptions of the modeling exercise is that refiners will bereceiving prices for products delivered to domestic markets that reflect opportunitycosts. If the refiners are not remunerated at economic levels they will not be able toassume the required investments. In this case the supply costs to the respectivemarkets will be higher. Conversely, allowing SSA refineries to recover market costsfor the more advanced AFRI-4 fuels will improve refinery margins and viability.
One result of the modeling which may be of importance to policy makers is thatthe cost of maintaining all the existing SSA refineries through 2020 and requiring
Billions 2007 dollars
5-Year Refinery Investment Costs
Health Benefits over 5 Years1
10-Year Refinery Investment Costs
Health Benefits over 10 Years1
SSA Total
$2.76 B
$25 B
$6.14 B
$43 B
WestAfrica
$0.47 B
$18 B
$4.69 B
$32 B
EastAfrica
$2.13 B
$5.3 B
$2.48 B
$9.0 B
EastAfrica
$0.59 B
$1.0 B
$0.99 B
$1.8 B
Table 1.4: Five-Year and Ten-Year Net Present Value of RefineryInvestment Costs versus Health Benefits
1. Central value shown for elasticity=1.5; ranges for elasticities of 1.0 and 2.0 are shown in the report. For Scenario 2(lower sulfur fuel and pollution control equipment) and alternate 2-stroke motorcycle emissions assumptions.
These results indicate that, over time, the potential health benefits fromScenario 2 outweigh the costs to the SSA refineries of improving fuelspecifications. Regulatory authorities should raise the SSA fuelspecifications first to current refineries’ typical production specifications,and then, in a concerted way, move to AFRI-4 before the year 2015.
7E x t r a c t i v e I n d u s t r i e s f o r D e v e l o p m e n t S e r i e s
the investments to produce gasoline and diesel to AFRI-4 fuel specifications wasestimated at an incremental $1.02 billion (2007 $) over the free market case. Suchan incremental cost will have to be supported by the economies of countries wherethese refineries are located.
SSA refineries that do well in the competitive global market usually:
• Are larger and have scale• Have invested over time and are more complex• Are more efficient• Have access to good local quality crude oil, and• Have access to larger markets.
The consequent improvement in refinery margins from these investments, based onthe model assumptions, can be seen in Exhibits 6-1 through 6-3 in the main Refineryreport. What these tables show are that the three crack spreads representing the threetypical types of refineries improve markedly in 2015 and 2020 cases, both constrainedand open market, where the refineries move to AFRI-4 standards. Crack spreadsrepresent the gross margins achieved by the refineries.
The focus of this study was the cost benefit analysis of the impact of cleantransportation fuels on human health in the urban areas of SSA. As mentioned earlierthere are considerable uncertainties associated with the health data and the globalrecession has compounded the uncertainties associated with the demand projections.
Nevertheless, the health benefits are in line with similar work undertaken in Mexicoand China, and are of sufficient magnitude that even if the refinery costs weredoubled, on a NPV basis the benefits would still be positive.
There are two other aspects of transportation fuels and their emissions to keep inmind, apart from the potential health benefits:
• Looking out beyond 2020 the trends that have been apparent in SSA will likelycontinue, as in other developing nations. Populations will continue to grow,GDP will continue to expand and urbanization and traffic congestion will alsolikely grow. The net result of this is that in the next few decades vehicle missionswill overwhelm pollution from other sources such as road dust in most capitalcities of Sub-Saharan Africa.
• SSA imports vehicles. Global vehicles, both gasoline-powered and diesel-powered, make use of increasingly sophisticated and effective control
However, despite the problems arising from global competitionfacing the SSA refiners and despite the costs of moving to AFRI-4standards, those refiners that do invest will see improved refinerymargins and increased revenues.

8 S u b - S a h a r a n A f r i c a R e f i n e r y P r o j e c t
technology. However, this technology requires clean fuels with increasinglystringent specifications in order to optimally perform. Clean fuels are required fortechnological reasons as well as for health benefits.
Table 1.5 summarizes the major investments proposed by the model for the constrainedand openmarket AFRI-4 2020 cases for the existing refineries. The capacities and dollar
Table 1.5: Major Investments Proposed by the WORLD® Model for the 202
220 2020AFRI-4Constr
All units in MT, unless otherwise specified SGI CAM
Revamping
Debottlenecking
New Units
Debottlenecking
New Units
Revamping
Cat ref to CCRDDS to ULSD
Cost $ MillionsCrude distillation 275,000 90,000Vacuum distillation 59,000Cat crackingHydrocracking
Cost $ Millions 10Crude DistillationVacuum distillation 7,000Cat reforming 55,000Naptha desulfurization 113,000FCC gasoline desulfurization 117,000Distillate desulfurization 1,686,000 312,000VGO / FCC feed desulfurizationHydrogen Plant Mill (SCFD) 8,641Sulfur plant (T / day) 30,000 10,000Aromatics recovery 97,000 26,000Isomerization 61,000
Cost $ Millions 460 70Total Investment $ Millions 470 70Cat ref to CCRDDS to ULSD
Cost $ MillionsCrude distillationCat crackingHydrocracking
Cost $ MillionsCrude DistillationVacuum distillation 6,000Cat reforming 69,000Naptha desulfurizationFCC gasoline desulfurization 10,000Distillate desulfurization 1,048,000 190,000Hydrogen Plant Mill (SCFD) 8,055Sulfur plant (T / day) 20,000 10,000Aromatics recovery 104,000 18,000Isomerization 61,000
Cost $ Millions 350 50Total Investment $ Millions 350 50
222 2020AFRI-4OpenMarket
Case No. Description Unit

9E x t r a c t i v e I n d u s t r i e s f o r D e v e l o p m e n t S e r i e s
20 Constrained and Open Market Cases
amounts are shown by the refinery groupings. Similar data for all eight cases can befound in the report. The refinery groupings shown in the table are as follows:
SGI: Senegal, Ghana, Cóte d’IvoireCAM: CameroonNIG: Nigeria
ZAM: ZambiaKEN: KenyaSUD: Sudan
COG: Congo, GabonANG: AngolaSAF: South Africa
NIG COG ANG SAF ZAM KEN SUD1,918,000734,000260
925,000 229,000
199,00023,00030
350,00036,000
999,000 51,000 20,00023,000
118,0006,602,000 214,000 362,000 126,,000 290,000 1,753,000
105,0003,340 393 9,823 1,572 4,715
50,000 10,000 10,000 30,000 30,00026,000 498,000 2,000 38,000 86,000
1,190 120 90 620 90 100 3301,190 120 90 910 90 100 330
1,918,000736,000260
925,000199,00023,00030
121,000
407,00023,000
48,000 929,000 104,0003,643,000 46,000 3,092,000 128,000 1,791,000
9,627 1,375 5,30550,000 10,000 30,000
4,000 512,000 2,000 87,000
620 10 600 90 340620 10 600 90 340
Refinery Groupings
10 S u b - S a h a r a n A f r i c a R e f i n e r y P r o j e c t
2. Health Study Overview
The Health Study evaluated a Base Case, Scenario 1 (reduced sulfur intransportation fuels), and Scenario 2 (reduced fuel sulfur, improved emissioncontrols, and increase in vehicle activity), with the following steps:
• Air Quality Modeling- Select modeling locations (representative cities in Sub-Saharan Africa)- Select air quality model- Select pollutants and emission sources to be modeled
• Health Impact Assessment- Select health endpoints- Identify appropriate studies to evaluate air pollution/health relationship- Compile baseline health data- Calculate the reduction in mortality or cases of disease
• Valuation of Health Impacts- Determine the appropriate approach for valuation in Sub-Saharan Africa- Identify relevant studies and assess quality and applicability- Estimate the value of mortality risk reductions- Estimate the value of reductions in the risks of chronic bronchitis andexacerbation of asthma symptoms
Each step is associated with important uncertainties that are summarized belowand discussed in detail in the report.
Air Quality ModelingTo model the air quality for SSA, based primarily on the availability of emissionsdata, three representative cities from each of the selected regions of SSA (West, Eastand South - see Figure 2) were selected for quantitative analysis. Two additional citiesin each region were selected for qualitative analysis (Table 2.1).
Quantitative analysis involved compilation of emissions inventories and an airquality model to estimate ambient air quality resulting from local emissions of airpollutants. Emissions inventories for vehicle, area, and point sources werecompiled. Emissions data included variables such as percent of vehicle kilometerstraveled (VKT) by various types of vehicles, VKT on paved and unpaved roads,dust emissions factors, and industrial mix. Qualitative analysis compared localconditions (including population, total emissions, industrial mix, vehicle fleetcomposition, meteorology, etc.) to conditions of the quantitatively analyzed city inthe same region.
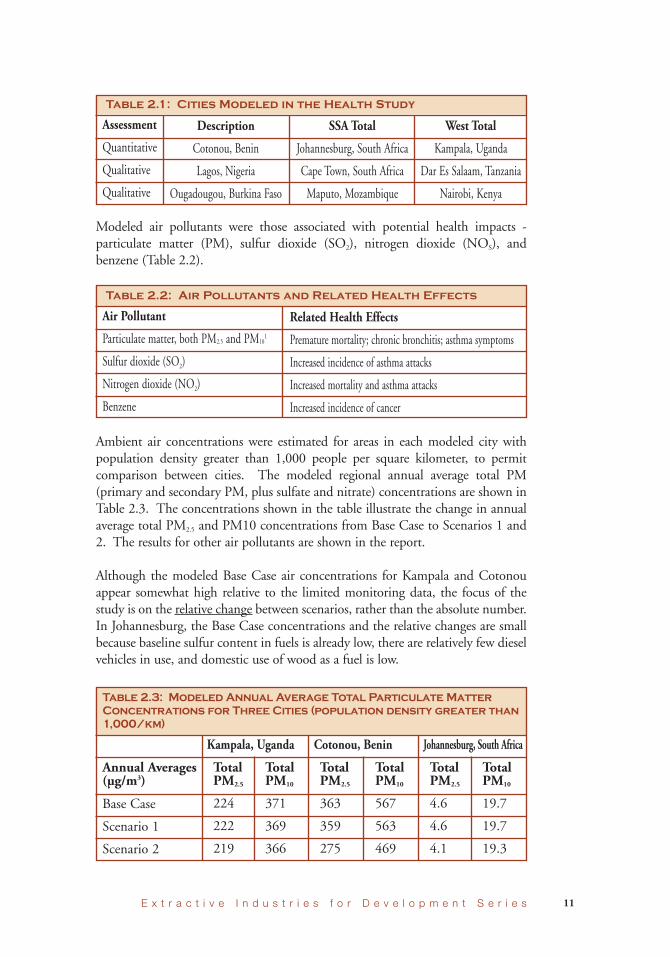
Modeled air pollutants were those associated with potential health impacts -particulate matter (PM), sulfur dioxide (SO2), nitrogen dioxide (NOS), andbenzene (Table 2.2).
Ambient air concentrations were estimated for areas in each modeled city withpopulation density greater than 1,000 people per square kilometer, to permitcomparison between cities. The modeled regional annual average total PM(primary and secondary PM, plus sulfate and nitrate) concentrations are shown inTable 2.3. The concentrations shown in the table illustrate the change in annualaverage total PM2.5 and PM10 concentrations from Base Case to Scenarios 1 and2. The results for other air pollutants are shown in the report.
Although the modeled Base Case air concentrations for Kampala and Cotonouappear somewhat high relative to the limited monitoring data, the focus of thestudy is on the relative change between scenarios, rather than the absolute number.In Johannesburg, the Base Case concentrations and the relative changes are smallbecause baseline sulfur content in fuels is already low, there are relatively few dieselvehicles in use, and domestic use of wood as a fuel is low.
11E x t r a c t i v e I n d u s t r i e s f o r D e v e l o p m e n t S e r i e s
Assessment
Quantitative
Qualitative
Qualitative
Description
Cotonou, Benin
Lagos, Nigeria
Ougadougou, Burkina Faso
SSA Total
Johannesburg, South Africa
Cape Town, South Africa
Maputo, Mozambique
West Total
Kampala, Uganda
Dar Es Salaam, Tanzania
Nairobi, Kenya
Table 2.1: Cities Modeled in the Health Study
Air Pollutant
Particulate matter, both PM2.5 and PM101
Sulfur dioxide (SO2)
Nitrogen dioxide (NO2)
Benzene
Related Health Effects
Premature mortality; chronic bronchitis; asthma symptoms
Increased incidence of asthma attacks
Increased mortality and asthma attacks
Increased incidence of cancer
Table 2.2: Air Pollutants and Related Health Effects
Kampala, Uganda Cotonou, Benin Johannesburg, South Africa
Table 2.3: Modeled Annual Average Total ParticulateMatterConcentrations for Three Cities (population density greater than1,000/km)
Annual Averages(µg/m3)
Base Case
Scenario 1
Scenario 2
TotalPM2.5
224
222
219
TotalPM10
371
369
366
TotalPM2.5
363
359
275
TotalPM10
567
563
469
TotalPM2.5
4.6
4.6
4.1
TotalPM10
19.7
19.7
19.3
Estimated Reduction in Tons/Year of PM2.5 for Vehicle Sources
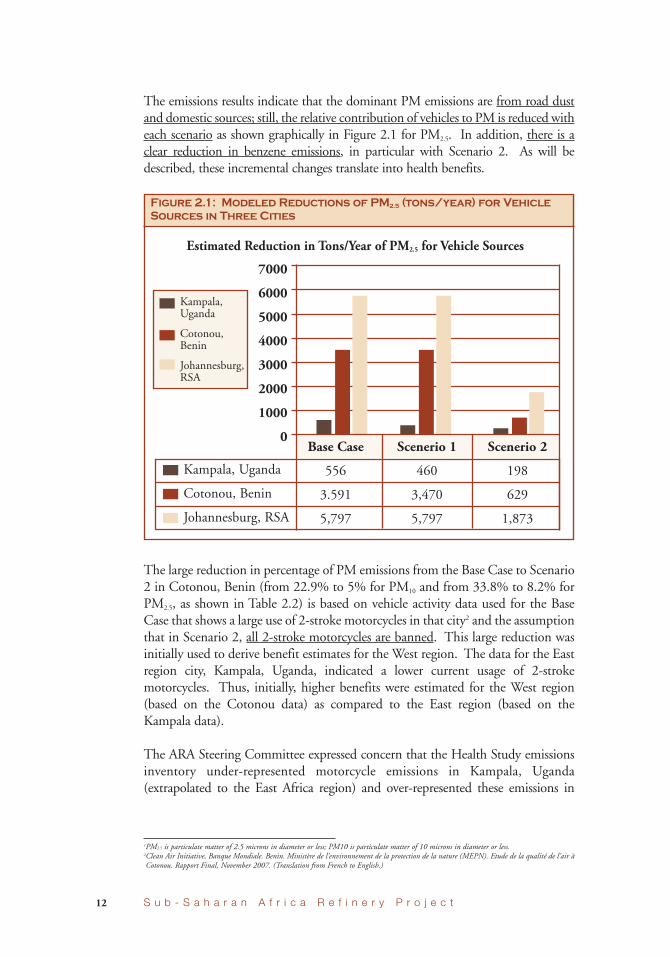
The emissions results indicate that the dominant PM emissions are from road dustand domestic sources; still, the relative contribution of vehicles to PM is reduced witheach scenario as shown graphically in Figure 2.1 for PM2.5. In addition, there is aclear reduction in benzene emissions, in particular with Scenario 2. As will bedescribed, these incremental changes translate into health benefits.
The large reduction in percentage of PM emissions from the Base Case to Scenario2 in Cotonou, Benin (from 22.9% to 5% for PM10 and from 33.8% to 8.2% forPM2.5, as shown in Table 2.2) is based on vehicle activity data used for the BaseCase that shows a large use of 2-stroke motorcycles in that city2 and the assumptionthat in Scenario 2, all 2-stroke motorcycles are banned. This large reduction wasinitially used to derive benefit estimates for the West region. The data for the Eastregion city, Kampala, Uganda, indicated a lower current usage of 2-strokemotorcycles. Thus, initially, higher benefits were estimated for the West region(based on the Cotonou data) as compared to the East region (based on theKampala data).
The ARA Steering Committee expressed concern that the Health Study emissionsinventory under-represented motorcycle emissions in Kampala, Uganda(extrapolated to the East Africa region) and over-represented these emissions in
12 S u b - S a h a r a n A f r i c a R e f i n e r y P r o j e c t
1PM2.5 is particulate matter of 2.5 microns in diameter or less; PM10 is particulate matter of 10 microns in diameter or less.2Clean Air Initiative, Banque Mondiale. Benin. Ministère de l’environnement de la protection de la nature (MEPN). Etude de la qualité de l’air àCotonou. Rapport Final, November 2007. (Translation from French to English.)
Figure 2.1: Modeled Reductions of PM2.5 (tons/year) for VehicleSources in Three Cities
7000
6000
5000
4000
3000
2000
1000
0Base Case
556
3.591
5,797
Scenerio 1
460
3,470
5,797
Scenerio 2
198
629
1,873
Kampala, Uganda
Cotonou, Benin
Johannesburg, RSA
Kampala,Uganda
Cotonou,Benin
Johannesburg,RSA

13E x t r a c t i v e I n d u s t r i e s f o r D e v e l o p m e n t S e r i e s
Cotonou, Benin (extrapolated to the West Africa region) for the Base Case andScenario 1.3 These concerns were based on anecdotal observations that:
(1) Motorcycle use has increased in recent years in East Africa, and(2) Motorcycle use may have decreased in West Africa because of bans on theuse of 2-stroke motorcycles in some areas. Therefore, regionalizing theCotonou analysis may be problematic because some large cities in WestAfrica, particularly in some states of Nigeria, have banned 2-stroke engines.While 2-stroke engines have not entirely disappeared from those cities,their prevalence has decreased so using Cotonou’s inventory for these citiesmay not be accurate.
Emissions from motorcycles, as well as other motor vehicles, are a function of thetotal vehicle activity that is kilometers driven. While the number of vehicle typesregistered is useful when vehicle activity data are not available, emissions are notdirectly scalable with the number of vehicles. For example, buses make up a smallfraction of the number of vehicles in most cities, but they are operated nearlycontinuously, meaning that the emissions from buses are not in proportion to theirnumber. Therefore, whenever available, travel fraction data, which is nearlyproportional to vehicle emissions, were used as a basis for quantifying vehicleactivity. Motorcycle travel fractions in Cotonou and Kampala were based onpublished vehicle activity data.
The air modeling results were scaled using the following assumptions:
Health Impact AssessmentHealth impacts are assessed by:
• Selecting health endpoints4 associated with the air pollutants of concern• Identifying appropriate studies to evaluate air pollution/health relationships• Compiling baseline health data• Calculating the reduction in mortality or cases of disease associated withimproved fuels
4Health endpoints mean the health impact of concern, such as respiratory illness or mortality.
Alternate 2-Stroke Motorcycle Assumptions for the Base Caseand Scenario 1:
• West Region: VKT from 2-stroke motorcycles was reducedfrom 50% to 10%
• East Region: VKT from 2-stroke motorcycles wasincreased from 20% to 50%
• South Region: no changes

14 S u b - S a h a r a n A f r i c a R e f i n e r y P r o j e c t
Exposure-response data from published studies quantifies the relationship betweenexposure to air pollutants (exposure) and health impacts (response). The mostsupportable studies, with high-quality exposure and health response data, wereselected. However, the selected studies are from U.S. locations with varyingdemographics. There are uncertainties associated with extrapolating the U.S. airpollution/health impact studies to Sub-Saharan Africa, although World Bankstudies have previously concluded that, under certain circumstances, there issupport for extrapolating results from cities in developed countries to cities indeveloping countries. Literature regarding air pollution/health impact data fromAfrica is mainly prevalence data, useful for determining baseline rates of the relevantdiseases, but providing limited exposure measurements. Other required baselinehealth data were collected from international organizations and databases.
Valuation of Health ImpactsEstimating the monetary value of the selected health risk reductions for this studyinvolved four steps:
• Determining the appropriate approach for valuation• Identifying relevant studies and assessing their quality and applicability• Estimating the value of mortality risk reductions• Estimating the value of reductions in the risks of chronic bronchitis andincreased asthma symptoms
Previous studies conducted by international and national organizations have useda variety of approaches to value health risk reductions. These diverse approaches inpart reflect differences in the goals of the studies, and in part reflect the limitationsof the then-available research. The three approaches most often used are calledwillingness-to-pay, cost-of-illness, and quality-adjusted life years or disability-adjusted life-years. The preferred approach to valuation in benefit-cost analysis isto rely on estimates of individual willingness-to-pay (WTP), which describeindividual preferences; i.e., the affected individuals’ willingness to exchange theirown income for reductions in their own risks, for example, the risk of mortality orillness. The value of the mortality risk reductions associated with pollutionabatement and other policies is commonly expressed as the value per statistical life(VSL). The VSL concept is frequently misunderstood -- it is not the value ofsaving a “life,” nor is it a measure of the moral worth or inherent value of anindividual.
The WTP approach is consistent with the framework for pollution abatementdecisions; e.g., deciding whether to allocate funds for further upgrades to refineryoperations or for other projects.
The monetary benefit values and the results of the benefit-cost analysis moregenerally, are only some of the many factors typically weighed by decision makers.Additional considerations include, for example, the distribution of the potential
15E x t r a c t i v e I n d u s t r i e s f o r D e v e l o p m e n t S e r i e s
health impacts across different countries and subpopulations, the potentialmagnitude of health effects that are not quantified, and the substantialuncertainties in the valuation estimates. In addition, decision makers may considerthe equity or fairness of different approaches, or may have goals or constraints thatwill lead to outcomes not entirely consistent with the preferences of those affected.Decision makers will need to exercise judgment in weighing the substantialuncertainty associated with these values, as well as the inability to quantify some ofthe effects of air pollutants.
The key conclusions of the health valuation are as follows.
General Framework• Although there are several current approaches, in benefit-cost analysis, thevalue of risk reductions is determined by estimating the affected individuals’own willingness to exchange income for the resulting benefits, so that thevalues reflect their preferences for spending on improved health rather thanon other goods and services such as food and shelter.
• Spending for risk reductions is more constrained in Sub-Saharan Africa thanin many other countries, because of the relatively low average incomes in thisregion. Average per capita income, based on purchasing power parity, is$1,900 annually in Sub-Saharan Africa. In contrast, per capita incomeaverages about $46,000 annually in the U.S. Significant income disparitiesunderline these averages both across and within countries.
• Estimates of willingness to pay for risk reductions are very uncertain forresidents of Sub-Saharan Africa because little is known about theirpreferences. Instead, values are typically extrapolated from studies conductedin much wealthier countries, with adjustment for income differences.
• Variation in income across SSA countries leads to large differences in theVSL estimates, because individuals’ willingness to pay for risk reductions isdependent on the amount of money they have available.
• Income is only one of many factors affecting the value of risk reductions.These values may also be influenced by the characteristics of the affectedpopulations (e.g., their age and health status) and of the risks themselves(e.g., whether they involve illness or injury or are incurred involuntarily). Asa result, values will vary across individuals, communities, countries, andregions for many reasons.
• The valuation section of the Health Study recommends the use of ranges toreflect uncertainty. To reduce this uncertainty, more research is needed thatdirectly elicits or reveals the preferences of individuals residing in thesecountries for reductions in these types of risks.
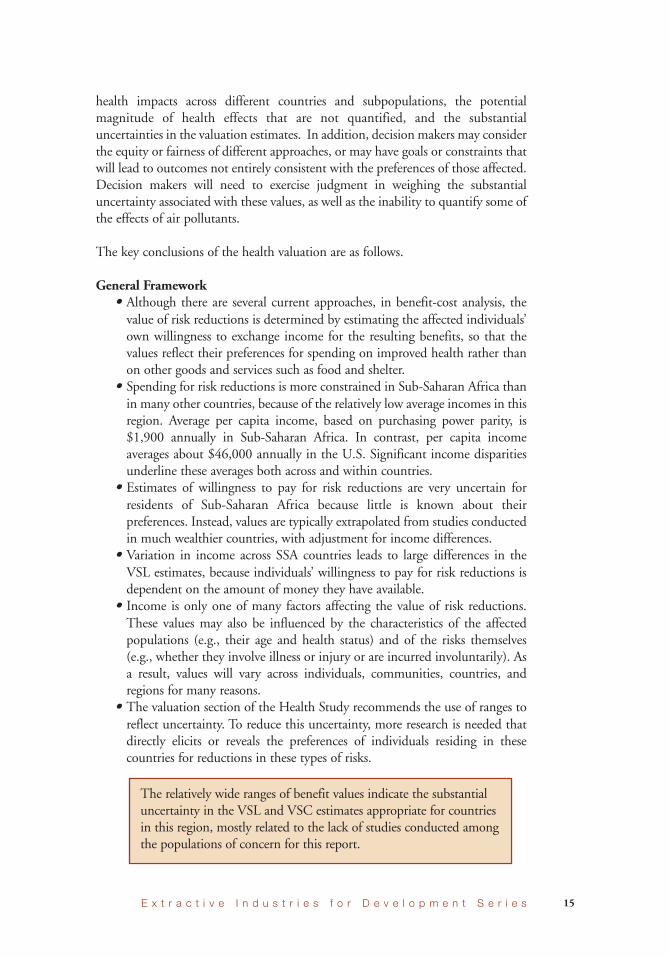
The relatively wide ranges of benefit values indicate the substantialuncertainty in the VSL and VSC estimates appropriate for countriesin this region, mostly related to the lack of studies conducted amongthe populations of concern for this report.

16 S u b - S a h a r a n A f r i c a R e f i n e r y P r o j e c t
Extrapolating from existing studies requires understanding the effects of largeincome differences, and we are uncertain about the appropriate income elasticity.In addition, differences in other population characteristics and in thecharacteristics of the risks themselves may lead to higher or lower values. Culturalattitudes towards risks, the age of those affected, and the quality of availablemedical treatment will affectWTP for health risk reductions. These factors are bestaddressed by conducting studies in the countries of concern. Additionalconsiderations, such as the equity of the distribution of wealth and health and non-quantified impacts, should be considered separately.
In addition to income – measured by the DDP per capita -, there are a number ofother differences between the available research and the mortality risks associatedwith air pollution in Sub-Saharan Africa. These include population characteristicssuch as age, life expectancy, health status, and total mortality risk.5 The study usedfor mortality valuation focuses on job-related deaths from accidental injuries, whileair pollution leads to deaths from illness. However, the available research is notsufficient to support quantitative adjustment of the VSL to reflect thesedifferences, especially given that these characteristics may be viewed differentlyacross countries and cultures.
The valuation estimates cover a wide range due to the significant differences inincome – measured by GDP per capita- across these countries. These values are onlyone of many factors that must be considered in related decisions. They do notincorporate concerns about the equity of the distribution of income and health.
Regional AnalysisThe estimated health benefits for each quantitatively evaluated city must beextrapolated to a regional level, in order to compare the benefits with the costsestimated in the Refinery Study. The regional extrapolation was accomplished by,first, identifying all large cities in each region, defined as those with a populationgreater than 300,000. Then, the estimated decreases in the numbers of deaths orcases of bronchitis or asthma in each modeled city were used to estimate thedecreases for the population of each large city in the region. Finally, the estimatedmonetary benefit values for each country were used to estimate the regionalmonetary benefits of a reduction in emissions of air pollutants.6 Scaling bypopulation and income level assumes that the scaled cities have the samereductions in emissions (including the same vehicle mix, industry mix, etc.), andthe same population characteristics (e.g., the same baseline rate of disease). This iscertainly an over-simplification; however, it provides an estimate of the potentialimpact of fuel improvements for each Sub-Saharan African region.
5Due to the limitations of the available research, this report recommends using the same values for adults and children, while noting that mortalityrisks to children are generally valued more highly.6We do not adjust the valuation estimates for income differences within each country.
17E x t r a c t i v e I n d u s t r i e s f o r D e v e l o p m e n t S e r i e s
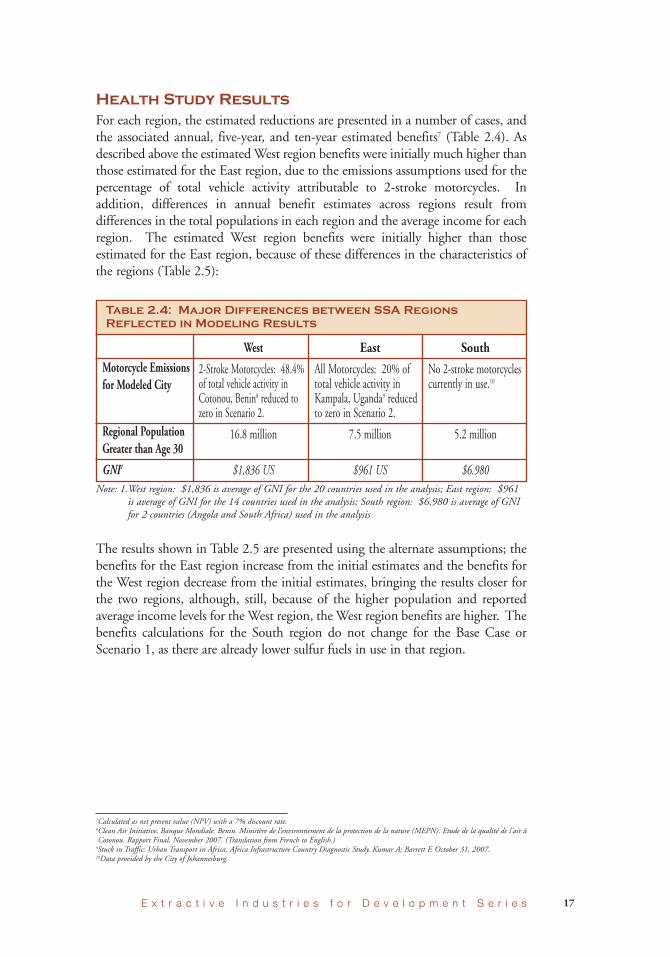
Health Study ResultsFor each region, the estimated reductions are presented in a number of cases, andthe associated annual, five-year, and ten-year estimated benefits7 (Table 2.4). Asdescribed above the estimatedWest region benefits were initially much higher thanthose estimated for the East region, due to the emissions assumptions used for thepercentage of total vehicle activity attributable to 2-stroke motorcycles. Inaddition, differences in annual benefit estimates across regions result fromdifferences in the total populations in each region and the average income for eachregion. The estimated West region benefits were initially higher than thoseestimated for the East region, because of these differences in the characteristics ofthe regions (Table 2.5):
The results shown in Table 2.5 are presented using the alternate assumptions; thebenefits for the East region increase from the initial estimates and the benefits forthe West region decrease from the initial estimates, bringing the results closer forthe two regions, although, still, because of the higher population and reportedaverage income levels for theWest region, theWest region benefits are higher. Thebenefits calculations for the South region do not change for the Base Case orScenario 1, as there are already lower sulfur fuels in use in that region.
7Calculated as net present value (NPV) with a 7% discount rate.8Clean Air Initiative, Banque Mondiale. Benin. Ministère de l’environnement de la protection de la nature (MEPN). Etude de la qualité de l’air àCotonou. Rapport Final, November 2007. (Translation from French to English.)9Stuck in Traffic: Urban Transport in Africa. Africa Infrastructure Country Diagnostic Study. Kumar A; Barrett F. October 31, 2007.10Data provided by the City of Johannesburg.
Motorcycle Emissionsfor Modeled City
Regional PopulationGreater than Age 30
GNI1
West
2-Stroke Motorcycles: 48.4%of total vehicle activity inCotonou, Benin8 reduced tozero in Scenario 2.
16.8 million
$1,836 US
East
All Motorcycles: 20% oftotal vehicle activity inKampala, Uganda9 reducedto zero in Scenario 2.
7.5 million
$961 US
South
No 2-stroke motorcyclescurrently in use.10
5.2 million
$6.980
Table 2.4: Major Differences between SSA RegionsReflected in Modeling Results
Note: 1.West region: $1,836 is average of GNI for the 20 countries used in the analysis; East region: $961is average of GNI for the 14 countries used in the analysis; South region: $6,980 is average of GNIfor 2 countries (Angola and South Africa) used in the analysis

18 S u b - S a h a r a n A f r i c a R e f i n e r y P r o j e c t
The dollar values presented represent the middle estimate of a range from lowestimated values (using an income elasticity of 2.0) to high estimated values (usingan elasticity of 1.0). The range of estimates is shown in the study report.
The estimated 10-year benefits of reduced sulfur fuels modeled in Scenario 2 forall of SSA (about $43 billion) are similar to the benefits shown in other regionalstudies. For example, the benefits of reducing health impacts in China, includingtotal mortality and chronic bronchitis, modeled for the years 2008-2030, areabout $45 billion (in 2005 US dollars) for total mortality and $10 billion (in2005 US dollars) for chronic bronchitis.11 A similar study conducted in Mexicopredicted benefits of about $40 billion (in 2000 US dollars) modeled for the years2006-203012.
The decrease in cancer risk due to potential reductions in the exposures to benzeneis low in both Johannesburg and in Kampala (less than 150 cases). The larger
11The International Council on Clean Transportation (ICCT), 2006. Costs and Benefits of Reduced Sulfur Fuels in China. Cited in presentationby Ray Minjares of ICCT, Costs and Benefits of Lower Sulfur Fuels; Implications for Eastern Africa, Eastern Africa Sub-Regional Workshop onBetter Air Quality in Cities, Nairobi, Kenya, 21-22 Oct 2008.
12Estudio de Evaluación Socioeconómica del Proyecto Integral de Combustibles, Instituto Naciónal de Ecología. 2006. Cited in presentation by RayMinjares of ICCT, Costs and Benefits of Lower Sulfur Fuels; Implications for Eastern Africa, Eastern Africa Sub-Regional Workshop on Better AirQuality in Cities, Nairobi, Kenya, 21-22 Oct 2008.
- Numberof Cases of:
East Region
Base CaseScenario 1Scenario 2
-All-CauseMortality -Reductionsin PM2.5
(ages>30)
541,823532,449506,516
West Region
Base CaseScenario 1Scenario 2
1,325,8801,316,4891,249,046
7,387,3997,334,6976,952,170
7,464,9777,462,0417,444,698
69,14069,00668,238
--$640 M$4,500 M
--$2.6 B$18 B
--$4.5 B$32 B
BronchitisCases -
Reductionsin PM2.5
(ages>30)
2,293,2812,247,0422,118,796
AsthmaExacerba-tions- Reductions in
PM10
(ages 8-13)
3,183,8713,179,6403,167,322
RespiratoryDiseaseMortality -Reductions inPM10 (ages<5)
3,183,8713,179,6403,167,322
Estimated TotalAnnual Benefit(million 2007US dollars)
--$340 M$1,300 M
EstimatedFive-Year
(NPV) Benefit(billion 2007US dollars)
--$1.4 B$5.3 B
Estimated Ten-Year (NPV)
Benefit (billion2007 USdollars)
--$2.4 B$9.0 B
Table 2.5: Health Study Regional Results Using Alternate 2-Stroke Motorcycle Assumptions
South Region
Base CaseScenario 1Scenario 2
3,6363,6363,261
108,256108,256107,576
799,209799,209796,852
970970948
--$0 M$252 M
--$0 B$1.0 B
--$0 B$1.8 B
Notes: Using the air model results for >1,000 population density with each city, extrapolated to the region.1. Applying country-specific VSL or VSC, elasticity of 1.5, and GNI using PPP.2. Net present values calculated with 7% discount rate.
19E x t r a c t i v e I n d u s t r i e s f o r D e v e l o p m e n t S e r i e s
GASOLINERON, min*MON, minLead content**Sulfur content, % mass, maxBenzene content, % vol, max
DIESELSulfur content, % mass, maxDensity at 15 C, kg/litre (min/max)Cetane index (calculated), minLubricity (HFRR @ 60 C), micron, min
AFRI-1
9181
Unleaded0.1
To be reported
0.8800/89042
To be reported
AFRI-2
9181
Unleaded0.05
To be reported
0.35800/89045
To be reported
AFRI-3
9181
Unleaded0.035
0.05800/89045460
AFRI-4
9181
Unleaded0.0151
0.005820/88045460
Table 3.1: AFRI Standards for Sub-Saharan AfricaTransportation Fuels
*A higher grade of gasoline may be marketed if required** “Unleaded means <0.013g of lead per litre
11The International Council on Clean Transportation (ICCT), 2006. Costs and Benefits of Reduced Sulfur Fuels in China. Cited in presentationby Ray Minjares of ICCT, Costs and Benefits of Lower Sulfur Fuels; Implications for Eastern Africa, Eastern Africa Sub-Regional Workshop onBetter Air Quality in Cities, Nairobi, Kenya, 21-22 Oct 2008.
12Estudio de Evaluación Socioeconómica del Proyecto Integral de Combustibles, Instituto Naciónal de Ecología. 2006. Cited in presentation by RayMinjares of ICCT, Costs and Benefits of Lower Sulfur Fuels; Implications for Eastern Africa, Eastern Africa Sub-Regional Workshop on Better AirQuality in Cities, Nairobi, Kenya, 21-22 Oct 2008.
reductions in benzene modeled for Cotonou result in a potential reduction incancer cases due to benzene exposure of up to 250 cases in Scenario 2. Becausethese reductions are small relative to the other benefits estimated, the reduction ofcancer risk due to benzene exposure is not included in the valuation or in theregional extrapolation.
3. Refinery Study OverviewOver the past two decades, the growing awareness of the role that emissions playin human health and environmental degradation had led to a general movementin many parts of the world to control emissions to reduce the impacts. Thismovement has mainly taken two forms: 1) the development and subsequentrequired use of control devices for stationary sources and vehicle sources and, 2)changes in the specifications of transportation fuels to reduce emissions of themajor pollutants. These trends originated in the industrialized countries and arenow spreading, at different rates, throughout the world.
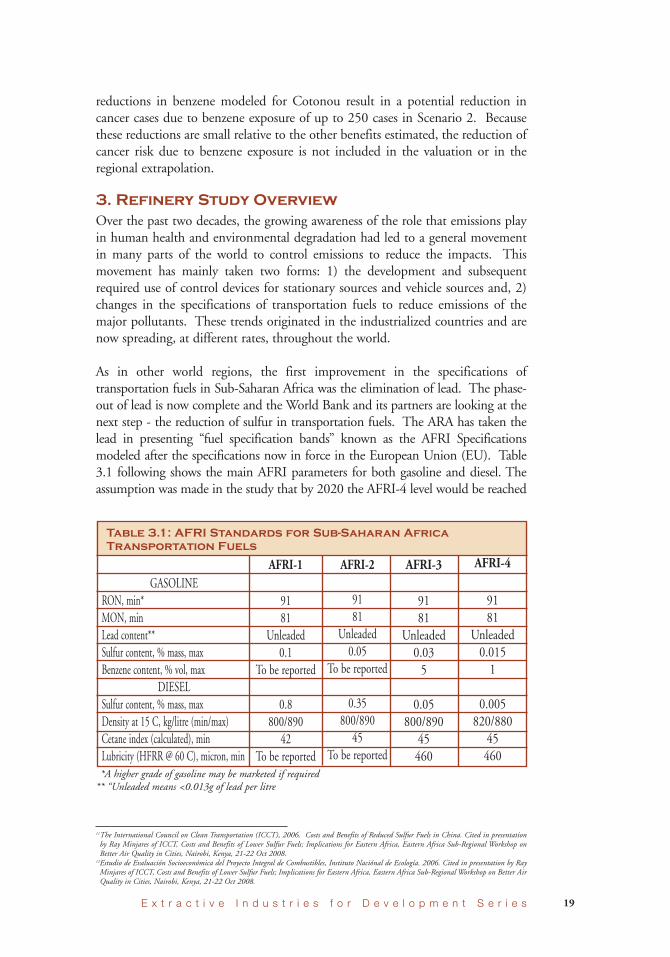
As in other world regions, the first improvement in the specifications oftransportation fuels in Sub-Saharan Africa was the elimination of lead. The phase-out of lead is now complete and the World Bank and its partners are looking at thenext step - the reduction of sulfur in transportation fuels. The ARA has taken thelead in presenting “fuel specification bands” known as the AFRI Specificationsmodeled after the specifications now in force in the European Union (EU). Table3.1 following shows the main AFRI parameters for both gasoline and diesel. Theassumption was made in the study that by 2020 the AFRI-4 level would be reached

20 S u b - S a h a r a n A f r i c a R e f i n e r y P r o j e c t
by all SSA refineries (sulfur content for gasoline 150 ppm, for diesel 50 ppm, andbenzene content for gasoline 1%).
The growing complexity of the vehicle emission control technologies for bothpersonal vehicles and commercial trucks and the concomitant need for clean fuels,in addition to the growing awareness of the human health and environmentalimpact of vehicle source emissions, have placed increasing requirements onrefineries. Sulfur is not an additive but a natural part of crude oil. Its removalprocesses presents both technological and economic challenges to refiners.However, by coming later than OECD regions to ultra-low sulfur fuels, SSArefineries are in a position to benefit from the operating experience and processimprovements obtained elsewhere in the refining industry.
Refinery Study MethodologyThe methodology used by ICF and its subcontractor EnSys Energy, centeredaround the use of a global refining modelWORLD®, which allowed us to not onlycalculate the impacts of stricter fuel specifications on the SSA refiners but also setthem in the context of the global refining and downstream system.
With agreement from the Steering Committee, ICF/EnSys modeled refiningactivities and investment costs for the global refining sector with horizons of 2010,2015, and 2020. Modeling 2010 (Base Case) enabled calibration againstconditions close to those of 2009. Stepping the model forward to 2015 and then2020 captures the evolution of product demand and mix in the regions and theadvance to AFRI-4 specifications in each refinery subgroup, with the attendantcosts and impacts.
In order to model the various cases that were developed the following data had tobe generated:
• Annual demand for petroleum products for every SSA country out to 2020,as well as supply
• Base Year configuration of each SSA refinery with information ontechnologies used, capacities and the type of crude oil and other feedstocksused
• Expansion projects and other refinery assumptions• Delineation of the cases for 2015 and 2020
Demand ProjectionsEnergy demand within an individual country is largely a function of grossdomestic product (GDP), population, and the energy intensity/efficiency of theoverall economy and specific sectors within the economy. Demand is alsoimpacted by Government policies that influence the exploitation of domesticnatural resources, control imports and/or exports, affect prices in country, andimpact the efficiency of energy end-use technologies. Further impact comes from

21E x t r a c t i v e I n d u s t r i e s f o r D e v e l o p m e n t S e r i e s
the state of the domestic infrastructure and the percentage of GDP derived fromthe export of raw commodities13. Using prices to estimate demand is complicated.In an unfettered market, the market clearing price would determine the level ofdemand by consumers in the different economic sectors. While this may be themost rigorous approach to estimating demand, substantial amounts of data arerequired. There is also a good deal of dissension over the correct elasticities to use.Therefore, initially, ICF concluded that an accepted publicly available projectionwould be the best approach.
ICF has been unable to find publicly available substantive projections of energydemand by country in SSA. In the various projections, such as those from OPEC,one can find Angola and Nigeria, the major oil producers identified. Otherprojections will identify South Africa, usually broken out because of the size of itsGDP. ICF was unable to find a projection that addressed the major countries inSSA, let alone the smaller countries.
A further complication is that very few countries in SSA, with the exception ofSouth Africa, have a mixed industrial economy - which works best with thenormal analytical approach. Many of the SSA countries have very rapidlygrowing GDPs driven largely by resource exports during a period when globalcommodity prices were at an all-time high and this does not translate directly intopetroleum demand.
ICF has therefore developed its own methodology to project petroleum demandby country out through 2020. Total projected petroleum demand for Africa wasbased on the projections from the Energy Information Administration tied to theprice projection discussed above. North African demand was subtracted from thetotals. The primary source of data for the demand model is the CITAC AfricaLLP data base which provides total consumption from 2000 to 2007 for eightpetroleum products and the International Energy Agency’s Energy Balances whichprovides data from 1992 to 2007. The latter is used to extrapolate CITAC databack to 1992 and to fill in certain items missing from the CITAC database suchas refinery fuel use. Regressions were then run on the consumption time series togive the trends by product and by sector and to relate the trends to populationand GDP.
Given projected population and GDP from the World Bank, the United Nations,the IMF, and the U.S. Census Bureau, trends from the regressions can be thensuperimposed on the SSA total demand to give estimates of individual countrylevel demand. A further step was the discounting of the GDP effect in thosecountries whose GDP was driven largely by raw commodity exports rather than bydomestic goods and services.
SSA RefineriesWith the agreement of the Steering Committee three large demand regions were
13There are, of course, impacts from random events that cannot be modeled looking out to the future. These can include civil wars, and extremeclimate impacts among others.

22 S u b - S a h a r a n A f r i c a R e f i n e r y P r o j e c t
created for SSA: West, Southern, and East. These regions reflected the logistics ofpetroleum product supply to meet demand within SSA. Then, within these threeregions, nine refinery supply sub-regions were created. These nine sub-regionsvaried from individual refineries, e.g., Cameroon, to groups of refineries, e.g., all theNigerian refineries. The world outside SSA was formulated in WORLD® as 20demand regions containing a total of 23 refining groups. Explicit refining groupswere incorporated for Yanbu, Saudi Arabia and for Reliance/Essar in western India.This formulation allowed the modeling to represent the global context, the SSAcontext, the 3-region context, and the sub-regional context.
The groupings used in the model for SSA are shown in the table and map of Figure3.1 below.
Source: CITAC Africa LLP
SGI Senegal, Ghana and Cóte d'lvoireCAM Cameroon
NIG Nigeria
COG Congo and GabonANG Angola
SAF South Africa
ZAM ZambiaKEN KenyaSUD Sudan
Figure 3.1: Sub-Saharan Africa Refinery RegionalGroupings
23E x t r a c t i v e I n d u s t r i e s f o r D e v e l o p m e n t S e r i e s
Refining AssumptionsOne goal of the modeling was to assess the investment requirements facing theindividual SSA refineries if they are to move along the AFRI standards. Itbecame clear during the Kick Off meeting that, at least as far as gasoline anddiesel are concerned, there are three sets of specifications: “Officialspecifications” (maximum specifications allowed by the government); and“import specifications”. In countries without refineries import specificationsmay be the same as official specifications, but in other countries with refineriesgovernments may specify/allow a different specification with a view to blendingwith local production.
There is a vast difference between the official specifications and the estimatedactual qualities, particularly for gasoline. Knowledge of the actual qualities iscritical for the modeling. If, in fact, SSA refineries are already making, forexample, gasoline at the AFRI-3 level, that changes the whole investmentpicture. Thus, although it was initially thought costs would be based on movingfrom mainly AFRI-1 to AFRI-4, based on the current specifications identified,the costs are more likely related to moving from AFRI-2 and -3 to AFRI-4.
The advance of regional specifications, demand and supply, as well as theinfluences of broader global developments, impact the investments made in themodel in both existing refineries and for potential new refining centers. Withinexisting refineries, the investments potentially range from the relativelyinexpensive, such as revamp or debottlenecking of existing units, to high costinvestment decisions such as large expansions or installation of a majorsecondary unit such as a hydrocracker. Wholly new refining capacity can rangefrom a new moderate scale local refinery to large and complex new refiningcenters. Stepping forward to 2015 and then 2020, with associated productquality, demand, and related developments, enables ICF/EnSys and the ARASteering Committee to examine the economics of the different refinerysubgroups and to clarify whether or not they can make the investments necessaryto meet advancing fuel specifications and still remain profitable and competitiveon the world market.
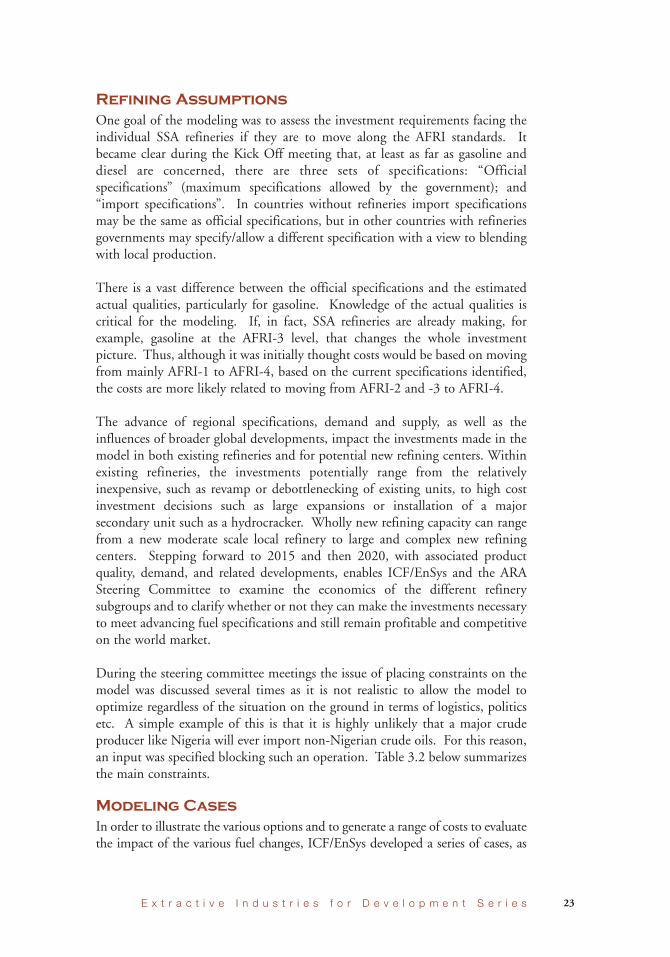
During the steering committee meetings the issue of placing constraints on themodel was discussed several times as it is not realistic to allow the model tooptimize regardless of the situation on the ground in terms of logistics, politicsetc. A simple example of this is that it is highly unlikely that a major crudeproducer like Nigeria will ever import non-Nigerian crude oils. For this reason,an input was specified blocking such an operation. Table 3.2 below summarizesthe main constraints.
Modeling CasesIn order to illustrate the various options and to generate a range of costs to evaluatethe impact of the various fuel changes, ICF/EnSys developed a series of cases, as
24 S u b - S a h a r a n A f r i c a R e f i n e r y P r o j e c t
Activity
Refinery capacity
Refinery projects
Refinery activity
New refinerycapacity
Process units
Crude oil slates
Trade
Infrastructure
Constraint
Capacities established for 2008 are used in the study. The model adds someexpansion through revamping and debottlenecking allowed for 2010 andmajor new investments in later cases.
Following the model protocol, only new projects that are under constructionwere allowed, with the exception of the assumed Ugandan refinery (seebelow). None of the planned projects in SSA refineries were added to theSSA database. Where economic the model adds capacity in the future cases
Base Case operating rates are based on the 2007 operating rates. For theConstrained Cases all existing refineries continue to operate at Base Caseefficiencies. For the OpenMarket Cases an upper cap has been placed on thethroughput at Nigerian refineries. Nigerian refineries were capped at 43 %as their average 7-year utilization between 2001 and 2007 was 32% with thehighest level being 47% in 2001. A lower floor of 29% was placed on theIndeni refinery in Zambia
Africa East: a new 50 mb/d refinery is entered for all 2015 and 2020 cases.(This was set to run emerging Uganda crude oil.)Africa West: a cap of 200 mb/d is imposed in all 2015 and 2020 cases toreflect the financing limits expected to prevail
In Nigeria it was assumed that the alkylation units would not run at any time
In the 2020 Constrained Cases SSA refineries are required to use the samecrude oil slates as in the Base Case. In the Open Market Cases someconstraints were imposed such as limiting Nigerian and Angolan refineries tothe use of their indigenous crude oils only.
In all cases the export of high sulfur distillate is not allowed. Trade in mostintermediate products is constrained particularly where storage capacitieswould not allow the export/import of economic cargo sizes. Exports ofbenzene are allowed but imports are constrained. Imports of MTBE areconstrained but some imports of ethanol are allowed.
The costs of adding infrastructure capacity at ports and in the consumerdistribution system (required for increased imports) were not included in themodel: incremental capacity and costs for all refinery offsites was included.
Table 3.2: WORLD® Model Constraints
shown in Table 3.3. This allowed the examination of a number of possible policyoptions, in particular, what would happen to SSA refineries and costs in an openmarket in which they were fully exposed to global competition versus what wouldhappen if all existing SSA refineries were protected (the constrained case). Fromthese cases, ICF/EnSys was able to identify the incremental costs of moving to theAFRI-4 standards, and to distinguish these costs from the costs of investmentdriven by normal organic growth. Further, the cost differentials between the openmarket cases and the constrained cases were identified.

25E x t r a c t i v e I n d u s t r i e s f o r D e v e l o p m e n t S e r i e s
Case Description
2010 Base Case
2015 Open MarketCase. SSA Refineriesin open competition
2015 Open MarketCase. SSA Refineriesin open competition
2020 Base Case: SSARefineries keptrunning:
2020 Base Case – SSARefineries keptrunning:
2020 Open MarketCase: SSA Refineriesin open competition:
2020 Open MarketCase: SSA Refineriesin open competition:
2020 Open MarketCase: SSA Refineriesin open competition:
Case No.
210
215
216
224
220
221
222
223
2010
X
2015
X
X
EconomicConditionsin SSA
Unfavorable
Unfavorable
Favorable
Favorable
Favorable
Favorable
Unfavorable
2015/2020AFRI-Current
X
X
X
X
2015/2020AFRI-4
X
X
X
X
Table 3.3: Modeling Case Descriptions
Data UncertaintiesThere are considerable uncertainties associated with the demand data which is oneof the main drivers in the model. While the methodology is analytically reasonable,
there may be countries in SSA that are at a threshold for economic takeoff and thismethodology would not indicate this. In addition, there is the issue of “pent up”demand. If consumers in a specific country are faced with government regulationsthat limit the availability of certain products they may consume less than they wish.Likewise if the infrastructure of a country is poor enough to impede distributionconsumers will consume less than they demand. If, at some point in the future, theimpediment to demand is lifted, whether by revising government regulations or byimproving the distribution infrastructure, there may be a surge in actualconsumption as demands are met. This will have to be evaluated by expert

26 S u b - S a h a r a n A f r i c a R e f i n e r y P r o j e c t
Case Year AFRIStandards
FAVORABLE CASES –CONSTRAINED
210 2010 Current
FAVORABLE CASES – OPENMARKET
215 2015 Current
216 2015 AFRI-4
221 2020 Current
222 2020 AFRI-4
UNFAVORABLE CASE –OPENMARKET
223 2020 AFRI-4
Table 3.4: Refinery Throughputs of Regional Groupings inthe Various Cases
SGI
85%
85%
62%
85%
85%
49%
CAM
91%
91%
83%
91%
91%
55%
NIG1
39%
39%
39%
43%
43%
43%
COG
75%
0%
0%
49%
0%
0%
ANG
70%
7%
5%
36%
26%
17%
SAF
90%
90%
86%
90%
90%
90%
ZAM1
31%
34%
29%
31%
29%
29%
KEN
37%
12%
0%
7%
0%
0%
SUD
85%
85%
85%
85%
86%
85%
REFINERY GROUPINGS
judgment. The complications of the demand estimates are fully discussed inAppendix A in Volume II-B, the Refinery Study Appendices.
Apart from the specific problems in generating demand projections, this study wasfaced with the overarching problem of the global recession. Since this was a“moving target”, the ICF (with the concurrence of the World Bank), took theapproach of deciding on a projection that was lower than historic trend indicated.These cases are the ones indicated in the report as having economic conditionsfavorable to SSA. However, to deal with the continuing fall in demand analternative case was constructed with even lower demand; these cases were labeledas unfavorable. In these latter cases, the average annual regional economic growthoriginally projected in the base case as 4% was scaled down to 2% per year. To someextent these levels are arbitrary. However, all international forecasts indicate theconsensus belief that the developing nations will recover in a more timely fashionthan the developed world and will then proceed to start growing again.
Refinery Study ResultsThe model runs using the constraints listed in Table 3.2 above resulted in refinerythroughputs as a percentage of nameplate capacity as follows:
It can be seen that the refineries in the SGI (Senegal, Côte d’Ivoire, and Ghana),Cameroon, South Africa and Sudan operate at high levels in most cases. Nigeria hasbeen capped at the typical throughput rate achieved in recent years (2001/07average =32%) and Zambia has a floor of 29%. But in most cases for the smallrefineries with little or no upgrading and limited local demand the model forecastslow or zero throughput.
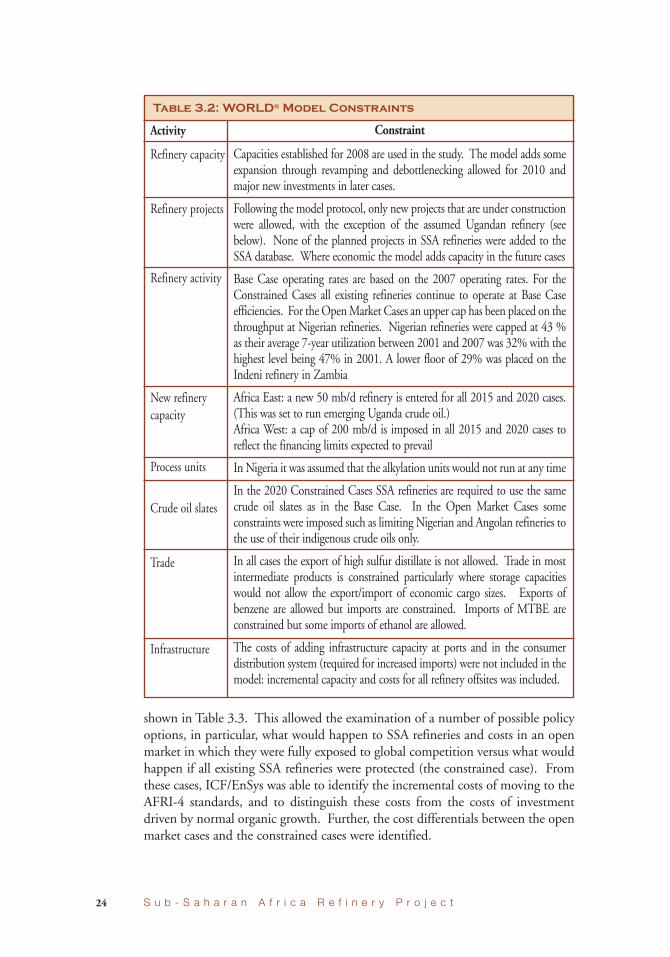
Table 3.5 summarizes the total investment costs for the various cases facing the SSArefining sector tomeet both normal growing demand and the requirement of movingup the AFRI scale to AFRI-4 fuel specifications. Table 3.6 separates out theinvestment costs of moving to AFRI-4 specifications compared to the current AFRIspecifications. This table also shows the incremental cost of moving to AFRI-4 in aconstrained versus an open market and the incremental difference in moving toAFRI-4 for a favorable economic situation versus an unfavorable situation.
The modeling undertaken in this study examined the incremental costs of SSArefineries moving to AFRI-4 standards only. We are aware that the target in SouthAfrica was EUROIV and EUROV. The specifications of these standards are morestringent than those in AFRI-4. Thus the costs that were generated for SouthAfrican refineries, based on AFRI-4, substantially underestimate the costs whenapplied to the two EURO standards.
ThisTable shows that the incremental cost for moving to AFRI-4 in the constrainedcase is approximately $1.02 billion more than in the open market case
The refinery cost impacts depend in part on the SSA region, and are a functionof the:
27E x t r a c t i v e I n d u s t r i e s f o r D e v e l o p m e n t S e r i e s
Case
210
215
216
224
220
221
222
223
Description
Base
Open Market
Open Market
Constrained
Constrained
Open Market
Open Market
Open MarketUnfavorable
Year
2010
2015
2015
2020
2020
2020
2020
2020
AFRISpecificationsCurrent
Current
AFRI-4
Current
AFRI-4
Current
AFRI-4
AFRI-4
SSATotal0.06
1.89
3.14
5.40
8.67
5.32
7.65
6.19
WestTotal0.01
0.02
0.47
3.19
5.31
3.07
4.51
2.98
SouthTotal0.05
0.28
0.54
0.60
1.00
0.59
0.90
0.64
EastTotal-
1.60
2.13
1.61
2.36
1.66
2.25
2.56
Table 3.5: Total Refinery Investments from the Eight Cases(Billions of 2007$)
Year
2015
2020
2020
2020
2020
Description
Open Market
Constrained
Open Market
Constrained vs. Open Market
Open Market Favorable vs. Unfavorable
SSATotal1.25
3.27
2.33
1.02
1.46
WestTotal0.45
2.12
1.44
0.80
1.53
SouthTotal0.26
0.40
0.31
0.10
0.26
EastTotal0.53
0.75
0.59
0.11
(0.69)
Table 3.6: Incremental Costs to Move to AFRI-4 FuelSpecifications (Billions of 2007$)
28 S u b - S a h a r a n A f r i c a R e f i n e r y P r o j e c t
• Standards of the transportation fuels already being made• Technology already installed, particularly FCC and desulfurization capacity• Types of crude oil being used, for example, West Africa, in general, has goodquality sweet crude oil, compared to the imported sourMiddle Eastern crudeoil used in South and East Africa
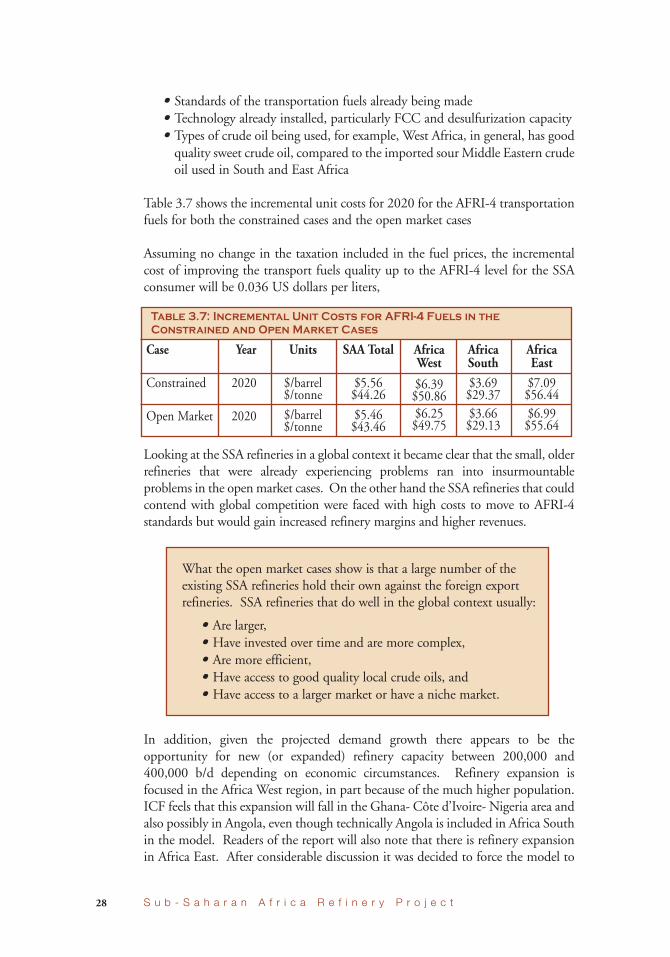
Table 3.7 shows the incremental unit costs for 2020 for the AFRI-4 transportationfuels for both the constrained cases and the open market cases
Assuming no change in the taxation included in the fuel prices, the incrementalcost of improving the transport fuels quality up to the AFRI-4 level for the SSAconsumer will be 0.036 US dollars per liters,
Looking at the SSA refineries in a global context it became clear that the small, olderrefineries that were already experiencing problems ran into insurmountableproblems in the openmarket cases. On the other hand the SSA refineries that couldcontend with global competition were faced with high costs to move to AFRI-4standards but would gain increased refinery margins and higher revenues.
In addition, given the projected demand growth there appears to be theopportunity for new (or expanded) refinery capacity between 200,000 and400,000 b/d depending on economic circumstances. Refinery expansion isfocused in the Africa West region, in part because of the much higher population.ICF feels that this expansion will fall in the Ghana- Côte d’Ivoire- Nigeria area andalso possibly in Angola, even though technically Angola is included in Africa Southin the model. Readers of the report will also note that there is refinery expansionin Africa East. After considerable discussion it was decided to force the model to
Case
Constrained
Open Market
Year
2020
2020
Units
$/barrel$/tonne
$/barrel$/tonne
SAA Total
$5.56$44.26
$5.46$43.46
AfricaWest
$6.39$50.86$6.25$49.75
AfricaSouth$3.69$29.37$3.66$29.13
AfricaEast$7.09$56.44$6.99$55.64
Table 3.7: Incremental Unit Costs for AFRI-4 Fuels in theConstrained and Open Market Cases
What the open market cases show is that a large number of theexisting SSA refineries hold their own against the foreign exportrefineries. SSA refineries that do well in the global context usually:
• Are larger,• Have invested over time and are more complex,• Are more efficient,• Have access to good quality local crude oils, and• Have access to a larger market or have a niche market.
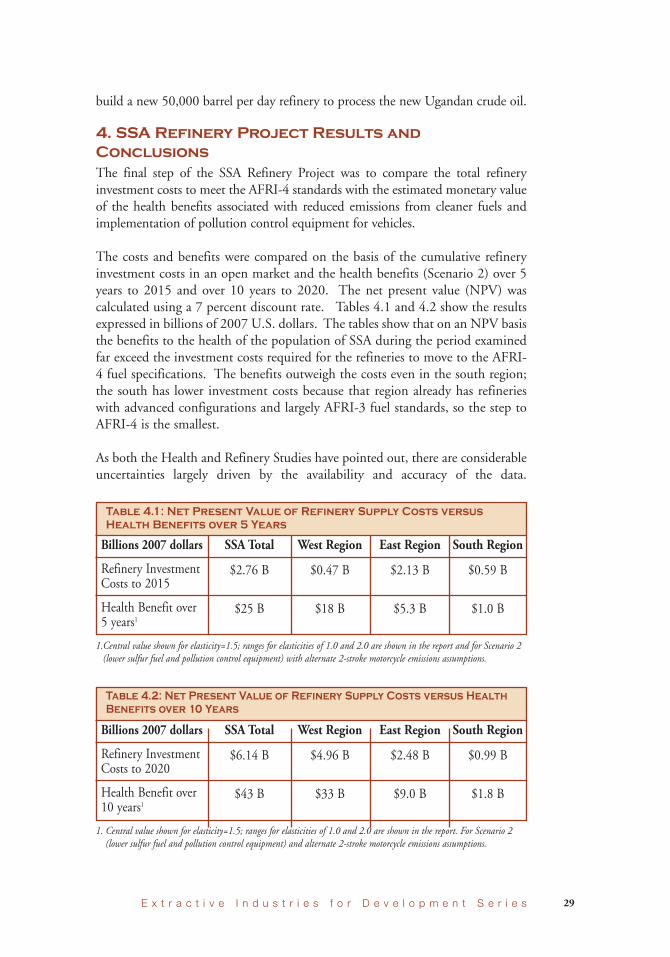
29E x t r a c t i v e I n d u s t r i e s f o r D e v e l o p m e n t S e r i e s
Billions 2007 dollars
Refinery InvestmentCosts to 2015
Health Benefit over5 years1
SSA Total
$2.76 B
$25 B
West Region
$0.47 B
$18 B
East Region
$2.13 B
$5.3 B
South Region
$0.59 B
$1.0 B
Table 4.1: Net Present Value of Refinery Supply Costs versusHealth Benefits over 5 Years
1.Central value shown for elasticity=1.5; ranges for elasticities of 1.0 and 2.0 are shown in the report and for Scenario 2(lower sulfur fuel and pollution control equipment) with alternate 2-stroke motorcycle emissions assumptions.
build a new 50,000 barrel per day refinery to process the new Ugandan crude oil.
4. SSA Refinery Project Results andConclusionsThe final step of the SSA Refinery Project was to compare the total refineryinvestment costs to meet the AFRI-4 standards with the estimated monetary valueof the health benefits associated with reduced emissions from cleaner fuels andimplementation of pollution control equipment for vehicles.
The costs and benefits were compared on the basis of the cumulative refineryinvestment costs in an open market and the health benefits (Scenario 2) over 5years to 2015 and over 10 years to 2020. The net present value (NPV) wascalculated using a 7 percent discount rate. Tables 4.1 and 4.2 show the resultsexpressed in billions of 2007 U.S. dollars. The tables show that on an NPV basisthe benefits to the health of the population of SSA during the period examinedfar exceed the investment costs required for the refineries to move to the AFRI-4 fuel specifications. The benefits outweigh the costs even in the south region;the south has lower investment costs because that region already has refinerieswith advanced configurations and largely AFRI-3 fuel standards, so the step toAFRI-4 is the smallest.
As both the Health and Refinery Studies have pointed out, there are considerableuncertainties largely driven by the availability and accuracy of the data.
Billions 2007 dollars
Refinery InvestmentCosts to 2020
Health Benefit over10 years1
SSA Total
$6.14 B
$43 B
West Region
$4.96 B
$33 B
East Region
$2.48 B
$9.0 B
South Region
$0.99 B
$1.8 B
Table 4.2: Net Present Value of Refinery Supply Costs versus HealthBenefits over 10 Years
1. Central value shown for elasticity=1.5; ranges for elasticities of 1.0 and 2.0 are shown in the report. For Scenario 2(lower sulfur fuel and pollution control equipment) and alternate 2-stroke motorcycle emissions assumptions.

30 S u b - S a h a r a n A f r i c a R e f i n e r y P r o j e c t
Nevertheless, these studies provide a methodology for assessing the costs andbenefits of improving the quality of transportation fuels in SSA. Although thesestudies looked out only to 2020, all indications are that SSA will continue to growand that growth is likely to be accompanied by further urbanization and vehicleuse. In addition, future changes in SSA will likely affect results of modeled airemission. For example, although in some cases air pollution was dominated bydomestic emissions and road dust, in the future these sources may be reducedwith increased modernization, leaving vehicle pollution as the predominantsource of air pollution.
The Health Study results indicate that there is a potential for significant healthbenefits in Sub-Saharan Africa’s urban areas associated with the use of improvedfuels, and the Refinery Study provides evidence that:
The combined results of the Health Study and the Refinery Study have shown thatthe estimates of the potential for health benefits outweigh the costs of improvingfuel quality over time in SSA. These studies provide one line of evidence for thedecisions to be made by Sub-Saharan African policy makers on whether to moveforward with the manufacture of improved fuels.
Drawing on the conclusions of both studies ICF believes that policy makers in theSSA region should consider the following recommendations.
• SSA refineries are already halfway up the AFRI standards,mitigating the size of the required future investments, and
• Many of the SSA refineries are capable of functioning in thelarger context of the global market.

31E x t r a c t i v e I n d u s t r i e s f o r D e v e l o p m e n t S e r i e s
• Governments should instigate a sustained effort to update official fuelspecifications to reflect current refineries’ actual production.
• Governments should consider upgrading the official fuel specificationsin their country to AFRI-4 by 2015.
• SSA refineries that could economically produce transport fuels atAFRI-4 specifications should develop investment plans to meet a 2015deadline.
• In parallel, Governments should adopt and enforce regulatorymeasures to improve the vehicle fleets such as:- All imported gasoline powered cars must have functioning catalyticconverters- Establish an inspection and maintenance program- Encourage the phase out of old, highly polluting vehicles- Encourage the phase out or banning of 2-stroke engines
• To reduce the uncertainties confronted in this study Governments,International Agencies, and Technical experts should conductadditional research with respect to:- Data on emissions in major urban centers (including permanentinstallations for measuring pollution levels)- Examination of the appropriate methodology for estimating healthcosts and benefits in developing nations- Improvements of data on product demand
• The WORLD® model output indicates that major expansion will beneeded in existing refineries as well as new regional refineries in theAfrica West/Angola region. Lesser, but still positive growth is expectedin Africa East and refining investment will probably be tied toUgandan crude oil. More focused technical studies should concentrateon these regions.
• Open market policies should be expanded to allow refineries toimprove their revenue as they move to AFRI-4 standards.
• Policy makers need to decide the future of the mainlytopping/reforming refiners such as those in Senegal, Congo, Gabon,and Kenya. The study indicates the magnitude of the costs ofmodernizing and operating these refineries to meet the AFRI-4specifications.
THEWORLDBANKOIL, GAS, ANDMINING POLICY DIVISION
The World Bank Group's role in the oil, gas, and mining sectors focuses onensuring that its current interventions facilitate the extractive industries'contribution to poverty alleviation and economic growth through the promotion ofgood governance and sustainable development.
The Oil, Gas, and Mining Policy Division serves as the Bank's global sectormanagement unit on extractive industries and related issues for all the regions of theworld. It is part of the Oil, Gas, Mining, and Chemicals Department, a jointWorldBank/International Finance Corporation department.
Through loans/credits/grants, technical assistance, policy dialogue, and analyticalwork, the Division leads a work program with multiple activities in more than 70countries, of which almost half are in Sub-Saharan Africa. More specifically, theDivision:• Advises governments on legal, fiscal, and regulatory issues and on institutionalarrangements as they relate to natural resources, as well as on good governancepractices.• Assists governments in setting up environmental and social safeguards inprojects in order to promote the sustainable development of extractiveindustries.• Helps governments formulate policies that promote private sector growth andforeign direct and domestic private sector investments.• Advises governments on how to increase the access of the poor to cleancommercial energy and to assess options for protecting the poor from high fuelprices.
The Oil, Gas, and Mining Policy Division serves as a global technical advi-sor thatsupports sustainable development by building capacity and provid-ing extractiveindustry sector-related advisory services to resource-rich developing country gov-ernments. The Division also carries out an advocacy role through its man-agementof the following global programs:• The Extractive Industries Transparency Initiative (EITI) Multi-Donor TrustFund, which supports countries in implementing EITI programs.• The Global Gas Flaring Reduction (GGFR) Public-Private Partnership, whichbrings governments and oil companies together to reduce gas flaring.• The Communities and Small-Scale Mining (CASM) Partnership, whichpromotes an integrated approach to addressing issues faced by artisanal andsmall-scale miners.• The Gender and Extractive Industries Program, which addresses gender issuesin extractive industries.• The Petroleum Governance Initiative (PGI), which promotes petroleumgovernance frameworks, including linkages to environmental and communityissues.• The Extractive IndustriesTechnical Advisory Facility (EI-TAF), which facilitates"rapid-response" advisory services on a demand-driven basis to build capacityfor extractive industry resource policy frameworks and transactions.
Other publications in the ExtractiveIndustries for Development Series are:
Vulnerability to Oil Price Increases: A Decomposition Analysis of161 Countries by Robert Bacon and Masami Kojima
Changes in End-User Petroleum Product Prices: A Comparison of48 Countries by Masami Kojima
Extractive Industries Value Chain: A Comprehensive IntegratedApproach to Developing Extractive Industries by Eleodoro MayorgaAlba
Mining Cadastres: Promoting Transparent Access to MineralResources by Enrique Ortega, Alexandra Pugachevsky, andGotthard Walser,
Emerging Players in Global Mining by Dr. David Humphreys
Changing Patterns of Household Expenditures on Energy: A CaseStudy of Indonesia and Pakistan by Robert Bacon, SomaBhattacharya, and Masami Kojima
Financial Surety: Guidance Notes for the Implementation ofFinancial Surety for Mine Closure by Meredith Sassoon
Mining for Equity: Gender Dimensions of the Extractive Industries
Guidance Note for Task Team Leaders: Mainstreaming Genderinto Extractive Industries Projects
Government Response to Oil Price Volatility: Experience of 49Developing Countries by Masami Kojima
CO2 emissions; household energy use; and oil price transmission,Masami
#1
#2
#3
#4
#5
#6
#7
#8
#9
#10
#11

The World Bank1818 H Street, N.W.Washington, D.C. 20433USAwww.worldbank.org/ogmc (OR /oil OR /gas OR /mining)www.ifc.org/ogmc (OR /oil OR /gas OR /mining)