Sub-Saharan Oil and Gas October 2012 FAR Ltd
35
Sub-Saharan Oil and Gas October 2012 96 FAR Ltd (FAR) is a junior oil and gas company focused on offshore West and East Africa. In our view, its most valuable assets are its Senegalese, Kenyan and Guinea Bissau licences. Both Senegal and Kenya have been underexplored historically, and the main Senegalese prospects have large potential oil reservoirs in late Cretaceous fan systems. FAR entered both countries relatively early. It farmed into Kenya Block L6 in 2006 and its Senegalese licences in 2008 before the cost of these farm-ins took off. The planned drilling of wells in FAR’s Senegal licences and Kenyan Blocks L6 and L9 are likely to provide direct catalysts for the stock, but only in late 1H13/2H13, in our view. The drilling of APCL‘s Alhamdulillah Prospect, in Gambia, is likely to provide an indirect catalyst earlier (1Q13). In Kenya, Anadarko (operator of L7, L12, L11A and L11B), Afren (operator of L17 and L18) or BG (operator of L10A and L10B) may also provide catalysts. We believe FAR has enough cash for the next 12 months, assuming that it is able to farm out interests in its Kenyan L6 and Senegalese licences for carry on its well costs (it will likely benefit from substantial reimbursement of historic costs as part of any farm-out deal). It currently has A$33.7m in cash. We estimate that the current fair value of FAR’s share price is A¢7, which is roughly 2x higher than its A¢3.4 price on 19 October. In our ‗success‘ scenario we estimate that FAR‘s shares could be worth A¢49 by end-2013, while in our ‗failure‘ scenario we estimate they could be worth A¢1 over the same timeframe. FAR is trading on an EV/net risked 2P prospective resource multiple of just ~US$0.15/boe, a substantial discount to most of its peers. FAR Share Price (A¢), Fair Value & Scenario Outcomes Source: FactSet, Company data 0 5 10 15 20 25 30 35 40 45 50 Fair Value "Success" "Failure" 19 October 2012 FAR Ltd Speculative Buy FAR Cheaper than Most Others Stuart Amor +44 (0)20 3440 6826 [email protected] Price (A¢) 3.4 Fair Value (A¢) 7.3 Ticker FAR-AU Market cap (A$m) 87.5 Estimated cash (A$m) 34 Estimated debt (A$m) 0 Shares in issue Basic (m) 2,500 Fully diluted (m) 2,565 52-week High (A$) 0.06 Low (A$) 0.02 3m-avg daily vol (000) 15,372 3m-avg daily val (A$000) 684 Top shareholders (%) HSBC 9.0 JP Morgan 8.9 Citicorp 4.0 National Nominees 3.1 Oliver Lennox-King 3.0 Total 28.2 Management Nicholas Limb NEC Catherine Norman MD Charles Cavnes NED Ted Brindal NED Commodity Price Assumptions (Real) Oil (US$/bbl) 90 Africa Net-back Gas (US$/Mcf) 7.70 Valuation EV/Net Risked 2C + 2P Resources (US$/boe) 0.15
Transcript of Sub-Saharan Oil and Gas October 2012 FAR Ltd

Sub-Saharan Oil and Gas October 2012 96
FAR Ltd (FAR) is a junior oil and gas company focused on offshore West and East Africa. In our view, its most valuable assets
are its Senegalese, Kenyan and Guinea Bissau licences.
Both Senegal and Kenya have been underexplored historically,
and the main Senegalese prospects have large potential oil reservoirs in late Cretaceous fan systems. FAR entered both countries relatively early. It farmed into Kenya Block L6 in 2006 and its Senegalese licences in 2008 before the cost of these farm-ins took off.
The planned drilling of wells in FAR’s Senegal licences and Kenyan Blocks L6 and L9 are likely to provide direct catalysts for the stock, but only in late 1H13/2H13, in our view. The drilling of
APCL‘s Alhamdulillah Prospect, in Gambia, is likely to provide an indirect catalyst earlier (1Q13). In Kenya, Anadarko (operator of L7, L12, L11A and L11B), Afren (operator of L17 and L18) or BG (operator of L10A and L10B) may also provide catalysts.
We believe FAR has enough cash for the next 12 months,
assuming that it is able to farm out interests in its Kenyan L6 and Senegalese licences for carry on its well costs (it will likely benefit from substantial reimbursement of historic costs as part of any farm-out deal). It currently has A$33.7m in cash.
We estimate that the current fair value of FAR’s share price is A¢7, which is roughly 2x higher than its A¢3.4 price on 19 October. In our
‗success‘ scenario we estimate that FAR‘s shares could be worth A¢49 by end-2013, while in our ‗failure‘ scenario we estimate they could be worth A¢1 over the same timeframe. FAR is trading on an EV/net risked 2P prospective resource multiple of just ~US$0.15/boe, a substantial discount to most of its peers.
FAR Share Price (A¢), Fair Value & Scenario Outcomes
Source: FactSet, Company data
0
5
10
15
20
25
30
35
40
45
50
Fair Value
"Success"
"Failure"
19 October 2012 FAR Ltd Speculative Buy FAR Cheaper than Most Others
Stuart Amor +44 (0)20 3440 6826 [email protected]
Price (A¢) 3.4
Fair Value (A¢) 7.3
Ticker FAR-AU
Market cap (A$m) 87.5
Estimated cash (A$m) 34
Estimated debt (A$m) 0
Shares in issue
Basic (m) 2,500
Fully diluted (m) 2,565
52-week
High (A$) 0.06
Low (A$) 0.02
3m-avg daily vol (000) 15,372
3m-avg daily val (A$000) 684
Top shareholders (%)
HSBC 9.0
JP Morgan 8.9
Citicorp 4.0
National Nominees 3.1
Oliver Lennox-King 3.0
Total 28.2
Management
Nicholas Limb NEC
Catherine Norman MD
Charles Cavnes NED
Ted Brindal NED
Commodity Price Assumptions (Real)
Oil (US$/bbl) 90
Africa Net-back Gas (US$/Mcf) 7.70
Valuation
EV/Net Risked 2C + 2P Resources (US$/boe) 0.15

Sub-Saharan Oil and Gas October 2012 97
Table 34: FAR Ltd Licences
Licence Name
Working Interest/ (Paying
interest) Operator Main Other Partners
Gross Acreage
(km2)
Gross Unrisked Mean
Prospective Resources
Next Steps
Kenya
L6 (offshore) 60%/(60%) FAR Ltd Pancon (40%)
3,134 1,378MMboe (1)
Processing/analysing Kifaru 3D seismic with a view to a farm-out prior to drilling in mid-2013
L9 (offshore) 30%/(30%) Ophir (60%)
Avana (10%)
5,100 - Reprocess historic data. Shoot 3D seismic
Senegal
Rufisque, Sangomar and Sangomar Deep (offshore)
90%/(100%) FAR Ltd Petrosen (10%)
7,490 1,580MMbbl Oil (2)
Farm-out to a drill partner. Well to be
drilled before February 2014
Guinea Bissau
Blocks 2, 4A and 5A
15.00%/ (21.43%)
Svenska Petroleum
(55%)
Petroguin (30%)
5,832 141MMbbl Oil (3)
An appraisal well for the Sinapa discovery is
planned for 2Q13
AGC
AGC Profond 8.8%/(10.0%) Ophir (79.2%)
L'Ent AGC (12.0%),
9,838 229MMbbl Oil (4)
Review Kora-1 well data. Working up new
prospects
Australia
WA-457-P and WA-458-P (Carnarvon Basin)
100%/(100%) FAR Ltd - 566 - FAR is looking to shoot 3D seismic in 2013
EP 104 & R1 (Canning Basin)
8%/(8%) Buru Energy (38.9%)
Emerald Gas (12.8%) Key Petr. (14.8%), Pancon (10.0%),
Phoenix Res (10.0%) Indigo Oil (5.5%)
736 - Assessing exploration options after Stokes Bay-1 well recovered saline from its target
L15 (Canning Basin)
12%/(12%) Buru Energy (19%)
Key Petr (49%), Pancon (12%), Indigo Oil (8%)
163 - Considering well workover of West Kora-
1 well
Jamaica
Walton Basin 6, 7, 10, 11 and 12
50%/(50%) Finder Exploration
(50%)
- 14,329 - FAR seeking a farm-in partner
Notes: (1) Unrisked prospective mean resources (MMboe), based on 70% gas/30% oil, as per CPR (RISC October 2010); (2) Unrisked prospective P50 resources (MMstb), as per management estimates. Excludes any extension of Alhamdulillah prospect to be drilled by African Petroleum in adjacent block; (3) Unrisked prospective & contingent P50 resources (MMbbl), as per CPR (Senergy November 2011). Includes 20MMbbl of P50 contingent resources for Sinapa discovery; (4) Unrisked prospective P50 resources (MMstb), as per CPR completed pre-drilling of Kora-1 well (RPS June 2011). Excludes Kora Prospect resources after Kora-1 well was dry;
Investment Case
FAR Limited‘s (FAR) share price has generally followed the fortunes of Pancon‘s this year. Although it had no direct interest in Kenyan Block L8, its shares initially rose and then were hurt by disappointment that the Mbawa-1 well did not find oil, and by the confusion surrounding the announcements about what the well did discover.
Should exploration drilling of APCL‘s Alhamdulillah Prospect in neighbouring Gambia prove the key elements of a working hydrocarbon system in the basin, FAR should benefit because this will de-risk its Senegalese prospects. Should the well make a discovery, FAR will directly benefit because some of the prospect overlaps into FAR‘s acreage. APCL is likely to drill Alhamdulillah in 1Q13.

Sub-Saharan Oil and Gas October 2012 98
Also, should positive (>1Tcf of gas) volumetric details be released about the ‗non-commercial‘ Mbawa gas discovery, we would expect the market to reassess the potential of FAR‘s offshore Kenyan acreage. Anadarko (operator L7, L12, L11A and L11B), Afren (operator L17 and L18) or BG (operator L10A and L10B) may also provide catalysts for this reassessment should they drill wells in their blocks as planned in 2013. The planned drilling of FAR‘s well in Senegal and Kenyan Blocks L6 and L9 are likely to provide more direct catalysts, but only in late 1H13/2H13, in our view.
FAR‘s main assets are its interests in three Senegalese offshore licences and four offshore Kenyan licences. Both Senegal and Kenya have been under-explored historically, and the main Senegalese prospects have large potential oil reservoirs in late Cretaceous fan systems. FAR entered both countries relatively early. It farmed into Kenya Block L6 in 2006 and its Senegalese licences in 2008, before the cost of these farm-ins took off. In Senegal it inherited a large interest in the licence when Hunt Oil exited in the middle of the financial crisis. In both Senegal and Kenya, we believe that FAR will farm down some of its interest in its licences for carry on the first well.
We believe FAR has enough cash for the next 12 months, assuming that it is able to farm out interests in its Kenyan and Senegalese licences for carry on its well costs (it will likely benefit from substantial reimbursement of historic costs as part of any farm-out deal — we estimate ~US$17m if both farm-outs occur on the terms we assume in our calculation of current fair value). Cash at the end of June 2012 was A$33.7m, with the company having raised A$15m in 2Q12. We estimate that cash outgoings from June 2012 to December 2013 will be ~A$33m (L6 — A$9m on Kifaru 3D seismic, Guinea Bissau — A$12m on two wells, Australia — A$5m on 3D seismic, A$7m on general & administration).
We believe, along with FAR management, that offshore Kenya is much more oil-prone than offshore Tanzania and Mozambique. Management points to oil seeps/slicks in the region and proprietary work by its geologists on the inferred maturation profiles of likely source rocks. Nonetheless, the Mbawa-1 well discovered a ‗non-commercial‘ gas column and this is bound to shift the risking of prospects towards gas from oil. An independent assessment (RISC September 2010) of Block L6 used a 70% gas, 30% oil mix to estimate the gross unrisked prospective resources of the block. We believe this is a sensible mix to use and have modelled this in our valuation. However, as oil is more valuable than gas, companies will target prospects that are more likely to yield oil, skewing the proportion of any announced discoveries back towards oil. As Ophir has shown, gas discoveries can still be highly valuable, as long as sufficient gas quantities are found in the region to justify an LNG development (at least ~10Tcf of gas).
We estimate that the current fair value of FAR‘s share price is A¢7, which is roughly 2x higher than its A¢3.4 price on 19 October. In our ‗success‘ scenario we estimate FAR‘s shares could be worth A¢49 by end-2013, while in our ‗failure‘ scenario we estimate they could be worth A¢1 over in the same timeframe. FAR is trading on an EV/net risked 2P prospective resource multiple of just ~US$0.15/boe, a substantial discount to most of its peers.
Management
Nicholas Limb is FAR‘s Non-executive Chairman. Mr Limb is a professional geophysicist and also has extensive experience as a stockbroker and merchant banker. He is currently Executive Chairman of Mineral Deposits Limited, an Australian-listed company. He has significant in-country experience in Senegal.
Nicholas Limb —Non-executive Chairman

Sub-Saharan Oil and Gas October 2012 99
Catherine Norman is FAR‘s Managing Director. Ms Norman is a professional geophysicist who has 20 years‘ experience in the mineral and oil and gas exploration industry, having held executive positions both in Australia and the UK and carried out operating assignments in Europe, Africa, the Middle East and Australia. She has a strong background in the application of traditional and innovating geophysical technologies in the search for oil and gas and in new business development. She served as the Managing Director of Flow Energy for six years.
Operations
Kenya
Figure 35: Kenya: L6 and L9 Prospects/Leads
Source: FAR
FAR Limited (FAR) farmed into L6 in August 2006. It earned a 60% interest by free carrying Pancontinental through a 2D seismic survey and an airborne gravity survey costing ~US$2m. FAR shot 1,200km of 2D seismic over L6 in February 2007. This was soon followed by a 6,273km airborne gravity gradiometry survey.
Catherine Norman — Managing Director
Block L6
Sub-Saharan Oil and Gas October 2012 100
In July 2012 FAR completed the 778km2 Kifaru 3D seismic survey. This survey covered the Kifaru and Tembo Prospects in the southern offshore portion of the L6 area. The Kifaru Prospect is in water depths of 80-100m in the south-west of the L6 area. FAR is now processing and interpreting the Kifaru 3D seismic with a view to farming down its interest ahead of drilling (planned for mid-2013). FAR modelling of L6 prospects and a subsequent Competent Person‘s Report prepared by RISC estimates unrisked prospective resources (P50) of 1,378MMboe for L6. Estimates are based on 70% gas and 30% oil.
In March 2011 Dominion (subsequently acquired by Ophir) and its partners, including Flow Energy (now FAR), were awarded Block L9, which has water depths ranging from 300m to 1,400m. To date, only one well has been drilled in the L9 block — the Simba-1 well in 1979, which encountered gas shows. Offshore oil seeps have also been identified to the north of L9. After 500km2 of 3D seismic in L9 was acquired in January 2012, Ophir has identified Simba Graben as the main lead for drilling in 2013. FAR currently plans to farm down its interest prior to drilling Mbawa South at the end of 2013.
Senegal
The Rufisque, Sangomar and Sangomar Deep licences were initially awarded to Hunt Oil in 2004. FAR entered Senegal in January 2006 when it acquired a 30% stake in each of these three licences by contributing ~US$9m towards a 3D seismic programme. The 2,086km2 3D seismic survey was completed in March 2007. When Hunt withdrew from Africa and the Senegal licences in November 2008, FAR inherited Hunt‘s 60% interest. A Presidential Decree issued on 6 February 2012 confirmed FAR‘s entry into the Second Renewal Period of the PSC for the Senegal permits. Total exploration on the blocks to date is ~US$21m. We estimate FAR has only contributed ~US$10m to this.
In June 2009 Shell funded the acquisition of Control Source Electro Magnetic (CSEM) data over the carbonate shelf of the licences, to earn a three-month option to acquire a 70% interest in each of the licences. Shell subsequently decided not to exercise this option after the results of CSEM survey were inconclusive. In October 2010 FAR granted Ophir an option over a 25% interest in its Senegalese licences as part of the agreement to farm in to Ophir‘s AGC Profond licence. After the Kora-1 well was completed, Ophir decided not to exercise this option. Had Ophir elected to remain in the JV after drilling the first well, it would have paid FAR a 50% uplift on its pro-rata share of subsequent well costs (capped at a gross cost of US$32m).
While it is not possible to know precisely why Hunt pulled out of the licence and Ophir did not take up its option, we believe there were specific circumstances to each company that meant they had to focus their portfolio on assets that were closer to development. Hunt pulled out in the middle of the financial crisis as it had to focus on its capital-intensive Yemen LNG project, and at a time when an applied for extension of the licence was uncertain (thus, there was the risk that the JV had moved into the next stage of the project, committing the JV to a well). At the time Ophir had to decide on its option, it was preoccupied with its acquisition of Dominion Resources and was busy preparing for its relatively high capex 2012 Tanzanian and Equatorial Guinea drilling campaigns (where it had already made discoveries). Shell‘s CSEM survey of the carbonate shelf targeted the less exciting structural trap plays in the licences (as that was licence focus at that time).
Block L9
Rufisque, Sangomar and Sangomar Deep licence history
Previous farm-out activity

Sub-Saharan Oil and Gas October 2012 101
Figure 36: FAR Senegalese Licences: 3D Seismic of Fan Complexes
Source: FAR
This year FAR has reworked the data on the licence and management has increased its estimate of gross unrisked mean prospective resources from 697MMbbl to 1,580MMbbl of oil. Importantly, ~80% of the resources in the new estimate are from late Cretaceous fan complexes (one of the main themes of this report), whereas only ~45% of resources in the previous estimate were from these reservoirs. With the much more exciting reworked analysis, FAR now plans to farm out an interest (and operatorship) in the Senegalese licences before a first well must be drilled before February 2014. We believe FAR is likely to be successful in this farm-out given the increased focus of the industry on late Cretaceous stratigraphic traps along the West African Transform Margin.
We believe FAR is likely to farm out an interest successfully given the increased focus of industry on late Cretaceous stratigraphic traps along the West African Transform Margin

Sub-Saharan Oil and Gas October 2012 102
Also, should exploration drilling of APCL‘s Alhamdulillah Prospect in neighbouring Gambia prove the key elements of a working hydrocarbon system in the basin, FAR should benefit because this may de-risk its Senegalese prospects. Should the well make a discovery, FAR will directly benefit because some of the prospect overlaps into FAR‘s acreage. APCL is likely to drill Alhamdulillah in 1Q13.
Guinea Bissau
FAR bought its 15% interest in three Guinea Bissau licences from Delek International Energy in December 2009. The interests were acquired by assuming the exploration obligations of Delek for the year 2009, capped at US$0.6m plus forward obligations arising from the date of the agreement. In the event of commercial production, Delek is entitled to recover past costs capped at US$13m. The Sinapa (Block 2) and Esperanca (Blocks 4A and 5A) offshore licences lie in water depths ranging from 10m to in excess of 1,000m. Immediately to the north lies the billion barrel Dome Flore discovery.
The licences include the Sinapa oil discovery in 30-60m of water, which was found by Premier in 2004. Senergy estimated it to have gross 2C + 2P oil resources of ~21MMbbl (November 2011 CPR). They also contain several untested prospects, including the Sardinha Prospect, which Senergy estimated to have gross unrisked (P50) prospective resources of 91MMbbl (November 2011 CPR).
Processing and interpretation of the 3D seismic data acquired in October 2010 continues, with the objective of better defining the existing Sinapa discovery and several other prospects and leads. Up to two wells may be drilled on the licence in 2013, with the first likely to be a Sinapa appraisal well, although with the sale of Svenska (the operator) we believe this timing may slip.
AGC
FAR acquired its 8.8% interest in the AGC Profond PSC in October 2010. FAR earned its interest by agreeing to pay 15% of the cost of the first well. The Kora-1 frontier exploration well, lying in 2,600m of water, was spudded on 28 June 2011, using the semi-submersible rig Maersk Deliverer. The well was drilled to a total depth of 4,447m sub-sea and plugged and abandoned as an unsuccessful well. The primary (Albian) and secondary (Coniacian and Barremian) reservoir intervals were penetrated close to their anticipated depths, but the well encountered a predominantly clay stone and thinly-bedded limestone sequence rather than the prognosed sandstone reservoir.
Prior to drilling the Kora Prospect was interpreted as a large toe-thrust structure containing a series of stacked reservoir targets, having P50 prospective oil resources of 313MMbbl (RPS estimate). The prospect was supported by a combination of 3D seismic and CSEM data.
Noble and Rocksource have since withdrawn from the licence. Ophir and FAR have negotiated a licence extension/elected to enter the next phase and are talking to the government about renegotiating the terms of the next phase.
Upcoming drilling of Alhamdulillah Prospect, if successful, would add value to the licence, in our view

Sub-Saharan Oil and Gas October 2012 103
Australia
In July 2011 Flow Energy (now part of FAR) was awarded the WA-457-P and WA-458-P permits for offshore petroleum exploration in the Dampier Sub-basin in Western Australia. Both blocks have a three-year initial exploration period consisting of seismic reprocessing and geophysical studies in Year One, 3D seismic data acquisition in Year Two and geological studies in Year Three. FAR aims to shoot the 3D seismic and then farm down an interest for carry on the first well in the next exploration period.
FAR also has several non-operating interests in Australian licences in the Canning Basin. In the EP104/R1 area in the Canning Basin, the joint venture is examining the prospectivity of the licence area. Elsewhere in the Canning Basin, the L15 joint venture that manages the West Kora oil field is planning for the rehabilitation of existing production facilities. We believe that none of these non-operated Australian licences are material to FAR‘s valuation.
Jamaica
FAR is a 50% equity holder of five exploration blocks in the Walton Basin offshore Jamaica. Water depths range from less than 20m near the coast and over some shoals to 1,700m in the extreme south-east. Seven prospects and leads have been mapped in the area using 2D seismic and Falcon Airborne Gravity Gradiometer data. FAR is currently seeking a partner for drilling, with the first well due before 4Q13 (see FAR‘s website for the farm-out brochure). We believe that FAR is likely to focus on its exciting African prospects, and may look to dispose of its Jamaican licences over time.
Risks
FAR is a speculative investment. It is subject to the usual risks that a junior upstream petroleum exploration company operating in Africa and Australia faces. These include: geological/technical, political/regulatory, commercial, operational, capital access and environmental. As a relatively small company with a current market cap of just A$88m, its shares also have significant liquidity risk.
A key risk that is specific to FAR is that it might be unable to farm-out its Kenyan L6 and Senegalese licences on acceptable terms. Alternatively, a key risk to our current fair value estimate is that it has to give up more of its interest in this licence than we have assumed to get a deal done.
Even if FAR does farm down its acreage for carry on exploration wells, these wells might not be successful. Indeed, we estimate the geological chance of success (Pg) of the proposed exploration wells are just 15%, 15% and 20% for the Kifaru, Southern Fan complex and Sardinha prospects respectively. We estimate that Pg of the proposed Sinapa appraisal well is 40%. Failure of an individual well is still more likely than success, as it is for the vast majority of exploration wells.

Sub-Saharan Oil and Gas October 2012 104
Valuation
We estimate that the current fair value of FAR‘s share price is A¢7, which is roughly 2x higher than its A¢3.4 price on 19 October 2012. In our ‗success‘ scenario we estimate FAR‘s shares could be worth A¢49 by end-2013, while in our ‗failure‘ scenario we estimate they could be worth A¢1 over the same timeframe. We outline the key assumptions behind our estimates below. FAR‘s current fair value is also highly sensitive to our oil price and discount rate assumptions. FAR is trading on an EV/net risked 2P prospective resource multiple of just ~US$0.15/boe.
Key Assumptions
For our Current Fair Value Estimate
In the L6, Kenya, we have assumed that by end-2013 FAR farms down half its interest for carry on the first well, which we have assumed will target the Kifaru Prospect. After an assumed government back-in right of 10%, this leaves FAR with a 27% interest in the licence. We also assume that the Pd is just 50%, reflecting the risk that a farm-down is not completed and that if a discovery is made that it is not taken to commercial development.
In Kenya we have only valued the L6 prospects in FAR‘s September 2010 CPR. Thus, we have ascribed no value to FAR‘s new ~600MMboe Tembo Prospect, over which 3D seismic was just shot.
We have valued the Kenyan L9 licence based on a recent per km2 farm-in valuation for offshore Kenya.
We have used recent management guidance on the size of the Senegalese prospects, as management has worked up the prospects further since the CPR was published.
In Senegal we have assumed that by end-2013 FAR farms down a 60% interest for carry on an exploration well targeting the Southern Fan Complex Prospect. We also assume that Pd for the this prospect is 50%, reflecting the risk that a farm-down is not completed and that if a discovery is made that it is not taken to commercial development.
In Guinea Bissau we have assumed two wells are drilled.
We have ascribed no value to FAR‘s AGC Profond licence, its Australian licences and its Jamaican licences as they are not likely to be currently material to FAR‘s valuation in our view.
The key attributes of our standardised model resource developments are given in Table 35 below. Other key assumptions can be seen in Table 37.
Table 35: FAR Resource Development Model Attributes
Resources (MMboe)
NPV (US$m)
NPV (US$/boe)
IRR (%)
Gov’t take (%)
Kenya Oil 428 3,898 9.10 34% 49%
Kenya Gas 1,359 3,456 2.54 19% 43%
Oil 30%, Gas 70% 4.51
Senegal/GB Oil 428 4,140 9.67 32% 46%
Source: RFC Ambrian estimates

Sub-Saharan Oil and Gas October 2012 105
For our ‘Success’ Scenario Value Estimate
All assumptions are the same as above except:
We assume that in Senegal a farm-out is completed on the terms assumed above, and that an oil discovery is made in the Southern Fan Prospect. This de-risks the other fan prospects (Pg is raised from 10% to 25%). We also raise our Pd from 50% to 80% for all the Senegalese prospects.
We assume that in Kenya a farm-out is completed on the terms assumed above, but that the first well is a dry hole. We assume no value for FAR‘s L6 licence and also lower the value of FAR‘s interest in L9 by 75% in this scenario.
In Guinea Bissau we assume that two wells are drilled, but just the Sinapa appraisal well is successful and only the Sinapa field is valued.
For our ‘Failure’ Scenario Value Estimate
All assumptions are the same as current fair value except:
We assume that in Senegal a farm-out is completed on the terms assumed above, but that the first well is a dry hole. We lower Pg for the two other fan prospects from 10% to 5%, and set Pd for all the Senegalese prospects at just 10% (from 50%).
We assume that in Kenya a farm-out is completed on the terms assumed above, but that the first well is a dry hole. We assume no value for FAR‘s L6 licence and also lower the value of FAR‘s interest in L9 by 75% in this scenario.
In Guinea Bissau we assume that neither well is successful. We ascribe no value for these licences in this scenario.
Sensitivity Analysis
FAR‘s current fair value is also highly sensitive to our oil price and discount rate assumptions. Table 36 gives the fully diluted NAV/share value for different combinations of real oil price and nominal discount rates.
Table 36: FAR’s Fair Value Sensitivity to Oil Price and Discount Rate
A¢/share
Real oil price (US$/bbl)
70 80 90 100 110
8 6.5 7.9 9.3 10.8 12.3
Nominal 9 5.7 7.0 8.2 9.6 10.9
discount rate 10 5.1 6.2 7.3 8.5 9.7
(%) 11 4.5 5.5 6.6 7.6 8.7
12 4.0 5.0 5.9 6.8 7.8
Source: RFC Ambrian estimates
EV/Net Risked Resource & EV/Net Licence Area Multiples
We estimate that FAR is trading on an EV/net risked 2P prospective resource multiple of ~US$0.15/boe. We estimate that it is trading on an EV/km2 multiple of ~US$2,690/km2. Although we do not put much weight on EV/net risked resource & EV/net licence area multiples, we have also calculated them because we believe that the market does place some weight on them. These multiples are well below the average for the peer group, reflecting FAR‘s substantial net risked prospective resources, its large acreage position in the Senegal, Kenya, Guinea Bissau, AGC and Jamaica, and the funding/farm-out risks.

Sub-Saharan Oil and Gas October 2012 106
Table 37: Estimate of FAR’s Current Fair Value
Fields
Liquids (MMbbl)
Gas (Bcf)
Total Oil Equiv
(MMboe)
Net Int’t (%)
Net Oil and Gas (MMboe)
NAV/boe (US$/ boe)
Unrisked NAV
(US$m)
Pg (%)
Pd (%)
Risked NAV
(US$m)
Risked NAV/sh (A¢/sh)
Discovered resources
Guinea Bissau
Sinapa 13 - 13 15.0 2 9.67 19 100 75 15 0.6
Discovered resources 13 - 13 2 19 15 0.6
4Q12/2013 Work Programme
Kenya
Kifaru 80 27.0 22 4.51 97 15 50 7 0.3
Senegal
Southern Fan 307 - 307 30.0 92 9.67 891 15 50 67 2.6
Guinea Bissau
Sinapa 8 8 15.0 1 9.67 11 40 75 3 0.1
Sardinha 91 91 15.0 14 9.67 132 20 75 20 0.8
Work Programme 406 - 486 128 1,149 97 3.8
Other identified prospects
Kenya
Kudu 86 27.0 23 4.51 105 10 15 - 0.0
Chui + Chui West 208 27.0 56 4.51 253 10 15 2 0.1
Nyati 91 27.0 25 4.51 111 10 15 - 0.0
Updip Kipini 25 27.0 7 4.51 30 10 15 - 0.0
Nyati W 205 27.0 55 4.51 250 10 15 2 0.1
Kiboko 81 27.0 22 4.51 99 10 15 - 0.0
Senegal
North Fan 226 226 30.0 68 9.67 656 10 15 7 0.3
Mid Fan 709 709 30.0 213 9.67 2,057 10 15 28 1.1
Carbonate Platform 338 338 30.0 101 9.67 981 5 15 4 0.2
Guinea Bissau
Sabayon 7 7 15.0 1 9.67 10 20 20 - 0.0
Harlequin 23 23 15.0 3 9.67 33 20 20 1 0.0
Other Prospects 1,999 574 4,737 43 1.7
Total of above 2,498 705 5,905 155 5.9
Licence valuation
Kenya: L9 Based on US$20,000/km2 farm-in cost offshore 31 1.2
AGC: Profond Block Licence uncertain. No value ascribed - 0.0
Australia: WA-457-P, WA-458-P Acquired licences in July 2011. Little material work done so far. No value ascribed - 0.0
Australia: EP104/R1, L15 Licence immaterial to FAR valuation. No value ascribed - 0.0
Jamaica: Blocks 6, 7, 10, 11 & 12
Licence immaterial to FAR valuation. No value ascribed - 0.0
Cash, G&A and work programme expenditure
Net cash/(debt) June 2012 34 1.3
Exploration expenditure (2H12) (8) (0.4)
Exploration expenditure (2013 -) (20) (0.8)
Cash NAV 5 0.3
Other Value adjustments
Options - 0.0
Total FAR fully diluted NAV 193 7.3
Note: Uses fully diluted number of shares of 2,565m; Source: RFC Ambrian estimates

Sub-Saharan Oil and Gas
Sitting Ducks? October 2012

Sub-Saharan Oil and Gas October 2012
Contents
Summary 1
Why Sub-Saharan Explorers? 5
North West Africa Coastal 9
West Coast Central Pre-Salt 11
East Africa Rift Basins 12
East Africa Coastal 13
Regional Play Type Undiscovered Resources 15
Valuation 17
Bottom-up Risked NAV Methodology 17
Peer Multiples 22
Companies 22
Company Analyses 23
Ophir 24
Africa Oil Corp 40
African Petroleum 54
Pancontinental 66
Chariot Oil and Gas 76
Rialto 86
FAR Ltd 96
Fastnet Oil & Gas 108
WHL Energy 118
Tangiers Petroleum 128
Appendix —Sub-Saharan Transaction Multiples 138
All prices in this document are as of 19 October 2012
Stuart Amor +44 (0)20 3440 6826 [email protected]

Sub-Saharan Oil and Gas October 2012 1
Summary
With equity markets unusually risk averse, we believe it is a good time to build a portfolio of undervalued, high-risk (and thus cheap) frontier exploration stocks with a view to generating strong portfolio returns over the next few years. Many Sub-Saharan African Explorers fit this bill well. Significantly, we believe that the potential for new petroleum discoveries in Sub-Sahara Africa is being underestimated by equity markets. While most explorers in this report suffer from a relatively heavy concentration of regional, geologic and/or political risk, we think a good proportion of this risk can be hedged by owning a portfolio of these stocks.
We believe that the scope for new oil and gas discoveries in Sub-Saharan Africa is being underestimated and that they are undervalued because:
The April 2012 USGS World Petroleum Assessment estimate of Sub-Saharan Africa mean undiscovered conventional petroleum resources was 2.2x larger (or 146Bboe) than its 2000 Assessment. This was by far the largest increase of its eight main assessment regions, in both absolute and percentage terms.
New technology has de-risked the exploration of certain play types that were considered too risky just a decade or two ago when the majors held much of Africa‘s offshore acreage.
The influence of the region’s (current) relatively low levels of proven reserves and production has on perceptions about future potential.
Political risk, regulatory risk, graft and security issues have caused the region to be less explored than its geologic potential warrants.
The average upside to our current fair values for the ten companies covered in this report is >80%.
The USGS estimate of the undiscovered resource potential of Sub-Saharan Africa now rivals that of the Middle East and North Africa, North America and South America. We believe that junior explorers operating in Sub-Saharan Africa often have better access to licences than in the other regions. We have identified four Sub-Sahara African play types that have had recent petroleum discoveries, and where we believe there is plenty of scope for further exploration success. Below we give our recommendations and current fair values of what we believe are ten of the most exciting exploration companies operating in Sub-Saharan Africa1.
Table 1: Sub-Saharan Explorers: Recommendation and Current Fair Values
Company
Speculative Recommendation
Cur
Share Price (lc)
Mkt Cap (US$m)
Fair Value (lc)
Upside/(downside) to Fair Value (%)
Ophir Buy £ 5.74 3,675 8.09 41
African Oil Corp Sell C$ 10.05 2,245 7.60 (24)
African Petroleum Buy A$ 1.11 1,837 2.23 101
Pancontinental Buy A¢ 9.4 112 10.3 10
Chariot Oil and Gas Buy p 30.0 96 61.8 106
Rialto Energy Buy A¢ 13.5 95 47.8 254
FAR Ltd Buy A¢ 3.4 88 7.3 116
Fastnet Oil and Gas Buy p 25.9 85 33.3 29
WHL Energy Buy A¢ 4.0 58 5.3 34
Tangiers Petroleum* Buy A¢ 37.0 44 110.3 198
*RFC Ambrian acts as Nomad to this company; Source: FactSet, RFC Ambrian estimates
1 We have also included Morocco, which is technically not part of Sub-Saharan Africa, but
where some companies are following the same play types as those that have proved successful along West Africa‘s Transform Margin
A good time to build a portfolio of undervalued, high-risk frontier exploration stocks with a view to generating strong portfolio returns over the next few years
Why Sub-Saharan Explorers?
Sub-Saharan Oil and Gas October 2012 2
When picking stocks to include in a portfolio, we believe investors should favour companies that have the following characteristics:
They acquired their licences early when the region was out of favour.
They are following drill bit success, either within their own licences or of analogous plays elsewhere in Africa.
They have partnered with successful leading major oil and gas companies.
Their stock appears undervalued relative to our bottom-up, risked Net Asset Value (NAV) estimate of their current fair value.
While not all the companies covered in this report tick every box, they have been included because they tick at least one of the boxes.
The fiscal terms obtained from governments are generally much more favourable in out of favour, unproven provinces than in provinces that have had significant discoveries. This can make a big difference to the value of any oil/gas discoveries. The development NAV of oil resources in licences covered by this report ranges from US$5-20/bbl based largely on the different fiscal terms. Also, junior oil and gas companies don‘t have the firepower to compete with the majors in highly developed provinces.
As with the elephants on the front cover, petroleum fields tend to be found together. Furthermore, once a particular play type is shown to work, this de-risks the same play type elsewhere. Thus, once a frontier wildcat well makes a discovery, several more successful exploration/ appraisal wells tend to follow. In this report we have identified ten companies that are well exposed to the four Sub-Saharan African exploration themes that have had recent success, and which we believe will continue to prove fruitful: North West African Coastal oil plays, Central West African sub-salt oil plays, East African Rift Basin oil plays and East African offshore oil/gas plays.
Some oil and gas companies seem to have found the right formula to improve drill bit success rates. For example, the use of airborne full-tensor gradiometry (FTG) gravity surveys in Uganda, when combined with seismic data, has allowed Tullow to record ~90% success rates for its exploration wells there. Africa Oil Corp has farmed out much of its most prospective onshore Kenyan acreage to Tullow, which we believe should significantly improve the likelihood of exploration success. Petrobras should also be able to improve Ophir‘s sub-salt exploration prospects in Gabon, given its experience in Brazil. Many junior oil companies will need help developing any large discoveries they might make, particularly if the discoveries will require an LNG terminal to be commercialised. Ophir‘s partnership with BG offshore Tanzania is a good example of where a company has brought in a strategic partner that has a successful track record of commercialising large gas discoveries.
The valuation of exploration companies is hard because data is scarce and uncertainties are large. We believe the best way to value them is to use a bottom-up, risked net asset value (NAV) methodology, using consistent inputs (although this still requires a lot of judgement calls). We use such a process to estimate the current fair value of a stock. We have used scenario analysis to show what the stock price might be end-2013, should each company‘s work programme to end-2013 be successful or should it be a failure. This, we believe, gives a sense of the range of possible outcomes from their farm-out and exploration programmes, though not their distribution, which is incorporated in our current fair value estimates.
Characteristics of companies with good stocks to own…
… they got their licences early…
… they are following success…
… they have partnered successful, larger companies, with relevant skill sets and …
… they are undervalued

Sub-Saharan Oil and Gas October 2012 3
Figure 1: Fair Value as a Percentage of Current Share Price
Source: RFC Ambrian estimates
We consider that, based on their current fair values and risk/reward profiles, all the companies covered in this report, except African Oil Corp, are good candidates to be included in a portfolio of Sub-Saharan Explorers. We outline the main assumptions behind our current fair value estimates in the individual company valuation sections. Above we have broken down our current fair value estimates into the component parts: current discoveries, work programme and other identified prospects, licences where we have no/little prospect information and cash including other valuation adjustments. We believe this gives a good idea of how much of a company‘s current share price is underpinned by these components. We estimate the value of discoveries and prospects using 40-year DCF model developments, run to the field economic limit. We use a flat real oil price assumption of US$90/bbl and an Asian LNG (CIF) gas price of US$13.5/Mcf. The historic commodity prices and our assumptions to 2019 can be seen in Figure 2 below.
Figure 2: Real Historic and Assumed Commodity Prices
Source: FactSet, RFC Ambrian estimates
-
20
40
60
80
100
120
140
160
Re
al o
il &
Gas
Pri
ces
(US$
/bo
e -
MO
D)
Brent Brent Futures
Oil Assumption Gas (LNG CIF Japan)
Gas Assumption (LNG CIF Asia) Netback E & W Africa
Netback Aus.
In general, current discoveries and prospect inventories underpin the current share prices

Sub-Saharan Oil and Gas October 2012 4
Peer valuation multiples are difficult to apply given that companies do not currently have positive revenues, operating cashflow and earnings, and that they report net risked resources in an inconsistent manner (and in some cases only for some of their licences). Furthermore, gas is not as valuable as oil and even per barrel oil valuations for different fields vary widely. Not all acreage is equally valuable, so peer metrics based on this are not that useful in our view. Nonetheless, we believe the market does take account of these metrics and in some cases mis-values companies based on them. We give our estimate of each company‘s EV/net risked 2C + 2P resources and EV/net licence area in Table 2 below (a fuller peer group table is given on page 22).
Table 2: Company Risked Resource and Licence Area based multiples
Company
Cur
Share Price (lc)
Mkt Cap (US$m)
Net Debt/ (Cash) (US$m)
EV (US$m)
Net
Licence Area (km2)
Net Risked
2C + 2P Resources (MMboe)
EV/
Licence Area
(US$/km2)
EV/ Net Risked
2C + 2P Resource (US$/boe)
Ophir £ 5.74 3,675 (454) 3,220 63,809 1,914 50,470 1.68
Africa Oil Corp C$ 10.05 2,245 (125) 2,121 119,181 985 17,793 2.15
African Petr A$ 1.11 1,837 (220) 1,617 33,318 596 48,536 2.71
Pancontinental A¢ 9.4 112 (49) 62 20,120 69 3,098 0.91
Chariot p 30.0 96 (112) (16) 35,671 742 N/A N/A
Rialto A¢ 13.5 95 (76) 19 506 213 37,328 0.09
FAR A¢ 3.4 88 (35) 53 19,737 352 2,690 0.15
Fastnet p 25.9 85 (13) 72 2,509 312 28,763 0.23
WHL p 4.0 58 (8) 50 17,345 330 2,869 0.15
Tangiers p 37.0 44 (9) 35 30,737 161 1,152 0.22
Covered Companies’ Average 21,411 0.92
Source: RFC Ambrian estimates
We provide the investment case, a description of operations/assets, risks and valuation for each company in a separate company section later in the report. In Table 3 below we summarise the characteristics of each company as they relate to the key themes of this report.
Table 3: Company Characteristics
Company
Main region/ play types
Early licences
Discoveries
Large company partners
FV % above/ (below) SP
Ophir EAO, SS, NWAC Yes Gas off TZ & EG BG, Petrobras 41
African Oil Corp E Africa Rift Basin Yes Oil onshore Kenya Tullow, Marathon (24)
African Petroleum NWAC Yes Oil off Liberia 101
Pancontinental EAO, Namibia Yes BG, Apache 9
Rialto Energy NWAC Yes Gas/cond off CI 106
FAR NWAC, EAO Yes 254
WHL Energy Seychelles Yes 116
Chariot Oil & Gas Namibia, NWAC Yes BP, Petrobras 29
Fastnet Oil & Gas NWAC Yes Kosmos 34
Tangiers NWAC Yes 198
EAO = East Africa Offshore, SS = Sub-salt, NWAC = North West African Coastal, TZ = Tanzania, EG = Equatorial Guinea; Source: RFC Ambrian estimates
Peer valuation multiples

Sub-Saharan Oil and Gas October 2012 5
Why Sub-Saharan Explorers?
We believe Sub-Saharan Africa political risk, regulatory risk, graft and security issues have caused the region to be less explored than its geologic potential warrants. In many countries these risks are abating. Furthermore, new technology has de-risked the exploration of certain play types that were considered too risky a decade ago when the majors held much of Africa‘s offshore acreage. In our view, this is only just starting to be appreciated. The April 2012 USGS World Petroleum Assessment estimate of Sub-Saharan Africa mean undiscovered conventional petroleum resources was 2.2x larger (or 146Bboe) than its 2000 Assessment. This was by far the largest increase of its eight main assessment regions, in both absolute and percentage terms. The undiscovered resource potential of Sub-Saharan Africa now rivals that of the Middle East, North Africa, North America and South America. We believe that junior explorers operating in Sub-Saharan Africa often have better access to licences than in these other regions.
We believe that the reason Sub-Saharan Africa has large undiscovered petroleum resources is due to the euphemistically named ‗surface issues‘ (political risk, regulatory risk, graft and security) that have historically dogged many countries in the region. We think that these issues have caused the region to be less explored than its geologic potential warrants. While Sub-Saharan African country, political and security risks have not disappeared (and are still far higher than in the developed world), we believe that, with some notable exceptions — Somalia, Sudan, South Sudan, Mali and Cote d‘Ivoire — they have generally diminished over the last few years.
We consider that Sub-Saharan African country stability is loosely tied to economic growth, which has been relatively strong in the last few years. Although presidential/parliamentary polls and leadership successions can trigger crises, we do not expect such problems in the near term in most of the coastal countries where petroleum exploration takes place. We believe graft will become less of an issue on account of new (and stronger enforcement of) anti-corruption legislation abroad (US FCPA, UK Bribery Act, etc), which generally strengthens the hand of foreign firms refusing to participate in corrupt practices. Furthermore, we believe improvements in the investment environment are starting to be understood by both companies and investors; 60% of international decision makers surveyed in Ernst and Young‘s 2012 Africa Attractiveness Survey reported that over the last three years their perception of Africa‘s attractiveness as a place to do business had improved (only 11% reported that it had deteriorated).
We think that the opportunity to add value through oil and gas exploration in Sub-Saharan Africa is both very large and underestimated. New technology has made exploration possible of plays that were previously difficult. In particular, improvements in 3D seismic acquisition and processing now allow companies to visualise much better, deeper reservoirs/traps (pre-salt and Cretaceous stratigraphic traps), improving the chances of successful wells. Onshore full-tensor gradiometry (FTG) gravity surveys have made finding Rift Basin reservoirs easier. Furthermore, as more world-scale discoveries are made (such as Kosmos‘s 2007 Jubilee oil field discovery offshore Ghana and Anadarko‘s more recent gas discoveries offshore Mozambique), both equity markets and industry will place more value on exploration companies operating in the region.
Summary
‗Surface issues‘ have caused the region to be less explored than its geologic potential warrants
We believe political and security risks have generally diminished over the last few years
New technology has improved exploration success rates of certain types of plays

Sub-Saharan Oil and Gas October 2012 6
The United States Geological Society (USGS) agrees with us. The April 2012 USGS World Petroleum Assessment of Sub-Saharan African estimated mean undiscovered conventional petroleum resources was 2.2x larger (or 146Bboe) than its 2000 Assessment. This was by far the largest increase of its eight main assessment regions, in both absolute and percentage terms.
Sub-Saharan African total mean undiscovered petroleum resources are 267Bboe according to a recent report by the USGS. This means that the opportunity is comparable in size to that of the Middle East and North Africa (299Bboe), North America (296Bboe) and South America and the Caribbean (260Bboe). Moreover, we believe that junior explorers operating in Sub-Saharan Africa often have better access to licences than in some of these regions (Middle East, South America) and face less competition than in other regions (North America). Thus, we think the scope to add value is higher for exploration companies operating in Sub-Saharan Africa than almost anywhere else.
Figure 3: World Mean Undiscovered Prospective Oil & Gas Resources
Source: USGS, RFC-Ambrian estimates
Despite the scale of the estimated mean undiscovered resources by the USGS, we believe many people still underestimate the scope for new oil and gas discoveries in Sub-Saharan Africa. We think that this is because the region‘s (current) relatively low level of proven reserves and production unduly influences them. Only Nigeria and Angola had 2011 oil production greater than 0.5MMbpd. However, the scope for new discoveries depends not on current reserves and/or production, but on the geological propensity of a region to produce oil and gas fields and the amount of historic exploration conducted in the region. The USGS has looked at the latter factors and has produced two World Petroleum Assessments, one in 2000 and the other this year. If you are a Sub-Saharan African oil and gas explorer, the results of the most recent assessment were highly encouraging, with over 15% of the world‘s undiscovered petroleum resources estimated to be in the region!
21%
17%
17%
15%
15%
11%
2% 2%
Former Soviet Union
Middle East and NorthAfrica
North America
Sub-Saharan Africa
South America andCaribbean
Asia Pacific
Europe
South Asia
In 2012 the USGS estimated that Sub-Saharan African mean undiscovered conventional petroleum resources were 2.2x its 2000 Assessment
Sub-Saharan Africa undiscovered oil and gas resources still underestimated

Sub-Saharan Oil and Gas October 2012 7
At the end of 2011 Sub-Saharan Africa had conventional proven oil reserves (68.4Bbbl) equivalent to 4.1% of the world‘s total, according to BP‘s 2012 statistical review of world energy. Sub-Saharan 2011 oil production (5.9Mbpd) was 6.9% of the world‘s total. However, Sub-Saharan Africa contains 19.5% of the world‘s mean undiscovered conventional oil resources according to the April 2012 world petroleum assessment update by the USGS. This equates to mean technically recoverable undiscovered oil resources of 115Bbbl. No small number. And it does not include additional mean technically recoverable undiscovered natural gas liquid (NGL) resources of 28Bbbl that are included in BP‘s estimated proven reserves. Overall mean technically recoverable undiscovered oil + NGL resources are more than 2x larger than current proven liquid reserves.
At the end of 2011 Sub-Saharan Africa had conventional proven gas reserves (224Tcf) equivalent to 3.0% of the world‘s total according to BP‘s 2012 statistical review of world energy. Sub-Saharan 2011 gas production (5.7Bcf/day) was 1.8% of the world‘s total. However, Sub-Saharan Africa contains 12.4% of the world‘s mean undiscovered conventional gas resources according to the April 2012 world petroleum assessment update by the USGS. This equates to mean technically recoverable undiscovered gas resources of 744Tcf. This is more than 3x larger than current proven gas reserves.
Figure 4: Sub-Saharan African Petroleum Production, Reserves and Undiscovered Resources as a % of the World Total
Source: USGS, BP review of world energy 2012, RFC-Ambrian estimates
We believe that the consensus view of the petroleum potential of Sub-Saharan Africa is becoming much more positive. For example, the April 2012 USGS World Petroleum Assessment of Sub-Saharan African estimated that mean undiscovered conventional petroleum resources were 2.2x larger (or 146Bboe) than its 2000 Assessment. This was by far the largest increase of its eight main assessment regions in both absolute and percentage terms. Indeed, its estimate of world mean undiscovered conventional petroleum resources actually fell 2% over the 12 years! Figures 5 and 6 below show how the regional estimates of mean undiscovered oil and gas resources have changed between the two assessments.
0% 2% 4% 6% 8% 10% 12% 14% 16% 18% 20%
Gas production
Gas proved reserves
Gas undiscovered resources
Oil & NGL production
Oil & NGL proved reserves
Oil & NGL undiscovered resources
USGS‘ estimated increase in Sub-Saharan Africa undiscovered resources was by far the largest increase of its eight main assessment regions, in both absolute and percentage terms

Sub-Saharan Oil and Gas October 2012 8
Figure 5: USGS 2000 World
Petroleum Assessment Figure 6: USGS 2012 World
Petroleum Assessment
Source: USGS, RFC-Ambrian Source: USGS, RFC-Ambrian
The change in sentiment towards Sub-Saharan Africa‘s frontier exploration regions (as opposed to Nigeria and Angola, which have to date attracted the vast majority of industry exploration, appraisal and development spending) has been driven by large, new discoveries in previously underexplored territory. We have grouped the recent Sub-Sahara African frontier discoveries into four regional play types below:
North West African Coastal
West Coast Central Pre-Salt
East Africa Coastal
East African Rift Basins
Figure 7: Four Regional Sub-Saharan African Exploration Play Types
Source: RFC-Ambrian
0
100
200
300
400
500
600
Un
dis
cove
red
mea
n r
eso
urc
es
(Bill
ion
BO
E)
Gas
Oil + NGL
0
100
200
300
400
500
600
Un
dis
cove
red
mea
n r
eso
urc
es
(B
illio
n B
OE)
Gas
Oil + NGL
North West
African Coastal East
Africa
Rift
Basins
East
Africa
Coastal
West
Coast
Central
Pre-Salt
Four regional play types

Sub-Saharan Oil and Gas October 2012 9
North West Africa Coastal
Figure 8: North West African Coastal Fields and Discoveries
Source: FAR Ltd
The main impetus behind the re-evaluation of petroleum resources in frontier Sub-Saharan African countries came from the giant Jubilee oil field discovery by Kosmos Energy offshore Ghana in 2007. Kosmos drilled the Mahogany-1 well in the West Cape Three Points Block in June 2007 and intersected 95m of net stacked oil pay. The reservoir straddled the West Cape Three Points and Deepwater Tano Blocks and the field was later unitised and named ‗Jubilee‘ with Tullow becoming the operator. According to Kosmos, the Jubilee field has petroleum resources that range from 600Mboe to over 1Bboe. Tullow has already brought on stream Phase 1 (at a capital cost of around ~US$3.4bn) and expects 2012 production of between 70-90,000 barrels per day (Mbpd), ramping up to the FPSO capacity of 120Mbpd in 2013.
In March 2009 Tullow drilled the Tweneboa-1 exploration well in the Deepwater Tano Block, 25km east of the Jubilee field, intersecting 21m of net light oil pay. Several successful exploration/appraisal wells later, the TEN Project, as it is now known, is about to be formally declared commercial. Tullow estimates TEN Project resources are in the range 200-600MMbbl. Kosmos has made four further significant discoveries (Mahogany, Teak, Aksa and Banda) in the West Cape Three Points Block since 2007. Look at the ‗herd of elephants‘ in the Deep Water Tano licence to the east of the Jubilee field in Figure 9.
We believe that the reason the Jubilee field was overlooked before its discovery is that previously oil companies along the West African Transform Margin had mainly drilled tertiary structural traps as they were easier to identify on 2D seismic than deeper Cretaceous stratigraphic traps. The Jubilee field is a structural-stratigraphic trap (a large turbidite fan system in upper Cretaceous reservoir rocks).
The Jubilee play opening discovery
Many discoveries since around the Jubilee field

Sub-Saharan Oil and Gas October 2012 10
Figure 9: Tullow’s Acreage along West Africa’s Transform Margin
Source: Tullow Oil
Anadarko learnt from Jubilee‘s success, and in 2009 made the Venus discovery offshore Sierra Leone, some 1,100km away. The deep water exploration well encountered more than 45 net feet of hydrocarbon pay in Cretaceous rocks. This discovery de-risked the same type of play (deepwater late Cretaceous rocks in stratigraphic traps) in countries in between Ghana and Sierra Leone (Liberia, Cote d‘Ivoire). Indeed, in February 2012 African Petroleum also had success with this play in Block LB-09, Liberia. The Narina-1 well encountered 105 feet of net oil pay in two zones (Turonian and Albian reservoirs). Today, Kosmos is pursuing the same geologic theme as far north as Mauritania and Morocco.
Companies covered in this report that own licences where this type of play may prove successful include African Petroleum Corp, Ophir, FAR Ltd, Chariot, Rialto and Fastnet. We believe that Tangiers Petroleum could also potentially explore for this type of play, although this is not its current focus.
Jubilee stratigraphy
Anadarko learnt from Jubilee‘s success and made the Venus discovery 1,100km away in Sierra Leone
Companies in this report with exposure to this type of play are African Petroleum Corp, Ophir, FAR Ltd, Chariot and Fastnet

Sub-Saharan Oil and Gas October 2012 11
West Coast Central Pre-Salt
Following improvements in seismic technology it has become possible to view the strata below salt layers. Salt attenuates seismic waves and its structure often contains overhangs that are difficult to image. Improved computing power and the wide-azimuth towed streamer survey which was first tested in 2004 on the Mad Dog field, Gulf of Mexico, allow companies to better view sub-salt strata.
In 2006 BG discovered the giant pre-salt Tupi oil field in deepwater, offshore Brazil that Petrobras estimates has recoverable reserves of 5-8Bbbl. Following this and other giant pre-salt petroleum discoveries in Brazil, interest in African West Coast Central pre-salt potential has increased dramatically (the Brazilian and African tectonic plates were joined as part of Gondwana before moving apart in the early Cretaceous period and thus they share a similar geologic history).
We believe Cobalt is likely to have been the first company to have found a giant pre-salt reservoir in Africa. The results of the wireline evaluation programme on its Cameia-1 well (in Block 21, offshore Angola) confirmed the presence of a 1,200 foot gross continuous oil column and estimated that the net-to-gross pay ratio was 75%. The flow rate from the Drill Stem Test (DST), which was restricted by surface equipment and safety precautions, confirmed the presence of a very thick, continuous, high-quality reservoir saturated with light oil. The recent appraisal well confirmed a lower oil water contact and confirmed the aerial extent of the field.
Figure 10: Cobalt’s Cameia Discovery
Source: Cobalt International
The opening up of deep water pre-salt plays in Brazil has transformed the Brazilian oil industry. Both the scale of individual petroleum discoveries and the economic rent available from their development are enormous. Brazilian proven oil reserves have increased from 8.5Bbbl in 2001 to 15.1Bbbl at the end of 20112. We believe a similar transformation is possible offshore Angola, Gabon, Congo (Brazzaville) and DRC. However, the large upfront costs required to explore for deepwater pre-salt petroleum resources limits the ability of junior oil and gas companies to participate in this geological theme. Of the companies covered in this report, we believe that only Ophir has licences that could hold substantial pre-salt petroleum resources.
2 BP‘s 2012 statistical review of world energy
Cameia-1 Cameia-2
Improvements in seismic technology have made it possible to view the strata below salt layers
Tupi oil field (2006): the first pre-salt discovery in the world
Cobalt is likely to have been the first company to have found a giant pre-salt reservoir in Africa
Of companies covered in this report, only Ophir has licences that could hold substantial pre-salt petroleum resources
Sub-Saharan Oil and Gas October 2012 12
East Africa Rift Basins
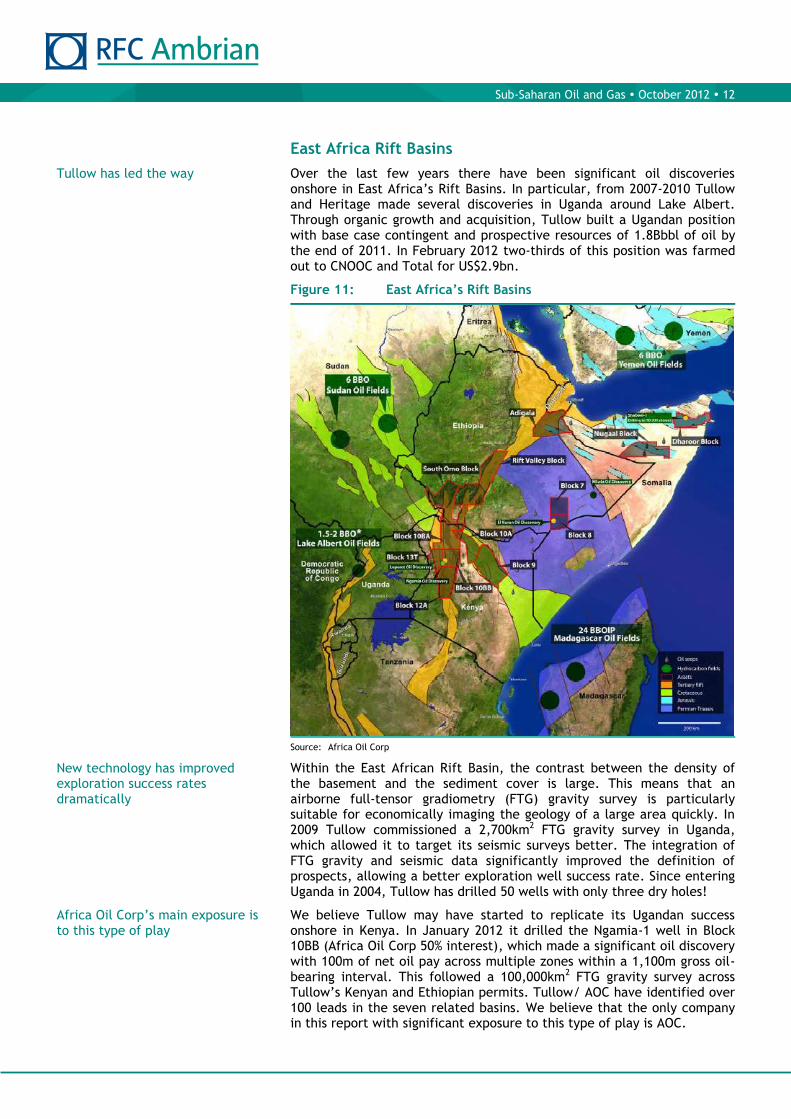
Over the last few years there have been significant oil discoveries onshore in East Africa‘s Rift Basins. In particular, from 2007-2010 Tullow and Heritage made several discoveries in Uganda around Lake Albert. Through organic growth and acquisition, Tullow built a Ugandan position with base case contingent and prospective resources of 1.8Bbbl of oil by the end of 2011. In February 2012 two-thirds of this position was farmed out to CNOOC and Total for US$2.9bn.
Figure 11: East Africa’s Rift Basins
Source: Africa Oil Corp
Within the East African Rift Basin, the contrast between the density of the basement and the sediment cover is large. This means that an airborne full-tensor gradiometry (FTG) gravity survey is particularly suitable for economically imaging the geology of a large area quickly. In 2009 Tullow commissioned a 2,700km2 FTG gravity survey in Uganda, which allowed it to target its seismic surveys better. The integration of FTG gravity and seismic data significantly improved the definition of prospects, allowing a better exploration well success rate. Since entering Uganda in 2004, Tullow has drilled 50 wells with only three dry holes!
We believe Tullow may have started to replicate its Ugandan success onshore in Kenya. In January 2012 it drilled the Ngamia-1 well in Block 10BB (Africa Oil Corp 50% interest), which made a significant oil discovery with 100m of net oil pay across multiple zones within a 1,100m gross oil-bearing interval. This followed a 100,000km2 FTG gravity survey across Tullow‘s Kenyan and Ethiopian permits. Tullow/ AOC have identified over 100 leads in the seven related basins. We believe that the only company in this report with significant exposure to this type of play is AOC.
Tullow has led the way
New technology has improved exploration success rates dramatically
Africa Oil Corp‘s main exposure is to this type of play

Sub-Saharan Oil and Gas October 2012 13
East Africa Coastal
Figure 12: Licences and Discoveries Offshore East Africa
Source: Ophir
Offshore East Africa has become a world-class gas province in the last couple of years. That there was gas offshore East Africa has been known since western oil majors performed some limited exploration in the 1960s. However, the scale of the resource was not appreciated, and with a limited local market for any gas discovered the majors moved on to what they perceived were more promising prospects. It was Anadarko that opened up the Rovuma Basin, offshore Mozambique, with its Windjammer discovery in February 2010. Pre-drill it estimated gas resources, if found, might be 0.1-3.8Tcf in an Oligocene toe thrust stratigraphic trap. Today, several discovery wells later, Anadarko has found two huge gas complexes with layered resources in Oligocene, Eocene and Paleocene basin fan systems: the Propseridade complex has estimated recoverable resources of 17-30Tcf of gas, while the Golfinho/Atum complex has estimated recoverable resources of 10-30Tcf of gas.
Anadarko has led the way in Mozambique

Sub-Saharan Oil and Gas October 2012 14
Anadarko‘s gas discoveries in Mozambique‘s Offshore Area 1 are not the only recent gas discoveries off the East Coast of Africa. ENI now estimates that Mozambique‘s Offshore Area 4 (adjacent to Area 1) has 70Tcf of gas in place. We estimate that between 60-100Tcf of recoverable gas resources have been discovered to date in Areas 1 & 4, offshore Mozambique.
Ophir/BG have made a string of ‗small‘ Tanzanian discoveries over the last two years. Ophir management estimates that total discovered gas-in-place resources to date are 13.5-21.0Tcf of gas. We estimate this equates to 10-15Tcf of recoverable gas resources. Statoil has not started to drill its two blocks (Areas 2 & 5) in Mozambique, but has ~9Tcf of gas-in-place at its Zafarani and Lavani discoveries in Block 2, Tanzania. Ophir/BG‘s discoveries have been from aerially restricted tertiary intra-slope channel systems rather than the aerially extensive tertiary amalgamated channel complexes/ basin floor fan systems in which Anadarko‘s and ENI‘s Mozambique discoveries have been made. It is quite possible that similar plays (and resource sizes?) to that found in Mozambique are waiting to be discovered in Tanzania! In 2Q12 BG/Ophir conducted a 3D seismic survey of the amalgamated channel complexes/ basin floor fan systems in Block 1. Once they have processed and interpreted the data they hope to drill a fan basin floor prospect in 2013.
Figure 13: Rovuma and Rufiji Delta Play Types
Source: Ophir Energy
Further north, offshore Kenya is also ‗hot‘, although there has only been one recent well drilled. Similar play types are possible, and notwithstanding Apache‘s recent Mbawa ‗non-commercial‘ gas discovery, we believe this region is likely to be more oil prone than further south.
The companies in this report with substantial exposure to this region are Ophir, FAR Ltd and Pancontinental.
Ophir discoveries
Anadarko discoveries
Followed by ENI…
… and then by Ophir and Statoil in Tanzania
Kenya is also ‗hot‘
Ophir, Pancontinental and FAR have exposure to this region

Sub-Saharan Oil and Gas October 2012 15
Regional Play Type Undiscovered Resources
So what is the potential of the four regional play types we have described above? Below we give the breakdown of the USGS estimate of Sub-Saharan Africa mean undiscovered prospective resources by main basin and product (oil, gas and NGLs). We would not overemphasise the exact numbers as the uncertainty in these estimates is high. While we quote the total estimated mean undiscovered oil resources at 115Bbbl of oil, the P5 and P95 estimates are 232Bbbl and 41Bbbl of oil respectively. Nevertheless, we believe the relative levels across the basins that are covered are probably about right. We also believe the numbers support our thesis on why Sub-Saharan exploration is so exciting for junior oil companies at present.
The first thing we note is that not all of Africa‘s prospective basins are included. In particular, there is no assessment of the East African Rift Basins that cover parts of Uganda, Kenya, Ethiopia, Tanzania, Mozambique, DRC and Zambia. We know that at the time of writing Tullow/Heritage have discovered hundreds of millions of barrels of oil in Uganda. Tullow now estimates that base case contingent and prospective resources of its Ugandan acreage are 1.8Bbbl of oil, with upside potential of >2Bbbl. In this respect we believe that the USGS is struggling to play ‗catch up‘ with fast moving events. African Oil Corp has substantial exposure to this type of play in Kenya and Ethiopia.
Unsurprisingly, Nigeria and Angola have the largest individual country estimated mean prospective undiscovered oil resources. However, they (plus Congo and the DRC) account for only ~43% of the Sub-Saharan total. Although Nigeria and Angola dominate current regional oil production (73%) and reserves (74%), undiscovered Sub-Saharan oil resources lie predominantly outside their territory. This is great news for junior oil and gas companies that struggle to compete with oil majors in these two countries. Nigeria and Angola are only bit players in the undiscovered gas stakes.
Simple adding of the mean undiscovered resources of East African Coastal countries Mozambique, Tanzania and Madagascar gives undiscovered resources of 24.6Bbbl of oil, 420.6Tcf of gas and 13.0Bbbl of NGLs. These are huge numbers (and include well over half of the estimated Sub-Saharan undiscovered gas resources), although the majority of the resources are estimated to be in Madagascar and Mozambique. Companies covered in this report only have licences offshore Tanzania (Ophir), Kenya (Ophir, FAR and Pancontinental) and the Seychelles (WHL Energy). The Seychelles has estimated gross mean prospective undiscovered resources of 2.4Bbbl of oil, 20.4Tcf of gas and 0.7Bbbl NGLs (ie, 37% oil on a boe basis vs. 17% in Tanzania and 25% in Mozambique and Madagascar). There is no assessment of Kenya‘s offshore resources.
Adding the mean prospective undiscovered resources along the North West African Coast from Mauritania to Benin gives undiscovered resources of 9.7Bbbl of oil, 76.8Tcf of gas and 2.4Bbbl of NGLs. So, quite a bit for African Petroleum, Ophir, FAR, Rialto and Chariot to play for then! Although not all of this will be in the type of late Cretaceous stratigraphic trap that we have highlighted, given the successes this year along this coast we wouldn‘t be surprised if the USGS increases its assessment of resources in this region in its next update.
East African Rift Basins missing
We estimate that Nigeria and Angola have less than 40% of undiscovered oil resources in the region despite dominating regional oil production
East African Coastal
North West African Coastal

Sub-Saharan Oil and Gas October 2012 16
The USGS estimates that the mean undiscovered pre-salt resources of Gabon, Equatorial Guinea and Cameroon are 7.6Bbbl of oil, 18.8Tcf of gas and 0.9Bbbl of NGLs, roughly equivalent to the total post-salt undiscovered resources offshore these countries. The USGS estimates that mean undiscovered post-salt resources of Gabon, Equatorial Guinea and Cameroon are 7.5Bbbl of oil, 16.2Tcf of gas and 0.5Bbbl of NGLs. Ophir has exposure to both the pre-salt and post-salt play type in Gabon. Angola‘s pre-salt undiscovered resources are included in the Kwanza-Namibe composite estimate, which also includes post-salt undiscovered resources.
The USGS estimates that mean undiscovered pre-salt resources of Namibia are 1.1Bbbl of oil, 27.8Tcf of gas and 0.7Bbbl of NGLs. Of companies covered in this report, Chariot and Pancontinental have licences here.
Table 4: Sub-Saharan Africa — Estimated Mean Undiscovered Prospective Petroleum Resources
Total Petroleum System (TPS) Main countries with resources in
Total Petroleum System Oil
(Bbbl) Gas (Tcf)
NGL (Bbbl)
Oil, Gas & NGL
(Bboe)
Senegal Coastal Province (Cretaceous-Tertiary Composite)
Mauritania, Senegal, The Gambia, Guinea Bissau and the AGC 2.4 18.7 0.6 6.0
West African Coastal (Cretaceous Composite)
Guinea, Sierra Leone and Liberia 3.2 23.6 0.7 7.9
Gulf of Guinea (Cretaceous Composite)
Cote d'Ivoire, Ghana, Togo and Benin 4.1 34.5 1.1 11.0
Niger Delta (Tertiary Composite: Agbada and Akata Reservoirs)
Nigeria 15.5 58.2 6.3 31.6
West Coast Central (Melania Gamba: Gabon pre-salt)
Cameroon, Equatorial Guinea and Gabon 7.6 18.8 0.9 11.6
West Coast Central (Cretaceous -Tertiary Composite: Gabon post-salt)
Cameroon, Equatorial Guinea and
Gabon 7.5 16.2 0.5 10.7
West Coast Central (Congo Delta Composite)
Congo (Brazzaville), DRC and Angola 12.9 18.2 0.9 16.8
West Coast Central (Kwanza-Namibe Composite)
Angola 21.7 22.6 0.6 26.1
Orange River Coastal (Cretaceous Composite)
Namibia 1.1 27.8 0.7 6.4
South Africa Coastal (Mesazoic Composite)
South Africa 2.1 36.0 1.1 9.2
Mozambique Coastal (Mesozoic Composite)
Mozambique 11.7 182.3 5.6 47.7
Tanzania Coastal (Mesozoic- Cenozoic Composite)
Tanzania 2.8 71.1 2.2 16.9
Morondava (Mesozoic Composite)
Madagascar 10.8 167.2 5.2 43.8
Seychelles Rifts (Moesozoic- Cenozoic Composite)
Seychelles 2.4 20.4 0.7 6.5
North Central Africa – Chad (Cretaceous-Tertiary Composite)
Chad and Niger 2.3 14.6 0.4 5.1
North Central Africa - Sud Province (Cretaceous-Cenozoic Composite)
Sudan, Chad and Central African Republic 7.3 13.2 0.4 9.9
Sub-Saharan Total 115.3 743.5 28.0 267.2
Source: USGS, RFC-Ambrian estimates
Pre-salt West Coast Central
Namibia

Sub-Saharan Oil and Gas October 2012 17
Valuation
We believe the best way to value these companies is to use a bottom-up risked net asset value (NAV) methodology, using consistent inputs (although this still requires a lot of judgement calls). We use such a process to estimate the current fair value of a stock and explain our methodology below. We have used scenario analysis to show graphically a range of outcomes bounded by what the stock price might be end-2013, should each company‘s work programme to end-2013 be ‗successful‘ or should it be a ‗failure‘. We outline the assumptions behind each scenario in the individual company sections. This, we believe, gives a sense of the possible outcomes for the stocks, although not their distribution which is incorporated in our fair value estimates. We consider that, based on their current fair values and risk reward profiles, all the companies covered in this report, except African Oil Corp, are good candidates to be included in a portfolio Sub-Saharan Explorers.
The valuation of exploration companies is hard because data is scarce and uncertainties are large. Peer valuation multiples are difficult to apply given that pure explorers do not currently have positive revenues, operating cashflow and earnings, and that they report risked resources in an inconsistent manner (and in many cases not at all or only for some of their licences). Not all acreage is equally valuable so peer metrics based on this are not that useful either, in our view.
Bottom-up Risked NAV Methodology
For each company we estimate the value of the interest (taking account of any announced farm-down or licence interest sale, whether completed or not, and less any government back-in rights) in:
discovered contingent and prospective resources, based on DCF modelling of their development, which is then risked;
prospect/lead resources that are due to be drilled as part of the company‘s work programme to end-2013, based on DCF modelling of their development, which is then risked;
other identified prospects in the company‘s portfolio based a DCF modelling their development, which is then heavily risked (see below);
material licences where no drilling is planned, or drilling is planned but no prospect information has been made available to the market, based on recent relevant transaction multiples (farm-out, asset sales & corporate acquisition);
30 June 2012 cash less administrative and work programme expenditure to end-2013, adjusting for any free carried interest and our estimate of cash that will be received from new equity/option issuance since that date; and
other value adjustments (see below).
We have estimated the net present value per barrel of oil equivalent (NAV/boe) for each identified prospect based on our understanding of the fiscal terms, capex and opex. Our models use an effective nominal 10% discount rate (actually our models run in real terms and use a real 7.5% discount rate). We use a flat real oil price of US$90/bbl (roughly equivalent to the three-year forward Brent price) and appropriate net-back gas prices. We have based our Asian delivered LNG CIF on our oil price forecast using 15% of the Brent oil price (at today‘s price of ~US$110/bbl this equates to US$16.5/Mcf). Thus, for our flat real US$90/bbl oil price we are assuming the delivered LNG CIF price is flat real US$13.50/Mcf.
Summary
DCF modelling of prospects

Sub-Saharan Oil and Gas October 2012 18
We then estimate East African, West African and Australian net-backs by subtracting our estimate of different gas liquefaction and transportation costs. This gives East African, West African, Australian and Moroccan net backs of flat real US$7.70/Mcf, US$7.70/Mcf, US$8.00/Mcf and US$7.50/Mcf respectively. We have generally used standardised models for different prospect sizes, adjusted for our estimate of different well costs for each prospect.
Figure 14: Real Historic and Assumed Commodity Prices
Source: FactSet, RFC Ambrian estimates
While we believe that the market understands that gas is generally worth a lot less than oil on a boe basis, the NAV10/bbl for different sized oil prospects in different jurisdictions vary far more widely than we believe is generally understood. We estimate that the NAV10/bbl for a 400MMbbl prospect offshore Morocco is ~US$20/bbl, while it is just ~US5/bbl for a 1,200MMbbl sub-salt prospect offshore Gabon. This variation derives from:
Different fiscal terms offered by different governments. In general, the more oil that has been recently discovered in a region the worse the terms. Thus, the terms of Production Sharing Contract (PSC) agreements negotiated with governments get worse/better over time depending on recent exploration success. Anecdotal evidence suggests that the contractor share of gross oil for the Jubilee field in Ghana is about ~50%, but that in new Ghanaian contracts that percentage is now only ~25%. Many governments have confidentiality clauses in their agreements that prevent the companies showing them to us (Morocco and Namibia are the main exceptions). Nonetheless, we have modelled the fiscal terms of the company‘s licences using what public data is available, management guidance and the gross contractor share of oil/ gas for each of Ophir‘s potential developments using data in the CPR attached to its prospectus.
-
20
40
60
80
100
120
140
160R
eal o
il &
Gas
Pri
ces
(US$
/bo
e -
MO
D)
Brent Brent Futures
Oil Assumption Gas (LNG CIF Japan)
Gas Assumption (LNG CIF Asia) Netback E & W Africa
Netback Aus.

Sub-Saharan Oil and Gas October 2012 19
Different prospect sizes. While the development of a larger prospect benefits from economies of scale, this is normally more than offset by the fiscal terms. The larger a prospect in a certain jurisdiction, the greater the total US$m NAV, but the lower the US$ NAV/bbl, as the ‗small‘ additional value is spread over a lot more barrels. This is because most PSCs involve sharing profit oil (oil that remains after royalty and cost oil have been subtracted) between the government and the contractor. The proportion a contractor gets is usually based on the production rate (or occasionally the cumulative production, or an R-Factor). As these metrics increase, the contractor share is reduced. Thus, the larger the prospect the greater the government‘s overall percentage take and the lower the contractor NAV/bbl.
Different water depths and (more importantly) variation in sub-surface depth to target reservoirs. Offshore well costs generally range from ~US$20m to ~US80m per well, excluding any appraisal and testing costs. Sub-salt wells can cost a lot more. Deep sub-surface wells cost a lot more than shallow sub-surface wells. Costs can make up a substantial proportion of development capital costs (they make up ~46% of the estimated development capex of Chariot‘s Delta-1 prospect); this affects the NAV of the development.
Risking
We have risked the NAV of already discovered resources by our estimate of the probability that the field is developed (Pd), taking into account the value of the project, its resilience to changing commodity prices and the company‘s funding situation. For each prospect that we have assumed will be drilled as part of the company‘s work programme, we have risked the potential development NAV using our estimate of the geological chance of successfully discovering commercial hydrocarbons (Pg), and our estimate of the probability that the field is developed (Pd), using the same criteria as above. For each identified prospect not included as part of the company‘s work programme to end-2013, we have calculated the Estimated Monetary Value (EMV) using the following formula:
[(Pg x NAV) - ({1-Pg} x well cost)] x Pd
In other words, we have multiplied geological chance of successfully discovering commercial hydrocarbons (Pg) by the reward on discovery (NAV), and subtracted the geological chance of failure (1-Pg) multiplied by the capital put at risk. Finally, we multiply the result of this subtraction by our estimate of the probability that the field is both drilled and developed (Pd).
For wells that are not part of the work programme, we have generally set the probability that the prospect is both drilled and developed (Pd) equal to the geological chance of success (Pg) of a similar well (the same type of play) that is due to be drilled in the same licence. This we believe reflects the vicious circle that companies move into when they drill an exploration well that fails. Similar prospects are risked more and it is less likely they are drilled and funding future similar wells is more problematic. Conversely, if an exploration well is a success, companies move into a virtuous circle as this de-risks other similar prospects in the licence, making the funding of future wells easier.
We have risked the NAV of prospects and already discovered resources

Sub-Saharan Oil and Gas October 2012 20
There is no publicly available prospect information on several of the licences in which companies in this report have an interest. Some of these licenses are valuable and material to the valuation of some of the companies. When this occurs we have used approximate US$/km2 multiples calculated for the most relevant recent transactions (either farm-ins, asset sales or corporate acquisitions) in ‗nearby‘ licences to estimate a fair value for these licences. Please see the Appendix for a table of these transactions and our estimate of the valuation put on the licences.
As we value the shares on a fully diluted basis, we estimate the cash that will be received on the exercising of any in-the-money options (whether or not they expire by end-2013). In the case of APCL we have assumed that the announced negotiations to sell a 20% stake in its Liberian licences are completed. We have adjusted the company‘s interest in the licence down accordingly, and added our estimate of the sale price. We estimate that AOC‘s free carry from its farm-down of Blocks 9 and 12A to Marathon will extend beyond the 2013 work programme. As we have adjusted the company interest for the farm-down, we add our estimate of the value of any unused free carry here.
Results
In Figure 15 below we have graphed the breakdown of our current fair value estimates as a percentage of each company‘s current share price. ‗Discoveries‘ is our estimate of the value of the company‘s current discovered resources. ‗Prospects‘ is our estimate of the value of the company‘s 4Q12/2013 work programme prospect plus other identified prospects. ‗Licences‘ is our estimate of the value of the company‘s licences where we did not have prospect information. Cash is our estimate of the company‘s cash and other value adjustments. The sum of the above components gives our company fair value as a percentage of the current share price. All of the companies look undervalued relative to our fair value estimate except African Oil Corp.
Figure 15: Fair Value as a Percentage of Current Share Price
Source: RFC Ambrian estimates
Material licences
Other value adjustments
All of the companies look undervalued relative to our fair value estimate except African Oil Corp

Sub-Saharan Oil and Gas October 2012 21
From this chart:
Ophir’s share price appears reasonably well underpinned by the value of its substantial gas discoveries offshore Kenya and Equatorial Guinea. We believe from the above chart that Ophir‘s work programme and other identified prospects still offer investors more upside than the current share price suggests.
African Oil Corp (AOC) appears overvalued given the risk that the rift basins of Kenya and Ethiopia will not prove as prolific as Uganda‘s Lake Albert Rift Basin.
African Petroleum Corp (APCL) is trading at roughly half our estimate of its fair value. We believe that the market is not attaching enough value to its Liberian discovery and nearby prospects. Also, funding concerns are overhanging this stock. Should the company complete the negotiations to sell 20% of its Liberian licences, and be successful with its Liberian appraisal wells, we believe a significant re-rating should occur.
Pancontinental trades ~10% below our estimate of its fair value. The operators of many of its licences do not allow prospect information to be released. Thus, we have had to value most of its licences using comparable farm-in multiples.
Chariot trades at roughly half our fair value estimate. We believe that the fair value of its Namibian prospects are worth more than its current market cap. When you add the cash, we believe the stock appears significantly undervalued.
Rialto is trading as if it is in distress in our view. This seems unfair given the likelihood of Rialto achieving a farm-out of its exploration acreage, even if it is not on the terms management is aiming for. Funding of the Gazelle development is a concern, but we believe it doesn‘t warrant the current discount to our fair value.
FAR trades at roughly half our fair value estimate. This estimate depends on successful farm-outs of its Senegalese and Kenyan L6 licences. While successful farm-outs are not certain, we believe the market is discounting too much risk.
Fastnet’s fair value depends on the successful farm-out of its Moroccan Foum Assaka licence. Again, while a successful farm out is not certain, we believe the market is discounting too much risk.
WHL trades at a 34% discount to our estimate of its fair value. We estimate that roughly one-third of its current share price is underpinned by its La Bella discovery in Australia. Most of the rest is made up of our valuation of its Seychelles licences.
Tangiers trades at one-third our fair value estimate. We believe that the market is being far more sceptical about management‘s ability to farm out its Moroccan and Australian licences. We risked the farm-outs at 50%, so the market seems to be assuming its chance of success is ~20%. This is far too low in our view.
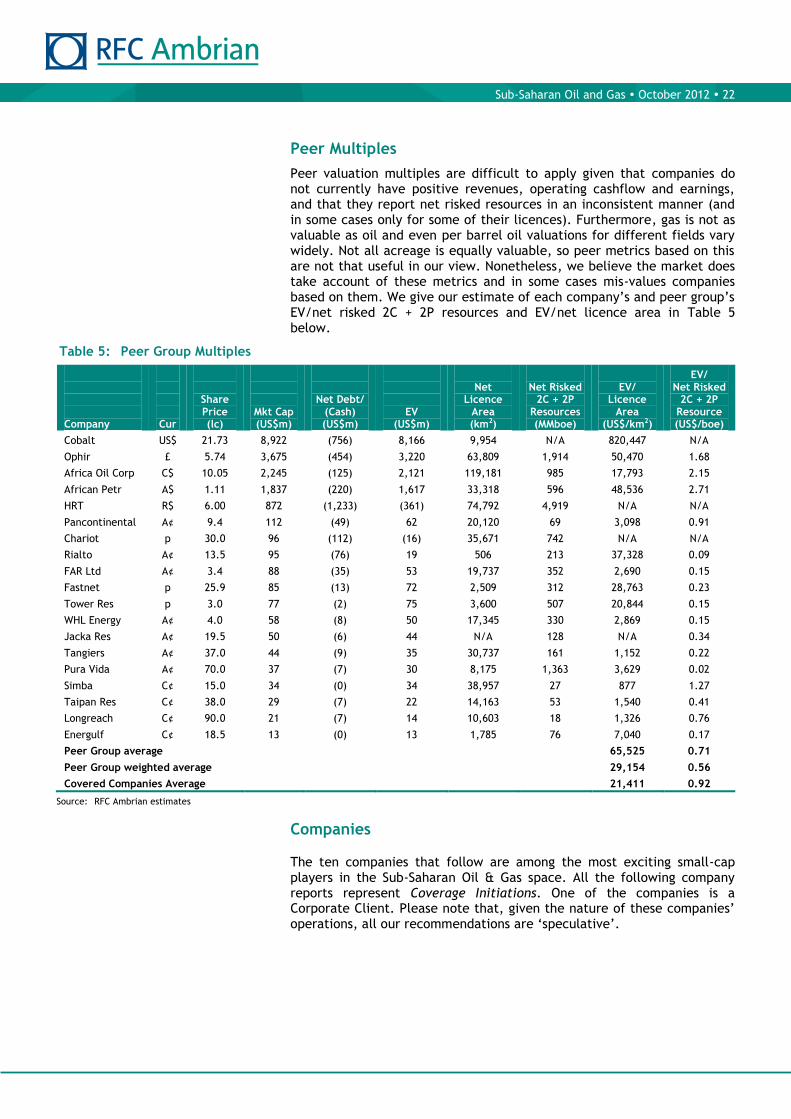
Sub-Saharan Oil and Gas October 2012 22
Peer Multiples
Peer valuation multiples are difficult to apply given that companies do not currently have positive revenues, operating cashflow and earnings, and that they report net risked resources in an inconsistent manner (and in some cases only for some of their licences). Furthermore, gas is not as valuable as oil and even per barrel oil valuations for different fields vary widely. Not all acreage is equally valuable, so peer metrics based on this are not that useful in our view. Nonetheless, we believe the market does take account of these metrics and in some cases mis-values companies based on them. We give our estimate of each company‘s and peer group‘s EV/net risked 2C + 2P resources and EV/net licence area in Table 5 below.
Table 5: Peer Group Multiples
Company
Cur
Share Price (lc)
Mkt Cap (US$m)
Net Debt/ (Cash) (US$m)
EV (US$m)
Net
Licence Area (km2)
Net Risked
2C + 2P Resources (MMboe)
EV/
Licence Area
(US$/km2)
EV/ Net Risked
2C + 2P Resource (US$/boe)
Cobalt US$ 21.73 8,922 (756) 8,166 9,954 N/A 820,447 N/A
Ophir £ 5.74 3,675 (454) 3,220 63,809 1,914 50,470 1.68
Africa Oil Corp C$ 10.05 2,245 (125) 2,121 119,181 985 17,793 2.15
African Petr A$ 1.11 1,837 (220) 1,617 33,318 596 48,536 2.71
HRT R$ 6.00 872 (1,233) (361) 74,792 4,919 N/A N/A
Pancontinental A¢ 9.4 112 (49) 62 20,120 69 3,098 0.91
Chariot p 30.0 96 (112) (16) 35,671 742 N/A N/A
Rialto A¢ 13.5 95 (76) 19 506 213 37,328 0.09
FAR Ltd A¢ 3.4 88 (35) 53 19,737 352 2,690 0.15
Fastnet p 25.9 85 (13) 72 2,509 312 28,763 0.23
Tower Res p 3.0 77 (2) 75 3,600 507 20,844 0.15
WHL Energy A¢ 4.0 58 (8) 50 17,345 330 2,869 0.15
Jacka Res A¢ 19.5 50 (6) 44 N/A 128 N/A 0.34
Tangiers A¢ 37.0 44 (9) 35 30,737 161 1,152 0.22
Pura Vida A¢ 70.0 37 (7) 30 8,175 1,363 3,629 0.02
Simba C¢ 15.0 34 (0) 34 38,957 27 877 1.27
Taipan Res C¢ 38.0 29 (7) 22 14,163 53 1,540 0.41
Longreach C¢ 90.0 21 (7) 14 10,603 18 1,326 0.76
Energulf C¢ 18.5 13 (0) 13 1,785 76 7,040 0.17
Peer Group average 65,525 0.71
Peer Group weighted average 29,154 0.56
Covered Companies Average 21,411 0.92
Source: RFC Ambrian estimates
Companies
The ten companies that follow are among the most exciting small-cap players in the Sub-Saharan Oil & Gas space. All the following company reports represent Coverage Initiations. One of the companies is a Corporate Client. Please note that, given the nature of these companies‘ operations, all our recommendations are ‗speculative‘.