Sub-Saharan Africa: Factors Affecting Trade Patterns of Selected ...
286
Transcript of Sub-Saharan Africa: Factors Affecting Trade Patterns of Selected ...
U.S. International Trade Commission
Address all communications toSecretary to the Commission
United States International Trade CommissionWashington, DC 20436
COMMISSIONERS
Irving A. Williamson
Deanna Tanner Okun
Robert A. RogowskyDirector of Operations
Karen Laney-CummingsDirector, Office of Industries
Charlotte R. Lane
Daniel R. Pearson, Chairman
Dean A. Pinkert
Shara L. Aranoff, Vice Chairman
U.S. International Trade CommissionWashington, DC 20436
Publication 3989 April 2008
www.usitc.gov
Sub-Saharan Africa:Factors Affecting Trade Patterns
of Selected Industries
Second Annual Report
Investigation No. 332--477
This report was prepared principally by the Office of Industries
Project LeaderFalan Yinug
Deputy Project LeaderJames Fetzer
Andrea Boron, Gail Burns, Ray Cantrell, Jonathan Coleman, Daniel Cook, Alfred Dennis,Erland Herfindahl, Brendan Lynch, Erick Oh, Laura Rodriguez, Mark Simone, and Ralph Watkins
Primary ReviewersNannette Christ and Cathy Jabara
Office of EconomicsKyle Johnson
Administrative SupportPhyllis Boone, Monica Reed, and Wanda Tolson
Special AssistanceDavid Lundy, Cynthia Payne, and Laura Polly
Under the direction ofMichael Anderson, Chief
Advanced Technology and Machinery Division
i
Abstract
his report examines factors that contributed to the shift in global export patterns in sub-Saharan Africa (SSA) during 2002–06 for 11 industries: coffee; shea butter; spices (primarily vanilla, cloves, pepper, and ginger);
tropical fruit (primarily bananas and pineapples); footwear; natural rubber; processed diamonds; textiles; wood furniture; aviation services; and communication services. The value of global SSA exports increased in nine of the 11 industries during 2002–06, ranging from a 12 percent increase in the value of textile exports to a 262 percent increase in the value of natural rubber exports. For the most part, the nine industries benefited from three common factors: (1) increased global prices as a result of demand growth exceeding supply growth; (2) investment in new and expanded production capacity; and (3) implementation of policies and programs to promote industrial development, whether targeted to a specific industry or applied generally to all industries. Other factors that contributed to the development of these industries and facilitated export growth include: (4) growth of private enterprise and emergence of key business relationships; (5) infrastructural improvements; (6) deeper regional integration; (7) improved product quality; (8) liberalized market regulations; (9) effects of tariff preferences; (10) improved industry organization; and (11) product differentiation. The value of global SSA exports declined for three of the selected industries during 2002–06: spices, wood furniture, and the pineapples sector of tropical fruit, industries which experienced decreases of 47, 46, and 5 percent, respectively. Factors contributing to decreased export values or mitigating export growth included; (1) increased competition in key markets; (2) low crop yield due to weather; (3) political instability; (4) overproduction; (5) effects of exchange rate changes; (6) reduced resource supply; (7) and increased local demand. The change in volume of global SSA exports for most industries varied, ranging from a 28 percent decrease for pineapples to a 15 percent increase for natural rubber, with an exceptionally large increase for shea butter of 660 percent.
T

iii
CONTENTSPage
Abstract . . . . . . . . . . . . . . . . . . . . . . . . . . . . . . . . . . . . . . . . . . . . . . . . . . . . . . . . . . . . . . . i
Executive Summary . . . . . . . . . . . . . . . . . . . . . . . . . . . . . . . . . . . . . . . . . . . . . . . xiii
Chapter 1 Introduction and Overview . . . . . . . . . . . . . . . . . . . . . . 1-1
Industry and country coverage . . . . . . . . . . . . . . . . . . . . . . . . . . . . . . . . . . . . . . . . . . . . 1-1Information used in the report . . . . . . . . . . . . . . . . . . . . . . . . . . . . . . . . . . . . . . . . . . . . . 1-2Approach . . . . . . . . . . . . . . . . . . . . . . . . . . . . . . . . . . . . . . . . . . . . . . . . . . . . . . . . . . . . . 1-3Organization of report . . . . . . . . . . . . . . . . . . . . . . . . . . . . . . . . . . . . . . . . . . . . . . . . . . . 1-3Overview of SSA sector export trade . . . . . . . . . . . . . . . . . . . . . . . . . . . . . . . . . . . . . . . 1-4
Agriculture . . . . . . . . . . . . . . . . . . . . . . . . . . . . . . . . . . . . . . . . . . . . . . . . . . . . . . . . . 1-5Mining and manufacturing . . . . . . . . . . . . . . . . . . . . . . . . . . . . . . . . . . . . . . . . . . . . . 1-6Services . . . . . . . . . . . . . . . . . . . . . . . . . . . . . . . . . . . . . . . . . . . . . . . . . . . . . . . . . . . 1-6
Chapter 2 Agricultural and Fisheries Sector Profiles . . 2-1
Coffee . . . . . . . . . . . . . . . . . . . . . . . . . . . . . . . . . . . . . . . . . . . . . . . . . . . . . . . . . . . . . . . 2-2Summary of findings . . . . . . . . . . . . . . . . . . . . . . . . . . . . . . . . . . . . . . . . . . . . . . . . . 2-2Industry overview . . . . . . . . . . . . . . . . . . . . . . . . . . . . . . . . . . . . . . . . . . . . . . . . . . . 2-4
Ethiopia . . . . . . . . . . . . . . . . . . . . . . . . . . . . . . . . . . . . . . . . . . . . . . . . . . . . . . . . . 2-5Kenya . . . . . . . . . . . . . . . . . . . . . . . . . . . . . . . . . . . . . . . . . . . . . . . . . . . . . . . . . . . 2-6Uganda . . . . . . . . . . . . . . . . . . . . . . . . . . . . . . . . . . . . . . . . . . . . . . . . . . . . . . . . . . 2-6Côte d’Ivoire . . . . . . . . . . . . . . . . . . . . . . . . . . . . . . . . . . . . . . . . . . . . . . . . . . . . . 2-7Tanzania . . . . . . . . . . . . . . . . . . . . . . . . . . . . . . . . . . . . . . . . . . . . . . . . . . . . . . . . 2-7Rwanda . . . . . . . . . . . . . . . . . . . . . . . . . . . . . . . . . . . . . . . . . . . . . . . . . . . . . . . . . 2-8
Sub-Saharan Africa trade in the global context . . . . . . . . . . . . . . . . . . . . . . . . . . . . . 2-8Leading exporters . . . . . . . . . . . . . . . . . . . . . . . . . . . . . . . . . . . . . . . . . . . . . . . . . 2-8Leading export markets . . . . . . . . . . . . . . . . . . . . . . . . . . . . . . . . . . . . . . . . . . . . 2-9
Factors affecting export patterns . . . . . . . . . . . . . . . . . . . . . . . . . . . . . . . . . . . . . . . . 2-10Price increases and demand growth . . . . . . . . . . . . . . . . . . . . . . . . . . . . . . . . . . . . 2-11Ongoing liberalization of SSA coffee sectors . . . . . . . . . . . . . . . . . . . . . . . . . . . . 2-12
Ethiopia . . . . . . . . . . . . . . . . . . . . . . . . . . . . . . . . . . . . . . . . . . . . . . . . . . . . . . . 2-12Kenya . . . . . . . . . . . . . . . . . . . . . . . . . . . . . . . . . . . . . . . . . . . . . . . . . . . . . . . . . 2-13Côte d’Ivoire . . . . . . . . . . . . . . . . . . . . . . . . . . . . . . . . . . . . . . . . . . . . . . . . . . . 2-13Tanzania . . . . . . . . . . . . . . . . . . . . . . . . . . . . . . . . . . . . . . . . . . . . . . . . . . . . . . 2-13
Success in differentiating coffee from a homogenous commodity . . . . . . . . . . . . 2-14Shea butter . . . . . . . . . . . . . . . . . . . . . . . . . . . . . . . . . . . . . . . . . . . . . . . . . . . . . . . . . . . 2-19
Summary of findings . . . . . . . . . . . . . . . . . . . . . . . . . . . . . . . . . . . . . . . . . . . . . . . . . 2-19Industry overview . . . . . . . . . . . . . . . . . . . . . . . . . . . . . . . . . . . . . . . . . . . . . . . . . . . 2-19
iv
CONTENTS–ContinuedPage
Chapter 2 Agricultural and Fisheries SectorProfiles—ContinuedShea butter—Continued
Sub-Saharan Africa trade in the global context . . . . . . . . . . . . . . . . . . . . . . . . . . . . . . 2-23Leading exporters . . . . . . . . . . . . . . . . . . . . . . . . . . . . . . . . . . . . . . . . . . . . . . . . . . 2-24Leading export markets . . . . . . . . . . . . . . . . . . . . . . . . . . . . . . . . . . . . . . . . . . . . . . 2-28
Factors affecting export patterns . . . . . . . . . . . . . . . . . . . . . . . . . . . . . . . . . . . . . . . . . 2-28Rising cocoa butter equivalent demand . . . . . . . . . . . . . . . . . . . . . . . . . . . . . . . . . . 2-29Increased prices . . . . . . . . . . . . . . . . . . . . . . . . . . . . . . . . . . . . . . . . . . . . . . . . . . . . 2-29Growing consumer awareness . . . . . . . . . . . . . . . . . . . . . . . . . . . . . . . . . . . . . . . . . 2-30Training/funding for improved production . . . . . . . . . . . . . . . . . . . . . . . . . . . . . . . 2-31Increased private sector investment . . . . . . . . . . . . . . . . . . . . . . . . . . . . . . . . . . . . . 2-31
Spices . . . . . . . . . . . . . . . . . . . . . . . . . . . . . . . . . . . . . . . . . . . . . . . . . . . . . . . . . . . . . . . . 2-35Summary of findings . . . . . . . . . . . . . . . . . . . . . . . . . . . . . . . . . . . . . . . . . . . . . . . . . . 2-35Industry overview . . . . . . . . . . . . . . . . . . . . . . . . . . . . . . . . . . . . . . . . . . . . . . . . . . . . 2-35Sub-Saharan Africa trade in the global context . . . . . . . . . . . . . . . . . . . . . . . . . . . . . . 2-38
Leading exporters . . . . . . . . . . . . . . . . . . . . . . . . . . . . . . . . . . . . . . . . . . . . . . . . . . 2-39Vanilla . . . . . . . . . . . . . . . . . . . . . . . . . . . . . . . . . . . . . . . . . . . . . . . . . . . . . . . . . 2-39Cloves . . . . . . . . . . . . . . . . . . . . . . . . . . . . . . . . . . . . . . . . . . . . . . . . . . . . . . . . . 2-39Pepper . . . . . . . . . . . . . . . . . . . . . . . . . . . . . . . . . . . . . . . . . . . . . . . . . . . . . . . . . 2-40Ginger . . . . . . . . . . . . . . . . . . . . . . . . . . . . . . . . . . . . . . . . . . . . . . . . . . . . . . . . . 2-41
Leading export markets . . . . . . . . . . . . . . . . . . . . . . . . . . . . . . . . . . . . . . . . . . . . . . 2-41Vanilla . . . . . . . . . . . . . . . . . . . . . . . . . . . . . . . . . . . . . . . . . . . . . . . . . . . . . . . . . 2-42Cloves . . . . . . . . . . . . . . . . . . . . . . . . . . . . . . . . . . . . . . . . . . . . . . . . . . . . . . . . . 2-42Pepper . . . . . . . . . . . . . . . . . . . . . . . . . . . . . . . . . . . . . . . . . . . . . . . . . . . . . . . . . 2-42Ginger . . . . . . . . . . . . . . . . . . . . . . . . . . . . . . . . . . . . . . . . . . . . . . . . . . . . . . . . . 2-42
Factors affecting export patterns . . . . . . . . . . . . . . . . . . . . . . . . . . . . . . . . . . . . . . . . . 2-43Production and price instability . . . . . . . . . . . . . . . . . . . . . . . . . . . . . . . . . . . . . . . . 2-43Growing global demand . . . . . . . . . . . . . . . . . . . . . . . . . . . . . . . . . . . . . . . . . . . . . 2-44Programs to promote production and investment . . . . . . . . . . . . . . . . . . . . . . . . . . 2-44Political unrest . . . . . . . . . . . . . . . . . . . . . . . . . . . . . . . . . . . . . . . . . . . . . . . . . . . . . 2-45
Tropical fruit . . . . . . . . . . . . . . . . . . . . . . . . . . . . . . . . . . . . . . . . . . . . . . . . . . . . . . . . . . . 2-48Summary of findings . . . . . . . . . . . . . . . . . . . . . . . . . . . . . . . . . . . . . . . . . . . . . . . . . . 2-48Industry overview . . . . . . . . . . . . . . . . . . . . . . . . . . . . . . . . . . . . . . . . . . . . . . . . . . . . 2-49
Bananas . . . . . . . . . . . . . . . . . . . . . . . . . . . . . . . . . . . . . . . . . . . . . . . . . . . . . . . . . . 2-51Pineapples . . . . . . . . . . . . . . . . . . . . . . . . . . . . . . . . . . . . . . . . . . . . . . . . . . . . . . . . 2-52
Sub-Saharan Africa trade in the global context . . . . . . . . . . . . . . . . . . . . . . . . . . . . . . 2-53Bananas . . . . . . . . . . . . . . . . . . . . . . . . . . . . . . . . . . . . . . . . . . . . . . . . . . . . . . . . . . 2-53Pineapples . . . . . . . . . . . . . . . . . . . . . . . . . . . . . . . . . . . . . . . . . . . . . . . . . . . . . . . . 2-54Leading exporters . . . . . . . . . . . . . . . . . . . . . . . . . . . . . . . . . . . . . . . . . . . . . . . . . . 2-55
Bananas . . . . . . . . . . . . . . . . . . . . . . . . . . . . . . . . . . . . . . . . . . . . . . . . . . . . . . . . 2-55Pineapples . . . . . . . . . . . . . . . . . . . . . . . . . . . . . . . . . . . . . . . . . . . . . . . . . . . . . . 2-56
v
CONTENTS—ContinuedPage
Chapter 2 Agricultural and Fisheries SectorProfiles—ContinuedTropical fruit—Continued
Leading export markets . . . . . . . . . . . . . . . . . . . . . . . . . . . . . . . . . . . . . . . . . . . . . . 2-57Factors affecting export patterns . . . . . . . . . . . . . . . . . . . . . . . . . . . . . . . . . . . . . . . . . 2-60
Demand growth for bananas and pineapples . . . . . . . . . . . . . . . . . . . . . . . . . . . . . . 2-61Bananas . . . . . . . . . . . . . . . . . . . . . . . . . . . . . . . . . . . . . . . . . . . . . . . . . . . . . . . . 2-61Pineapples . . . . . . . . . . . . . . . . . . . . . . . . . . . . . . . . . . . . . . . . . . . . . . . . . . . . . . 2-61
Development of new pineapple variety . . . . . . . . . . . . . . . . . . . . . . . . . . . . . . . . . . 2-61Increased foreign investment . . . . . . . . . . . . . . . . . . . . . . . . . . . . . . . . . . . . . . . . . . 2-62Price increases for bananas . . . . . . . . . . . . . . . . . . . . . . . . . . . . . . . . . . . . . . . . . . . 2-62Assistance to SSA from international aid programs . . . . . . . . . . . . . . . . . . . . . . . . 2-64The development of industry organizations and government support
institutions . . . . . . . . . . . . . . . . . . . . . . . . . . . . . . . . . . . . . . . . . . . . . . . . . . . . . . 2-64Country profiles . . . . . . . . . . . . . . . . . . . . . . . . . . . . . . . . . . . . . . . . . . . . . . . . . . . . 2-65
Côte d’Ivoire . . . . . . . . . . . . . . . . . . . . . . . . . . . . . . . . . . . . . . . . . . . . . . . . . . . . 2-65Ghana . . . . . . . . . . . . . . . . . . . . . . . . . . . . . . . . . . . . . . . . . . . . . . . . . . . . . . . . . . 2-67Cameroon . . . . . . . . . . . . . . . . . . . . . . . . . . . . . . . . . . . . . . . . . . . . . . . . . . . . . . 2-70
Chapter 3 Mining and Manufacturing IndustrySector Profiles . . . . . . . . . . . . . . . . . . . . . . . . . . . . . . . . . . . . . . . . . . . . . . . . . 3-1
Footwear . . . . . . . . . . . . . . . . . . . . . . . . . . . . . . . . . . . . . . . . . . . . . . . . . . . . . . . . . . . . . . 3-2Summary of findings . . . . . . . . . . . . . . . . . . . . . . . . . . . . . . . . . . . . . . . . . . . . . . . . . . 3-2Industry overview . . . . . . . . . . . . . . . . . . . . . . . . . . . . . . . . . . . . . . . . . . . . . . . . . . . . . 3-2Sub-Saharan Africa trade in the global context . . . . . . . . . . . . . . . . . . . . . . . . . . . . . . 3-5
Leading exporters . . . . . . . . . . . . . . . . . . . . . . . . . . . . . . . . . . . . . . . . . . . . . . . . . . 3-6Leading export markets . . . . . . . . . . . . . . . . . . . . . . . . . . . . . . . . . . . . . . . . . . . . . . 3-7
Factors affecting export patterns . . . . . . . . . . . . . . . . . . . . . . . . . . . . . . . . . . . . . . . . . 3-8Policies and programs to promote the footwear industry . . . . . . . . . . . . . . . . . . . . 3-8
Kenya . . . . . . . . . . . . . . . . . . . . . . . . . . . . . . . . . . . . . . . . . . . . . . . . . . . . . . . . . . 3-8Ethiopia . . . . . . . . . . . . . . . . . . . . . . . . . . . . . . . . . . . . . . . . . . . . . . . . . . . . . . . . 3-9
Deeper regional integration . . . . . . . . . . . . . . . . . . . . . . . . . . . . . . . . . . . . . . . . . . . 3-10Growth of private enterprise in Ethiopia and the development of partnerships
with the European footwear industry . . . . . . . . . . . . . . . . . . . . . . . . . . . . . . . . . . 3-11Impact of AGOA preferences on South African exports . . . . . . . . . . . . . . . . . . . . . 3-12
Natural rubber . . . . . . . . . . . . . . . . . . . . . . . . . . . . . . . . . . . . . . . . . . . . . . . . . . . . . . . . . . 3-17Summary of findings . . . . . . . . . . . . . . . . . . . . . . . . . . . . . . . . . . . . . . . . . . . . . . . . . . 3-17Industry overview . . . . . . . . . . . . . . . . . . . . . . . . . . . . . . . . . . . . . . . . . . . . . . . . . . . . . 3-17
Profiles of leading SSA NR producers . . . . . . . . . . . . . . . . . . . . . . . . . . . . . . . . . . 3-20Côte d’Ivoire . . . . . . . . . . . . . . . . . . . . . . . . . . . . . . . . . . . . . . . . . . . . . . . . . . . . 3-20
vi
CONTENTS—ContinuedPage
Chapter 3 Mining and Manufacturing IndustrySector Profiles—ContinuedNatural rubber—Continued
Liberia . . . . . . . . . . . . . . . . . . . . . . . . . . . . . . . . . . . . . . . . . . . . . . . . . . . . . . . . . 3-20Cameroon . . . . . . . . . . . . . . . . . . . . . . . . . . . . . . . . . . . . . . . . . . . . . . . . . . . . . . 3-21Nigeria . . . . . . . . . . . . . . . . . . . . . . . . . . . . . . . . . . . . . . . . . . . . . . . . . . . . . . . . . 3-21Ghana . . . . . . . . . . . . . . . . . . . . . . . . . . . . . . . . . . . . . . . . . . . . . . . . . . . . . . . . . . 3-22Guinea . . . . . . . . . . . . . . . . . . . . . . . . . . . . . . . . . . . . . . . . . . . . . . . . . . . . . . . . . 3-22Democratic Republic of the Congo (DRC) . . . . . . . . . . . . . . . . . . . . . . . . . . . . . 3-23Gabon . . . . . . . . . . . . . . . . . . . . . . . . . . . . . . . . . . . . . . . . . . . . . . . . . . . . . . . . . 3-23
Proposals to promote the industry and increases investment in the future . . . . . . . 3-24Sub-Saharan Africa trade in the global context . . . . . . . . . . . . . . . . . . . . . . . . . . . . . . 3-24
Leading exporters . . . . . . . . . . . . . . . . . . . . . . . . . . . . . . . . . . . . . . . . . . . . . . . . . . 3-24Leading export markets . . . . . . . . . . . . . . . . . . . . . . . . . . . . . . . . . . . . . . . . . . . . . . 3-25
Factors affecting export patterns . . . . . . . . . . . . . . . . . . . . . . . . . . . . . . . . . . . . . . . . . 3-26Demand growth . . . . . . . . . . . . . . . . . . . . . . . . . . . . . . . . . . . . . . . . . . . . . . . . . . . . 3-26Inadequate infrastructure and political instability in SSA countries supplying
NR . . . . . . . . . . . . . . . . . . . . . . . . . . . . . . . . . . . . . . . . . . . . . . . . . . . . . . . . . . . . 3-27Processed diamonds . . . . . . . . . . . . . . . . . . . . . . . . . . . . . . . . . . . . . . . . . . . . . . . . . . . . . 3-30
Summary of findings . . . . . . . . . . . . . . . . . . . . . . . . . . . . . . . . . . . . . . . . . . . . . . . . . . 3-30Industry overview . . . . . . . . . . . . . . . . . . . . . . . . . . . . . . . . . . . . . . . . . . . . . . . . . . . . . 3-30Sub-Saharan Africa trade in the global context . . . . . . . . . . . . . . . . . . . . . . . . . . . . . . 3-34
Leading exporters . . . . . . . . . . . . . . . . . . . . . . . . . . . . . . . . . . . . . . . . . . . . . . . . . . 3-34Leading export markets . . . . . . . . . . . . . . . . . . . . . . . . . . . . . . . . . . . . . . . . . . . . . . 3-35
Factors affecting export patterns . . . . . . . . . . . . . . . . . . . . . . . . . . . . . . . . . . . . . . . . . 3-36Global price increases . . . . . . . . . . . . . . . . . . . . . . . . . . . . . . . . . . . . . . . . . . . . . . . 3-36Beneficiation investment and policy . . . . . . . . . . . . . . . . . . . . . . . . . . . . . . . . . . . . 3-37
Angola . . . . . . . . . . . . . . . . . . . . . . . . . . . . . . . . . . . . . . . . . . . . . . . . . . . . . . . . . 3-37Botswana . . . . . . . . . . . . . . . . . . . . . . . . . . . . . . . . . . . . . . . . . . . . . . . . . . . . . . . 3-37Namibia . . . . . . . . . . . . . . . . . . . . . . . . . . . . . . . . . . . . . . . . . . . . . . . . . . . . . . . . 3-38South Africa . . . . . . . . . . . . . . . . . . . . . . . . . . . . . . . . . . . . . . . . . . . . . . . . . . . . 3-39Other efforts to facilitate SSA beneficiation . . . . . . . . . . . . . . . . . . . . . . . . . . . . 3-39
Textiles . . . . . . . . . . . . . . . . . . . . . . . . . . . . . . . . . . . . . . . . . . . . . . . . . . . . . . . . . . . . . . . 3-43Summary of findings . . . . . . . . . . . . . . . . . . . . . . . . . . . . . . . . . . . . . . . . . . . . . . . . . . 3-43Industry overview . . . . . . . . . . . . . . . . . . . . . . . . . . . . . . . . . . . . . . . . . . . . . . . . . . . . . 3-45Sub-Saharan Africa trade in the global context . . . . . . . . . . . . . . . . . . . . . . . . . . . . . . 3-46
Leading exporters . . . . . . . . . . . . . . . . . . . . . . . . . . . . . . . . . . . . . . . . . . . . . . . . . . 3-47Leading export markets . . . . . . . . . . . . . . . . . . . . . . . . . . . . . . . . . . . . . . . . . . . . . . 3-48
Factors affecting export patterns . . . . . . . . . . . . . . . . . . . . . . . . . . . . . . . . . . . . . . . . . 3-49Deeper regional integration . . . . . . . . . . . . . . . . . . . . . . . . . . . . . . . . . . . . . . . . . . . 3-50Foreign investment . . . . . . . . . . . . . . . . . . . . . . . . . . . . . . . . . . . . . . . . . . . . . . . . . 3-50
Ethiopia . . . . . . . . . . . . . . . . . . . . . . . . . . . . . . . . . . . . . . . . . . . . . . . . . . . . . . . . 3-51
vii
CONTENTS—ContinuedPage
Chapter 3 Mining and Manufacturing IndustrySector Profiles—ContinuedTextiles—Continued
Kenya . . . . . . . . . . . . . . . . . . . . . . . . . . . . . . . . . . . . . . . . . . . . . . . . . . . . . . . . . . 3-51Lesotho . . . . . . . . . . . . . . . . . . . . . . . . . . . . . . . . . . . . . . . . . . . . . . . . . . . . . . . . 3-51Mauritius . . . . . . . . . . . . . . . . . . . . . . . . . . . . . . . . . . . . . . . . . . . . . . . . . . . . . . . 3-51Tanzania . . . . . . . . . . . . . . . . . . . . . . . . . . . . . . . . . . . . . . . . . . . . . . . . . . . . . . . 3-52
Policies to promote the industry and other country-specific factors . . . . . . . . . . . . 3-52Mauritius . . . . . . . . . . . . . . . . . . . . . . . . . . . . . . . . . . . . . . . . . . . . . . . . . . . . . . . 3-52Kenya . . . . . . . . . . . . . . . . . . . . . . . . . . . . . . . . . . . . . . . . . . . . . . . . . . . . . . . . . . 3-53Lesotho . . . . . . . . . . . . . . . . . . . . . . . . . . . . . . . . . . . . . . . . . . . . . . . . . . . . . . . . 3-53Ethiopia . . . . . . . . . . . . . . . . . . . . . . . . . . . . . . . . . . . . . . . . . . . . . . . . . . . . . . . . 3-53
Wood furniture . . . . . . . . . . . . . . . . . . . . . . . . . . . . . . . . . . . . . . . . . . . . . . . . . . . . . . . . . 3-56Summary of findings . . . . . . . . . . . . . . . . . . . . . . . . . . . . . . . . . . . . . . . . . . . . . . . . . . 3-56Industry overview . . . . . . . . . . . . . . . . . . . . . . . . . . . . . . . . . . . . . . . . . . . . . . . . . . . . . 3-57Sub-Saharan Africa trade in the global context . . . . . . . . . . . . . . . . . . . . . . . . . . . . . . 3-59
Leading exporters . . . . . . . . . . . . . . . . . . . . . . . . . . . . . . . . . . . . . . . . . . . . . . . . . . 3-59Leading export markets . . . . . . . . . . . . . . . . . . . . . . . . . . . . . . . . . . . . . . . . . . . . . . 3-61
Factors affecting export patterns . . . . . . . . . . . . . . . . . . . . . . . . . . . . . . . . . . . . . . . . . 3-63Competition from China in the EU and U.S. markets . . . . . . . . . . . . . . . . . . . . . . . 3-64
Ghana . . . . . . . . . . . . . . . . . . . . . . . . . . . . . . . . . . . . . . . . . . . . . . . . . . . . . . . . . . 3-64South Africa . . . . . . . . . . . . . . . . . . . . . . . . . . . . . . . . . . . . . . . . . . . . . . . . . . . . 3-65
Appreciation of the South African rand . . . . . . . . . . . . . . . . . . . . . . . . . . . . . . . . . . 3-66Reduced supplies of timber . . . . . . . . . . . . . . . . . . . . . . . . . . . . . . . . . . . . . . . . . . . 3-66
Ghana . . . . . . . . . . . . . . . . . . . . . . . . . . . . . . . . . . . . . . . . . . . . . . . . . . . . . . . . . . 3-67Kenya . . . . . . . . . . . . . . . . . . . . . . . . . . . . . . . . . . . . . . . . . . . . . . . . . . . . . . . . . . 3-67South Africa . . . . . . . . . . . . . . . . . . . . . . . . . . . . . . . . . . . . . . . . . . . . . . . . . . . . 3-68Zimbabwe . . . . . . . . . . . . . . . . . . . . . . . . . . . . . . . . . . . . . . . . . . . . . . . . . . . . . . 3-68
Increased demand in South Africa . . . . . . . . . . . . . . . . . . . . . . . . . . . . . . . . . . . . . . 3-68Foreign investment has developed new exporters . . . . . . . . . . . . . . . . . . . . . . . . . . 3-69
Cameroon . . . . . . . . . . . . . . . . . . . . . . . . . . . . . . . . . . . . . . . . . . . . . . . . . . . . . . 3-69Gabon . . . . . . . . . . . . . . . . . . . . . . . . . . . . . . . . . . . . . . . . . . . . . . . . . . . . . . . . . 3-69Ghana . . . . . . . . . . . . . . . . . . . . . . . . . . . . . . . . . . . . . . . . . . . . . . . . . . . . . . . . . . 3-69Mali . . . . . . . . . . . . . . . . . . . . . . . . . . . . . . . . . . . . . . . . . . . . . . . . . . . . . . . . . . . 3-70Namibia . . . . . . . . . . . . . . . . . . . . . . . . . . . . . . . . . . . . . . . . . . . . . . . . . . . . . . . . 3-71Zimbabwe . . . . . . . . . . . . . . . . . . . . . . . . . . . . . . . . . . . . . . . . . . . . . . . . . . . . . . 3-71
Policies to promote the industry and increased investment . . . . . . . . . . . . . . . . . . . 3-71Cameroon . . . . . . . . . . . . . . . . . . . . . . . . . . . . . . . . . . . . . . . . . . . . . . . . . . . . . . 3-72Gabon . . . . . . . . . . . . . . . . . . . . . . . . . . . . . . . . . . . . . . . . . . . . . . . . . . . . . . . . . 3-72Ghana . . . . . . . . . . . . . . . . . . . . . . . . . . . . . . . . . . . . . . . . . . . . . . . . . . . . . . . . . . 3-73South Africa . . . . . . . . . . . . . . . . . . . . . . . . . . . . . . . . . . . . . . . . . . . . . . . . . . . . 3-74
viii
CONTENTS–ContinuedPage
Chapter 4 Services Sector Profiles . . . . . . . . . . . . . . . . . . . . . . . . . . . . . 4-1
Aviation services . . . . . . . . . . . . . . . . . . . . . . . . . . . . . . . . . . . . . . . . . . . . . . . . . . . . . . . . 4-1Summary of findings . . . . . . . . . . . . . . . . . . . . . . . . . . . . . . . . . . . . . . . . . . . . . . . . . . 4-1Industry overview . . . . . . . . . . . . . . . . . . . . . . . . . . . . . . . . . . . . . . . . . . . . . . . . . . . . . 4-3Sub-Saharan Africa trade in the global context . . . . . . . . . . . . . . . . . . . . . . . . . . . . . . 4-5
Leading exporters . . . . . . . . . . . . . . . . . . . . . . . . . . . . . . . . . . . . . . . . . . . . . . . . . . 4-5Leading export markets . . . . . . . . . . . . . . . . . . . . . . . . . . . . . . . . . . . . . . . . . . . . . . 4-6
Factors affecting export patterns . . . . . . . . . . . . . . . . . . . . . . . . . . . . . . . . . . . . . . . . . 4-7Increased tourist and business travel . . . . . . . . . . . . . . . . . . . . . . . . . . . . . . . . . . . 4-8Growth in time sensitive exports . . . . . . . . . . . . . . . . . . . . . . . . . . . . . . . . . . . . . . . 4-8Alliances and route expansions . . . . . . . . . . . . . . . . . . . . . . . . . . . . . . . . . . . . . . . . 4-8Increased capital investment . . . . . . . . . . . . . . . . . . . . . . . . . . . . . . . . . . . . . . . . . . 4-9Infrastructure development . . . . . . . . . . . . . . . . . . . . . . . . . . . . . . . . . . . . . . . . . . . 4-9Country profiles . . . . . . . . . . . . . . . . . . . . . . . . . . . . . . . . . . . . . . . . . . . . . . . . . . . . 4-10
Kenya . . . . . . . . . . . . . . . . . . . . . . . . . . . . . . . . . . . . . . . . . . . . . . . . . . . . . . . . . . 4-10Ethiopia . . . . . . . . . . . . . . . . . . . . . . . . . . . . . . . . . . . . . . . . . . . . . . . . . . . . . . . . 4-12South Africa . . . . . . . . . . . . . . . . . . . . . . . . . . . . . . . . . . . . . . . . . . . . . . . . . . . . 4-13Madagascar . . . . . . . . . . . . . . . . . . . . . . . . . . . . . . . . . . . . . . . . . . . . . . . . . . . . . 4-14Seychelles . . . . . . . . . . . . . . . . . . . . . . . . . . . . . . . . . . . . . . . . . . . . . . . . . . . . . . 4-14Cape Verde . . . . . . . . . . . . . . . . . . . . . . . . . . . . . . . . . . . . . . . . . . . . . . . . . . . . . 4-15
Communication services . . . . . . . . . . . . . . . . . . . . . . . . . . . . . . . . . . . . . . . . . . . . . . . . . . 4-19Summary of findings . . . . . . . . . . . . . . . . . . . . . . . . . . . . . . . . . . . . . . . . . . . . . . . . . . 4-19Industry overview . . . . . . . . . . . . . . . . . . . . . . . . . . . . . . . . . . . . . . . . . . . . . . . . . . . . . 4-20Sub-Saharan Africa trade in the global context . . . . . . . . . . . . . . . . . . . . . . . . . . . . . . 4-20
Leading exporters . . . . . . . . . . . . . . . . . . . . . . . . . . . . . . . . . . . . . . . . . . . . . . . . . . 4-21Leading export markets . . . . . . . . . . . . . . . . . . . . . . . . . . . . . . . . . . . . . . . . . . . . . . 4-23
Factors affecting export patterns . . . . . . . . . . . . . . . . . . . . . . . . . . . . . . . . . . . . . . . . . 4-24Introduction of competition and new licensing policies . . . . . . . . . . . . . . . . . . . . . 4-24
Liberalization of international gateway competition . . . . . . . . . . . . . . . . . . . . . . 4-24Introduction of VoIP technology . . . . . . . . . . . . . . . . . . . . . . . . . . . . . . . . . . . . . 4-25Liberalization of competition policies . . . . . . . . . . . . . . . . . . . . . . . . . . . . . . . . . 4-25
Expanded infrastructure development . . . . . . . . . . . . . . . . . . . . . . . . . . . . . . . . . . . 4-27SSA telecommunications demand growth . . . . . . . . . . . . . . . . . . . . . . . . . . . . . . . . 4-28
Greater role of geographic links . . . . . . . . . . . . . . . . . . . . . . . . . . . . . . . . . . . . . 4-28Increased African migration . . . . . . . . . . . . . . . . . . . . . . . . . . . . . . . . . . . . . . . . 4-28Higher GDP per capita . . . . . . . . . . . . . . . . . . . . . . . . . . . . . . . . . . . . . . . . . . . . 4-28Increased international trade and investment . . . . . . . . . . . . . . . . . . . . . . . . . . . 4-29Innovative applications of telecommunications . . . . . . . . . . . . . . . . . . . . . . . . . 4-29
Country profiles . . . . . . . . . . . . . . . . . . . . . . . . . . . . . . . . . . . . . . . . . . . . . . . . . . . . 4-30Ethiopia . . . . . . . . . . . . . . . . . . . . . . . . . . . . . . . . . . . . . . . . . . . . . . . . . . . . . . . . 4-30Kenya . . . . . . . . . . . . . . . . . . . . . . . . . . . . . . . . . . . . . . . . . . . . . . . . . . . . . . . . . . 4-30Nigeria . . . . . . . . . . . . . . . . . . . . . . . . . . . . . . . . . . . . . . . . . . . . . . . . . . . . . . . . . 4-32
ix
CONTENTS–ContinuedPage
Chapter 4 Services Sector Profiles—ContinuedCommunication services—Continued
South Africa . . . . . . . . . . . . . . . . . . . . . . . . . . . . . . . . . . . . . . . . . . . . . . . . . . . . 4-33Uganda . . . . . . . . . . . . . . . . . . . . . . . . . . . . . . . . . . . . . . . . . . . . . . . . . . . . . . . . . 4-33
AppendixesA. Request Letter . . . . . . . . . . . . . . . . . . . . . . . . . . . . . . . . . . . . . . . . . . . . . . . . . . . . . . . . . . . . . A-1B. Federal Register Notice . . . . . . . . . . . . . . . . . . . . . . . . . . . . . . . . . . . . . . . . . . . . . . . . . . . . . . B-1C. Hearing list of participants . . . . . . . . . . . . . . . . . . . . . . . . . . . . . . . . . . . . . . . . . . . . . . . . . . . . C-1D. Summaries of views of interested parties . . . . . . . . . . . . . . . . . . . . . . . . . . . . . . . . . . . . . . . . . D-1E. Harmonized tariff schedule categories . . . . . . . . . . . . . . . . . . . . . . . . . . . . . . . . . . . . . . . . . . . E-1F. Leading export shifts for all SSA countries . . . . . . . . . . . . . . . . . . . . . . . . . . . . . . . . . . . . . . . F-1
Boxes2.1. Product description for coffee . . . . . . . . . . . . . . . . . . . . . . . . . . . . . . . . . . . . . . . . . . . . . . 2-52.2. Shea butter production, processing, and marketing chain . . . . . . . . . . . . . . . . . . . . . . . . . 2-202.3. Production description for shea butter . . . . . . . . . . . . . . . . . . . . . . . . . . . . . . . . . . . . . . . 2-212.4. Product description for spices . . . . . . . . . . . . . . . . . . . . . . . . . . . . . . . . . . . . . . . . . . . . . . 2-382.5. Product description for bananas and pineapples . . . . . . . . . . . . . . . . . . . . . . . . . . . . . . . . 2-492.6. Downstream tropical fruit production . . . . . . . . . . . . . . . . . . . . . . . . . . . . . . . . . . . . . . . . 2-512.7. EU tariff preferences for bananas from ACP countries . . . . . . . . . . . . . . . . . . . . . . . . . . 2-603.1. Production description for footwear . . . . . . . . . . . . . . . . . . . . . . . . . . . . . . . . . . . . . . . . . 3-43.2. Peacock: An example of the Italian connection . . . . . . . . . . . . . . . . . . . . . . . . . . . . . . . . 3-123.3. TSONGA USA LLC: An example of export growth prompted by AGOA . . . . . . . . . . . 3-143.4. Product description for natural rubber . . . . . . . . . . . . . . . . . . . . . . . . . . . . . . . . . . . . . . . 3-193.5. Product description for processed diamonds . . . . . . . . . . . . . . . . . . . . . . . . . . . . . . . . . . . 3-303.6. Precious-metal jewelry . . . . . . . . . . . . . . . . . . . . . . . . . . . . . . . . . . . . . . . . . . . . . . . . . . . 3-323.7. The Kimberley Process Certification Scheme (KPCS) . . . . . . . . . . . . . . . . . . . . . . . . . . . 3-343.8. Petra Diamonds’ efforts for SSA beneficiation . . . . . . . . . . . . . . . . . . . . . . . . . . . . . . . . 3-403.9. Product description for textiles . . . . . . . . . . . . . . . . . . . . . . . . . . . . . . . . . . . . . . . . . . . . . 3-453.10. Product description for wood furniture . . . . . . . . . . . . . . . . . . . . . . . . . . . . . . . . . . . . . . . 3-593.11. Shift in sourcing of wood furniture from SSA to China: One company’s story . . . . . . . . 3-663.12. Visions of a wood furniture city in Ghana . . . . . . . . . . . . . . . . . . . . . . . . . . . . . . . . . . . . 3-703.13. Ghana to help Liberia salvage rubber trees to make furniture . . . . . . . . . . . . . . . . . . . . . 3-733.14. The government of South Africa intervenes in forest products sector in 2007 . . . . . . . . . 3-754.1. Product description for aviation services . . . . . . . . . . . . . . . . . . . . . . . . . . . . . . . . . . . . . 4-34.2. Product description for communication services . . . . . . . . . . . . . . . . . . . . . . . . . . . . . . . 4-19
x
CONTENTS–ContinuedPage
TablesES.1. Sub-Saharan Africa: Summary of findings for selected industries . . . . . . . . . . . . . . . . . . xviES.2. Sub-Saharan Africa, factors affecting trade patterns, by selected industry . . . . . . . . . . . xviiES.3. Sub-Saharan Africa: Summary of factors affecting exports patterns . . . . . . . . . . . . . . . . xix1.1. Sub-Saharan Africa merchandise and services exports: Value by sector, 2001–06 . . . . . 1-51.2. Sub-Saharan Africa commercial services exports: Value by country, 2001–05 . . . . . . . . 1-72.1. Sub-Saharan Africa coffee exports, by selected exporters and key markets,
2002–06 . . . . . . . . . . . . . . . . . . . . . . . . . . . . . . . . . . . . . . . . . . . . . . . . . . . . . . . . . . . . 2-32.2. Sub-Saharan Africa shea nut production, shea nut exports, and shea butter exports, by
leading countries . . . . . . . . . . . . . . . . . . . . . . . . . . . . . . . . . . . . . . . . . . . . . . . . . . . . . . 2-242.3. Shea processing firms . . . . . . . . . . . . . . . . . . . . . . . . . . . . . . . . . . . . . . . . . . . . . . . . . . . . 2-282.4. Sub-Saharan Africa exports of all SSA spices, by selected exporters and key markets,
2002–06 . . . . . . . . . . . . . . . . . . . . . . . . . . . . . . . . . . . . . . . . . . . . . . . . . . . . . . . . . . . . 2-362.5. Sub-Saharan Africa exports of vanilla, cloves, pepper, and ginger, by selected
exporters, 2002–06 . . . . . . . . . . . . . . . . . . . . . . . . . . . . . . . . . . . . . . . . . . . . . . . . . . . . 2-402.6. Sub-Saharan Africa exports of SSA bananas, by selected exporters and key markets,
2002–06 . . . . . . . . . . . . . . . . . . . . . . . . . . . . . . . . . . . . . . . . . . . . . . . . . . . . . . . . . . . . 2-542.7. Sub-Saharan Africa exports of SSA pineapples, by selected exporters and key
markets, 2002–06 . . . . . . . . . . . . . . . . . . . . . . . . . . . . . . . . . . . . . . . . . . . . . . . . . . . . . 2-553.1. Sub-Saharan Africa footwear exports, by selected exporters and key markets,
2002–06 . . . . . . . . . . . . . . . . . . . . . . . . . . . . . . . . . . . . . . . . . . . . . . . . . . . . . . . . . . . . 3-33.2. Sub-Saharan Africa natural rubber exports, by selected exporters and key markets,
2002–06 . . . . . . . . . . . . . . . . . . . . . . . . . . . . . . . . . . . . . . . . . . . . . . . . . . . . . . . . . . . . 3-183.3. South Africa processed diamonds exports, by selected exporters and key
markets, 2002–06 . . . . . . . . . . . . . . . . . . . . . . . . . . . . . . . . . . . . . . . . . . . . . . . . . . . . . 3-353.4. Sub-Saharan Africa processed diamonds exports (other than those of South Africa),
by selected exporters, 2002–06 . . . . . . . . . . . . . . . . . . . . . . . . . . . . . . . . . . . . . . . . . . 3-353.5. Sub-Saharan Africa textile exports, by selected exporters and key markets, 2002–06 . . 3-443.6. Sub-Saharan Africa wood furniture exports, by selected exporters and key
markets, 2002–06 . . . . . . . . . . . . . . . . . . . . . . . . . . . . . . . . . . . . . . . . . . . . . . . . . . . . . 3-574.1. Sub-Saharan Africa aviation exports, by reporting exporters, 2001–05 . . . . . . . . . . . . . . 4-24.2. Leading sub-Saharan African airlines, by international passengers and freight metric
tons carried, 2006 . . . . . . . . . . . . . . . . . . . . . . . . . . . . . . . . . . . . . . . . . . . . . . . . . . . . . 4-44.3. Sub-Saharan Africa communications exports, by selected exporters, 2001–05 . . . . . . . . 4-224.4. Competition and state ownership in SSA telecommunications sector . . . . . . . . . . . . . . . 4-264.5. Largest wireless providers in SSA by total number of mobile subscribers as of
June, 2007 . . . . . . . . . . . . . . . . . . . . . . . . . . . . . . . . . . . . . . . . . . . . . . . . . . . . . . . . . . . 4-34
Figures1.1. Sub-Saharan Africa merchandise exports: Average annual growth rates by sector,
2001–06 . . . . . . . . . . . . . . . . . . . . . . . . . . . . . . . . . . . . . . . . . . . . . . . . . . . . . . . . . . . . 1-42.1. Leading global and sub-Saharan Africa exporters of coffee, 2006 . . . . . . . . . . . . . . . . . . 2-92.2. Leading markets for global and sub-Saharan Africa exports of coffee, 2006 . . . . . . . . . . 2-10
xi
CONTENTS–ContinuedPage
Figures—Continued2.3. Shea processing and shea marketing chain . . . . . . . . . . . . . . . . . . . . . . . . . . . . . . . . . . . . 2-222.4. Leading sub-Saharan Africa exporters of shea butter and shea nuts . . . . . . . . . . . . . . . . . 2-252.5. Shea nut exports for selected major exporting countries . . . . . . . . . . . . . . . . . . . . . . . . . 2-252.6. SSA shea exports for selected major exporting countries . . . . . . . . . . . . . . . . . . . . . . . . . 2-262.7. EU imports of SSA shea butter . . . . . . . . . . . . . . . . . . . . . . . . . . . . . . . . . . . . . . . . . . . . . 2-272.8. Leading global and sub-Saharan Africa exporters of spices, 2006 . . . . . . . . . . . . . . . . . . 2-382.9. Leading markets for global and sub-Saharan Africa exports of spices, 2006 . . . . . . . . . . 2-412.10. SSA vanilla and clove export unit values, 2002–06 . . . . . . . . . . . . . . . . . . . . . . . . . . . . . 2-442.11. Leading global and sub-Saharan Africa exporters of bananas, 2006 . . . . . . . . . . . . . . . . 2-562.12. Leading global and sub-Saharan Africa exporters of pineapples, 2006 . . . . . . . . . . . . . . 2-572.13. Leading markets for global and sub-Saharan Africa exports of pineapples, 2006 . . . . . . 2-582.14. Leading markets for global and sub-Saharan Africa exports of bananas, 2006 . . . . . . . . 2-583.1. Leading global and sub-Saharan Africa exporters of footwear, 2006 . . . . . . . . . . . . . . . . 3-63.2. Leading markets for global and sub-Saharan Africa exports of footwear, 2006 . . . . . . . 3-73.3. Leading global and sub-Saharan Africa exporters of natural rubber, 2006 . . . . . . . . . . . 3-253.4. Leading markets for global and sub-Saharan Africa exports of natural rubber, 2006 . . . 3-263.5. Leading markets for global and South African exports of processed diamonds, 2006 . . . 3-363.6. Leading global and sub-Saharan Africa exporters of textiles, 2006 . . . . . . . . . . . . . . . . . 3-473.7. Leading markets for global and sub-Saharan Africa exports of textiles, 2006 . . . . . . . . . 3-483.8. Leading global and sub-Saharan Africa exporters of wood furniture, 2006 . . . . . . . . . . . 3-603.9. Leading markets for global and sub-Saharan Africa exports of wood furniture,
2006 . . . . . . . . . . . . . . . . . . . . . . . . . . . . . . . . . . . . . . . . . . . . . . . . . . . . . . . . . . . . . . . 3-624.1. Leading global and sub-Saharan Africa exporters of aviation services, 2005 . . . . . . . . . 4-64.2. Leading markets for global exports of aviation services, 2005 . . . . . . . . . . . . . . . . . . . . 4-74.3. Leading global and sub-Saharan Africa exporters of communication services, 2005 . . . 4-214.4. Leading markets for global exports of communication services, 2005 . . . . . . . . . . . . . . . 4-23

xiii
Executive Summary
nalysis of factors contributing to significant changes in sub-Saharan African (SSA) exports in 11 industries1 during 2002−06 found that several internal factors within SSA contributed to increased SSA exports
in nine of the 11 industries during the period. Increased global prices also contributed to export increases for several SSA industries such as coffee, processed diamonds, and natural rubber. Selected factors are highlighted below, while tables ES.1−3 summarize the study findings, including all factors.
Industry-Specific Government Policies and Programs Encouraged Exports Government policies to encourage investment and expansion of domestic industries were evident in certain industries. For example, the Namibian government offered incentives in the form of Export Processing Zone status and training grants to foster an export-oriented diamond cutting and polishing industry. Ghana and South Africa sponsored or proposed programs to promote the wood furniture industry. In Ghana, government institutions played a crucial role in the pineapple and banana industries’ export growth by facilitating the development and distribution of a new pineapple variety, coordinating the cold-storage chain, and providing technical support to improve quality and acquire international standards certifications.
Increased Investment Spurred Exports Increased demand spurred investment and led to the rapid growth of the wireless telephony industry; an expansion of airline fleets; an increase in textiles production; and an increase in agricultural programs for bananas, pineapples, spices, and shea butter. Investment was critical to the explosion of wireless telephony services in several SSA countries as well as to the increase and upgrade of air fleets by several SSA airlines. Ethiopian Airways’ ability to reliably service its market in combination with the flexibility it achieved through the Open Skies agreements led to plans to expand and upgrade its fleet. In 2004, when Ethiopian Airways signed an agreement for at least five new Boeing 787 Dreamliners, it became the first African carrier to be a launch customer for these jets. In Kenya, a joint venture in textiles enabled the domestic partner to secure technology allowing expanded operations into apparel. In addition, increased foreign investment in the banana industries in Côte d’Ivoire, Cameroon, and Ghana increased the total area harvested for bananas by more than 12 percent during 2002−06. In Ghana, new investments by a large multinational fruit company helped increase Ghanaian banana exports. The increasing popularity of shea butter as an input in the cosmetics and edible fats industries prompted
1 The 11 industries are: coffee; shea butter; spices (primarily vanilla, cloves, pepper, and
ginger); tropical fruit (primarily bananas and pineapples); footwear; natural rubber; processed diamonds; textiles; wood furniture; aviation services; and communication services.
A
xiv
several multinational companies to invest in shea processing in Ghana and Burkina Faso.
Infrastructure Improvements Contributed to Increased Exports Some SSA governments, as well as international lenders such as the World Bank, improved infrastructure or production facilities to assist domestic industries. Infrastructure and transportation services improvements were especially beneficial to exports of shea butter, certain tropical fruit, aviation services, and communication services. Côte d’Ivoire, Ghana, and Cameroon export the majority of their fresh pineapples and bananas to the EU, so proper cold storage facilities and appropriate tracking and handling equipment are key components for the industry. Also, expansion and upgrades of the fruit wharf at the port of Abidjan were key in Côte d’Ivoire’s increasing banana sector exports. Several landlocked countries in West Africa require adequate road and rail networks to transport goods primarily to Senegal and Ghana for export by freight or air. Improved roads in Ghana and railroads and air transport in Senegal facilitated increased SSA exports of shea butter. Improved airport facilities and more direct routes contributed to increased aviation services exports.
SSA Regional Integration Facilitated Exports Strengthened ties among members of the Common Market for Eastern and Southern Africa (COMESA) and the formation of the East African Customs Union (EAC) also improved efficiencies and increased regional trade. The establishment of the EAC between Kenya, Uganda, and Tanzania in 2005 likely contributed to the increased level of footwear trade, particularly between Kenya and Uganda, in 2005 and 2006 by liberalizing tariffs on intra-EAC trade while establishing a common external tariff.
Tariff Preferences Boosted SSA Exports Tariff preferences provided a boost to SSA exports of footwear and textiles. For example, the Cotonou Agreement, which requires the use of regional fabric in apparel receiving duty-free treatment to the EU, and South Africa’s elimination of tariffs from Southern African Development Community (SADC) partner members both contributed to increased intra-SSA textile exports during 2002−06. For footwear, the elimination of tariffs under the African Growth and Opportunity Act (AGOA) contributed to increased exports of footwear from South Africa to the United States during 2002−06.
Sector and Market Liberalizations Increased SSA Exports Liberalizations in the coffee, communication services, and aviation services sectors in several SSA countries helped to facilitate greater exports. Reduced government intervention in the coffee sectors of several SSA countries allowed producer prices to be linked to higher prices. The introduction of competition and
xv
new licensing policies in several SSA countries’ communication services sectors reduced the cost and increased the volume of international calls. Among the largest and most successful SSA aviation services industries (Kenya, Ethiopia, and South Africa), the use of code sharing and other cooperative agreements such as frequent flyer and open skies agreements between airlines and nations have been vital to their sustained export growth. Changes in EU market regulations permitting some shea butter in products labeled “chocolate” increased demand for shea butter in the EU.
Some Sectors’ Exports Decreased Not all of the 11 selected industries experienced export growth. Indeed, the value of global SSA exports declined for spices, wood furniture, and pineapples. The overall decrease in SSA spice exports during 2002−06 was due primarily to decreased prices associated with overproduction of vanilla in Madagascar.2 Increased competition in key markets was the principal factor contributing to the decreased value of SSA wood furniture exports, as well as the main reason for decreased pineapple export values. Exports of SSA wood furniture faced intense competition with exports from China in key EU markets and the United States, while SSA pineapple exports lost EU market share to Costa Rican exports. Other factors contributing to the decrease of SSA wood furniture exports were the relative strength of the South African rand against the euro and the U.S. dollar, reduced resource supply, and increased local demand, particularly in South Africa. Unstable political conditions and a deteriorating economic environment contributed to decreased export volumes of pineapples and coffee from Côte d’Ivoire and pepper from Zimbabwe. Côte d’Ivoire’s political crisis curtailed most financial lending for small pineapple farmers, reducing production. Zimbabwe, SSA’s leading pepper exporter in 2002, experienced a sharp decline during 2003−06, following its land reform program that began in June 2002.
2 Following a cyclone-induced shortage of natural vanilla in 2000, the resulting global price
spike compelled consumers to switch to artificial substitutes, thereby depressing demand for natural vanilla and decreasing the value of SSA exports, primarily from Madagascar and Comoros. Subsequently, recovery of supplies from the SSA area hit by the cyclone caused a vanilla glut and further decreased world prices and export values.
xvi
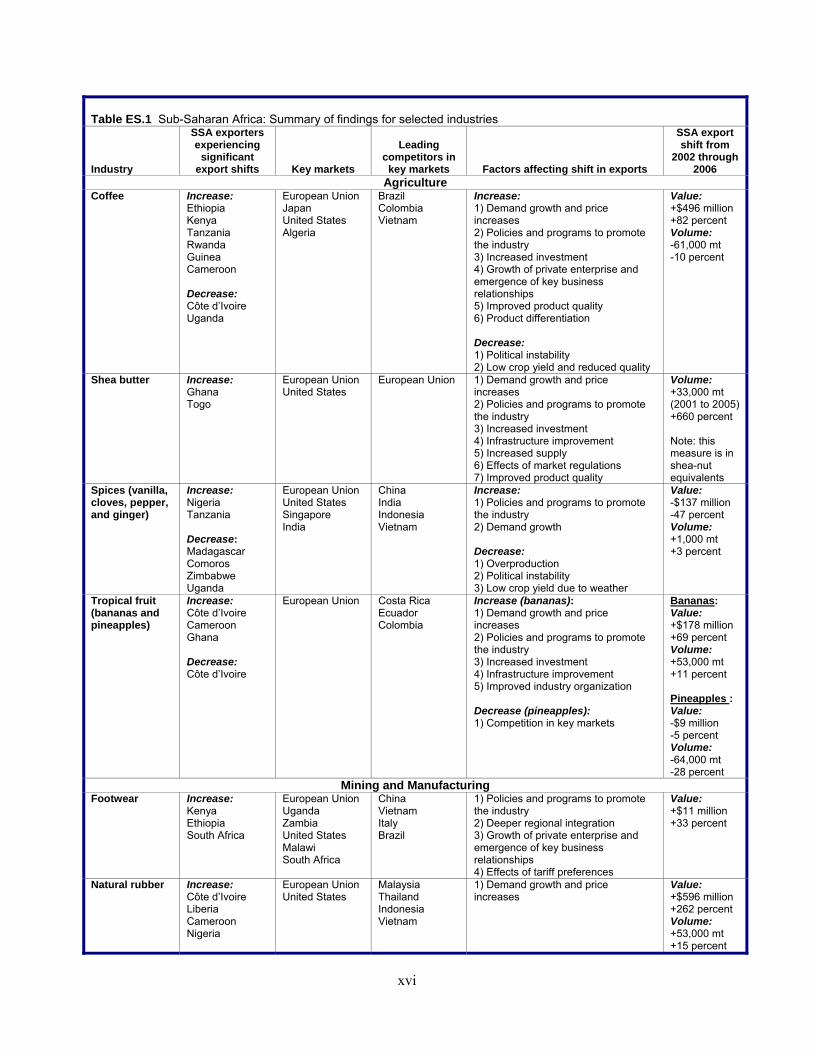
Table ES.1 Sub-Saharan Africa: Summary of findings for selected industries Industry
SSA exporters experiencing
significant export shifts
Key markets
Leading
competitors in key markets
Factors affecting shift in exports
SSA export shift from
2002 through 2006
Agriculture Coffee
Increase: Ethiopia Kenya Tanzania Rwanda Guinea Cameroon Decrease: Côte d’Ivoire Uganda
European Union Japan United States Algeria
Brazil Colombia Vietnam
Increase: 1) Demand growth and price increases 2) Policies and programs to promote the industry 3) Increased investment 4) Growth of private enterprise and emergence of key business relationships 5) Improved product quality 6) Product differentiation Decrease: 1) Political instability 2) Low crop yield and reduced quality
Value: +$496 million +82 percent Volume: -61,000 mt -10 percent
Shea butter Increase: Ghana Togo
European Union United States
European Union 1) Demand growth and price increases 2) Policies and programs to promote the industry 3) Increased investment 4) Infrastructure improvement 5) Increased supply 6) Effects of market regulations 7) Improved product quality
Volume: +33,000 mt (2001 to 2005) +660 percent Note: this measure is in shea-nut equivalents
Spices (vanilla, cloves, pepper, and ginger)
Increase: Nigeria Tanzania Decrease: Madagascar Comoros Zimbabwe Uganda
European Union United States Singapore India
China India Indonesia Vietnam
Increase: 1) Policies and programs to promote the industry 2) Demand growth Decrease: 1) Overproduction 2) Political instability 3) Low crop yield due to weather
Value: -$137 million -47 percent Volume: +1,000 mt +3 percent
Tropical fruit (bananas and pineapples)
Increase: Côte d’Ivoire Cameroon Ghana Decrease: Côte d’Ivoire
European Union Costa Rica Ecuador Colombia
Increase (bananas): 1) Demand growth and price increases 2) Policies and programs to promote the industry 3) Increased investment 4) Infrastructure improvement 5) Improved industry organization Decrease (pineapples): 1) Competition in key markets
Bananas: Value: +$178 million +69 percent Volume: +53,000 mt +11 percent Pineapples : Value: -$9 million -5 percent Volume: -64,000 mt -28 percent
Mining and Manufacturing Footwear
Increase: Kenya Ethiopia South Africa
European Union Uganda Zambia United States Malawi South Africa
China Vietnam Italy Brazil
1) Policies and programs to promote the industry 2) Deeper regional integration 3) Growth of private enterprise and emergence of key business relationships 4) Effects of tariff preferences
Value: +$11 million +33 percent
Natural rubber Increase: Côte d’Ivoire Liberia Cameroon Nigeria
European Union United States
Malaysia Thailand Indonesia Vietnam
1) Demand growth and price increases
Value: +$596 million +262 percent Volume: +53,000 mt +15 percent
xvii
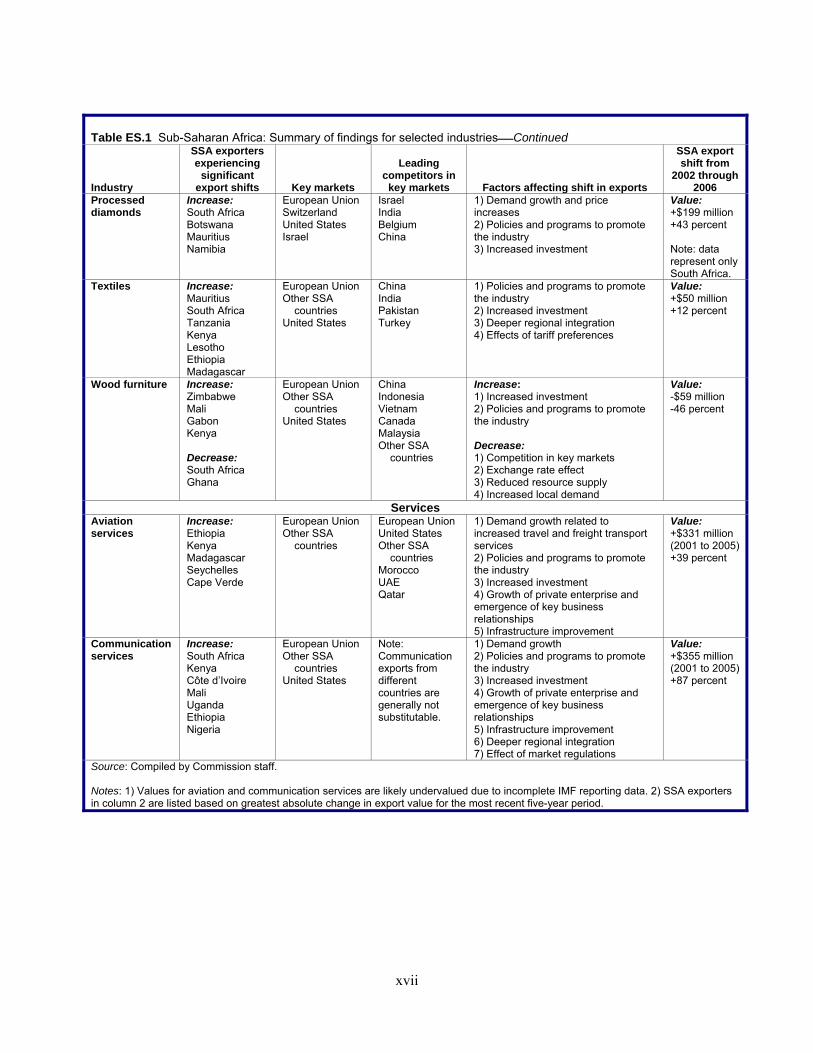
Table ES.1 Sub-Saharan Africa: Summary of findings for selected industriesContinued Industry
SSA exporters experiencing
significant export shifts
Key markets
Leading
competitors in key markets
Factors affecting shift in exports
SSA export shift from
2002 through 2006
Processed diamonds
Increase: South Africa Botswana Mauritius Namibia
European Union Switzerland United States Israel
Israel India Belgium China
1) Demand growth and price increases 2) Policies and programs to promote the industry 3) Increased investment
Value: +$199 million +43 percent
Note: data represent only South Africa.
Textiles
Increase: Mauritius South Africa Tanzania Kenya Lesotho Ethiopia Madagascar
European Union Other SSA countries United States
China India Pakistan Turkey
1) Policies and programs to promote the industry 2) Increased investment 3) Deeper regional integration 4) Effects of tariff preferences
Value: +$50 million +12 percent
Wood furniture
Increase: Zimbabwe Mali Gabon Kenya Decrease: South Africa Ghana
European Union Other SSA countries United States
China Indonesia Vietnam Canada Malaysia Other SSA countries
Increase: 1) Increased investment 2) Policies and programs to promote the industry Decrease: 1) Competition in key markets 2) Exchange rate effect 3) Reduced resource supply 4) Increased local demand
Value: -$59 million -46 percent
Services Aviation services
Increase: Ethiopia Kenya Madagascar Seychelles Cape Verde
European Union Other SSA countries
European Union United States Other SSA countries Morocco UAE Qatar
1) Demand growth related to increased travel and freight transport services 2) Policies and programs to promote the industry 3) Increased investment 4) Growth of private enterprise and emergence of key business relationships 5) Infrastructure improvement
Value: +$331 million (2001 to 2005) +39 percent
Communication services
Increase: South Africa Kenya Côte d’Ivoire Mali Uganda Ethiopia Nigeria
European Union Other SSA countries United States
Note: Communication exports from different countries are generally not substitutable.
1) Demand growth 2) Policies and programs to promote the industry 3) Increased investment 4) Growth of private enterprise and emergence of key business relationships 5) Infrastructure improvement 6) Deeper regional integration 7) Effect of market regulations
Value: +$355 million (2001 to 2005) +87 percent
Source: Compiled by Commission staff. Notes: 1) Values for aviation and communication services are likely undervalued due to incomplete IMF reporting data. 2) SSA exporters in column 2 are listed based on greatest absolute change in export value for the most recent five-year period.
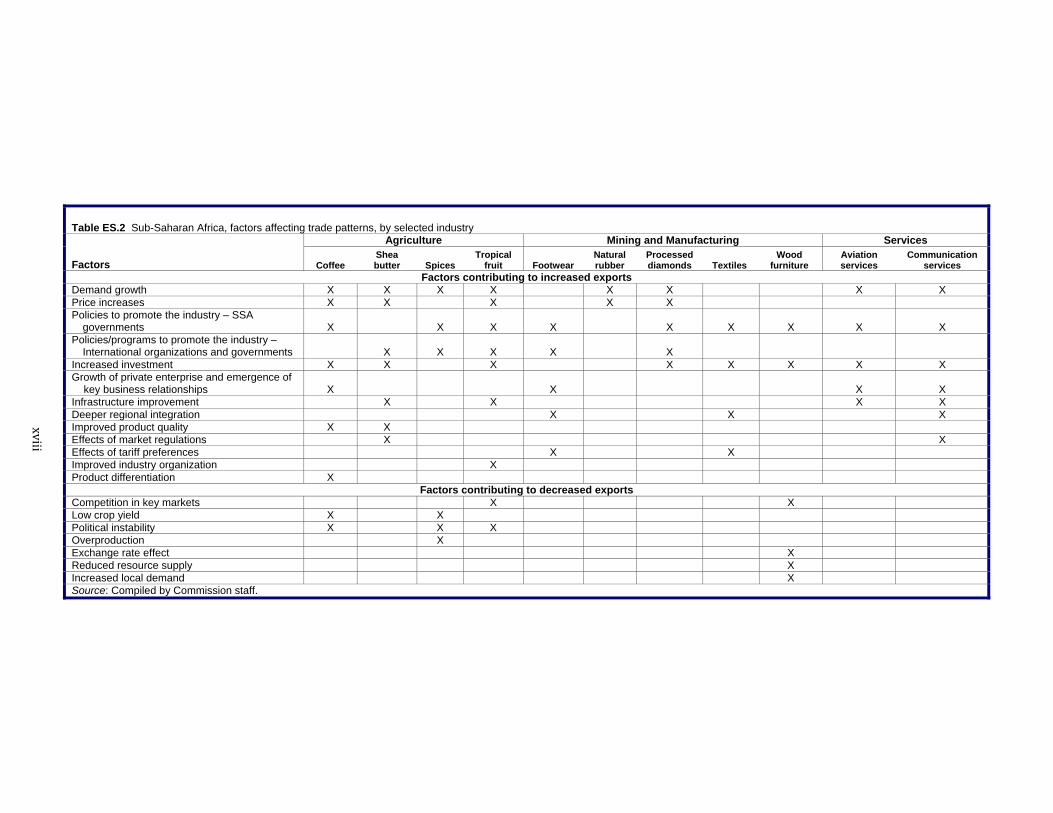
Table ES.2 Sub-Saharan Africa, factors affecting trade patterns, by selected industry Agriculture Mining and Manufacturing Services
Factors Coffee
Shea butter Spices
Tropical fruit Footwear
Natural rubber
Processed diamonds Textiles
Wood furniture
Aviation services
Communication services
Factors contributing to increased exports Demand growth X X X X X X X X Price increases X X X X X Policies to promote the industry – SSA governments X X X X X X X X X Policies/programs to promote the industry – International organizations and governments X X X X X Increased investment X X X X X X X X Growth of private enterprise and emergence of key business relationships X X X X Infrastructure improvement X X X X Deeper regional integration X X X Improved product quality X X Effects of market regulations X X Effects of tariff preferences X X Improved industry organization X Product differentiation X
Factors contributing to decreased exports Competition in key markets X X Low crop yield X X Political instability X X X Overproduction X Exchange rate effect X Reduced resource supply X Increased local demand X Source: Compiled by Commission staff.
xviii
xix
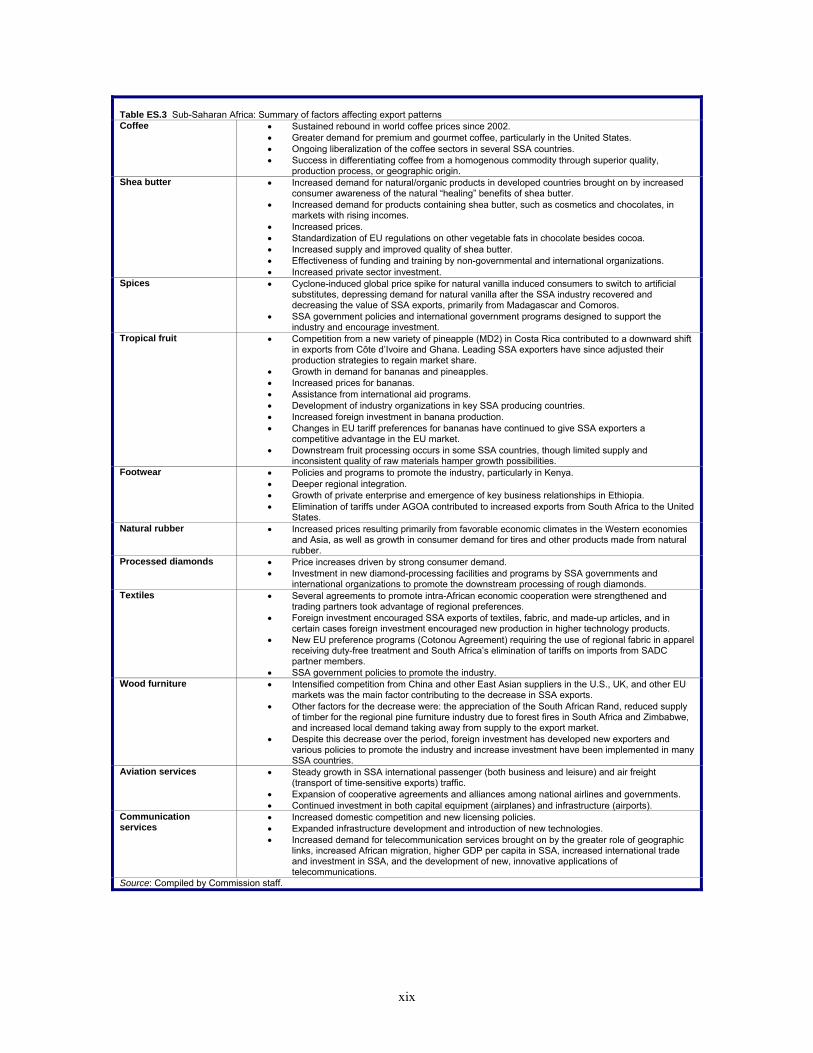
Table ES.3 Sub-Saharan Africa: Summary of factors affecting export patterns Coffee • Sustained rebound in world coffee prices since 2002.
• Greater demand for premium and gourmet coffee, particularly in the United States. • Ongoing liberalization of the coffee sectors in several SSA countries. • Success in differentiating coffee from a homogenous commodity through superior quality,
production process, or geographic origin. Shea butter • Increased demand for natural/organic products in developed countries brought on by increased
consumer awareness of the natural “healing” benefits of shea butter. • Increased demand for products containing shea butter, such as cosmetics and chocolates, in
markets with rising incomes. • Increased prices. • Standardization of EU regulations on other vegetable fats in chocolate besides cocoa. • Increased supply and improved quality of shea butter. • Effectiveness of funding and training by non-governmental and international organizations. • Increased private sector investment.
Spices • Cyclone-induced global price spike for natural vanilla induced consumers to switch to artificial substitutes, depressing demand for natural vanilla after the SSA industry recovered and decreasing the value of SSA exports, primarily from Madagascar and Comoros.
• SSA government policies and international government programs designed to support the industry and encourage investment.
Tropical fruit • Competition from a new variety of pineapple (MD2) in Costa Rica contributed to a downward shift in exports from Côte d’Ivoire and Ghana. Leading SSA exporters have since adjusted their production strategies to regain market share.
• Growth in demand for bananas and pineapples. • Increased prices for bananas. • Assistance from international aid programs. • Development of industry organizations in key SSA producing countries. • Increased foreign investment in banana production. • Changes in EU tariff preferences for bananas have continued to give SSA exporters a
competitive advantage in the EU market. • Downstream fruit processing occurs in some SSA countries, though limited supply and
inconsistent quality of raw materials hamper growth possibilities. Footwear • Policies and programs to promote the industry, particularly in Kenya.
• Deeper regional integration. • Growth of private enterprise and emergence of key business relationships in Ethiopia. • Elimination of tariffs under AGOA contributed to increased exports from South Africa to the United
States. Natural rubber • Increased prices resulting primarily from favorable economic climates in the Western economies
and Asia, as well as growth in consumer demand for tires and other products made from natural rubber.
Processed diamonds • Price increases driven by strong consumer demand. • Investment in new diamond-processing facilities and programs by SSA governments and
international organizations to promote the downstream processing of rough diamonds. Textiles • Several agreements to promote intra-African economic cooperation were strengthened and
trading partners took advantage of regional preferences. • Foreign investment encouraged SSA exports of textiles, fabric, and made-up articles, and in
certain cases foreign investment encouraged new production in higher technology products. • New EU preference programs (Cotonou Agreement) requiring the use of regional fabric in apparel
receiving duty-free treatment and South Africa’s elimination of tariffs on imports from SADC partner members.
• SSA government policies to promote the industry. Wood furniture • Intensified competition from China and other East Asian suppliers in the U.S., UK, and other EU
markets was the main factor contributing to the decrease in SSA exports. • Other factors for the decrease were: the appreciation of the South African Rand, reduced supply
of timber for the regional pine furniture industry due to forest fires in South Africa and Zimbabwe, and increased local demand taking away from supply to the export market.
• Despite this decrease over the period, foreign investment has developed new exporters and various policies to promote the industry and increase investment have been implemented in many SSA countries.
Aviation services • Steady growth in SSA international passenger (both business and leisure) and air freight (transport of time-sensitive exports) traffic.
• Expansion of cooperative agreements and alliances among national airlines and governments. • Continued investment in both capital equipment (airplanes) and infrastructure (airports).
Communication services
• Increased domestic competition and new licensing policies. • Expanded infrastructure development and introduction of new technologies. • Increased demand for telecommunication services brought on by the greater role of geographic
links, increased African migration, higher GDP per capita in SSA, increased international trade and investment in SSA, and the development of new, innovative applications of telecommunications.
Source: Compiled by Commission staff.

1-1
CHAPTER 1 Introduction and Overview
his report provides information on competitive factors affecting selected industries in sub-Saharan Africa (SSA)1 that have experienced significant shifts in exports.2 This report describes industry and market conditions;
identifies the leading SSA exporters, their key markets, and their global competitors; and identifies, describes, and analyzes factors that have contributed to significant export shifts in the selected SSA industries for the most recent five-year period for which data are available. In addition, the report includes brief overviews of the trends in SSA exports for the agriculture (including fisheries), mining and manufacturing, and services sectors.
Industry and Country Coverage This report analyzes eleven SSA industries selected by the United States Trade Representative (USTR): certain spices (including ginger), coffee, shea butter and downstream products thereof, and tropical fruit (e.g. bananas, pineapples, and guavas) and processed products thereof in the agriculture and fisheries sector; footwear, natural rubber and downstream products thereof, jewelry and downstream diamond processing (e.g., polishing and cutting), textiles, and wood furniture in the mining and manufacturing sector; and aviation services and communication services in the services sector. For each industry, trade data were used to narrow the focus of the analysis to that part of the industry and to those countries within SSA that demonstrated substantial or consistent export value shifts from 2002–06.3
1 Throughout the report “SSA” is used to refer to both “sub-Saharan Africa” as a noun and
“sub-Saharan African” as an adjective. 2 On July 27, 2006, the Office of the United States Trade Representative (USTR) requested that
the U.S. International Trade Commission (Commission) prepare three annual reports under section 332(g) of the Tariff Act of 1930 (19 U.S.C. 1332(g)) addressing factors affecting trade patterns of selected industries in sub-Saharan Africa. This report is the second in that series. The USTR requested that the Commission submit its report by April 3, 2008. A copy of the request letter is included in app. A, and the Commission’s notice of investigation, published in the Federal Register of July 18, 2007 (72 F.R. 39445), is in app. B.
3 Sub-Saharan Africa consists of the following 48 countries: Angola, Benin, Botswana, Burkina Faso, Burundi, Cameroon, Cape Verde, Central African Republic, Chad, Comoros, Democratic Republic of the Congo, Republic of the Congo, Côte d’Ivoire, Djibouti, Equatorial Guinea, Eritrea, Ethiopia, Gabon, The Gambia, Ghana, Guinea, Guinea-Bissau, Kenya, Lesotho, Liberia, Madagascar, Malawi, Mali, Mauritania, Mauritius, Mozambique, Namibia, Niger, Nigeria, Rwanda, São Tomé and Príncipe, Senegal, Seychelles, Sierra Leone, Somalia, South Africa, Sudan, Swaziland, Tanzania, Togo, Uganda, Zambia, and Zimbabwe. Because data were unavailable for 2006 for all commercial services sectors, export shifts for services are based on changes during 2001−05.
T
1-2
Information Used in the Report Merchandise trade data throughout this report, unless otherwise indicated, were obtained from Global Trade Information Services, Inc.’s (GTIS) Global Trade Atlas database.4 Industry sectors were defined based on 2-, 4-, and 6-digit harmonized system (HS) classifications (app. table E.1). To minimize the effect of incomplete trade data from SSA countries, the data presented for exports in this report represent the value of apparent exports rather than actual reported exports, unless otherwise noted. That is, as import data are generally considered more reliable than export data, and export data from a number of SSA countries were limited, export trade values were derived by aggregating import data values (including insurance and freight) from all countries reporting to GTIS.5 Furthermore, complete and reliable 2006 data for some industry sectors (e.g., aviation services and communication services) were not readily available. Services industry definitions were based on the International Monetary Fund’s (IMF) Balance of Payments Manual. Services sector data were compiled from various sources, including the IMF’s Balance of Payments Manual and the World Trade Organization’s (WTO) International Trade Statistics 2007. In addition to the trade data described above, information for this report was collected from a variety of industry and government sources, including domestic and foreign industry representatives; international organizations, including the WTO, the World Bank, the Food and Agriculture Organization (FAO) of the United Nations, and the IMF; U.S. and foreign government sources, including U.S. embassies in SSA countries and SSA countries’ embassies in the United States; and submissions of interested parties. In addition, Commission staff conducted fieldwork in East Africa (Ethiopia, Kenya, Tanzania, and Uganda), Southern Africa (Madagascar and South Africa), and West Africa (Côte d’Ivoire, Ghana, and Senegal).
4 Global Trade Atlas was the primary source of trade data for this report. Most data were
collected as of July 24, 2007; however, Global Trade Information Services, Inc. (GTIS) periodically updates its database and certain values were updated at later times. All data are reported as nominal values unless otherwise indicated. Internal European Union trade data were excluded. Throughout this report, references to the European Union (EU) refer to the EU27: Austria, Belgium, Bulgaria, Cyprus, the Czech Republic, Denmark, Estonia, Finland, France, Germany, Greece, Hungary, Ireland, Italy, Latvia, Lithuania, Luxembourg, Malta, the Netherlands, Poland, Portugal, Romania, Slovakia, Slovenia, Spain, Sweden, and the United Kingdom.
5 Trade data used for the processed diamonds profile are an exception; as the import data are likely inflated due to double counting of reexports, SSA export data from the leading exporter, South Africa, were used. Import valuation for most countries reporting to GTIS is based on the cost, insurance, and freight, or C.I.F. value. Although this approach provided the broadest set of data, introduction of insurance and freight into the export values may cause additional variation. For example, increased freight costs associated with increased fuel costs over the period will also show up as increased export value.
1-3
Approach The approach employed by the Commission to identify factors that affected trade patterns in the selected industries included several steps. First, the Commission analyzed export data in the selected industries to determine whether changes in exports over the most recent five-year period primarily reflected changes in prices or changes in quantity. Second, examination of data was combined with information gathered from domestic and foreign industry and government sources, as well as international organizations, to identify factors that were related to demand and supply conditions affecting each selected industry. For example, factors relating to demand include changes in global demand and changes in tariff preferences extended to the respective SSA countries in world markets. Examples of factors relating to supply include increased investment leading to increased capacity and changes in domestic government policies, such as tax policies, or infrastructure improvements. The factors identified in this report are not an exhaustive list and are not ranked according to significance. Any level of relative significance suggested in the report is a qualitative assessment based on the information gathered and is not the result of statistical analysis. Data sources for this report include public sources of export data, telephone interviews, e-mail correspondence with domestic and foreign industry representatives, information from other U.S. government agencies, and fieldwork conducted by Commission staff. In Ethiopia, Kenya, Tanzania, and Uganda, Commission staff met with representatives from the aviation services, coffee, communications services, footwear, shea butter, spice, textile, tropical fruit, wood furniture, and related industries. In Côte d’Ivoire, Ghana, and Senegal, Commission staff met with representatives from the aviation services, coffee, communications services, natural rubber, shea butter, tropical fruit, wood furniture, and related industries. In Madagascar and South Africa, Commission staff met with representatives from the aviation services, diamond processing, natural rubber, spice, textile, wood furniture, and related industries.
Organization of Report The remainder of chapter 1 provides an overview of SSA sector exports. Chapter 2 profiles the selected agricultural industries; chapter 3 profiles the selected mining and manufacturing industries; and chapter 4 profiles the selected services industries.
1-4
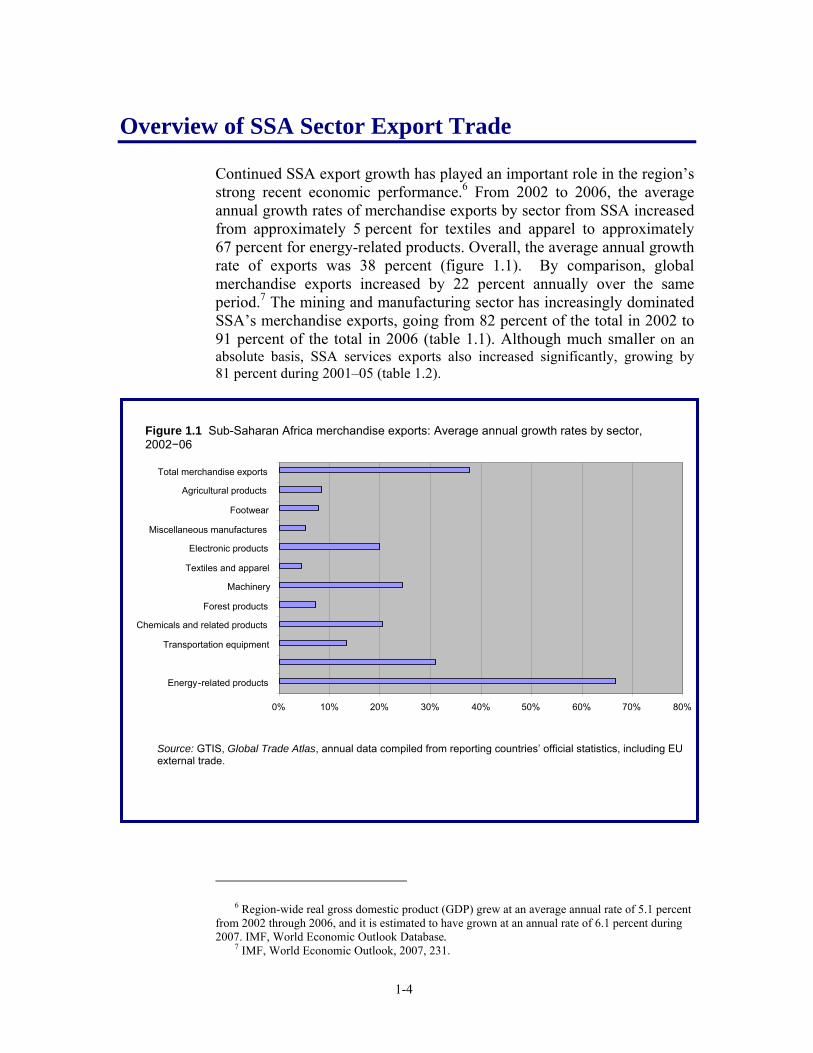
Overview of SSA Sector Export Trade Continued SSA export growth has played an important role in the region’s strong recent economic performance.6 From 2002 to 2006, the average annual growth rates of merchandise exports by sector from SSA increased from approximately 5 percent for textiles and apparel to approximately 67 percent for energy-related products. Overall, the average annual growth rate of exports was 38 percent (figure 1.1). By comparison, global merchandise exports increased by 22 percent annually over the same period.7 The mining and manufacturing sector has increasingly dominated SSA’s merchandise exports, going from 82 percent of the total in 2002 to 91 percent of the total in 2006 (table 1.1). Although much smaller on an absolute basis, SSA services exports also increased significantly, growing by 81 percent during 2001–05 (table 1.2).
6 Region-wide real gross domestic product (GDP) grew at an average annual rate of 5.1 percent
from 2002 through 2006, and it is estimated to have grown at an annual rate of 6.1 percent during 2007. IMF, World Economic Outlook Database.
7 IMF, World Economic Outlook, 2007, 231.
Figure 1.1 Sub-Saharan Africa merchandise exports: Average annual growth rates by sector, 2002−06
0% 10% 20% 30% 40% 50% 60% 70% 80%
Energy -related products
Transportation equipment
Chemicals and related products
Forest products
Machinery
Textiles and apparel
Electronic products
Miscellaneous manufactures
Footwear
Agricultural products Total merchandise exports
Source: GTIS, Global Trade Atlas, annual data compiled from reporting countries’ official statistics, including EU external trade.
1-5
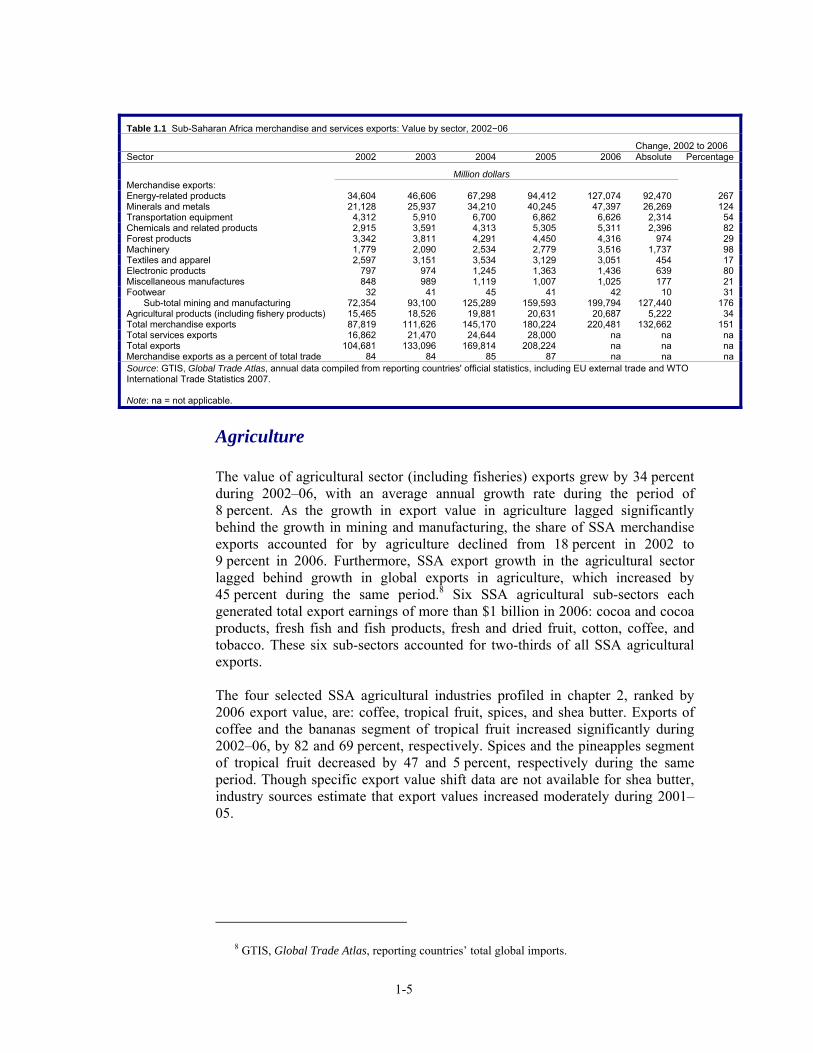
Table 1.1 Sub-Saharan Africa merchandise and services exports: Value by sector, 2002−06
Change, 2002 to 2006 Sector 2002 2003 2004 2005 2006 Absolute Percentage
Million dollars Merchandise exports: Energy-related products 34,604 46,606 67,298 94,412 127,074 92,470 267 Minerals and metals 21,128 25,937 34,210 40,245 47,397 26,269 124 Transportation equipment 4,312 5,910 6,700 6,862 6,626 2,314 54 Chemicals and related products 2,915 3,591 4,313 5,305 5,311 2,396 82 Forest products 3,342 3,811 4,291 4,450 4,316 974 29 Machinery 1,779 2,090 2,534 2,779 3,516 1,737 98 Textiles and apparel 2,597 3,151 3,534 3,129 3,051 454 17 Electronic products 797 974 1,245 1,363 1,436 639 80 Miscellaneous manufactures 848 989 1,119 1,007 1,025 177 21 Footwear 32 41 45 41 42 10 31
Sub-total mining and manufacturing 72,354 93,100 125,289 159,593 199,794 127,440 176 Agricultural products (including fishery products) 15,465 18,526 19,881 20,631 20,687 5,222 34 Total merchandise exports 87,819 111,626 145,170 180,224 220,481 132,662 151 Total services exports 16,862 21,470 24,644 28,000 na na na Total exports 104,681 133,096 169,814 208,224 na na na Merchandise exports as a percent of total trade 84 84 85 87 na na na Source: GTIS, Global Trade Atlas, annual data compiled from reporting countries' official statistics, including EU external trade and WTO International Trade Statistics 2007. Note: na = not applicable.
Agriculture
The value of agricultural sector (including fisheries) exports grew by 34 percent during 2002–06, with an average annual growth rate during the period of 8 percent. As the growth in export value in agriculture lagged significantly behind the growth in mining and manufacturing, the share of SSA merchandise exports accounted for by agriculture declined from 18 percent in 2002 to 9 percent in 2006. Furthermore, SSA export growth in the agricultural sector lagged behind growth in global exports in agriculture, which increased by 45 percent during the same period.8 Six SSA agricultural sub-sectors each generated total export earnings of more than $1 billion in 2006: cocoa and cocoa products, fresh fish and fish products, fresh and dried fruit, cotton, coffee, and tobacco. These six sub-sectors accounted for two-thirds of all SSA agricultural exports. The four selected SSA agricultural industries profiled in chapter 2, ranked by 2006 export value, are: coffee, tropical fruit, spices, and shea butter. Exports of coffee and the bananas segment of tropical fruit increased significantly during 2002–06, by 82 and 69 percent, respectively. Spices and the pineapples segment of tropical fruit decreased by 47 and 5 percent, respectively during the same period. Though specific export value shift data are not available for shea butter, industry sources estimate that export values increased moderately during 2001–05.
8 GTIS, Global Trade Atlas, reporting countries’ total global imports.
1-6
Mining and Manufacturing
Growth in mining and manufacturing exports was strong during 2002–06; however, it was concentrated in energy-related products and minerals and metals, which grew at average annual rates of 67 and 31 percent, respectively, by value (figure 1.1). SSA exports of energy-related products grew nearly 270 percent by value during 2002–06, reflecting increased world petroleum prices as well as increased volume (table 1.1). Similarly, SSA exports of minerals and metals increased by 124 percent during 2002–06 as strong global demand increased the volume of exports and fueled higher prices for products such as gold, aluminum, steel, and copper. SSA exports of all other commodities in the mining and manufacturing sector rose 52 percent during 2002–06. The five selected industries in the SSA mining and manufacturing sector profiled in chapter 3, ranked by 2006 export value, are: natural rubber, processed diamonds, textiles, wood furniture, and footwear. Exports increased in four of the five sectors during 2002–06, with gains ranging from 12–262 percent. The one exception was wood furniture, which decreased by 46 percent.
Services
Services exports represented about 15 percent of total SSA exports during 2002–05 (table 1.1).9 The value of SSA services exports increased 81 percent during 2001–05, from $15.5 billion in 2001 to $28.0 billion in 2005 (table 1.2).10 The composition of SSA services exports shifted toward travel and tourism during the period. Travel and tourism accounted for 47 percent ($13.5 billion) of all SSA services exports in 2005, an increase from 39 percent ($6.4 billion) in 2001.11 Transportation services accounted for 19 percent of all SSA services exports in 2005, a decrease from 22 percent in 2001. All other services (including communications, construction, insurance, financial, computer and information services) decreased from 39 to 34 percent of all SSA services exports during 2001–05. Services exports from SSA are concentrated in the five leading exporters (South Africa, Nigeria, Mauritius, Kenya, and Tanzania), which accounted for $19.4 billion in services exports in 2005, representing 69 percent of all SSA services exports (table 1.2). The predominant type of service exported varied among exporters. In 2006, for example, tourism services dominated the services exports from South Africa (67 percent), Tanzania (67 percent), and Mauritius (60 percent).12 Other services (including communications, construction, insurance, financial, computer, and information services) dominated the services exports from Nigeria (82 percent) in 2005. In Kenya, services exports were
9 “Services” refers to commercial services as defined by the IMF and consist of transportation,
travel and tourism, and other services; other services include communications, construction, insurance, financial, computer and information, royalties and license fees, and other business services.
10 Services data were not completely available for 2006. 11 IMF, International Financial Statistics Yearbook, 2007. 12 WTO, Statistical Databases.
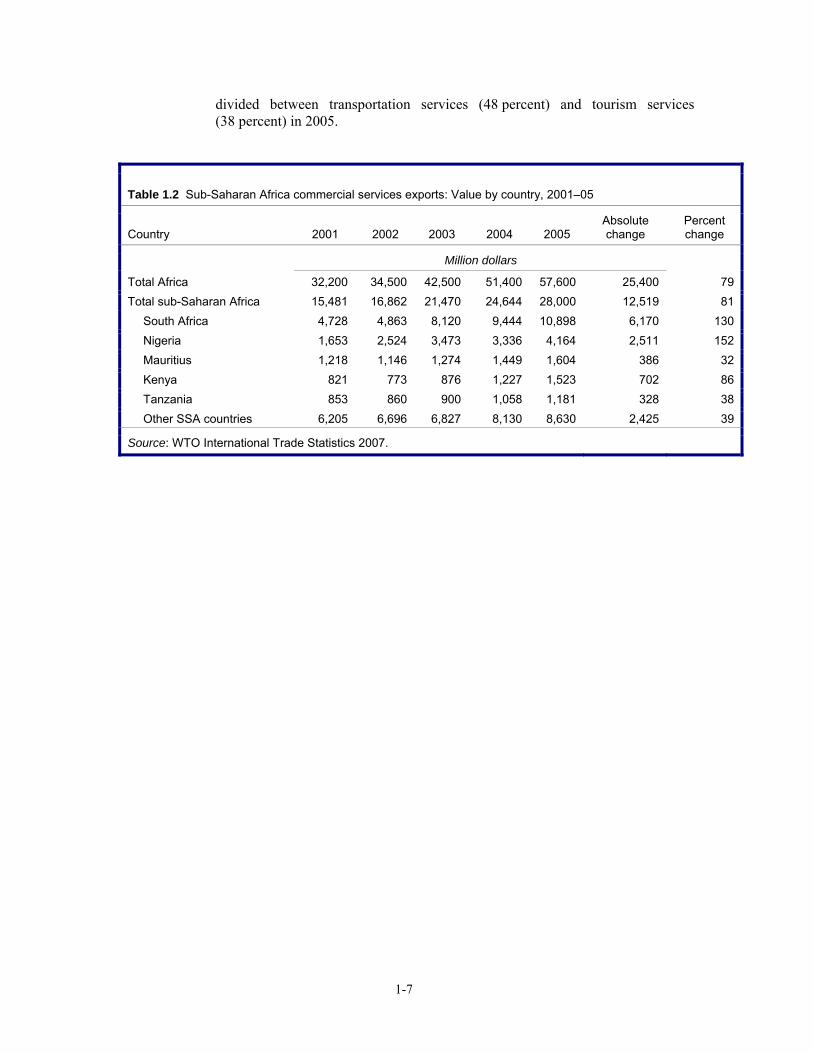
1-7
divided between transportation services (48 percent) and tourism services (38 percent) in 2005.
Table 1.2 Sub-Saharan Africa commercial services exports: Value by country, 2001–05
Country 2001 2002 2003 2004 2005 Absolute change
Percent change
Million dollars
Total Africa 32,200 34,500 42,500 51,400 57,600 25,400 79Total sub-Saharan Africa 15,481 16,862 21,470 24,644 28,000 12,519 81 South Africa 4,728 4,863 8,120 9,444 10,898 6,170 130 Nigeria 1,653 2,524 3,473 3,336 4,164 2,511 152 Mauritius 1,218 1,146 1,274 1,449 1,604 386 32 Kenya 821 773 876 1,227 1,523 702 86 Tanzania 853 860 900 1,058 1,181 328 38 Other SSA countries 6,205 6,696 6,827 8,130 8,630 2,425 39
Source: WTO International Trade Statistics 2007.

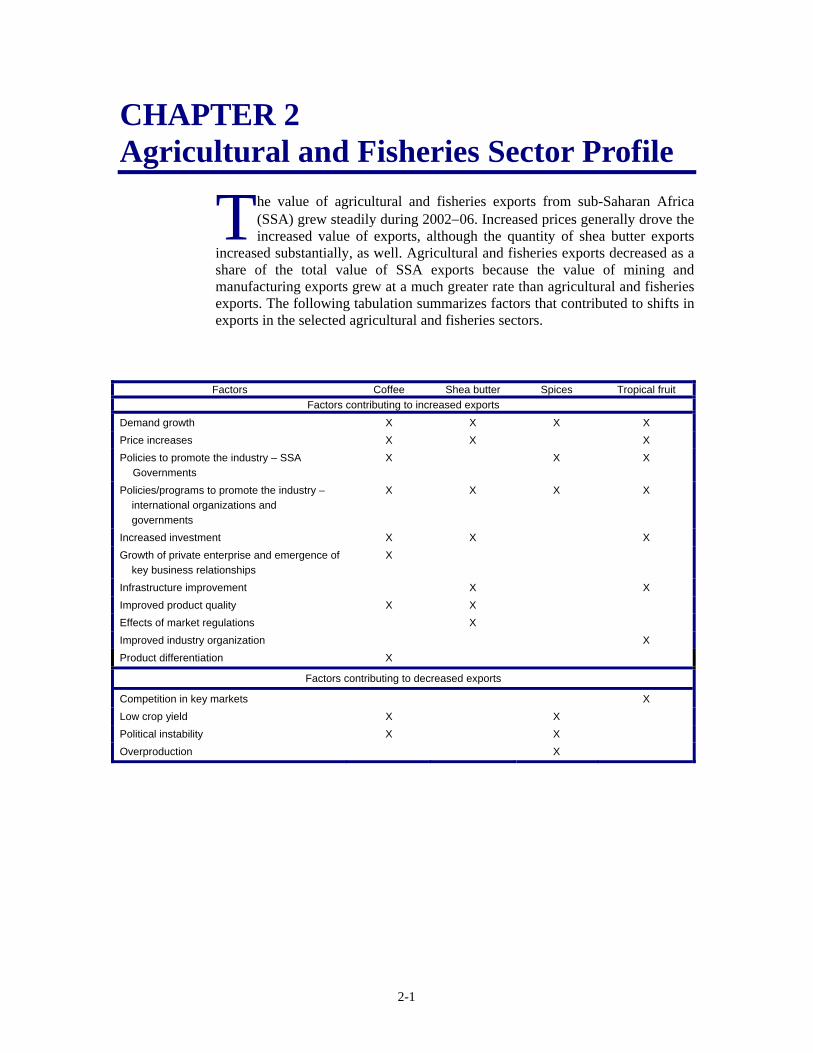
2-1
CHAPTER 2 Agricultural and Fisheries Sector Profile
he value of agricultural and fisheries exports from sub-Saharan Africa (SSA) grew steadily during 2002−06. Increased prices generally drove the increased value of exports, although the quantity of shea butter exports
increased substantially, as well. Agricultural and fisheries exports decreased as a share of the total value of SSA exports because the value of mining and manufacturing exports grew at a much greater rate than agricultural and fisheries exports. The following tabulation summarizes factors that contributed to shifts in exports in the selected agricultural and fisheries sectors.
T
Factors Coffee Shea butter Spices Tropical fruit Factors contributing to increased exports
Demand growth X X X X Price increases X X X Policies to promote the industry – SSA Governments
X X X
Policies/programs to promote the industry – international organizations and governments
X X X X
Increased investment X X X Growth of private enterprise and emergence of key business relationships
X
Infrastructure improvement X X Improved product quality X X Effects of market regulations X Improved industry organization X Product differentiation X
Factors contributing to decreased exports
Competition in key markets X Low crop yield X X Political instability X X Overproduction X
2-2
Coffee
Summary of Findings The value of SSA coffee exports increased each year during 2002−06, and by 82 percent to $1.1 billion between 2002 and 2006 (table 2.1). Increases occurred for several SSA coffee-producing countries. The factors behind the overall increase were a sustained rebound in world coffee prices since 2002; greater demand for premium and gourmet coffee; ongoing liberalization of the coffee sectors in several SSA countries since the early 1990s; and success in enhancing demand by differentiating coffee by superior quality, production process, or geographic origin. The growing popularity of premium coffee in the United States in recent years has resulted in the United States becoming an increasingly important market for several SSA coffee exporters. Most of the value increase of SSA coffee exports resulted from higher prices. World commodity-grade coffee prices saw a dramatic rebound during this period, doubling from the depressed levels in the early part of this decade. Compared to value, the volume of SSA exports increased at a lower rate in Ethiopia, Kenya, Rwanda, and Tanzania.. In Côte d’Ivoire and Uganda, export volume actually declined during 2002−06. Nevertheless, for SSA as a whole, the growing demand by specialty and gourmet coffee producers for African-origin coffee beans contributed to some gains in volume, particularly in exports to the United States.
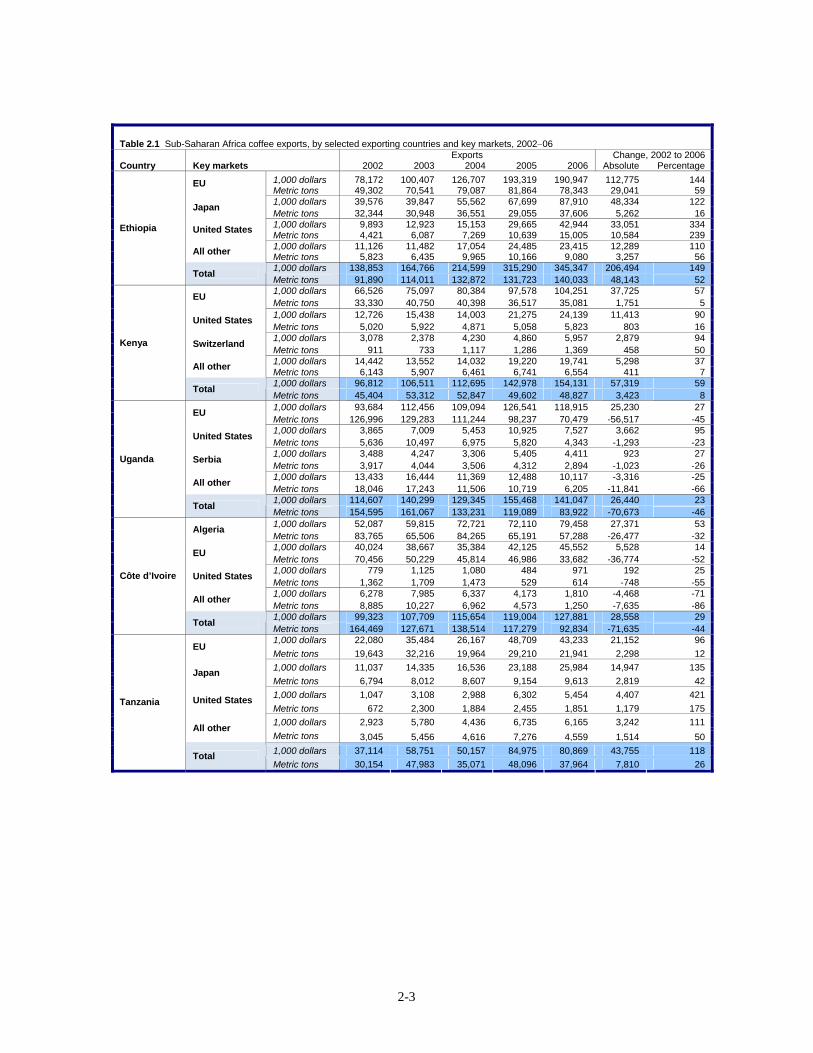
2-3
Table 2.1 Sub-Saharan Africa coffee exports, by selected exporting countries and key markets, 2002−06 Exports Change, 2002 to 2006 Country Key markets 2002 2003 2004 2005 2006 Absolute Percentage
1,000 dollars 78,172 100,407 126,707 193,319 190,947 112,775 144 EU Metric tons 49,302 70,541 79,087 81,864 78,343 29,041 59 1,000 dollars 39,576 39,847 55,562 67,699 87,910 48,334 122 Japan Metric tons 32,344 30,948 36,551 29,055 37,606 5,262 16 1,000 dollars 9,893 12,923 15,153 29,665 42,944 33,051 334 United States Metric tons 4,421 6,087 7,269 10,639 15,005 10,584 239 1,000 dollars 11,126 11,482 17,054 24,485 23,415 12,289 110 All other Metric tons 5,823 6,435 9,965 10,166 9,080 3,257 56 1,000 dollars 138,853 164,766 214,599 315,290 345,347 206,494 149
Ethiopia
Total Metric tons 91,890 114,011 132,872 131,723 140,033 48,143 52 1,000 dollars 66,526 75,097 80,384 97,578 104,251 37,725 57 EU Metric tons 33,330 40,750 40,398 36,517 35,081 1,751 5 1,000 dollars 12,726 15,438 14,003 21,275 24,139 11,413 90 United States Metric tons 5,020 5,922 4,871 5,058 5,823 803 16 1,000 dollars 3,078 2,378 4,230 4,860 5,957 2,879 94 Switzerland Metric tons 911 733 1,117 1,286 1,369 458 50 1,000 dollars 14,442 13,552 14,032 19,220 19,741 5,298 37 All other Metric tons 6,143 5,907 6,461 6,741 6,554 411 7 1,000 dollars 96,812 106,511 112,695 142,978 154,131 57,319 59
Kenya
Total Metric tons 45,404 53,312 52,847 49,602 48,827 3,423 8 1,000 dollars 93,684 112,456 109,094 126,541 118,915 25,230 27 EU Metric tons 126,996 129,283 111,244 98,237 70,479 -56,517 -45 1,000 dollars 3,865 7,009 5,453 10,925 7,527 3,662 95 United States Metric tons 5,636 10,497 6,975 5,820 4,343 -1,293 -23 1,000 dollars 3,488 4,247 3,306 5,405 4,411 923 27 Serbia Metric tons 3,917 4,044 3,506 4,312 2,894 -1,023 -26 1,000 dollars 13,433 16,444 11,369 12,488 10,117 -3,316 -25 All other Metric tons 18,046 17,243 11,506 10,719 6,205 -11,841 -66 1,000 dollars 114,607 140,299 129,345 155,468 141,047 26,440 23
Uganda
Total Metric tons 154,595 161,067 133,231 119,089 83,922 -70,673 -46 1,000 dollars 52,087 59,815 72,721 72,110 79,458 27,371 53 Algeria Metric tons 83,765 65,506 84,265 65,191 57,288 -26,477 -32 1,000 dollars 40,024 38,667 35,384 42,125 45,552 5,528 14 EU Metric tons 70,456 50,229 45,814 46,986 33,682 -36,774 -52 1,000 dollars 779 1,125 1,080 484 971 192 25 United States Metric tons 1,362 1,709 1,473 529 614 -748 -55 1,000 dollars 6,278 7,985 6,337 4,173 1,810 -4,468 -71 All other Metric tons 8,885 10,227 6,962 4,573 1,250 -7,635 -86 1,000 dollars 99,323 107,709 115,654 119,004 127,881 28,558 29
Côte d’Ivoire
Total Metric tons 164,469 127,671 138,514 117,279 92,834 -71,635 -44 1,000 dollars 22,080 35,484 26,167 48,709 43,233 21,152 96
EU Metric tons 19,643 32,216 19,964 29,210 21,941 2,298 12 1,000 dollars 11,037 14,335 16,536 23,188 25,984 14,947 135 Japan Metric tons 6,794 8,012 8,607 9,154 9,613 2,819 42 1,000 dollars 1,047 3,108 2,988 6,302 5,454 4,407 421 United States Metric tons 672 2,300 1,884 2,455 1,851 1,179 175 1,000 dollars 2,923 5,780 4,436 6,735 6,165 3,242 111 All other Metric tons 3,045 5,456 4,616 7,276 4,559 1,514 50 1,000 dollars 37,114 58,751 50,157 84,975 80,869 43,755 118
Tanzania
Total Metric tons 30,154 47,983 35,071 48,096 37,964 7,810 26
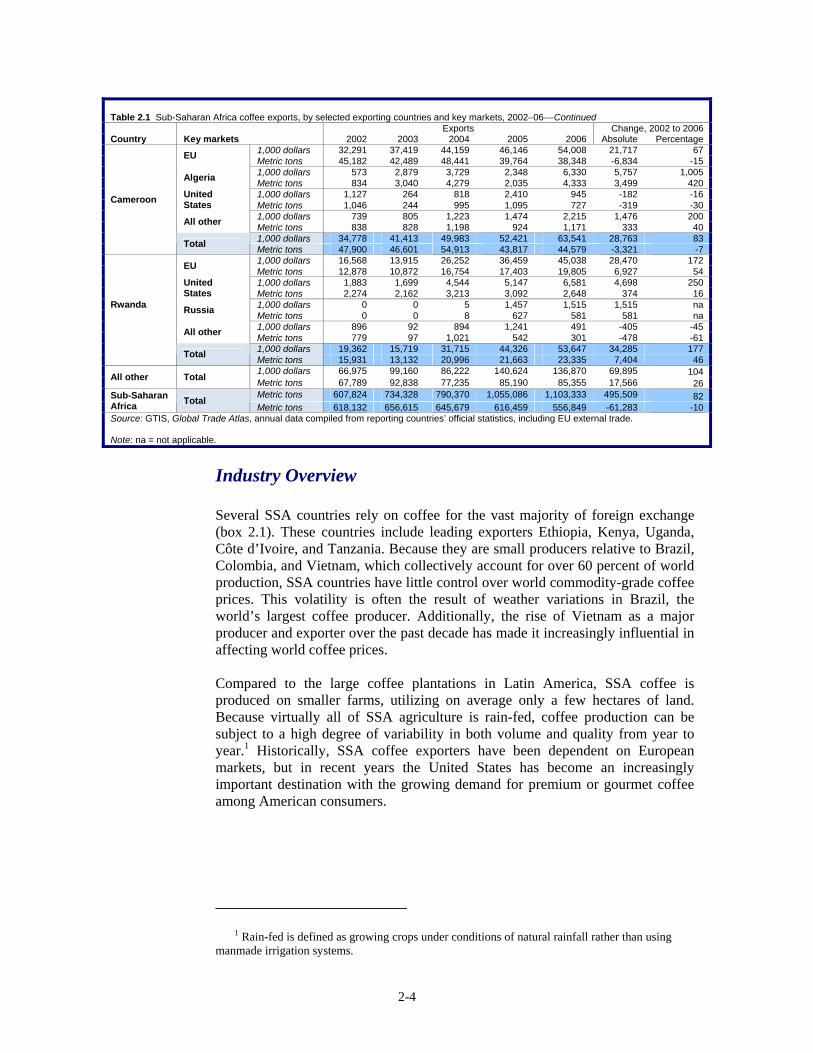
2-4
Industry Overview Several SSA countries rely on coffee for the vast majority of foreign exchange (box 2.1). These countries include leading exporters Ethiopia, Kenya, Uganda, Côte d’Ivoire, and Tanzania. Because they are small producers relative to Brazil, Colombia, and Vietnam, which collectively account for over 60 percent of world production, SSA countries have little control over world commodity-grade coffee prices. This volatility is often the result of weather variations in Brazil, the world’s largest coffee producer. Additionally, the rise of Vietnam as a major producer and exporter over the past decade has made it increasingly influential in affecting world coffee prices. Compared to the large coffee plantations in Latin America, SSA coffee is produced on smaller farms, utilizing on average only a few hectares of land. Because virtually all of SSA agriculture is rain-fed, coffee production can be subject to a high degree of variability in both volume and quality from year to year.1 Historically, SSA coffee exporters have been dependent on European markets, but in recent years the United States has become an increasingly important destination with the growing demand for premium or gourmet coffee among American consumers.
1 Rain-fed is defined as growing crops under conditions of natural rainfall rather than using
manmade irrigation systems.
Table 2.1 Sub-Saharan Africa coffee exports, by selected exporting countries and key markets, 2002−06−−Continued
Exports Change, 2002 to 2006 Country Key markets 2002 2003 2004 2005 2006 Absolute Percentage
1,000 dollars 32,291 37,419 44,159 46,146 54,008 21,717 67 EU Metric tons 45,182 42,489 48,441 39,764 38,348 -6,834 -15 1,000 dollars 573 2,879 3,729 2,348 6,330 5,757 1,005 Algeria Metric tons 834 3,040 4,279 2,035 4,333 3,499 420 1,000 dollars 1,127 264 818 2,410 945 -182 -16 United
States Metric tons 1,046 244 995 1,095 727 -319 -30 1,000 dollars 739 805 1,223 1,474 2,215 1,476 200 All other Metric tons 838 828 1,198 924 1,171 333 40 1,000 dollars 34,778 41,413 49,983 52,421 63,541 28,763 83
Cameroon
Total Metric tons 47,900 46,601 54,913 43,817 44,579 -3,321 -7 1,000 dollars 16,568 13,915 26,252 36,459 45,038 28,470 172 EU Metric tons 12,878 10,872 16,754 17,403 19,805 6,927 54 1,000 dollars 1,883 1,699 4,544 5,147 6,581 4,698 250 United
States Metric tons 2,274 2,162 3,213 3,092 2,648 374 16 1,000 dollars 0 0 5 1,457 1,515 1,515 na Russia Metric tons 0 0 8 627 581 581 na 1,000 dollars 896 92 894 1,241 491 -405 -45 All other Metric tons 779 97 1,021 542 301 -478 -61 1,000 dollars 19,362 15,719 31,715 44,326 53,647 34,285 177
Rwanda
Total Metric tons 15,931 13,132 20,996 21,663 23,335 7,404 46 1,000 dollars 66,975 99,160 86,222 140,624 136,870 69,895 104 All other Total Metric tons 67,789 92,838 77,235 85,190 85,355 17,566 26 Metric tons 607,824 734,328 790,370 1,055,086 1,103,333 495,509 82 Sub-Saharan
Africa Total Metric tons 618,132 656,615 645,679 616,459 556,849 -61,283 -10
Source: GTIS, Global Trade Atlas, annual data compiled from reporting countries’ official statistics, including EU external trade. Note: na = not applicable.
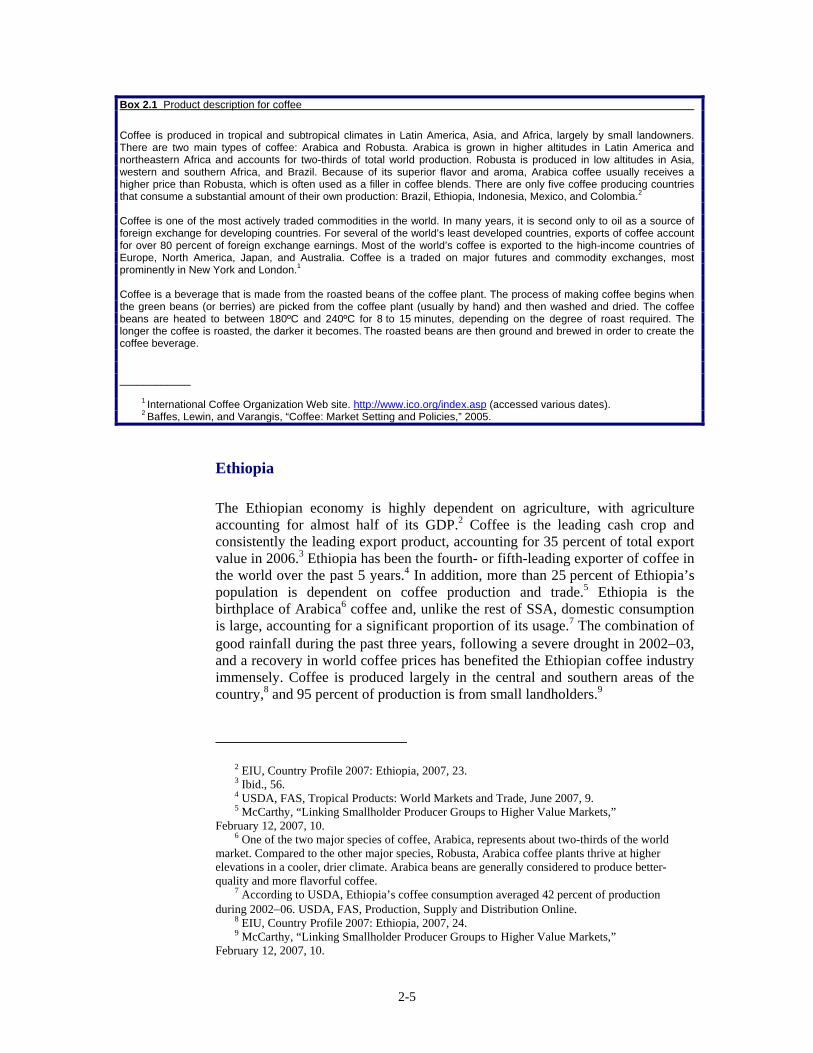
2-5
Box 2.1 Product description for coffee Coffee is produced in tropical and subtropical climates in Latin America, Asia, and Africa, largely by small landowners. There are two main types of coffee: Arabica and Robusta. Arabica is grown in higher altitudes in Latin America and northeastern Africa and accounts for two-thirds of total world production. Robusta is produced in low altitudes in Asia, western and southern Africa, and Brazil. Because of its superior flavor and aroma, Arabica coffee usually receives a higher price than Robusta, which is often used as a filler in coffee blends. There are only five coffee producing countries that consume a substantial amount of their own production: Brazil, Ethiopia, Indonesia, Mexico, and Colombia.2
Coffee is one of the most actively traded commodities in the world. In many years, it is second only to oil as a source of foreign exchange for developing countries. For several of the world’s least developed countries, exports of coffee account for over 80 percent of foreign exchange earnings. Most of the world’s coffee is exported to the high-income countries of Europe, North America, Japan, and Australia. Coffee is a traded on major futures and commodity exchanges, most prominently in New York and London.1 Coffee is a beverage that is made from the roasted beans of the coffee plant. The process of making coffee begins when the green beans (or berries) are picked from the coffee plant (usually by hand) and then washed and dried. The coffee beans are heated to between 180ºC and 240ºC for 8 to 15 minutes, depending on the degree of roast required. The longer the coffee is roasted, the darker it becomes. The roasted beans are then ground and brewed in order to create the coffee beverage. ____________
1 International Coffee Organization Web site. http://www.ico.org/index.asp (accessed various dates). 2 Baffes, Lewin, and Varangis, “Coffee: Market Setting and Policies,” 2005.
Ethiopia
The Ethiopian economy is highly dependent on agriculture, with agriculture accounting for almost half of its GDP.2 Coffee is the leading cash crop and consistently the leading export product, accounting for 35 percent of total export value in 2006.3 Ethiopia has been the fourth- or fifth-leading exporter of coffee in the world over the past 5 years.4 In addition, more than 25 percent of Ethiopia’s population is dependent on coffee production and trade.5 Ethiopia is the birthplace of Arabica6 coffee and, unlike the rest of SSA, domestic consumption is large, accounting for a significant proportion of its usage.7 The combination of good rainfall during the past three years, following a severe drought in 2002−03, and a recovery in world coffee prices has benefited the Ethiopian coffee industry immensely. Coffee is produced largely in the central and southern areas of the country,8 and 95 percent of production is from small landholders.9
2 EIU, Country Profile 2007: Ethiopia, 2007, 23. 3 Ibid., 56. 4 USDA, FAS, Tropical Products: World Markets and Trade, June 2007, 9. 5 McCarthy, “Linking Smallholder Producer Groups to Higher Value Markets,”
February 12, 2007, 10. 6 One of the two major species of coffee, Arabica, represents about two-thirds of the world
market. Compared to the other major species, Robusta, Arabica coffee plants thrive at higher elevations in a cooler, drier climate. Arabica beans are generally considered to produce better-quality and more flavorful coffee.
7 According to USDA, Ethiopia’s coffee consumption averaged 42 percent of production during 2002−06. USDA, FAS, Production, Supply and Distribution Online.
8 EIU, Country Profile 2007: Ethiopia, 2007, 24. 9 McCarthy, “Linking Smallholder Producer Groups to Higher Value Markets,”
February 12, 2007, 10.
2-6
Kenya
Coffee is a major export for Kenya. However, farmers have successfully diversified their agricultural exports into cut flowers and fresh vegetables in recent years.10 Kenya is the third-largest coffee producer in Africa, and most of its production is exported.11 Ninety percent of the coffee grown in Kenya is Arabica, as Kenya has a comparative advantage in Arabica production due to higher altitudes.12 The majority of Kenya’s coffee is produced by small-scale farmers organized into cooperatives for marketing; however, several estates13 operate as well.14
Uganda
Coffee’s share of Uganda’s total exports has dropped considerably since the 1950s when it accounted for over 90 percent of total annual export value.15 Currently, coffee accounts for roughly 20 percent of total exports.16 Because of the collapse in world coffee prices that occurred in the early part of this decade, Uganda has continued to diversify into other commodities, but it still ranks among the top ten coffee exporters in the world.17 Unlike most other SSA coffee producing countries, Uganda primarily grows the Robusta18 variety rather than Arabica, and it accounts for almost 90 percent of Uganda’s total coffee production.19 The lower-grade Robusta coffee is used to meet local demand, while the higher-grade Robusta is exported.20 Uganda is the second-largest SSA coffee producer after Ethiopia; however, its coffee production has suffered from coffee wilt disease21 for the past several years. There is currently no known fungicide for this disease, so the infected trees
10 Kjollerstrom, Agro-based Industries and Growth, July 2007, 6−7. 11 USDA, FAS, Kenya Coffee, May 13, 2005, 2. 12 Loise W. Njeru (managing director, Coffee Board of Kenya) and Isaac Muchomba
(executive secretary, Coffee Board of Kenya), interview by Commission staff, Nairobi, Kenya, October 17, 2007.
13 Estates are coffee farms on large parcels of land. Estate coffee is the product of one farm, unmixed with coffee from other farms. Estate coffee is grown, processed, and roasted under the control of the estate farm. Estate coffee is unique to an individual farm.
14 EIU, Country Profile 2006: Kenya, 2007, 30. 15 EIU, Country Profile 2007: Uganda, 2007, 23. 16 Ibid. 17 USDA, FAS, Tropical Products: World Markets and Trade, June 2007, 9. 18 Robusta is the other major species of coffee besides Arabica and has about one-third of the
world market. Compared to Arabica, Robusta plants grow taller, are more resistant to pests and disease, and produce more fruits. It is grown in Africa and Brazil, and to a much smaller extent in Central America. The caffeine content of Robusta beans is about twice that of Arabica. Considered inferior-tasting to Arabica, Robusta is often used for instant coffee and in supermarket-grade blends.
19 EIU, Country Profile 2007: Uganda, 2007, 23. 20 Eugene Nsereko (commercial manager, NKG Coffee Alliance Trust), interview by
Commission staff, Kampala, Uganda, October 22, 2007. 21 Coffee wilt disease (CWD), scientifically known as Tracheomycosis, is caused by a fungus
that blocks water and nutrients from traveling to other parts of the coffee plant from the roots, in turn causing wilting and eventually death. The disease, which affects only Robusta varieties, was first reported in the Central Africa Republic in 1927.
2-7
must be destroyed and the growing area disinfected.22 The government and universities are collaborating in research to find a coffee tree that is resistant to coffee wilt disease.23 Uganda’s government coffee replanting program was introduced in 1992 with the objective of increasing the productivity of the sector by replacing old Robusta coffee plants with newer, high-yielding varieties and expanding the area planted with Arabica. This program is administered by the Uganda Coffee Development Authority24 and provides the new coffee plants to producers free of charge.25
Côte d’Ivoire
Côte d’Ivoire is Africa’s largest producer of Robusta coffee, ranking fourth or fifth in world production. Because of the relatively greater importance of cocoa26 to its economy, coffee export revenue is relatively less significant to Côte d’Ivoire than to some other SSA countries such as Ethiopia and Uganda. Growing cocoa is relatively less labor intensive compared to coffee and with cocoa prices relatively more attractive, farmers have been encouraged to produce cocoa for the past several years.27 In addition, Vietnam is a major world producer of Robusta, and its dramatic increase in production during the 1990s reduced Robusta prices for several years. Vietnam’s production has subsequently slowed since 2000, allowing Robusta prices to recover, and Côte d’Ivoire and Ugandan coffee exports have consequently benefited.28 However, widespread civil unrest in Côte d’Ivoire has reduced the volume of coffee exports during 2002−06, offsetting the infrastructure advantage it possesses through its seaports and road network, which is the most extensive in the West Africa region.29
Tanzania
The increase in world coffee prices in recent years, coupled with Tanzania’s movement toward premium and branded coffee, has resulted in a recovery in coffee production. Traditionally a large export earner for Tanzania, coffee production eased during the mid-1990s because of low world prices. About
22 Lewin, Giovannucci, and Varangis, Coffee Markets, 2004, 85. 23 Uganda Coffee Development Authority officials, interview by Commission staff, Kampala,
Uganda,October 22, 2007. 24 The Uganda Coffee Development Authority (UCDA) was established by statutory mandate
in 1991 following the liberalization of the coffee industry. The UCDA has a statutory mandate to promote and oversee the development of the entire coffee industry through research, quality assurance, and improved marketing. UCDA Web site http://www.ugandacoffee.org/index.php (accessed October 2–November 30, 2007).
25 Baffes, “Restructuring Uganda’s Coffee Industry,” October 2006, 14. 26 Côte d’Ivoire is also the world’s largest producer of cocoa, accounting for about 40 percent
of global supply. EIU, Country Profile 2007: Côte d’Ivoire, 2007, 30. 27 Jean-Louis Billon (chairman, Ivorian Chamber of Commerce and Industry), interview by
Commission staff, Abidjan, Côte d’Ivoire, October 24, 2007. 28 USDA, FAS, Production, Supply and Distribution Online. 29 EIU, Country Profile 2007: Côte d’Ivoire, 2007, 26.
2-8
95 percent of Tanzania’s coffee is produced by small landholders on plots averaging 1−2 hectares, with the remainder by larger, privately owned estates.30 About two-thirds of Tanzania’s coffee production is Arabica, with the remainder Robusta.31
Rwanda
Coffee re-emerged as Rwanda’s top export earner following the rebound in world coffee prices and a recovery in production. Production was negatively affected by the country’s civil unrest in the mid-1990s and by low global prices. Coffee production reached its highest level of the post-genocide period in 2006, but remains only half of the former average production volume.32 The strong demand for Rwanda’s best Arabica coffee, mainly by U.S. specialty coffee buyers and roasters, has improved the outlook for the country’s coffee sector.
Sub-Saharan Africa Trade in the Global Context
Global exports of coffee totaled $12.0 billion in 2006. This value represents a 103 percent increase from $5.9 billion in 2002.33 SSA coffee exports were $1.1 billion in 2006, accounting for 9 percent of the world total and down from 10 percent of the world total in 2002.
Leading Exporters
The largest exporter of coffee to the world is Brazil, followed by Colombia and Vietnam (figure 2.1).34 Brazil accounted for almost one-quarter of the value of global coffee exports in 2006, and the United States, the European Union, and Japan were the leading destinations for most coffee exporters. Reflecting the continued rebound in world coffee prices since 2002, the value of SSA coffee exports increased 82 percent from 2002 to 2006. Ethiopia represented almost one-third of the SSA coffee exports by value in 2006, followed by Kenya, Uganda, and Côte d’Ivoire. The primary export destinations for SSA coffee in 2006 were the European Union, Japan, the United States, and Algeria.
30 Baffes, “Tanzania’s Coffee Sector,” June 2003, 1. 31 Ibid. 32 EIU, Country Profile 2007: Rwanda, 2007, 27. 33 GTIS, Global Trade Atlas. 34 Ibid.
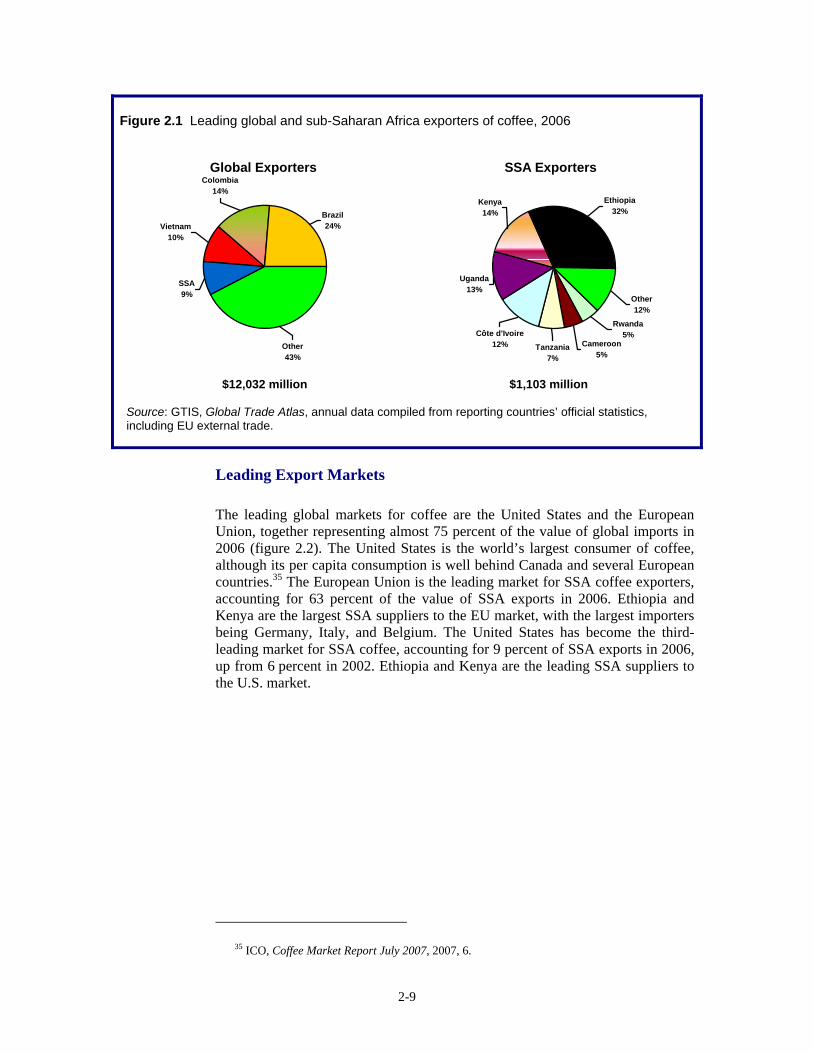
2-9
Leading Export Markets
The leading global markets for coffee are the United States and the European Union, together representing almost 75 percent of the value of global imports in 2006 (figure 2.2). The United States is the world’s largest consumer of coffee, although its per capita consumption is well behind Canada and several European countries.35 The European Union is the leading market for SSA coffee exporters, accounting for 63 percent of the value of SSA exports in 2006. Ethiopia and Kenya are the largest SSA suppliers to the EU market, with the largest importers being Germany, Italy, and Belgium. The United States has become the third-leading market for SSA coffee, accounting for 9 percent of SSA exports in 2006, up from 6 percent in 2002. Ethiopia and Kenya are the leading SSA suppliers to the U.S. market.
35 ICO, Coffee Market Report July 2007, 2007, 6.
Figure 2.1 Leading global and sub-Saharan Africa exporters of coffee, 2006
Global Exporters
SSA9%
Other43%
Colombia14%
Brazil24%Vietnam
10%
SSA Exporters
Other12%
Ethiopia32%
Kenya14%
Côte d'Ivoire12% Cameroon
5%Tanzania
7%
Rwanda5%
Uganda13%
$12,032 million $1,103 million
Source: GTIS, Global Trade Atlas, annual data compiled from reporting countries’ official statistics, including EU external trade.
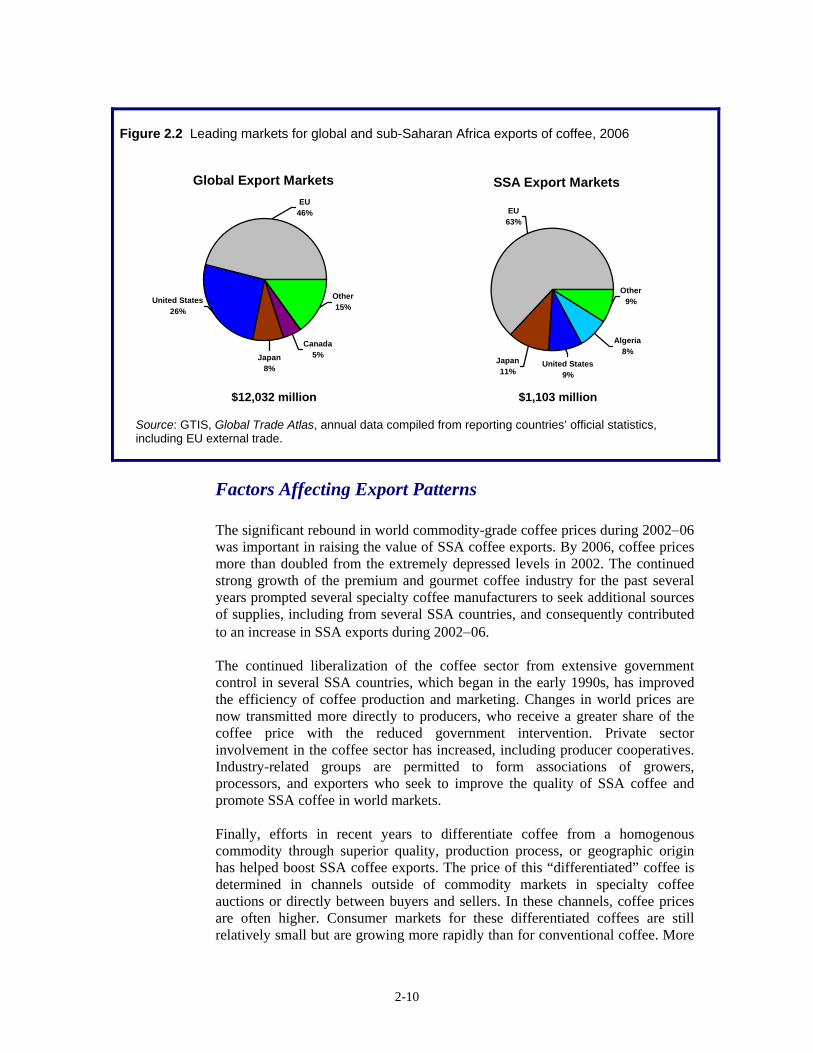
2-10
Factors Affecting Export Patterns The significant rebound in world commodity-grade coffee prices during 2002−06 was important in raising the value of SSA coffee exports. By 2006, coffee prices more than doubled from the extremely depressed levels in 2002. The continued strong growth of the premium and gourmet coffee industry for the past several years prompted several specialty coffee manufacturers to seek additional sources of supplies, including from several SSA countries, and consequently contributed to an increase in SSA exports during 2002−06. The continued liberalization of the coffee sector from extensive government control in several SSA countries, which began in the early 1990s, has improved the efficiency of coffee production and marketing. Changes in world prices are now transmitted more directly to producers, who receive a greater share of the coffee price with the reduced government intervention. Private sector involvement in the coffee sector has increased, including producer cooperatives. Industry-related groups are permitted to form associations of growers, processors, and exporters who seek to improve the quality of SSA coffee and promote SSA coffee in world markets. Finally, efforts in recent years to differentiate coffee from a homogenous commodity through superior quality, production process, or geographic origin has helped boost SSA coffee exports. The price of this “differentiated” coffee is determined in channels outside of commodity markets in specialty coffee auctions or directly between buyers and sellers. In these channels, coffee prices are often higher. Consumer markets for these differentiated coffees are still relatively small but are growing more rapidly than for conventional coffee. More
Figure 2.2 Leading markets for global and sub-Saharan Africa exports of coffee, 2006
Global Export Markets
Other15%
EU46%
Japan8%
United States26%
Canada5%
SSA Export Markets
Other9%
Algeria8%
Japan11%
United States9%
EU63%
$12,032 million $1,103 million Source: GTIS, Global Trade Atlas, annual data compiled from reporting countries’ official statistics, including EU external trade.
2-11
importantly, consumers appear willing to pay a premium for these characteristics. Consequently, several SSA countries have made strong efforts toward differentiating their coffee in order to capture these higher returns.
Price Increases and Demand Growth
Following a precipitous decline in world commodity-grade coffee prices to their lowest levels in 100 years in real terms in 2002,36 a sustained rebound in coffee prices has benefited SSA coffee exporters. The collapse in coffee prices from 1997 to 2002 had detrimental effects on several SSA coffee exporters. The rebound in world coffee prices since 2002 has largely resulted from smaller output levels from Brazil, the world’s largest coffee producer. Additionally, Vietnam’s coffee production, largely Robusta, has slowed in recent years after increasing dramatically in the 1990s. Global coffee consumption has also continuously increased since 2002, most notably in Brazil, the European Union, and the United States.37 The continued growth of demand for premium and gourmet coffee in the United States and other developed countries has resulted in an increased demand for high-quality coffee marketed by Starbucks and other premium coffee manufacturers.38 The specialty coffee market, which grew significantly in the past 15 years, now accounts for over 20 percent of the U.S. coffee market39 because of greater out-of-home consumption in cafes, coffee shops, and restaurants.40 Because of the specialty coffee industry’s consistent growth and the unique quality attributes of African coffee, Starbucks has purchased increasing amounts from SSA producers in recent years in order to expand its supply sources.41 Starbucks pays a premium for SSA coffee compared to prices on coffee exchanges in New York and London. In 2006, Starbucks bought coffee from six SSA countries: Burundi, Ethiopia, Kenya, Rwanda, Tanzania, and Zambia, although such purchases accounted for less than 10 percent of its global purchases. In 2007, Starbucks announced plans to double its coffee purchases from East Africa, the largest coffee-producing area in SSA.42 Other specialty coffee makers and large multinational coffee manufacturers43 are also increasing their purchases of African Arabica coffee because of the increasing demand for quality coffee. This trend is expected to continue.44 Surveys indicate the
36 ICO, The Global Coffee Crisis, August 21, 2002. 37 USDA, FAS, Production, Supply and Distribution Online. 38 Some of the other leading specialty coffee makers in the United States include Caribou
Coffee, Green Mountain, PJ's Coffee, and Peet’s Coffee & Tea. 39 Stephen P. McCarthy (senior technical specialist, ACDI/VOCA), interview with Commission
staff, Washington, DC, October 30, 2007. 40 Bryson, “Why the Coffee Kings Are Losing Their Power,” August 20, 2007. 41 These quality attributes include flavor and aroma that are unique to African coffee because of
the soil, climate, and altitude where the coffee is produced. 42 Xinhua News Agency. “Starbucks to Double Coffee Imports from East Africa.” May 8, 2007. 43 These manufacturers are Proctor and Gamble, Kraft, Sara Lee, and Nestle, the four largest
coffee manufacturers in the world. 44 Stephen P. McCarthy (senior technical specialist, ACDI/VOCA), interview with Commission
staff, Washington, DC, October 30, 2007.
2-12
improvement in quality over the past few years and the continued demand for this quality is likely to be sustained.45
Ongoing Liberalization of SSA Coffee Sectors
Several SSA countries reduced government involvement in their coffee sectors beginning in the early 1990s.46 Prior to these reforms, the governments of SSA coffee-producing countries had long controlled domestic marketing and trade because of coffee’s importance as a source of foreign exchange and government revenue. The two main factors behind the coffee sector reforms were the large decline in coffee prices caused by the end of the International Coffee Agreement (ICA)47 in 1989 and assistance by international financial institutions such as the World Bank and the International Monetary Fund that was tied to market reforms.48 The overhead costs of extensive government intervention were high, with farmers receiving a lower proportion of the export prices than they would have through a more efficient system. With the liberalization, growers have been paid more promptly and entrepreneurial activity has increased.49 The number of private exporting firms has increased, including producer cooperatives.50 Reduction in government involvement has allowed producer prices to be linked to world prices rather than fixed administrative prices and, as a consequence, producer prices have increased significantly as a share of the export price.51 The reduced government intervention has allowed exporters and buyers to directly interact, more effectively conveying quality concerns. Industry-related groups were permitted to form private associations of growers, processors, and exporters that sought to improve the quality of SSA coffee and to promote the SSA coffee in world markets. These associations include the Kenya Coffee Traders Association, the Uganda Coffee Development Authority, and the Eastern Africa Fine Coffees Association.
Ethiopia
Ethiopia’s coffee sector was removed from state control in 1991, when the Ethiopian People’s Revolutionary Party (ERDF) came into power. Since 1999, several coffee farmer cooperatives have been formed to provide a new marketing channel, which has encouraged farmers to improve the quality of their coffee by directly marketing their coffee for export.52 Ethiopia has also been successful in
45 Xinhua News Agency. “U.S. Firm Seeks to Improve Coffee Quality in East Africa,”
February 13, 2007. 46 This study identifies the factors during 2002–06 that caused an increase in SSA coffee
exports. Although many of these government reforms occurred during the 1990s, the result of these reforms likely assisted in raising the value of SSA coffee exports during 2002–06.
47 After World War II and until 1989, international coffee trade operated under the International Coffee Agreement (ICA), which allocated export quotas to individual coffee-producing countries in order to raise and stabilize prices.
48 Akiyama, “Coffee Market Liberalization since 1990,” 2001, 83. 49 Baffes, Lewin, and Varangis, “Coffee: Market Setting and Policies,” 2005, 305. 50 Akiyama, “Coffee Market Liberalization since 1990,” 2001, 96. 51 Ponte, “Coffee Markets in East Africa,” September 2001, 18. 52 Komada, “New Role of Cooperatives in Ethiopia,” March 2007, 102.
2-13
obtaining a premium price for its exports by developing organic coffee and branding Ethiopian coffee through “The Ethiopian Coffee Trademarking and Licensing Initiative.” The branding began in 2004 and Ethiopia has secured trademarks in several countries with licensed distributors.53
Kenya
In the last half of 2006, the government of Kenya authorized new legislation, known as the “Second Window,” creating a marketing channel to run concurrently with the central coffee auction, the traditional marketing outlet for Kenyan coffee producers held at the Nairobi Coffee Exchange.54 Kenya’s coffee farmers have long sought an alternative to the coffee auction in the belief that increased marketing competition would result in higher incomes. The Second Window allows farmers to sell directly to marketing agents for direct export of Kenyan coffee.55 The marketing agents are licensed and must demonstrate that they can access export markets, conduct market research, and provide a bank guarantee to protect farmers’ money.56
Côte d’Ivoire
Côte d’Ivoire removed its coffee and cocoa sectors from state control in the late 1990s as part of an IMF/World Bank structural adjustment program. Further sector reforms followed, and in 2001 the government’s price stabilization fund for coffee and cocoa was abolished and replaced by the Coffee and Cocoa Exchange (BCC), a private organization whose objective is to regulate the marketing and export of coffee and cocoa. Farmers comprise two-thirds of the BCC’s membership and exporters the remaining third.57 The BCC regulates and improves revenue of producers, coordinates exports of coffee and cocoa, and promotes the Ivorian coffee and cocoa label in international markets. The reforms in the sector were aimed at ensuring minimum revenue, establishing good purchasing prices, and setting competitive values.58
Tanzania
In the early 1990s, Tanzania eliminated several agricultural marketing boards that were directly involved with production and marketing.59 The Tanzania Coffee Board (TCB), formed in 1993, is now focused on quality control through licensing and regulation. The TCB also licenses all operators in the coffee
53 Ethiopian Coffee Network Web site. http://www.ethiopiancoffeenetwork.com (accessed
September 11, 2007). 54 USDA, FAS, Kenya Coffee: Kenya Coffee Annual Report 2007, May 14, 2007, 5. 55 Loise W. Njeru (managing director, Coffee Board of Kenya) and Isaac Muchomba
(executive secretary, Coffee Board of Kenya), interview by Commission staff, Nairobi, Kenya, October 17, 2007.
56 USDA, FAS, Kenya Coffee: Kenya Coffee Annual Report 2007, May 14, 2007, 5. 57 Tano Kassi Kadio (general manager, BCC), interview with Commission staff, Abidjan,
Côte d’Ivoire, October 25, 2007. 58 Ibid. 59 Beddies, et al., Tanzania Crop Boards Reform,” 2006, 492.
2-14
business and conducts central coffee auctions, where all coffee in Tanzania is sold to licensed exporters.60 In 2004, the TCB permitted the direct export of premium specialty coffee rather than through the central auction. This direct export has allowed Tanzanian producers to develop closer relationships with specialty coffee buyers in the United States and the European Union, and better understand their requirements for a reliable supply of consistent, high-quality coffee.61
Success in Differentiating Coffee from a Homogenous Commodity
Following liberalization of their coffee sectors in the early 1990s, Ethiopia, Kenya, Rwanda, Tanzania, and Uganda, made efforts toward differentiating their coffee to capture higher returns. For most of the industry, coffee is a commodity that continues to be largely priced on exchanges in New York and London. However, a growing number of producers and coffee manufacturers differentiate their coffee on the basis of quality, production process, or geographic origin. The price of this coffee is determined in channels outside of commodity markets in specialty coffee auctions or directly between buyer and seller. In these channels, coffee prices are often higher.62 The differentiated coffee market includes gourmet and specialty, organic, “fair trade,”63 and eco-friendly or shade-grown64 for which consumers appear willing to pay a premium.65 Consumer markets for these differentiated coffees are still relatively small but are growing more rapidly than for conventional coffee. By mid-2007, Ethiopia’s Coffee Trademarking and Licensing initiative had secured trademarks of Ethiopian coffee in 28 countries, including the European Union, Japan, and the United States.66 This trademarking of Ethiopian coffee is an attempt to use intellectual property rights to increase export revenues. The Ethiopian Fine Coffee Stakeholder Committee, a new group formed to manage this initiative is composed of cooperatives, private exporters, and the Ethiopian Intellectual Property Office and has a network of licensed distributors around the world.67 In June 2007, Starbucks and Ethiopia ended a dispute over this
60 Tanzania Coffee Board Web site. http://www.dreamweaver.co.uk/tcb/index.html (accessed
September 14, 2007). 61 OTF Group, Improving Competitiveness, 2005, 43–44. 62 For example, Ethiopian fine coffee have achieved far greater export prices when traded in
specialty coffee auctions. Ethiopian Coffee Network Web site. http://www.ethiopiancoffeenetwork.com (accessed October 9, 2007).
63 The International Fair Trade Association defines Fair Trade as “a trading partnership, based on dialogue, transparency and respect, which seeks greater equity in international trade. It contributes to sustainable development by offering better trading conditions to, and securing the rights of, marginalized producers and workers.” International Fair Trade Association Web site. http://www.ifat.org/ (accessed October 9, 2007).
64 Shade-grown or Eco-friendly coffee production maintains the environment through management of the forest canopy rather than producing coffee through traditional means under full or partial sun exposure.
65 Lewin, Giovannucci, and Varangis, “Coffee Markets: New Paradigms in Global Supply and Demand,” 2004, 100.
66 March, “Making the Origin Count: Two Coffees,” September 2007. 67 Ethiopian Coffee Network Web site. http://www.ethiopiancoffeenetwork.com (accessed
September 11, 2007).
2-15
trademark, and Starbucks is now able to use and promote Ethiopian coffee in its stores.68 Another example is Uganda’s Good African Coffee (GAC) Company, which was founded in 2003 to purchase coffee directly from growers at prices to ensure them profitable returns on their labor.69 GAC claims that it adds value to the coffee through its stringent quality controls during roasting, blending, and packaging. Although Uganda mostly produces the Robusta variety, GAC also uses Arabica varieties grown in the more mountainous region of Kasese, Uganda. GAC produces four different single-origin, roast, and ground coffees and one 100 percent Arabica freeze-dried coffee, which are named after regions in Kasese, where they originate. GAC’s products are now sold in large supermarkets in the United Kingdom, making GAC the first Ugandan coffee company to have a presence outside of Africa.70 Several U.S. Agency for International Development (USAID) projects in SSA countries have sought to improve quality differentiation in the specialty coffee market. According to USAID, its programs in Ethiopia, Malawi, Rwanda, Tanzania, Uganda, and Zambia have all made progress.71 In one example given by a USAID representative, a key quality issue for SSA is to increase the use of washing to separate coffee beans from other cherries produced by the coffee plant. Because of the lack of a sufficient water supply, most farmers use dry methods. During 2001−06, USAID allocated more than $10 million for the Rwandan coffee industry to develop coffee washing stations and rebuild local infrastructure, helping to improve quality.72
68 Mekay, “Starbucks Coffee Deal with Ethiopia Hailed As Model,” June 30, 2007. 69 Good Africa Coffee Company Web site. http://www.goodafrican.com/index.php (accessed
October 9, 2007). 70 allAfrica.com, “Uganda: Great African Coffee Steams Its Way to Europe, S. Africa,”
January 22, 2007. 71 Chris Kosnik (U.S. Agency for International Development), e-mail message to Commission
staff, September 15, 2007. 72 USAID, “USAID and Rwanda Ambassador Celebrate Rwandan Coffee (April 11),” 2007.
2-16
Coffee Bibliography Akiyama, Takamasa. “Coffee Market Liberalization since 1990.” In Commodity Market Reforms, edited by Takamasa Akiyama, John Baffes, Donald F. Larson, and Panos Varangis, 83–120. Washington, D.C.: The World Bank, 2001. allAfrica.com. “Uganda: Great African Coffee Steams Its Way to Europe, S. Africa,” January 22, 2007. http://w3.nexis.com/new/delivery/PrintDocdo?fileSize=233082&jobhandle=1862%3A39 (accessed various dates). Baffes, John. “Restructuring Uganda’s Coffee Industry: Why Going Back to the Basics Matters.” World Bank Policy Research Working Paper 4020, October 2006. Baffes, John. “Tanzania’s Coffee Sector: Constraints and Challenges in a Global Environment.” World Bank Africa Region Working Paper 56, June 2003. Baffes, John, Bryan Lewin, and Panos Varangis. “Coffee: Market Setting and Policies.” In Global Agricultural Trade and Developing Countries, edited by M. Ataman Aksoy and John C. Beghin, 297–309. Washington, D.C.: The World Bank, 2005. Beddies, Sabine, Maria Correia, Shashidhara Kolavalli, and Robert Townsend. “Tanzania Crop Boards Reform.” In Poverty and Social Impacts of Reforms, edited by Aline Coudouel, Anis A. Dani, and Stefano Paternostro, 491−520. Washington, D.C.: The World Bank, 2006. Bryson, York Emily. “Why the Coffee Kings Are Losing Their Power.” Advertising Age, August 20, 2007. http://adage.com/print?article_id=119940 (accessed various dates). Crown, Judith. “Coffee: The Generation Gap.” Business Week, October 8, 2007. http://www.businessweek.com/bwdaily/dnflash/content/oct2007/db2007105_442051.htm?chan=search (accessed various dates). Economist Intelligence Unit (EIU). “Trading up.” Business Africa, July 1, 2006. ——. Country Profile 2007: Côte d’Ivoire. 2007. ——. Country Profile 2006: Kenya. 2006. ——. Country Profile 2007: Ethiopia.2007. ——. Country Profile 2007: Rwanda. 2007. ——. Country Profile 2007: Uganda. 2007. ——. Country Report April 2007: Ethiopia. 2007. Global Trade Information Services, Inc. (GTIS). World Trade Atlas Database. Annual data complied from reporting countries’ official statistics, including EU27 external trade. http://www.gtis.com/gta/usitc/ (accessed various dates).
2-17
International Coffee Organization (ICO). Coffee market Report July 2007. London: ICO, 2007. http://dev.ico.org/documents/cmr0707e.pdf (accessed various dates). Kjollerstrom, Monica. Agro-based Industries and Growth: Prospects for sub-Saharan Africa. United Nations Department of Economic and Social Affairs. Innovation Briefs Issue 3, July 2007. Komada,Yuka. “New Role of Cooperatives in Ethiopia: The Case of Ethiopian Coffee Farmer Cooperatives.” African Study Monographs Supplementary Issue, 35 (March 2007): 87−108. Lewin, Bryan, Daniele Giovannucci, and Panos Varangis. Coffee Markets: New Paradigms in Global Supply and Demand. Washington, D.C.: The World Bank, 2004. https://scaa.org/pdfs/2004_Coffee_Markets.pdf (accessed various dates). McCarthy, Stephen. “Linking Smallholder Producer Groups to Higher Value Markets, Ethiopia’s Coffee Cooperatives: A Case Study.” Presentation to the World Bank on Rural Institutions, February 12, 2007. March, Elizabeth. “Making the Origin Count: Two Coffees.” WIPO Magazine, September 2007. http://www.wipo.int/wipo_magazine/en/2007/05/article_0001.html (accessed various dates). Mekay, Emad. “Starbucks Coffee Deal With Ethiopia Hailed As Model.” allAfrica.com, June 30, 2007. http://allafrica.com/stories/printable/200706300046.html (accessed various dates). OTF Group. Improving Competitiveness and Increasing Economic Growth in Tanzania: The Role of Information and Communication Technologies. Washington, D.C.: The World Bank, 2005. http://www.infodev.org/en/Publication.81.html (accessed various dates). PFK Consulting LTD. and International Research Network. Tea and coffee industry in Kenya. 2005. http://www.epzakenya.com/UserFiles/File/Beverages.pdf. Ponte, Stefano. “Coffee Markets in East Africa: Local Responses to Global Challenges or Global Responses to Local Challenges?” Centre for Development Research Working Paper 01.5, September 2001. Sebolt, Allison. “Coffee On-the-Go.” Food Business News, September 18, 2007. U.S. Agency for International Development (USAID). “USAID and Rwanda Ambassador Celebrate Rwandan Coffee (April 11).” Washington, D.C., 2007. U.S. Department of Agriculture (USDA). Foreign Agricultural Service (FAS). (Author: Kevin N. Smith). Kenya Coffee: Kenya Coffee Annual Report 2007. GAIN Report No. KE7005, May 14, 2007. ——. (Author: Mary Onsongo). Kenya Coffee: Kenya Coffee Annual Update Report 2005 GAIN Report No. KE5008, May 13, 2005. ——. Production, Supply and Distribution Online. http://www.fas.usda.gov/psdonline/psdHome.aspx (accessed various dates). ——. Tropical Products: World Markets and Trade. Circular Series FTROP 2-07, June 2007.
2-18
Wasserman, Miriam. “Trouble in Coffee Lands.” Regional Review, Federal Reserve Bank of Boston, Quarter 2, (2002): 4−12. http://www.bos.frb.org/economic/nerr/rr2002/q2/q202.pdf. Xinhua News Agency. “Starbucks to Double Coffee Imports from East Africa.” May 8, 2007. http://w3.nexis.com/new/delivery/PrintDoc.do?fileSize=2330082&jobHandle=1862%3A39 (accessed various dates). Xinhua News Agency. “U.S. Firm Seeks to Improve Coffee Quality in East Africa.” February 13, 2007. http://w3.nexis.com/new/delivery/PrintDoc.do?fileSize=2330082&jobHandle=1862%3A39 (accessed various dates).
2-19
Shea Butter73
Summary of Findings
Total shea SSA exports increased an estimated 35 percent during 2001–05, while shea butter exports increased 660 percent and shea nut exports increased 21 percent.74 Factors that have affected this growth include (1) rising demand for cocoa butter equivalents (CBEs)75 (2) increased prices, (3) growing consumer awareness of shea butter, (4) training/funding for improved production, and (5) increased private investment in SSA shea processing. Rising demand for CBEs, the result of growing world chocolate consumption, is considered the primary factor affecting international trade in shea butter. Increased investment in SSA processing, which resulted in higher SSA shea butter production, is also considered a major factor affecting the shift in SSA shea butter exports vis-à-vis shea nut exports.
Industry Overview
SSA producers account for all global shea nut production and are the major source of global trade in unrefined shea butter. Most refined shea butter is produced in Europe, which is a major exporter of refined shea butter and related downstream products. Shea nuts and butter are used in the production of a variety of products, including vegetable fats and cosmetics (box 2.2).
73 HTS subheadings 1207.99.02 and 1515.90.21 include shea and other nuts and oils/fat not
elsewhere specified or identified, respectively. SSA production is dispersed across large rural areas and is characterized by numerous small/micro-enterprises. Other products including cosmetics, lotions, hair products, and soaps (HS 3304, HTS 3305.10, HTS 3305.20, and HTS 3401.11.00) do not specify the percentage of shea in the final product. Industry representatives have stated in Commission interviews that there is no good source of trade and production data for shea nuts, butter, or downstream products. The best data available for trade and production are based on industry knowledge and are subjective. Therefore, this section is a qualitative analysis of the shea industry.
74 LMC International, Ltd., “The Impact of Directive 2000/26/EC,” June 2006. The term “shea” refers to both shea nuts and shea butter, similar to the use of the term cocoa when referring to both cocoa bean and cocoa butter.
75 CBEs are used sometimes as substitutes in confectionary products to replace cocoa butter due to costs and certain property differences.
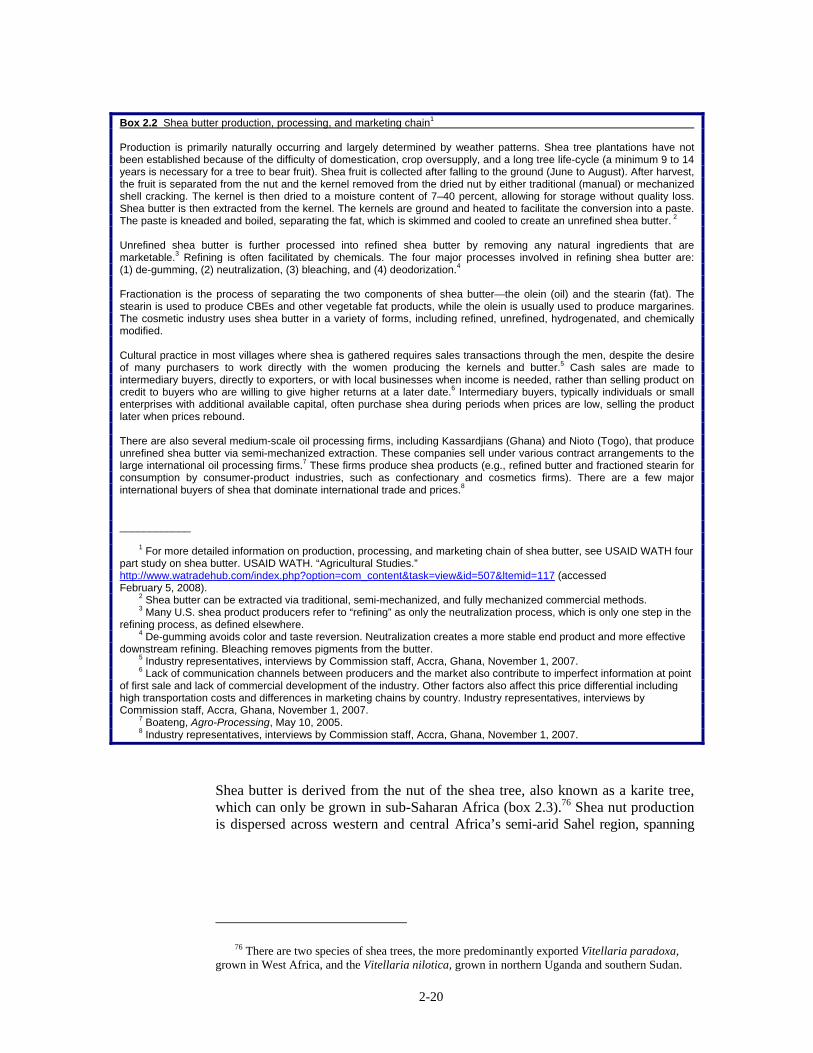
2-20
Box 2.2 Shea butter production, processing, and marketing chain1 Production is primarily naturally occurring and largely determined by weather patterns. Shea tree plantations have not been established because of the difficulty of domestication, crop oversupply, and a long tree life-cycle (a minimum 9 to 14 years is necessary for a tree to bear fruit). Shea fruit is collected after falling to the ground (June to August). After harvest, the fruit is separated from the nut and the kernel removed from the dried nut by either traditional (manual) or mechanized shell cracking. The kernel is then dried to a moisture content of 7–40 percent, allowing for storage without quality loss. Shea butter is then extracted from the kernel. The kernels are ground and heated to facilitate the conversion into a paste. The paste is kneaded and boiled, separating the fat, which is skimmed and cooled to create an unrefined shea butter. 2
Unrefined shea butter is further processed into refined shea butter by removing any natural ingredients that are marketable.3 Refining is often facilitated by chemicals. The four major processes involved in refining shea butter are: (1) de-gumming, (2) neutralization, (3) bleaching, and (4) deodorization.4 Fractionation is the process of separating the two components of shea butter—the olein (oil) and the stearin (fat). The stearin is used to produce CBEs and other vegetable fat products, while the olein is usually used to produce margarines. The cosmetic industry uses shea butter in a variety of forms, including refined, unrefined, hydrogenated, and chemically modified. Cultural practice in most villages where shea is gathered requires sales transactions through the men, despite the desire of many purchasers to work directly with the women producing the kernels and butter.5 Cash sales are made to intermediary buyers, directly to exporters, or with local businesses when income is needed, rather than selling product on credit to buyers who are willing to give higher returns at a later date.6 Intermediary buyers, typically individuals or small enterprises with additional available capital, often purchase shea during periods when prices are low, selling the product later when prices rebound. There are also several medium-scale oil processing firms, including Kassardjians (Ghana) and Nioto (Togo), that produce unrefined shea butter via semi-mechanized extraction. These companies sell under various contract arrangements to the large international oil processing firms.7 These firms produce shea products (e.g., refined butter and fractioned stearin for consumption by consumer-product industries, such as confectionary and cosmetics firms). There are a few major international buyers of shea that dominate international trade and prices.8 ____________
1 For more detailed information on production, processing, and marketing chain of shea butter, see USAID WATH four part study on shea butter. USAID WATH. “Agricultural Studies.” http://www.watradehub.com/index.php?option=com_content&task=view&id=507<emid=117 (accessed February 5, 2008).
2 Shea butter can be extracted via traditional, semi-mechanized, and fully mechanized commercial methods. 3 Many U.S. shea product producers refer to “refining” as only the neutralization process, which is only one step in the
refining process, as defined elsewhere. 4 De-gumming avoids color and taste reversion. Neutralization creates a more stable end product and more effective
downstream refining. Bleaching removes pigments from the butter. 5 Industry representatives, interviews by Commission staff, Accra, Ghana, November 1, 2007. 6 Lack of communication channels between producers and the market also contribute to imperfect information at point
of first sale and lack of commercial development of the industry. Other factors also affect this price differential including high transportation costs and differences in marketing chains by country. Industry representatives, interviews by Commission staff, Accra, Ghana, November 1, 2007.
7 Boateng, Agro-Processing, May 10, 2005. 8 Industry representatives, interviews by Commission staff, Accra, Ghana, November 1, 2007.
Shea butter is derived from the nut of the shea tree, also known as a karite tree, which can only be grown in sub-Saharan Africa (box 2.3).76 Shea nut production is dispersed across western and central Africa’s semi-arid Sahel region, spanning
76 There are two species of shea trees, the more predominantly exported Vitellaria paradoxa,
grown in West Africa, and the Vitellaria nilotica, grown in northern Uganda and southern Sudan.
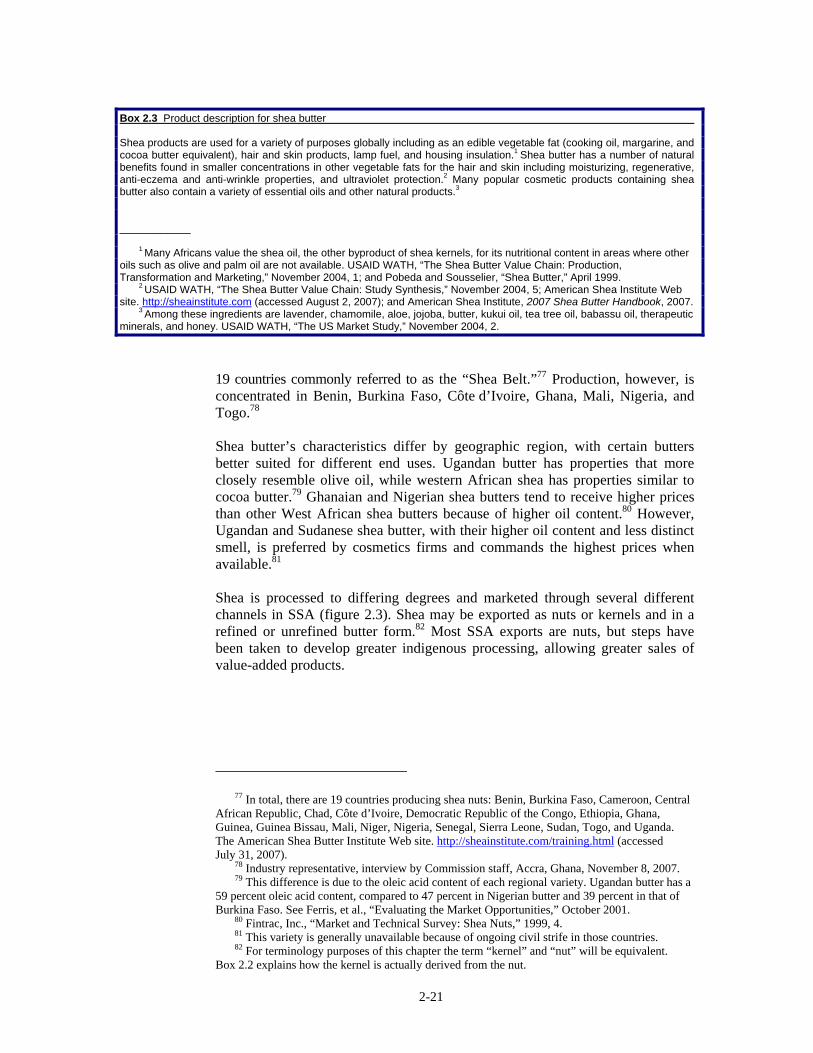
2-21
Box 2.3 Product description for shea butter Shea products are used for a variety of purposes globally including as an edible vegetable fat (cooking oil, margarine, and cocoa butter equivalent), hair and skin products, lamp fuel, and housing insulation.1 Shea butter has a number of natural benefits found in smaller concentrations in other vegetable fats for the hair and skin including moisturizing, regenerative, anti-eczema and anti-wrinkle properties, and ultraviolet protection.2 Many popular cosmetic products containing shea butter also contain a variety of essential oils and other natural products.3
____________
1 Many Africans value the shea oil, the other byproduct of shea kernels, for its nutritional content in areas where other oils such as olive and palm oil are not available. USAID WATH, “The Shea Butter Value Chain: Production, Transformation and Marketing,” November 2004, 1; and Pobeda and Sousselier, “Shea Butter,” April 1999.
2 USAID WATH, “The Shea Butter Value Chain: Study Synthesis,” November 2004, 5; American Shea Institute Web site. http://sheainstitute.com (accessed August 2, 2007); and American Shea Institute, 2007 Shea Butter Handbook, 2007.
3 Among these ingredients are lavender, chamomile, aloe, jojoba, butter, kukui oil, tea tree oil, babassu oil, therapeutic minerals, and honey. USAID WATH, “The US Market Study,” November 2004, 2.
19 countries commonly referred to as the “Shea Belt.”77 Production, however, is concentrated in Benin, Burkina Faso, Côte d’Ivoire, Ghana, Mali, Nigeria, and Togo.78 Shea butter’s characteristics differ by geographic region, with certain butters better suited for different end uses. Ugandan butter has properties that more closely resemble olive oil, while western African shea has properties similar to cocoa butter.79 Ghanaian and Nigerian shea butters tend to receive higher prices than other West African shea butters because of higher oil content.80 However, Ugandan and Sudanese shea butter, with their higher oil content and less distinct smell, is preferred by cosmetics firms and commands the highest prices when available.81 Shea is processed to differing degrees and marketed through several different channels in SSA (figure 2.3). Shea may be exported as nuts or kernels and in a refined or unrefined butter form.82 Most SSA exports are nuts, but steps have been taken to develop greater indigenous processing, allowing greater sales of value-added products.
77 In total, there are 19 countries producing shea nuts: Benin, Burkina Faso, Cameroon, Central
African Republic, Chad, Côte d’Ivoire, Democratic Republic of the Congo, Ethiopia, Ghana, Guinea, Guinea Bissau, Mali, Niger, Nigeria, Senegal, Sierra Leone, Sudan, Togo, and Uganda. The American Shea Butter Institute Web site. http://sheainstitute.com/training.html (accessed July 31, 2007).
78 Industry representative, interview by Commission staff, Accra, Ghana, November 8, 2007. 79 This difference is due to the oleic acid content of each regional variety. Ugandan butter has a
59 percent oleic acid content, compared to 47 percent in Nigerian butter and 39 percent in that of Burkina Faso. See Ferris, et al., “Evaluating the Market Opportunities,” October 2001.
80 Fintrac, Inc., “Market and Technical Survey: Shea Nuts,” 1999, 4. 81 This variety is generally unavailable because of ongoing civil strife in those countries. 82 For terminology purposes of this chapter the term “kernel” and “nut” will be equivalent.
Box 2.2 explains how the kernel is actually derived from the nut.
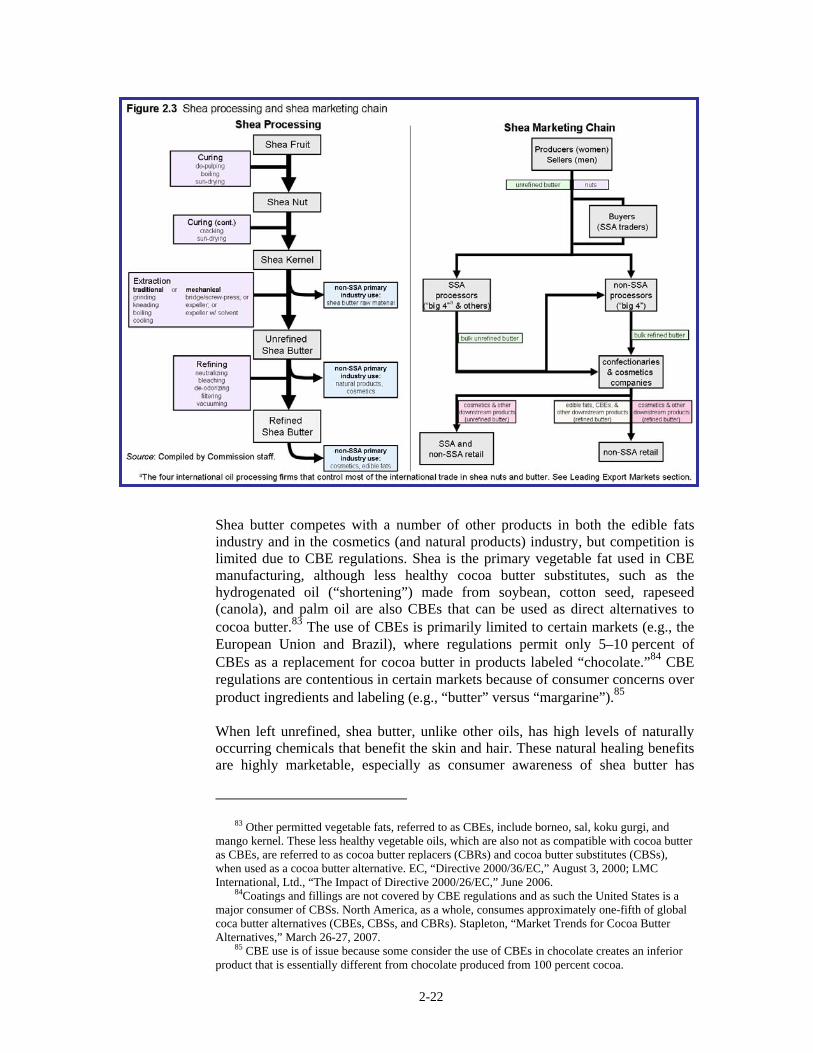
2-22
Shea butter competes with a number of other products in both the edible fats industry and in the cosmetics (and natural products) industry, but competition is limited due to CBE regulations. Shea is the primary vegetable fat used in CBE manufacturing, although less healthy cocoa butter substitutes, such as the hydrogenated oil (“shortening”) made from soybean, cotton seed, rapeseed (canola), and palm oil are also CBEs that can be used as direct alternatives to cocoa butter.83 The use of CBEs is primarily limited to certain markets (e.g., the European Union and Brazil), where regulations permit only 5–10 percent of CBEs as a replacement for cocoa butter in products labeled “chocolate.”84 CBE regulations are contentious in certain markets because of consumer concerns over product ingredients and labeling (e.g., “butter” versus “margarine”).85 When left unrefined, shea butter, unlike other oils, has high levels of naturally occurring chemicals that benefit the skin and hair. These natural healing benefits are highly marketable, especially as consumer awareness of shea butter has
83 Other permitted vegetable fats, referred to as CBEs, include borneo, sal, koku gurgi, and
mango kernel. These less healthy vegetable oils, which are also not as compatible with cocoa butter as CBEs, are referred to as cocoa butter replacers (CBRs) and cocoa butter substitutes (CBSs), when used as a cocoa butter alternative. EC, “Directive 2000/36/EC,” August 3, 2000; LMC International, Ltd., “The Impact of Directive 2000/26/EC,” June 2006.
84Coatings and fillings are not covered by CBE regulations and as such the United States is a major consumer of CBSs. North America, as a whole, consumes approximately one-fifth of global coca butter alternatives (CBEs, CBSs, and CBRs). Stapleton, “Market Trends for Cocoa Butter Alternatives,” March 26-27, 2007.
85 CBE use is of issue because some consider the use of CBEs in chocolate creates an inferior product that is essentially different from chocolate produced from 100 percent cocoa.
2-23
grown, creating an opportunity for SSA unrefined shea butter producers to increase the volume and value of exports. Demand for plant-derived natural chemicals grew by 4.6 percent annually during 2000–05.86 However, multinational oil-processing firms primarily process shea butter outside SSA using a method that creates a white, uniform, odorless refined butter more suitable as an emulsifier but lacking these healing benefits.87
Sub-Saharan Africa Trade in the Global Context
SSA countries primarily export shea nuts and butter, while Europe solely exports shea butter. SSA countries account for 100 percent of global production and export of shea nuts. Shea is primarily an export commodity for SSA with the equivalent of 80 percent of all shea nuts being exported in either nut or butter form. The seven major West African producing countries harvest approximately 500,000 mt of shea nuts per year. This compares to estimates of shea nut production in table 2.2, which represents best-case scenarios as yields normally fluctuate on a three-year cycle. SSA countries account for most unrefined shea butter production and exports, while Europe is the primary producer and exporter of refined shea butter. Shea butter is also produced in India and Japan. It is estimated that 30–54 percent of SSA shea nuts are exported. Assuming an average 500,000 mt annual nut harvest, approximately 150,000–270,000 mt of nuts are exported annually.88 The remainder (approximately 30,000–350,000 mt) is converted into 60,000–91,000 mt of crude or unrefined shea butter, of which half is exported.89
86 Demand has especially grown in the United States. USAID WATH, “The US Market Study,”
November 2004, 4. 87 Fintrac Inc., “A Marketing Manual for West Africa,” 2002. 88 USAID WATH, “Refining in West Africa,” October 2004, 2; and USAID WATH, “The
Shea Butter Value Chain: Production, Transformation and Marketing,” November 2004, 2. 89 USAID WATH, “Refining in West Africa,” October 2004, 2.
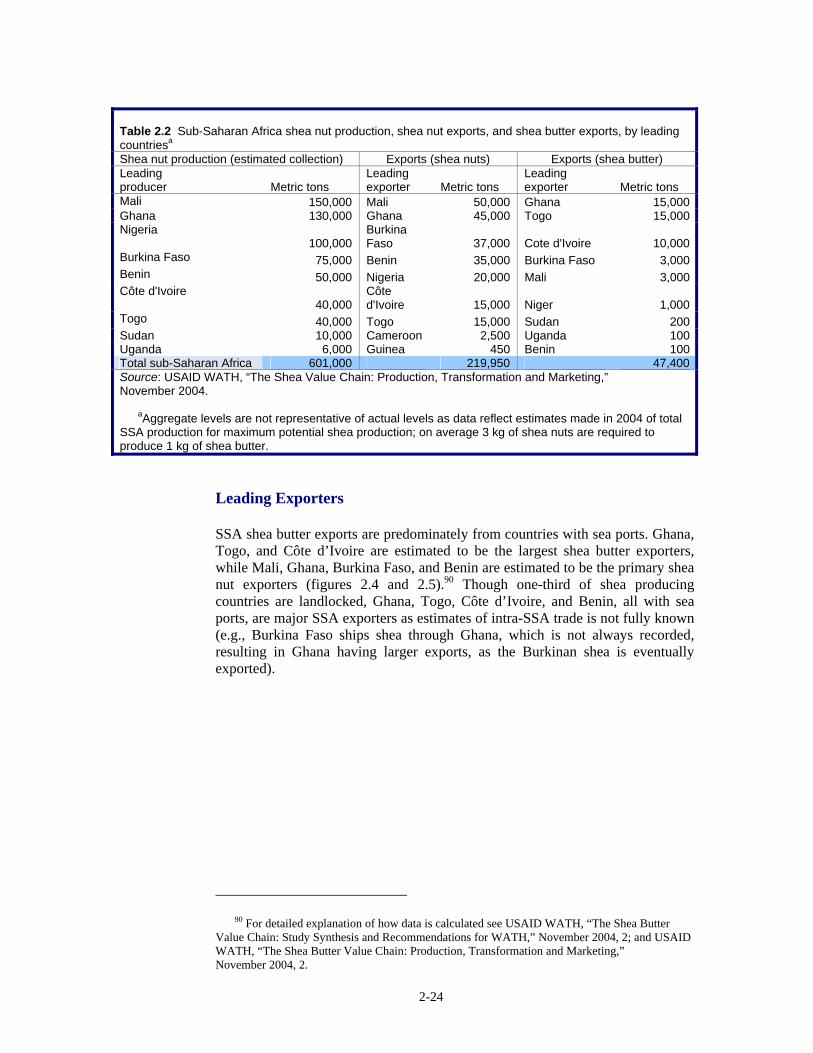
2-24
Leading Exporters
SSA shea butter exports are predominately from countries with sea ports. Ghana, Togo, and Côte d’Ivoire are estimated to be the largest shea butter exporters, while Mali, Ghana, Burkina Faso, and Benin are estimated to be the primary shea nut exporters (figures 2.4 and 2.5).90 Though one-third of shea producing countries are landlocked, Ghana, Togo, Côte d’Ivoire, and Benin, all with sea ports, are major SSA exporters as estimates of intra-SSA trade is not fully known (e.g., Burkina Faso ships shea through Ghana, which is not always recorded, resulting in Ghana having larger exports, as the Burkinan shea is eventually exported).
90 For detailed explanation of how data is calculated see USAID WATH, “The Shea Butter
Value Chain: Study Synthesis and Recommendations for WATH,” November 2004, 2; and USAID WATH, “The Shea Butter Value Chain: Production, Transformation and Marketing,” November 2004, 2.
Table 2.2 Sub-Saharan Africa shea nut production, shea nut exports, and shea butter exports, by leading countriesa
Shea nut production (estimated collection) Exports (shea nuts) Exports (shea butter) Leading producer Metric tons
Leading exporter Metric tons
Leading exporter Metric tons
Mali 150,000 Mali 50,000 Ghana 15,000 Ghana 130,000 Ghana 45,000 Togo 15,000 Nigeria
100,000 Burkina Faso 37,000 Cote d'Ivoire 10,000
Burkina Faso 75,000 Benin 35,000 Burkina Faso 3,000 Benin 50,000 Nigeria 20,000 Mali 3,000 Côte d'Ivoire
40,000 Côte d'Ivoire 15,000 Niger 1,000
Togo 40,000 Togo 15,000 Sudan 200 Sudan 10,000 Cameroon 2,500 Uganda 100 Uganda 6,000 Guinea 450 Benin 100 Total sub-Saharan Africa 601,000 219,950 47,400 Source: USAID WATH, “The Shea Value Chain: Production, Transformation and Marketing,” November 2004. aAggregate levels are not representative of actual levels as data reflect estimates made in 2004 of total SSA production for maximum potential shea production; on average 3 kg of shea nuts are required to produce 1 kg of shea butter.
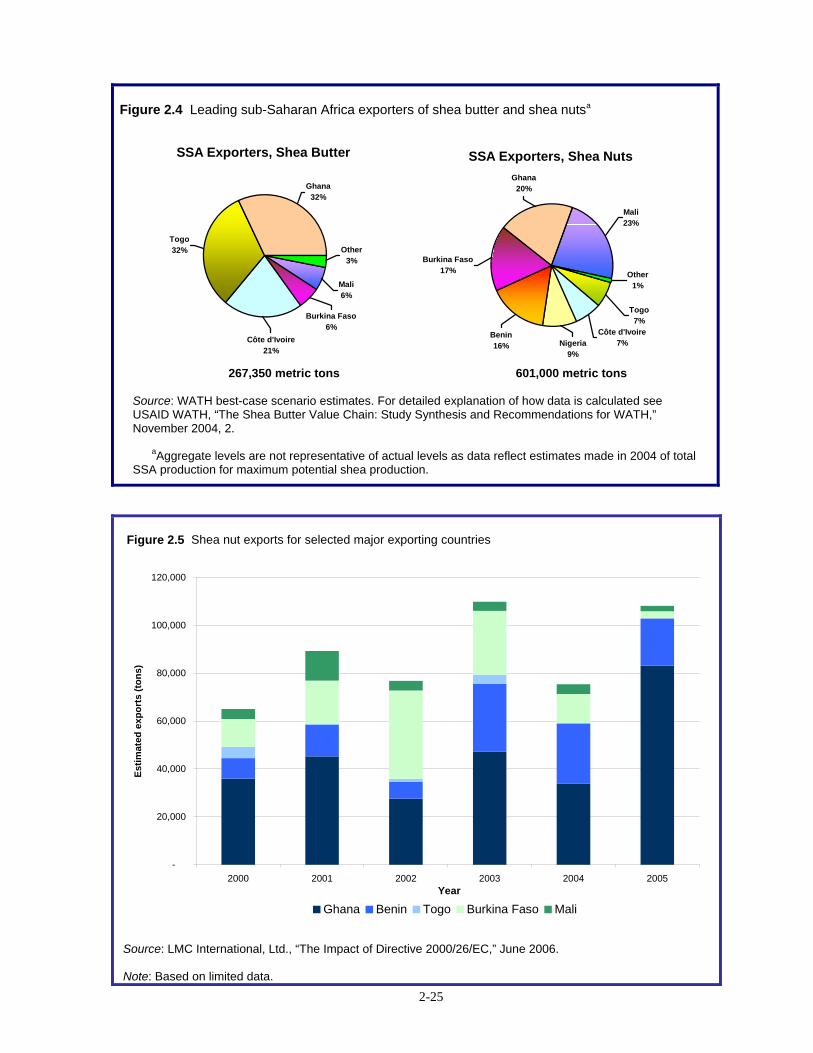
2-25
Figure 2.4 Leading sub-Saharan Africa exporters of shea butter and shea nutsa
SSA Exporters, Shea Butter
Other3%
Ghana32%
Togo32%
Burkina Faso6%
Côte d'Ivoire21%
Mali6%
SSA Exporters, Shea Nuts
Other1%
Mali23%
Ghana20%
Benin16%
Côte d'Ivoire7%Nigeria
9%
Togo7%
Burkina Faso17%
267,350 metric tons 601,000 metric tons Source: WATH best-case scenario estimates. For detailed explanation of how data is calculated see USAID WATH, “The Shea Butter Value Chain: Study Synthesis and Recommendations for WATH,” November 2004, 2. aAggregate levels are not representative of actual levels as data reflect estimates made in 2004 of total SSA production for maximum potential shea production.
Figure 2.5 Shea nut exports for selected major exporting countries
-
20,000
40,000
60,000
80,000
100,000
120,000
2000 2001 2002 2003 2004 2005Year
Estim
ated
exp
orts
(ton
s)
Ghana Benin Togo Burkina Faso Mali
Source: LMC International, Ltd., “The Impact of Directive 2000/26/EC,” June 2006. Note: Based on limited data.
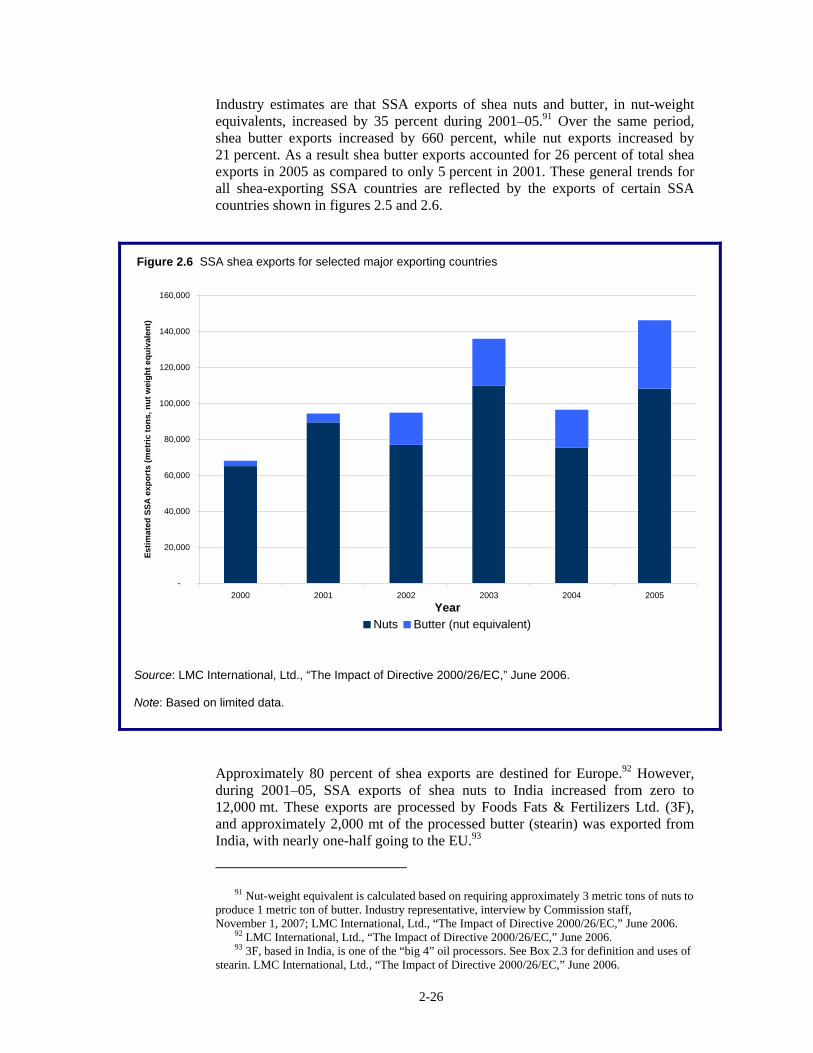
2-26
Figure 2.6 SSA shea exports for selected major exporting countries
-
20,000
40,000
60,000
80,000
100,000
120,000
140,000
160,000
2000 2001 2002 2003 2004 2005Year
Estim
ated
SSA
exp
orts
(met
ric to
ns, n
ut w
eigh
t equ
ival
ent)
Nuts Butter (nut equivalent)
Industry estimates are that SSA exports of shea nuts and butter, in nut-weight equivalents, increased by 35 percent during 2001–05.91 Over the same period, shea butter exports increased by 660 percent, while nut exports increased by 21 percent. As a result shea butter exports accounted for 26 percent of total shea exports in 2005 as compared to only 5 percent in 2001. These general trends for all shea-exporting SSA countries are reflected by the exports of certain SSA countries shown in figures 2.5 and 2.6.
Approximately 80 percent of shea exports are destined for Europe.92 However, during 2001–05, SSA exports of shea nuts to India increased from zero to 12,000 mt. These exports are processed by Foods Fats & Fertilizers Ltd. (3F), and approximately 2,000 mt of the processed butter (stearin) was exported from India, with nearly one-half going to the EU.93
91 Nut-weight equivalent is calculated based on requiring approximately 3 metric tons of nuts to
produce 1 metric ton of butter. Industry representative, interview by Commission staff, November 1, 2007; LMC International, Ltd., “The Impact of Directive 2000/26/EC,” June 2006.
92 LMC International, Ltd., “The Impact of Directive 2000/26/EC,” June 2006. 93 3F, based in India, is one of the “big 4” oil processors. See Box 2.3 for definition and uses of
stearin. LMC International, Ltd., “The Impact of Directive 2000/26/EC,” June 2006.
Source: LMC International, Ltd., “The Impact of Directive 2000/26/EC,” June 2006. Note: Based on limited data.
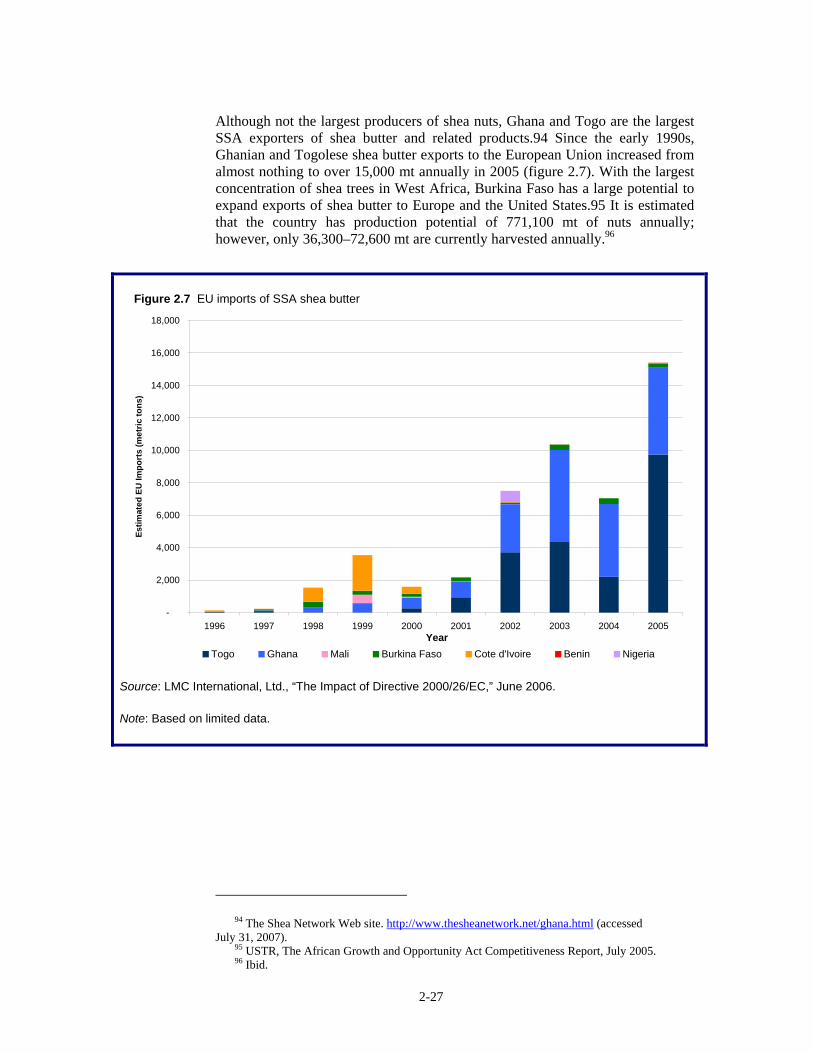
2-27
Figure 2.7 EU imports of SSA shea butter
-
2,000
4,000
6,000
8,000
10,000
12,000
14,000
16,000
18,000
1996 1997 1998 1999 2000 2001 2002 2003 2004 2005Year
Estim
ated
EU
Impo
rts
(met
ric to
ns)
Togo Ghana Mali Burkina Faso Cote d'Ivoire Benin Nigeria
Although not the largest producers of shea nuts, Ghana and Togo are the largest SSA exporters of shea butter and related products.94 Since the early 1990s, Ghanian and Togolese shea butter exports to the European Union increased from almost nothing to over 15,000 mt annually in 2005 (figure 2.7). With the largest concentration of shea trees in West Africa, Burkina Faso has a large potential to expand exports of shea butter to Europe and the United States.95 It is estimated that the country has production potential of 771,100 mt of nuts annually; however, only 36,300–72,600 mt are currently harvested annually.96
94 The Shea Network Web site. http://www.thesheanetwork.net/ghana.html (accessed
July 31, 2007). 95 USTR, The African Growth and Opportunity Act Competitiveness Report, July 2005. 96 Ibid.
Source: LMC International, Ltd., “The Impact of Directive 2000/26/EC,” June 2006. Note: Based on limited data.
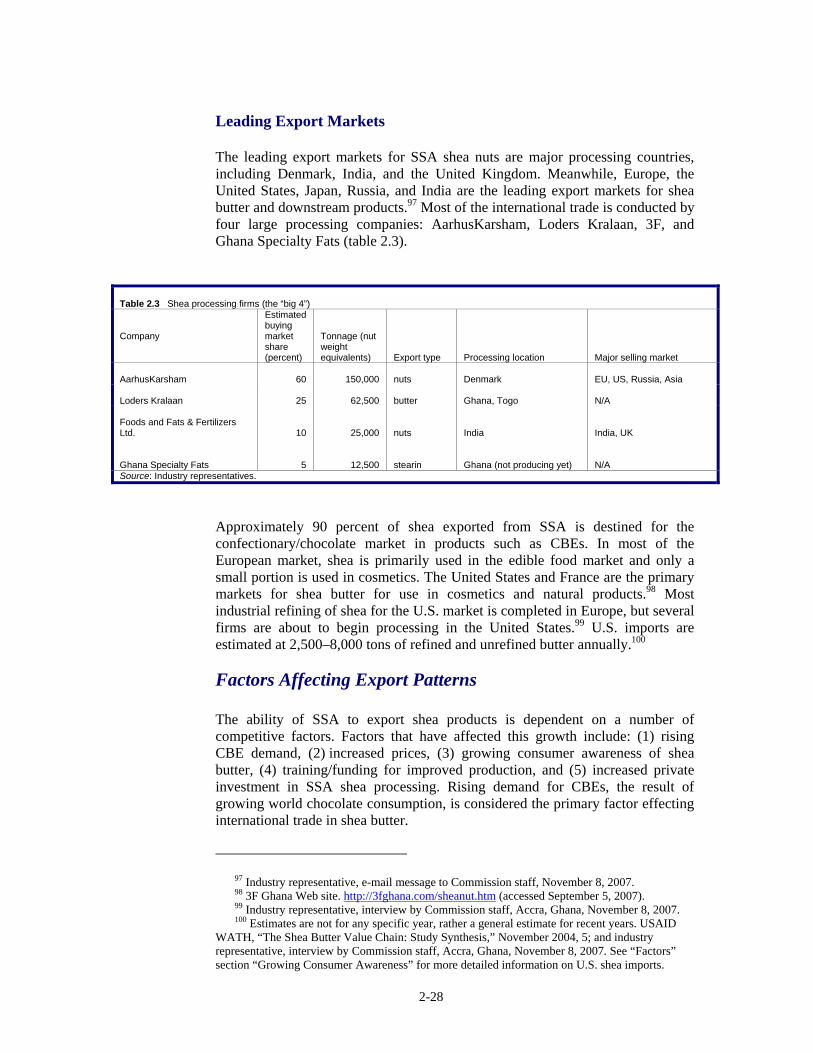
2-28
Leading Export Markets
The leading export markets for SSA shea nuts are major processing countries, including Denmark, India, and the United Kingdom. Meanwhile, Europe, the United States, Japan, Russia, and India are the leading export markets for shea butter and downstream products.97 Most of the international trade is conducted by four large processing companies: AarhusKarsham, Loders Kralaan, 3F, and Ghana Specialty Fats (table 2.3).
Approximately 90 percent of shea exported from SSA is destined for the confectionary/chocolate market in products such as CBEs. In most of the European market, shea is primarily used in the edible food market and only a small portion is used in cosmetics. The United States and France are the primary markets for shea butter for use in cosmetics and natural products.98 Most industrial refining of shea for the U.S. market is completed in Europe, but several firms are about to begin processing in the United States.99 U.S. imports are estimated at 2,500–8,000 tons of refined and unrefined butter annually.100
Factors Affecting Export Patterns
The ability of SSA to export shea products is dependent on a number of competitive factors. Factors that have affected this growth include: (1) rising CBE demand, (2) increased prices, (3) growing consumer awareness of shea butter, (4) training/funding for improved production, and (5) increased private investment in SSA shea processing. Rising demand for CBEs, the result of growing world chocolate consumption, is considered the primary factor effecting international trade in shea butter.
97 Industry representative, e-mail message to Commission staff, November 8, 2007. 98 3F Ghana Web site. http://3fghana.com/sheanut.htm (accessed September 5, 2007). 99 Industry representative, interview by Commission staff, Accra, Ghana, November 8, 2007. 100 Estimates are not for any specific year, rather a general estimate for recent years. USAID
WATH, “The Shea Butter Value Chain: Study Synthesis,” November 2004, 5; and industry representative, interview by Commission staff, Accra, Ghana, November 8, 2007. See “Factors” section “Growing Consumer Awareness” for more detailed information on U.S. shea imports.
Table 2.3 Shea processing firms (the “big 4”) Company
Estimated buying market share (percent)
Tonnage (nut weight equivalents)
Export type
Processing location
Major selling market
AarhusKarsham
60
150,000
nuts
Denmark
EU, US, Russia, Asia
Loders Kralaan
25
62,500
butter
Ghana, Togo
N/A
Foods and Fats & Fertilizers Ltd.
10
25,000
nuts
India
India, UK
Ghana Specialty Fats
5
12,500
stearin
Ghana (not producing yet)
N/A
Source: Industry representatives.
2-29
Rising Cocoa Butter Equivalent Demand
Demand for CBEs in Europe is the primary factor affecting demand for shea butter.101 From 2000 to 2005 the global CBE market grew approximately 20,000 mt (29 percent) to an estimated 90,000 mt.102 Though European markets are considered to be mature for chocolate and chocolate containing CBEs, demand is increasing for three reasons: (1) changes in CBE regulations in multiple countries/regions that allow use of CBEs in chocolate, (2) reduced demand for less healthy CBE substitutes, and (3) rising incomes in emerging economies (e.g., Latin America and Eastern Europe).103 Western Europe and East Asia consume nearly two-thirds of global CBE production, but most growth has occurred in new markets. Most Asian markets do not have any regulations on chocolate labeling with respect to CBEs. Though the European Union recently enacted new, more liberal CBE regulations, certain EU members already permitted the use of CBEs in products labeled chocolate, causing the regulation to have little impact on overall European consumption growth. The majority of the 2000–05 growth in CBE consumption occurred in markets, such as Brazil and Oceania, where similar legislation was passed. It is estimated that the Brazilian market for CBEs grew from zero in 2003 to 8,000 mt in 2005.104 Healthier eating and rising incomes caused the most significant growth in CBE consumption. Increased consumer demand for products containing limited or no trans fats resulted in greater demand for CBEs as chocolate manufacturers replace these hydrogenated fats with healthier fat substitutes, such as CBEs.105 The switch to CBEs was most predominant in Latin America (Brazil) and eastern and central Europe. Rising incomes in emerging countries in Latin America, Eastern Europe, and the Asia-Pacific region has resulted in increased chocolate consumption which, in turn, has increased demand for CBEs.
Increased Prices
The price of shea is mostly affected by its quality (e.g., oil and moisture content) and the price of cocoa (through shea’s use in CBEs). Increasingly, quality is becoming a more important factor than cocoa prices in determining the price received for shea as cosmetic demand grows. Cosmetic firms are expanding relationships directly with producers to ensure high-quality product by offering price premiums. Price premiums are paid for certain natural characteristics that also improve the butter’s desirability, such as higher oil content, and lower moisture content and free fatty acids.106 Other factors that attract premiums
101 Industry representative, interview by Commission staff, Accra, Ghana, November 2, 2007. 102 Stapleton, Gerard. “Market Trends for Cocoa Butter Alternatives.” LMC International Ltd.
Presented at the Cocoa Outlook 2007 on March 26–27, 2007. Oxford, UK. 103 LMC International, Ltd., “The Impact of Directive 2000/26/EC,” June 2006, 54. 104 Ibid. 105 The other primary cocoa substitutes are cocoa butter replacers (CBRs), which are typically
composed of vegetable fats from soybeans, cottonseed, rapeseed, and palm olein all of which require hydrogenation to form the correct consistency for use in chocolates. LMC International, Ltd. “The Impact of Directive 2000/26/EC,” June 2006, 54.
106 The price premium is received by the exporter.
2-30
include specific iodine values, melting points, and purity.107 These factors are partially determined by the production processes used in the refining of the butter. Cosmetic firms, such as The Body Shop, increasingly purchase shea directly from village women instead of village middlemen, who are traditionally men. By purchasing directly from women, firms ensure that price incentives for higher-quality nuts and butter are realized by the producers.108 Additionally, firms are able to directly work with individual women’s groups to provide them the necessary resources and skills to utilize best production practices.109 Though primarily linked to cocoa prices, shea prices also fluctuate considerably from year to year and seasonally in response to changes in production volumes, quality, and availability.110 Average annual prices during 2002–06 fluctuated between $300 and $400 per mt. Prices increased between 2000 and 2002 and fell from 2003 to 2005, only to rise sharply to record levels above $600 per mt in 2007. Comparatively, cocoa prices increased significantly in 2002 peaking at over $2,200 per mt, only to fall and fluctuate around $1,400 to $1,700 per mt before beginning a sharp rise at the end of 2006. Prices of $2,100 per mt at the end of 2007 were more than double the January 2002 price.111 The recent shea price increase since 2005 has been in part a result of increased purchases by the “big 4,” largely in response to increased demand.112
Growing Consumer Awareness
In recent years the cosmetics industry has promoted products containing unrefined shea butter to increase consumer awareness and build shea as a viable product to compete in the growing natural, organic market. Traditionally, the cosmetics industry preferred refined shea butter to unrefined because it is low-priced, readily available, of a consistent quality, and less likely to turn rancid.113 In the 1990s, European cosmetics companies, such as The Body Shop and L’Occitane, began incorporating, often in large quantities, unrefined shea butter into product lines while promoting its healing and “natural” characteristics.114 The Body Shop also actively promoted its shea products as “fair trade” through increasing awareness of the role rural African women play in producing shea.115
107 Boateng, Agro-Processing, May 10, 2005, 5. 108 Industry representative, interview by Commission staff, Accra, Ghana, November 8, 2007. 109 Ibid. 110 International Shea Butter Conference, October 5, 2007; LMC International, Ltd. “The
Impact of Directive 2000/26/EC,” June 2006, 84. 111 Industry representative, interview by Commission staff, Accra, Ghana, November 8, 2007;
International Cocoa Organization (ICCO), “ICCO Monthly Averages of Daily Prices,” February 4, 2008. http://www.icco.org/statistics/monthly.aspx?AD=2002&MD=1&AH=2008&MH=1&Tipo=Tabla&Datos=USD (accessed February 4, 2008).
112 According to industry representatives, during the current crop season, prices continued to increase when prices have historically declined. The exact reason for this is not known. Industry representative, interview by Commission staff, Accra, Ghana, November 8, 2007.
113 Ferris, et al., “Evaluating the Market Opportunities,” October 2001, 52. 114 Ibid. 115 This suggests to the consumer that paying a premium price for shea products returns greater
income to poor communities in Africa. Ferris, et al., “Evaluating the Market Opportunities,” October 2001, 10.
2-31
In the United States, most cosmetic firms traditionally purchased refined shea butter from European processors, but more recently there has been more interest in purchasing shea directly from Africa in order to obtain product containing greater levels of its natural, healing qualities.116 This gives Africa the opportunity to increase shea exports directly to the United States, improving Africans’ returns on exports.
Training/Funding for Improved Production
A number of poverty elimination and rural development programs were established across SSA to improve shea production and marketing. Among the organizations working in this area are U.S. and Japanese international development agencies and the U.N. Food and Agriculture Organization through the Common Fund for Commodities. Other programs, funded by organizations such as the World Bank, aim to improve the overall competitiveness of SSA across a broad array of products, including shea butter.117 These programs generally attempt to improve traditional, labor-intensive production practices that typically result in inconsistent and poor quality butter. Consistently high-quality shea butter likely receives price premiums from exports, as the butter is suitable for use in cosmetics.118 USAID and other organizations, such as the Prokarite Project, have provided extensive training and aid for increased mechanization in rural communities.119 Also, some small SSA cosmetic shea butter enterprises and larger international firms have gone directly to their shea butter sources to provide training, supervision, and machinery so that the end product meets their standards.120
Increased Private Sector Investment
Traditionally, multinational oil-processing firms produce shea butter in European refineries to ensure consistent quality and quantity. Recent investments by multinationals in SSA shea processing, such as in Ghana, increased capacity to produce bulk shea butter domestically, rather than export shea nuts for processing overseas. Shebu Ltd., a subsidiary of Loders Croklaan, emerged in 2001 as a major SSA shea butter extractor. Shebu purchases shea nuts from Loders Croklaan’s suppliers (Kassardjians and Olam) and produces shea butter for Loders Corklaan to export from SSA rather than shea nuts.121 In 2005 the shea butter extractor planned to further expand its suppliers through direct purchase. Loders Kralaan has moved to extract all of its shea butter within SSA. In Togo, the company sources shea butter from the single industrial processor, Nioto, which has resulted in a substantial shift in Togo’s exports from shea nuts to
116 Ferris, et al., “Evaluating the Market Opportunities,” October 2001, 52. 117 USAID WATH, “The Shea Butter Value Chain: Production, Transformation and
Marketing,” November 2004, X. 118 USAID WATH, “The Shea Butter Value Chain: Study Synthesis,” November 2004, 6. 119 Semi-mechanical methods have been introduced for extracting shea butter, such as roasters
and kneaders to improve Ghana’s traditional method’s low yields and efficiencies. In Northern Ghana, the diesel or electric plate-grinder is the most commonly used “advanced” technology and is used for a variety of agricultural products. USAID WATH, “The Shea Butter Value Chain: Study Synthesis,” November 2004, 6.
120 USAID WATH, “The Shea Butter Value Chain: Study Synthesis,” November 2004, 6. 121 Ferris, et al., “Evaluating the Market Opportunities,” October 2001, 26.
2-32
butter. Blue Mont Trading LTD installed a fractionation plant in Ghana in 2006, expanding processing capabilities from 40 mt per shift to 75 mt per shift.122 In 2006, ADM and Wilmar Holdings built a plant in Ghana that will begin its first processing season in 2007, producing stearin for export to the European market.123 In 2004, Cam, a Swiss group, invested $35.6 million in a partnership with a Burkinabe village chief to build the Oil Works and Metal Barrel Manufacturing Plant of Burkina with the capacity to extract 50,000 mt of shea butter annually and produce metal barrels for the packing of the shea butter.124
122 Boateng, Agro-Processing, May 10, 2005, 10. 123 Dialog Global Reporter, “U.S. Equity News,” 2006. 124 Financial Times, “Burkina Faso,” July 16, 2004.
2-33
Shea Butter Bibliography
American Shea Institute. 2007 Shea Butter Handbook. 5th Annual Shea Butter International Conference. October 5-6, 2007.
Boateng, Roselyn. Agro-Processing: Blue Mont Trading (Ghana) LTD. Accra, Ghana: Databank Research, May 10, 2005.
Business Wire. “Karlshamns Expects Considerable Growth Potentials from New EU Regulation.” June 28, 2000.
Economist Intelligence Unit. Country Profile 2007: Côte d’Ivoire. 2007.
——. Country Profile 2007: Ghana. 2007.
European Community (EC). “Directive 2000/36/EC of the European Parliament and Council of 23 June 2000 Relating to Cocoa and Chocolate Products Intended for Human Consumption.” Official Journal of the European Communities L 197/19, August 3, 2000.
Ferris R.S.B., C. Collinson, K. Wanda, J. Jagwe, and P. Wright. “Evaluating the Market Opportunities for Shea Nut and Shea Nut Processed Products in Uganda.” U.S. Agency for International Development. Foodnet and Natural Resources Institute. October 2001. http://www.foodnet.cgiar.org/Projects/Sheanut_Rep.pdf (accessed September 20, 2007).
Financial Times, “Burkina Faso: Shea Butter, Barrel Project with Swiss Group Approved,” July 16, 2004.
Fintrac, Inc. “Market and Technical Survey: Shea Nuts.” Prepared for USAID, May 1999.
Food Navigator.com Europe. “Aarhus links up for chocolate formulations in Brazil.” News Headlines. June 23, 2004. http://www.foodnavigator.com/news/ng.asp?id=53016-aarhus-links-up (accessed November 9, 2007).
International Shea Butter Conference, October 5, 2007.
LMC International, Ltd. “The Impact of Directive 2000/26/EC on the Economies of those Countries Producing Cocoa and Vegetable Fats Other than Cocoa Butter: Main Report.” Prepared for the European Commission – DG Agriculture and Rural Development. New York, June 2006.
Naude, Wim and Marianne Matthee. “The Significance of Transport Costs in Africa.” Policy Brief. No. 5. United Nations University. 2007.
Pobeda, M. and L. Sousselier. “Shea Butter: The Revival of an African Wonder.” Global Cosmetic Industry. 164, 4 (April 1999): 340–41.
U.S. Agency for International Development West Africa Trade Hub (USAID WATH). “Refining in West Africa.” West Africa Trade Hub Technical Report No. 3, October 2004.
——. “The Shea Butter Value Chain: Production, Transformation and Marketing in West Africa.” West Africa Trade Hub Technical Report No. 2, November 2004.
2-34
——. “The Shea Butter Value Chain: Study Synthesis and Recommendations for WATH.” West Africa Trade Hub Technical Report No. 1, November 2004.
——. “The US Market Study.” West Africa Trade Hub Technical Report No. 4, November 2004.
U.S. Trade Representative (USTR). The African Growth and Opportunity Act Competitiveness Report. Washington, DC: USTR, July 2005. http://www.ustr.gov/assets/Document_Library/Reports_Publications/2005/asset_upload_file604_7857.pdf (accessed September 26, 2007).
2-35
Spices125
Summary of Findings
Between 2002 and 2006, the value of SSA spice exports to all markets decreased by 47 percent (table 2.4). Adverse weather conditions during the period resulted in irregular production that contributed to considerable inter-year variability in prices. For example, rapid growth in export values during 2002–04 can be associated with higher vanilla prices in the wake of a cyclone that hit Madagascar’s vanilla-growing areas in 2000. Despite declines in export value during 2002–06, the quantity of spice exports increased by 3 percent, led by vanilla, cloves, and ginger. Factors contributing to this growth include increasing global demand for spices and programs designed to promote the industry and to encourage investment. These programs include funding for training in production, processing, and marketing. Political unrest in some countries offset these factors for spice exports.
Industry Overview
Spice exports from SSA involve a wide variety of products and every SSA country reported exports in 2006. However, exports are highly concentrated both in terms of products and exporting countries. In 2006, Madagascar was by far the largest spice-exporting country in SSA followed by South Africa, Comoros, and Tanzania (table 2.4). All other SSA countries exporting spices accounted for less than 5 percent of the region’s total. Vanilla beans, cloves, pepper,126 and ginger accounted for 93 percent of the $156 million in SSA spice exports in 2006. Nearly 50 percent of SSA spice exports were vanilla beans ($76 million), while cloves, pepper, and ginger together represented 44 percent ($41 million [26 percent], $19 million [12 percent], and $9 million [6 percent], respectively).
125 Owing to the dominance of vanilla, cloves, pepper, and ginger among SSA spice exports,
these products and the countries that export them will be the focus of this profile. Spices are defined as those products classified in Harmonized Schedule (HS) heading 0904, pepper, paprika, anaheim and ancho peppers, bell peppers, jalapeno peppers, and allspice; HS 0905, vanilla beans; HS 0906, cinnamon; HS 0907, cloves; HS 0908, nutmeg, mace, and cardamoms; HS 0909, seeds of anise, badian, fennel, coriander, cumin, caraway, and juniper berries; and HS 0910, ginger, saffron, turmeric, thyme, bay leaves, curry, origanum, and dill.
126 The largest category of pepper exported by SSA include the genuses Capsicum and Pimenta, which include paprika, anaheim, ancho, bell, and jalapeno. The other SSA pepper export is from the genus Piper, which includes black and white pepper.
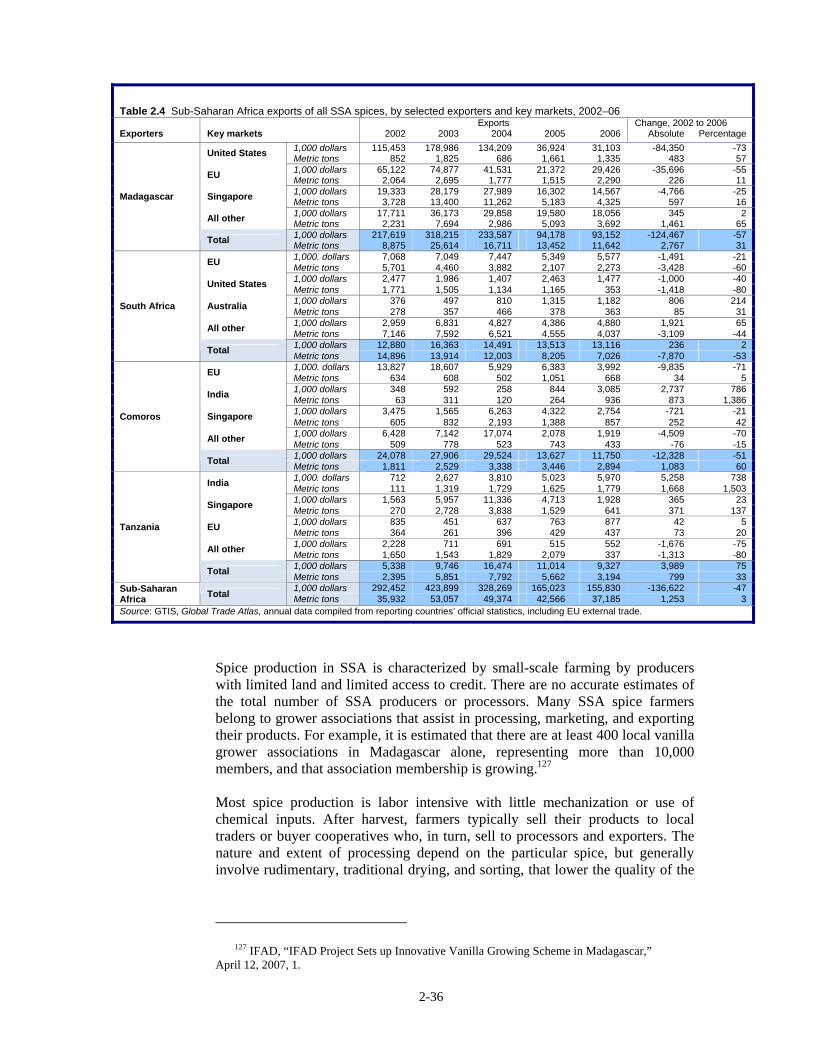
2-36
Spice production in SSA is characterized by small-scale farming by producers with limited land and limited access to credit. There are no accurate estimates of the total number of SSA producers or processors. Many SSA spice farmers belong to grower associations that assist in processing, marketing, and exporting their products. For example, it is estimated that there are at least 400 local vanilla grower associations in Madagascar alone, representing more than 10,000 members, and that association membership is growing.127 Most spice production is labor intensive with little mechanization or use of chemical inputs. After harvest, farmers typically sell their products to local traders or buyer cooperatives who, in turn, sell to processors and exporters. The nature and extent of processing depend on the particular spice, but generally involve rudimentary, traditional drying, and sorting, that lower the quality of the
127 IFAD, “IFAD Project Sets up Innovative Vanilla Growing Scheme in Madagascar,”
April 12, 2007, 1.
Table 2.4 Sub-Saharan Africa exports of all SSA spices, by selected exporters and key markets, 2002–06
Exports Change, 2002 to 2006 Exporters Key markets 2002 2003 2004 2005 2006 Absolute Percentage
1,000 dollars 115,453 178,986 134,209 36,924 31,103 -84,350 -73 United States Metric tons 852 1,825 686 1,661 1,335 483 57 1,000 dollars 65,122 74,877 41,531 21,372 29,426 -35,696 -55 EU Metric tons 2,064 2,695 1,777 1,515 2,290 226 11 1,000 dollars 19,333 28,179 27,989 16,302 14,567 -4,766 -25 Singapore Metric tons 3,728 13,400 11,262 5,183 4,325 597 16 1,000 dollars 17,711 36,173 29,858 19,580 18,056 345 2 All other Metric tons 2,231 7,694 2,986 5,093 3,692 1,461 65 1,000 dollars 217,619 318,215 233,587 94,178 93,152 -124,467 -57
Madagascar
Total Metric tons 8,875 25,614 16,711 13,452 11,642 2,767 31 1,000. dollars 7,068 7,049 7,447 5,349 5,577 -1,491 -21 EU Metric tons 5,701 4,460 3,882 2,107 2,273 -3,428 -60 1,000 dollars 2,477 1,986 1,407 2,463 1,477 -1,000 -40 United States Metric tons 1,771 1,505 1,134 1,165 353 -1,418 -80 1,000 dollars 376 497 810 1,315 1,182 806 214 Australia Metric tons 278 357 466 378 363 85 31 1,000 dollars 2,959 6,831 4,827 4,386 4,880 1,921 65 All other Metric tons 7,146 7,592 6,521 4,555 4,037 -3,109 -44 1,000 dollars 12,880 16,363 14,491 13,513 13,116 236 2
South Africa
Total Metric tons 14,896 13,914 12,003 8,205 7,026 -7,870 -53 1,000. dollars 13,827 18,607 5,929 6,383 3,992 -9,835 -71 EU Metric tons 634 608 502 1,051 668 34 5 1,000 dollars 348 592 258 844 3,085 2,737 786 India Metric tons 63 311 120 264 936 873 1,386 1,000 dollars 3,475 1,565 6,263 4,322 2,754 -721 -21 Singapore Metric tons 605 832 2,193 1,388 857 252 42 1,000 dollars 6,428 7,142 17,074 2,078 1,919 -4,509 -70 All other Metric tons 509 778 523 743 433 -76 -15 1,000 dollars 24,078 27,906 29,524 13,627 11,750 -12,328 -51
Comoros
Total Metric tons 1,811 2,529 3,338 3,446 2,894 1,083 60 1,000. dollars 712 2,627 3,810 5,023 5,970 5,258 738 India Metric tons 111 1,319 1,729 1,625 1,779 1,668 1,503 1,000 dollars 1,563 5,957 11,336 4,713 1,928 365 23 Singapore Metric tons 270 2,728 3,838 1,529 641 371 137 1,000 dollars 835 451 637 763 877 42 5 EU Metric tons 364 261 396 429 437 73 20 1,000 dollars 2,228 711 691 515 552 -1,676 -75 All other Metric tons 1,650 1,543 1,829 2,079 337 -1,313 -80 1,000 dollars 5,338 9,746 16,474 11,014 9,327 3,989 75
Tanzania
Total Metric tons 2,395 5,851 7,792 5,662 3,194 799 33 1,000 dollars 292,452 423,899 328,269 165,023 155,830 -136,622 -47 Sub-Saharan
Africa Total Metric tons 35,932 53,057 49,374 42,566 37,185 1,253 3 Source: GTIS, Global Trade Atlas, annual data compiled from reporting countries’ official statistics, including EU external trade.
2-37
final product.128 For example, in Nigeria, traditional methods of splitting and sun-drying ginger result in high rates of spoilage, and poor quality and appearance.129 Most SSA spices are exported with little or no processing.130 In particular, processing activities that add significant value, such as grinding, blending, and canning, are typically undertaken by large-scale international spice companies in the importing country. For example, there is no processing of pepper in Uganda,131 and in Nigeria, ginger is sold on the world market in split-dried form, where importing countries further process it into ginger powder, essential oils, oleoresin, and ginger ale concentrates.132 Similarly, only minimal processing (e.g., removing stems, cleaning, and drying) of cloves is undertaken before export for use as either a food ingredient or in cigarette manufacturing.133 Often, importing countries will process and package products for re-export. For example, ginger imported by India from SSA is ground and re-packaged for export all over the world, and most of the SSA clove exports to Singapore are processed and re-packed for distribution to other Asian markets. SSA vanilla is exported as raw vanilla beans and further processed in the countries of destination.134 Spice production in most of SSA lacks internal marketing infrastructure, such as transparent pricing systems, grades, and standards. For example, clove exports from Madagascar have been hampered by the inability of suppliers to meet quality standards of importing countries,135 and Nigerian ginger exports reportedly have gained a reputation for low quality because of poor production and marketing infrastructure.136 There is also little coordination between farmers, buyers, processors, and exporters. There are three distinct market segments for SSA spice exports. The retail sector, such as supermarkets, grocery delicatessens, and specialty food stores; the catering sector, such as hotels, restaurants, and other institutions; and the industrial sector, including manufacturers of processed food, beverages, tobacco products, cosmetics, pharmaceuticals, and detergents (box 2.4).137
128 Trade and Industrial Policy Strategies and Australian Agency for International
Development. SADC Trade, Trade Information Brief, Spices, undated (accessed January 31, 2008). 129 Yiljep, Fumen, and Ajisegiri, “The Effects of Peeling, Splitting and Drying on Ginger
Quality,” December 2005. 130 Trade and Industrial Policy Strategies and Australian Agency for International
Development, SADC Trade, Trade Information Brief, Spices, undated (accessed January 31, 2008). 131 International Society for Horticultural Science, The Uganda Horticultural Sector in
Uganda, January 2005. 132 Yiljep, Fumen, and Ajisegiri, “The Effects of Peeling, Splitting and Drying on Ginger
Quality,” December 2005. 133 UNCTAD, The Market of Cloves in the European Union, 2006.
134 Nielsen-Massey Vanillas, Inc. official, interview by Commission staff, December 12, 2007. Nielsen-Massey Vanillas, Waukegan, IL, is the largest vanilla importer and processor in the United States.
135 UNCTAD, The Market of Cloves in the European Union, 2006 136 Chemonics International Inc., Global Market Assessment, November 29, 2001. 137 Trade and Industrial Policy Strategies and Australian Agency for International
Development. SADC Trade, Trade Information Brief, Spices, undated (accessed January 31, 2008).
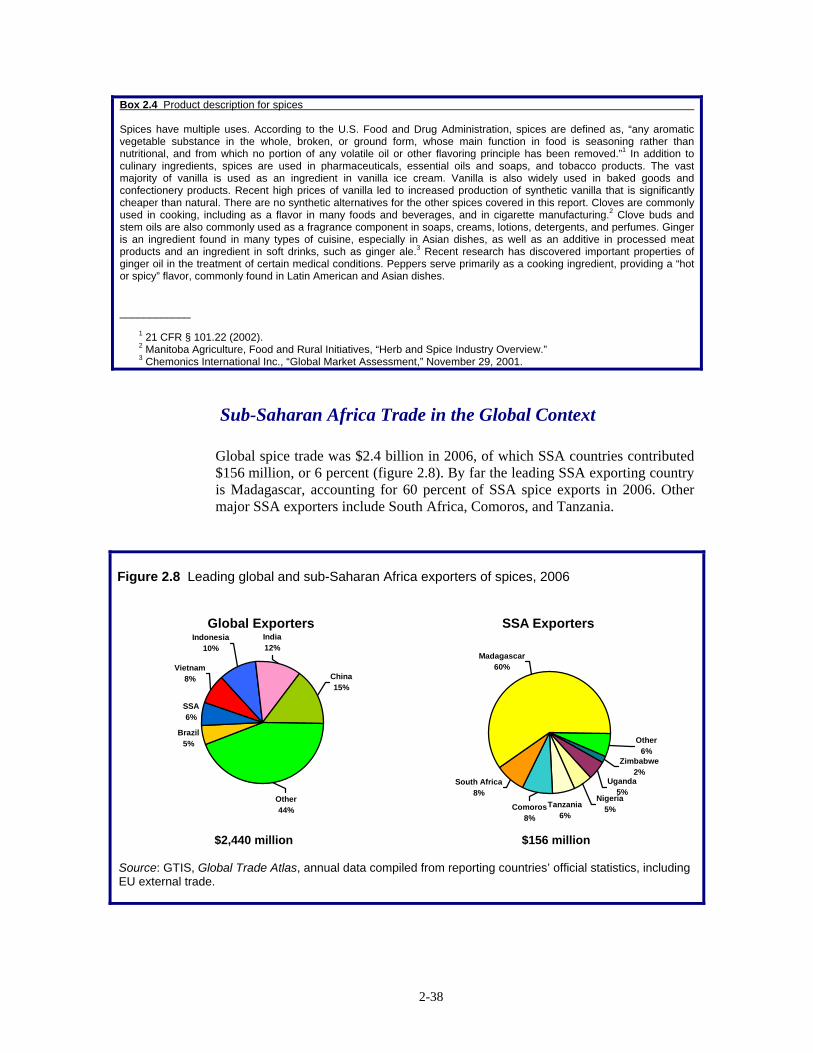
2-38
Sub-Saharan Africa Trade in the Global Context
Global spice trade was $2.4 billion in 2006, of which SSA countries contributed $156 million, or 6 percent (figure 2.8). By far the leading SSA exporting country is Madagascar, accounting for 60 percent of SSA spice exports in 2006. Other major SSA exporters include South Africa, Comoros, and Tanzania.
Box 2.4 Product description for spices Spices have multiple uses. According to the U.S. Food and Drug Administration, spices are defined as, “any aromatic vegetable substance in the whole, broken, or ground form, whose main function in food is seasoning rather than nutritional, and from which no portion of any volatile oil or other flavoring principle has been removed.”1 In addition to culinary ingredients, spices are used in pharmaceuticals, essential oils and soaps, and tobacco products. The vast majority of vanilla is used as an ingredient in vanilla ice cream. Vanilla is also widely used in baked goods and confectionery products. Recent high prices of vanilla led to increased production of synthetic vanilla that is significantly cheaper than natural. There are no synthetic alternatives for the other spices covered in this report. Cloves are commonly used in cooking, including as a flavor in many foods and beverages, and in cigarette manufacturing.2 Clove buds and stem oils are also commonly used as a fragrance component in soaps, creams, lotions, detergents, and perfumes. Ginger is an ingredient found in many types of cuisine, especially in Asian dishes, as well as an additive in processed meat products and an ingredient in soft drinks, such as ginger ale.3 Recent research has discovered important properties of ginger oil in the treatment of certain medical conditions. Peppers serve primarily as a cooking ingredient, providing a “hot or spicy” flavor, commonly found in Latin American and Asian dishes. ____________
1 21 CFR § 101.22 (2002). 2 Manitoba Agriculture, Food and Rural Initiatives, “Herb and Spice Industry Overview.” 3 Chemonics International Inc., “Global Market Assessment,” November 29, 2001.
Figure 2.8 Leading global and sub-Saharan Africa exporters of spices, 2006
Global Exporters
SSA6%
Brazil5%
Other44%
China15%
Indonesia10%
India12%
Vietnam8%
SSA Exporters
Madagascar60%
South Africa8%
Comoros8%
Nigeria5%
Zimbabwe2%
Uganda5%
Other6%
Tanzania6%
$2,440 million $156 million
Source: GTIS, Global Trade Atlas, annual data compiled from reporting countries’ official statistics, including EU external trade.
2-39
Major markets included the EU, United States, and Japan, which together account for about one-half of global trade. Close to 55 percent of SSA spice exports in 2006 were destined for either the EU or the United States. Other important markets for SSA spice exports were Singapore, India, and Japan.
Leading Exporters
Vanilla
The world’s two leading vanilla exporting countries are in SSA—Madagascar and Uganda—and together these two countries accounted for about 71 percent of global exports in 2006. Other major global suppliers are Indonesia, India, and Papua New Guinea. The top five exporting countries accounted for nearly 90 percent of global exports in 2006. Madagascar is by far the world’s largest vanilla exporting country, with over 87 percent and 64 percent, respectively, of SSA and global exports in 2006, followed by Uganda, Comoros, Mauritius, and South Africa.138 Although the value of SSA vanilla exports declined from $215 million in 2002 to $76 million in 2006 (a decline of 65 percent), the quantity of exports actually increased by 75 percent (table 2.5). World vanilla prices increased from 2002 to 2004, but fell dramatically in 2005 and 2006, largely in response to the sharp fall and subsequent recovery of vanilla production in Madagascar during this period.
Cloves
Global exports of cloves totaled $103 million in 2006, a decline of 36 percent from $139 million in 2002. SSA clove exports were $41 million in 2006 and accounted for 40 percent of total world clove exports, up from 29 percent in 2002. Indonesia was the world’s largest clove exporter in 2006, accounting for 27 percent of the world clove market, followed by Madagascar and Sri Lanka with shares of 23 percent and 13 percent, respectively. Other major global clove exporters are Brazil, Comoros, and Tanzania. Madagascar was responsible for nearly 55 percent of SSA clove exports in 2006, followed by Comoros with 23 percent, and Tanzania with 21 percent. Declining world clove prices accounted for the decline in world export values between 2002 and 2006. In order to increase the prices of cloves received by clove producers, in 2002 Indonesia banned clove imports until the local price of Indonesian cloves increased to a certain price level.139 The use of cloves in Indonesia is almost only for cigarette factories, known as kretek.140
138 GTIS, Global Trade Atlas. 139 Feitos, Orion, “Brazilian Cloves Exports,” August 19, 2002; and industry officials,
interview by Commission staff, Antananarivo, Madagascar, November 7, 2007. 140 Feitos, Orion, “Brazilian Cloves Exports,” August 19, 2002.
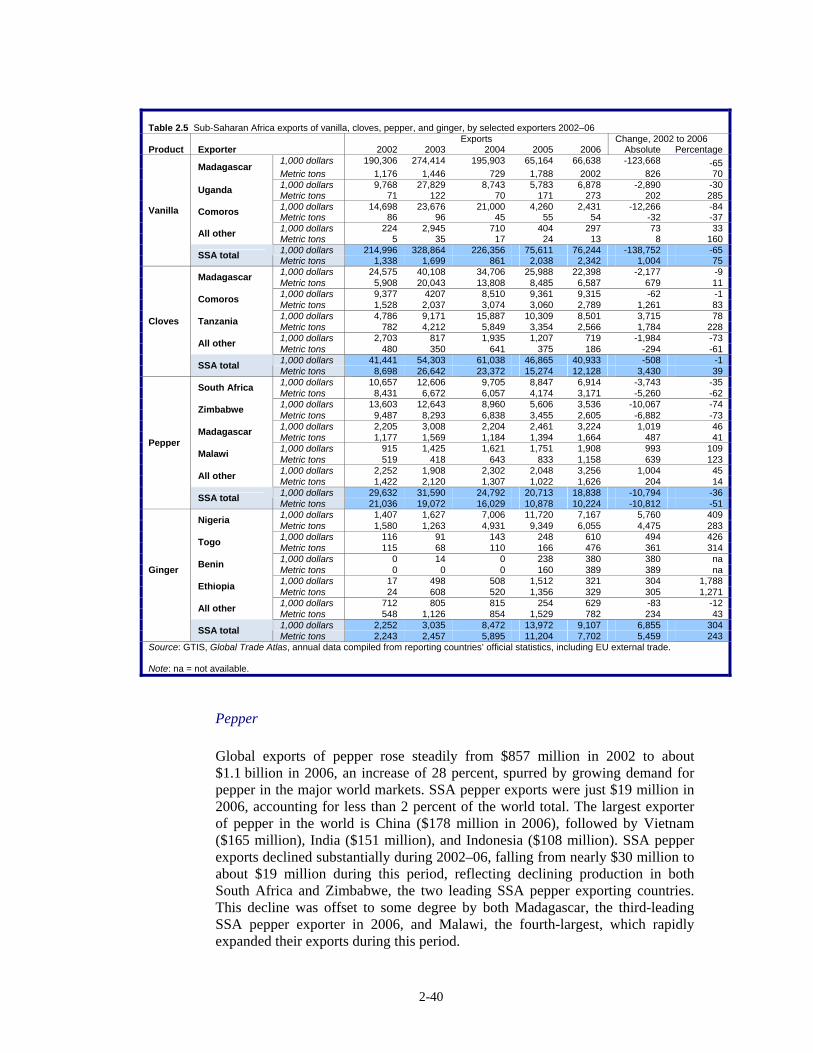
2-40
Pepper
Global exports of pepper rose steadily from $857 million in 2002 to about $1.1 billion in 2006, an increase of 28 percent, spurred by growing demand for pepper in the major world markets. SSA pepper exports were just $19 million in 2006, accounting for less than 2 percent of the world total. The largest exporter of pepper in the world is China ($178 million in 2006), followed by Vietnam ($165 million), India ($151 million), and Indonesia ($108 million). SSA pepper exports declined substantially during 2002–06, falling from nearly $30 million to about $19 million during this period, reflecting declining production in both South Africa and Zimbabwe, the two leading SSA pepper exporting countries. This decline was offset to some degree by both Madagascar, the third-leading SSA pepper exporter in 2006, and Malawi, the fourth-largest, which rapidly expanded their exports during this period.
Table 2.5 Sub-Saharan Africa exports of vanilla, cloves, pepper, and ginger, by selected exporters 2002–06
Exports Change, 2002 to 2006 Product Exporter 2002 2003 2004 2005 2006 Absolute Percentage
1,000 dollars 190,306 274,414 195,903 65,164 66,638 -123,668 -65 Madagascar Metric tons 1,176 1,446 729 1,788 2002 826 70 1,000 dollars 9,768 27,829 8,743 5,783 6,878 -2,890 -30 Uganda Metric tons 71 122 70 171 273 202 285 1,000 dollars 14,698 23,676 21,000 4,260 2,431 -12,266 -84 Comoros Metric tons 86 96 45 55 54 -32 -37 1,000 dollars 224 2,945 710 404 297 73 33 All other Metric tons 5 35 17 24 13 8 160 1,000 dollars 214,996 328,864 226,356 75,611 76,244 -138,752 -65
Vanilla
SSA total Metric tons 1,338 1,699 861 2,038 2,342 1,004 75 1,000 dollars 24,575 40,108 34,706 25,988 22,398 -2,177 -9 Madagascar Metric tons 5,908 20,043 13,808 8,485 6,587 679 11 1,000 dollars 9,377 4207 8,510 9,361 9,315 -62 -1 Comoros Metric tons 1,528 2,037 3,074 3,060 2,789 1,261 83 1,000 dollars 4,786 9,171 15,887 10,309 8,501 3,715 78 Tanzania Metric tons 782 4,212 5,849 3,354 2,566 1,784 228 1,000 dollars 2,703 817 1,935 1,207 719 -1,984 -73 All other Metric tons 480 350 641 375 186 -294 -61 1,000 dollars 41,441 54,303 61,038 46,865 40,933 -508 -1
Cloves
SSA total Metric tons 8,698 26,642 23,372 15,274 12,128 3,430 39 1,000 dollars 10,657 12,606 9,705 8,847 6,914 -3,743 -35 South Africa Metric tons 8,431 6,672 6,057 4,174 3,171 -5,260 -62 1,000 dollars 13,603 12,643 8,960 5,606 3,536 -10,067 -74 Zimbabwe Metric tons 9,487 8,293 6,838 3,455 2,605 -6,882 -73 1,000 dollars 2,205 3,008 2,204 2,461 3,224 1,019 46 Madagascar Metric tons 1,177 1,569 1,184 1,394 1,664 487 41 1,000 dollars 915 1,425 1,621 1,751 1,908 993 109 Malawi Metric tons 519 418 643 833 1,158 639 123 1,000 dollars 2,252 1,908 2,302 2,048 3,256 1,004 45 All other Metric tons 1,422 2,120 1,307 1,022 1,626 204 14 1,000 dollars 29,632 31,590 24,792 20,713 18,838 -10,794 -36
Pepper
SSA total Metric tons 21,036 19,072 16,029 10,878 10,224 -10,812 -51 1,000 dollars 1,407 1,627 7,006 11,720 7,167 5,760 409 Nigeria Metric tons 1,580 1,263 4,931 9,349 6,055 4,475 283 1,000 dollars 116 91 143 248 610 494 426 Togo Metric tons 115 68 110 166 476 361 314 1,000 dollars 0 14 0 238 380 380 na Benin Metric tons 0 0 0 160 389 389 na 1,000 dollars 17 498 508 1,512 321 304 1,788 Ethiopia Metric tons 24 608 520 1,356 329 305 1,271 1,000 dollars 712 805 815 254 629 -83 -12 All other Metric tons 548 1,126 854 1,529 782 234 43 1,000 dollars 2,252 3,035 8,472 13,972 9,107 6,855 304
Ginger
SSA total Metric tons 2,243 2,457 5,895 11,204 7,702 5,459 243 Source: GTIS, Global Trade Atlas, annual data compiled from reporting countries’ official statistics, including EU external trade. Note: na = not available.
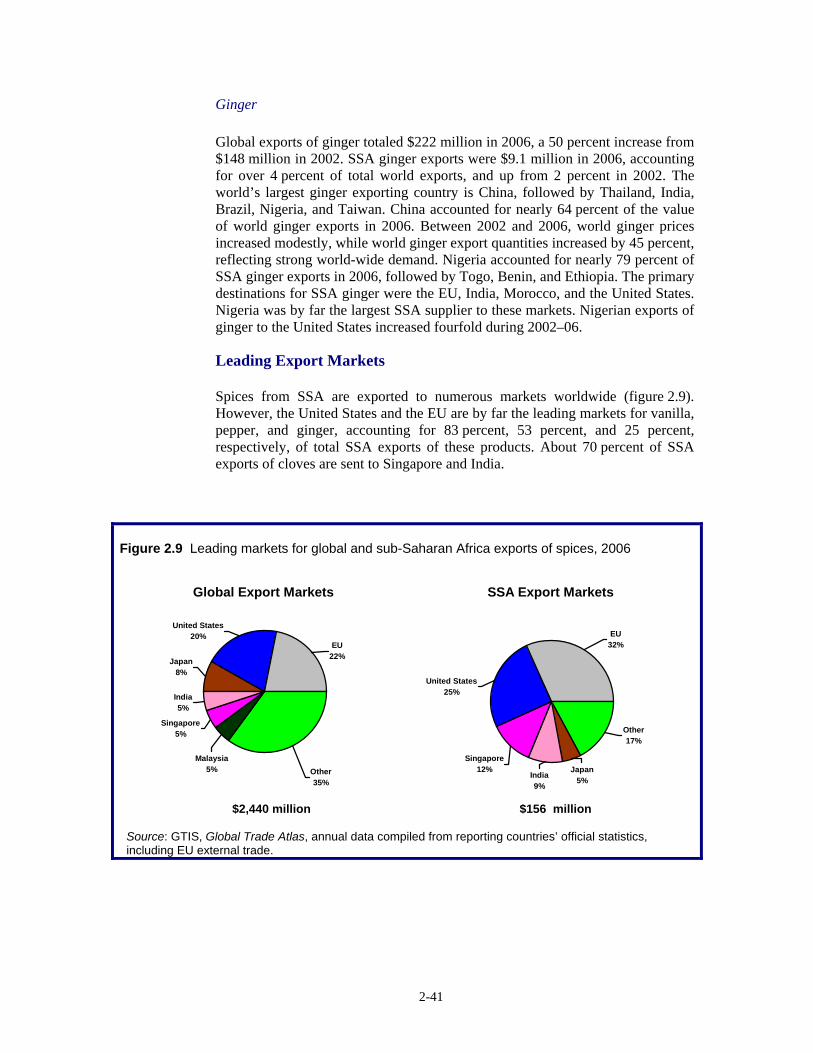
2-41
Ginger
Global exports of ginger totaled $222 million in 2006, a 50 percent increase from $148 million in 2002. SSA ginger exports were $9.1 million in 2006, accounting for over 4 percent of total world exports, and up from 2 percent in 2002. The world’s largest ginger exporting country is China, followed by Thailand, India, Brazil, Nigeria, and Taiwan. China accounted for nearly 64 percent of the value of world ginger exports in 2006. Between 2002 and 2006, world ginger prices increased modestly, while world ginger export quantities increased by 45 percent, reflecting strong world-wide demand. Nigeria accounted for nearly 79 percent of SSA ginger exports in 2006, followed by Togo, Benin, and Ethiopia. The primary destinations for SSA ginger were the EU, India, Morocco, and the United States. Nigeria was by far the largest SSA supplier to these markets. Nigerian exports of ginger to the United States increased fourfold during 2002–06.
Leading Export Markets
Spices from SSA are exported to numerous markets worldwide (figure 2.9). However, the United States and the EU are by far the leading markets for vanilla, pepper, and ginger, accounting for 83 percent, 53 percent, and 25 percent, respectively, of total SSA exports of these products. About 70 percent of SSA exports of cloves are sent to Singapore and India.
Figure 2.9 Leading markets for global and sub-Saharan Africa exports of spices, 2006
Global Export Markets
India5%
Singapore5%
Malaysia5% Other
35%
United States20%
EU22%Japan
8%
SSA Export Markets
India9%
Japan5%
Singapore12%
EU32%
United States25%
Other17%
$2,440 million $156 million
Source: GTIS, Global Trade Atlas, annual data compiled from reporting countries’ official statistics, including EU external trade.
2-42
Vanilla
In 2006, the leading world markets for vanilla were the United States and the EU, together representing almost 80 percent of the value of global imports. The United States was the world’s largest consumer of vanilla (mostly used in ice cream manufacturing), purchasing nearly 42 percent of global imports that year. The EU accounted for another 38 percent of world vanilla imports, while Japan and Canada accounted for 7 percent and 5 percent, respectively. In 2006, over 77 percent of U.S. vanilla imports were supplied by SSA countries, mostly from Madagascar (69 percent) and Uganda (7 percent). The EU and Japan relied on SSA countries for roughly 77 and 93 percent, respectively, of their vanilla imports.
Cloves
The leading world markets for cloves are India and Singapore, where cloves are primarily imported for use in cigarette manufacturing. Together these countries accounted for about 70 percent of the value of world imports in 2006. Other major markets are the EU and the United States, with global import shares of 7 percent and 4 percent, respectively. Singapore and India are the leading world markets for SSA clove exports. About 30 percent of India’s clove imports were from SSA countries, while over 57 percent of Singapore’s imports were of SSA origin in 2006. Madagascar is the largest supplier to these markets. The United States relied on SSA countries for about one-half of its clove imports in 2006.
Pepper
The leading global markets for pepper are the United States and the EU, accounting for about one-half of the value of global imports in 2006. Other important pepper importers include Malaysia, Japan, and Singapore. World demand for pepper grew rapidly from 2002 to 2006, up 25 percent by value and 32 percent by quantity, in part reflecting a growing trend toward the use of more spices for culinary use in developed countries and rising incomes in developing countries. The leading market for SSA pepper exports is the EU followed by the United States and Malaysia.
Ginger
In 2006, Japan was the world’s leading importer of ginger, accounting for about one-third of global imports, followed by the EU, Pakistan, and the United States, which together accounted for another 39 percent. During 2002–06, Japan’s share of global imports fell from over one-half to about one-third. At the same time, EU and U.S. ginger imports grew rapidly, as did those of Pakistan. The EU is the leading market for SSA ginger exports, accounting for over one-quarter of SSA exports in 2006, mainly from Nigeria. India was the second-leading destination for SSA ginger exports, followed by Morocco and the United States.
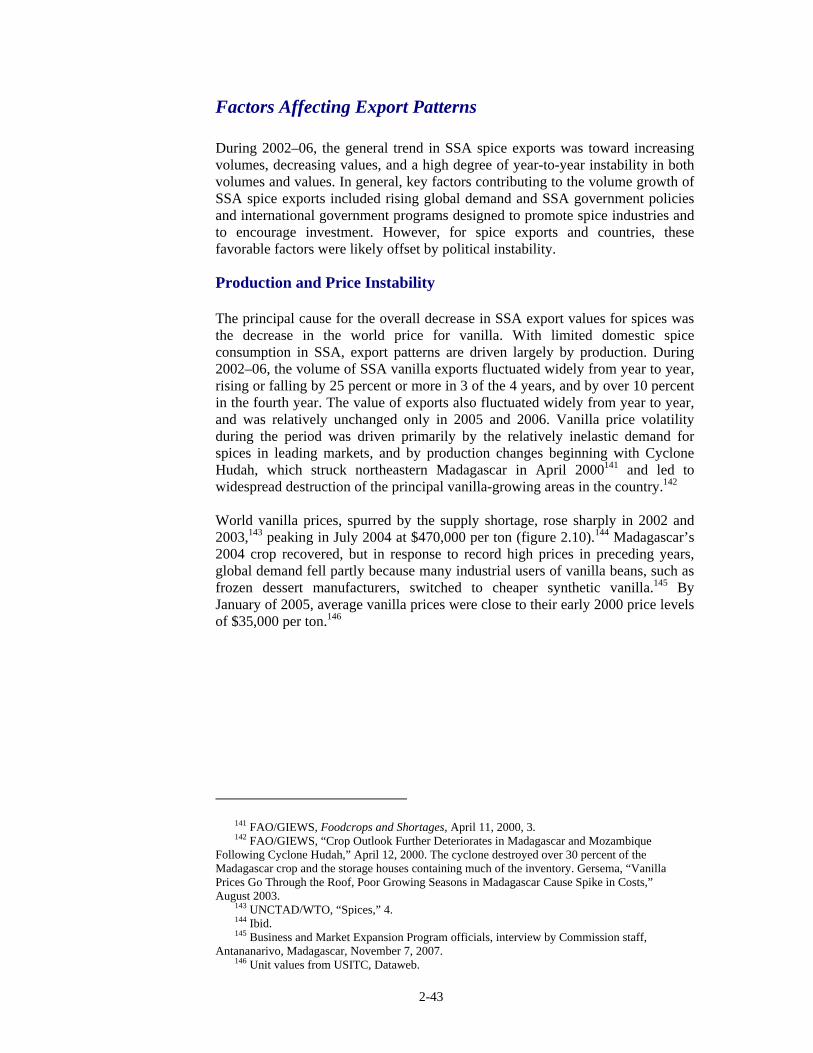
2-43
Factors Affecting Export Patterns
During 2002–06, the general trend in SSA spice exports was toward increasing volumes, decreasing values, and a high degree of year-to-year instability in both volumes and values. In general, key factors contributing to the volume growth of SSA spice exports included rising global demand and SSA government policies and international government programs designed to promote spice industries and to encourage investment. However, for spice exports and countries, these favorable factors were likely offset by political instability.
Production and Price Instability
The principal cause for the overall decrease in SSA export values for spices was the decrease in the world price for vanilla. With limited domestic spice consumption in SSA, export patterns are driven largely by production. During 2002–06, the volume of SSA vanilla exports fluctuated widely from year to year, rising or falling by 25 percent or more in 3 of the 4 years, and by over 10 percent in the fourth year. The value of exports also fluctuated widely from year to year, and was relatively unchanged only in 2005 and 2006. Vanilla price volatility during the period was driven primarily by the relatively inelastic demand for spices in leading markets, and by production changes beginning with Cyclone Hudah, which struck northeastern Madagascar in April 2000141 and led to widespread destruction of the principal vanilla-growing areas in the country.142 World vanilla prices, spurred by the supply shortage, rose sharply in 2002 and 2003,143 peaking in July 2004 at $470,000 per ton (figure 2.10).144 Madagascar’s 2004 crop recovered, but in response to record high prices in preceding years, global demand fell partly because many industrial users of vanilla beans, such as frozen dessert manufacturers, switched to cheaper synthetic vanilla.145 By January of 2005, average vanilla prices were close to their early 2000 price levels of $35,000 per ton.146
141 FAO/GIEWS, Foodcrops and Shortages, April 11, 2000, 3. 142 FAO/GIEWS, “Crop Outlook Further Deteriorates in Madagascar and Mozambique
Following Cyclone Hudah,” April 12, 2000. The cyclone destroyed over 30 percent of the Madagascar crop and the storage houses containing much of the inventory. Gersema, “Vanilla Prices Go Through the Roof, Poor Growing Seasons in Madagascar Cause Spike in Costs,” August 2003.
143 UNCTAD/WTO, “Spices,” 4. 144 Ibid. 145 Business and Market Expansion Program officials, interview by Commission staff,
Antananarivo, Madagascar, November 7, 2007. 146 Unit values from USITC, Dataweb.
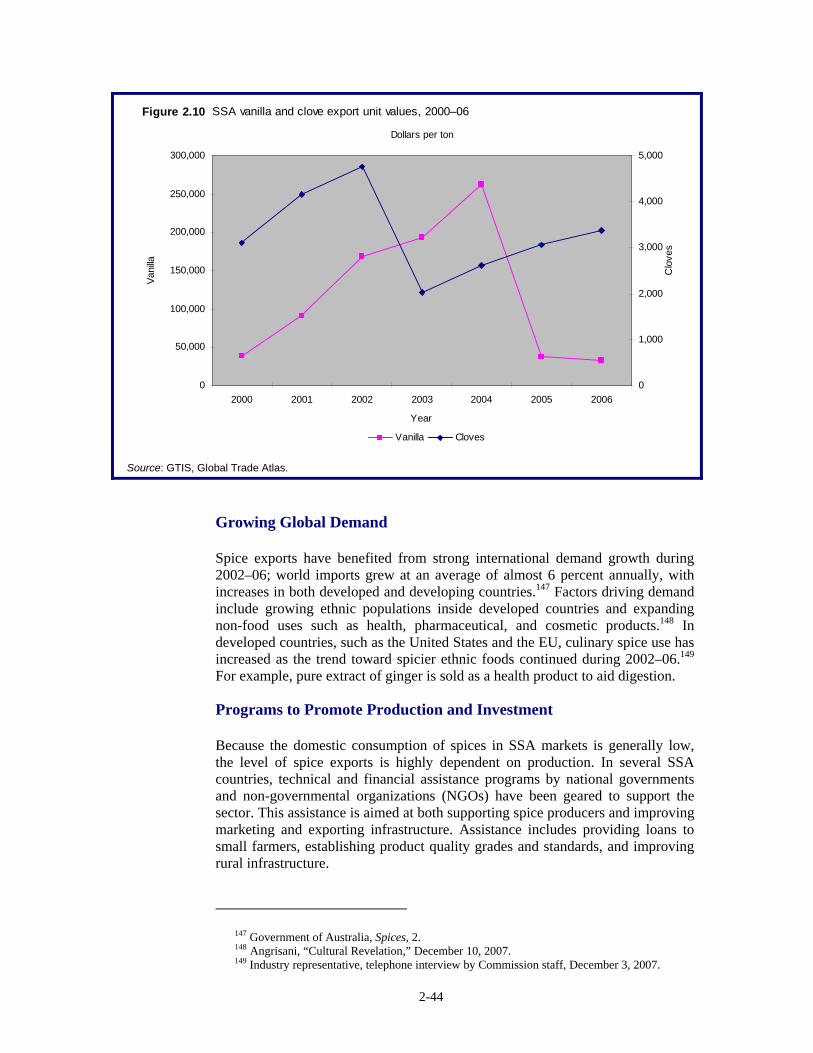
2-44
Growing Global Demand
Spice exports have benefited from strong international demand growth during 2002–06; world imports grew at an average of almost 6 percent annually, with increases in both developed and developing countries.147 Factors driving demand include growing ethnic populations inside developed countries and expanding non-food uses such as health, pharmaceutical, and cosmetic products.148 In developed countries, such as the United States and the EU, culinary spice use has increased as the trend toward spicier ethnic foods continued during 2002–06.149 For example, pure extract of ginger is sold as a health product to aid digestion.
Programs to Promote Production and Investment
Because the domestic consumption of spices in SSA markets is generally low, the level of spice exports is highly dependent on production. In several SSA countries, technical and financial assistance programs by national governments and non-governmental organizations (NGOs) have been geared to support the sector. This assistance is aimed at both supporting spice producers and improving marketing and exporting infrastructure. Assistance includes providing loans to small farmers, establishing product quality grades and standards, and improving rural infrastructure.
147 Government of Australia, Spices, 2. 148 Angrisani, “Cultural Revelation,” December 10, 2007. 149 Industry representative, telephone interview by Commission staff, December 3, 2007.
Figure 2.10 SSA vanilla and clove export unit values, 2000–06
0
50,000
100,000
150,000
200,000
250,000
300,000
2000 2001 2002 2003 2004 2005 2006
Year
Vani
lla
0
1,000
2,000
3,000
4,000
5,000
Dollars per ton
Clo
ves
Vanilla Cloves
Source: GTIS, Global Trade Atlas.
2-45
Programs to promote spice production can be found throughout the region. For example, an International Fund for Agricultural Development (IFAD)150 project for small-scale vanilla producers in Madagascar provided training in improved production techniques and assistance in managing financial risks associated with seasonal high price and income volatility. Part of this program included the establishment of 18 credit unions covering 43 communes that provided farmers with access to affordable financial services for both borrowing and saving.151 In Uganda, assistance to vanilla and cardamom farmers was provided by the USAID-funded Uganda Agricultural Productivity Enhancement Program (APEP).152 Working with the two main Ugandan vanilla grower associations, the Association of the Vanilla Exporters of Uganda (VANEX) and the Ugandan National Vanilla Association (UNVA), the program involves: (1) training growers in improved production technologies, (2) helping grower associations to coordinate and monitor farmer activities, (3) promoting the quality of vanilla from the farm through processing, and (4) making Ugandan vanilla more competitive in world markets. In Nigeria, the Kaduna State Agricultural Development Project is working to improve ginger production, processing, and marketing by establishing processing centers and providing micro-credit to farmers.
Political Unrest
During 2002–06, political instability negatively affected exports of SSA spices. For example, Zimbabwe, the leading SSA pepper exporter in 2002, experienced a sharp decline during 2003–06, following Zimbabwe’s land reform program that began in June 2002.153 Exports of cloves by Comoros, the second-largest SSA clove exporting country, were adversely affected by periodic political unrest in Anjouan, a region that accounts for 90 percent of the Comorian clove crop.154
150 IFAD, a specialized agency of the United Nations, was established as an international
financial institution in 1977 as one of the major outcomes of the 1974 World Food Conference. 151 IFAD, “Project Sets up Innovative Vanilla Growing Scheme in Madagascar,”
April 12, 2007, 1. 152 USAID, Uganda Agricultural Productivity Enhancement Program, 2007. 153 Land was acquired from large-scale commercial farmers for redistribution to resettled small-
scale farmers. USAID FEWS, Zimbabwe Livelihood Profiles, September 2005, 9. 154 EIU, Country Profile: Comoros, 2007.
2-46
Spices Bibliography Angrisani, Carol. “Cultural Revelation.” Supermarket News, December 10, 2007. http://supermarketnews.com/ethnic_specialty/cultural_revelation. Cadot, O., L. Dutoit, and J. de Melo. “The Elimination of Madagascar’s Vanilla Marketing Board, Ten Years On.” World Bank Policy Research Working Paper 3979, August 2006. Chemonics International Inc. Global Market Assessment: Nigerian Exports of Agricultural and Natural Products. Prepared for United States Agency for International Development/Nigeria, November 29, 2001. http://www.usaid.gov/ng/downloads/markets/global_market_assessment.doc (accessed December 21, 2007). Economic Intelligence Unit (EIU). Country Profile: Comoros. 2007. Feitosa, Orion, “Brazilian Cloves Exports – Next Crop Foresight 2002-08-19,” Brazilian Peppertrade Board, August 19, 2002. http://www.peppertrade.combr/vernoticia.php?dn-133. Gersema, Emily. “Vanilla Prices Go Through the Roof, Poor Growing Seasons in Madagascar Cause Spike in Costs.” Associated Press, August 2003. Global Trade Information Services, Inc. (GTIS). World Trade Atlas Database. Annual data compiled from reporting countries’ official statistics, including EU27 external trade. http://www.gtis.com/gta/usitc/ (accessed various dates).
Government of Australia. Spices. Trade Information Brief. Trade and Industrial Policy Strategies (TIPS), 2007. http://www.sadctrade.org/files/TIB-Spices-final.pdf (accessed January 31, 2007).
International Fund for Agricultural Development (IFAD). “Project Sets up Innovative Vanilla Growing Scheme in Madagascar.” Rural Poverty Portal, April 12, 2007.
International Society for Horticultural Science. The Uganda Horticultural Sector in Uganda. January 2005. http://www.actahort.org/chronica/pdf/sh_1.pdf. Manitoba Agriculture, Food and Rural Initiatives, “Herb and Spice Industry Overview – Four Market Applications/Barriers and Challenges – Manitoba.” December 2005. http://www.gov.mb.ca/agriculture/financial/agribus/ccg02s01.html. Trade and Industrial Policy Strategies and Australian Agency for International Development. SADC Trade, Trade Information Brief, Spices. http://www.sadctrade.org/files/TIB-Spices-final.pdf (accessed January 31, 2008). Ugandan Ministry of Agriculture. Animal Industry and Fisheries. National Agricultural Advisory Service. Kampala, May 23, 2003. http://naads.or.ug/manage/reports/20reportVanilla%20consultative%20wshop%20report.pdf.
2-47
United Nations Council for Trade and Development (UNCTAD). The Market of Cloves in the European Union. Geneva: International Trade Center, 2006. http://www.epicescomores.com/pdf_doc_gie/CCI_Girofle_Cloves.pdf (accessed January 25, 2008).
United Nations Conference on Trade and Development/World Trade Organization (UNCTAD/WTO). International Trade Centre. “Spices.” Market News Service, 5, June 17, 2005. Food and Agriculture Organization of the United Nations. Global Information and Early Warning System on Food and Agriculture (FAO/GIEWS). “Crop Outlook Further Deteriorates in Madagascar and Mozambique Following Cyclone Hudah.” Special Alert No. 305, FAO Corporate Document Repository, April 12, 2000. ——. Foodcrops and Shortages No. 2, Madagascar, April 11, 2000. U.S. Agency for International Development (USAID) Famine Early Warning System (FEWS). Zimbabwe Livelihood Profiles, September 2005. ——. Uganda Agricultural Productivity Enhancement Program, 2007. http://www.apepuganda.org/index.htm. U.S. International Trade Commission (USITC). Interactive Tariff and Trade Dataweb (Dataweb). http://dataweb.usitc.gov (accessed various dates). Yiljep, Y.D., G.A. Fumen, and E.S.A. Ajisegiri. “The Effects of Peeling, Splitting and Drying on Ginger Quality and Oil/Oleoresin Content.” Manuscript FP 05 009. Vol. VII, December 2005. Agricultural Engineering International: The CIGR EJournal. http://ecommons.library.cornell.edu/bitstream/1813/2626/32/FP+05+009+Yiljep+final+12Dec2005.pdf (accessed December 3, 2007).
2-48
Tropical Fruit155
Summary of Findings
Growth in consumer demand for both bananas and pineapples in the major consuming markets of the EU and the United States spurred worldwide trade and contributed to an increase in exports from SSA producers between 2002 and 2006. Increasing prices in the EU market led to SSA exports of bananas increasing by 69 percent between 2002 and 2006 in terms of value compared to only 11 percent in terms of volume. Cameroon and Côte d’Ivoire, the largest SSA banana exporters, together accounted for almost 90 percent of the total SSA growth by value in banana exports. While increased prices were caused primarily by growth in demand, the new EU banana tariff regime (see box 2.5) may have also contributed to the increase. Multinational produce firms expanded their SSA operations in order to take advantage of increased EU demand and the tariff preferences granted to SSA countries. Total SSA exports of pineapples decreased slightly during 2002–06, as Cameroon and Ghana experienced increases that were offset by a significant decrease from Côte d’Ivoire. The introduction of a sweeter, consumer-preferred variety of fresh pineapple in the market drove a shift in demand for this variety (box 2.5). Cameroon, Côte d’Ivoire, and Ghana were slower than competing producers in Latin America to supply the new variety and consequent lost market share in the EU. West African producers responded by converting their production from the traditional Smooth Cayenne variety to the new MD2 variety. This transition had a negative impact on SSA pineapple exports, but should enable a more competitive SSA industry to emerge in the near future. Certain factors benefitted both banana and pineapple exports during 2002–06. Assistance from international aid programs and foreign governments provided Cameroon, Côte d’Ivoire, and Ghana with the ability to upgrade their infrastructure during this period. Export facilities and feeder roads were improved, which provided small pineapple growers, as well as larger banana plantations, with the ability to get their product to the market with greater efficiency, preserving product quality from farm to the final consumer. These aid programs, as well as increased foreign investment in new operations and increased support from industry organizations, significantly improved the competitiveness of SSA exports.
155 The majority of SSA non-citrus tropical fruit production is from two product categories, pineapples (HS 0804.30) and bananas, including plantains (HS 0803). Together these two products make up more than 60 percent of the total volume of all tropical fruits produced in SSA. Pineapples and bananas are also the most heavily traded tropical fruits and experienced the most significant shifts in exports during 2002-2006. This section will cover the pineapple and banana sectors in Côte d’Ivoire, Cameroon, and Ghana because those countries experienced large shifts in exports.
2-49
Industry Overview
Production of bananas and pineapples has thrived in Cameroon, Côte d’Ivoire, and Ghana due to favorable climate conditions and soil fertility. Bananas and pineapples flourish in subtropical equatorial climates where the temperature remains high. As a result of these climatic requirements, tropical fruits are typically grown in various Latin American, African, and Asian countries situated around the equator. Nevertheless, the lack of a comprehensive “cold chain” from farm to port and adequate road networks seriously impacts the competitiveness of SSA exports.156 Because fresh tropical fruits are highly perishable, efficient infrastructure systems are critical to the success of banana and pineapple export industries. However, pre-cooling and cold-storage facilities are limited for producers and exporters throughout SSA. While there are some facilities in place in Ghana, these are largely unused because a complete cold-storage chain, while under construction, has yet to be completed. As a result, approximately 40 percent of all Ghanaian agricultural output is lost annually due to inadequate cold-storage facilities, infrastructure, and road networks.157 Cold-storage facilities and supply
156 The percentage of tropical fruit products shipping from Cameroon, Côte d’Ivoire, and Ghana by sea freight has grown significantly as the number of reefers with cold storage capabilities has increased. Pineapples and bananas are generally transported from the farm at ambient temperatures prior to reaching the port for sea-freight shipping but will be cooled slightly once in the hold of the reefer vessel or container. Air freight remains expensive and therefore is generally used only for the highest-quality products. Adongo, “Reflecting National Circumstances and Development Priorities,” 8.
157 “Ghana-Irrigation is a Priority,” edited by Pita Adams, Africa Research Bulletin,17054A–17055A.
Box 2.5 Product description for bananas and pineapples The banana and its relative the plantain are often regarded as the fourth most important food crop for the world after rice, maize, and wheat. Bananas are generally eaten raw, while plantains are most often cooked. Bananas are also eaten dried as a snack food. Bananas grow in tropical climates on trees and in clusters. These hanging clusters together make up a “bunch,” which is the most common commercial form and can weigh up to 50 kg. The majority of global production occurs in developing countries and plays an important role in their economy and food security. Bananas are generally exported from developing countries to developed country markets.
Pineapples are second only to bananas as both the EU’s and the United States’ most popular tropical fruit. Pineapples are also produced in warm equatorial climates. Fresh pineapple is difficult to ship long distances because it can quickly become over-ripe if not properly handled. As a result, a large percentage of pineapples traded globally are processed and canned. The Smooth Cayenne pineapple was traditionally the most prevalent; however, it had several undesirable characteristics such as tough flesh and large spikes. A new pineapple variety, the hybrid MD2, possesses characteristics preferred by consumers, which has led to its increased consumption in recent years. For example, it is uniform in size and ripeness, has spineless leaves, and is less resistant to internal browning, thus giving it a longer shelf life and making it easier for producers to ship and handle. Consumers also prefer the MD2 variety because it is sweeter, less acidic, and more palatable. Del Monte launched this variety in Costa Rica and began marketing it as the MD2 variety in the late 1990s.¹
____________ ¹ Del Monte, The History of the Pineapple, October 2006. The development of new pineapple breeds dates back to
the 1970s when Dole, Del Monte, and the Maui Land and Pineapple Company partnered with University of Hawaii scientists and the Pineapple Research Institute to develop and introduce new hybrid pineapple varieties.
2-50
chains, as well as more dependable road networks, are being developed in all three countries. Recently, large international agribusiness corporations have begun to play a more significant role in the pineapple sector in West Africa and in the banana sector in Ghana. Compagnie Fruitière, of which Dole Food Company, Inc., has a 40 percent stake, began its Ghanaian operations in August of 2003 under the locally registered name of Golden Exotics Ltd. Compagnie Fruitière plays an influential role in the region and has a history of large banana and pineapple production facilities throughout West Africa. As more international firms have entered SSA through partnerships, joint ventures, or direct investment, and as worldwide demand for tropical fruits has increased, the hectarage utilized for production of these fruits has increased significantly. Downstream processing of tropical fruit in Cameroon, Côte d’Ivoire, and Ghana is fairly limited. Despite the fact that SSA firms generally have adequate technical expertise allowing them to remain competitive, they face numerous challenges that limit the possibility of growth.158 Downstream processing, of pineapple juices and concentrates as well as sliced and canned pineapple, is limited primarily due to concerns about the reliability of the supply of the fresh goods needed for processing. The lack of sufficient fresh produce for processing, which has intensified as a result of the transition to newer varieties; rising fresh produce prices; and quality concerns are the primary supply issues that limit the expansion of downstream processing in SSA (box 2.6).
158 Industry official, interview by Commission staff, Ghana, October 30, 2007.
2-51
Bananas In Cameroon, Côte d’Ivoire, and Ghana, most bananas are grown on medium to large plantations that are located near the major road networks, allowing for more efficient transport of the produce. Farm sizes have become the norm in SSA because large capital investments are needed in order to establish efficient growing plots. 159 In addition, expansion requires a significant amount of capital expenditure prior to generating an output because banana trees take approximately 12 to 16 months to bear fruit and the bananas are generally harvested only once a year. In Côte d’Ivoire, banana plantations cover an area of approximately 5,500 hectares. The industry has experienced significant consolidation; since 1993, the number of plantation sized farms has dropped from 83 to fewer than 30.160 As West African producers have become increasingly export oriented, consolidation has occurred as a result of the competitive pressure from Latin American countries outside of the EU tariff-exempted African, Caribbean, and
159 Minot, “Are horticultural exports a replicable success story?” 36. 160 Industry official, interview by Commission staff, Côte d’Ivoire, October 24, 2007.
Box 2.6 Downstream tropical fruit production A limited number of firms in Cameroon, Côte d’Ivoire, and Ghana are operating in the downstream sectors of the fresh tropical fruit industry. Downstream processing includes the processing of tropical fruits, primarily pineapples and mangoes, into various forms such as fruit salads, juices, concentrates, and sliced and canned produce. Bananas are only processed into a limited amount of forms, such as dried chips, and only a very small amount of banana processing occurs worldwide. In Côte d'Ivoire, pineapples are the only fresh produce to benefit from a well-structured processing industry. The processing is primarily done by two firms, Confripral and Safco. Both firms produce pineapple juice and concentrate, while Confripal also produces fruit pulp in cans. In Ghana, downstream industries consist of several small-and medium-sized companies. The processing firms in Ghana include: Blue Skies, which ships fresh pineapples and other tropical fruit, both organic and non-organic, also processes fruit into fruit salads; Astek, which is a large processing and packaging company that produces fruit juices; Dansak Farms, which produces fresh fruit juices as well as dried fruits and nuts; Ebenut Ghana, which produces dried fruits and nuts; N’Kulenu, which is a producer of preserves and fruit sauces; and Athena Foods, which produces fruit juices and concentrates.1
While demand for processed products has increased in European markets, the challenges that limit downstream processing in SSA generally lie on the supply side. The primary concern has been the availability of high-quality fresh fruit needed for processing. Processors compete with exporters that demand high volumes of fruit and often offer higher prices for raw materials.2 The transition to the new MD2 pineapple variety has also limited the availability of raw materials, especially for the juice producers. Juicers generally prefer to use the Smooth Cayenne pineapple variety, however, very few growers are still producing the Smooth Cayenne variety as a result of the fresh market preference for MD2.3 The supply of quality raw materials is also a hindrance to downstream processing of tropical fruits. Quality standards are of significant importance to European importers, and if SSA processors are not able to maintain their quality certifications, then their business is impacted tremendously. One problem is that fruit acidity levels are often inconsistent. Second, varying levels of supply cause inconsistent quality. For example, in 2004 Athena Foods of Ghana had an oversupply of the Smooth Cayenne variety due to the lack of demand in Europe and as a result, quality decreased.4
____________
1 Sofreco,”Strategic Evaluation of the Agro-Industrial Sector,” September 4–7, 2002. 2 Industry official, interview by Commission staff, Ghana, October 31, 2007. 3 Industry official, interview by Commission staff, Ghana, October 31, 2007. 4 Industry official, interview by Commission staff, Ghana, October 31, 2007.
2-52
Pacific (ACP) regions to reduce the cost of production while at the same time adhering to the strict quality and sanitary conditions that European importers require.161 A portion of overall banana production does come from smaller farms; however, according to the Food and Agriculture Organization (FAO), smaller growers are “usually located in poor soils, with steep slopes and limited water availability… [they] are finding it increasingly difficult to compete and are slowly disappearing.”162 In Côte d’Ivoire, the largest export companies are the Banana Development Society (SCB), a venture in which Dole Food Company, Inc. has controlling ownership interest; Banador, a subsidiary of Chiquita Brands International; and Canavèse. The employment generated by these banana operations is estimated at approximately 20,000–30,000 jobs.163 While the banana industry is relatively young in Ghana and smaller than some of its SSA competitors, it has a competitive advantage in its productivity. Hotter temperatures in Ghana allow banana trees to produce an average of 1.7 bunches of bananas per year compared to 1.3 bunches in Cameroon and Côte d’Ivoire.164
Pineapples Pineapple-producing companies in Cameroon, Côte d’Ivoire, and Ghana range in size from small individual subsistence farmers, to medium-size local companies, to cooperatives and joint ventures generally established through investments by larger multinational produce firms. The larger cooperatives and joint ventures generally operate at almost all stages of the value chain and often produce, process, and export the product.165 There are 56 pineapple exporters in Ghana, with the largest five accounting for 57 percent of the product.166 Small landholders that produce pineapples on farms generally between 0.5 and 10 hectares in size continue to play a crucial role in the SSA pineapple industries and make up a significant percentage of production.167 These small growers generally have limited access to inputs such as mechanical equipment, training, and seeds, but are vital to the industry’s success because large exporters generally have to subcontract with them in order to acquire their needed supply of fruit. In Ghana, exporters buy approximately 40 percent of their export requirements from small independent growers under various arrangements.168 In Côte d’Ivoire an even larger percentage of exports is purchased from small independent growers.169 Small growers tend to be more common in pineapple production compared to other tropical fruit production because the initial investment cost of establishing a farm is relatively low.170 Unlike bananas and
161 Minot, “Are horticultural exports a replicable success story?” 38. 162 FAO, “The World Banana Economy 1985-2002.” 163 USAID, “Policies Affecting the Development of Ghana’s Banana-Export Sector,” 69. 164 Industry official, interview by Commission staff, Accra, Ghana, October 30, 2007. 165 Danielou, “The Rise of Ghana’s Pineapple Industry,” November 2005, 17. 166 The five largest exporters are Jei River, Farmapine, Koranco, Milani, and Prudent. Danielou
“The Rise of Ghana’s Pineapple Industry,” November 2005, 17. 167 Minot, “Are horticultural exports a replicable success story?” 36. 168 Yeboah, Godfred, “The Farmapine Model,” January 16, 2005. 169 Minot, “Are horticultural exports a replicable success story?” 36. 170 Ibid.
2-53
other tropical fruits, pineapples have a short crop cycle time and are generally harvested every 6 to 8 months. Because of this faster crop cycle time, the investment risk and the capital requirements per unit of production are reduced.171 However, poor roads in these countries penalize the small growers that tend to operate in more remote areas of the country. Partnerships between small growers and large exporters can provide the growers with access to necessary inputs that the growers may not be able to acquire on their own. Exporters will occasionally provide assistance, often in the form of chemicals, planting materials, or even cash advances, to independent growers with the understanding that the grower sell his produce to the exporter. In Ghana, the arrangements between small growers and larger exporters are rarely made with legal contracts. This creates an uncertain business environment for both the producers and traders, as the growers will often disregard their previous agreements to sell to other exporters who are offering higher prices.172
Sub-Saharan Africa Trade in the Global Context
Bananas Global banana production totaled almost 70 million metric tons (mmt) in 2006. While bananas are produced in many tropical countries worldwide, the majority of production and trade is highly concentrated in a few countries. The 10 largest banana-producing countries accounted for about 75 percent of total banana production in 2006; Brazil, China, Ecuador, India, and the Philippines alone produced more than half of the total.173 In 2006, 35 SSA producers accounted for almost 4 mmt, or 6 percent, of worldwide production. During 2002–06, the largest SSA producers in order of production volume were Burundi, Cameroon, Uganda, Kenya, and South Africa. Global production of bananas increased by 3 percent volume between 2002 and 2006, while global exports have increased by 13 and 42 percent, in terms of volume and value, respectively. SSA exports grew at a similar rate to global exports by volume, increasing by approximately 11 percent during 2002–06. However, in terms of value SSA exports grew by 69 percent (table 2.6).174
171 USAID, “Policies Affecting the Development of Ghana’s Banana-Export Sector,” 104. 172 Yeboah, Godfred, “The Farmapine Model,” January 16, 2005. 173 FAO, FAOSTAT Production Database. 174 GTIS, Global Trade Atlas.
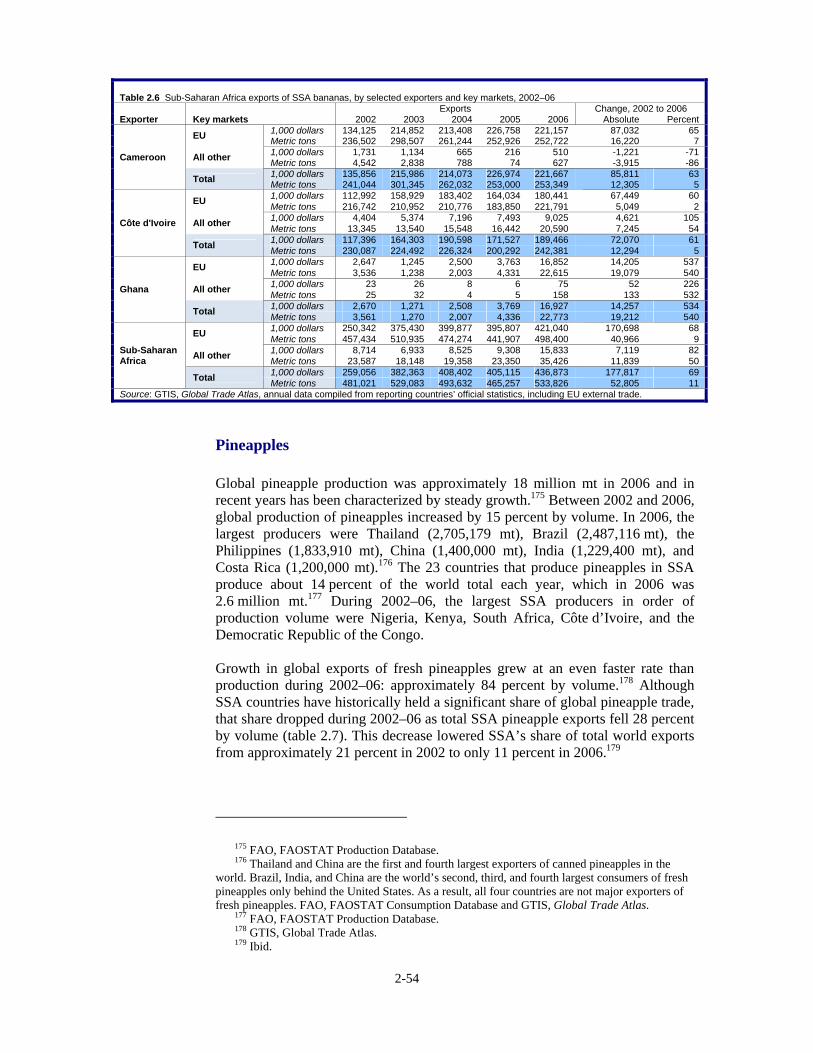
2-54
Pineapples Global pineapple production was approximately 18 million mt in 2006 and in recent years has been characterized by steady growth.175 Between 2002 and 2006, global production of pineapples increased by 15 percent by volume. In 2006, the largest producers were Thailand (2,705,179 mt), Brazil (2,487,116 mt), the Philippines (1,833,910 mt), China (1,400,000 mt), India (1,229,400 mt), and Costa Rica (1,200,000 mt).176 The 23 countries that produce pineapples in SSA produce about 14 percent of the world total each year, which in 2006 was 2.6 million mt.177 During 2002–06, the largest SSA producers in order of production volume were Nigeria, Kenya, South Africa, Côte d’Ivoire, and the Democratic Republic of the Congo. Growth in global exports of fresh pineapples grew at an even faster rate than production during 2002–06: approximately 84 percent by volume.178 Although SSA countries have historically held a significant share of global pineapple trade, that share dropped during 2002–06 as total SSA pineapple exports fell 28 percent by volume (table 2.7). This decrease lowered SSA’s share of total world exports from approximately 21 percent in 2002 to only 11 percent in 2006.179
175 FAO, FAOSTAT Production Database. 176 Thailand and China are the first and fourth largest exporters of canned pineapples in the
world. Brazil, India, and China are the world’s second, third, and fourth largest consumers of fresh pineapples only behind the United States. As a result, all four countries are not major exporters of fresh pineapples. FAO, FAOSTAT Consumption Database and GTIS, Global Trade Atlas.
177 FAO, FAOSTAT Production Database. 178 GTIS, Global Trade Atlas. 179 Ibid.
Table 2.6 Sub-Saharan Africa exports of SSA bananas, by selected exporters and key markets, 2002–06 Exports Change, 2002 to 2006 Exporter Key markets 2002 2003 2004 2005 2006 Absolute Percent
1,000 dollars 134,125 214,852 213,408 226,758 221,157 87,032 65 EU Metric tons 236,502 298,507 261,244 252,926 252,722 16,220 7 1,000 dollars 1,731 1,134 665 216 510 -1,221 -71 All other Metric tons 4,542 2,838 788 74 627 -3,915 -86 1,000 dollars 135,856 215,986 214,073 226,974 221,667 85,811 63
Cameroon
Total Metric tons 241,044 301,345 262,032 253,000 253,349 12,305 5 1,000 dollars 112,992 158,929 183,402 164,034 180,441 67,449 60 EU Metric tons 216,742 210,952 210,776 183,850 221,791 5,049 2 1,000 dollars 4,404 5,374 7,196 7,493 9,025 4,621 105 All other Metric tons 13,345 13,540 15,548 16,442 20,590 7,245 54 1,000 dollars 117,396 164,303 190,598 171,527 189,466 72,070 61
Côte d'Ivoire
Total Metric tons 230,087 224,492 226,324 200,292 242,381 12,294 5 1,000 dollars 2,647 1,245 2,500 3,763 16,852 14,205 537 EU Metric tons 3,536 1,238 2,003 4,331 22,615 19,079 540 1,000 dollars 23 26 8 6 75 52 226 All other Metric tons 25 32 4 5 158 133 532 1,000 dollars 2,670 1,271 2,508 3,769 16,927 14,257 534
Ghana
Total Metric tons 3,561 1,270 2,007 4,336 22,773 19,212 540 1,000 dollars 250,342 375,430 399,877 395,807 421,040 170,698 68 EU Metric tons 457,434 510,935 474,274 441,907 498,400 40,966 9 1,000 dollars 8,714 6,933 8,525 9,308 15,833 7,119 82 All other Metric tons 23,587 18,148 19,358 23,350 35,426 11,839 50 1,000 dollars 259,056 382,363 408,402 405,115 436,873 177,817 69
Sub-Saharan Africa
Total Metric tons 481,021 529,083 493,632 465,257 533,826 52,805 11 Source: GTIS, Global Trade Atlas, annual data compiled from reporting countries’ official statistics, including EU external trade.

2-55
Leading Exporters
Bananas The leading global exporter of bananas is Ecuador, followed by Colombia, Costa Rica, and the Philippines (figure 2.11). In 2006, these four countries accounted for 75 percent of total global banana exports. Banana exports from Latin America are shipped in large quantities to both the United States and the EU. Banana exports from the Philippines are destined almost entirely for Asian markets. The largest SSA banana exporters are Cameroon, Côte d’Ivoire, and Ghana. Cameroon and Côte d’Ivoire together accounted for approximately 93 percent of all SSA banana exports in terms of volume in 2006. Some of the largest SSA banana producers, including Burundi, Uganda, Kenya, and South Africa, export only minimal quantities of bananas as a result of high domestic consumption.
During 2002–06, banana exports from Ecuador, the Philippines, and Costa Rica increased in terms of volume by 7, 44, and 12 percent, respectively. The increase in exports by all of SSA, 11 percent by volume, mirrored the worldwide growth of 13 percent. Exports from Côte d’Ivoire and Cameroon, each of which grew by approximately 12,000 mt, or 5 percent, accounted for approximately 47 percent of the SSA export growth. Banana exports from Ghana, which contribute a much smaller percentage of the total SSA banana exports, experienced the largest growth in both volume and value, as a new acreage entered production, and increased by more than 530 percent, albeit from a very small base.180 While the volume of exports from SSA increased to some extent, the increase of exports in
180 Ibid.
Table 2.7 Sub-Saharan Africa exports of SSA pineapples, by selected exporters and key markets, 2002–06 Exports Change, 2002 to 2006 Exporter Key markets 2002 2003 2004 2005 2006 Absolute Percent
1,000 dollars 104,152 119,295 120,887 77,275 72,059 -32,093 -31 EU Metric tons 165,305 141,347 137,528 99,889 94,761 -70,544 -43 1,000 dollars 6,833 6,751 9,497 8,965 9,092 2,259 33 All other Metric tons 14,522 13,688 16,195 13,998 12,501 -2,021 -14 1,000 dollars 110,985 126,046 130,384 86,240 81,151 -29,834 -27
Côte d'Ivoire
Total Metric tons 179,827 155,035 153,723 113,887 107,262 -72,565 -40 1,000 dollars 40,265 60,001 70,275 57,393 51,268 11,003 27 EU Metric tons 36,467 44,316 51,726 45,066 40,102 3,635 10 1,000 dollars 6,874 7,192 5,992 6,671 5,489 -1,385 -20 All other Metric tons 4,080 3,754 3,846 4,338 3,488 -592 -15 1,000 dollars 47,139 67,193 76,267 64,064 56,757 9,618 20
Ghana
Total Metric tons 40,547 48,070 55,572 49,404 43,590 3,043 8 1,000 dollars 1,451 3,019 3,807 4,164 7,050 5,599 386 EU Metric tons 2,005 3,484 3,963 4,411 8,493 6,488 324 1,000 dollars 181 306 265 298 583 402 222 All other Metric tons 90 117 92 113 375 285 317 1,000 dollars 1,632 3,325 4,072 4,462 7,633 6,001 368
Cameroon
Total Metric tons 2,095 3,601 4,055 4,524 8,868 6,773 323 1,000 dollars 154,806 192,943 207,566 150,832 144,166 -10,640 -7 EU Metric tons 211,297 196,336 200,637 156,822 150,085 -61,212 -29 1,000 dollars 15,593 16,200 17,804 17,613 17,367 1,774 11 All other Metric tons 19,914 18,517 21,231 19,335 17,510 -2,404 -12 1,000 dollars 170,399 209,143 225,370 168,445 161,533 -8,866 -5
Sub Saharan Africa
Total Metric tons 231,211 214,853 221,868 176,157 167,595 -63,616 -28 Source: GTIS, Global Trade Atlas, annual data compiled from reporting countries’ official statistics, including EU external trade.
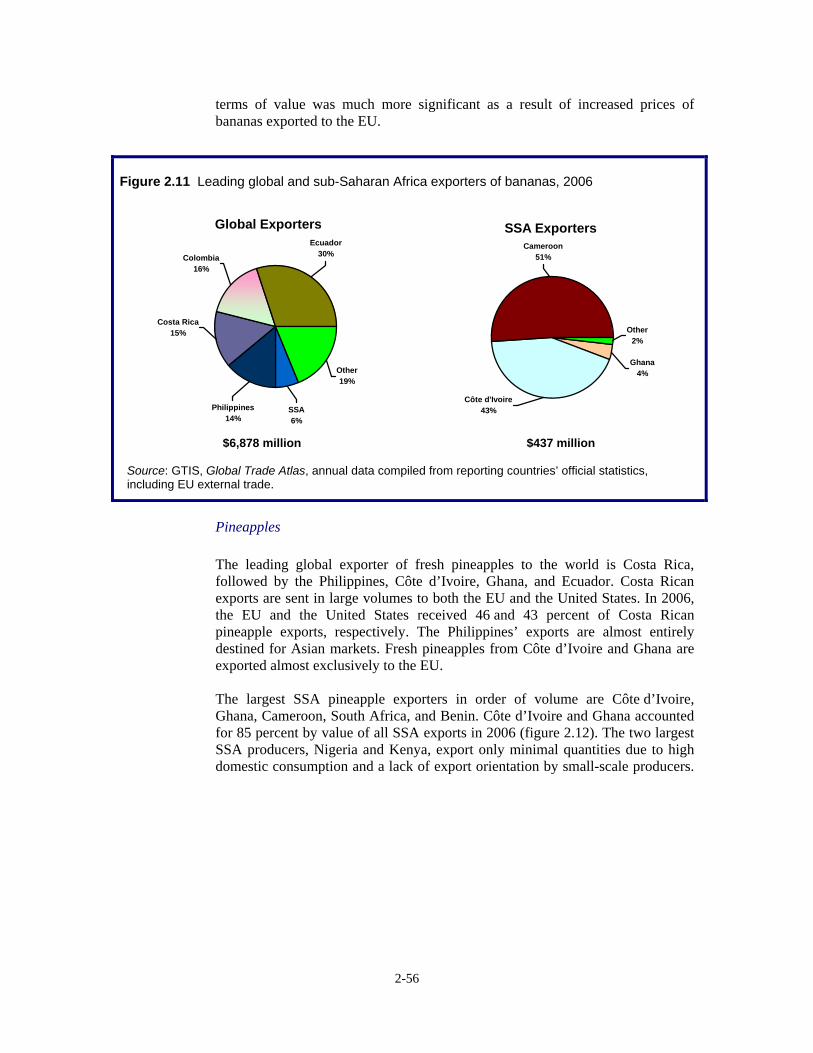
2-56
terms of value was much more significant as a result of increased prices of bananas exported to the EU.
Pineapples The leading global exporter of fresh pineapples to the world is Costa Rica, followed by the Philippines, Côte d’Ivoire, Ghana, and Ecuador. Costa Rican exports are sent in large volumes to both the EU and the United States. In 2006, the EU and the United States received 46 and 43 percent of Costa Rican pineapple exports, respectively. The Philippines’ exports are almost entirely destined for Asian markets. Fresh pineapples from Côte d’Ivoire and Ghana are exported almost exclusively to the EU. The largest SSA pineapple exporters in order of volume are Côte d’Ivoire, Ghana, Cameroon, South Africa, and Benin. Côte d’Ivoire and Ghana accounted for 85 percent by value of all SSA exports in 2006 (figure 2.12). The two largest SSA producers, Nigeria and Kenya, export only minimal quantities due to high domestic consumption and a lack of export orientation by small-scale producers.
Figure 2.11 Leading global and sub-Saharan Africa exporters of bananas, 2006
Global Exporters
Other19%
Ecuador30%Colombia
16%
Philippines14%
Costa Rica15%
SSA6%
SSA Exporters
Other2%
Côte d'Ivoire43%
Cameroon51%
Ghana4%
$6,878 million $437 million Source: GTIS, Global Trade Atlas, annual data compiled from reporting countries’ official statistics, including EU external trade.

2-57
As world pineapple trade expanded during 2002–06, Costa Rica and the Philippines increased their exports by 62 and 46 percent by volume, respectively, and maintained their large share of world exports. Côte d’Ivoire’s exports, however, decreased by 40 percent from 179,827 mt to 107,262 mt during 2002– 06 due to political unrest and changing consumer preferences. As a result, Côte d’Ivoire’s share of world exports in terms of volume dropped from 17 percent in 2002 to 5 percent in 2006. Despite a decreasing position as a global pineapple exporter, Côte d’Ivoire still accounted for 64 percent of total SSA exports by value in 2006. Ghana’s exports peaked in 2004 before decreasing but by the end of the period had increased by 8 percent overall. Cameroon’s pineapple exports increased consistently throughout the 5-year period and by the end of the period increased by 323 percent, albeit from a much smaller base.181
Leading Export Markets The leading global importers of both pineapples and bananas are the EU and the United States. The EU is the destination for 47 percent of global exports of both pineapples and bananas, while the United States is the destination for 31 and 17 percent by value of pineapples and bananas, respectively182 (figures 2.13 and 2.14). The global export market outside of the United States and the EU for pineapples and bananas is fragmented among a large number of relatively small markets.
181 The trends in pineapple exports mentioned above are similar when exports are measured either by value or by volume. GTIS, Global Trade Atlas.
182 GTIS, Global Trade Atlas.
Figure 2.12 Leading global and sub-Saharan Africa exporters of pineapples, 2006
Global Exporters
Other15%
SSA11%
Costa Rica64%
Philippines10%
SSA Exporters
Other5%
Ghana35%
Côte d'Ivoire50%
Cameroon5%
South Africa5%
$1,414 million $162 million Source: GTIS, Global Trade Atlas, annual data compiled from reporting countries’ official statistics, including EU external trade.
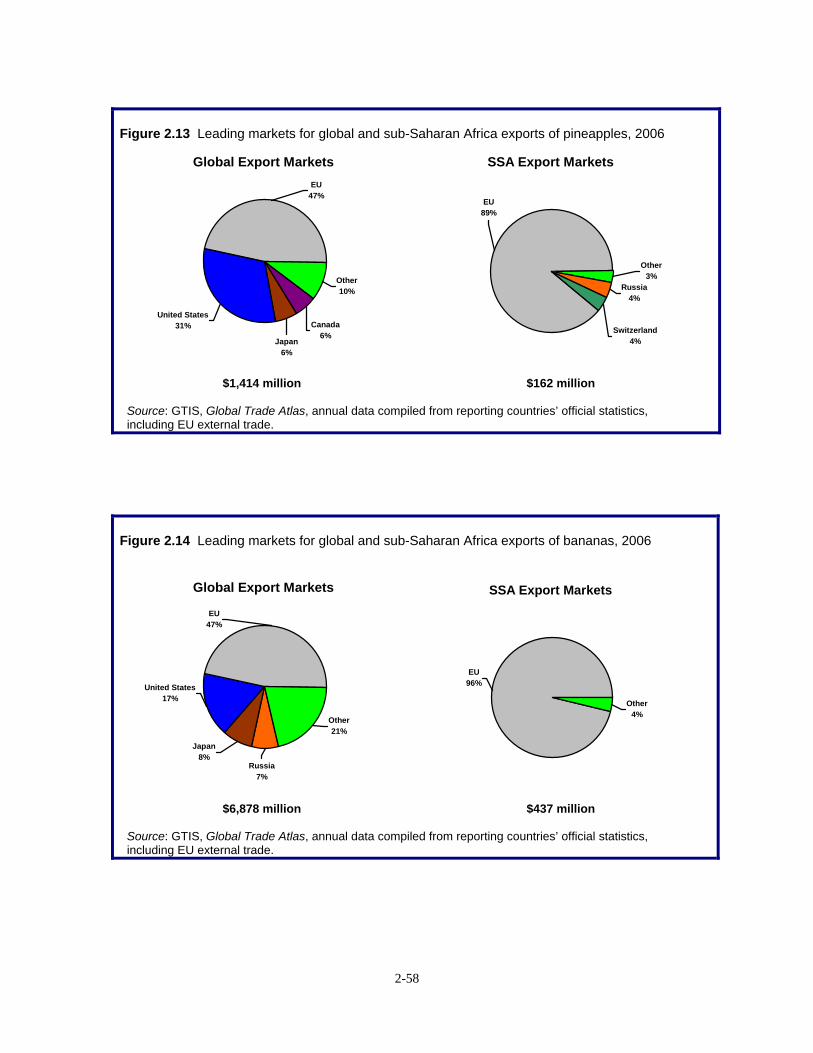
2-58
Figure 2.13 Leading markets for global and sub-Saharan Africa exports of pineapples, 2006
Global Export Markets
Other10%
EU47%
Japan6%
United States31% Canada
6%
SSA Export Markets
EU89%
Russia4%
Other3%
Switzerland4%
$1,414 million $162 million Source: GTIS, Global Trade Atlas, annual data compiled from reporting countries’ official statistics, including EU external trade.
Figure 2.14 Leading markets for global and sub-Saharan Africa exports of bananas, 2006
Global Export Markets
Other21%
EU47%
Japan8%
United States17%
Russia7%
SSA Export Markets
EU96%
Other4%
$6,878 million $437 million Source: GTIS, Global Trade Atlas, annual data compiled from reporting countries’ official statistics, including EU external trade.
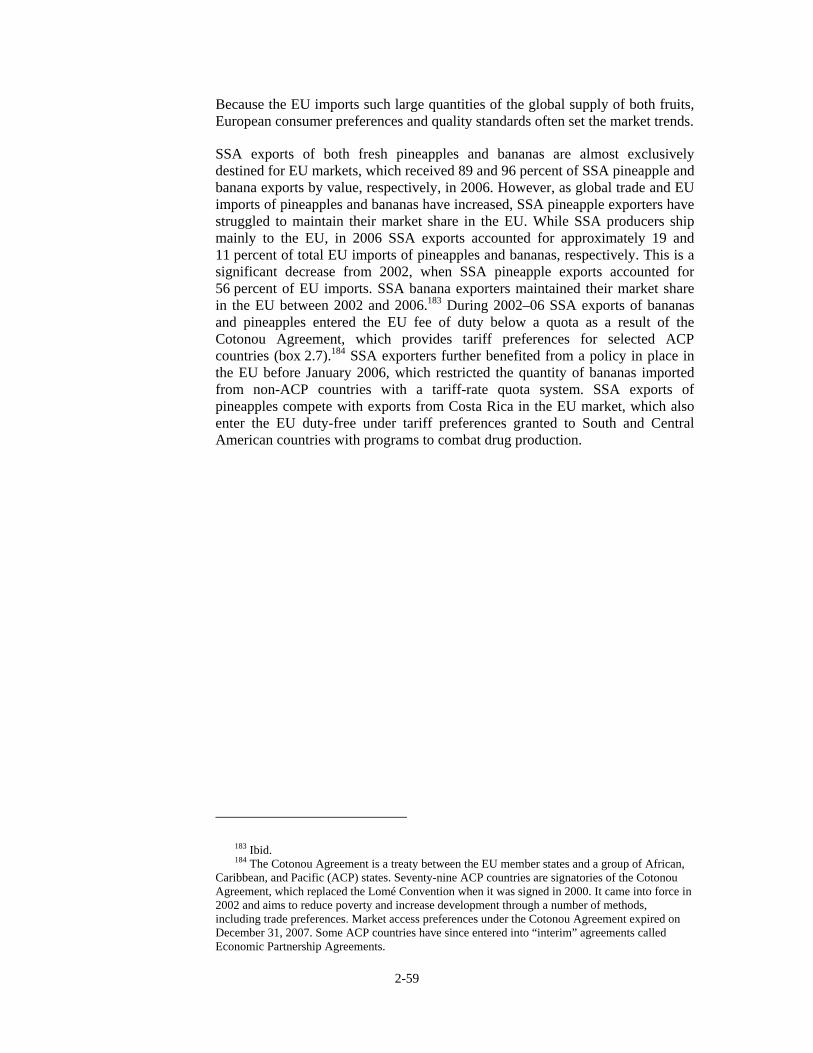
2-59
Because the EU imports such large quantities of the global supply of both fruits, European consumer preferences and quality standards often set the market trends.
SSA exports of both fresh pineapples and bananas are almost exclusively destined for EU markets, which received 89 and 96 percent of SSA pineapple and banana exports by value, respectively, in 2006. However, as global trade and EU imports of pineapples and bananas have increased, SSA pineapple exporters have struggled to maintain their market share in the EU. While SSA producers ship mainly to the EU, in 2006 SSA exports accounted for approximately 19 and 11 percent of total EU imports of pineapples and bananas, respectively. This is a significant decrease from 2002, when SSA pineapple exports accounted for 56 percent of EU imports. SSA banana exporters maintained their market share in the EU between 2002 and 2006.183 During 2002–06 SSA exports of bananas and pineapples entered the EU fee of duty below a quota as a result of the Cotonou Agreement, which provides tariff preferences for selected ACP countries (box 2.7).184 SSA exporters further benefited from a policy in place in the EU before January 2006, which restricted the quantity of bananas imported from non-ACP countries with a tariff-rate quota system. SSA exports of pineapples compete with exports from Costa Rica in the EU market, which also enter the EU duty-free under tariff preferences granted to South and Central American countries with programs to combat drug production.
183 Ibid. 184 The Cotonou Agreement is a treaty between the EU member states and a group of African,
Caribbean, and Pacific (ACP) states. Seventy-nine ACP countries are signatories of the Cotonou Agreement, which replaced the Lomé Convention when it was signed in 2000. It came into force in 2002 and aims to reduce poverty and increase development through a number of methods, including trade preferences. Market access preferences under the Cotonou Agreement expired on December 31, 2007. Some ACP countries have since entered into “interim” agreements called Economic Partnership Agreements.
2-60
Factors Affecting Export Patterns
Growth in consumer demand for bananas in major consuming markets, such as the EU, was the key factor contributing to SSA banana export growth. In order to take advantage of increased EU demand and the tariff preferences granted to SSA countries, multinational produce firms expanded existing banana plantations and invested in new operations. This increased investment by multinational produce firms was a key factor contributing to SSA banana export growth. The main factor contributing to shifts in pineapple exports was the entrance in the market of new, sweeter, consumer-preferred pineapple varieties. The resulting shift in demand to the new pineapple varieties forced the West African producers to convert their production to the new MD2 variety, which negativity impacted SSA export volumes during 2002–06.
Box 2.7 EU tariff preferences for bananas from ACP countries EU preference conditions for bananas from ACP (African, Caribbean, and Pacific) countries have given SSA exporters an advantage in the EU market over the large producers and exporters in Latin America. Prior to January 1, 2006, the EU applied a complex system of tariff-rate quotas for bananas under which ACP bananas entered free of duty under a quota of 750,000 tons. A €75 (about $90) per ton tariff was applied to EU banana imports from all other countries up to the quota of 2,653,000 tons.1 An additional 460,000 tons for all countries was added to the quota in 2004 as a result of the EU membership expansion.2 For bananas that entered the EU above the quota limits, prohibitive out-of-quota tariffs of €380 (about $440) and €680 (about $790) per ton were applied for bananas from ACP countries and all other countries, respectively.2
The EU banana regime has been the focus of ongoing negotiations, cases, and formal consultations in the WTO.4 The EU lost a case before the WTO Dispute Settlement Body in 1999, and after negotiations with the United States and Ecuador, agreed in 2001 to implement a new banana tariff-only regime by January 1, 2006. The new tariff regime implemented in 2006 continued to be preferential for ACP bananas. The new regime applies a tariff of €176 (about $200) per ton to countries with WTO MFN status. Bananas supplied by ACP countries enter free of duty below a quota of 755,000 tons. The quota level for ACP countries is approximately equal to the average amount of ACP bananas that traditionally entered the EU on a yearly basis.5 Non-ACP countries, such as Ecuador and Colombia, that do not receive the ACP preferences have continued to fight the tariff, arguing that the €176 (about $200) per ton tariff is too high and provides additional cost advantages to the ACP producers. ____________
1 FAO, “Agriculture, Trade Negotiations, and Gender,” 36. 2 The additional 460,000 tons was the total provided for all countries. EC, “Biennial Report on the Special Framework
of Assistance for Traditional ACP Suppliers of Bananas,” December 12, 2004, 5. 3 EC, Taric Consultation Database. 4 “In September 1995, the United States, Guatemala, Mexico, and Honduras requested formal consultations with the
EU, challenging the European import regime that gave preferences to banana imports from its former colonies, and preferential licenses to European banana importers. Ecuador later joined the WTO dispute. The EU lost the case before the WTO Dispute Settlement Body, and in 1999 the US imposed 100 percent tariffs on a list of eight items representing $191.4 million in imports from the EU. In 2001, the EU reached an agreement with the US and Ecuador to implement a new tariff regime by January 1, 2006.” USDA, FAS, EU-25 Trade Policy Monitoring Second WTO Rejection of the Banana Dispute, 2005, March 14, 2007.
5 EC, “Biennial Report on the Special Framework of Assistance for Traditional ACP Suppliers of Bananas,” December 12, 2004, 4.
2-61
Demand Growth for Bananas and Pineapples
Bananas Demand for bananas in the EU grew significantly in 2003 and 2004, partly as a result of cool weather in parts of Europe that reduced competition from other summer fruits due to below-average harvests.185 Also, EU domestic production186 during 2002–06 decreased by more than 13 percent by volume.187 These conditions led to greater EU demand for banana imports, which, by volume, increased by 13 percent between 2002 and 2006.188 As a result, total EU consumption of bananas grew steadily between 2002 and 2005, increasing by 12 percent by volume.189 This increased demand in the EU encouraged SSA growers to increase production and exports to the EU.190
Pineapples Demand for fresh pineapples in major consuming markets has increased over the last decade as a result of increased consumer education, better quality control, a growing preference for fresh instead of processed fruit, and improved packing techniques and product movement. Increases in demand during the 2002–06 period can be attributed to product innovations, such as the new MD2 variety, which have catered to changing consumer tastes, and new fresh pineapple product offerings by marketers, such as fresh cut pineapple in supermarket refrigerated sections. Pineapple consumption in the EU, SSA’s major export market, grew significantly during this period, by more then 30 percent by volume between 2002 and 2005.191 As there is virtually no pineapple production within the EU, the additional demand was supplied almost entirely by increased imports. Total EU imports of pineapples increased by 104 percent by value between 2002 and 2006.192 Despite growing EU demand and consumption of pineapples, the increased demand was primarily for the new varieties and not the traditional SSA export varieties.
Development of New Pineapple Variety During 2002–06, a new, consumer-preferred variety of pineapple entered the market in significant quantities, primarily from Costa Rica, and was an important factor that contributed to a decrease in exports from Côte d’Ivoire and Ghana and
185 FAO, “Food Outlook April 2005,” April 2005, 20. 186 EU banana production is located in Spain (Canary Islands), France (Guadeloupe and
Martinique), Greece, and Portugal (primarily Madeira). EU production has typically supplied slightly more than 10 percent of EU consumption. FAO, FAOSTAT Production and Consumption Database.
187 FAO, FAOSTAT Production Database. 188 GTIS, Global Trade Atlas. 189 2005 is the latest year for which consumption data is available. FAO, FAOSTAT
Consumption Database. 190 Industry official, interview by Commission staff, Côte d’Ivoire, October 25, 2007. 191 FAO, FAOSTAT Consumption Database. 192 GTIS, Global Trade Atlas.
2-62
a corresponding contraction in market share for SSA in the EU. The Smooth Cayenne pineapple was traditionally the most prevalent; however, a new variety, the MD2, is now preferred by European and U.S. consumers due to its sweeter, less acidic flavor.193 Increased demand for the MD2 variety increased the value of trade for pineapples, because the MD2 variety is often twice the price of the traditional Smooth Cayenne.194 In 2003 and 2004, Costa Rica began exporting large volumes of the MD2 variety, which provided Costa Rica with a first-to-market advantage and allowed it to significantly increase its market share in the EU, to the detriment of the West African producers.195 The MD2 variety also drove down the price of the traditional Smooth Cayenne variety, which resulted in a significant drop in the value of SSA exports. The MD2 variety now accounts for more than 75 percent by volume of European pineapple imports.196 This change in consumer preference to the new variety forced the industries in Côte d’Ivoire, Ghana, and Cameroon to transition their production to the MD2 variety in order to counter their decreasing market shares in the EU. The transitions in each country occurred on different time schedules, used different methods, and had varying degrees of government assistance and success.
Increased Foreign Investment Multinational produce companies, such as Dole, Chiquita, and Del Monte, expanded their plantings or established new large-scale production operations in the banana sector of West Africa in order to take advantage of the EU tariff preferences provided to ACP countries.197 For example, new investments in Ghana brought a large multinational firm, Compagnie Fruitière and Dole under the Golden Exotics name, into the banana industry and exponentially increased exports since the beginning of its operations. Investments in the region increased plantings, and as a result, the total area harvested for bananas in Côte d’Ivoire, Cameroon, and Ghana increased by more than 12 percent between 2002 and 2006.198 Foreign investment also brought highly professional farm practices and state-of-the-art logistics to the West African tropical fruit producers.
Price Increases for Bananas The price of imported bananas in the EU increased significantly between 2002 and 2006 as a result of a number of factors. Refrigerated container rates increased
193 The hybrid MD2 pineapple is also uniform in size and ripeness, has spineless leaves, and has a brighter gold color than the more traditional varieties, such as Smooth Cayenne. To the benefit of both producers and consumers, the MD2 variety is less resistant to internal browning, has a longer shelf life, and as a result demands a higher market price.
194 Fresh Plaza, “Ghana: Government fulfils promise to Pineapple exporters,” July 11, 2005. 195 Ghana Export Promotion Council, “Exports of MD2 Variety Rake in $20 million,”
February 8, 2007. 196 Ghanaweb, “GEPC Orders Pineapple Plantlets,” October 11, 2004. 197 Dow Jones Newswires, “Ecuador Reignites Banana Wars,” February 27, 2007. 198 FAO, FAOSTAT Production Database.
2-63
worldwide, causing the price of bananas to rise in all markets.199 Unfavorable weather in Central America during the 2005 hurricane season limited supply while demand remained high, causing prices to rise globally.200 In addition, changes to the EU tariff regime for bananas in 2006 may have contributed to a rise in banana prices (box 2.9). For SSA exporters, the price of bananas in the EU has a substantial impact on the total value of exports since almost all SSA banana exports are destined for EU markets. While the value of SSA exports to the EU rose significantly due to price increases, the quantity exported only rose by approximately 9 percent.201 While the average unit value of EU banana imports rose from all sources, the increase was much more significant from the large West Africa producers. Between 2002 and 2006, the average price per ton of imported bananas from Cameroon and Côte d’Ivoire rose 54 percent, from $548 to $843.202 Over this same period the average import value increased for bananas from the large Latin American producers by only 26 percent, from $557 to $704.203 The average EU value increase per ton for all imported bananas in terms of the euro was less profound but still significant.204 The increase was 30 and 20 percent from Côte d’Ivoire and Cameroon, respectively, in terms of euros during 2002–2005.205 These higher prices encouraged producers to increase production and exports.206 The new EU banana tariff, which increased from €75 (about $90) under a TRQ to €176 (about $200) per ton for all non-ACP imports in January 2006, also may have contributed to an increase in prices of bananas that year.207 The new tariff reportedly added significant costs for large multinational firms exporting bananas into the EU from Latin America and other non-ACP countries such as Brazil. As a result, large multinational produce firms announced price increases in the EU market in 2006. For example, Chiquita announced that the tariff increased its cost per box of Latin American bananas in the EU by $2.20.208 The firm’s average price in the EU, as a result, also rose by 5 percent on a local currency basis.209 As the higher tariff reportedly increased costs and prices for the Latin American
199 One factor contributing to the rise in import prices was the rise in the cost of sea transportation. This was caused partially by the doubling of fuel prices between 2002 and 2006. Reefer rates on average increased by approximately 10 percent between 2004 and 2005 alone. FAO, “Banana Market Situation in 2005 and Early 2006”; The Federal Reserve Board of San Francisco, “Oil Prices and the U.S. Trade Deficit,” September 22, 2006; and InflationData, “Historical Crude Oil Prices.”
200 FAO, “Banana Market Situation in 2005 and Early 2006,” May 2006 201 GTIS, Global Trade Atlas. 202 Prices are C.I.F. (Cost Insurance Freight) values. 203 Latin American producers referred to here includes Ecuador, Colombia, and Costa Rica. 204 SSA exports are generally traded in euros while Latin American exports are generally trade
in U.S. dollars. 205 USAID, “Policies Affecting the Development of Ghana’s Banana-Export Sector,”
December 2006, 26. 206 Industry official, interview by Commission staff, Côte d’Ivoire, October 25, 2007. 207 EC, “Biennial Report on the Special Framework of Assistance for Traditional ACP
Suppliers of Bananas,” December 12, 2004, 4. 208 The standard box size is 40 lbs. 209 Heller, “Chiquita Raises Banana Prices in Response to Higher Tariffs,” Food Navigator
Europe, March 24, 2006.
2-64
product, the largest suppliers to the EU market—the SSA exporters—may have also been able to increase their average price per ton without losing market share.
Assistance to SSA from International Aid Programs During 2002–06, development aid from a number of international organizations and government donors funded projects that provided support to the pineapple and banana industries in SSA in order to improve their competitiveness in global markets. Although the specifics of these initiatives will be discussed below in specific country profiles, the support provided technical assistance to SSA growers in order to enhance productivity, improved the business environment, and upgraded export facilities and supporting infrastructure thereby improving speed to market and product quality. The assistance also supported the development of tropical fruit industry organizations and producer organizations.
The Development of Industry Organizations and Government Support Institutions
Private industry and tropical fruit producer organizations in Côte d’Ivoire, Ghana, and Cameroon increased their coordination and influence as their industries matured during 2002–06. As a result of their increased capabilities, these industry organizations, with the assistance of government support institutions, were able to provide strategic direction for their industries’ growth, as well as oversight of their industry operations. Industry organizations worked with individual private firms and were integral to the pineapple industries’ transition from the Smooth Cayenne variety to the consumer-preferred MD2 variety. Because the EU is the destination for almost all SSA tropical fruit exports, it was essential for growers to adapt to and follow the EU’s sanitary and quality restrictions. Private industry organizations and institutions provided technical support and assistance as growers and traders increasingly tried to gain EU quality certifications. Industry organizations and government agencies also coordinated the growth in cold storage sea-freight shipping and began programs, which assisted product-and industry-specific efforts to increase the competitiveness of horticultural exports. The impact of specific industry organizations and institutions will be discussed in more detail in the following country profiles.210
210 Industry official, interview by Commission staff, Abidjan, Côte d’Ivoire, October 24, 2007; and FAGE, “Ready for Take Off–Ghana Horticulture,” May 2007, 5.
2-65
Country Profiles
Côte d’Ivoire In Côte d’Ivoire, the principal factors that contributed to the decrease in pineapple exports between 2002 and 2006 were the political crisis211 and its transition to production of the new MD2 pineapple variety. Banana exports grew significantly by value as a result of increased prices in the EU market. Both the banana and pineapple industries benefited from assistance from international aid programs that improved infrastructure and productivity. The political crisis in Côte d’Ivoire that began in 2002 had a significant impact on the production of tropical fruit and was one of the primary causes of the significant decrease in pineapple exports. Unlike the production of bananas, which generally takes place on larger plantations, pineapple production is still largely generated by small independent growers. As a result of the political instability, most financial lending in the country became restricted, particularly for small farmers. Without access to credit, many small farmers were unable to produce pineapples.212 Ivorian producers are reliant on the EU export market, and there are significant hurdles to market diversification, giving EU importers significant buying power. As a result, most producers are not paid by the EU importers until the product is purchased by consumers in the European market.213 This arrangement significantly limits the smaller growers’ ability to utilize the limited capital they possess and adds to the capital limitations created by the political instability. There has also been concern that the transportation infrastructure is deteriorating as a result of the recent political crisis.214 Before the crisis began, small pineapple growers produced approximately 150,000 mt per year; after the start of the crisis, production dropped to 25,000 mt per year.215 Another factor that limited Côte d’Ivoire’s exports of pineapples was the new consumer preference for the MD2 pineapple variety. The industry transition to the new variety in Côte d’Ivoire was undertaken entirely by the private sector, with the direction and oversight of the Organisation Centrale des Producteurs-Exportateurs d’Ananas et de Bananes (OCAB).216 SCB, a venture in which Dole
211 A failed coup attempt in 2002 quickly evolved into a rebellion. Rebel groups unified under the name, New Forces. In late January 2003, the country’s major political parties and the New Forces signed the French-brokered Linas-Marcoussis Accord (LMA), agreeing to a power-sharing national reconciliation government to include the rebel New Forces representatives. While on occasion there have been violent flare-ups, the country has maintained the east-west ceasefire line since the LMA with the help of peacekeeping troops. Due to political deadlock, the country remains divided. U.S. Department of State, “Background Note: Côte d’Ivoire,” November 2007.
212 The banana sector was less affected because production generally takes place on larger plantations operated by multinational produce firms, which lenders view as less risky and are less susceptible to domestic interruptions.
213 Industry official, interview by Commission staff, Abidjan, Côte d’Ivoire, October 24, 2007. 214 U.S. Department of State, “Background Notes on Côte d’Ivoire,” November 2007. 215 Industry official, interview by Commission staff, Abidjan, Côte d’Ivoire, October 24, 2007. 216 OCAB is the national association of producers and exports of bananas, pineapples, and
mangoes in Côte d’Ivoire. It provides quality control, industry oversight, oversight of freight, and supervision of production.
2-66
has a controlling interest, was the private firm that began MD2 production in Côte d’Ivoire.217 The transition in Côte d’Ivoire, despite OCAB’s oversight and assistance, was somewhat slower than in other West African countries. While measurable planting began in 2004, by the end of the 2006, production of the MD2 variety still made up less than one-half of all pineapple production.218 This factor limited demand for Ivorian pineapples in the EU. The EU Special Framework of Assistance for Traditional Suppliers of Bananas provides technical and financial support for specific projects proposed by the respective ACP banana-producing-country national governments. The EU allocated €21.73 (about $25) million for Côte d’Ivoire’s banana industry between 1999 and 2006.219 Projects between 2002 and 2006 were focused on technical assistance to increase productivity, rural development, and the social infrastructure. Investments were also made to improve quality and phytosanitary standards in order to: acquire or maintain EurepGAP/ISO14001 certifications;220 establish producer organizations; increase handling, packaging, and storage facilities; and develop marketing strategies. This program, along with the efforts made by industry organizations such as OCAB, has succeeded in getting producers to meet European quality standards. Today, all banana production is EurepGAP certified.221 International aid programs helped Côte d’Ivoire improve its infrastructure to the benefit of both pineapple and banana exporters. The World Bank operated an Export Promotion and Diversification Project that began operating in 1996 and was completed at the end of 2003. One of the program’s most beneficial aspects for banana and pineapple exporters was the rehabilitation and upgrading of export facilities. The fruit wharf at the port of Abidjan was refurbished and reopened for use for 2003. New facilities for cold storage, handling and packaging, and increased storage capacity were constructed at a cost of $27 million, which was financed primarily by the EU.222 This project increased the number of outlets on the dock for cold storage containers from 2 to 91, allowing for the storage of more fruit on the dock for longer periods while reducing spoilage.223 In 2004, the port’s logistical systems were improved to include a computerized tracking system, barcodes, and scanners. This tracking system allows traders and producers to coordinate and track shipments better, thus improving efficiency. The EU also funded this project. The port at Abidjan is now considered to be one of the most efficient ports in all of Africa and has contributed to the success of the country’s banana export sector.224
217 Industry official, interview by Commission staff, Abidjan, Côte d’Ivoire, October 24, 2007. 218 Ibid. 219 EC, “Biennial Report on the Special Framework of Assistance for Traditional ACP
Suppliers of Bananas,” December 15, 2006, 10. 220 EurepGAP is an organization that sets standards for the certification of agricultural products
in order to establish consistent standards and procedures for Good Agricultural Practices (GAP) around the world. The certification is designed to enhance consumer confidence in food safety and quality. ISO14001 is a environmental management certification.
221 Industry official, interview by Commission Staff, Abidjan, Côte d’Ivoire, October 24, 2007. 222 World Bank, “Implementation Completion Report,” December 31, 2007, 6. 223 Industry official, interview by Commission staff, Abidjan, Côte d’Ivoire, October 26, 2007. 224 FITA, “Market Access – Ivory Coast,” 2006.
2-67
Ghana In Ghana, the principal factors that contributed to the shift in exports of both pineapples and bananas between 2002 and 2006 were increased investments from a multinational firm and assistance from the Ghanaian government and international aid programs that improved infrastructure, increased productivity, and supported industry organizations in the transition to the new pineapple variety. The benefits of some of these factors did, however, have a much more limited impact on pineapple exports as a result of competition from the new variety. Investment from multinational produce firms helped to spur export growth for both bananas and pineapples in Ghana during 2002–06. Compagnie Fruitière of France, in which Dole has a 40 percent stake, was incorporated under the name Golden Exotics Ltd. in 2003 and began operations in Ghana in 2004. It acquired and expanded the previously existing pineapple operations of the Paradise Farm and banana operations of the Kasunya Farm. Golden Exotics made significant capital investments in these two projects in order to expand its operations in Ghana. By the end of 2006, investments in their Ghanaian banana operations alone totaled approximately €25 (about $30) million.225 Golden Exotics’ banana operations expanded significantly as a result of this large capital investment. Golden Exotics was the first, and is currently the only, major multinational firm producing bananas in Ghana. The banana operation was launched in 2005 and prior to its entrance banana production was primarily done on smaller plantations. By the end of 2006, Golden Exotics’ banana farm had grown to 800 hectares (1,976 acres) in size and had the potential to expand to 2,000 hectares (4,942 acres). In 2006, the 800 hectares (1,976 acres) at the Paradise Farm yielded 35,000 tons of bananas for export, which according to representatives from Golden Exotics, accounted for more than 85 percent of Ghana’s total banana exports in 2006.226 As a result of this expansion, exports of bananas from Ghana grew by more than $13 million between 2005 and 2006.227 Golden Exotics pineapple operations expanded significantly as well. By the end of December 2004, 160 additional hectares were planted, and by the end of 2006, 350 additional hectares (865 acres) were planted. In 2006, Golden Exotics’ farm yielded approximately 15,000 tons exclusively of the MD2 variety all for export.228 This production represented approximately 40 percent of the country’s total pineapple exports.229 The company is expected to expand its planted hecterage to the maximum of the purchased land, approximately 1,000 hectares
225 Industry official, interview by Commission staff, Accra, Ghana, October 29, 2007. 226 Ibid. 227 GTIS, Global Trade Atlas. 228 Industry official, interview by Commission staff, Accra, Ghana, October 30, 2007. 229 Del Monte was able to establish a plant in 1994 for a particular new pineapple variety,
which gave a head start in production. However, the legality and applicability of this patent to other newer pineapple varieties was challenged by both Dole and Maui Land and Pineapple. After numerous suits and counter suits were filed. The patent issue was finally settled out of court in 2003. Fresh Del Monte then withdrew the patent. Frank, “Juices Details,” October 7, 2003. 1-4.
2-68
(2,471 acres) at the Paradise pineapple farm, which would expand the total production capabilities significantly. To sustain its development, Golden Exotics started an MD2 pineapple nursery early in 2003, and, in addition its own needs, it developed enough production capabilities to supply third parties with MD2 planting material.230 Ghanaian pineapple exports struggled to expand and actually experienced a decrease as a result of the presence of the new MD2 variety in the market. The growth in pineapple exports from Ghana occurred mainly between 2002 and 2004. While the quantity of exports peaked in 2004, the price of the traditional Smooth Cayenne variety decreased. During the following year, 2005, the quantity and value of Ghana’s pineapple exports dropped significantly as a result of the European preference for the MD2 variety pineapple. The Ghanaian government responded with a $2 million budget allocation to establish Bioplantlet Ghana Limited for the multiplication of the MD2 variety through tissue culture techniques as well as other nursery methods. Bioplantlet was established as a joint venture among the Ministry of Agriculture, the Sea-Freight Pineapple Exporters of Ghana (SPEG), the Ghana Export Promotion Council (GEPC), the Biotechnology and Nuclear Agriculture Research Institute, and the Ghana Atomic Energy Commission, with support from the USAID.231 In 2002, all pineapple production in Ghana was of the Smooth Cayenne variety. By 2006, approximately 90 percent was of the MD2 variety.232 As a result of these programs, after more than a year of decreasing exports, exports of pineapples began growing again in July of 2006 as the new MD2 variety was successfully exported to European market.233 While this transition was successful, Ghanaian exports struggled to resume consistent growth due to poor post-harvesting and handling. Many small scale farmers still lack the capital needed to invest in new pack houses and to increase cold storage facilities.234 Assistance from international aid programs was a beneficial factor for both the pineapple and banana industries. The 9th European Development Fund (EDF) is an aid program that allocates funding to developing countries worldwide based on the framework and goals established by the Heavily Indebted Poor Countries initiative of the World Bank and by the Poverty Reduction Strategic Papers written by the domestic governments with assistance from the International Monetary Fund. The primary goal of the 9th EDF (from 2000 to 2007) is to allocate funding for projects with the goal of reducing poverty. Approximately €80 (about $90) million was allocated toward rural development in the 9th EDF. The enhancement of rural capital and economic growth through agricultural development was seen as crucial to decreasing poverty and was therefore one of the program’s priorities. €13 (about $15) million was allocated to the agricultural component of the rural development program between 2003 and 2006. Reportedly, this was accomplished through agricultural assistance and
230 Danielou, “The Rise of Ghana’s Pineapple Industry. From Successful Takeoff to Sustainable
Expansion,” November 2005, 22. 231 Ghana Export Promotion Council, “Exports of MD2 Variety Rake in $20 million,”
February 8, 2007. 232 Industry official, interview by Commission staff, Accra, Ghana, October 29, 2007. 233 FAGE, “Lessons Learned from Others,” May 2007, 3. 234 Industry official, interview by Commission staff, Accra, Ghana, October 29, 2007.
2-69
infrastructure development aimed at the promotion of export crops by growers.235 This funding increased the global competitiveness of both the pineapple and banana exports from Ghana. The poor condition of the road networks in Ghana has been a major hindrance to the growth of agricultural exports. The 9th EDF allocated funding to assist rural development and the development of the road networks. Approximately €70 (about $80) million was allocated toward the Ghanaian road transport sector in the 9th EDF.236 Between the second half of 2004 and the end of 2006, €36 (about $40) million was disbursed for construction and rehabilitation of major transport roads in Ghana. In 2005 and 2006, €28 (about $30) million was disbursed for the development of feeder roads that increase access for agricultural producers to markets and traders.237 According to government officials, the feeder roads in the more rural growing regions are crucial to the success of these industries. As a result of the funding, the feeder road networks were improved and allowed the smaller banana and pineapple growers to get their product to market more efficiently.238 During 2002–06, Ghanaian industry organizations and government institutions improved their operations and played an influential role in both the banana and pineapple industries’ growth and development. With assistance from USAID, these institutions increased their coordination with each other and their producing members in order to respond more effectively to market demands and to increase exports. The Ghanaian Ministry of Food and Agriculture’s Horticulture Export Industry Initiative (HEII) began in 2004 and was crucial to the pineapple and banana industries’ export growth. HEII was at the center of efforts that included developing and distributing the MD2 variety, coordinating the cold-storage chain, and providing technical support to improve quality and acquire international standards certifications.239 As result of these efforts the number of EurepGAP certifications increased tremendously. In 2002, very few producers were EurepGAP certified, but in 2006, 75 percent of growers were certified.240 GEPC is a national export trade support institution facilitating the development and promotion of exports by organizing contract product/supply schemes, disseminating trade information, and providing technical support for product and market development.241 SPEG and the Federation of Associations of Ghanaian Exporters also played important roles in the successful transition to the MD2 variety, the coordination of industry resources, the increase in cold-storage shipping, and the industry-wide effort to increase EurepGAP certifications.242 SPEG consolidates cargo for vessel operators, coordinates shipping arrangements, oversees loading of cargo at the
235 Republic of Ghana and the European Community, Country Strategic Paper and Indicative Program for 2002–07, 19.
236 Ibid., 26. 237 Ibid., 35. 238 Government officials, interview by Commission staff, Washington, DC, October 17, 2007. 239 FAGE, “Building Ghana’s Institutions,” May 2007, 7. 240 Industry official, interview with Commission staff, Accra, Ghana, October 29, 2007. 241 FAGE, “Ghana Fresh Produce Exporter’s Directory 2007,” 2007, 7. 242 FAGE, “Building Ghana’s Institutions,” May 2007, 6.
2-70
port, and provides market information and technical support for better agricultural practices.243 Most important, SPEG coordinated sea-freight shipments for horticulture exports and increased the availability of cold-storage shipping. In addition to these larger organizations, hundreds of small farmer-based organizations disseminated new and better farming techniques and plant materials, which increased growers’ competitiveness.244 In addition to industry organizations and government institutions, other international organizations provided assistance and supported both the transition to the MD2 variety and the increase in quality certifications. USAID’s Ghana Specific Economic Growth Program and Trade and Investment Program for a Competitive Export Economy, and the EU’s Regional Pesticide Initiative all coordinated with each other and worked with the private sector to provide support to Ghana’s pineapple and banana industries.245
Cameroon In Cameroon, the principal factors that contributed to the shift in exports of pineapples and bananas between 2002 and 2006 were international aid programs and increased investment by multinational firms. To the benefit of both the pineapple and banana industries, the 9th EDF allocated approximately €82 (about $95) million toward the transport sector in Cameroon.246 The focus was to rehabilitate the major transport roads. Crucial transport roads, such as the Ngaoundéré - Touboro - Moundou regional road, that connect major growing regions of the country to axis roads that lead to the port of Douala and major rail terminals were constructed or rehabilitated.247 The fund has also restructured the Ministry of Public Works, set up and financed the Road Fund, and through other administrative measures, has promoted the care and upkeep of the road infrastructure. In coordination with other development projects from the International Fund for Agricultural Development and the African Development Bank, the 9th EDF funded €56 (about $65) million toward rural development projects, which have significantly improved the infrastructure and feeder roads. The EDF also provided an annual budget for technical assistance measures solely for the banana industry in Cameroon. The budget allocated more than €5 (about $6) million per year directly to the banana industry. EU technical assistance generally includes replanting, land clearing, inputs and drainage works, training for farmers and staff, and help through the input supply fund to offset income losses suffered by banana farmers.248
243 FAGE, “Ghana Fresh Produce Exporter’s Directory 2007,” 2007, 8. 244 FAGE, “Building Ghana’s Institutions,” May 2007, 6. 245 Ibid., 7. 246 EC, “EU Relations with Cameroun,” September 2007. 247 Delegation of the European Commission in Cameroon, “EU Cooperation with Cameroun,
Infrastructure Sector,” September 2007. 248 EC, “EU and the Eastern Caribbean-Special Framework of Assistance.”
2-71
The EU Special Framework of Assistance for Traditional Suppliers of Bananas also provided technical and financial support for specific projects proposed by the respective national governments. The total funding allocated for Cameroon between 1999 and 2006 for the program was €35 (about $40) million,249 or approximately €5 (about $6) million per year. Between 2002 and 2006, the projects focused on technical assistance to increase productivity, rural development, and the social infrastructure. Investments were also made to improve quality and phytosanitary standards in order to acquire or maintain EurepGAP certifications; establish producer organizations; increase handling, packaging, and storage facilities; and develop marketing strategies. The increase in banana exports also occurred as a result of plantation expansion made by multinational firms. The area harvested for banana production increased by approximately 10 percent between 2002 and 2006.250 Banana exports are produced primarily by two large companies that operate in the southwestern region, Compagnie Fruitière and the Cameroon Development Corporation (CDC). Compagnie Fruitière increased its production capabilities to 150,000 mt during 2002–06.251 Banana production efficiency also increased significantly due to improved farming methods developed as a result of technical assistance and the influx of plantation expertise brought through partnerships with multinational produce firms.252 The CDC has a working partnership with Fresh Del Monte. As a result of technical assistance, Cameroon’s banana yield per hectare increased from 2002 to 2006 by more than 13 percent from less than 9 mt/ha to more than 10 mt/ha.253
249 Not all €35.2 million had been allocated by the end of 2007. 250 FAO, FAOSTAT Production Database. 251 Danielou, “The Rise of Ghana’s Pineapple Industry: From Successful Takeoff to
Sustainable Expansion,” November 2005. 252 EC, “Biennial Report on the Special Framework of Assistance for Traditional ACP
Suppliers of Bananas,” December 15, 2006, 12. 253 FAO, FAOSTAT Production Database.
2-72
Tropical Fruit Bibliography Adongo, Augustine. “Reflecting National Circumstances and Development Priorities in National Codes on Good Agricultural Practices That Can Be Benchmarked to EUREPGAP –The Case Of Ghana.” Paper presented at the FAO and UNCTAD Regional Workshop on Good Agricultural Practices in Eastern and Southern Africa, Nairobi, Kenya. March 5–9, 2007. Commission of the European Communities (EC), “Communication from the Commission to the Council and the European Parliament, Biennial Report on the Special Framework of Assistance for Traditional ACP Suppliers of Bananas.” COM(2004) 823 Final, December 12, 2004. ——. “Communication from the Commission to the Council and the European Parliament, Biennial Report on the Special Framework of Assistance for Traditional ACP Suppliers of Bananas.” COM(2006) 806 Final, December 15, 2006. Danielou, Morgane, and Christophe Ravry. “The Rise of Ghana’s Pineapple Industry. From Successful Takeoff to Sustainable Expansion,” World Bank Africa Region. November 2005. Delegation of the European Commission in Cameroon, EU Cooperation with Cameroon, Infrastructure Sector. http://www.delcmr.cec.eu.int/webeu/en/eu_and_cmr/infras_trans.htm. Del Monte, The History of the Pineapple, October, 2006. http://www.pr-integra.com/de/news/d_delmonte/en_Ananas_Geschichte.php?integracss=true&doklang=english. Dow Jones Newswires, “Ecuador Reignites Banana Wars,” February 27, 2007. http://www.bananalink.org.uk/index.php?option=com_content&task=view&id=132&Itemid=122. European Commission (EC), EU and the Eastern Caribbean- Special Framework of Assistance. http://www.delbrb.ec.europa.eu/en/eu_and_country/stlucia_sfa.htm. ——. EU Relations with Cameroon, Development and Relations with African, Caribbean, and Pacific States. http://ec.europa.eu/development/Geographical/RegionsCountries/Countries/Cameroon.htm (accessed various dates).
——. TARIC Consultation Database. http://ec.europa.eu/taxation_customs/dds/cgi-bin/tarchap?Lang=EN (accessed various dates). Food and Agriculture Organization of the United Nations (FAO), Gender and Population Division (Author: Zoraida García), “Agriculture, Trade Negotiations, and Gender,” Rome 2006. FAO, (Authors: Pedro Arias, Cora Dankers, Pascal Liu, Paul Pilkauskas). “The World Banana Market 1985–2002,” Rome 2003. ——. Banana Market Situation in 2005 and Early 2006, May 2006. http://www.fao.org/es/ESC/en/20953/20987/highlight_107821en.html .
2-73
——. Bananas: Implications of EU Tariff Reform for Producers” Trade Policy Briefs on Issues Related to the WTO Negotiations on Agriculture. ftp://ftp.fao.org/docrep/fao/007/j5022e/j5022e01.pdfm. ——. Food Outlook April 2005, April 2005. ftp://ftp.fao.org/docrep/fao/007/j5051e/j5051e00.pdf. Frank, Robert. “Juicy Details: Going for “Gold’ Turns Pineapple World Upside Down – Rush is on to Grass Versions of Fresh Del Monte’s, Fruit; Patents, Law Suits, Ground – Mistery-of the –Seven Seeds.” Wall Street Journal, October 7, 2003. Federal Reserve Board of San Francisco, Oil Prices and the U.S. Trade Deficit, Economic Letter, September 22, 2006 http://www.frbsf.org/publications/economics/letter/2006/el2006-24.html (accessed October 26, 2007). Federation of Associations of Ghanaian Exporters (FAGE), “Ready For Take Off - Ghana Horticulture,” May 2007. ——. “Lessons Learned from Others: Ghana Scores Well,” In Ready For Take Off - Ghana Horticulture, May 2007. ——. ”Building Ghana’s Institutions of Horticulture Success,” In Ready For Take Off - Ghana Horticulture, May 2007. Federation of Associations of Ghanaian Exporters (FAGE) and USAID, Trade and Investment Program for a Competitive Export Economy (TIPCEE), “Ghana Fresh Produce Exporters’ Directory 2007,” 2007. Federation of International Trade Associations (FITA), Market Access – Ivory Coast. 2006. http://www.fita.org/countries/cote.html?ma_rubrique=marche. Fresh Plaza Web site, Ghana: Government fulfils promise to Pineapple exporters, July 11, 2005. http://www.freshplaza.com/2005/11jul/2_gh_pineappelexporters.htm (accessed various dates). Ghana Export Promotion Council, Trade News, Exports of MD2 Variety Rake in $20 million, February 8, 2007. http://www.gepcghana.com/news.php?item=4&n. “Ghana - Irrigation is a Priority but a Number of Measures Are Being Taken to Boost Crops,” edited by Pita Adams, Africa Research Bulletin: Economic, Financial and Technical Series V 43, No. 7 (2006): 17054A–17055A. Ghanaweb, GEPC Orders Pineapple Plantlets, October 11, 2004. http://www.ghanaweb.com/GhanaHomePage/NewsArchive/artikel.php?ID=67530. Global Trade Information Services, Inc. (GTIS). Global Trade Atlas. Annual data complied from reporting countries’ official statistics, including EU27 external trade. http://www.gtis.com/gta/usitc (accessed various dates).
2-74
Heller, Lorraine, “Chiquita Raises Banana Prices in Response to Higher Tariffs,” Food Navigator Europe, March 24, 2006. http://www.foodnavigator.com/news/ng.asp?id=66641-chiquita-banana-tariffs-banana-prices. InflationData, “Historical Crude Oil Prices.” http://www.inflationdata.com/inflation/inflation_rate/Historical_Oil_Prices_Table.asp. Minot, Nicholas and Margaret Ngigi, “Are horticultural exports a replicable success story? Evidence from Kenya and Côte d'Ivoire,” International Food Policy Research Institute (IFPRI) and Egerton University, Conference paper #7, Presented at the Success in African Agriculture Conference, Pretoria, December 1–2, 2003. Republic of Ghana and the European Community, Country Strategic Paper and Indicative Program for 2002-2007. http://delgha.ec.europa.eu/en/publications/CSP-NIP%20Ghana%202002-2007.pdf. Sofreco, “Strategic Evaluation of the Agro-Industrial Sector.” Report presented at the Agro-Ind 2002 conference in Dakar, Senegal, September 4–7 2002. United Nations Conference on Trade and Development (UNCTAD), “Banana Market,” Market Information in the Commodities Area, http://www.unctad.org/infocomm/anglais/banana/market.htm#prod (accessed various dates). United States Agency for International Development (USAID), Trade and Investment Program for a Competitive Export Economy (TIPCEE), “Policies Affecting the Development of Ghana’s Banana-Export Sector,” December 2006. United States Department of Agriculture (USDA), Foreign Agriculture Service (FAS), (Author: Celsa Monros) EU-25 Trade Policy Monitoring Second WTO Rejection of the Banana Dispute, 2005, GAIN Report No: E47019, March 14, 2007, http://www.fas.usda.gov/gainfiles/200511/146131438.pdf. United States Department of State, “Background Notes on Côte d'Ivoire,” November 2007, http://www.state.gov/r/pa/ei/bgn/2846.htm (accessed November 11, 2007). World Bank, “Implementation Completion Report (IDA-27490 PPFI-P8550 PPFI-P8551) On a Loan/Credit/Grant in the Amount of US$ Million to the Republic of Cote d’Ivoire for a Export Promotion and Diversification Project.” Report No: 273009, December 31, 2006, http://www.wds.worldbank.org/external/default/WDSContentServer/WDSP/IB/2004/01/07/000160016_20040107120657/Rendered/PDF/273090CI.pdf (accessed various dates). Yeboah, Godfred. “The Farmapine Model: A Cooperative Marketing Strategy and a Market-Based Development Approach in Sub-Saharan Africa.” Choices: The Magazine of Food, Farm, and Resource Issues, January 16, 2005.
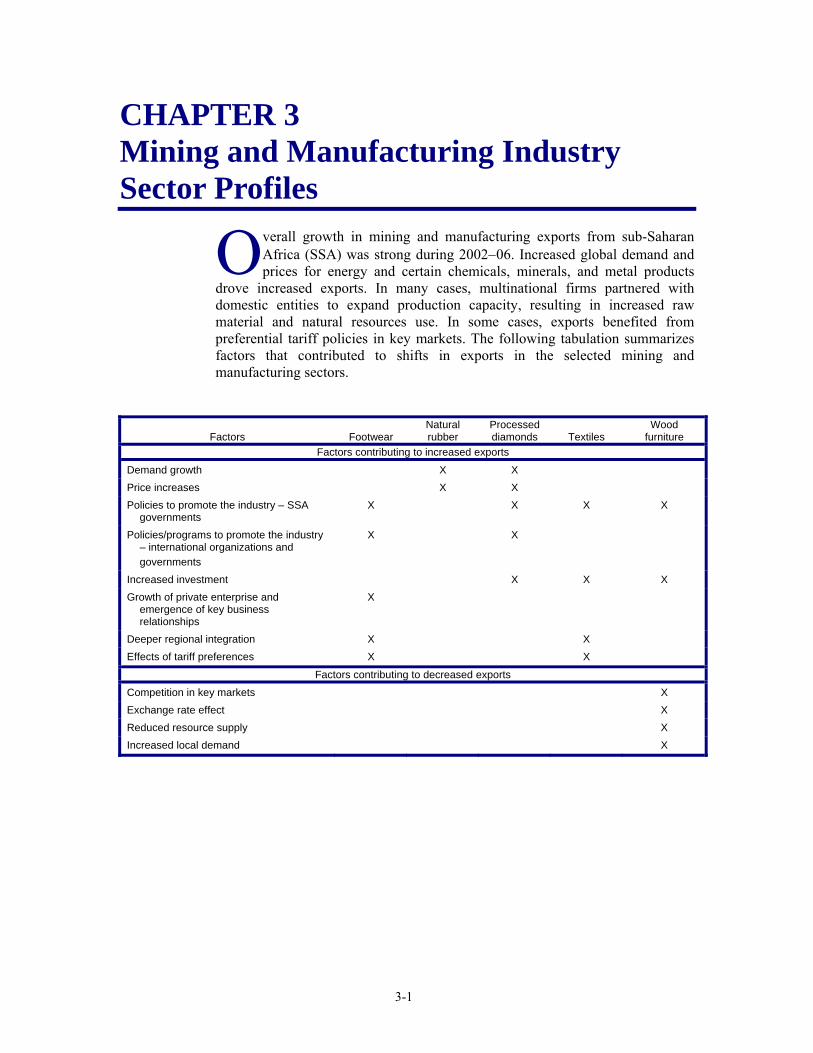
3-1
CHAPTER 3 Mining and Manufacturing Industry Sector Profiles
verall growth in mining and manufacturing exports from sub-Saharan Africa (SSA) was strong during 2002−06. Increased global demand and prices for energy and certain chemicals, minerals, and metal products
drove increased exports. In many cases, multinational firms partnered with domestic entities to expand production capacity, resulting in increased raw material and natural resources use. In some cases, exports benefited from preferential tariff policies in key markets. The following tabulation summarizes factors that contributed to shifts in exports in the selected mining and manufacturing sectors.
Factors
Footwear Natural rubber
Processed diamonds
Textiles
Wood furniture
Factors contributing to increased exports
Demand growth X X Price increases X X Policies to promote the industry – SSA governments
X X X X
Policies/programs to promote the industry – international organizations and governments
X X
Increased investment X X X Growth of private enterprise and emergence of key business relationships
X
Deeper regional integration X X Effects of tariff preferences X X
Factors contributing to decreased exports
Competition in key markets X Exchange rate effect X Reduced resource supply X Increased local demand X
O
3-2
Footwear
Summary of Findings
Although SSA countries export a very small amount of footwear, less than one-half of one percent of total worldwide footwear exports in 2006, the value of SSA footwear exports increased 33 percent during 2002−06, to $42.5 million (table 3.1). The principal drivers of the increased exports from the SSA countries were footwear production training and support initiatives to promote the footwear sectors in these countries, the establishment of the East African Customs Union in 2005, the emergence of new business relationships between SSA countries and European footwear firms, and duty-free treatment for footwear established under the African Growth and Opportunity Act (AGOA). Although South Africa is by far the largest SSA footwear producer,1 Kenya and Ethiopia experienced the largest increases in footwear exports (albeit from small bases) of 150 and 4,937 percent, respectively, during this period.2
Industry Overview
Leather and leather products (such as footwear) are among the most broadly traded and used commodities in the world (box 3.1). Although the SSA countries account for less than one percent of worldwide exports, the SSA footwear industry is not only important for creating manufacturing jobs, but also, according to some sources, is vital for generating foreign currency earnings.3 Consequently, as discussed later, some SSA governments have focused increasingly on expanding the footwear sector in their countries by establishing training institutes and creating regional associations designed to strengthen footwear manufacturing.4 SSA governments have also sought to attract foreign investment by offering incentives including abolishing export and import licensing, rationalizing and reducing import tariffs, allowing residents and non- residents to open foreign currency accounts with domestic
1 South Africa has historically been by far the SSA region’s leading footwear producer. South
Africa’s footwear sector consists of an estimated 230 factories producing completed footwear and another 50 to 100 factories making components. Dennis Lind (executive director, Southern African Footwear and Leather Industries Association), e-mail message to Commission staff, November 1, 2007; South African Footwear and Leather Export Council Web site, http://www.saflec.co.za/ (accessed February 4, 2008); and International Trade Centre UNCTAD/WTO Web site, http://www.intracen.org/ (accessed February 4, 2008).
2 From 2002 to 2006, Kenya’s global exports of footwear increased from $3.1 million to $7.7 million, while Ethiopia’s exports increased from $58,000 to $2.9 million. GTIS, Global Trade Atlas.
3 CDE/PRO&INVEST, “Targeted Support Programme,” September 2004. 4 The Regional Africa Leather and Footwear Industry Scheme (RALFIS) has aimed at
addressing some of the sector’s principal challenges and has assisted companies region-wide to adapt production operations to exploit market opportunities. In addition, national leather industry associations are operating in SSA countries and some are providing considerable assistance to their members.
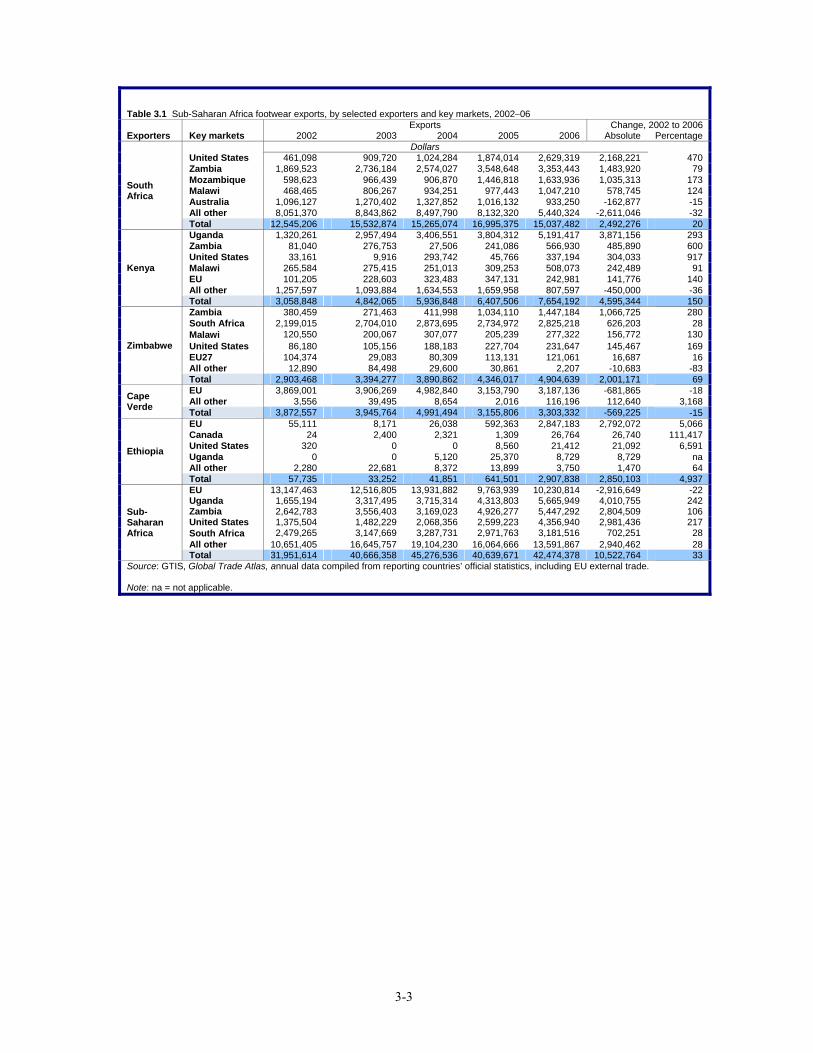
3-3
Table 3.1 Sub-Saharan Africa footwear exports, by selected exporters and key markets, 2002−06 Exports Change, 2002 to 2006 Exporters Key markets 2002 2003 2004 2005 2006 Absolute Percentage Dollars
United States 461,098 909,720 1,024,284 1,874,014 2,629,319 2,168,221 470 Zambia 1,869,523 2,736,184 2,574,027 3,548,648 3,353,443 1,483,920 79 Mozambique 598,623 966,439 906,870 1,446,818 1,633,936 1,035,313 173 Malawi 468,465 806,267 934,251 977,443 1,047,210 578,745 124 Australia 1,096,127 1,270,402 1,327,852 1,016,132 933,250 -162,877 -15 All other 8,051,370 8,843,862 8,497,790 8,132,320 5,440,324 -2,611,046 -32
South Africa
Total 12,545,206 15,532,874 15,265,074 16,995,375 15,037,482 2,492,276 20 Uganda 1,320,261 2,957,494 3,406,551 3,804,312 5,191,417 3,871,156 293 Zambia 81,040 276,753 27,506 241,086 566,930 485,890 600 United States 33,161 9,916 293,742 45,766 337,194 304,033 917 Malawi 265,584 275,415 251,013 309,253 508,073 242,489 91 EU 101,205 228,603 323,483 347,131 242,981 141,776 140 All other 1,257,597 1,093,884 1,634,553 1,659,958 807,597 -450,000 -36
Kenya
Total 3,058,848 4,842,065 5,936,848 6,407,506 7,654,192 4,595,344 150 Zambia 380,459 271,463 411,998 1,034,110 1,447,184 1,066,725 280 South Africa 2,199,015 2,704,010 2,873,695 2,734,972 2,825,218 626,203 28 Malawi 120,550 200,067 307,077 205,239 277,322 156,772 130 United States 86,180 105,156 188,183 227,704 231,647 145,467 169 EU27 104,374 29,083 80,309 113,131 121,061 16,687 16 All other 12,890 84,498 29,600 30,861 2,207 -10,683 -83
Zimbabwe
Total 2,903,468 3,394,277 3,890,862 4,346,017 4,904,639 2,001,171 69 EU 3,869,001 3,906,269 4,982,840 3,153,790 3,187,136 -681,865 -18 All other 3,556 39,495 8,654 2,016 116,196 112,640 3,168 Cape
Verde Total 3,872,557 3,945,764 4,991,494 3,155,806 3,303,332 -569,225 -15 EU 55,111 8,171 26,038 592,363 2,847,183 2,792,072 5,066 Canada 24 2,400 2,321 1,309 26,764 26,740 111,417 United States 320 0 0 8,560 21,412 21,092 6,591 Uganda 0 0 5,120 25,370 8,729 8,729 na All other 2,280 22,681 8,372 13,899 3,750 1,470 64
Ethiopia
Total 57,735 33,252 41,851 641,501 2,907,838 2,850,103 4,937 EU 13,147,463 12,516,805 13,931,882 9,763,939 10,230,814 -2,916,649 -22 Uganda 1,655,194 3,317,495 3,715,314 4,313,803 5,665,949 4,010,755 242 Zambia 2,642,783 3,556,403 3,169,023 4,926,277 5,447,292 2,804,509 106 United States 1,375,504 1,482,229 2,068,356 2,599,223 4,356,940 2,981,436 217 South Africa 2,479,265 3,147,669 3,287,731 2,971,763 3,181,516 702,251 28 All other 10,651,405 16,645,757 19,104,230 16,064,666 13,591,867 2,940,462 28
Sub-Saharan Africa
Total 31,951,614 40,666,358 45,276,536 40,639,671 42,474,378 10,522,764 33 Source: GTIS, Global Trade Atlas, annual data compiled from reporting countries’ official statistics, including EU external trade. Note: na = not applicable.
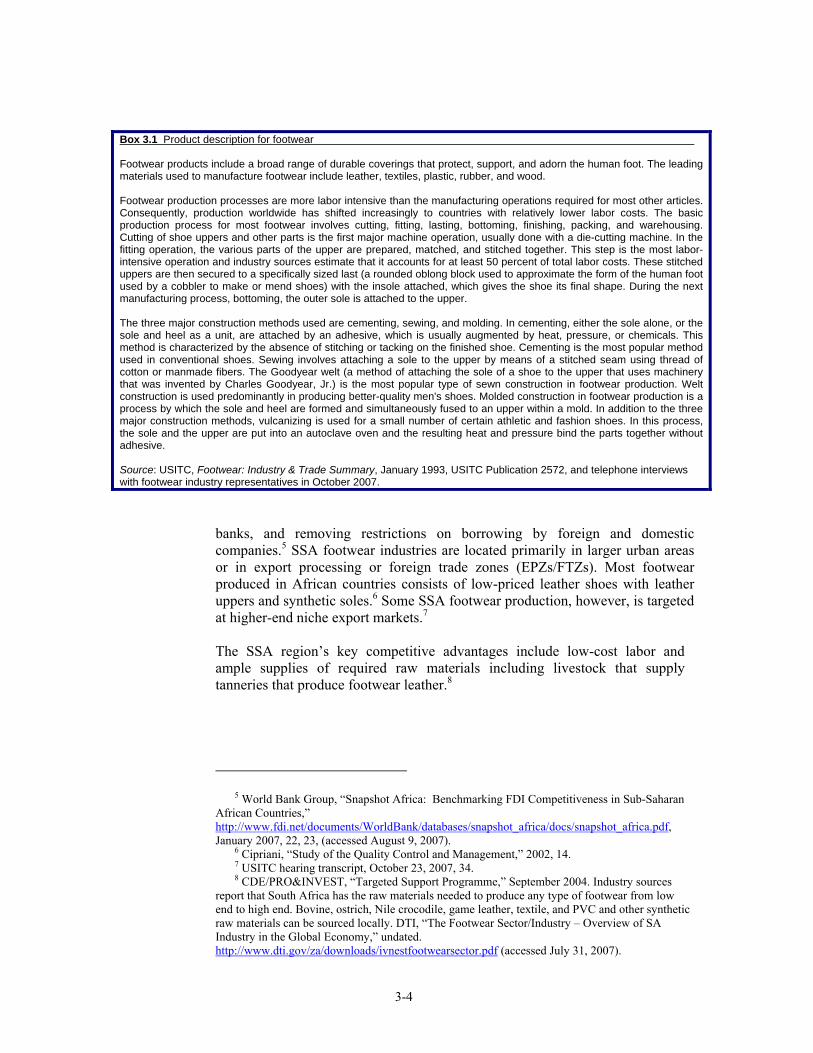
3-4
banks, and removing restrictions on borrowing by foreign and domestic companies.5 SSA footwear industries are located primarily in larger urban areas or in export processing or foreign trade zones (EPZs/FTZs). Most footwear produced in African countries consists of low-priced leather shoes with leather uppers and synthetic soles.6 Some SSA footwear production, however, is targeted at higher-end niche export markets.7 The SSA region’s key competitive advantages include low-cost labor and ample supplies of required raw materials including livestock that supply tanneries that produce footwear leather.8
5 World Bank Group, “Snapshot Africa: Benchmarking FDI Competitiveness in Sub-Saharan
African Countries,” http://www.fdi.net/documents/WorldBank/databases/snapshot_africa/docs/snapshot_africa.pdf, January 2007, 22, 23, (accessed August 9, 2007).
6 Cipriani, “Study of the Quality Control and Management,” 2002, 14. 7 USITC hearing transcript, October 23, 2007, 34. 8 CDE/PRO&INVEST, “Targeted Support Programme,” September 2004. Industry sources
report that South Africa has the raw materials needed to produce any type of footwear from low end to high end. Bovine, ostrich, Nile crocodile, game leather, textile, and PVC and other synthetic raw materials can be sourced locally. DTI, “The Footwear Sector/Industry – Overview of SA Industry in the Global Economy,” undated. http://www.dti.gov/za/downloads/ivnestfootwearsector.pdf (accessed July 31, 2007).
Box 3.1 Product description for footwear Footwear products include a broad range of durable coverings that protect, support, and adorn the human foot. The leading materials used to manufacture footwear include leather, textiles, plastic, rubber, and wood. Footwear production processes are more labor intensive than the manufacturing operations required for most other articles. Consequently, production worldwide has shifted increasingly to countries with relatively lower labor costs. The basic production process for most footwear involves cutting, fitting, lasting, bottoming, finishing, packing, and warehousing. Cutting of shoe uppers and other parts is the first major machine operation, usually done with a die-cutting machine. In the fitting operation, the various parts of the upper are prepared, matched, and stitched together. This step is the most labor-intensive operation and industry sources estimate that it accounts for at least 50 percent of total labor costs. These stitched uppers are then secured to a specifically sized last (a rounded oblong block used to approximate the form of the human foot used by a cobbler to make or mend shoes) with the insole attached, which gives the shoe its final shape. During the next manufacturing process, bottoming, the outer sole is attached to the upper. The three major construction methods used are cementing, sewing, and molding. In cementing, either the sole alone, or the sole and heel as a unit, are attached by an adhesive, which is usually augmented by heat, pressure, or chemicals. This method is characterized by the absence of stitching or tacking on the finished shoe. Cementing is the most popular method used in conventional shoes. Sewing involves attaching a sole to the upper by means of a stitched seam using thread of cotton or manmade fibers. The Goodyear welt (a method of attaching the sole of a shoe to the upper that uses machinery that was invented by Charles Goodyear, Jr.) is the most popular type of sewn construction in footwear production. Welt construction is used predominantly in producing better-quality men's shoes. Molded construction in footwear production is a process by which the sole and heel are formed and simultaneously fused to an upper within a mold. In addition to the three major construction methods, vulcanizing is used for a small number of certain athletic and fashion shoes. In this process, the sole and the upper are put into an autoclave oven and the resulting heat and pressure bind the parts together without adhesive. Source: USITC, Footwear: Industry & Trade Summary, January 1993, USITC Publication 2572, and telephone interviews with footwear industry representatives in October 2007.
3-5
Principal challenges that have hampered growth of the footwear sector in the SSA region in the past include obsolete tanning, finishing, and production technologies; high cost of financing or lack of capital; inadequate infrastructure, such as poorly paved roads that slow the transport of goods; poor handling methods resulting in low-quality raw hides and skins; modest labor productivity;9 political instability in certain countries; limited design capabilities; and limited managerial expertise in business operations.10 Trade liberalization in SSA countries has also allowed an influx of low-priced imports of Chinese footwear, leading to lower domestic production and capacity utilization as well as job losses.11
Sub-Saharan Africa Trade in the Global Context
As the world population has risen, so has demand for footwear.12 Total global exports of footwear rose 43 percent, from $39.2 billion in 2002, to $56.1 billion in 2006. An estimated 11.6 billion pairs of shoes were produced worldwide in 2006 with revenues of $106.7 billion.13 Because footwear manufacturing is labor-intensive, developing countries with relatively lower wage rates, particularly China, dominated footwear production in 2006. China is projected to manufacture about 6.7 billion pairs of shoes, or an estimated 57 percent of total production in 2007.14 Vietnam, the next-leading and rapidly growing supplier, produced about 900 million pairs in 2007, or almost 8 percent of total world production.15 SSA footwear exports increased 33 percent during 2002−06, to $42 million, but accounted for less than one-half of one percent of the total world exports, essentially unchanged from their share in 2002. Although labor costs are low in the SSA region, numerous challenges discussed later in this section prevent SSA footwear exporters from becoming leading players in the world marketplace. Most of the increase in SSA footwear exports was in regional trade and likely prompted by the establishment of the East African Customs Union (EAC), the strengthening of Common Market for Eastern and Southern Africa (COMESA) ties, growing privatization, and the emergence of business relationships between footwear producers in SSA countries with European manufacturers.
9 Cipriani, Simone, “Study of the Quality Control and Management on the African Leather
Sector,” 2002. http://www.unido.org/file-storage/download/?file_id=10201, accessed August 30, 2007. Labor productivity is referred to here in terms of output per worker. Several industry sources have reported that labor productivity in manufacturing in SSA countries tends to be lower than in other developing regions such as the Caribbean/Central American region.
10 Calabro, “UNIDO at Work: Sub-Saharan Africa: Kenya, Ethiopia,” undated. 11 All Africa.com, “Textile ‘Tax Gap’ Costs Soars R20bn,” September 3, 2005. 12 IBISWorld, Global Footwear Manufacturing: C1321, July 4, 2007, 29. 13 Ibid., 4. 14 Ibid., 31. 15 IBISWorld, Global Footwear Manufacturing: C1321, July 4, 2007, 31;Vietnam’s exports
could reach $6 billion by 2010, according to deputy chairman of the country’s Leather and Footwear Association, Nguyn Duc Thuan. World Footwear News, “Vietnam: Positive First Half Figures,” September/October 2007, 5.
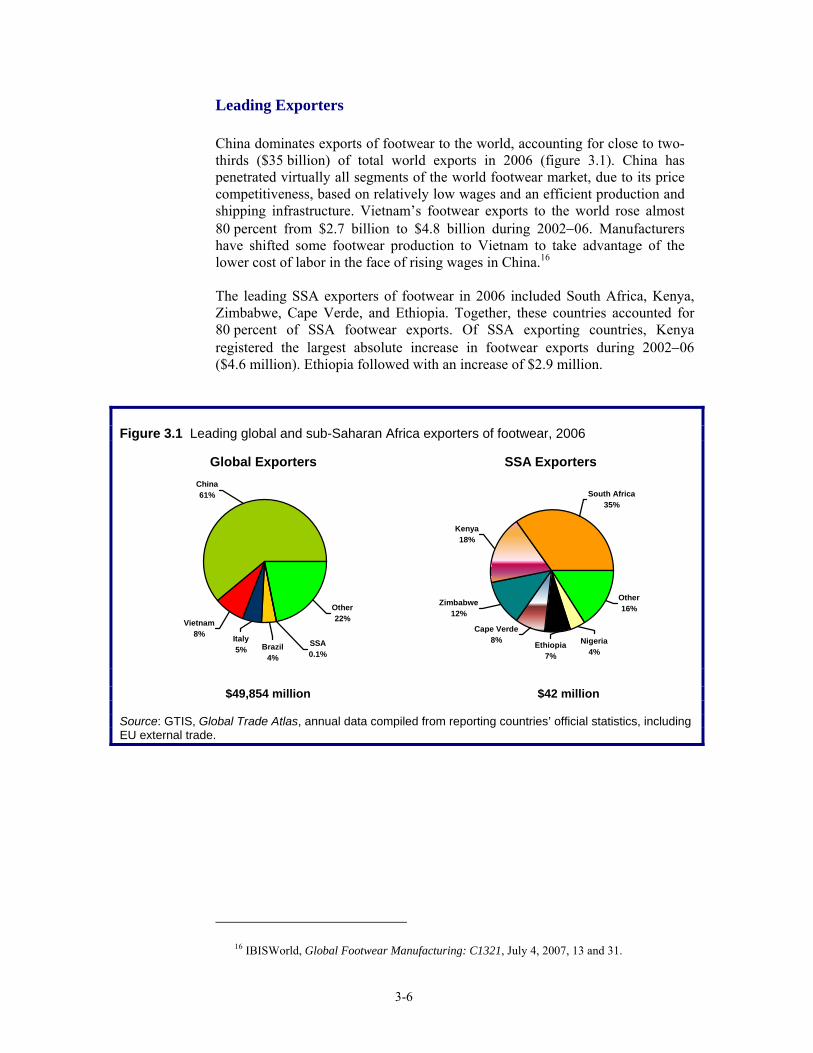
3-6
Leading Exporters China dominates exports of footwear to the world, accounting for close to two-thirds ($35 billion) of total world exports in 2006 (figure 3.1). China has penetrated virtually all segments of the world footwear market, due to its price competitiveness, based on relatively low wages and an efficient production and shipping infrastructure. Vietnam’s footwear exports to the world rose almost 80 percent from $2.7 billion to $4.8 billion during 2002−06. Manufacturers have shifted some footwear production to Vietnam to take advantage of the lower cost of labor in the face of rising wages in China.16 The leading SSA exporters of footwear in 2006 included South Africa, Kenya, Zimbabwe, Cape Verde, and Ethiopia. Together, these countries accounted for 80 percent of SSA footwear exports. Of SSA exporting countries, Kenya registered the largest absolute increase in footwear exports during 2002−06 ($4.6 million). Ethiopia followed with an increase of $2.9 million.
Figure 3.1 Leading global and sub-Saharan Africa exporters of footwear, 2006
Global Exporters
SSA0.1%
Other22%
China61%
Italy5%
Vietnam8%
Brazil4%
SSA Exporters
Nigeria4%
Other16%
Kenya18%
Cape Verde8%
Zimbabwe12%
Ethiopia7%
South Africa35%
$49,854 million $42 million Source: GTIS, Global Trade Atlas, annual data compiled from reporting countries’ official statistics, including EU external trade.
16 IBISWorld, Global Footwear Manufacturing: C1321, July 4, 2007, 13 and 31.
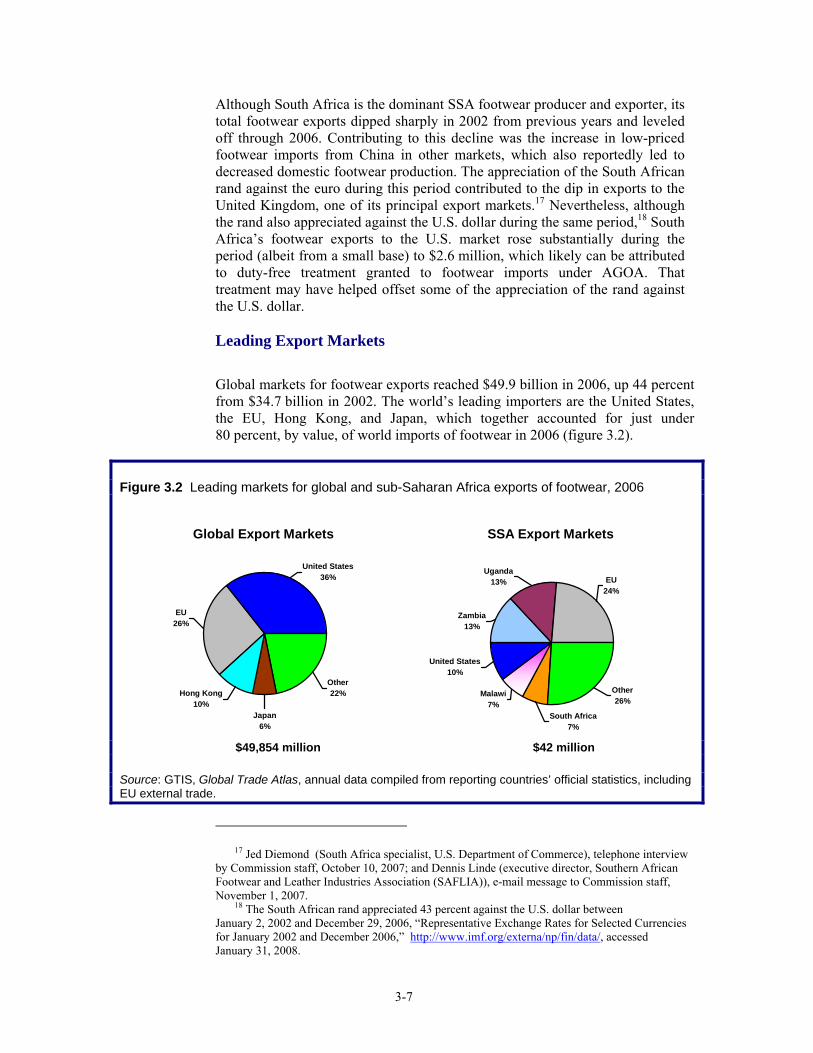
3-7
Although South Africa is the dominant SSA footwear producer and exporter, its total footwear exports dipped sharply in 2002 from previous years and leveled off through 2006. Contributing to this decline was the increase in low-priced footwear imports from China in other markets, which also reportedly led to decreased domestic footwear production. The appreciation of the South African rand against the euro during this period contributed to the dip in exports to the United Kingdom, one of its principal export markets.17 Nevertheless, although the rand also appreciated against the U.S. dollar during the same period,18 South Africa’s footwear exports to the U.S. market rose substantially during the period (albeit from a small base) to $2.6 million, which likely can be attributed to duty-free treatment granted to footwear imports under AGOA. That treatment may have helped offset some of the appreciation of the rand against the U.S. dollar. Leading Export Markets Global markets for footwear exports reached $49.9 billion in 2006, up 44 percent from $34.7 billion in 2002. The world’s leading importers are the United States, the EU, Hong Kong, and Japan, which together accounted for just under 80 percent, by value, of world imports of footwear in 2006 (figure 3.2).
Figure 3.2 Leading markets for global and sub-Saharan Africa exports of footwear, 2006
Global Export Markets
Hong Kong10%
Japan6%
United States36%
Other22%
EU26%
SSA Export Markets
Other26%
EU24%
Uganda13%
South Africa7%
United States10%
Malawi7%
Zambia13%
$49,854 million $42 million Source: GTIS, Global Trade Atlas, annual data compiled from reporting countries’ official statistics, including EU external trade.
17 Jed Diemond (South Africa specialist, U.S. Department of Commerce), telephone interview
by Commission staff, October 10, 2007; and Dennis Linde (executive director, Southern African Footwear and Leather Industries Association (SAFLIA)), e-mail message to Commission staff, November 1, 2007.
18 The South African rand appreciated 43 percent against the U.S. dollar between January 2, 2002 and December 29, 2006, “Representative Exchange Rates for Selected Currencies for January 2002 and December 2006,” http://www.imf.org/externa/np/fin/data/, accessed January 31, 2008.
3-8
SSA footwear exports reached $42.5 million in 2006, up 33 percent from $32.0 million in 2002. The leading markets for SSA footwear were the EU, Uganda, Zambia, the United States, Malawi, and South Africa, which together accounted for slightly over two-thirds of world imports by value from SSA suppliers.
Factors Affecting Export Patterns
The growth of SSA exports of footwear during 2002−06 was driven largely by the long-term impact of programs launched by international development organizations and national governments to enhance existing footwear industries, the establishment of the EAC, the strengthening of COMESA trade ties and COMESA initiatives to expand the leather products sector, the growth of private enterprises, and the emergence of business relationships between certain footwear producers in SSA countries and European manufacturers. To a lesser extent, preferential trade programs such as AGOA also contributed to increased footwear exports from South Africa to the United States. Although the percentage increases in footwear exports from the SSA countries during 2002−06 were large, the value increases were more modest and the total values of exports from these countries were relatively small.19 Policies and Programs to Promote the Footwear Industry
Kenya
Kenya has one of the most established footwear sectors in East Africa. Kenya’s footwear industry has about 10 factories.20 Footwear accounted for 8 percent of Kenya’s manufactured export earnings in 2004.21 Leading Kenyan footwear producers that currently export include C & P Shoe Industries and Bata Kenya, both located in Nairobi. C & P Shoe Industries attributes its success to state-of-the-art manufacturing technology and technical assistance arrangements with companies in the United Kingdom, India, and Taiwan.22 Bata Kenya receives technological and design support from its parent company in Canada. In addition,
19 By contrast, during 2002−06 China’s footwear exports rose 97 percent to $21.8 billion. One
U.S. footwear industry representative emphasized that footwear production for domestic versus export markets differs substantially. He stated that, in general, SSA suppliers lack the capability or capacity to manufacture footwear in the quantity and quality required for export markets such as the United States whose consumers seek branded or private label quality footwear at the lowest possible price. He stated that eliminating duties on footwear imports from SSA countries was therefore unlikely to boost SSA footwear exports substantially to the U.S. market. Peter Mangione (president, Footwear Distributors and Retailers of America), telephone interview by Commission staff, October 11, 2007.
20 George Aldridge (economics officer, U.S. Embassy, Nairobi), e-mail message to Commission staff, November 13, 2007.
21 Kenya Association of Manufacturers, “Leather Products and Footwear,” undated. http://www.kam.co.ke/sector_content.php?ID=Leather%20Products%20and%20Footwear&page_title=KAM%20SECTORS (accessed October 2, 2007).
22 C & P Shoe Industries Web site, undated. http://www.cpshoes.com/default2.php?active_page_id=382 (accessed October 2, 2007).
3-9
Bata Kenya is able to be price-competitive because of its vertically integrated operations.23 Industry sources attribute the export success of some Kenyan footwear producers not only to investments in upgrading manufacturing technology, but also to the availability of domestic raw materials and competitive labor costs.24 Bata Kenya is able to source all its leather supplies from local tanneries.25 In 2005, the government of Kenya imposed an export tax on hides, leading to more leather available at lower costs for footwear producers in Kenya.26 As a result, Bata Kenya was able to reduce its prices on shoes for both the domestic and export markets, making them more competitive with shoes from China. Uganda is Bata Kenya’s largest export market at $4 million.27 Kenya’s footwear exports to neighboring Uganda rose substantially in 2005 and 2006. 28
United Nations Industrial Development Organization (UNIDO) claims that Kenya’s footwear industry has also benefited substantially from a program it created in 1994 with the Industrial Development Decade for Africa (IDDA).29 These two organizations invested $900,000 to establish a Training and Production Centre for the Shoe Industry in Thika, a city northeast of Nairobi that has been a site for light manufacturing for many years.30 The project’s goal was to improve the quality and design of locally made footwear to make it internationally competitive. The center has focused on the needs of the footwear and leather product industries in eastern and southern Africa since its inception.31 Training courses provided by the center include shoe design and pattern cutting, shoe upper cutting and stitching, leather sole making, and business training. Although this project was completed in 2000, the resulting strengthening of Kenya’s footwear industry likely contributed to the expansion of Kenya’s footwear exports during 2002−06.
Ethiopia
Ethiopia established a similar leather products training institute in Addis Ababa, where students receive six months of training in various shoe-making skills. The institute has supplied workers to the three footwear factories that have opened in Addis Ababa in 2006−07, reducing the start-up training costs for these
23 George Aldridge (economics officer, U.S. Embassy, Nairobi), e-mail message to
Commission staff, November 13, 2007. 24 United Nations University, “Kenya: Leather and Footwear Industry,” undated,
http://www.unu.edu/unupress/unupbooks/uu34ee/uu34e0t.htm (accessed August 13, 2007). 25 George Aldridge (economics officer, U.S. Embassy, Nairobi), e-mail message to
Commission staff, November 13, 2007. 26 Barry Fisher (executive director, African Cotton & Textiles Industries Federation (ACTIF)),
interview by Commission staff, Nairobi, Kenya, October 16, 2007. 27 George Aldridge (economics officer, U.S. Embassy, Nairobi), e-mail message to
Commission staff, November 13, 2007. 28 Barry Fisher (executive director, African Cotton & Textiles Industries Federation (ACTIF)),
interview by Commission staff, Nairobi, Kenya, October 16, 2007. 29 Aurelia Calabro (project manager, UNIDO), e-mail message to Commission staff,
October 2, 2007. 30 “Kenya: Institutional Support.” UNCTAD/WTO 1994−2006, undated
http://intracen.org/appli2/leather/AfricanPlatform/ (accessed August 23, 2007). 31 Ibid.
3-10
companies. Footwear and apparel exporters also benefit from reduced freight rates when using government-owned trucking companies.32 Most of Ethiopia’s footwear establishments are located in Addis Ababa, with the remainder in Oromiya and Amhara.33 Estimates of the number of factories vary; a recent report stated that currently more than 30 new shoe-manufacturing industries are operational, employing more than 9,000 workers.34 Most factories employ only ten or fewer workers; a few factories employ hundreds of workers.35 Although Ethiopia has the largest livestock population in Africa and the tenth largest in the world,36 the competitiveness of Ethiopia’s footwear sector has been hampered by low-quality hides, skins, and finished leathers as a result of non-commercial slaughtering and handling conditions and obsolete tanning, finishing, and production technologies.37 Recently, Ethiopia’s footwear sector has launched initiatives to improve the harvesting of hides and skins through training programs and projects to reduce defects and to enhance and create linkages between tanners and footwear producers.38 Deeper Regional Integration The establishment of the EAC39 among Kenya, Uganda, and Tanzania on January 1, 2005,40 also likely contributed to the increased level of intraregional footwear trade, particularly between Kenya and Uganda, in 2005 and 2006. The EAC established common duty rates to be applied uniformly on goods imported into the EAC, and also partly liberalized tariffs on intra-EAC trade; the EAC plans to fully eliminate tariffs on intra-regional trade by year-end 2009. Uganda’s reduction of tariffs on footwear imported from Kenya since the establishment of the EAC contributed to the subsequent growth in Uganda’s imports of footwear from Kenya in 2005 and 2006.41 The steady growth of Uganda’s GDP by an
32 Tesfay Weldekiros (general manager, Peacock Shoe Factory), interview by Commission
staff, Addis Ababa, Ethiopia, October 26, 2007. 33 Van der Loop, Clothing and Footwear in African Industrialization, January 2003, 13. 34 Economic Commission for Africa/Africa Union, Economic Report on Africa 2007,
February 2007, 160. 35 Akoten, Otsuka, and Sonobe, “The Development of the Footwear Industry in Ethiopia,”
January 2007. 36 Van der Loop, Clothing and Footwear in African Industrialization, January 2003, 12. 37 Slaughtering of animals in Ethiopia primarily occurs in private back yards rather than
commercial abattoirs. Haile Kibret (economic specialist, U.S. Embassy, Addis Ababa), e-mail message to Commission staff, November 20, 2007; and Calabro, “UNIDO at Work: Sub-Saharan Africa: Kenya, Ethiopia – For Export.”
38 USAID, “Hides, Skins and Leather Sector Activities Briefing,” September, 2007. 39 Burundi and Rwanda have since joined the EAC, becoming full members on July 1, 2007.
East African Community, “About EAC,” www.eac.int/about_eac.htm (accessed March 11, 2008). 40 “Uganda,” African Economic Outlook 2005-2006, AFDB/OECD 2006,
http://www.oecd.org/dev/publications/africanoutlook, 513, (accessed September 12, 2007). 41 Tariffs decreased from 10 percent to a current 6 percent for Ugandan importers that are not
officially registered with the Government of Uganda and became duty free for companies that are registered with the government. George Aldridge (economics officer, U.S. Embassy, Kampala), e-mail message to Commission staff, November 23, 2007.
3-11
average of 5.8 percent or more per year since 200442 and the country’s limited footwear production43 also likely contributed to the growth in Uganda’s footwear imports from Kenya. The regional footwear industry also likely benefited from strengthened trade ties among COMESA members and COMESA initiatives to support the manufacturing of leather products.44 USAID contractors at the East and Central Africa Trade Hub in Nairobi have worked with the COMESA Secretariat to lower tariffs among COMESA members and incorporate measures to speed customs processing, reducing costs for traders. Leading COMESA markets for sub-Saharan Africa exports include Uganda, South Africa, Malawi, and Tanzania.45 COMESA also established a leather products institute to provide training in leather-making and technology,46 which may have contributed to growth in footwear trade among certain COMESA members during 2002−2006. Growth of Private Enterprise in Ethiopia and the Development of Partnerships with the European Footwear Industry The Ethiopian Government launched a program to privatize state-owned enterprises and the Ethiopian Privatization Agency (EPA) was established to implement the program in 1995.47 Although state-owned footwear facilities still account for a significant share of Ethiopia’s footwear sector, the number of privately-owned operations has grown. The entry of high-performing, innovative private enterprises since 2001 has reportedly led to improvements in the quality of products and increased efficiency of marketing and management.48 Such private enterprise activities have likely helped to strengthen and expand Ethiopia’s footwear sector and exports. Private Ethiopian firms have been building new large factories in industrial parks developed by the government, and plans are underway to establish additional
42 “Uganda,” African Economic Outlook 2005–2006, AFDB/OECD 2006,
http://www.oecd.org/dev/publications/africanoutlook, 507 (accessed September 12, 2007); and The Economist, “Africa’s Economy: A Glimmer of Light at Last?” June 24, 2006, 51.
43 Stella Kasansula (economic/commercial assistant, U.S. Embassy, Kampala), e-mail to Commission staff, November 16, 2007. Uganda’s footwear business is dominated by one large manufacturer, Uganda Bata Shoe Co. which employs over 100 people and produces 5 million pairs of assorted footwear. Uganda’s population in 2007 was an estimated 30.9 million.
44 Industry sources report, “at the regional level it is especially the trade arrangements made within the Common Market of Eastern and Southern Africa (COMESA) that are likely to promote exports. . . . In the leather sector there are several regional associations.” Theo van der Loop, “RLDS Policy Brief No. 1: The Importance of the Leather Footwear Sector for Development in Ethiopia,” June 2003, 4.
45 Ronald Black (chief of party, East and Central Africa Trade Hub), interview by Commission staff, Nairobi, Kenya, October 17, 2007.
46 USITC hearing transcript, October 23, 2007, 30. 47 “Ethiopian Business Development Services Network: Investment Opportunities,”
http://www.bds-ethiopia.net/investment-opportunities.html (accessed August 17, 2007). 48 Akoten, Otsuka, and Sonobe, “The Development of the Footwear Industry in Ethiopia: How
Different Is it from the East Asian Experience?” Prepared for the Global Development Network Annual Conference, January 2007, 1, 8.
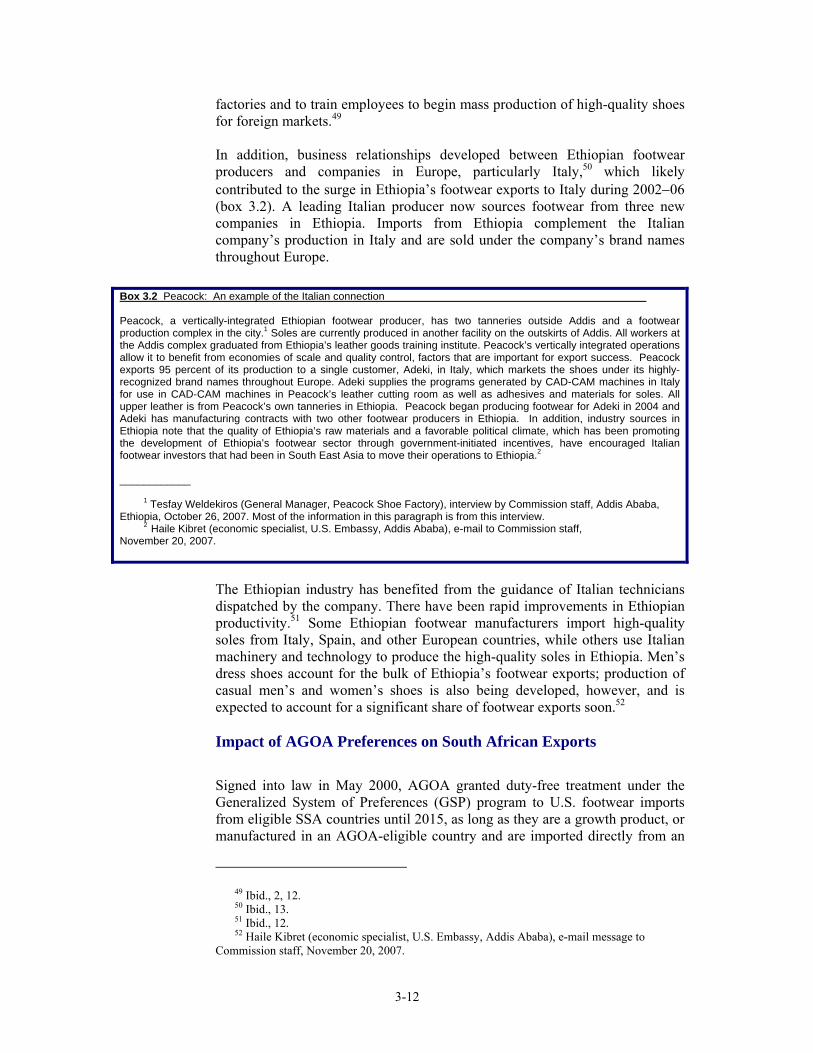
3-12
factories and to train employees to begin mass production of high-quality shoes for foreign markets.49 In addition, business relationships developed between Ethiopian footwear producers and companies in Europe, particularly Italy,50 which likely contributed to the surge in Ethiopia’s footwear exports to Italy during 2002−06 (box 3.2). A leading Italian producer now sources footwear from three new companies in Ethiopia. Imports from Ethiopia complement the Italian company’s production in Italy and are sold under the company’s brand names throughout Europe.
The Ethiopian industry has benefited from the guidance of Italian technicians dispatched by the company. There have been rapid improvements in Ethiopian productivity.51 Some Ethiopian footwear manufacturers import high-quality soles from Italy, Spain, and other European countries, while others use Italian machinery and technology to produce the high-quality soles in Ethiopia. Men’s dress shoes account for the bulk of Ethiopia’s footwear exports; production of casual men’s and women’s shoes is also being developed, however, and is expected to account for a significant share of footwear exports soon.52 Impact of AGOA Preferences on South African Exports Signed into law in May 2000, AGOA granted duty-free treatment under the Generalized System of Preferences (GSP) program to U.S. footwear imports from eligible SSA countries until 2015, as long as they are a growth product, or manufactured in an AGOA-eligible country and are imported directly from an
49 Ibid., 2, 12. 50 Ibid., 13. 51 Ibid., 12. 52 Haile Kibret (economic specialist, U.S. Embassy, Addis Ababa), e-mail message to
Commission staff, November 20, 2007.
Box 3.2 Peacock: An example of the Italian connection Peacock, a vertically-integrated Ethiopian footwear producer, has two tanneries outside Addis and a footwear production complex in the city.1 Soles are currently produced in another facility on the outskirts of Addis. All workers at the Addis complex graduated from Ethiopia’s leather goods training institute. Peacock’s vertically integrated operations allow it to benefit from economies of scale and quality control, factors that are important for export success. Peacock exports 95 percent of its production to a single customer, Adeki, in Italy, which markets the shoes under its highly-recognized brand names throughout Europe. Adeki supplies the programs generated by CAD-CAM machines in Italy for use in CAD-CAM machines in Peacock’s leather cutting room as well as adhesives and materials for soles. All upper leather is from Peacock’s own tanneries in Ethiopia. Peacock began producing footwear for Adeki in 2004 and Adeki has manufacturing contracts with two other footwear producers in Ethiopia. In addition, industry sources in Ethiopia note that the quality of Ethiopia’s raw materials and a favorable political climate, which has been promoting the development of Ethiopia’s footwear sector through government-initiated incentives, have encouraged Italian footwear investors that had been in South East Asia to move their operations to Ethiopia.2
____________ 1 Tesfay Weldekiros (General Manager, Peacock Shoe Factory), interview by Commission staff, Addis Ababa, Ethiopia, October 26, 2007. Most of the information in this paragraph is from this interview. 2 Haile Kibret (economic specialist, U.S. Embassy, Addis Ababa), e-mail to Commission staff, November 20, 2007.
3-13
eligible country; the rule-of-origin qualifications specify that U.S. content may be counted toward the 35 percent value contribution threshold (HTS general note 16 (b)). Such preferential treatment contributed to increased SSA (primarily from South Africa) footwear exports to the United States from 2002 through 2006.53 One U.S. footwear distributor stated that it began importing hand-stitched footwear from South Africa shortly after AGOA went into effect.54 Before AGOA, importing footwear from South Africa for this U.S. footwear distributor was cost prohibitive because of tariffs and because South African production costs are higher than other footwear suppliers. South African workers are paid an average of four times as much as their counterparts in China.55 Another industry source stated that AGOA has given South African footwear exports “an edge over our competitors who have to pay duties of between 15 percent and 16 percent on synthetic products.”56 In 2002, U.S. imports of footwear from SSA countries under AGOA accounted for 35 percent of total U.S. imports of footwear from SSA countries; in 2006, U.S. imports entering duty-free from SSA countries under AGOA accounted for 61 percent of total U.S. footwear imports from SSA. Virtually all of U.S. imports of footwear entering duty-free under AGOA in 2006 were from South Africa. In general, however, SSA footwear producers as a group have taken limited advantage of AGOA to boost their exports of footwear to the United States. This may be, in part, because of existing contractual obligations to sell cowhides to be processed in China, or because of minimal interest in alternative sources of supply on the part of U.S. footwear importers who source more than 90 percent of their products from China.57 According to one U.S. industry representative, the principal opportunity for SSA footwear producers in taking advantage of AGOA lies in “small orders and niches.”58 South African footwear producers tend to concentrate on producing higher-end shoes (box 3.3).59
53 Dennis Linde (executive director, Southern African Footwear and Leather Industries
Association (SAFLIA)), e-mail message to Commission staff, November 1, 2007. 54 Russell Lindsay (president, TSONGA USA LLC), e-mail message to Commission staff,
October 10, 2007. 55 Ibid. 56 Njobeni, “Business Day (South Africa): SA Producers Push Quality Ahead of Price,”
October 3, 2005. 57 USITC hearing transcript, October 23, 2007, 110−111, 139. 58 Ibid., 139. 59 Dennis Linde (executive director, Southern African Footwear and Leather Industries
Association (SAFLIA)), e-mail message to Commission staff, November 1, 2007.
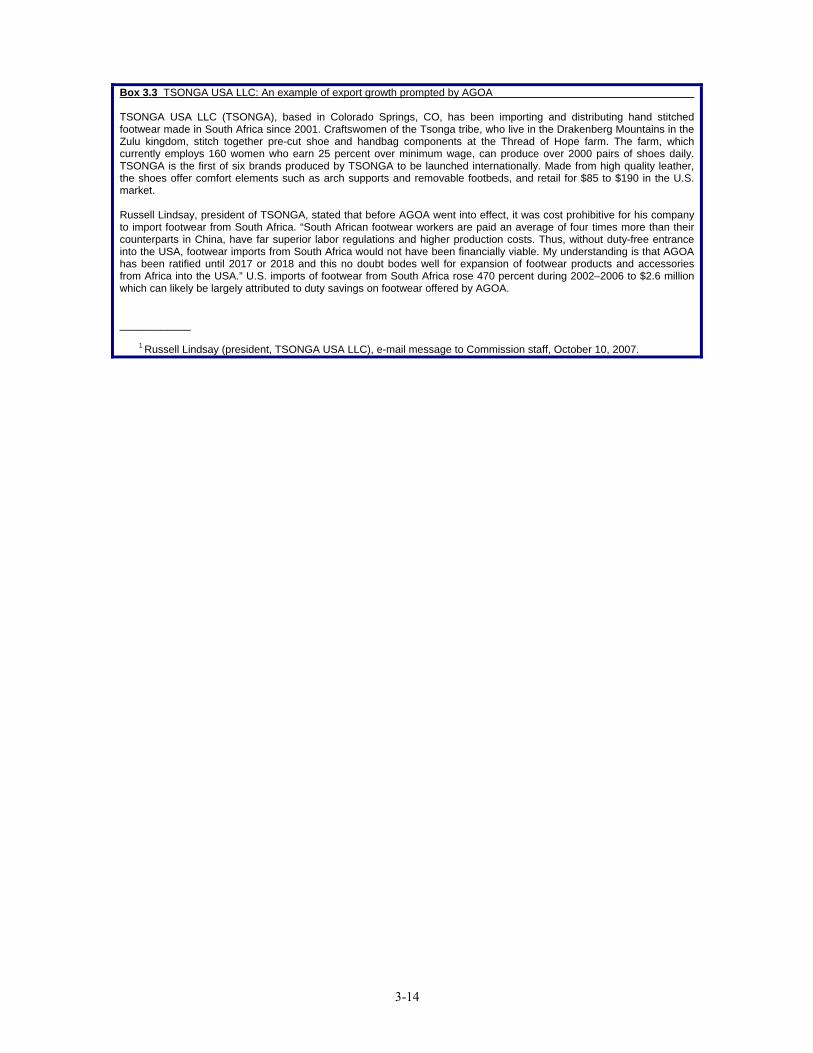
3-14
Box 3.3 TSONGA USA LLC: An example of export growth prompted by AGOA TSONGA USA LLC (TSONGA), based in Colorado Springs, CO, has been importing and distributing hand stitched footwear made in South Africa since 2001. Craftswomen of the Tsonga tribe, who live in the Drakenberg Mountains in the Zulu kingdom, stitch together pre-cut shoe and handbag components at the Thread of Hope farm. The farm, which currently employs 160 women who earn 25 percent over minimum wage, can produce over 2000 pairs of shoes daily. TSONGA is the first of six brands produced by TSONGA to be launched internationally. Made from high quality leather, the shoes offer comfort elements such as arch supports and removable footbeds, and retail for $85 to $190 in the U.S. market. Russell Lindsay, president of TSONGA, stated that before AGOA went into effect, it was cost prohibitive for his company to import footwear from South Africa. “South African footwear workers are paid an average of four times more than their counterparts in China, have far superior labor regulations and higher production costs. Thus, without duty-free entrance into the USA, footwear imports from South Africa would not have been financially viable. My understanding is that AGOA has been ratified until 2017 or 2018 and this no doubt bodes well for expansion of footwear products and accessories from Africa into the USA.” U.S. imports of footwear from South Africa rose 470 percent during 2002–2006 to $2.6 million which can likely be largely attributed to duty savings on footwear offered by AGOA. ____________
1 Russell Lindsay (president, TSONGA USA LLC), e-mail message to Commission staff, October 10, 2007.
3-15
Footwear Bibliography Akoten, John, Keijiro Otsuka, and Tetsushi Sonobe. “The Development of the Footwear Industry in Ethiopia: How Different Is it from the East Asian Experience?” Prepared for the Global Development Network Annual Conference, Beijing, China, January 2007. Cipriani, Simone. Study of the Quality Control and Management on the African Leather Sector. Prepared by Assomac Servizi Srl for UNIDO, 2002. CDE/PRO&INVEST. “Targeted Support Programme for Small and Medium Sized Enterprise (SME) Development in the Leather Sector.” Leather Programme for Eastern and Southern Africa, September 2004. Datamonitor, Footwear in South Africa: Industry Profile. October 2005. Department of Trade and Industry (South Africa) (DTI). Textile, Clothing and Footwear Sector – the Trade and Investment South Africa Profile. Undated. Global Trade Information Services, Inc. (GTIS), Global Trade Atlas. Annual data compiled from reporting countries’ official statistics, including EU27 external trade. http://www.gtis.com/gta/usitc (accessed various dates). IBISWorld. Global Footwear Manufacturing: C1321. IBISWorld Industry Report, July 4, 2007. New Agriculturist On-line, “Africa Goes Hell for Leather.” http://www.new-ag.info/99-4/develop/dev03.html (accessed August 23, 2007). OECD. African Economic Outlook 2005-2006, “Uganda,” AFDB/OECD 2006, http://www.oecd.org/dev/publications/africanoutlook. Republic of Kenya, “Position Paper on Leather and Leather Products.” June 2001. “Trade Matters: A Bread for the World Institute Newsletter. AGOA,” November 2006.
UNIDO, “Trade Capacity Building: Case Studies: Sub-Saharan Africa, Kenya, Ethiopia.” United Nations Economic Commission for Africa and the African Union. Economic Report on Africa 2007: Accelerating Africa’s Development Through Diversification. Addis Ababa. February 2007. United Nations Industrial Development Office. “Regional African leather and footwear industry scheme,” 2003. http://wwap.unesco.org/ev.php?URL_ID=7505&URL_DO=DO_TOPIC&URL_SECTION=201&reload=1154102136&PHPSE. United Nations University. “Kenya: Leather and Footwear Industry.” undated. http://www.unu.edu/unupress/unupbooks/uu34ee/uu34e0t.htm (accessed September 19, 2007). U.S. International Trade Commission (USITC) hearing transcript in connection with inv. No. 332-477, Sub-Saharan Africa: Factors Affecting Trade Patterns of Selected Industries, October 23, 2007.
3-16
Van der Loop, Theo. Clothing and Footwear in African Industrialization: The Case of Ethiopia. The Netherlands: Institute of Social Studies, Clothing and Footwear Network in Africa, January 2003. ——. “The Importance of the Leather Footwear Sector for Development in Ethiopia.” RLDS Policy Brief No. 1, Addis Ababa. June 2003. WorldWater Assesment Programme, “Regional African Leather and Footwear Industry Scheme.” http://wwap.unesco.org/ev.php?URL_ID=7505&URL_DO=DO-TOPIC&URL_SECTION=201&reload=1154102136&PHPSE.
3-17
Natural Rubber
Summary of Findings
Rising demand for motor vehicles, tires, and other rubber products grew faster than global natural rubber (NR) production and led to sharply rising NR prices and SSA export values during 2002–06. These higher prices were chiefly responsible for the 262 percent increase in the value of SSA exports of NR during 2002−06, from $228 million in 2002 to $824 million in 2006. The price of NR in SSA more than tripled during 2002−06, from $668 per metric ton (mt) to $2,092 per mt in 2006. SSA price trends mirror global NR trends, which are driven by Asian exports. Supply constraints faced by SSA NR producers, however, dampened the increase in SSA export value, allowing for the relatively low volume growth of 15 percent over 2002 −06. Factors that limited export volumes and the development of value-added rubber processing in the region included infrastructure constraints, capital resource requirements, and political instability in several SSA countries. In response to the increasing global prices, officials in Côte d’Ivoire, Cameroon, and Ghana have announced plans to double production of NR during the 2010−20 period.60 The project will be funded by the Common Fund for Commodities and include the adoption of technologies used in Asia.
Industry Overview
NR is a large-volume commodity product produced and traded only in select countries situated near the equator; thus, most large consuming countries are dependent upon a limited number of suppliers. The industry is dominated by exports from Asia, and strategically augmented with supplies from SSA and Latin America. Major NR exchanges are in New York, London, Tokyo, Shanghai, Thailand, and Malaysia. NR is generally imported duty-free by non-producing countries (as such, AGOA preferences play no role).61
The NR industry in SSA consists of nine known producing countries, largely situated near the equatorial coastal regions of West Africa. SSA countries produce NR from rubber tree plantations; such plantations employ several thousand workers on roughly 0.5 million hectares (1 million acres),62 and are operated by both large conglomerates and smaller farmers. Côte d’Ivoire, Liberia, Cameroon, and Nigeria are the leading producers and exporters, accounting for about 91 percent of total SSA production and exports (table 3.2).
60 AFP, “Three African Nations Pledge to Double Rubber Production,” July 27, 2007. Yann R. Wadjas
(factory manager, Sigal, Côte d’Ivoire), e-mail messages to Commission staff, September 18−19, 2007. http://www.aaalatex.com/content/comments.asp?id=113 (accessed September 1, 2007).
61 Dock No (International Rubber Study Group (IRSG)), e-mail message to Commission staff, September 18, 2007.
62 International Rubber Study Group (IRSG), Rubber Statistical Bulletin, July/August 2007, table 46.
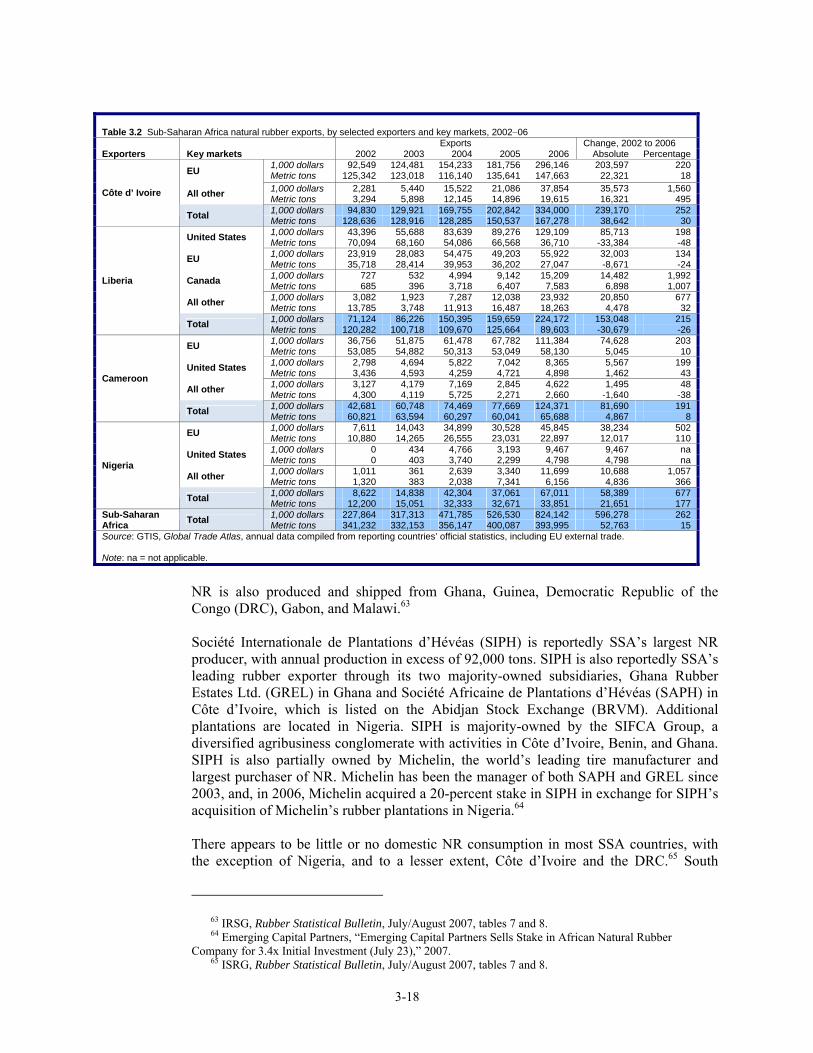
3-18
Table 3.2 Sub-Saharan Africa natural rubber exports, by selected exporters and key markets, 2002−06
Exports Change, 2002 to 2006 Exporters Key markets 2002 2003 2004 2005 2006 Absolute Percentage
1,000 dollars 92,549 124,481 154,233 181,756 296,146 203,597 220 EU Metric tons 125,342 123,018 116,140 135,641 147,663 22,321 18 1,000 dollars 2,281 5,440 15,522 21,086 37,854 35,573 1,560 All other Metric tons 3,294 5,898 12,145 14,896 19,615 16,321 495 1,000 dollars 94,830 129,921 169,755 202,842 334,000 239,170 252
Côte d’ Ivoire
Total Metric tons 128,636 128,916 128,285 150,537 167,278 38,642 30 1,000 dollars 43,396 55,688 83,639 89,276 129,109 85,713 198 United States Metric tons 70,094 68,160 54,086 66,568 36,710 -33,384 -48 1,000 dollars 23,919 28,083 54,475 49,203 55,922 32,003 134 EU Metric tons 35,718 28,414 39,953 36,202 27,047 -8,671 -24 1,000 dollars 727 532 4,994 9,142 15,209 14,482 1,992 Canada Metric tons 685 396 3,718 6,407 7,583 6,898 1,007 1,000 dollars 3,082 1,923 7,287 12,038 23,932 20,850 677 All other Metric tons 13,785 3,748 11,913 16,487 18,263 4,478 32 1,000 dollars 71,124 86,226 150,395 159,659 224,172 153,048 215
Liberia
Total Metric tons 120,282 100,718 109,670 125,664 89,603 -30,679 -26 1,000 dollars 36,756 51,875 61,478 67,782 111,384 74,628 203 EU Metric tons 53,085 54,882 50,313 53,049 58,130 5,045 10 1,000 dollars 2,798 4,694 5,822 7,042 8,365 5,567 199 United States Metric tons 3,436 4,593 4,259 4,721 4,898 1,462 43 1,000 dollars 3,127 4,179 7,169 2,845 4,622 1,495 48 All other Metric tons 4,300 4,119 5,725 2,271 2,660 -1,640 -38 1,000 dollars 42,681 60,748 74,469 77,669 124,371 81,690 191
Cameroon
Total Metric tons 60,821 63,594 60,297 60,041 65,688 4,867 8 1,000 dollars 7,611 14,043 34,899 30,528 45,845 38,234 502 EU Metric tons 10,880 14,265 26,555 23,031 22,897 12,017 110 1,000 dollars 0 434 4,766 3,193 9,467 9,467 na United States Metric tons 0 403 3,740 2,299 4,798 4,798 na 1,000 dollars 1,011 361 2,639 3,340 11,699 10,688 1,057 All other Metric tons 1,320 383 2,038 7,341 6,156 4,836 366 1,000 dollars 8,622 14,838 42,304 37,061 67,011 58,389 677
Nigeria
Total Metric tons 12,200 15,051 32,333 32,671 33,851 21,651 177 1,000 dollars 227,864 317,313 471,785 526,530 824,142 596,278 262 Sub-Saharan
Africa Total Metric tons 341,232 332,153 356,147 400,087 393,995 52,763 15 Source: GTIS, Global Trade Atlas, annual data compiled from reporting countries’ official statistics, including EU external trade. Note: na = not applicable.
NR is also produced and shipped from Ghana, Guinea, Democratic Republic of the Congo (DRC), Gabon, and Malawi.63 Société Internationale de Plantations d’Hévéas (SIPH) is reportedly SSA’s largest NR producer, with annual production in excess of 92,000 tons. SIPH is also reportedly SSA’s leading rubber exporter through its two majority-owned subsidiaries, Ghana Rubber Estates Ltd. (GREL) in Ghana and Société Africaine de Plantations d’Hévéas (SAPH) in Côte d’Ivoire, which is listed on the Abidjan Stock Exchange (BRVM). Additional plantations are located in Nigeria. SIPH is majority-owned by the SIFCA Group, a diversified agribusiness conglomerate with activities in Côte d’Ivoire, Benin, and Ghana. SIPH is also partially owned by Michelin, the world’s leading tire manufacturer and largest purchaser of NR. Michelin has been the manager of both SAPH and GREL since 2003, and, in 2006, Michelin acquired a 20-percent stake in SIPH in exchange for SIPH’s acquisition of Michelin’s rubber plantations in Nigeria.64
There appears to be little or no domestic NR consumption in most SSA countries, with the exception of Nigeria, and to a lesser extent, Côte d’Ivoire and the DRC.65 South
63 IRSG, Rubber Statistical Bulletin, July/August 2007, tables 7 and 8. 64 Emerging Capital Partners, “Emerging Capital Partners Sells Stake in African Natural Rubber
Company for 3.4x Initial Investment (July 23),” 2007. 65 ISRG, Rubber Statistical Bulletin, July/August 2007, tables 7 and 8.
3-19
Africa, the only industrially developed country in SSA, reportedly consumes some amount of SSA NR in tire production.66 Tire production facilities in other SSA countries also may consume some regionally-produced NR.67 Background information on the description and uses of NR is presented in box 3.4.
66 Bridgestone, Continental, Dunlop, and Goodyear operate tire plants in South Africa that employ some
5,500 workers. www.rubbernews.com, “Directory of Tire Manufacturers,” October 2007. Various suppliers in West Africa ship regular quantities of NR to South Africa. Certain supplies from Cameroon, Côte d’Ivoire, and Liberia are reportedly transshipped through Spain. Gary Soska (principal engineer, Goodyear Tire and Rubber Company), e-mail message to Commission staff, September 13, 2007.
67 Angola, Cameroon, Democratic Republic of the Congo, Ethiopia, Ghana, Kenya, Mozambique, Nigeria, South Africa, Sudan, Tanzania, and Zimbabwe. Rubber News, www.rubbernews.com, July 5, 2007. Rubber gloves are produced to a limited extent in one factory in Côte d’Ivoire; condoms are not known to be manufactured in any of the NR producing countries. South Africa reportedly produces condoms from imported Malaysian latex; Namibia reportedly produces condoms from latex of unknown origin.
Box 3.4 Product description for natural rubber Natural rubber (NR) is derived from the aqueous milky white latex sap of the rubber tree (Hevea brasiliensis), which flourishes in tropical regions near the equator where there are alternating periods of abundant rainfall. The rubber tree is native to the Amazon region. Rubber trees are a renewable resource cultivated under agro-forestry conditions from seeds, seedlings, and by grafting. It takes about six years for a rubber tree to reach harvest maturity and up to 15 years for maximum yields to occur; its productive lifetime is 26-30 years.1 NR harvesting is labor intensive typically involving the recovery of rubber by many workers from trees grown on large estates or plantations. Yields from a quality rubber plantation under ideal conditions may approach one short ton per acre on a 100 percent solids basis.2 About 80 percent of the world’s NR tonnage is supplied by plantations in Southeast Asia, followed by other Asian countries, and sub-Saharan Africa (4 percent), with minor amounts from Latin America.3 The latex tapped from the rubber tree contains about 30 percent by weight of natural rubber in aqueous colloidal suspension. Workers collect less than a cupful from each tree every four hours. Latex is transported to collection stations where a small amount of ammonia must be added to prevent it from coagulating if its end use is to be concentrated liquid latex, or for most solid forms. The ammoniated crude liquid latex is subsequently transported to a processing plant where it is purified and concentrated to about 60 percent solid content for latex use, which after aging is ready for shipping. Solid forms of natural rubber are produced from coagulated product transferred from the collection site, or by subsequent coagulation of the diluted latex with acid at the processing plant.4 Solid forms predominate and are produced in three types: ribbed smoked sheet (RSS) in several grades; technically specified natural rubber (TSR) in several grades; and smaller amounts of crepe rubber. RSS sheet forms are milled through ribbed roller drums to form a ribbed sheet and washed; the sheet is subsequently dried and smoked to cure and preserve the rubber, and the dark product sheets are pressed into bales and packaged for shipment. TSR rubber coagulum is washed to remove impurities, and passed through a mill to form a sheet which is compressed into bales and packaged. TSR rubber specifications quantify the dirt, ash, nitrogen, and volatile matter contents and color code the NR. Crepe is the purest form of NR (polyisoprene) but it is produced in limited amounts.5
About 75 percent of total solid NR forms are reportedly consumed in tire manufacturing of all types;6 NR solid items such as seals, hoses, drive belts, conveyor belts, and foam rubber, are also produced. In the United States, about 90 percent of NR consumption is as solid, and 10 percent as latex. About 80 percent of the solid NR is of the TSR type.7 Latex is an important commodity used in dipped goods such as surgical gloves, other medical products, and prophylactic items used for personal hygiene. Latex is also used for carpet backing, adhesives, and other products.8 ____________
1 Technical Centre for Agricultural and Rural Cooperation ACP-EU, “Natural Rubber Springs Back,” April 2007; and Wikipedia, “Para Rubber Tree,” undated (accessed September 1, 2007).
2 Firestone Natural Rubber Company, LLC, Web site. http://www.firestonenaturalrubber.com (accessed May 23, 2007). 3 IRSG, Rubber Statistical Bulletin, July/August 2007. 4 Firestone Natural Rubber Company, LLC, Web site. http://www.firestonenaturalrubber.com (accessed May 23, 2007). 5 Transportation Information Service, “Natural Rubber, version 1.0.0.05,” undated (accessed September 10, 2007). 6 Technical Centre for Agricultural and Rural Cooperation ACP-EU, “Natural Rubber Springs Back,” April 2007. 7 USITC, Dataweb. 8 Rob Blalock (U.S. sales representative, Firestone Natural Rubber, Co.), telephone interview by Commission staff, May 24, 2007.
3-20
Profiles of Leading SSA NR Producers
Côte d’Ivoire
The leading producer and exporter of NR in SSA demonstrated strong growth, with exports rising 30 percent by volume and 252 percent by value during 2002–06. Overall production volume also increased by 48 percent, from 120,000 tons to 178,000 tons, representing 42 percent of total SSA production in 2006.68 The area under cultivation in 2006 was reported to be 122,000 hectares (300,000 acres).69 The NR industry in Côte d’Ivoire is well organized and structured. The industry consists of two subsectors, manufacturers and growers, which coordinate their activities through the Association of Producers and Manufacturers of Natural Rubber (APROMAC). There is reportedly no government support for the NR industry.70 The NR industry was privatized during the early to mid-1990s. Historically, manufacturers of salable basic NR in bales and sheets relied primarily on their own plantations for a steady flow of raw materials. However, the sharp increase in the world price of rubber, as well as improving terms of trade following a 50 percent currency devaluation in 1994, resulted in a marked increase in areas planted by small growers. Although the share of producing areas cultivated by small growers averaged only about 16 percent during 1990–93, this share climbed to 43 percent by 1997. Following privatization, two large enterprises, SAPH and SOGB, which were originally set up under state control to run certain sectors of the NR industry, remained and commanded about 80 percent of the producing areas.71 There is very little domestic consumption of NR in Côte d’Ivoire other than a rubber glove factory, SIGAL, and possibly some production of rubber buckets and boots.72
Liberia
Export values during the 2002–06 period increased by 215 percent due mainly to rising prices. In 2006, about 64 percent of Liberia’s NR export shipments by value were exported to the United States and Canada.73 The remainder was shipped largely to France and other EU countries. Annual NR production of Liberia, the second-leading producer of NR in SSA, was relatively constant during 2002–06, ranging from a high of 115,000 tons in 2004 to a low of 101,000 tons in 2006, and representing about 24 percent of the SSA total in that year.74 There is no known domestic consumption of NR in Liberia.
68 IRSG, Rubber Statistical Bulletin, July/August 2007, table 7. 69 Ibid., table 46. 70 Jean-Louis Billion (chairman, Ivorian chamber of commerce and industry (CCI)), interview by
Commission staff, Abidjan, Côte d’Ivoire, October 24, 2007. 71 Jones, Jammal, and Gokgur, Impact of Privatization, July 15, 2002, III-1-43. 72 Yann R. Wadjas (factory manager, SIGAL, Côte d’Ivoire), e-mail message to Commission staff,
August 30, 2007. 73 GTIS, Global Trade Atlas. 74 IRSG, Rubber Statistical Bulletin, July/August 2007, table 7.
3-21
Approximately 270,000 acres of rubber trees were under cultivation in 1999, the last year of available data. 75 Firestone Natural Rubber Company, LLC, reportedly operates the world’s single largest NR estate in Liberia, encompassing approximately 120,000 acres. Firestone began production in Liberia in 1926. Approximately 8 million rubber trees are now planted, and about 6,000 workers are employed.76 Hydroelectric power has been developed for the estate. Firestone reportedly supplies solid block rubber to its sister company, Bridgestone Firestone North America Tire, LLC, and liquid latex to specialty compounders and manufacturers in the United States and Canada.77 Firestone indicated that it has contributed significantly to the redevelopment of Liberia’s NR production and infrastructure during the post-Civil War period (1995−96), including restoration of roads, bridges, and schools.78
Cameroon
The third largest NR producing country in SSA accounted for 15 percent of total production volume in 2006. Export volumes were relatively stable during 2002–06, while the value of exports grew by 191 percent, due mainly to rising prices. In 2005, the total area of rubber trees under cultivation was reportedly 40,400 hectares (99,000 acres).79 Although the industry has reportedly been privatized, production remained relatively flat during 2002–06, hitting a high of 62,200 tons in 2006 and a low of 54,000 tons in 2004.80 No confirmed evidence exists of domestic NR consumption in Cameroon,81 although a tire facility may exist in Douala.82 However, a producer in Cameroon of technically specified rubber (TSR) is seeking a partner for a factory that would be built in Cameroon to process rubber into higher value-added articles, which would reduce transportation costs per unit volume, and create more jobs.83
Nigeria
NR is one of Nigeria’s traditional non-oil export products. Dynamic growth in global demand during 2002–06 resulted in an export increase of 677 percent by value and 177 percent by volume. The largest market for Nigerian NR is the EU. Companies from Côte d’Ivoire and Cameroon are reportedly major stakeholders in the Nigerian industry.84 Nigeria also consumes significant quantities of NR—more than 35 percent of production—domestically,85 using it to make products such as tires, bathroom slippers, rubber bowls, and cups. Major export markets for Nigeria’s rubber products are other West African countries. In the past, both Michelin and Dunlop operated tire plants in
75 IRSG, Rubber Statistical Bulletin, July/August 2007, table 46. Currently, about 550,000 acres of semi-
developed arable land are potentially available for NR cultivation in Liberia. Juba, “Natural Rubber Industry of Liberia,” April 5, 2007.
76 Firestone Natural Rubber Company, LLC, Web site. http://www.firestonenaturalrubber.com (accessed various dates, 2007).
77 Ibid. 78 Ibid. 79 IRSG, Rubber Statistical Bulletin, July/August 2007, table 46. 80 Ibid., table 7. 81 Ibid., tables 7 and 8. 82 Rubber News. www.rubbernews.com (accessed various dates, 2007). 83 “Rubber Factory Project,” UNIDO Web site.
http://www.ticadeexchange.unido.org/templatees/detailviews/detaiview_all.sap?lan=en&plan=en, (accessed December 3, 2007).
84 “Rubber and Rubber Products,” Nigeria Commerce, January 9, 2007. 85 IRSG, Rubber Statistical Bulletin, July/August 2007, tables 7 and 8.
3-22
Nigeria; however Michelin ceased operations at the end of 2006. Six Nigerian firms were identified that trade in NR products other than tires.86 Nigeria is the fourth largest producing country of NR in SSA, representing about 10 percent of total production by volume in 2006. Production volume ranged from a low of 38,000 tons in 2003 to a high of 45,000 tons in 2004.87 Risingson International, Inc., a Nigerian affiliate with a sales office in Chicago, IL, markets various solid grades of TSR. Risingson works with rubber plantation owners and producers near Benin City, which is located in the Edo State, about 200 miles east of Lagos. Benin City is at the center of Nigeria’s rubber industry and is home to the headquarters of the Nigerian Rubber Board (NRB) and the Rubber Research Institute of Nigeria.88
Ghana
In 2006, Ghana was the fifth largest SSA producer of NR, providing about 3 percent of total SSA production. Production and export volumes were relatively constant during the 2002–06 period, averaging about 10,000 tons per year. Export values, however, increased 238 percent during the period, owing to a dramatic rise in prices. The latest data available indicate acreage under cultivation of 17,000 hectares (42,000 acres) in 1999.89 There is no indication of domestic consumption of NR in Ghana, although an idle tire production facility formerly run by Firestone using Liberian NR feedstock is reportedly located in the country at Bonsasa.90 Ghana Rubber Estates Ltd. (GREL), a formerly state-owned operation that was privatized in October 1996, currently encompasses 22,000 acres. GREL has received financial aid from the French Development Fund (CFD) to establish a processing plant, which reportedly is on stream.91
Guinea
Guinea is the most recent entrant into NR production in SSA. In 2006, NR production was 9,000 tons, representing about 2 percent of total SSA output. Production was relatively constant during 2002–06, averaging 9,000 tons annually, while export volumes averaged 8,400 tons-per-year. Both export values increased significantly during 2002–06 due to increased prices. NR is produced by Société of guinéenne de palmiers à huile et d’hévéas (Soguipah), a wholly owned government company, at its Nzerekore estate in the south of the country, along the Liberian border. The plantation is managed by Société guinéenne de gestion agro-industrielle (Soggai). Rubber planted acreage in 2001–02 totaled 6,000 hectares
86 Nigeria Commerce. “Rubber and Rubber Products.”
http://www.commerce44ng.org/commerce/index.php?option=com_content&t, (accessed August 30, 2007); and “Michelin Annual Report 2006.” www.michelin.com, undated.
87 IRSG, Rubber Statistical Bulletin, July/August 2007, tables 7 and 8. 88 Retrieved from Risingson Web site, www.risingsoninternational.com/rubber.asp, September 1, 2007. 89 IRSG, Rubber Statistical Bulletin, July/August 2007, table 46. 90 USITC staff interview with a delegation of Ghanaian government and industry representatives,
Washington, DC, October 17, 2007; and Rubber News. www.rubbernews.com, (accessed various dates, 2007).
91 “The African Rubber Industry,” Secretariat Conference Paper 2002B, International Rubber Study Group (IRSG), September 2002, 10.
3-23
(15,000 acres), including around 3,700 acres of smallholder rubber. A processing plant was scheduled to be on stream by early-2001. Plans were formulated to plant an estimated 17,000−20,000 acres, of which 6,000 acres were to be in smallholdings.92 USITC staff was not able to confirm whether these plans have reached fruition.
Democratic Republic of the Congo (DRC)
NR production in DRC averaged 2 percent of the SSA total during 2002–06, varying between 7,000 and 8,000 tons per year, while export volumes averaged only 1,700 tons annually. However, both export volumes and value increased significantly during 2002–06. In 1972, Cobra Tire and Rubber Company opened a 1,000-unit-per-day tire plant at Kinshasa.93 Production of NR in DRC reached 35,000 tons-per-year by the early 1960s, during which average planted acreage was 222,000 acres. Since the 1970s, production and planted acreage fell, however, averaging under 20,000 tons per year in the 1980s and less than 15,000 annual tons in the 1990s. By 1990, total planted acreage was estimated at 99,000 acres, of which only 25,000 acres were tapped by four companies.94 In the 1990s, production fell below 10,000 tons per year, disrupted by civil war, economic crises, high interest rates, and hyperinflation.95 Planted acreage in 1999 was reported at 35,000 hectares (86,000 acres).96
Gabon
In 2006, Gabon’s exports of NR ($26 million) accounted for about 3 percent of total SSA exports. Export prices for NR from Gabon tracked global and SSA trends, increasing from $762 per ton in 2002 to $2,112 per ton in 2006. Hevegab, a government-owned company, was formed in 1981 to develop NR cultivation in Gabon with the assistance of the CFD. A total of 9,000 hectares (22,200 acres) were planted and production began in the early-1990s on three estates, Bitam, Kango, and Mitzic. Production reportedly reached 10,000−12,000 tons in 1997–98. A 10,000−20,000 ton processing plant was built at Mitzic to produce block rubber. In 2000, a privatization plan was initiated.97 Production fell thereafter, but export volumes increased from 1,000 tons in 2004 to 12,500 tons in 2006.
92 “The African Rubber Industry,” Secretariat Conference Paper 2002B, IRSG, September 2002, 10. 93 Rubber News. www.rubbernews.com, undated. 94 Of the four producing entities, three were foreign owned, and one, Cultures Zairoises (CZ), was
locally-owned. In the late-1990s to early-2000s, only the foreign-owned entity, Groupe Agro-Pastorale (GAP), an American company, was believed to still be in production. The GAP plantations output was used for tire production. Production was all solid still rubber in several grades. TSR capacity was installed at the Busira estate in Equatorial Zaire around Ikele in 1995, and at the SCAM estate in the southwest of the country in early-1999.
95 “The African Rubber Industry,” Secretariat Conference Paper 2002B, IRSG, September 2002, 12−13. 96 IRSG, Rubber Statistical Bulletin, July/August 2007, table 46. 97 “The African Rubber Industry,” Secretariat Conference Paper 2002B, IRSG, September 2002, 9−10.
3-24
Proposals to Promote the Industry and Increase Investment in the Future In order to encourage continued growth in NR production and trade, Côte d’Ivoire, Cameroon, and Ghana announced ambitious goals to double NR production during 2010–20.98 Industry sources report that during a July 2007 meeting on how to increase revenues for small rubber farmers, plans were disclosed for implementation of a project involving the adoption of technologies used in Asia. The $3 million project, a figure representing the costs for all three countries combined, will be financed by the Common Fund for Commodities, a Netherlands-based financial institution.99 The project is designed to achieve production increases through:
• Technology transfer for the implementation of good agricultural practices; • Productivity increases through the use of high-yielding clones; • Installation of breeding programs so that high-yielding clones are available in
sufficient quantities; and, • Strengthening of professional and research organizations.100
Sub-Saharan Africa Trade in the Global Context
Leading Exporters In 2006, global exports of NR were valued at $13.6 billion. Thailand, Indonesia, Malaysia, and Vietnam dominated global exports, accounting for 89 percent of the total value (figure 3.3). SSA countries, in contrast, accounted for 6 percent of the global total. Côte d’Ivoire and Liberia ranked fifth and sixth in terms of the world’s largest global exporters, while Cameroon ranked ninth. Côte d’Ivoire, Liberia, Cameroon, and Nigeria accounted for 91 percent of the total value of SSA exports, while Gabon, Ghana, and Guinea accounted for another 7 percent. Relatively minor differences between production and export statistics indicate very little apparent domestic consumption in any of the SSA producing countries except for Nigeria (36 percent of production) and a minor amount in Côte d’Ivoire (3 percent of production). There is also statistical evidence of domestic consumption in the DRC. Of the SSA countries identified, 94 percent of Côte d’Ivoire’s exports were in solid forms, while 60 percent of Liberia’s exports were in latex forms.101
98 AFP. “Three African Nations Pledge to Double Rubber Production,” July 27, 2007.
http://www.aaalatex.com/content/comments.asp?id=113 (accessed September 1, 2007). 99 Ibid.; and Yann R. Wadjas (factory manager, SIGAL, Côte d’Ivoire), e-mail message to Commission
staff, September 19, 2007. 100 Yann R. Wadjas (factory manager, SIGAL, Côte d’Ivoire), e-mail message to Commission staff,
September 19, 2007. 101 IRSG, Rubber Statistical Bulletin, July/August 2007, tables 7 and 8.
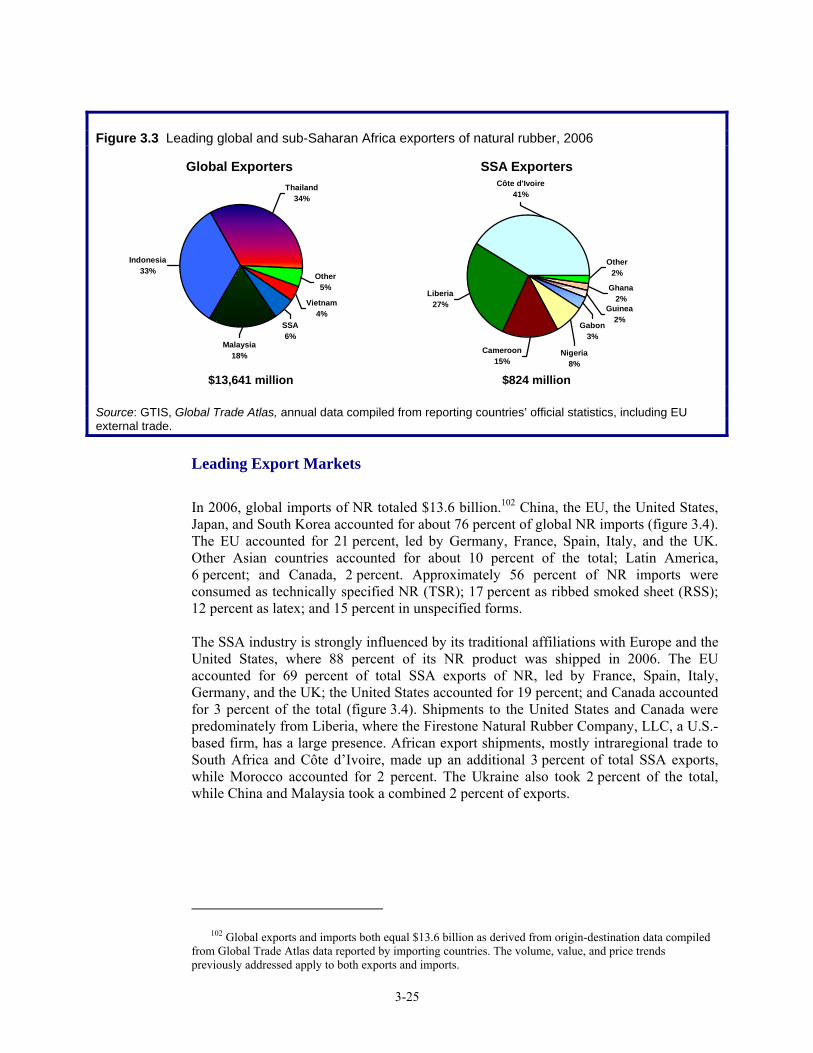
3-25
Figure 3.3 Leading global and sub-Saharan Africa exporters of natural rubber, 2006
Global Exporters
Other5%
Thailand34%
Indonesia33%
SSA6%
Malaysia18%
Vietnam4%
SSA Exporters
Other2%
Côte d'Ivoire41%
Liberia27%
Nigeria8%
Guinea2%
Gabon3%
Ghana2%
Cameroon15%
$13,641 million $824 million Source: GTIS, Global Trade Atlas, annual data compiled from reporting countries’ official statistics, including EU external trade.
Leading Export Markets In 2006, global imports of NR totaled $13.6 billion.102 China, the EU, the United States, Japan, and South Korea accounted for about 76 percent of global NR imports (figure 3.4). The EU accounted for 21 percent, led by Germany, France, Spain, Italy, and the UK. Other Asian countries accounted for about 10 percent of the total; Latin America, 6 percent; and Canada, 2 percent. Approximately 56 percent of NR imports were consumed as technically specified NR (TSR); 17 percent as ribbed smoked sheet (RSS); 12 percent as latex; and 15 percent in unspecified forms. The SSA industry is strongly influenced by its traditional affiliations with Europe and the United States, where 88 percent of its NR product was shipped in 2006. The EU accounted for 69 percent of total SSA exports of NR, led by France, Spain, Italy, Germany, and the UK; the United States accounted for 19 percent; and Canada accounted for 3 percent of the total (figure 3.4). Shipments to the United States and Canada were predominately from Liberia, where the Firestone Natural Rubber Company, LLC, a U.S.-based firm, has a large presence. African export shipments, mostly intraregional trade to South Africa and Côte d’Ivoire, made up an additional 3 percent of total SSA exports, while Morocco accounted for 2 percent. The Ukraine also took 2 percent of the total, while China and Malaysia took a combined 2 percent of exports.
102 Global exports and imports both equal $13.6 billion as derived from origin-destination data compiled
from Global Trade Atlas data reported by importing countries. The volume, value, and price trends previously addressed apply to both exports and imports.
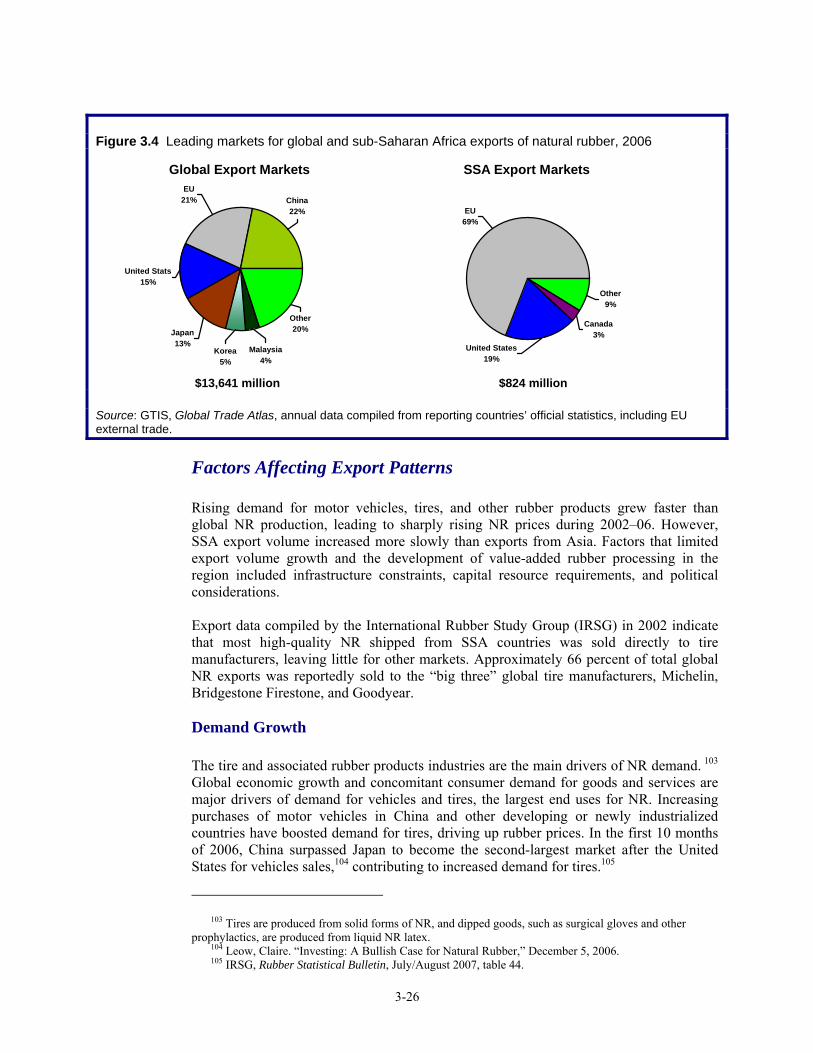
3-26
Figure 3.4 Leading markets for global and sub-Saharan Africa exports of natural rubber, 2006
Global Export Markets
Other20%
China22%
EU21%
United Stats15%
Korea5%
Japan13%
Malaysia4%
SSA Export Markets
United States19%
Other9%
EU69%
Canada3%
$13,641 million $824 million Source: GTIS, Global Trade Atlas, annual data compiled from reporting countries’ official statistics, including EU external trade.
Factors Affecting Export Patterns
Rising demand for motor vehicles, tires, and other rubber products grew faster than global NR production, leading to sharply rising NR prices during 2002–06. However, SSA export volume increased more slowly than exports from Asia. Factors that limited export volume growth and the development of value-added rubber processing in the region included infrastructure constraints, capital resource requirements, and political considerations. Export data compiled by the International Rubber Study Group (IRSG) in 2002 indicate that most high-quality NR shipped from SSA countries was sold directly to tire manufacturers, leaving little for other markets. Approximately 66 percent of total global NR exports was reportedly sold to the “big three” global tire manufacturers, Michelin, Bridgestone Firestone, and Goodyear. Demand Growth The tire and associated rubber products industries are the main drivers of NR demand. 103 Global economic growth and concomitant consumer demand for goods and services are major drivers of demand for vehicles and tires, the largest end uses for NR. Increasing purchases of motor vehicles in China and other developing or newly industrialized countries have boosted demand for tires, driving up rubber prices. In the first 10 months of 2006, China surpassed Japan to become the second-largest market after the United States for vehicles sales,104 contributing to increased demand for tires.105
103 Tires are produced from solid forms of NR, and dipped goods, such as surgical gloves and other
prophylactics, are produced from liquid NR latex. 104 Leow, Claire. “Investing: A Bullish Case for Natural Rubber,” December 5, 2006. 105 IRSG, Rubber Statistical Bulletin, July/August 2007, table 44.
3-27
In addition, global economic growth has created more demand for rubber products. A period of generally depressed NR prices in 2002 was followed by a period of growth, during which prices for ribbed smoked sheet (RSS) on the New York market rising from $907 per mt in 2002 to a record high of $2,904 per mt in June 2006, an increase of 220 percent.106 Global NR production volume increased a more modest 31 percent, from 7.4 million metric tons in 2002 to 9.7 million metric tons in 2006.107 However, because of supply and infrastructure constraints, limited domestic consumption, and political instability in Africa, NR production volume in SSA grew at about one-half of the global NR rate.108 The increase in the price of synthetic rubber also fueled increased demand for NR during 2002–06. Synthetic rubber uses petrochemical feedstocks derived from crude oil, and consumes 3.5 times more oil than is required to produce NR from a renewable resource rubber tree plantation. This dependence on oil has led to a dramatic increase in synthetic rubber prices over the last few years, fueling an increase in demand and prices for NR.109 Prices for natural rubber often track crude oil benchmark prices, which soared to a record high of more than $90 per barrel in November 2007. Officials in Côte d’Ivoire reported that NR has benefited relative to synthetic rubber because of a demand shift created by the high oil prices.110 One industry source predicts that NR prices will continue to rise because economic growth in emerging countries, especially China, is so strong that global supply will lag behind demand.111 Inadequate Infrastructure and Political Instability in SSA Countries Supplying NR Inadequate infrastructure and other supply constraints have hampered SSA suppliers of NR from keeping pace with the growth in exports from other NR supplying regions. Roads, electricity supplies, and communication networks are viewed as inadequate to meet the needs of the NR rubber exporting industry in SSA. Political instability, particularly in Liberia and the DRC, has constrained some SSA suppliers from meeting growing demand for NR. Although a democratic government is now in place in Liberia, the damage to infrastructure and institutions that occurred during and immediately after the civil war (which ended in 2005−06) will likely take years to rebuild. Civil wars in the DRC and Côte d’Ivoire also disrupted NR production during 2002–06. The civil war in the DRC is officially over, although armed conflict in the eastern part of the country has hampered investment. A cease fire in Côte d’Ivoire that began in 2003 offers hope that a more favorable climate for NR investment and production will return.112
106 Ibid., table 48. 107 Ibid., table 7. 108 Ibid. 109 Crawford, “Rubber is Critical, and Vulnerable,” April 16, 2005. 110 Jean-Louis Billon (chairman, Ivorian chamber of commerce and industry), interview by Commission
staff, Abidjan, Côte d’Ivoire, October 24, 2007. 111 Leow, “Investing: A bullish case for natural rubber,” International Herald Tribune, Bloomberg Press,
Jakarta, Indonesia, December 5, 2006. www.iht.com/articles/2006/12/04/bloomberg/bxinvest.php (accessed September 1, 2007).
112 CIA, The World Factbook 2007, May 25, 2007.
3-28
Natural Rubber Bibliography AFP. “Three African Nations Pledge to Double Rubber Production.” http://www.aaalatex.com/content/comments.asp?id=113. (accessed September 1, 2007). CountryWatchForecast. Real Economic Growth Rates: Key Countries: 2002−2006. http://forecast.countrywatch.com/macro/topic.aspx?vcountry=999&t..., (accessed November 28, 2007). Crawford, Dan. Energy Bulletin, “Rubber is Critical, and Vulnerable,” April 16, 2005. www.energybulletin.net/5408.html (accessed September 1, 2007). “Directory of Tire Manufacturers.” Rubber & Plastics News, May−October, 2007. http://www.rubbernews.com. Emerging Capital Partners, “Emerging Capital Partners Sells Stake in African Natural Rubber Company for 3.4x Initial Investment,” July 23, 2007. www.ecpinvestments.com/news/1512.xml (accessed August 24, 2007). Firestone Natural Rubber Company, LLC. www.firestonenaturalrubber.com (accessed various dates, 2007). Global Trade Information Services, Inc. (GTIS), Global Trade Atlas. Annual data compiled from reporting countries’ official statistics, including EU27 external trade. http://www.gtis.com/gta/usitc (accessed various dates). International Rubber Study Group (IRSG), Rubber Statistical Bulletin, July/August 2007. Jones, Leroy P., Yahya Jammal, and Nilgun Gokgur. “Impact of Privatization in Côte d’Ivoire.” Boston Institute for Developing Economies (BIDE), III-1-43, 2002. http://rru.worldbank.org/Documents/PapersLinks/privatization_Côte_d_ivoire.pdf, (accessed September 1, 2007). Jubah, K. “Natural Rubber Industry of Liberia.” April 5, 2007. http://www.africacncl.org/Events/downloads/Mr._Keith_Jubah.pdf. Leow, Claire. “Investing: A bullish case for natural rubber.” International Herald Tribune, Bloomberg Press, Jakarta, Indonesia, December 5, 2006. www.iht.com/articles/2006/12/04/bloomberg/bxinvest.php. (accessed September 1, 2007). Michelin Annual Report 2006. www.michelin.com (accessed August 30, 2007). Nigeria Commerce. “Rubber and Rubber Products,” http://www.commerce44ng.org/commerce/index.php?option=com_content&t (accessed August 30, 2007).
3-29
Technical Centre for Agricultural and Rural Cooperation ACP-EU, “Natural Rubber Springs Back,” April 2007. http://www.cta.int/ (accessed September 1, 2007). “The African Rubber Industry,” Secretariat Conference Paper 2002B, International Rubber Study Group (IRSG), September 2002. U.S. Central Intelligence Agency (CIA): The World Factbook 2007, May 25, 2007. https://www.cia.gov/library/publications/the-world-factbook/index.html. Wikipedia, “Para Rubber Tree,” http://en.wikipedia.org/wiki/Rubber_tree (accessed September 1, 2007).
3-30
Processed Diamonds
Summary of Findings
Global price increases driven by strong consumer demand for polished diamonds was the key factor contributing to the export growth of processed diamonds (box 3.5) from SSA during 2002−06. Other contributing factors were investment in new diamond-processing facilities, and programs by some SSA governments and international organizations to promote beneficiation, or the downstream processing of rough diamonds. These principal factors led to increased production and exports by small but growing producers such as Botswana, Namibia, and Angola. The Kimberly Process Certification Scheme (KPCS) has helped to maintain consumer confidence in diamonds originating from the SSA diamond industry, thereby limiting any negative perception or impact on its exports of processed diamonds.
The value of SSA exports of processed diamonds increased steadily during 2002–06. However, volume (as measured in carats) likely decreased during this period. Exports from South Africa, which make up the vast majority of SSA exports of processed diamonds, increased from $465 million in 2002 to $664 million in 2006, or by 43 percent. Botswana, Mauritius, and Namibia also showed gains during the period.113
Industry Overview
Over one-half of the world’s diamonds are mined in Africa, with four SSA countries—Botswana, South Africa, Angola, and Namibia—contributing the bulk of the production and trade. However, with the exception of South Africa (and to a much lesser extent Mauritius), SSA countries have not been significantly engaged in diamond processing and other value-added activities (diamond cutting and polishing), which were principally
113 GTIS, Global Trade Atlas.
Box 3.5 Product description for processed diamonds As a mineral (rather than a rock) due to its isometric (cubic) crystal structure, diamond is a form of pure carbon characterized by extreme hardness. Rough diamonds are mined from both primary and secondary deposits. SSA is the world’s leading source of rough diamonds. The steps to transform a rough diamond into a processed one involve sawing or cleaving, grinding (bruting), and cutting and polishing, all steps requiring much experience. Initial shaping and sizing of the diamond is now generally done by sawing with a diamond-impregnated circular saw, rather than the older cleaving method of tapping a chisel held against the diamond. The diamond is further rough-shaped by grinding it against another diamond. To cut and polish the facets, the diamond is cemented to a holder and held against a high-speed horizontal wheel (rotating at about 1,800 to 3,000 r.p.m.) that is covered with a mixture of diamond dust and lubricating oil. Despite the high degree of mechanization, the cutting of angled facets is still ultimately guided by the cutter’s experienced eye. The loss of material throughout the grinding, cutting, and polishing processes can amount to about 50 to 60 percent of the original rough diamond. Rough diamonds can have a greasy luster before processing, but cut diamonds are usually colorless, with some being tinged with various colors, most commonly yellow. Source: Schumann, Gemstones of the World, 1986.
3-31
done in overseas locales.114 Nonetheless, in recent years, some SSA countries in addition to South Africa (notably Angola, Botswana, Namibia, and Mauritius) have taken steps to add value to their rough diamonds and boost domestic revenue and employment. Processed diamonds are used primarily in jewelry manufacturing to make items such as rings, necklaces, bracelets, pins, and earrings (box 3.6).115 During 2002−06, shifts in the SSA diamond-processing industry and exports were differentiated between the more established industry in South Africa, which currently dominates SSA production, and the newer developing industries in Angola, Botswana, and Namibia. Although one company, De Beers,116 continues to control or influence virtually all aspects of SSA diamond operations, Angola and Namibia have become notable exceptions by also relying on other outside foreign investment in their diamond-processing operations. South Africa, the oldest rough diamond producer in the region, was also the first to establish a diamond-cutting and polishing industry. Due to efforts by the government, De Beers, and many firms in the diamond cutting and diamond retail sectors, a slow but steady increase in South Africa’s production of processed diamonds has occurred since the mid-1990s. By 2005, in addition to the 13,000 employed in South Africa’s diamond mines, another 300 people were employed in sorting and valuing activities for De Beers in Kimberly, and some 2,100 people were employed in diamond cutting and polishing in about 20 major factories and over 100 small-scale cutting operations.117 Safdio RSA Diamond Cutting factory is one of the largest South African factories and is located in the heart of Johannesburg’s diamond district. It opened in 1985, and currently has a highly skilled workforce of more than 200 artisans. The operation includes the grading of rough diamonds, followed by sawing, cutting, and final polishing. The factory specializes in “perfect makes” and “fancy yellow”, many of which are prepared for the prestigious Graff collection.118 These South African polished exports compete favorably with products from Antwerp, New York City, and Tel Aviv. The Harry Oppenheimer Training School, a diamond-cutting school operated by De Beers and the Diamond Foundation of South Africa, is also located in Johannesburg.
114 The cutting and polishing of rough diamonds is a specialized skill that is concentrated in a limited
number of locations worldwide. Traditional diamond-processing (cutting/polishing) and trade centers are in Israel, India, Belgium, and the United States. Recently, China and Thailand have become established diamond-cutting centers. Cutting centers with lower costs of labor, notably Surat in Gujarat, India, handle a larger number of smaller carat diamonds. India has the largest cutting and polishing industry in the world, employing over a million people. It is the leading center in terms of value added, accounting for over 50 percent of cutting and polishing by value; 80 percent by carat weight; and 95 percent in terms of pieces of global cut and polished diamond production.
115 The USTR requested coverage of the SSA industries engaged in jewelry production and downstream diamond processing. However, since SSA export values of processed diamonds are much greater than the exports of jewelry, this analysis focuses on processed diamonds.
116 For the past century, De Beers has dominated the global diamond trade. De Beers, with annual sales of more than $6 billion, accounts for around 40 percent of the world’s production of rough diamonds. De Beers S.A. is the holding company of the De Beers mining interests around the world. It oversees De Beers Consolidated Mines (DBCM, mining, South Africa) and The Diamond Trading Company (DTC), the marketing arm of De Beers. It also controls the De Beers diamond mining interests with the governments of Botswana and Namibia.
117 Mining Review Africa, “Diamond Beneficiation in South Africa,” 2005. 118 The House of Graff reportedly is synonymous with the most prestigious diamonds in the world,
representing rarity, beauty, and the highest quality and craftsmanship.
3-32
Although labor costs are reportedly never more than 10 percent of the final cost of the processed diamond,119 they do factor into the competitiveness of various countries and the types of diamonds processed in those countries. In South Africa, because skilled labor is in relatively short supply, the estimated labor cost of cutting and polishing diamonds is $55 to $75 a carat. This compares with $75 per carat in Belgium; $100 to
119 Ernest Bloom (president, World Federation of Diamond Bourses), interview by Commission staff,
Johannesburg, South Africa, October 30, 2007.
Box 3.6 Precious-metal jewelry
An established and growing processed-diamond industry in the SSA countries could also contribute to growth in the value-added precious-metal jewelry industry by increasing the availability of diamonds to the domestic jewelry industry. Exports of precious-metal jewelry from the SSA countries totaled $163.7 million in 2006, representing a 38-percent gain over 2002. Leading SSA exporters were South Africa, with $97.1 million (58 percent of SSA exports) and Mauritius, $56.7 million (35 percent of SSA exports).1 The major factor affecting this trade pattern was the substantial annual increase in the global price of gold, as well as government programs to support the industry in South Africa. The United States accounted for half ($82.6 million) of total SSA exports in 2006, followed by France, which made up 28 percent ($45.1 million). Reflecting growing regional trade, two percent ($2.6 million) went to South Africa. The SSA countries represented roughly one percent of global exports of precious-metal jewelry in 2006. South Africa is the leading producer of precious-metal jewelry in SSA. South Africa has a small but well-established jewelry-manufacturing sector, producing a wide variety of precious-metal jewelry items, ranging from mass production items to individual pieces. South Africa’s jewelry production is located primarily in the Gauteng and Western Cape provinces, although there are also important manufacturing centers in the Durban/Pietermaritzburg (Kwazulu Natal) and Bloemfontein (Free State) areas. The precious-metal jewelry industry in South Africa consists of about 350 manufacturing concerns, ranging from large manufacturers employing several hundred employees to smaller studios specializing in high value-added “designer” pieces. Total jewelry manufacturing employment is estimated at 3,000. A large portion of South Africa’s manufactured jewelry is sold locally; approximately 20 percent of production is exported.2 Gold chain is the largest export jewelry item. Reportedly, much of the gold is locally sourced.3
As with the processed diamonds sector, the jewelry industry was targeted by the South African government as a priority sector to increase the country’s production of value-added products. The Precious Metals Act of 2005, for example, amended portions of the Mining Rights Act of 1967 to eliminate the barriers to local beneficiation of precious metals and to rationalize the regulation of matters pertaining to the downstream development of precious metals. The objectives of the Act include: (1) to allow for the acquisition and possession of precious metals for local beneficiation; (2) to regulate the precious metal industry; (3) to repeal earlier legislation that had created barriers to beneficiation; and (4) to amend the over-regulation of the industry by centralizing the issuing of jewelers’ permits within the Department of Minerals and Energy.4 The continuing growth of the precious-metal industry will also depend on the success of the Mineral Policy and Promotion Branch’s numerous ministerial projects, two of which are the ATA Carnet System,5 and the Industrial Development Zone (IDZ) Jewelry Manufacturing Precinct (JMP) at the Johannesburg International Airport.6 Tariff preferences under the African Growth and Opportunity Act (AGOA)7 have been credited with drawing foreign investment to the South African jewelry industry.8 The MFN duties in the U.S. on gold jewelry range from five percent to seven percent. ____________
1 GTIS, Global Trade Atlas. 2 MBendi, “South Africa Manufacturing: Jewelry and Watch Manufacturing,” 2007. 3 Lorens Mare (The Jewelry Council of South Africa), interview by Commission staff, Pretoria, South Africa, October 31,
2007. 4 “Mineral policy development,” The Department of Minerals and Metals (DME), Republic of South Africa.
http://www.dme.gov.za/minerals/min_pol_development.stm (accessed February, 7, 2008). 5 The ATA Carnet system is a means of facilitating international trade and streamlining customs procedures for local
jewelers wishing to export their goods temporarily, e.g., to show their products in foreign markets. One benefit to the system is the ATA Carnet eliminates VAT payments and customs duties on their return.
6 The IDZ is specifically designed for the manufacture and export of jewelry products. 7 AGOA became effective May 18, 2000, and offers incentives for African countries to continue their efforts to open their
economies and build free markets. The AGOA Acceleration Act of 2004 extended preferential access for imports from beneficiary SSA countries until 2015.
8 Lorens Mare (The Jewellery Council of South Africa), interview by Commission staff, Pretoria, South Africa, October 31, 2007.
3-33
$110 in the United States; $18 to $25 in China; and $12 in India.120 South African (and generally SSA) diamond-processing producers tend to cut and polish larger/higher-value diamonds than those processed in India and China due to higher South African labor costs. There are two major diamond-processing factories in Mauritius. Mauriden Ltd, owned by a U.S. investor, was one of the first companies to operate in the country’s EPZ more than 30 years ago. It is involved in diamond cutting and polishing as well as jewelry production and sales. The other factory is Floreal Diamond Cutting Ltd, which was established in 2001, and is managed by a former employee of Mauriden. In 2006, Mauritius imported about $44 million worth of diamonds, mostly rough, primarily from Belgium and the United States. Once the diamonds are cut and polished, they are re-exported to their principal markets (Belgium, United States, South Africa, and Australia).121 In contrast to the relatively large and established diamond-processing industry in South Africa and Mauritius, the industry in Angola, Botswana, and Namibia is small and developing. Namibia reportedly operates about eight factories that compete with low-cost cutting centers in India and China and with highly skilled ones in Antwerp, New York, and Tel Aviv. These factories employ approximately 800 workers.122 The Namibian industry nearly tripled in size during 2002−06. The Namibian factories are not primarily cutting diamonds mined in Namibia. Namdeb,123 Nambia’s diamond mining company, has a marketing agreement with the Diamond Trading Company (DTC), the marketing arm of De Beers’s, whereby 100 percent of its rough diamonds are exported to London. Some of the factories in Namibia are owned or supplied by De Beers’s clients. These clients buy parcels of rough diamonds from the DTC in London that are comprised of rough diamonds that also originate from Botswana, Russia, Tanzania, and South Africa. The rough diamonds that are shipped back to Namibia are unlikely to contain more than a small percent of Namibian stones.124 One of the most important developments for SSA governments and the diamond industry in general is the KPCS, which seeks to bring accountability to the global supply of rough diamonds. The KPCS has been credited for allowing SSA and the SSA diamond industry to portray a positive image, and to increase the value of their diamonds. The KPCS has helped to maintain consumer confidence in diamonds originating from the SSA diamond industry, thereby limiting any negative perception or impact on its exports of processed diamonds (box 3.7).
120 Broadman, Africa’s Silk Road, 2007. 121 U.S. Department of State; U.S. Embassy, Port Louis. “USITC Study on sub-Saharan Africa;
information on Mauritius and Seychelles (PORT L 000448),” August 23, 2007. 122 Boer, Managing Diamond Dependency, April 2004. 123 In 1994, De Beers operations in Namibia were renamed Namdeb Diamond Corporation (Namdeb),
and it became a 50-50 joint venture with the Government of the Republic of Namibia. 124 Boer, Managing Diamond Dependency, April 2004.
3-34
Sub-Saharan Africa Trade in the Global Context
Leading Exporters Israel, India, and Belgium are the world’s major diamond-cutting and trading centers and the leading global exporters of processed diamonds. Reportedly, all three countries produce high-quality finished diamonds. India specializes in processing more labor-intensive, small-carat diamonds used in less expensive gold jewelry inlaid with diamonds, jewelry which is typically produced in India and China. Higher-carat diamonds processed in Belgium and Israel are used in more expensive, higher-quality gold jewelry, which is typically produced in the EU and the United States. Traditionally, the leading producers and exporters of processed diamonds have not been countries with natural diamond deposits. Rather, they have imported the rough diamonds.125 Despite the abundant natural deposits of rough diamonds in certain SSA countries, these SSA countries remain small players in the global context of trade in processed diamonds. Unprocessed (rough) diamonds, which have lower prices on world markets, continue to make up the bulk of SSA diamond exports. SSA is estimated to produce over 75 percent (in value) of the world’s rough diamonds, worth about $15.8 billion.126 By comparison, processed diamonds from SSA make up an estimated 4 percent ($1 billion) of the global market.127 Nevertheless, SSA exports of processed diamonds in recent years have grown steadily. South Africa, Botswana, Mauritius, and Namibia, were the four SSA countries that have made the greatest gains in increasing value-added diamond processing operations (tables 3.3 and 3.4). South Africa accounted for most of the SSA exports, with
125 Manduna, “Assessing the Causes of Sub-Saharan Africa’s Declining Exports,” May 2005. 126 MBendi, “Africa: Mining-Diamond Mining, Overview,” November 29, 2006. 127 Estimated by Commission staff from GTIS, Global Trade Information Services, Inc.
Box 3.7 The Kimberley Process Certification Scheme (KPCS) __ This process began in 2000 as an effort by diamond-producing countries in Africa to prevent “conflict diamonds” from entering the market. The initiative now includes 74 countries that are involved in the production and trade of diamonds. The members are obliged to provide each other with statistics on their diamond production, making it easier to trace and eliminate so-called “blood diamonds”1 from legitimate trade. Reportedly, Botswana’s Diamond Cutting Act, in conjunction with the KPCS, requires every polishing factory in Botswana to keep records of its trade in rough and polished diamonds and submit them to the Mining Commissioner each month. Companies must record their imports of rough diamonds, details of the manufacture of cut and polished stones, and the remaining and residual rough diamonds for export. These figures are checked against agreed parameters on loss through the cutting and polish process. However, because the KPCS is essentially self-enforced, many factors can jeopardize certification, from lack of enforcement on the ground to the commercial secrecy in the diamond trading centers such as Antwerp. Industry sources indicate that the KPCS provides legitimacy to SSA diamonds and access to the global diamond market, and simultaneously makes a positive contribution toward the local economy and the curbing of illicit and conflict diamonds. Source: Kimberley Process Update, “Combating Conflict Diamonds,” November 2006. ____________
1 Blood diamonds which are also called conflict diamonds, dirty diamonds, or war diamonds, refer to diamonds mined in a war zone and sold, usually clandestinely, in order to finance an insurgency or invading army’s war efforts.
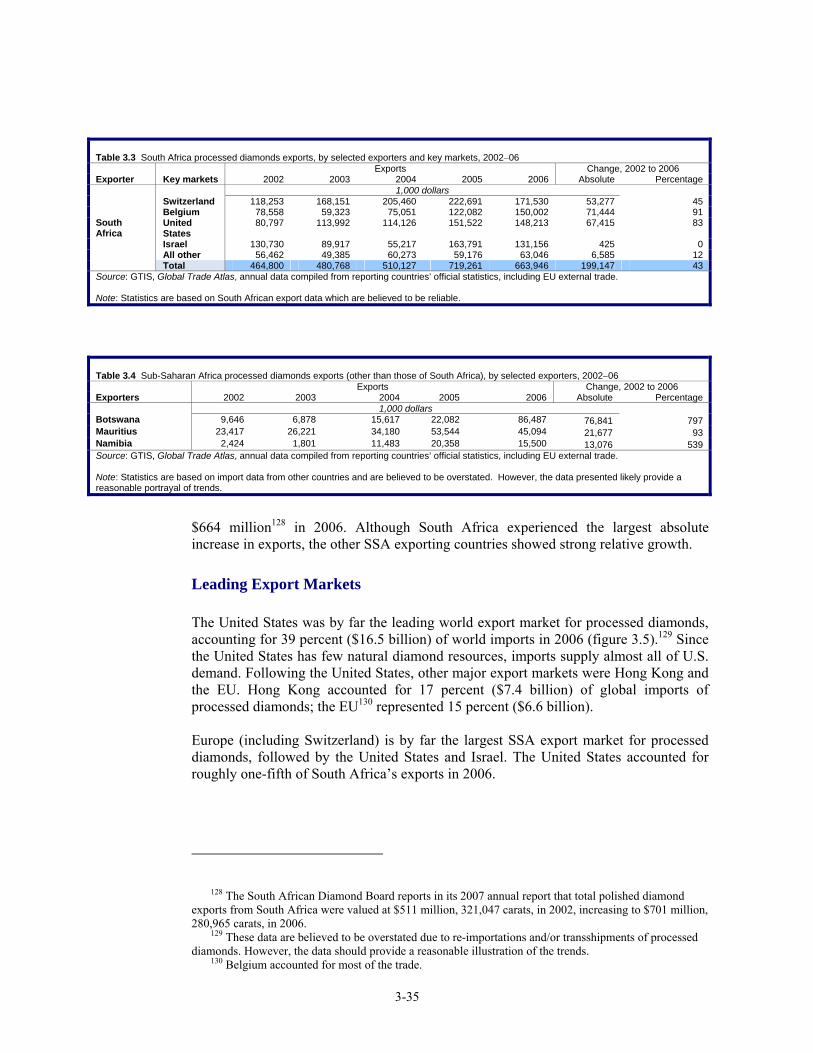
3-35
$664 million128 in 2006. Although South Africa experienced the largest absolute increase in exports, the other SSA exporting countries showed strong relative growth. Leading Export Markets The United States was by far the leading world export market for processed diamonds, accounting for 39 percent ($16.5 billion) of world imports in 2006 (figure 3.5).129 Since the United States has few natural diamond resources, imports supply almost all of U.S. demand. Following the United States, other major export markets were Hong Kong and the EU. Hong Kong accounted for 17 percent ($7.4 billion) of global imports of processed diamonds; the EU130 represented 15 percent ($6.6 billion). Europe (including Switzerland) is by far the largest SSA export market for processed diamonds, followed by the United States and Israel. The United States accounted for roughly one-fifth of South Africa’s exports in 2006.
128 The South African Diamond Board reports in its 2007 annual report that total polished diamond
exports from South Africa were valued at $511 million, 321,047 carats, in 2002, increasing to $701 million, 280,965 carats, in 2006.
129 These data are believed to be overstated due to re-importations and/or transshipments of processed diamonds. However, the data should provide a reasonable illustration of the trends.
130 Belgium accounted for most of the trade.
Table 3.3 South Africa processed diamonds exports, by selected exporters and key markets, 2002−06 Exports Change, 2002 to 2006 Exporter Key markets 2002 2003 2004 2005 2006 Absolute Percentage 1,000 dollars
Switzerland 118,253 168,151 205,460 222,691 171,530 53,277 45 Belgium 78,558 59,323 75,051 122,082 150,002 71,444 91 United States
80,797 113,992 114,126 151,522 148,213 67,415 83
Israel 130,730 89,917 55,217 163,791 131,156 425 0 All other 56,462 49,385 60,273 59,176 63,046 6,585 12
South Africa
Total 464,800 480,768 510,127 719,261 663,946 199,147 43 Source: GTIS, Global Trade Atlas, annual data compiled from reporting countries’ official statistics, including EU external trade. Note: Statistics are based on South African export data which are believed to be reliable.
Table 3.4 Sub-Saharan Africa processed diamonds exports (other than those of South Africa), by selected exporters, 2002−06 Exports Change, 2002 to 2006 Exporters 2002 2003 2004 2005 2006 Absolute Percentage 1,000 dollars Botswana 9,646 6,878 15,617 22,082 86,487 76,841 797 Mauritius 23,417 26,221 34,180 53,544 45,094 21,677 93 Namibia 2,424 1,801 11,483 20,358 15,500 13,076 539 Source: GTIS, Global Trade Atlas, annual data compiled from reporting countries’ official statistics, including EU external trade. Note: Statistics are based on import data from other countries and are believed to be overstated. However, the data presented likely provide a reasonable portrayal of trends.
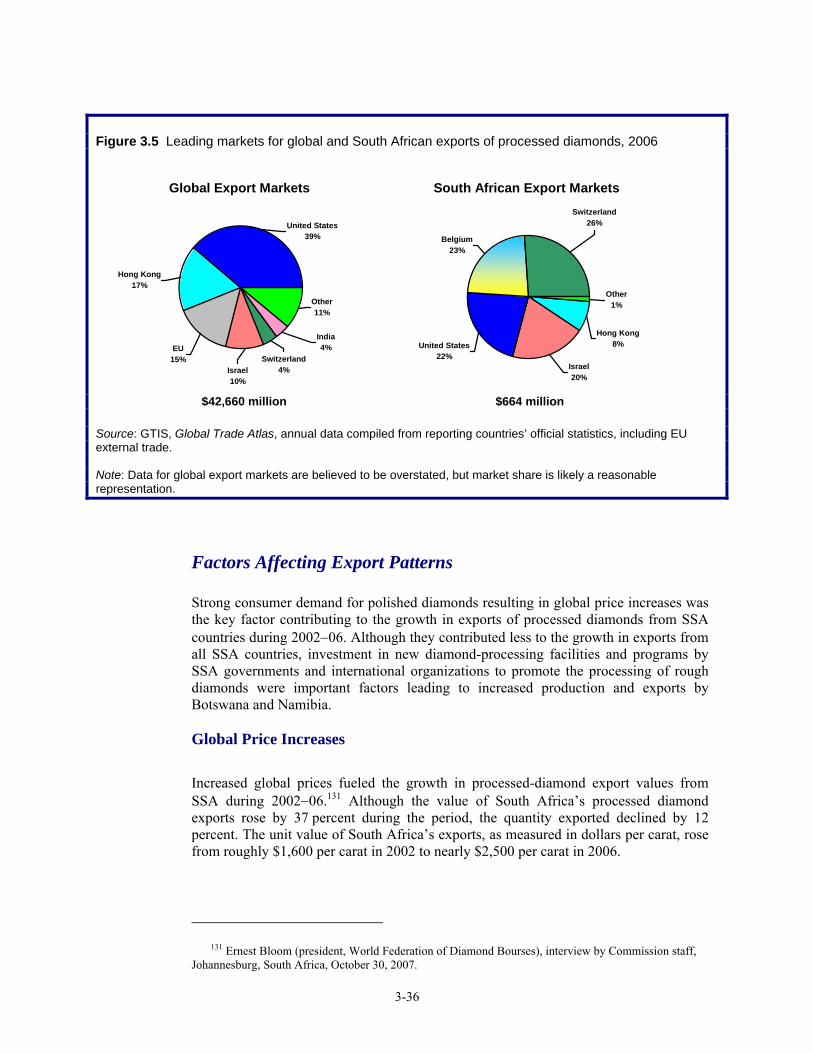
3-36
Figure 3.5 Leading markets for global and South African exports of processed diamonds, 2006
Global Export Markets
United States39%
Hong Kong17%
EU15%
Israel10%
India4%
Switzerland4%
Other11%
South African Export Markets
Other1%
Switzerland26%
Hong Kong8%United States
22%Israel20%
Belgium23%
$42,660 million $664 million Source: GTIS, Global Trade Atlas, annual data compiled from reporting countries’ official statistics, including EU external trade. Note: Data for global export markets are believed to be overstated, but market share is likely a reasonable representation.
Factors Affecting Export Patterns
Strong consumer demand for polished diamonds resulting in global price increases was the key factor contributing to the growth in exports of processed diamonds from SSA countries during 2002−06. Although they contributed less to the growth in exports from all SSA countries, investment in new diamond-processing facilities and programs by SSA governments and international organizations to promote the processing of rough diamonds were important factors leading to increased production and exports by Botswana and Namibia. Global Price Increases Increased global prices fueled the growth in processed-diamond export values from SSA during 2002−06.131 Although the value of South Africa’s processed diamond exports rose by 37 percent during the period, the quantity exported declined by 12 percent. The unit value of South Africa’s exports, as measured in dollars per carat, rose from roughly $1,600 per carat in 2002 to nearly $2,500 per carat in 2006.
131 Ernest Bloom (president, World Federation of Diamond Bourses), interview by Commission staff,
Johannesburg, South Africa, October 30, 2007.
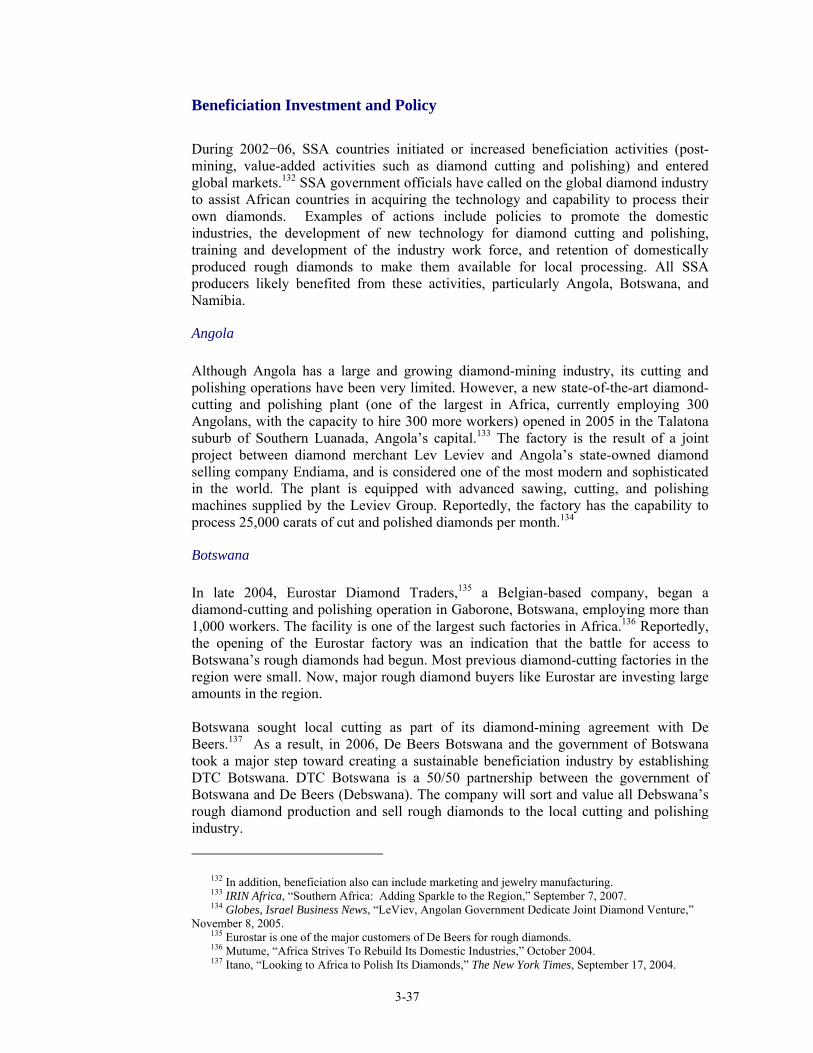
3-37
Beneficiation Investment and Policy During 2002−06, SSA countries initiated or increased beneficiation activities (post-mining, value-added activities such as diamond cutting and polishing) and entered global markets.132 SSA government officials have called on the global diamond industry to assist African countries in acquiring the technology and capability to process their own diamonds. Examples of actions include policies to promote the domestic industries, the development of new technology for diamond cutting and polishing, training and development of the industry work force, and retention of domestically produced rough diamonds to make them available for local processing. All SSA producers likely benefited from these activities, particularly Angola, Botswana, and Namibia.
Angola
Although Angola has a large and growing diamond-mining industry, its cutting and polishing operations have been very limited. However, a new state-of-the-art diamond-cutting and polishing plant (one of the largest in Africa, currently employing 300 Angolans, with the capacity to hire 300 more workers) opened in 2005 in the Talatona suburb of Southern Luanada, Angola’s capital.133 The factory is the result of a joint project between diamond merchant Lev Leviev and Angola’s state-owned diamond selling company Endiama, and is considered one of the most modern and sophisticated in the world. The plant is equipped with advanced sawing, cutting, and polishing machines supplied by the Leviev Group. Reportedly, the factory has the capability to process 25,000 carats of cut and polished diamonds per month.134
Botswana
In late 2004, Eurostar Diamond Traders,135 a Belgian-based company, began a diamond-cutting and polishing operation in Gaborone, Botswana, employing more than 1,000 workers. The facility is one of the largest such factories in Africa.136 Reportedly, the opening of the Eurostar factory was an indication that the battle for access to Botswana’s rough diamonds had begun. Most previous diamond-cutting factories in the region were small. Now, major rough diamond buyers like Eurostar are investing large amounts in the region. Botswana sought local cutting as part of its diamond-mining agreement with De Beers.137 As a result, in 2006, De Beers Botswana and the government of Botswana took a major step toward creating a sustainable beneficiation industry by establishing DTC Botswana. DTC Botswana is a 50/50 partnership between the government of Botswana and De Beers (Debswana). The company will sort and value all Debswana’s rough diamond production and sell rough diamonds to the local cutting and polishing industry.
132 In addition, beneficiation also can include marketing and jewelry manufacturing. 133 IRIN Africa, “Southern Africa: Adding Sparkle to the Region,” September 7, 2007. 134 Globes, Israel Business News, “LeViev, Angolan Government Dedicate Joint Diamond Venture,”
November 8, 2005. 135 Eurostar is one of the major customers of De Beers for rough diamonds. 136 Mutume, “Africa Strives To Rebuild Its Domestic Industries,” October 2004. 137 Itano, “Looking to Africa to Polish Its Diamonds,” The New York Times, September 17, 2004.
3-38
The opening and success of the planned $83 million DTC (Diamond Trade Center) Botswana in 2008 is likely to have a significant effect on SSA’s future global role in the diamond-processing industry. The DTC Botswana reportedly will create over 3,000 jobs in downstream diamond-related activities alone, representing an increase of about 30 percent in diamond-related employment levels in Botswana, and an increase of about 10 percent in the manufacturing sector, including expansion of jewelry manufacturing.138 In addition, in 2007, a $3 million diamond-polishing factory was opened in Botswana.139
Namibia
The Namibian government has been actively engaged in efforts to foster a diamond cutting and polishing manufacturing industry for export. The government has offered incentives in the form of Export Processing Zone status, whereby taxes and duties are waived, and training grants are provided. In an effort to break the South African market concentration, several diamond-trading companies have established polishing plants in Namibia. In June 2004, Israel-based Lev Leviev Diamonds (LLD Diamonds), the second-largest diamond trader in the world,140 opened a diamond-polishing factory in Namibia, employing 550 workers. LLD Diamonds can produce as many as 150,000 carats of cut and polished diamonds annually. Lev Leviev141 has expressed a desire to help the economy in SSA and wants to continue to expand value-added processing where the diamonds are mined.142 Namibia is the only SSA country where De Beers’s operations include cutting and polishing, through the Namdeb subsidiary of NamGem. With 129 workers, NamGem is a major source of employment for the town of Okahandja. In 2005, NamGem increased production by 42 percent over 2004. In 2005, NamGem diamonds were made available to a number of local retail and jewelry outlets, thereby further fostering value-added operations developing in Namibia.143 Going forward, Namibia likely will see an upsurge in the opening of processing factories as the Ministry of Mines and Energy registered 20 licenses for cutting and polishing early in 2007; six of the approved licensees are already in operation. Beneficiation in Namibia may further benefit from De Beers’s announcement in September 2007 that it would supply up to $300 million worth of rough diamonds to Namibia by 2009.144
138 The DTC Botswana will be the world’s largest and most modern individual diamond-processing
facility. 139 De Beers, “Investing in the Future, Economics,” Supply Chain Value Creation: Case Study-
Establishment of DEC Botswana, 2007. 140 The Leviev Group, a major competitor to De Beers, has diamond-polishing plants in Russia, India,
China, South Africa, Ukraine, and Armenia. 141 Lev Leviev, an Israeli born businessman now living in the United Kingdom, controls global
operations that cut and polish more diamonds than anyone else in the world. And, according to the New York Times, since 1996 he has invested millions of dollars in the diamond concessions in Angola and Namibia.
142 Weildlich, “Africa Taking Its Diamond Cut,” November 6, 2005. 143 De Beers, “Investing in the Future, Economics,” Supply Chain Value Creation: Case Study-
Establishment of DEC Botswana, 2007. 144 The Norwegian Council in Africa, “Namibia: Diamond Rush,” October 6, 2007.
3-39
South Africa
In August 2006, diamond cutting/polishing operations were established in Pelindaba in northwest South Africa. Production in Pelindaba is intended to reach 18,000 carats per month with custom-built facilities covering 30,000 square meters. The operation falls under the Calibrated Diamonds Project, which focuses on cutting and polishing of diamonds with leading technology developed in South Africa that reduces production-related product loss from 40 percent to less than 10 percent.145 The Calibrated Diamonds Project, valued at nearly $15 million, has the potential to create at least 400 businesses in cutting and polishing operations.146
Other Efforts to Facilitate SSA Beneficiation
In 2005, the Overseas Private Investment Corporation (OPIC)147 entered into a partnership with the South African government, Lazare Kaplan International Inc. (LKI), and Nozala Diamonds, a cutting factory in South Africa (a joint venture between Lazare Kaplon and a South African women’s empowerment group) to facilitate diamond beneficiation projects in Angola, Botswana, Namibia, and South Africa. LKI is engaged in the cutting, polishing, and sales of diamonds internationally. The joint venture is designed to make it possible for SSA to “go downstream.” Beginning in 2006, SSA countries have also begun to develop new organizations designed to expand beneficiation through investment in new processing facilities. The African Countries Diamond Producers Association (ADPA), formed in November 2006, is an organization designed to strengthen Africa’s influence on the world diamond market as well as harmonize legislation and encourage foreign investment in the industry. A main concern is the continued illegal sale of blood diamonds. The Diamond Empowerment Fund (D.E.F.TM) was established in December 2006. The mission of the D.E.F.TM is to raise money for the development and empowerment of people and communities in African countries where diamonds are a natural resource. This non-profit organization is involved in the advancement of the processed-diamond sector. In addition, in 2006, Petra Diamonds, a pan-African diamond mining company began pursuing a strategy of acquiring facilities to cut and polish their own rough diamond production (box 3.8).
145 Calibrated Diamonds’ proprietary laser-cutting process has significant advantages over traditional cutting and polishing methodology, producing stones to a very high and consistent standard. Reportedly, Calibrated Diamonds’ cut and polished stones are a premium product producing the highly sought after “hearts and arrows” (style of cut used for round brilliant diamonds) quality, which is rarely achieved by conventional means.
146 Diamond Intelligence Brief, “Polishing Operations Established in Pelindaba Under the Calibrated Diamonds Project,” June 13, 2006, 3957(1).
147 OPIC is a U.S. government agency that supports economic development by promoting U.S. private investment in developing countries.
3-40
Box 3.8 Petra Diamonds’ for SSA beneficiation Another factor that will contribute to the continuing growing capacity of the SSA diamond-cutting and polishing industry is the regional expansion of Petra Diamonds1 from solely rough diamond mining into the beneficiation of diamonds in SSA countries. In November 2006, Petra made a strategic move into the diamond cutting and polishing industry with the acquisition of Calibrated Diamonds Investments Holding Limited (“Calibrated Diamonds”). This acquisition gives Petra the in-house capability to cut and polish its own rough diamond production, which in turn will directly affect Petra’s bottom line given the value added in a polished stone compared to the rough form. Construction of diamond cutting and polishing facilities is underway, and it is expected that an additional 2,500 carats per month of rough diamonds will be processed in the region by mid-2008.2
____________
1 Petra Diamonds is a pan-African diamond mining company with operations in South Africa, Angola, Botswana, and Sierra Leone. Petra has grown significantly over the last few years to be the largest diamond company quoted on London’s Alternative Investment Market (AIM) market. Petra is the second largest producer of diamonds after De Beers. 2 Petra Diamonds Ltd, “Current Operations,” Calibrated Diamonds, 2007.
3-41
Processed Diamonds Bibliography
Boer, Martin. Managing Diamond Dependency: Should Namibia Risk More to Gain More? Research Report no. 6, April 2004. http://www.miningnorth.com/Namibia (accessed October 11, 2007). Broadman, Harry G. Africa’s Silk Road, China and India’s New Economic Frontier. Washington, DC: The World Bank, 2007. De Beers. “Investing in the Future, Economics.” Supply Chain Value Creation: Case Study- Establishment of DTC Botswana, 2007. http://www.debeersgroup.com/debeersweb/Investing+in=the=Future/Economics/Supply+ chain=value=creation.htm (accessed October 10, 2007). Diamonds and Gems. “De Beers Burns, Southern African Diamond Producing Countries Smile,” April 23, 2007. Diamond Intelligence Brief. “Polishing Operations Established in Pelindaba Under the Calibrated Diamonds Project,” June 13, 2006. http://w3.nexis.com/new/delivery/PrintDoc.do?fileSize=23717&jobHandle+1861%3A391 (accessed July 24, 2007). Global Trade Information Services, Inc. (GTIS). Global Trade Atlas. Annual data compiled from reporting countries’ official statistics, including EU27 external trade. http://www.gtis.com/gta/usitc/ (accessed various dates). Globes, Israel Business News, “LeViev, Angolan Government Dedicate Joint Diamond Venture,” November 8, 2005. http://w3.nexis.com/new/delivery/PrintDoc.do?fileSize=23717&jobHandle=1861%3A391 (accessed July 24, 2007). Hill, Matthew. “State, Diamond Cutters at Odds Over Gem Supply.” Mining Weekly, October 3, 2007. http://www.miningweekly.co.za/article.php?a_id+118211 (accessed October 11, 2007). IRIN Africa. “Southern Africa: Adding Sparkle to the Region,” September 7, 2007. Israeli Diamond Industry. “Botswana’s Diamond Cutting Act Wins Praise as a Model in KP Process,” November 2005. http://www.israelidiamond.co.il/english/NEWS1073&SearchS=.aspx?boneID=918&objID= (accessed August 2, 2007). Israeli Diamond Industry. “De Beers Provides Update on Supply Arrangements.” September 9, 2007. http://www.israelidiamond.co.il/English/News.aspx?boneId=918&objid+2573 (accessed September 14, 2007). Itano, Nicole. “Looking to Africa to Polish Its Diamonds,” The New York Times, September 17, 2004. http://www.nytimes.com/2004/-9/17/business/worldbusiness/17diamond.html?n=Top/ne (accessed November 11, 2007.) Kimberley Process Update. “Combating Conflict Diamonds,” November 2006. http://www.globalwitness.org/pages/en/the_kimberley_process.htm (accessed October 9, 2007).
3-42
MBendi, “Africa: Mining-Diamond Mining, Overview,” November 29, 2006. http://www.mbendi.co.za/indy/ming/dmnd/af/p0005.htm (accessed August 2, 2007). MBendi, “South Africa Manufacturing: Jewelry and Watch Manufacturing,” 2007. http://www.mbendi.co.za/indy/mnfc/jewl/af/sa/p0005.htm (accessed August 2, 2007). Manduna, Calvin. “Assessing the Causes of Sub-Saharan Africa’s Declining Exports and Addressing Supply-Side Constraints.” Tralac Working Paper, 2/2005, May 2005. http://www.tralac.org (accessed October 11, 2007). Mining Review Africa, “Diamond Beneficiation in South Africa,” 2005. Mutume, Gumisai. “Africa Strives To Rebuild Its Domestic Industries.” Africa Renewal 18, no. 3, (October 2004): 19-21. http://www.un.org/ecosocdev/geninfo/afrec/vol18no3/18no3_eng.pdf (accessed October 11, 2007). Norwegian Council in Africa. “Namibia: Diamond Rush.” Africa News Update, October 6, 2007. Petra Diamonds Ltd. “Current Operations. Calibrated Diamonds,” 2007. http://www.minesite.com/companies/comp-single/company/petra-diamonds-ltd.html (accessed November 29, 2007). Schumann, W. Gemstones of the World. New York: Sterling Publishing Co. Inc., 1986. Singer, Saul. “Big Plans for the Diamond Industry in South Africa.” Tralac (Trade Law Center for Southern Africa), November 4, 2005. http://www.tralac.org/scripts/content.php?ld=3548 (accessed August 2, 2007). U.S. Department of State. U.S. Embassy, Port Louis. “USITC Study on Sub-Saharan Africa; Information on Mauritius and Seychelles (Port L 000448),” August 23, 2007. Weildlich, Brigitte. “Africa Taking Its Diamond Cut.” FIN24, Finweek, November 6, 2005. http://www.fin24.co/za/articles/default/display-article.aspz?Articleld=1518-1786-1820748 (accessed November 29, 2007).
3-43
Textiles153
Summary of Findings
Textile exports from SSA increased 12 percent by value during 2002–06 to $467 million, reflecting increased global demand for textiles, deeper regional integration, and increased foreign investment (table 3.5). This growth occurred despite a decrease in textile exports of roughly $68 million during 2004–06, following the completion of staged elimination of global quotas under the Agreement on Textiles and Clothing (ATC) on January 1, 2005.154 Patterns of exports of textiles from SSA are influenced by the historical relationships between SSA countries and former colonial powers. In certain cases, national export trends are the result of the activities of one or two firms.155 Regional trade increased over the period, in part, because of the combination of greater European demand for apparel and the rules of origin for EU preference programs, which require the use of regional fabrics in apparel exported free of duty to the EU. Regional agreements among SSA countries also encouraged SSA textile exports. Most textiles and textile product exports to the United States did not receive preferential treatment under AGOA during 2002–06; however, with the renewal of AGOA in December 2006, eligibility for duty-free treatment was expanded to certain textile articles.156
153 For the purposes of this study, textiles include products covered in the HS chapters 50 through 60, and chapter 63. Finished apparel classified in HS chapters 61 and 62 is not included. The broader textile and apparel industry in SSA consists mostly of cut-make-trim apparel manufacturing, and is generally footloose since it requires little capital investment apart from cutting and sewing machines. Textiles, including yarns and fabrics, represented 16 percent of total textile and apparel exports from SSA in 2006. This section addresses primarily textiles and textile products, not finished apparel. For a discussion of apparel, see USITC, Sub-Saharan Africa: Factors Affecting Trade Patterns of Selected Industries, First Annual Report, USITC Publication 3914. Washington, DC: USITC, 2007.
154 Phased elimination of textile quotas began on January 1, 1995, and was completed January 1, 2005. The elimination of quotas subjected SSA exporters to increased competition from previously restrained suppliers, especially China.
155 In the cases of Lesotho and Madagascar, there is only one reported exporter of textiles. 156 African Growth and Opportunity Act, 19 U.S.C. 3701, as amended. For further information
on AGOA IV, see http://www.agoa.gov/agoa_legislation/agoa_legislation4.html.
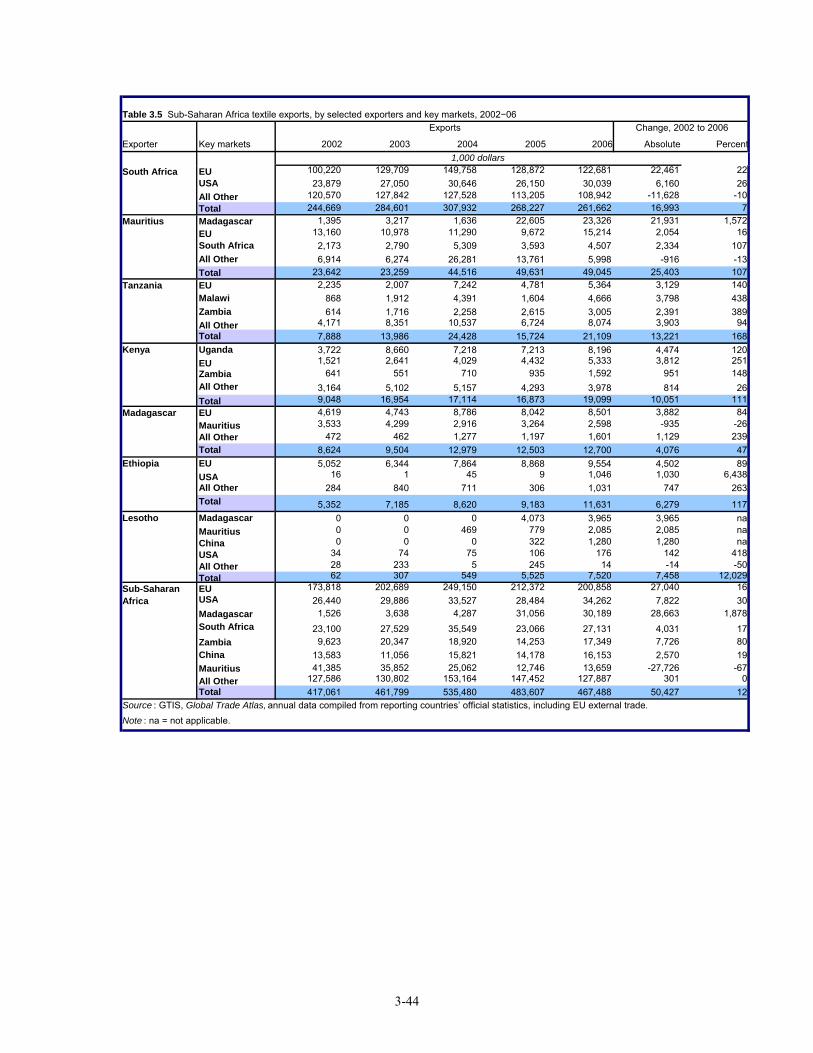
3-44
Exporter Key markets 2002 2003 2004 2005 2006 Absolute Percent
EU 100,220 129,709 149,758 128,872 122,681 22,461 22USA 23,879 27,050 30,646 26,150 30,039 6,160 26All Other 120,570 127,842 127,528 113,205 108,942 -11,628 -10Total 244,669 284,601 307,932 268,227 261,662 16,993 7Madagascar 1,395 3,217 1,636 22,605 23,326 21,931 1,572EU 13,160 10,978 11,290 9,672 15,214 2,054 16South Africa 2,173 2,790 5,309 3,593 4,507 2,334 107All Other 6,914 6,274 26,281 13,761 5,998 -916 -13Total 23,642 23,259 44,516 49,631 49,045 25,403 107EU 2,235 2,007 7,242 4,781 5,364 3,129 140Malawi 868 1,912 4,391 1,604 4,666 3,798 438Zambia 614 1,716 2,258 2,615 3,005 2,391 389All Other 4,171 8,351 10,537 6,724 8,074 3,903 94Total 7,888 13,986 24,428 15,724 21,109 13,221 168Uganda 3,722 8,660 7,218 7,213 8,196 4,474 120EU 1,521 2,641 4,029 4,432 5,333 3,812 251Zambia 641 551 710 935 1,592 951 148All Other 3,164 5,102 5,157 4,293 3,978 814 26Total 9,048 16,954 17,114 16,873 19,099 10,051 111EU 4,619 4,743 8,786 8,042 8,501 3,882 84Mauritius 3,533 4,299 2,916 3,264 2,598 -935 -26All Other 472 462 1,277 1,197 1,601 1,129 239Total 8,624 9,504 12,979 12,503 12,700 4,076 47EU 5,052 6,344 7,864 8,868 9,554 4,502 89USA 16 1 45 9 1,046 1,030 6,438All Other 284 840 711 306 1,031 747 263Total 5,352 7,185 8,620 9,183 11,631 6,279 117Madagascar 0 0 0 4,073 3,965 3,965 naMauritius 0 0 469 779 2,085 2,085 naChina 0 0 0 322 1,280 1,280 naUSA 34 74 75 106 176 142 418All Other 28 233 5 245 14 -14 -50Total 62 307 549 5,525 7,520 7,458 12,029EU 173,818 202,689 249,150 212,372 200,858 27,040 16USA 26,440 29,886 33,527 28,484 34,262 7,822 30Madagascar 1,526 3,638 4,287 31,056 30,189 28,663 1,878South Africa 23,100 27,529 35,549 23,066 27,131 4,031 17Zambia 9,623 20,347 18,920 14,253 17,349 7,726 80China 13,583 11,056 15,821 14,178 16,153 2,570 19Mauritius 41,385 35,852 25,062 12,746 13,659 -27,726 -67All Other 127,586 130,802 153,164 147,452 127,887 301 0Total 417,061 461,799 535,480 483,607 467,488 50,427 12
Note : na = not applicable.
Table 3.5 Sub-Saharan Africa textile exports, by selected exporters and key markets, 2002−06Exports
South Africa
Change, 2002 to 2006
1,000 dollars
Ethiopia
Lesotho
Source : GTIS, Global Trade Atlas, annual data compiled from reporting countries’ official statistics, including EU external trade.
Mauritius
Kenya
Madagascar
Tanzania
Sub-Saharan Africa
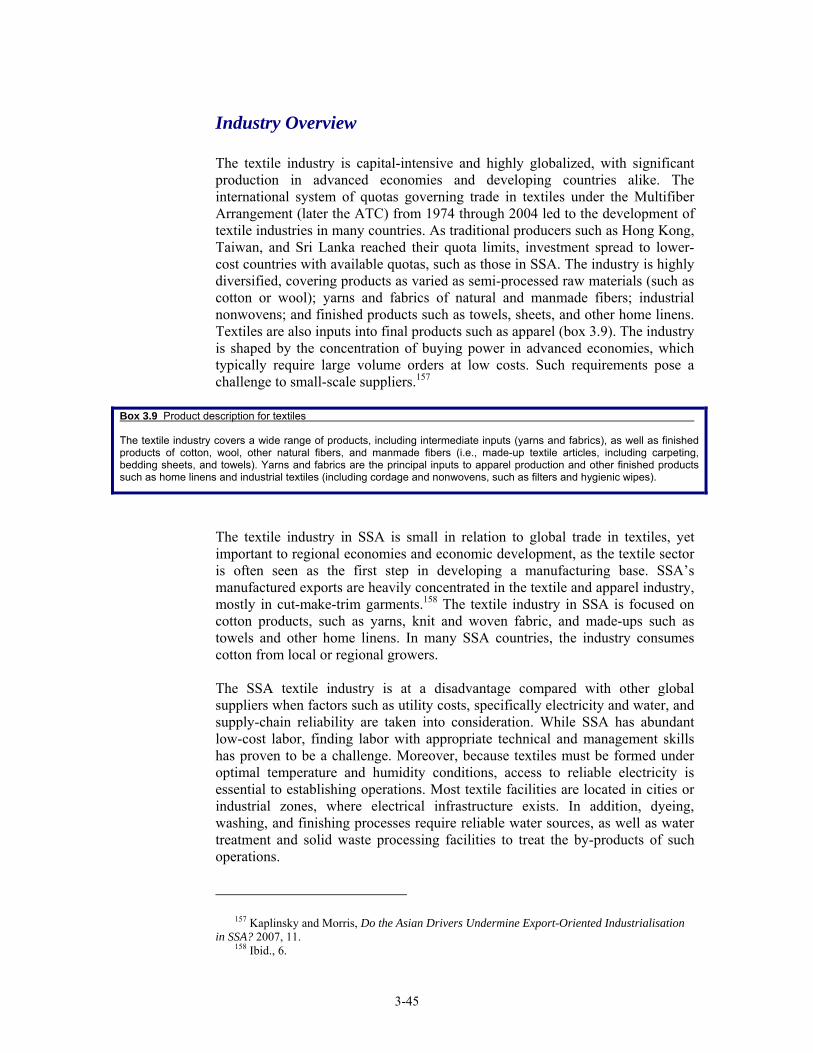
3-45
Industry Overview
The textile industry is capital-intensive and highly globalized, with significant production in advanced economies and developing countries alike. The international system of quotas governing trade in textiles under the Multifiber Arrangement (later the ATC) from 1974 through 2004 led to the development of textile industries in many countries. As traditional producers such as Hong Kong, Taiwan, and Sri Lanka reached their quota limits, investment spread to lower-cost countries with available quotas, such as those in SSA. The industry is highly diversified, covering products as varied as semi-processed raw materials (such as cotton or wool); yarns and fabrics of natural and manmade fibers; industrial nonwovens; and finished products such as towels, sheets, and other home linens. Textiles are also inputs into final products such as apparel (box 3.9). The industry is shaped by the concentration of buying power in advanced economies, which typically require large volume orders at low costs. Such requirements pose a challenge to small-scale suppliers.157
The textile industry in SSA is small in relation to global trade in textiles, yet important to regional economies and economic development, as the textile sector is often seen as the first step in developing a manufacturing base. SSA’s manufactured exports are heavily concentrated in the textile and apparel industry, mostly in cut-make-trim garments.158 The textile industry in SSA is focused on cotton products, such as yarns, knit and woven fabric, and made-ups such as towels and other home linens. In many SSA countries, the industry consumes cotton from local or regional growers. The SSA textile industry is at a disadvantage compared with other global suppliers when factors such as utility costs, specifically electricity and water, and supply-chain reliability are taken into consideration. While SSA has abundant low-cost labor, finding labor with appropriate technical and management skills has proven to be a challenge. Moreover, because textiles must be formed under optimal temperature and humidity conditions, access to reliable electricity is essential to establishing operations. Most textile facilities are located in cities or industrial zones, where electrical infrastructure exists. In addition, dyeing, washing, and finishing processes require reliable water sources, as well as water treatment and solid waste processing facilities to treat the by-products of such operations.
157 Kaplinsky and Morris, Do the Asian Drivers Undermine Export-Oriented Industrialisation
in SSA? 2007, 11. 158 Ibid., 6.
Box 3.9 Product description for textiles The textile industry covers a wide range of products, including intermediate inputs (yarns and fabrics), as well as finished products of cotton, wool, other natural fibers, and manmade fibers (i.e., made-up textile articles, including carpeting, bedding sheets, and towels). Yarns and fabrics are the principal inputs to apparel production and other finished products such as home linens and industrial textiles (including cordage and nonwovens, such as filters and hygienic wipes).
3-46
High demand for apparel inputs such as yarn and fabric in SSA is due to SSA apparel export successes to the United States under AGOA, as well as requirements for local or regional fabric use in apparel under the EU’s GSP and Cotonou159 preference programs. SSA’s leading exporters of textiles are also leading producers and exporters of apparel. However, industry sources indicate the current regional supply of yarn and fabric cannot fully meet the needs of apparel producers. For example, in Madagascar, apparel production capacity is estimated to be 20 to 30 times higher than that of Madagascar’s capacity to produce textile inputs.160 In Kenya, a shortage of Kenyan cotton restricts the production of yarns and fabrics for the local apparel industry.161 As a result, most of the fabric used in the production of apparel for the U.S. market is imported into SSA from third countries, mainly China and other Asian suppliers. Regional fabric output is used first in apparel manufactured for the EU market because the EU preferences require local inputs to receive duty-free treatment. Given the importance of the apparel sector exports to certain SSA countries, there appears to be demand to deepen the sector upstream to yarns and fabrics. However, this requires higher skill levels and greater capital investment, which are difficult to develop in SSA countries with inadequate transportation networks, electrical power, and water sources. The lack of vertical integration impedes the competitiveness of the apparel sector through increased lead times, as fabric must first be imported from Asian suppliers before garment assembly can begin. There are a few vertically integrated firms that spin fibers and knit or weave fabric to be used in-house for apparel manufacturing.162 Reportedly, some vertically integrated firms export their excess fabric production, such as those in Kenya and Lesotho. Developing vertical operations helps firms ensure reliable supplies of apparel inputs and also decreases production lead times.
Sub-Saharan Africa Trade in the Global Context163
Global exports of textiles increased 22 percent by value between 2002 and 2006 to $123.5 billion. China accounted for roughly one-third of global exports,
159 The EU is currently negotiating bilateral free trade agreements with ACP countries (called Economic Partnership Agreements or EPAs) to replace the Cotonou Agreement, which expired at the end of 2007. Negotiations are generally taking place between the EU and four separate regional groupings, although in some instances individual countries are pursuing their own separate agreements. In addition to market access provisions for goods, the EPAs are intended to cover services as well as trade-related issues such as competition, investment, IPR, and the environment. The Everything-But-Arms preference program does not allow for regional cumulation amongst SSA countries.
160 Brian Neubert, (U.S. Embassy, Antananarivo, Madagascar), interview by Commission staff, Antananarivo, Madagascar, November 7, 2007.
161 Reportedly, there is reduced production of cotton in Kenya and Uganda because of higher returns on investment from alternative crops. Due to this shortage, Kenyan apparel producers use mostly nonregional fabric. Dr. Steve New, director, Kenya Horticultural Development Program, USAID, interview by Commission staff, Nairobi, Kenya, October 16, 2007; and Othieno Odoi, senior trade promotion officer, Uganda Export Promotion Board, interview by Commission staff, Kampala, Uganda, October 23, 2007.
162 Examples of vertically integrated textile companies include Nien Hsing (Lesotho), Cotona/Cottonline (Madagascar), and A to Z Textiles (Tanzania).
163 Unless otherwise indicated, data in this section are from GTIS, World Trade Atlas Database.
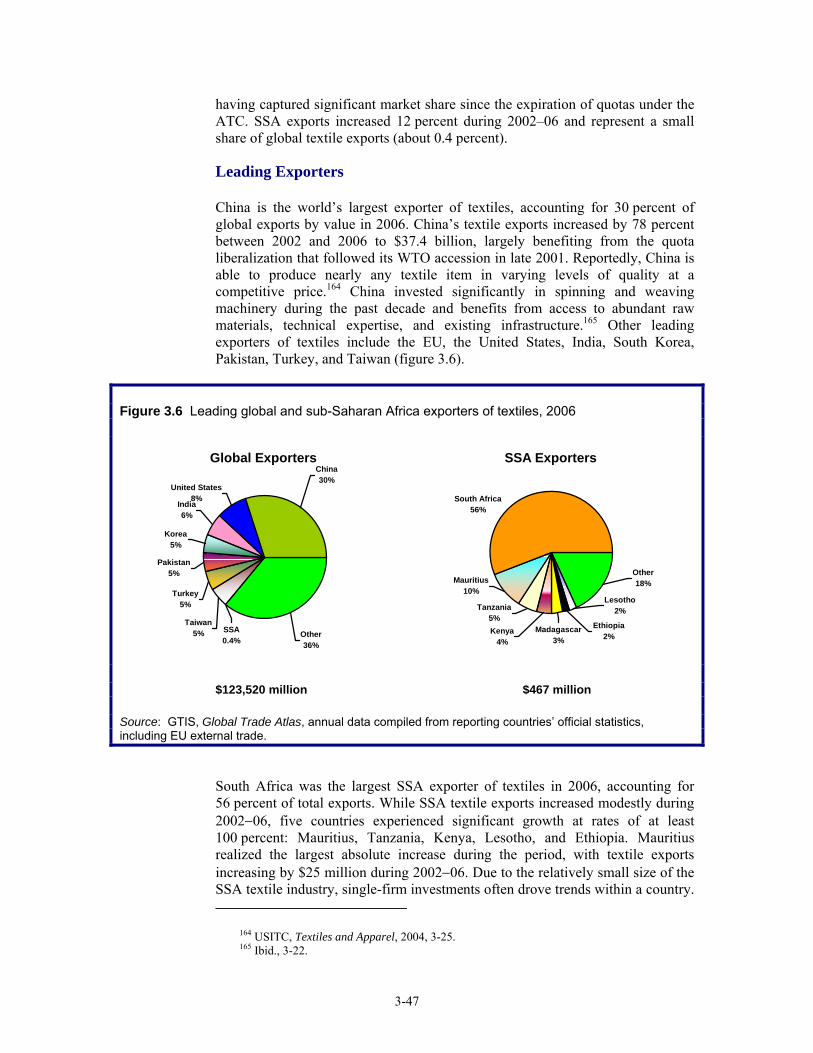
3-47
having captured significant market share since the expiration of quotas under the ATC. SSA exports increased 12 percent during 2002–06 and represent a small share of global textile exports (about 0.4 percent).
Leading Exporters
China is the world’s largest exporter of textiles, accounting for 30 percent of global exports by value in 2006. China’s textile exports increased by 78 percent between 2002 and 2006 to $37.4 billion, largely benefiting from the quota liberalization that followed its WTO accession in late 2001. Reportedly, China is able to produce nearly any textile item in varying levels of quality at a competitive price.164 China invested significantly in spinning and weaving machinery during the past decade and benefits from access to abundant raw materials, technical expertise, and existing infrastructure.165 Other leading exporters of textiles include the EU, the United States, India, South Korea, Pakistan, Turkey, and Taiwan (figure 3.6).
Figure 3.6 Leading global and sub-Saharan Africa exporters of textiles, 2006
Global Exporters
United States8%
China30%
India6%
Korea5%
Pakistan5%
Turkey5%
SSA0.4%
Taiwan5% Other
36%
SSA Exporters
South Africa56%
Mauritius10%
Tanzania5%
Madagascar3%
Lesotho2%
Ethiopia2%
Other18%
Kenya4%
$123,520 million $467 million Source: GTIS, Global Trade Atlas, annual data compiled from reporting countries’ official statistics, including EU external trade.
South Africa was the largest SSA exporter of textiles in 2006, accounting for 56 percent of total exports. While SSA textile exports increased modestly during 2002−06, five countries experienced significant growth at rates of at least 100 percent: Mauritius, Tanzania, Kenya, Lesotho, and Ethiopia. Mauritius realized the largest absolute increase during the period, with textile exports increasing by $25 million during 2002−06. Due to the relatively small size of the SSA textile industry, single-firm investments often drove trends within a country.
164 USITC, Textiles and Apparel, 2004, 3-25. 165 Ibid., 3-22.
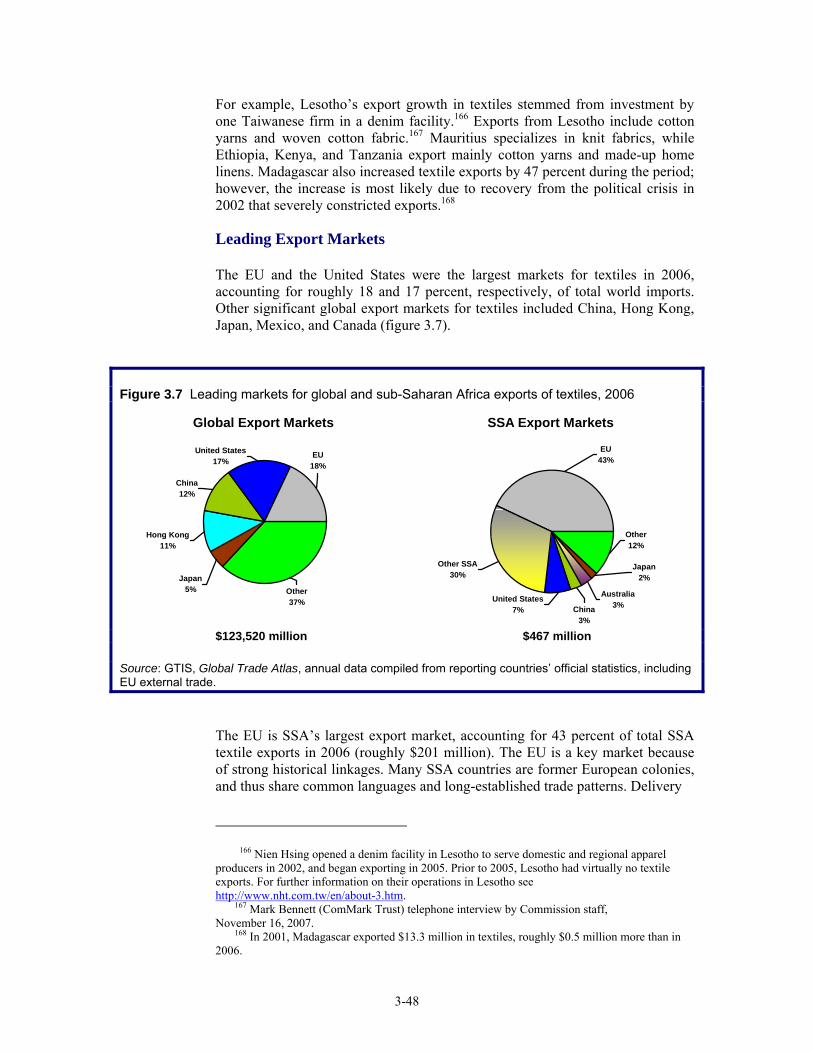
3-48
For example, Lesotho’s export growth in textiles stemmed from investment by one Taiwanese firm in a denim facility.166 Exports from Lesotho include cotton yarns and woven cotton fabric.167 Mauritius specializes in knit fabrics, while Ethiopia, Kenya, and Tanzania export mainly cotton yarns and made-up home linens. Madagascar also increased textile exports by 47 percent during the period; however, the increase is most likely due to recovery from the political crisis in 2002 that severely constricted exports.168
Leading Export Markets
The EU and the United States were the largest markets for textiles in 2006, accounting for roughly 18 and 17 percent, respectively, of total world imports. Other significant global export markets for textiles included China, Hong Kong, Japan, Mexico, and Canada (figure 3.7).
Figure 3.7 Leading markets for global and sub-Saharan Africa exports of textiles, 2006
Global Export Markets
EU18%
United States17%
China12%
Japan5%
Hong Kong11%
Other37%
SSA Export Markets
Other SSA30%
United States7% China
3%
EU43%
Japan2%
Other12%
Australia3%
$123,520 million $467 million Source: GTIS, Global Trade Atlas, annual data compiled from reporting countries’ official statistics, including EU external trade.
The EU is SSA’s largest export market, accounting for 43 percent of total SSA textile exports in 2006 (roughly $201 million). The EU is a key market because of strong historical linkages. Many SSA countries are former European colonies, and thus share common languages and long-established trade patterns. Delivery
166 Nien Hsing opened a denim facility in Lesotho to serve domestic and regional apparel
producers in 2002, and began exporting in 2005. Prior to 2005, Lesotho had virtually no textile exports. For further information on their operations in Lesotho see http://www.nht.com.tw/en/about-3.htm.
167 Mark Bennett (ComMark Trust) telephone interview by Commission staff, November 16, 2007.
168 In 2001, Madagascar exported $13.3 million in textiles, roughly $0.5 million more than in 2006.
3-49
times to the EU are also shorter than to the United States and, reportedly, exporters can earn higher prices in the EU market than in the U.S. market.169 U.S. buyers typically require larger-quantity orders, leaving smaller operations, such as those in SSA, at a disadvantage. Furthermore, SSA and EU countries are located in similar time zones, so there are fewer delays in communication. In addition to finished home, kitchen, and bed linens; carpets; and special woven fabric, SSA firms also export unfinished or greige goods to partners in Europe. Often, SSA firms lack special washing or finishing capabilities needed to make the final product.170 Within the EU, Italy and the United Kingdom are the largest export markets, accounting for 12 and 11 percent of total SSA textile exports, respectively. There are also significant exports to Germany, Belgium, and France. SSA textile exports to the EU accounted for 54 percent of total SSA textile export increases during 2002−06. Total EU textile imports increased 51 percent during 2002–06; however, imports from SSA partners only increased by 16 percent. Thirty percent ($137.9 million) of SSA textile exports in 2006 went to other SSA countries (intra-SSA trade), namely Madagascar, South Africa, Zambia, Mauritius,171 Uganda, and Malawi. Regional fabric exports are often used in apparel destined for local African and export markets, particularly the EU.172 In 2006, 7 percent of SSA textile exports went to the U.S. market. SSA exports to the United States increased by 30 percent during 2002–06 to $34.3 million. South Africa is the largest SSA exporter to the U.S. market, representing 88 percent of total SSA textile exports to that market in 2006. SSA textile articles exported to the United States include special woven fabric; handwoven rugs; and made-up articles such as labels, cords, and wall banners. Other markets for SSA textile exports included China, Australia, and Japan.
Factors Affecting Export Patterns
Factors contributing to increased textiles exports from SSA during 2002−06 include increased global demand, deeper regional integration and cooperation, and foreign investment in SSA. Increased global demand for textiles buoyed SSA exports, specifically in the EU and U.S. markets where SSA textile exports realized significant increases. Total textile imports increased 51 and 39 percent in the EU and in U.S. markets, respectively, during 2002−06. Additionally,
169 Industry representative, interview by Commission staff, Antananarivo, Madagascar,
November 7, 2007. 170 Industry representative, interview by Commission staff, Antsirabe, Madagascar,
November 5, 2007. 171 While Mauritius is a leading market for SSA textile exports, total imports from other SSA
countries actually declined 67 percent during 2002−06. As Mauritius increased its textile capacity and wages rose, Mauritian firms invested in Madagascar’s apparel industry, creating an export market for Mauritian fabrics.
172 Regional exports of textiles are linked to the use of EU preference programs, which grant duty-free treatment to apparel imports but require a double transformation under the rules of origin for the Cotonou Agreement program. This means that fabric must be knit or woven locally, the cut and sewn regionally for the apparel to qualify for preferential treatment.
3-50
increased European demand for apparel,173 combined with strict rules of origin for EU preference programs that require the use of regional inputs in apparel, and the implementation of regional economic partnerships help explain the 10 percent increase in intra-SSA trade during 2002−06. However, the industry faces significant challenges to compete in the global market, specifically underdeveloped infrastructure, a lack of skilled technical and managerial labor, and scarcity of capital.
Deeper Regional Integration
During 2002−06, several agreements to promote intra-African economic cooperation were strengthened and trading partners took advantage of regional preferences. The Common Market for Eastern and Southern Africa (COMESA), East African Community (EAC), and Southern African Development Community (SADC) all extended trade benefits that encouraged trade in textiles. Particularly, all SADC members, including textile exporters Lesotho, Mauritius, and Tanzania, can export their products to South Africa free of duty.174 This development is significant because South Africa is the fourth-largest export market for total SSA textile exports. COMESA and EAC are also working toward free trade areas. For example, Kenya can export fabric to Tanzania at a reduced duty under the EAC agreement and will gain duty-free access in 2009.175 At least two vertically integrated textile and apparel producers in Kenya import cotton duty-free from Tanzania and Uganda for their yarn-spinning operations.176
Foreign Investment
Foreign investment has encouraged SSA exports of textiles, fabric, and made-up articles. In certain cases foreign investment has encouraged new production in higher-technology products. Investment generally comes from SSA, Asian, and European countries, and several SSA countries have established successful international joint ventures, as described below. Where infrastructure exists, such as in government-established export processing zones, SSA is an attractive investment location due to preferential access to the U.S., EU, and regional markets. For example, through a partnership with a U.S. firm, Fine Spinners of Kenya produces patented, coated threads (see Kenya discussion below).
173 European consumption of clothing during 2002−06 increased steadily. This increased
demand has been met with rising imports, rather than with additional domestic production. Werner International Strategic Consultants, “Strategic Overview,” 2007. The EU is SSA’s second-largest apparel market after the United States, accounting for 40 percent of total SSA exports of apparel in 2006. GTIS, World Trade Atlas Database.
174 Paul Theron, (Department of Trade and Industry, Republic of South Africa), interview by Commission staff, Pretoria, South Africa, October 29, 2007.
175 Jas Bedi, (African Cotton and Textiles Federation), interview by Commission staff, Nairobi, Kenya, October 16, 2007.
176 Ibid.
3-51
Ethiopia
Italian and Turkish firms have invested in Ethiopia’s textile industry. Ethiopia produces home linens such as sheets and tablecloths for the European-based retailer, IKEA.177
Kenya178
A Kenyan firm, Fine Spinners, partnered with an American textile company, American & Efird, in order to secure the technology necessary to produce special coated threads that pass through sewing machines more efficiently. This product is sold regionally for use in apparel production and marketed at the retail level for household use in Kenya.179 The success of this partnership has allowed Fine Spinners to expand its operations to include apparel production as well as yarns, fabrics, and finished textile articles.
Lesotho
In 2002, Nien Hsing, a Taiwanese firm that exports fabric regionally for use in apparel, built a denim fabric mill in Lesotho. Reportedly, this investment in textile capacity was made in anticipation of the expiration of the AGOA third-country fabric provision, which was set to expire in September 2007.180 The provision was ultimately extended to 2012 with AGOA renewal legislation in December 2006.181 Nien Hsing exports denim fabric regionally for use in apparel.
Mauritius
Mauritius received Chinese, Indian, and Pakistan investment in spinning capacity to provide domestic production of yarn for downstream fabric production in the local market.182 Investment is encouraged by Mauritius’ established textile and apparel sector, preferential market access to the EU and U.S. markets, as well as government incentives (see the following discussion). Tianli Spinning Ltd., Arvind Overseas Ltd., and CMT Ltd. began production of cotton yarns in Mauritius during 2003−04.183
177 Addis Alemayehou, (USAID), interview by Commission staff, Addis Ababa, Ethiopia,
October 24, 2007. 178 Despite the preceding example, Kenya has reportedly received little foreign investment in
textile mills due to high energy and transportation costs, as well as because of concerns about corruption. Domestic textile fabric producers interviewed in Nairobi, Kenya, indicated that it is difficult to get a loan from a bank in Kenya to finance improvements in manufacturing equipment or to expand production capacity. Bedi, interview by Commission staff, Nairobi, Kenya, October 16, 2007.
179 Ibid. 180 Bennett, telephone interview by Commission staff, November 16, 2007. 181 African Growth and Opportunity Act, 19 U.S.C. 3701, as amended. For further information,
see USITC, Commercial Availability of Fabric & Yarns in AGOA Countries: Certain Denim, USITC Publication 3950, Washington, DC USITC, 2007.
182 Joomun, “The Textile and Clothing Industry in Mauritius,” 2006, 199. 183 U.S. Department of State, “Textile and Apparel Production Capabilities in AGOA-Eligible
Countries,” August 2006.
3-52
Tanzania
In 2004, A to Z Textile Mills Ltd. (A to Z) in Arusha, Tanzania, received a license from the Japanese firm Sumitomo to produce its patented mosquito nets treated with insecticide for SSA markets. A to Z’s success led Sumitomo to form a joint venture with A to Z (Vector Health International) and build a new factory completed in late 2006 dedicated to mosquito net production. A to Z received contracts from international non-governmental organizations, such as the World Bank and UNICEF, to produce malaria nets for the African market.184 The success of its joint venture with Sumitomo has allowed A to Z to upgrade some of its equipment used in the manufacture of cotton and cotton-polyester blended knit shirts sold in regional markets. Raw cotton is purchased from Tanzania but polyester must be imported.185 Policies to Promote the Industry and Other Country-Specific Factors
Mauritius
The Mauritian government encourages growth and investment in the textiles sector through investment incentives, the maintenance of a competitive export-processing zone, and business counseling. The Mauritius Industrial Development Authority (MIDA), established in 2000, and the Export Processing Zone Development Authority (EPZDA), established in 1992, work together to encourage exports and develop industrial sites. EPZDA, for example, encourages product diversification and technology transfer to promote a viable textile industry. In 2003−04, the government granted a tax holiday and investment credit to investors establishing a spinning mill.186 This incentive was extended to help producers meet the rules-of-origin criteria for exporting to the United States and the EU. This encouraged the establishment of three new spinning facilities.187 With the establishment of new textile capacity, Mauritius increased regional exports, particularly to Madagascar. Due to historical and cultural linkages, as well as rising wage rates within Mauritius, many investors have set up apparel assembly operations in Madagascar. Such operations created a market for Mauritian textiles, mostly for apparel exported to the EU. It is important to note, however, that a political crisis in Madagascar in early 2002 adversely affected the textiles and apparel industries in that country. Thus the large increases in exports to Madagascar during 2002−06 reflect the recovery of the industry to 2001 levels rather than a longer term growth trend.
184 International Herald Tribune, “Bush, in Tanzania, Highlights Anti-malaria Effort.”
February 18, 2008. 185 Industry representative, interview by Commission staff, Arusha, Tanzania,
October 19, 2007. 186 Joomun, “The Textile and Clothing Industry in Mauritius,” 2006, 205–6. 187 U.S. Department of State, “Textile and Apparel Production Capabilities in AGOA-Eligible
Countries,” August 2006.
3-53
Kenya
The textiles and apparel industry is important to the Kenyan economy and has been targeted for employment creation and poverty reduction. In particular, two programs, the Economic Recovery for Wealth and Employment Creation and the Investment Programme for the Economic Recovery Strategy, aim to promote growth within the textiles sector by helping manufacturers identify new export markets, representing firms at trade shows, and assisting with quality improvements.
Lesotho
The government-sponsored Lesotho National Development Corporation encourages investment within the textiles sector. Additionally, the government of Lesotho promotes the textiles and apparel sector by bringing in U.S. buyers and promoting investment and exports.188 Though a landlocked country, Lesotho benefits from access to South Africa’s developed infrastructure to get finished goods to international markets.189 However, Lesotho faces specific challenges that adversely affect textiles exports. Lesotho’s currency, the loti, is pegged to the South African rand. From 2002 to 2006 the rand appreciated significantly and continues to be volatile, thus posing a disadvantage to Lesotho exporters.190 Despite Lesotho’s successes in textile exports, the country currently lacks industrial infrastructure for greenfield investment to expand the sector further, despite interest from investors.191
Ethiopia
The government of Ethiopia provided export incentives throughout the period under consideration, and recognizes the textile and clothing industry as key to development and industrialization.192 The Ethiopian Investment Agency assists foreign investors with feasibility studies and location selection.193 Additionally, all capital goods used to establish operations and raw materials used in the production of exports may be imported duty-free. Although the large textile mills in Ethiopia are government-operated, there are a number of small knitting operations using traditional (non-electric) methods to produce handcrafted textile articles for export markets.194 Such articles are eligible to enter the United States free of duty under AGOA.
188 USITC hearing transcript, October 23, 2007, 90. 189 Theron, interview by Commission staff, Pretoria, South Africa, October 29, 2007. 190 Bennett, telephone interview by Commission staff, November 16, 2007. 191 Ibid. 192 Tait, The Potential for Ethiopia’s textile and garment industry, 2007, 14. 193 Ibid. 194 Industry representative, interview by Commission staff, Addis Ababa, Ethiopia,
October 24, 2007.
3-54
Textiles Bibliography
Brenton, Paul and Mombert Hoppe. “Life after Quotas? Early Signs of the New Era in Trade of Textiles and Clothing.” In Trade, Doha, and Development: A Window into the Issues, edited by Richard Newfarmer, 155–164. Washington, DC: The World Bank, 2006. Global Trade Information Services, Inc. (GTIS). World Trade Atlas Database. Annual data compiled from reporting countries’ official statistics, including EU27 external trade. http://www.gtis.com/wta/usitc/ (accessed various dates). International Herald Tribune. “Bush, in Tanzania, Highlights Anti-malaria Effort.” February 18, 2008. http://www.iht.com/articles/2008/02/18/africa/prexy.php (accessed February 21, 2008). Joomun, Gilles. “The Textile and Clothing Industry in Mauritius.” In The Future of the Textile and Clothing Industry in Sub-Saharan Africa, edited by Herbert Jauch and Rudolf Traub-Merz, 193–211. Bonn, Germany: Friedrich-Ebert-Stiftung, 2006. Kaplinsky, Raphael, and Mike Morris. Do the Asian Drivers Undermine Export-Oriented Industrialisation in SSA? Department of Policy and Practice, The Open University, April 2007. Kenya Export Processing Zones Authority. “Kenya’s Apparel & Textile Industry.” Nairobi, Kenya: 2005. http://www.epzakenya.com/UserFiles/File/ApparelTextile.pdf (accessed various dates). Naumann, Eckart. “Textiles and clothing: Reflections on the sector’s integration into the post-quota environment,” Trade Law Centre for Southern Africa Working Paper No 1/2005, March 2005. Omolo, Jacob. “The Textile and Clothing Sector in Kenya.” In The Future of the Textile and Clothing Industry in Sub-Saharan Africa, edited by Herbert Jauch and Rudolf Traub-Merz, 147−164. Bonn, Germany: Friedrich-Ebert-Stiftung, 2006. Subramanian, Uma, and Matthijs, Matthias. “Can Sub-Saharan Africa Leap into Global Network Trade?” World Bank Policy Research Group Working Paper 4112, January 2007. Tait, Niki. The Potential for Ethiopia’s Textile and Garment Industry, March 2007. Management Briefings. Aroq Limited. http://just-style-com (accessed various dates). Traub-Merz, Rudolf, with assistance from Herbert Jauch. “The African Textile and Clothing Industry: From Import Substitution to Export Orientation.” In The Future of the Textile and Clothing Industry in Sub-Saharan Africa, edited by Herbert Jauch and Rudolf Traub-Merz, 9−35. Bonn, Germany: Friedrich-Ebert-Stiftung, 2006. United Nations Conference on Trade and Development (UNCTAD), Investment Policy Review: Lesotho (UNCTAD/ITE/IPC/2003/4), Geneva, July 2003.
3-55
USAID/The Zambian Trade and Investment Enhancement (ZAMTIE) Project, “Third Party Yarn and Fabric Capacity in Southern/Eastern Africa and Garment Production,” April 2004.
U.S. Department of State. “Textile and Apparel Production Capabilities in AGOA-Eligible Countries,” August 2006. U.S. International Trade Commission (USITC) hearing transcript in connection with inv. No. 332-477, Sub-Saharan Africa: Factors Affecting Trade Patterns of Selected Industries, October 23, 2007.
——. Textiles and Apparel: Assessment of the Competitiveness of Certain Foreign Suppliers to the U.S. Market, USITC Publication 3671. Washington, DC: USITC, 2004. Werner International Strategic Consultants. “Strategic Overview on Global Textile & Apparel Supply Chain Dynamics,” New Twist Newsletter 4 (2007). http://www.werner-newtwist.com/en/newsl-vol-004/index.htm (accessed December 18, 2007.) World Bank Group/MIGA, Snapshot Africa: Benchmarking FDI Competitiveness in Sub-Saharan Africa, www.fdi.net/snapshot_africa, Washington, DC, November 2006.
3-56
Wood Furniture
Summary of Findings
Wood furniture exports from SSA countries fell by 46 percent during 2002−06 (table 3.6). Most of this decline occurred over the final two years of the period, as exports of wood furniture fell by $55.1 million (44 percent) during 2004−06, to $68.7 million. Decreased exports from South Africa accounted for 99 percent ($54.4 million) of the total net decline during 2004–06, and falling exports from Ghana accounted for 9 percent ($4.7 million). By contrast, exports of wood furniture from all other SSA suppliers grew by 18 percent ($4.1 million) during 2004–06, led by increases from Mali ($1.6 million) and Gabon ($1.2 million). Intensified competition with imports from China in key EU and U.S. markets was the leading factor responsible for the decline in SSA exports of wood furniture during 2002–06, especially for exports from South Africa and Ghana. Other factors contributing to the decrease were the relative strength of the South African rand against the euro and the U.S. dollar, deforestation in both South Africa and Ghana, and difficulty obtaining “sustainable forestry” certification for wood furniture produced in Ghana. SSA producers supply less than 1 percent of the world market for wood furniture. Some West African countries have adopted regulations to promote furniture production and exports by restricting the export of logs or by conditioning the harvesting of timber on commitments to develop downstream processing of the logs prior to export. However, increased exports from these new furniture-producing countries were more than offset by sharp decreases from established supplier countries.
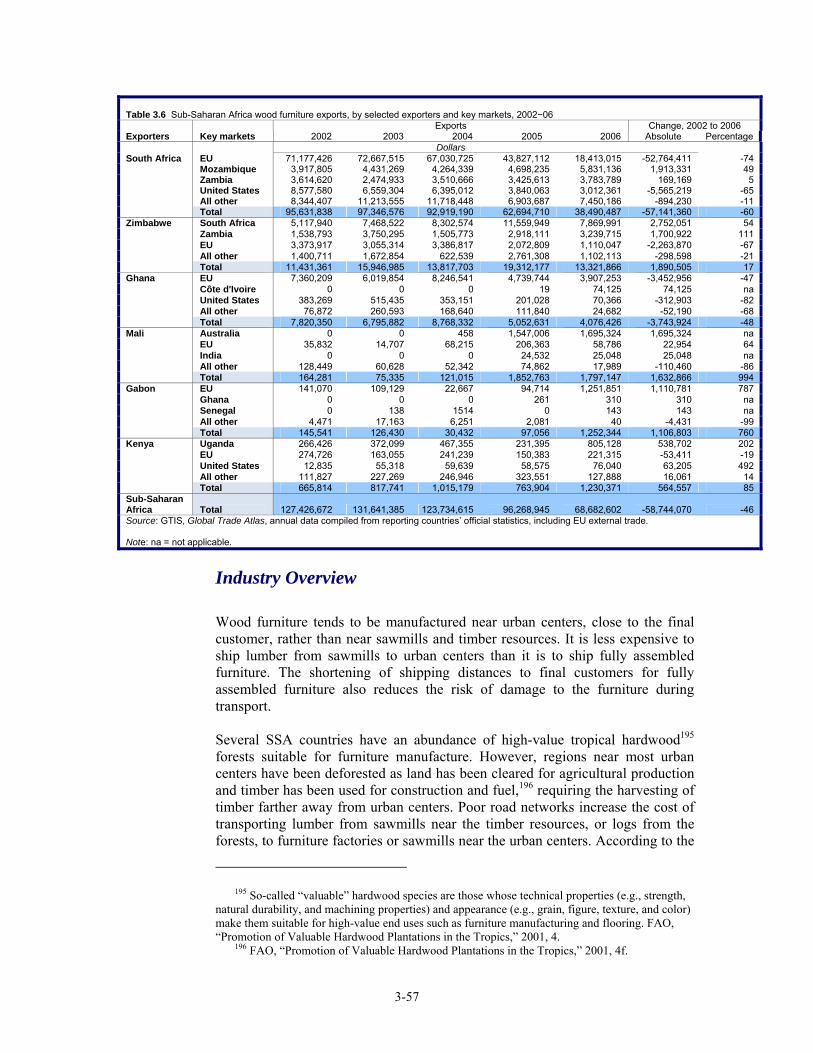
3-57
Table 3.6 Sub-Saharan Africa wood furniture exports, by selected exporters and key markets, 2002−06 Exports Change, 2002 to 2006 Exporters Key markets 2002 2003 2004 2005 2006 Absolute Percentage Dollars
EU 71,177,426 72,667,515 67,030,725 43,827,112 18,413,015 -52,764,411 -74 Mozambique 3,917,805 4,431,269 4,264,339 4,698,235 5,831,136 1,913,331 49 Zambia 3,614,620 2,474,933 3,510,666 3,425,613 3,783,789 169,169 5 United States 8,577,580 6,559,304 6,395,012 3,840,063 3,012,361 -5,565,219 -65 All other 8,344,407 11,213,555 11,718,448 6,903,687 7,450,186 -894,230 -11
South Africa
Total 95,631,838 97,346,576 92,919,190 62,694,710 38,490,487 -57,141,360 -60 South Africa 5,117,940 7,468,522 8,302,574 11,559,949 7,869,991 2,752,051 54 Zambia 1,538,793 3,750,295 1,505,773 2,918,111 3,239,715 1,700,922 111 EU 3,373,917 3,055,314 3,386,817 2,072,809 1,110,047 -2,263,870 -67 All other 1,400,711 1,672,854 622,539 2,761,308 1,102,113 -298,598 -21
Zimbabwe
Total 11,431,361 15,946,985 13,817,703 19,312,177 13,321,866 1,890,505 17 EU 7,360,209 6,019,854 8,246,541 4,739,744 3,907,253 -3,452,956 -47 Côte d'Ivoire 0 0 0 19 74,125 74,125 na United States 383,269 515,435 353,151 201,028 70,366 -312,903 -82 All other 76,872 260,593 168,640 111,840 24,682 -52,190 -68
Ghana
Total 7,820,350 6,795,882 8,768,332 5,052,631 4,076,426 -3,743,924 -48 Australia 0 0 458 1,547,006 1,695,324 1,695,324 na EU 35,832 14,707 68,215 206,363 58,786 22,954 64 India 0 0 0 24,532 25,048 25,048 na All other 128,449 60,628 52,342 74,862 17,989 -110,460 -86
Mali
Total 164,281 75,335 121,015 1,852,763 1,797,147 1,632,866 994 EU 141,070 109,129 22,667 94,714 1,251,851 1,110,781 787 Ghana 0 0 0 261 310 310 na Senegal 0 138 1514 0 143 143 na All other 4,471 17,163 6,251 2,081 40 -4,431 -99
Gabon
Total 145,541 126,430 30,432 97,056 1,252,344 1,106,803 760 Uganda 266,426 372,099 467,355 231,395 805,128 538,702 202 EU 274,726 163,055 241,239 150,383 221,315 -53,411 -19 United States 12,835 55,318 59,639 58,575 76,040 63,205 492 All other 111,827 227,269 246,946 323,551 127,888 16,061 14
Kenya
Total 665,814 817,741 1,015,179 763,904 1,230,371 564,557 85 Sub-Saharan Africa Total 127,426,672 131,641,385 123,734,615 96,268,945 68,682,602 -58,744,070 -46 Source: GTIS, Global Trade Atlas, annual data compiled from reporting countries’ official statistics, including EU external trade. Note: na = not applicable.
Industry Overview
Wood furniture tends to be manufactured near urban centers, close to the final customer, rather than near sawmills and timber resources. It is less expensive to ship lumber from sawmills to urban centers than it is to ship fully assembled furniture. The shortening of shipping distances to final customers for fully assembled furniture also reduces the risk of damage to the furniture during transport. Several SSA countries have an abundance of high-value tropical hardwood195 forests suitable for furniture manufacture. However, regions near most urban centers have been deforested as land has been cleared for agricultural production and timber has been used for construction and fuel,196 requiring the harvesting of timber farther away from urban centers. Poor road networks increase the cost of transporting lumber from sawmills near the timber resources, or logs from the forests, to furniture factories or sawmills near the urban centers. According to the
195 So-called “valuable” hardwood species are those whose technical properties (e.g., strength, natural durability, and machining properties) and appearance (e.g., grain, figure, texture, and color) make them suitable for high-value end uses such as furniture manufacturing and flooring. FAO, “Promotion of Valuable Hardwood Plantations in the Tropics,” 2001, 4.
196 FAO, “Promotion of Valuable Hardwood Plantations in the Tropics,” 2001, 4f.
3-58
European Commission for the Promotion of Investment, rapid deforestation in West Africa in areas of relatively high population density, particularly in Nigeria, Côte d’Ivoire, and Ghana, limits the potential of the emergence of wood furniture as a significant export industry.197
SSA furniture production and exports are concentrated in southern and West Africa (box 3.10). Compared with other regions in SSA, southern Africa (South Africa and Zimbabwe) has a superior road network for transporting lumber and furniture,198 a well-developed electricity network for operating sawmills and furniture factories, a highly skilled workforce, and (in South Africa) a growing middle class providing a domestic market for regionally produced furniture. In contrast, according to the African Timber Organization, West Africa has the more abundant tropical hardwood resources for the production of furniture but lacks sufficient road networks and electrical grid capacity. The development of export-quality manufacturing capability in West Africa is in its initial stage.199 A large multinational company, Steinhoff International, dominates the South African furniture industry and is the leading SSA exporter as well as the leading supplier of furniture to South Africa’s domestic market. Locally owned small- and medium-sized producers also supply the South African market. Foreign investors have helped establish medium-sized companies in Cameroon, Gabon, and Ghana that are the furniture export “champions” in their respective countries, with production limited to garden furniture. The domestic markets in SSA (except South Africa) are supplied principally by small producers (fewer than 10 employees) making custom-ordered furniture by hand. The lumber available to these producers is usually of low quality because, according to the Africa Timber Organization, with few exceptions, the SSA wood processing industry is characterized by obsolete, often ill-maintained equipment.200
197 European Commission for the Promotion of Investment (Pro-invest), Sector Orientation
Report, February 2004, Annex A 07, 3. 198 Matthee and Naude, The Significance of Transportation Costs in Africa, 2007, 4. 199 The development of value-added timber processing in West Africa is most developed in
Ghana, Côte d’Ivoire, and Nigeria. ATO, Promoting the Further Processing of Tropical Timber in Africa, 2004, 13.
200 ATO, Promoting the Further Processing of Tropical Timber in Africa, 2004, 8.
3-59
Box 3.10 Product description for wood furniture Wood furniture accounts for about one-half of global production and trade in furniture, with furniture of metal and plastics accounting for most of the remainder. Upholstered furniture built on wood frames is classified as wood furniture. For the purposes of this report, furniture made from wicker, rattan, bamboo, or similar fibers is considered to be of wood. Chairs and other furniture made from such fibers accounted for 6 percent of total SSA exports of wood furniture in 2006. Solid wood furniture accounted for 74 percent of SSA exports, and upholstered chairs and sofas built on wood frames, 20 percent. The primary input for wood furniture is lumber. Some furniture producers in SSA are vertically integrated, with sawmills that supply the lumber and forest products companies that supply the mills with logs. Lumber used in furniture production must be kiln or air dried. After drying, the lumber is sawn into shapes approximating the dimensions of the final furniture parts. Modern furniture operations employed by the leading producers in South Africa use electrically powered saws, whereas operations in locations without reliable supplies of electricity will hand carve furniture pieces from solid wood. Wood surfaces that will be flat in the final furniture pieces are planed. Rounded surfaces, such as table and chair legs, are lathed. Furniture parts can be finished prior to assembly or the finish can be applied to the furniture after assembly. The assembly process usually employs a combination of chemical adhesives and hardware, such as nails and screws. A veneer, usually of hardwood, may be glued to the surface of the furniture part or assembly. The furniture part is sanded after the veneer application and/or furniture assembly. Flat surfaces can be roll-coated with a finish, but curved surfaces must be spray-finished. Five types of furniture made in SSA countries compete in international markets:
• Contemporary household furniture produced in South Africa using tropical hardwood logs or sawn lumber from West Africa (chiefly Côte d’Ivoire) is sold both domestically and in Europe. • Low-end furniture (such as bunk beds and other children’s furniture) made from indigenous South African pine is sold both domestically and in Europe.
• Garden furniture made from teak and similar tropical hardwoods that are resistant to water damage and
insects is produced in West Africa for export. Most garden furniture produced in Ghana is exported to the United Kingdom, whereas garden furniture produced in Gabon and Cameroon is marketed through distributors in France or, in the case of Cameroon, exported to the United States.
• Sturdy, handmade furniture of tropical hardwoods is finding increased sales in regional markets, particularly in the East Africa Community (Burundi, Kenya, Rwanda, Tanzania, and Uganda) and among COMESA members.
• High-quality, solid tropical hardwood nursery furniture produced in Mali is distributed in Australia and New Zealand. This is upper-end furniture for a niche market.
Sources: EPA, Profile of the Wood Furniture and Fixtures Industry, September 1995, 13−18, and the Global Trade Atlas.
Sub-Saharan Africa Trade in the Global Context
Despite the abundant timber resources in West Africa and the Congo Basin, total exports of wood furniture from SSA fell by 46 percent during 2002–06, to $68.7 million. During the same period, world exports grew by 66 percent to $34.2 billion. SSA exports accounted for 0.2 percent of world exports of wood furniture in 2006.
Leading Exporters
China is the leading supplier of wood furniture to world markets, accounting for 42 percent of global exports in 2006, followed by Canada (7 percent). Vietnam, Indonesia, Italy, and Malaysia each supplied between 5 and 6 percent of world exports (figure 3.8). China became an exporter of wood furniture when suppliers of ready-to-assemble (RTA) furniture in Taiwan shifted their production operations to China in the 1980s as labor costs rose in Taiwan. U.S. furniture producers then contracted the production of labor-intensive parts, such as table and chair legs, to manufacturers in China. Chinese furniture producers eventually
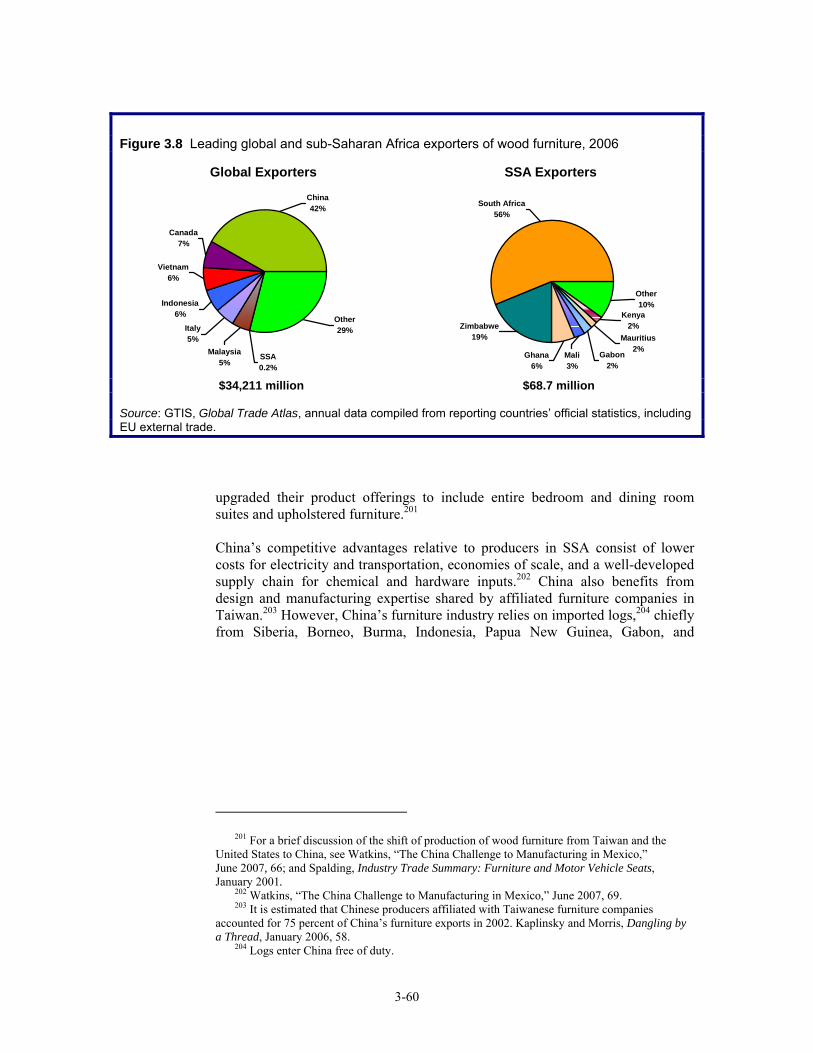
3-60
Figure 3.8 Leading global and sub-Saharan Africa exporters of wood furniture, 2006
Global Exporters
China42%
Canada7%
Vietnam6%
Indonesia6%
Italy5%
SSA0.2%
Malaysia5%
Other29%
SSA Exporters
South Africa56%
Zimbabwe19%
Ghana6%
Gabon2%
Kenya2%
Mauritius2%
Other10%
Mali3%
$34,211 million $68.7 million Source: GTIS, Global Trade Atlas, annual data compiled from reporting countries’ official statistics, including EU external trade.
upgraded their product offerings to include entire bedroom and dining room suites and upholstered furniture.201 China’s competitive advantages relative to producers in SSA consist of lower costs for electricity and transportation, economies of scale, and a well-developed supply chain for chemical and hardware inputs.202 China also benefits from design and manufacturing expertise shared by affiliated furniture companies in Taiwan.203 However, China’s furniture industry relies on imported logs,204 chiefly from Siberia, Borneo, Burma, Indonesia, Papua New Guinea, Gabon, and
201 For a brief discussion of the shift of production of wood furniture from Taiwan and the
United States to China, see Watkins, “The China Challenge to Manufacturing in Mexico,” June 2007, 66; and Spalding, Industry Trade Summary: Furniture and Motor Vehicle Seats, January 2001.
202 Watkins, “The China Challenge to Manufacturing in Mexico,” June 2007, 69. 203 It is estimated that Chinese producers affiliated with Taiwanese furniture companies
accounted for 75 percent of China’s furniture exports in 2002. Kaplinsky and Morris, Dangling by a Thread, January 2006, 58.
204 Logs enter China free of duty.
3-61
Cameroon.205 China also imports logs from the Republic of the Congo, Equatorial Guinea, and Liberia.206 South Africa, Zimbabwe, and Ghana were the leading SSA exporters of wood furniture in 2006, collectively accounting for 81 percent of total SSA exports. Despite a 60 percent decline in its exports of wood furniture during 2002–06, South Africa continued to supply over one-half of SSA’s total exports to the world in 2006. South Africa and Ghana were the only SSA countries with significant exports to industrialized markets in 2002, with the United Kingdom (UK) accounting for 31 percent ($12.0 million) of South Africa’s total exports that year and 85 percent ($3.5 million) of Ghana’s. During 2002–06, wood furniture from China made a significant push into the UK market, with exports from China growing by 369 percent ($922.5 million), and China’s share of the UK import market expanding from 11 percent to 29 percent (including competition from internal EU suppliers).207 During 2002–06, South Africa’s exports to the UK plunged by 81 percent ($44.5 million) and Ghana’s fell by 49 percent ($3.4 million) under increasing competition from China.208 In contrast to developments in South Africa and Ghana, investments by French and Turkish timber companies have led to recent increases in exports of wood furniture from Gabon209 to France and from Cameroon210 to the United States. In 2006 alone, exports of wood furniture from Gabon to France rose from $95,000 to $1.3 million. During 2002–06, the United States replaced France as Cameroon’s leading market for exports of wood furniture. Whereas exports to France from Cameroon were fairly consistent, averaging $154,000 during the period, exports to the United States jumped from $7,000 to $384,000.211 Leading Export Markets
The United States and the EU are the leading markets for wood furniture, with the United States importing 44 percent of world exports in 2006, and the EU importing 20 percent (figure 3.9). Despite the aforementioned sharp decline in
205 Global Timber Organization, China – Illegal Imports and Exports of Wood-Based Products
(2006), 2007. 206 According to a report by the Global Timber Organization, over one-half of the logs exported
to China from Cameroon are harvested illegally; 70 percent from Gabon; 90 percent from the Republic of the Congo and Equatorial Guinea; and 100 percent from Liberia. Global Timber Organization, China – Illegal Imports and Exports of Wood-Based Products (2006), 2007; and Taylor, “China’s Environmental Footprint in Africa,” February 2, 2007. Exports of wood furniture from the Democratic Republic of the Congo (DRC), Equatorial Guinea, and Liberia totaled $75,578 in 2006. Exports of wood furniture from DRC to France totaled $60,623 in 2006, compared with zero in 2005.
207 This measure of China’s share of the UK import market includes imports from other EU countries. If imports from other EU countries were not included, China’s share of the U.K. import market in 2006 would have been greater than 40 percent.
208 GTIS, Global Trade Atlas. 209 Business Africa, “Agribusiness Gabon,” August 1, 2005. 210 Bofor Cameroon S.A. Web site. http://www.boforcameroon.com/EN_2_2.htm (accessed
October 2, 2007). Based in Turkey, Bofor Bodrum established outdoor furniture manufacturing operations in Cameroon in 2005. Most production is exported to France for distribution internationally.
211 GTIS, Global Trade Atlas.
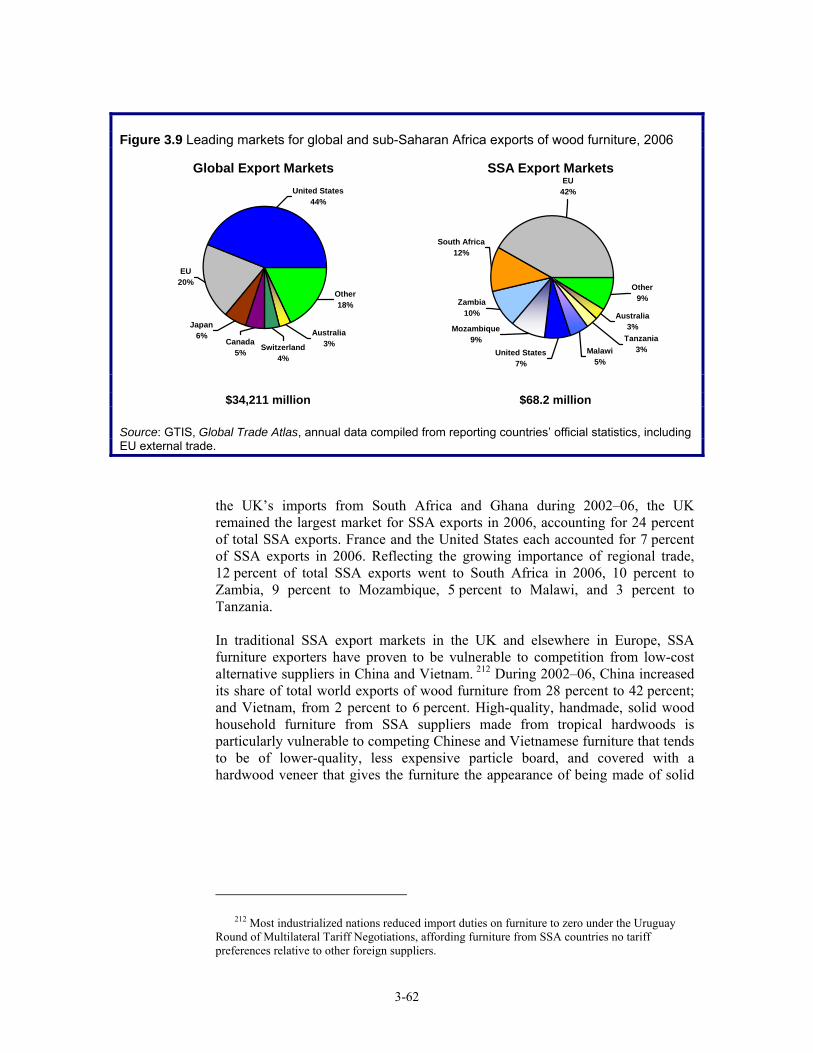
3-62
Figure 3.9 Leading markets for global and sub-Saharan Africa exports of wood furniture, 2006
Global Export MarketsUnited States
44%
EU20%
Japan6%
Canada5%
Australia3%Switzerland
4%
Other18%
SSA Export Markets
South Africa12%
EU42%
Zambia10%
Mozambique9%
United States7%
Other9%
Tanzania3%
Australia3%
Malawi5%
$34,211 million $68.2 million
Source: GTIS, Global Trade Atlas, annual data compiled from reporting countries’ official statistics, including EU external trade.
the UK’s imports from South Africa and Ghana during 2002–06, the UK remained the largest market for SSA exports in 2006, accounting for 24 percent of total SSA exports. France and the United States each accounted for 7 percent of SSA exports in 2006. Reflecting the growing importance of regional trade, 12 percent of total SSA exports went to South Africa in 2006, 10 percent to Zambia, 9 percent to Mozambique, 5 percent to Malawi, and 3 percent to Tanzania. In traditional SSA export markets in the UK and elsewhere in Europe, SSA furniture exporters have proven to be vulnerable to competition from low-cost alternative suppliers in China and Vietnam. 212 During 2002–06, China increased its share of total world exports of wood furniture from 28 percent to 42 percent; and Vietnam, from 2 percent to 6 percent. High-quality, handmade, solid wood household furniture from SSA suppliers made from tropical hardwoods is particularly vulnerable to competing Chinese and Vietnamese furniture that tends to be of lower-quality, less expensive particle board, and covered with a hardwood veneer that gives the furniture the appearance of being made of solid
212 Most industrialized nations reduced import duties on furniture to zero under the Uruguay
Round of Multilateral Tariff Negotiations, affording furniture from SSA countries no tariff preferences relative to other foreign suppliers.
3-63
hardwood.213 Garden furniture made from teak and similar water- and insect-resistant woods, and pine children’s furniture also face stiff competition from East Asian suppliers in the EU market. According to a southern Africa forest products industry publication, aspects of competition that need improvement for SSA furniture to be competitive in European markets are design, quality of pine lumber used to make the furniture, manufacturing technology, finishes, and worker training. To make these improvements, furniture producers need improved access to credit. European-based marketing agents are also needed to close the deal when competing in EU markets.214
Reduced customs barriers among countries in the SSA region and growth in disposable income in several SSA countries have led to the expansion in cross-border furniture trade among SSA partners.215 Nevertheless, SSA imports from China have taken away market share from local suppliers in selected SSA markets.216
Factors Affecting Export Patterns
The principal factors responsible for the 46 percent ($58.7 million) decrease in SSA export of wood furniture during 2002–06 were (1) intensified competition with imports from China and other East Asian suppliers in the United States, UK, and other EU markets; (2) the appreciation of the South African rand; (3) forest fires in South Africa and Zimbabwe that reduced the supply of timber for the regional pine furniture industry;217 and (4) increased local demand in South Africa.218 The strong domestic market reduced the incentive for South African
213 Amalgamated Appliance Holdings (AMAP), based in Booysens, South Africa, is an
exception. Some furniture produced by AMAP uses particle board manufactured in South Africa by PG Bison Holdings, a subsidiary of Steinhoff Africa. South Africa-based Steinhoff International Holdings owns Steinfhoff Africa and 26 percent of AMAP. Steinhoff International Holdings is one of the five largest furniture companies in Europe and Austral-Asia. AMAP became the largest furniture manufacturer in Africa when it purchased Steinhoff Africa’s furniture factories in 2006. Steinhoff International Holdings Web site. http://www.steinhoffinternational.com (accessed September 17, 2007).
214 Dunne, “Snapshot of a Successful Furniture Industry,” March 2006. 215 Exports of wood furniture from SSA countries to South Africa increased from $5.5 million
to $8.3 million (by 53 percent) during 2002–06, and SSA exports to other SSA markets rose from $15.3 million to $21.5 million (by 41 percent). By contrast, SSA exports to the EU fell sharply, from $87.2 million to $28.5 million (by 67 percent). GTIS, Global Trade Atlas.
216 Imports of wood furniture from China into South Africa, for example, jumped from $4.2 million to $85.2 million during 2002–06. GTIS, Global Trade Atlas. SSA customers have reportedly been surprised and disappointed by the lack of durability of Chinese-made furniture compared with more expensive, handmade, solid wood furniture produced by local suppliers. Micheni, “Fragile Imported Furniture Chokes Kenyan Market,” August 7, 2007.
217 Lee Raath-Brown and Maryke Naude (Wood Southern Africa & Timber Times), interview by Commission staff, Johannesburg, South Africa, October 30, 2007.
218 A combination of relatively low interest rates and increased per capita disposable income in South Africa contributed to the expansion of the domestic market in South Africa. Africa Report, “South Africa: South Africa’s Booming Furniture Retail Sector,” March 30, 2006.
3-64
producers to pursue increasingly difficult export markets in the EU and United States.219 In addition, deforestation in Ghana raised input costs for the production of furniture there, making it more difficult for garden furniture produced in Ghana to compete with UK imports from China. By contrast, vertical integration of furniture manufacturing (including timber harvesting, sawmilling, and distribution) helped control costs of making garden furniture in Cameroon and Gabon. In addition to increased competition in the UK market from furniture imported from China and appreciation of the rand, other factors contributing to the declining competitive position of the South African wood furniture industry were rising labor costs in South Africa,220 insufficient replanting of pine trees following forest fires, and inadequate investment in upgrading machinery used in South African sawmills and furniture factories.221 Zimbabwe, the second leading SSA exporter of wood furniture, was able to grow its exports of wood furniture by 69 percent (to $19.3 million) during 2002–05 following the 2004 purchase of its largest producer (Tedco) by South Africa’s leading manufacturer (Steinhoff). Steinhoff expanded Tedco’s production capacity and made quality improvements as well. The investments led to increased exports from Zimbabwe to South Africa and Zambia. Forest fires, electricity shortages, and political instability took its toll on Zimbabwe production in 2006, with exports falling by 31 percent to $13.3 million. Competition from China in the EU and U.S. Markets
Intensified competition with imports from China was the leading factor responsible for decreased exports of wood furniture from SSA to the EU and U.S. markets during 2002–06. Producers in many SSA countries are also losing domestic market shares to imports from China.222
Ghana
Scanstyle, Ghana’s top exporter of wood furniture, lost market share in the UK in 2005 and 2006 because garden furniture from China and elsewhere in East Asia was offered at prices considerably lower than Scanstyle’s prices. Scanstyle indicates that its efforts to compete with imports from China were hampered in 2004 after environmental groups convinced furniture retailers in the UK that the retailers should require wood furniture sold in their stores be certified by the Forestry Stewardship Council (FSC) as being made from wood from sustainable
219 Lee Raath-Browne and Maryke Naud (Wood Southern Africa & Timber Times), interview
by Commission staff, Johannesburg, South Africa, October 30, 2007. 220 Cape Argus, “Strike Adds to Woes of Furniture Industry,” Africa News, August 22, 2005. 221 Dunne, “Snapshot of a Successful Furniture Industry,” March 2006. The declining
competitive position of South African wood furniture in the UK market was exacerbated by the inferior quality of South African pine compared with Nordic pine.
222 Subramanian and Matthijs, “Can Sub-Saharan Africa Leap into Global Trade Network?” January 2007, 6.
3-65
sources.223 FSC certification reportedly added to Scanstyle’s costs and to the prices charged by Alexander Rose, Scanstyle’s distributor in the UK.224 Reflecting Scanstyle’s lost sales, Ghana’s exports of wood furniture to the UK fell by 54 percent during 2004–06, from $7.5 million to $3.5 million.
Although Alexander Rose, a UK-based distributor of garden furniture, is a minority owner in Scanstyle and supplies Scanstyle with furniture designs, Alexander Rose began substituting purchases of garden furniture from China and, to a lesser extent, Vietnam for a significant portion of its furniture imports from Ghana in 2005. Prices for similar pieces of garden furniture were 40 percent lower for imports from China compared with imports from Ghana, and 24 percent lower for imports from Vietnam.225
In 2007, however, Scanstyle states that they regained some of its lost customers as their customers came to realize that despite the relatively superior finishes of the garden furniture from China, the quality of the hardwood used in this furniture was inferior, making Scanstyle furniture imported from Ghana more durable.226
South Africa
A South African wood products industry journal attributed competition from lower-priced imports from China and appreciation of the rand as the two leading factors responsible for both declining exports of wood furniture from South Africa and the loss of domestic market share in South Africa to imports (box 3.11).227 South African exporters remain most competitive in the European markets for RTA furniture and children’s bunk beds.228 Imports from South Africa supply the low end of that market because the Nordic pine used by European furniture producers for most of the market is of a higher quality than South African pine. Consequently, pine furniture from South Africa is particularly vulnerable to competition from low-cost imports of similar furniture from China in the European market.229
223 In 2004, environmental NGOs began putting pressure on furniture retailers in the UK to
certify that furniture sold by them is the product of sustainable forestry. Obtaining certification from the Forestry Stewardship Council is time-consuming and costly. Samuel Nick Ayison (operations manager, Scanstyle), interview by Commission staff, Accra, Ghana, October 31, 2007.
224 Samuel Nick Ayison (operations manager, Scanstyle), interview by Commission staff, Accra, Ghana, October 31, 2007.
225 Kaplinsky and Morris, Dangling by a Thread, January 2006, 60. 226 Samuel Nick Ayison (operations manager, Scanstyle), interview by Commission staff,
Accra, Ghana, October 31, 2007. 227 Wood Southern Africa & Timber Times, “The South African Market for Timber Products,”
January 2005. 228 Dunne, “Snapshot of a Successful Furniture Industry,” March 2006. 229 Ibid.; and Mwega, “China, India, and Africa: Prospects and Challenges,” January 2007.
3-66
Box 3.11 Shift in sourcing of wood furniture from SSA to China: One company’s story In 2002, Steinhoff Africa, the largest furniture producer in Africa, purchased 34.9 percent of PG Bison Holdings (Pty.) Ltd., the leading particle board manufacturer in South Africa. Steinhoff Africa made significant investments in PG Bison’s sawmilling capacity in 2002, with much of the particle board supplying Steinhoff Africa’s furniture factories, permitting expansion of furniture exports from South Africa.1 In 2004, however, Steinhoff International Holdings, the parent company of Steinhoff Africa, opened its Imports and Sourcing Division in Shenzhen, China, and began supplying markets in the EU, Australia, and New Zealand with furniture sourced in China.2 In 2006, Steinhoff Africa, sold its furniture manufacturing operations to Amalgamated Appliances Holdings Ltd. (AMAP), a South Africa-based distributor of consumer electronics equipment and appliances. Steinhoff International Holdings had purchased a 26 percent share of AMAP in 2005.3 The opening of Steinhoff International’s sourcing division in China in 2004 and the sale of its furniture factories in South Africa in 2006 coincided with the sharp (73 percent) decline in South Africa’s exports to the EU during 2004−06. ____________
1 Steinhoff International Holdings Ltd., “Company History,” http://www.steinhoffinternational.com/bus_history.htm (accessed September 17, 2007).
2 Steinhoff International Holdings, with headquarters in Bramley, South Africa, owns over 70 factories in 25 countries, led by plants in Australia, Germany, Hungary, India, the Netherlands, New Zealand, Poland, South Africa, Ukraine, and the UK, with production focused on bedding, case goods, and lounge furniture. Steinhoff also produces auto parts in South Africa. “Business Centre,” Steinhoff International Holdings, Ltd., http://www.steinhoffinternational.com.htm (accessed September 17,2007). Steinhoff employes a staff 50,000, with 17,000 at its nine foreign affiliates, with foreign assets totaling $2.7 billion in 2004, and foreign sales amounting to $1.6 billion that year. UNCTAD, “South Africa Fact Sheet,” World Investment Report 2006; and Robbins, “Steinhoff Blazes a Bumpy Acquisition Trail,” Business Report 2007.
3 Steinhoff International Holdings Ltd., “Company History,” http://www.steinhoffinternational.com/bus_history.htm (accessed September 17, 2007).
Appreciation of the South African Rand
The appreciation of the rand relative to other currencies contributed to the declining competitiveness in South Africa’s exports of wood furniture to U.S. and European markets during 2002–06.230 The value of the rand against the U.S. dollar rose by about 40 percent between 2002 and 2006.231 In 2005, the Alexander Rose Company indicated that it stopped importing furniture from South Africa in 2005 because of the rising value of the rand. Instead, Alexander Rose imported garden furniture from China. Reflecting both lower production and transport costs for Chinese suppliers and appreciation of the rand, Chinese suppliers offered garden furniture for about one-half the price quoted by suppliers in South Africa.232
Reduced Supplies of Timber
Several countries in West and East Africa have restricted the harvesting of timber in response to deforestation, driving up costs of tropical hardwood logs and
230 Cape Argus, “Strike Adds to Woes of Furniture Industry,” August 22, 2005; and Lee Raath-
Browne and Maryke Naude (Wood Southern Africa & Timber Times), interview by Commission staff, Johannesburg, South Africa, October 30, 2007. By establishing a purchasing division in China in 2004, Steinhoff International, Africa’s largest producer of wood furniture at that time, gained additional flexibility.
231 Reflecting the importance of South Africa as a global supplier of gold and the role of gold in the South African economy, the rising price of gold during 2002−06 was a major determinant of the real effective exchange rate of the rand during the period. UNECA, Economic Report on Africa 2007, 43.
232 Kaplinsky and Morris, Dangling by a Thread, January 2006, 60.
3-67
lumber for furniture producers in those countries. In addition, forest fires in South Africa and Zimbabwe in recent years have reduced supplies of timber available for the furniture industry, forcing producers to pay higher prices for furniture-grade pine lumber.233 Whereas SSA furniture producers purchase lumber from local sawmills or import logs from other SSA countries, Chinese sawmills and furniture producers have global supply chains and are less vulnerable to local supply shortages.
Ghana
Restricted supplies of timber threaten the ability of wood products companies in Ghana to export furniture234 and may have contributed to the decrease in Ghana’s furniture exports to the UK during 2004–06.235 In 2004, the African Timber Organization listed serious supply difficulties for log-pressing units as a main constraint to further processing of timber in Ghana.236 According to the Ghana Furniture Association, deforestation is forcing furniture producers to compete with the home building industry for scarce timber resources, bidding up the price of lumber. Also, loggers are forced to go deeper into forests to find timber, adding to production costs.237 Scanstyle, Ghana’s leading exporter of wood furniture, stated that it was forced to use “less attractive” wood from Cameroon for some of its production because of supply shortages of Ghanaian timber.238
Kenya
The price of wood in Kenya rose sharply in 2005 after the government of Kenya banned logging in an effort to combat deforestation and periodic flooding (Forestry Act No. 7 of 2005).239 Furniture producers in Kenya were forced to import logs and lumber from West and Central Africa, driving up production costs and the prices of locally made furniture.240 Kenyan exports did not, however, suffer a decline due to these increased input costs as the increase in exports was concentrated in a single company facing a unique situation. A relatively small producer in Nairobi (20 employees) received a long-term contract in 2003 to supply top-of-the-line Eastern-style mahogany furniture to the Serena Hotel in Kampala, Uganda. Company officials indicate that the contract is responsible for virtually all of Kenya’s three-fold increase in exports of wood furniture to Uganda during 2002–06, from $266,000 to
233 Spadavecchia, “Bold Forestry-Products Thrust Rooted in Rural Development,
Manufacturing Aspiration,” August 24, 2007; and Wood Southern Africa & Timber Times, “Zimbabwe in 2005,” February 1, 2006.
234 USTR, Africa Growth and Opportunity Act Competitiveness Report, July 2005, 16. 235 Despite the sharp decline in exports to the UK during 2004−06, the UK accounted for 85
percent of Ghana’s total exports of wood furniture in 2006. 236 ATO, Promoting the Further Processing of Tropical Timber in Africa, 2004, 19. 237 Mr. Sackyi (president, Ghana Furniture Association), interview by Commission staff,
October 31, 2007. 238 Samuel Nick Ayison (operations manager, Scanstyle), interview by Commission staff,
Accra, Ghana, October 31, 2007. 239 Geteria, “A Break With the Past,” August 28, 2007. 240 Mwenda wa Micheni, “Fragile Imported Furniture Chokes Kenyan Market,”
August 27, 2007.
3-68
$805,000.241 Consequently, the company’s exports have not been affected by the higher prices for imported mahogany logs.
South Africa
According to the U.S. Department of Commerce, “the amount of timber available to produce furniture in South Africa is drastically declining,” in part because of forest fires in recent years and inadequate reforestation programs. The supply of lumber available for furniture production also is exacerbated by the commitment of 80 percent of sawmill production to the mining, structural support, and export markets. As a result, some furniture producers have had to import lumber cut to their specifications in other countries to supplement the shortfall in local pine lumber available for furniture production.242
Zimbabwe
Numerous forest fires during 2000–04 destroyed a significant share of Zimbabwe’s timber resources. In addition to the shortage of quality sawlogs, the Zimbabwe furniture industry frequently faces disruptions in the supply of electricity, sawmill breakdowns, industrial unrest, increased costs for imported inputs, and weak domestic demand.243
Increased Demand in South Africa
Prior to the sharp rise in interest rates by the Central Bank in June 2007, the furniture industry in South Africa had experienced a rapidly growing domestic market in recent years.244 Factors responsible for the increase in furniture sales in South Africa in 2005 and 2006 included:
$ Higher wages throughout the country; $ Record low interest rates leading to increased new construction; home ownership, and purchases of consumer durables; $ Rapid expansion of the middle class; $ Increased government spending on housing; and $ Greater disposable income.245
241 M.S. Panesar (Panesar’s Kenya Ltd.), Nairobi, Kenya, interview by Commission staff,
October 16, 2007. 242 U.S. Department of Commerce Web site,
http://www.commercecan.ic.gc.ca/scdt/bizmap/interface2.nsf/vDownload/IMI_3115/$file/X_308486.DOC (accessed August 23, 2007). The impact of forest fires on the availability of lumber for use in the production of wood furniture was confirmed in a USITC staff interview with Lee Raath-Browne and Maryke Naude, Wood Southern Africa & Timber Times, Johannesburg, South Africa, October 30, 2007.
243 Wood Southern Africa & Timber Times, “Zimbabwe in 2005,” February 1, 2006. 244 Lee Raath-Browne and Maryke Naude (Wood Southern Africa & Timber Times),
Johannesburg, South Africa, interview by Commission staff, October 30, 2007. 245 Africa Report, “South Africa: South Africa’s Booming Furniture Retail Sector,”
March 30, 2006.
3-69
South African furniture producers also indicated that appreciation of the rand and stiff competition with imports from China and Vietnam reduced the profitability of exporting to Europe. As a result, the companies are focusing their marketing efforts on the local market where they receive a better return.246 Even in the domestic market, however, local furniture producers are losing market share to imports from China and are struggling to maintain sales volumes.247 Foreign Investment Has Developed New Exporters
As locally sourced credit for start-up companies is often difficult to obtain, foreign investment has been critical for the establishment of export-oriented furniture manufacturing operations in a number of countries. Examples of investments in SSA furniture production are provided below.
Cameroon
Bofor Bodrum, a company based in Turkey, founded Bofor Cameroon S.A. in Yaounde in 2005. The company produces furniture and other wood products, using hardwoods such as Iroko, Sapelli, Acajou, and Sipo. Bofor’s emphasis is on exports of outdoor furniture to France. 248
Gabon
The French timber company, Rougier Gabon, has operated in Gabon for over 50 years and is the country’s principal producer and exporter of logs and laminated wood.249 In 2005, Rougier Gabon built a timber processing complex at Mobouma-Oyali, Gabon. The investment, valued at $7.3 million, led to increased exports of wood furniture to France.
Ghana
One firm, Scanstyle, accounted for 95 percent of Ghana’s total exports of wood furniture in 2006.250 All of Scanstyle’s exports consisted of garden furniture, with 95 percent going to the UK-based Alexander Rose Company.251 Alexander Rose provides Scanstyle with technical advice regarding the selection of trees for use in furniture manufacture, design of the furniture, and manufacturing methods.252
246 Kaplinsky and Morris, Dangling by a Thread, January 2006, 65. 247 Imports of wood furniture from China into South Africa, for example, jumped from
$4.2 million to $85.2 million during 2002–06. GTIS, Global Trade Atlas. 248 Bofor Cameroon Web site, http://www.boforcameroon.com/en_2_2.htm (accessed
October 2, 2007). 249 Business Africa, “Agribusiness: Gabon,” August 1, 2005. 250 Ghanaian Export Promotion Council data provided in interview by Commission staff,
Accra, Ghana, October 31, 2007. According to a 2007 Ghana Investment Promotion Centre report, only 6 of the 53 furniture manufacturers in Ghana in 2007 had the capacity to manufacture export-quality furniture and joinery.
251 Samuel Nick Ayison (operations manager, Scanstyle), interview by Commission staff, Accra, Ghana, October 31, 2007.
252 Alexander Rose company brochure.
3-70
A smaller exporter, Semak Ghana Ltd., relies on a consortium of 15 small producers in Ghana employing approximately 200 workers (box 3.12). The company received assistance from a Ghanaian expatriate in Germany during 2001–03 to develop handmade modern furniture with an African accent. The Swiss Import-Export Programme (SIPPO) currently assists the company in marketing its products in Europe. The target markets are the UK, Germany, and the Netherlands.253
Box 3.12 Visions of a wood furniture city in Ghana
Production of wood products in Ghana is concentrated in the Accra-Tema metropolis, Kumasi, and Takoradi.1 Producers there have joined to form the Furniture and Wood Products Association of Ghana. According to the African Timber Organization (ATO), producers in Ghana hope to transition from exports of garden furniture to exports of higher-value-added interior furniture.2 To assist in this transition, the World Bank has proposed the establishment of an “Accra Wood Furniture City” to be located in the Tema Free Zone. Small-scale furniture manufacturers and related carpenters, joiners, and craftsmen would be relocated from their currently widely-dispersed locations in the Accra region to a site that would encourage collaboration in the development of a furniture manufacturing cluster. It is anticipated that the clustering would lead to improvements in productivity and quality that would make furniture produced in Ghana more competitive in both local and export markets. The clustering would also reduce environmental risks associated with current production of furniture in residential areas. The World Bank plan also would establish a wood technology institute located in the furniture city and has specific proposals for the construction of infrastructure to support the city (buildings, roads, walkways, and sewers).3 In keeping with the vision of the 1994 Forest Policy, Ghana banned log exports in an effort to encourage processing of its timber resources. It is the only West and Central African nation to institute an outright ban, whereas other countries have imposed export tax on logs.4 Illegal logging, however, is undermining the Forest Policy. The EU is working with the Forestry Commission of Ghana to stop illegal logging and provide technical assistance regarding sustainable forestry practices. These efforts are intended to increase the availability of logs for use in the manufacture of wood furniture for both domestic and export markets. First Counselor Dirk Naezer, head of the EU delegation on Economic and Micro Trade in Ghana, recommended to the Tema Wood Manufacturers Association of Ghana that greater emphasis should be placed on exporting wood products to ECOWAS partners.5 Establishment of the Accra Wood Furniture City may be a step in that direction. ____________
1 Ghana Investment Promotion Centre, “Ghana Investment Profile: Furniture and Wood Processing.” 2 ATO, Promoting the Further Processing of Tropical Timber in Africa, 2004, 14. 3 George Kobina Fynn (deputy chief commercial officer, Ministry of Trade, Industry, and Private Sector
Development), interview by Commission staff, Accra, Ghana, October 31, 2007. 4 European Commission for the Promotion of Investment (Pro-invest), Sector Orientation Report: West and Central
Africa, February 2004, Annex A 07, 1. 5 International Log & Sawnwood Prices, “EU to Assist Ghanaian Communities in Combating Illegal Logging,”
September 16–30, 2007. ECOWAS members include Benin, Burkina Faso, Cape Verde, Côte d’Ivoire, Gambia, Ghana, Guinea, Guinea-Bissau, Liberia, Mali, Niger, Nigeria, Senegal, Sierra Leone, and Togo.
Mali
Mali (Australia) Pty Ltd. established a manufacturing subsidiary in Mali, Mali Furniture, in 2004. The company manufactures nursery furniture that is sold in Australia. The furniture competes on the basis of safety, durability, and styling.254 Mali began exporting wood furniture to Australia in 2004 and exports reached
253 SIPPO Web site, http://www.sippo.ch/files/catalogues/imm06.pdf. 254 Mali Furniture Web site, http://www.malifurniture.com (accessed August 8, 2007).
3-71
$1.5 million the following year. Australia accounted for 94 percent of Mali’s exports of wood furniture in 2006.
Namibia
The U.S.-African Development Foundation provided $222,857 to help six employees purchase a high-end furniture manufacturer in Namibia in 2006. Foundation funds were also used to purchase new machinery, equipment, and fittings to enable the expansion of furniture production to market to tourists.255
Zimbabwe
Steinhoff Africa Ltd., a subsidiary of South Africa-based Steinhoff International Holdings, purchased controlling interest in Tedco Industries in 2004. Tedco is the largest furniture manufacturer in Zimbabwe. The South African investment increased Tedco’s production capacity from 15 to 150 lounge suites per day256 and enabled Tedco to start exporting wood furniture to Mozambique and Malawi by January 2005.257 By 2007, Tedco began exporting furniture and bedding to South Africa and juvenile furniture to Europe.258
Policies to Promote the Industry and Increased Investment
To compete with Chinese and other East Asian suppliers in European markets for wood furniture, African suppliers are focusing on the “green” niche.259 To supply that niche, however, the independent international non-governmental organization Forestry Stewardship Council (FSC)260 must certify that furniture produced by the SSA exporters is produced from timber that has been harvested using sustainable practices. Several governments have instituted regulations to improve their industries’ chances of obtaining FSC certification.261 These
255 U.S. African Development Foundation, “Namibia Investment Summary,” April 4, 2007. 256 Dube, “Shot in the Arm for Furniture Manufacturer Tedco Industries,” The Financial
Gazette, September 16, 2004. 257 Dube, “Tedco Spreads its Wings Regionally,” The Financial Gazette, January 6, 2005. 258 Harald (Harare), “Tedco to Spread Tentacles Regionally,” September 14, 2007. 259 In order to compete with lower-cost suppliers, producers of articles in developing countries
are increasingly turning to products and marketing strategies that will permit them to appeal to consumers who are willing to pay a premium for the articles they are offering. Some environmentally and socially conscious consumers are will to pay a premium for “green” or “fair-trade” articles, such as “organic” (fertilizer and pesticide free), shade-grown, or fair-trade coffee; apparel made from organic cotton; and “sustainable” furniture (made from trees that were harvested by companies that use sustainable forestry practices). For information on sustainable furniture, see, for example, Holt-Johnstone, “The Marketing of Sustainable Furniture,” May/June, 2007, 47; Hasek, “Interest in Sustainable Furniture Increases As Talk Indoor Air And Deforestation Pick Up,” August 17, 2007; and John, “How Do You Know That Wood Is Sustainable?” December 3, 2007.
260 The Forestry Stewardship Council, based in Bonn, Germany, was established in 1990. It sets international standards for responsible forest management and accredits independent organizations that can certify forest product producers to FSC standards. To market a product as FSC certified, the forest products operation must obtain a Forest Management Certificate and a Chain of Custody Certificate. FSC Web site, http://fsc.org/en/about.
261 However, some research has determined that some of these policies such as export quotas and taxes on log exports have a negative impact on sustainable forestry. See, for example, Malcolm Gillis and Robert Repetto, eds., Public Policies and the Misuse of Forest Resources, 1988.
3-72
regulations are often part of a forestry industry program that also encourages or requires that processing of harvested logs be performed in the country prior to exportation.
Cameroon
The government of Cameroon has encouraged processing of the country’s timber resources as part of its overall strategy to adopt policies that will improve the productivity of the forestry sector. According to the Global Timber Organization, contrary to government policies, about 80 percent of Cameroon’s exports of logs to China are harvested illegally and exported without being processed.262 Among other objectives, government policies try to reduce illegal logging and promote further processing of timber resources. Specific policies and measures adopted by the government of Cameroon include:263 $ Forest concessions granted with the obligation to establish industrial processing units; $ Establishment of a Directorate for the Promotion and Processing of Forest Products in 1998 with the following mandate: develop and implement a timber marketing policy, promote modern timber processing crafts and techniques, and pursue export opportunities; $ Establishment of a standardization and quality unit responsible for drafting national standards (Decree no. 98/313 of December 9, 1998); $ Adoption of an investment charter (2000); $ Introduction of an industrial free zone scheme as a major industrial incentive instrument (out of 44 companies registered in the scheme in 2000, 33 were in the forest products sector); and $ Export quotas and a progressive surtax on log exports (2000).
Gabon
Government officials in Gabon see the production of furniture, rather than the export of logs, as an important mechanism to diversify away from petroleum and other raw material exports.264 The government of Gabon’s timber strategy “focuses on increasing the percentage of timber processed domestically in order to increase value added.” According to estimates from the French economic mission, the percentage of timber processed domestically “has increased from 7 [percent] in 1995 to 33 [percent] in 2004.”265 The government of Gabon has encouraged processing of the country’s timber resources as part of its overall strategy to adopt policies that will lead to sustainable forest management in the country. According to the
262 Global Timber Organization, China - Illegal Imports and Exports of Wood-Based Products
(2006), 2007. 263 ATO, Promoting the Further Processing of Tropical Timber in Africa, 2004, 22. 264 Business Africa, “Gabon.” 265 Business Africa, “Agribusiness: Gabon,” August 1, 2005.
3-73
Global Timber Organization, about 80 percent of Gabon’s exports of logs to China are harvested illegally.266 Specific policies and measures adopted by the government of Gabon to reduce illegal logging and promote further processing of timber resources include:267 $ Export tax exemption on processed products; $ Tax on log exports and restrictions on log exports; $ Establishment of the Interministerial Commission on Industrialization (1995); $ Revision of the Forestry Law; $ Introduction of tax incentives: no value-added tax on specific wood-processing equipment; $ Granting of large logging concessions conditional on an industrialization plan; and $ Establishment of a Forest Industry Active Support Fund.
In January 2007, Gabon became the first African member of Programme for the Endorsement of Forest Certification (PEFC). “PEFC is a global scheme, launched in 1999, that provides buyers of timber with guarantees that they are purchasing wood only from sustainably managed forests. . . . The scheme could potentially provide additional revenues to Gabon by providing premium prices for timber under the scheme from environmentally conscious buyers in Europe and North America. . . . Libreville is also at the forefront of efforts to create a Pan-African Forest Certification System.”268
Ghana
Specific policies and measures adopted by the government of Ghana to promote further processing of timber resources include (box 3.13):269
Box 3.13 Ghana to help Liberia salvage rubber trees to make furniture The USAID-funded West Africa Trade Hub, based in Accra, Ghana, is coordinating a cooperative effort of the government of Liberia and the Timber Industry Development Division of the Forestry Commission of Ghana to provide advice to owners of rubber tree plantations in Liberia regarding the harvesting of over-age rubber trees. Currently, old rubber trees are cut down, then burned to produce charcoal. The new program will instruct plantation owners how to chemically treat the fallen tree so the rubber wood can be used to produce lumber and downstream products such as furniture.1 _________
1 White, “Rubber Wood Lumber May Help Liberia Bounce Back,” September 2007.
266 Global Timber Organization, China - Illegal Imports and Exports of Wood-Based Products
(2006),” 2007. 267 ATO, Promoting the Further Processing of Tropical Timber in Africa, 22. 268 Business Africa, “Regulatory Watch: Gabon,” February 1, 2007. 269 ATO, Promoting the Further Processing of Tropical Timber in Africa, 2004, 23.
3-74
A focus in the 1994 Forest Policy on further processing
with the objectives of restructuring the forest industry for the efficient utilization of timber from sustainably managed forests, promoting secondary and tertiary processing, improving processing efficiency, and improving plantation timber processing capacity; and
Establishing export processing zones aimed at promoting
investment in the production of articles that would further process and re-export African Timber Organization member-country timber products and make better use of current excess production capacity.
South Africa
During 2002−06, the government of South Africa limited its assistance to the forest products industry to a program to upgrade the skill levels of workers in the forest products sector. The Forest Industries Education and Training Authority initiated a project in July 2003 to deliver skills development programs for the manufacture of compact, affordable, multipurpose furniture for use in smaller, affordable housing. The program was funded by the Department of Labor’s National Skills Fund.270 In August 2007, the government took a decidedly more proactive role in addressing the problems of the forest products industry (box 3.14).
270 Wood Southern Africa & Timber Times, “The Furniture Manufacturing Skills Development
Project,” May 2003.
3-75
Box 3.14 The government of South Africa intervenes in forest products sector in 2007 Until August 2007, the government of South Africa had taken a relatively “hands-off” approach toward the forest products industry, allowing the market to guide industry decision makers. This position led to a critique in South Africa’s leading forest products trade journal that the government was not doing enough to promote the industry, particularly with regard to manpower training and reforestation.1
In August 2007, South Africa’s Department of Trade and Industry announced an industrial promotion program. The program included tax concessions in four industrial sectors, including furniture. One objective of the new policy was to lower the cost of capital for the furniture industry and improve the industry’s export competitiveness.2 In the domestic market, however, the government’s decision to raise interest rates in response to inflationary pressures decreased demand for interest rate-sensitive goods, including furniture, in the third quarter of 2007.3
Also in August 2007, South Africa’s Department of Water Affairs and Forestry (DWAF) announced a National Industrial Policy Framework (NIPF) and an associated Industrial Policy Action Plan. Under the NIPF, 100,000 hectares of land in the Eastern Cape and KwaZulu-Natal regions will be reforested, providing timber resources for downstream production of furniture and other wood products. The plan includes a cooperative effort with PG Bison to replant forests that will feed the company’s nearly completed particle board plant located outside the town of Ugie, which will supply the furniture and building materials industries. The project is expected to create 2,700 jobs in forestry and at the plant.4
According to Masizake Zimela, the Department of Trade and Industry’s (DTI’s) Chief Director of Resource-Based Industries, demand for timber has exceeded supply because of (1) the high rate of economic growth, (2) a decrease in public and private sector funding for reforestation, and (3) forest fires. The shortage of timber has led to the substitution of imported furniture for locally produced furniture, reducing employment in the sector. To counter the increase in furniture imports, the DTI will collaborate with the Small Enterprise Development Agency (SEDA) Technology Programme, the district municipality, the Eastern Cape Development Corporation, and the provincial government to set up a furniture technology incubator. Its aim is to facilitate activities requiring more advanced technology and higher skill levels, specifically high-end furniture design.5 The incubator, which will be located in Mthatha, is expected to be in operation by April 2008. The DTI’s long-term goal for the sector is to upgrade the skill levels of the workers and to develop products that are of high enough quality to penetrate international markets.6
____________
1 See Dunne, “Snapshot of a Successful Furniture Industry,” March 1, 2006. 2 Mafu, “DTI’s Tax Incentives Plan Draws Mixed Response,” August 7, 2007. 3 Business Day, “Manufacturing Confidence Down,” September 17, 2007. 4 Spadavecchia, “Bold Forestry-Products Thrust Rooted in Rural Development, Manufacturing Aspiration,”
August 24, 2007. 5 Ibid. 6 Ibid.
3-76
Wood Furniture Bibliography African Timber Organization (ATO). Promoting Further Processing of Tropical Timber in Africa, Libreville, Gabon: African Timber Organization, 2004. http://www.itto.or.jp/live/Live_Server/839/PD%2015-98%20Rev.%202(E).pdf (accessed September 10, 2007). “Africa’s Economy: A Glimmer of Light at Last?” The Economist, June 24, 2006. Africa Report. “South Africa: South Africa’s Booming Furniture Retail Sector,” March 30, 2006. http://www.Africareport.com/news_articles.aspx?Article_ID=493 (accessed August 23, 2007). Broadman, Harry G. Africa’s Silk Road: China and India’s New Economic Frontier, The World Bank, 2006. Business Africa. “Agribusiness Gabon,” August 1, 2005. http://www.eiu.com/index.asp?layout=displayIssuePrint&issue (accessed July 24, 2007). ——. “Gabon.” http://www.businessafrica.net/africabiz/countries/gabon.php (accessed September 6, 2007). ——. “Regulatory Watch: Gabon,” February 1, 2007. http://www.eiu.com/index.asp?layout=displayIssuePrint&issue (accessed July 24, 2007). Business Day. “Manufacturing Confidence Down,” September 17, 2007. http://www.transcripts.businessday.co.za/cgi-bin/transcripts/t-showtranscript.pl?1190070527 (accessed September 19, 2007). Cape Argus. “Strike Adds to Woes of Furniture Industry,” August 22, 2005. http://w3.nexis.com/new/delivery/PrintDoc.do?fileSize=85648&job (accessed July 24, 2007).
CIA. “Kenya.” The World Factbook. http://www.cia.gov/library/publications/the-world-factbook/print/ke/html (accessed September 19, 2007).
CIA. “Tanzania.” The World Factbook. http://www.cia.gov/library/publications/the-world-factbook/print/tz/html (accessed September 19, 2007).
Daily Green. “How Do You Know That Wood is Sustainable?” December 2, 2007. http://www.thedailygreen.com/print-this/environmental-news/community-news/sustainably-harvested-wood-66120201 (accessed December 3, 2007).
“Deputy Minister Sue van Der Merwe to Host Polish Counterpart for Political Consulations.” Department of Foreign Affairs, Republic of South Africa Web site. http://www.dfa.gov.za/does/2007/polish1005.htm (accessed October 7, 2007).
Dube, Zitha. “Shot in the Arm for Furniture Manufacturer Tedco Industries.” The Financial Gazette, September 16, 2004. http://www.fingaz.co.zw/fingaz/2004/September/September16/6534.shtml (accessed September 17, 2007).
3-77
——. “Tedco Spreads its Wings Regionally.” The Financial Gazette, January 6, 2005. http://www.fingaz.co.zw/fingaz/2005/January/January6/7474.shtml (accessed September 17, 2007). Dunne, Nikki. “Snapshot of a Successful Furniture Industry.” Wood Southern Africa & Timber Times, March 2006. http://www.timbersa.co.za/WoodSA/article.asp?articleID=490&month=3&year=2006 (accessed September 13, 2007). Environmental Protection Agency, EPA Office of Compliance Sector Notebook Project: Profile of the Wood Furniture and Fixtures Industry, September 1995. European Commission for the Promotion of Investment (Pro-invest). Sector Orientation Report: West and Central Africa. Brussels, February 2004. Food and Agriculture Organization of the United Nations (FAO). “Promotion of Valuable Hardwood Plantations in the Tropics: A Global Overview”. Forest Resources Development Service. Forest Resources Division. Unpublished report based on the work of F.K. Odoom. Forest Plantation Thematic Papers, Working Paper 4, 2001. Forest Stewardship Council Web site, http://fsc.org/en/about (accessed February 3, 2008). Geteria, Wamugunda. “A Break with the Past.” The Nation, August 28, 2007. http://www.allafrica.com/stories/printable/200708271484.html (accessed August 28, 2007). Ghana Investment Promotion Centre. “Ghana Investment Profiles: Furniture and Wood Processing.” http://www.unido.org/file-storage/index?folder_id=16946 (accessed September 4, 2007).
Gillis, Malcolm, and Robert Repetto, eds. Public Policies and the Misuse of Forest Resources, Cambridge University Press, 1988.
Global Timber Organization. China – Illegal Imports and Exports of Wood-Based Products (2006), 2007. http://www.globaltimber.org.uk/ChinaIllegalImpExp.htm (accessed August 3, 2007). Global Trade Information Services, Inc. (GTIS), Global Trade Atlas. Annual data compiled from reporting countries’ official statistics, including EU27 external trade. http://www.gtis.com/gta/usitc/ (accessed various dates). Hasek, Glenn. “Interest in Sustainable Furniture Increases as Talk Indoor Air and Deforestation Pick Up.” Green Lodging News, August 17, 2007. http://www.enn.com/green_building/article/21956/print (accessed August 27, 2007). Herald (Harare). “Tedco to Spread Tentacles Regionally,” September 14, 2007. http://allafrica.com/stories/printable/200709140044.html (accessed September 17, 2007).
Holt-Johnstone, Janet. “The Marketing of Sustainable Furniture.” Furniture World, May/June, 2007.
3-78
International Log & Sawnwood Prices, “EU to Assist Ghanaian Communities in Combating Illegal Logging,” September 16−30, 2007. http://www.globalwood.org/market1/aaw20070902.htm (accessed October 8, 2007). “Inside Story.” Cabinet Maker, July 21, 2006. Http://w3.nexis.com/new/delivery/PrintDoc.do?fileSize=85648&job (accessed July 24, 2007). Kaplinsky, Raphael and Mike Morris. Dangling by a Thread: How Sharp are the Chinese Scissors? Brighton, United Kingdom. Institute of Development Studies, January 2006. Mafu, Tony. “DTI’s Tax Incentives Plan Draws Mixed Response.” Business Report, August 7, 2007. http://www.busrep.co.za/general/print_article.php?farticleId=3981865&fSectionId=561&f... (accessed August 7, 2007). Mali Furniture Web site. http://www.malifurniture.com (accessed August 8, 2007). Matthee, Marianne and Wim Naude. The Significance of Transport Costs in Africa. United Nations University. Policy Brief No. 5, 2007. Muhoho, Robert. “Doing Business in Kenya: Manufacturing of Electronics, Paper, Metal, Vehicles, Plastics and Mining.” Buzzle.com. http://www.buzzle.com/articles/business-kenya-manufacturing-electronics-paper-metal-ve . . . (accessed September 24, 2007). Mwega, Francis M. “China, India, and Africa: Prospects and Challenges.” Nairobi: School of Economics, University of Nairobi, January 2007. Mwenda wa Micheni. “Fragile Imported Furniture Chokes Kenyan Market,” Business Daily Africa, August 7, 2007. http://www.bdafrica.com/index2.php?option=com_content&task=view&id=2332&pop=1&page=0&Itemid=5822 (accessed August 27, 2007). “New Credit Act Knocks Sales by 13.5%.” Business Report, August 16, 2007. http://www.busrep.co.za/general/print_article.php?fArticleId=3985354&fSectionId-612&f (accessed August 23, 2007). Republic of Uganda. Increasing Incomes Through Exports: A Plan for Zonal Agricultural Production, Agro-Processing and Marketing, August 2004.
Republic of Zimbabwe, Ministry of Industry and Trade. “Zimbabwe.” The Official SADC Trade, Industry, and Investment Review 2006, 277. Robbins, Tom. “Steinhoff Blazes a Bumpy Acquisition Trail.” Business Report 2007. http://www.busrep.co.za/general/print_article.php?ArticleId=4027736&fSectionId=561&f (accessed September 13, 2007). ——. “Steinhoff to Nail Down Wood Supply to Help PG Bison Meet Demand.” Business Report 2007, September 10, 2007. http://www.busrep.co.za/general/print_article.php?fArticleId=4027835&fSectionId=563&f (accessed September 11, 2007).
3-79
SIPPO Web site. http://www.sippo.ch/files/catalogues/imm06.pdf (accessed October 2, 2007). Spadavecchia, Olivia. “Bold Forestry-Products Thrust Rooted in Rural Development, Manufacturing Aspirations.” Engineering News, August 24, 2007. http://www.engineeringnews.co.za/print_version.php?a_id=114287 (accessed August 24, 2007). Spalding, Josephine. Industry and Trade Summary: Furniture and Motor Vehicle Seats. USITC Publication 3382. Washington, DC: USITC, 2005. January 2001. Steinhoff International Holdings Ltd. “Company History.” http://www.steinhoffinternational.com/bus_history.htm (accessed September 17, 2007). Subramanian, Uma and Matthias Matthijs. “Can Sub-Saharan Africa Leap into Global Network Trade?” World Bank Policy Research Group. Working Paper 4112, January 2007. Taylor, Ian. “China’s Environmental Imprint in Africa.” China Dialogue, February 2, 2007. http://www.mit.edu/blos/blog/2007/09/18/chanas-environmental-footrint-in-africa/ (accessed September 19, 2007. Teal, Francis. “The Ghanaian Manufacturing Sector 1991-1995: Firm Growth, Productivity and Convergence,” WPS/98-17. Centre for the Study of African Economics, Institute for Economics and Statistics, Oxford University, June 1998. UNCTAD. “South Africa Fact Sheet.” World Investment Report 2006. http://www.unctad.org.wir (accessed September 25, 2007). United Nations Economic Commission for Africa (UNECA). Economic Report on Africa 2007: Accelerating Africa’s Development through Diversification. Addis Ababa: UNECA, 2007. U.S. African Development Foundation. “Namibia Investment Summary,” April 4, 2007. http://www.usdaf.gov (accessed September 12, 2007). ——. “Paving New Routes to Credit Access in Northern Tanzania.” ADF e-news, July 2004. http://www.adf.gov/enews0704kda.htm (accessed September 12, 2007). U.S. Department of Commerce. Untitled. http://www.commercecan.ic.gc.ca/scdt/bizmap/interface2.nsf/vDownload/IMI_3115/$file/X_308486.DOC (accessed August 23, 2007).
USTR. Africa Growth and Opportunity Act Competitiveness Report. Washington, DC: USTR, July 2005. Watkins, Ralph. “The China Challenge to Manufacturing in Mexico.” Journal of the Flagstaff Institute, XXXI, no. 1 (June 2007): 44–70. White, Julianna. “Rubber Wood Lumber May Help Liberia Bounce Back,” The WATH Factor, September 2007. http://www.watradehum.com/index2.php?option=com_content&task=view&id=746&pop=... (accessed September 14, 2007).
3-80
Wood Southern Africa & Timber Times. “The Furniture Manufacturing Skills Development Project,” May 2003. http://www.timbersa.co.za/WoodSA/article.asp?articleID=188&month=5&year=2003 (accessed September 13, 2007). ——. “The South African Market for Timber Products,” January 2005. http://www.timbersa.co.za/WoodSA/article.asp?articleID=380&month-1&year=2005 (accessed September 13, 2007). “Zimbabwe: Back to the Dark Ages.” The Economist, May 10, 2007.
Wood Southern Africa & Timber Times. “Zimbabwe in 2005,” February 2006. http://www.timersa.co.za/WoodSA/article.asp?articleID=480&month=2&year=2006 (accessed September 13, 2007).
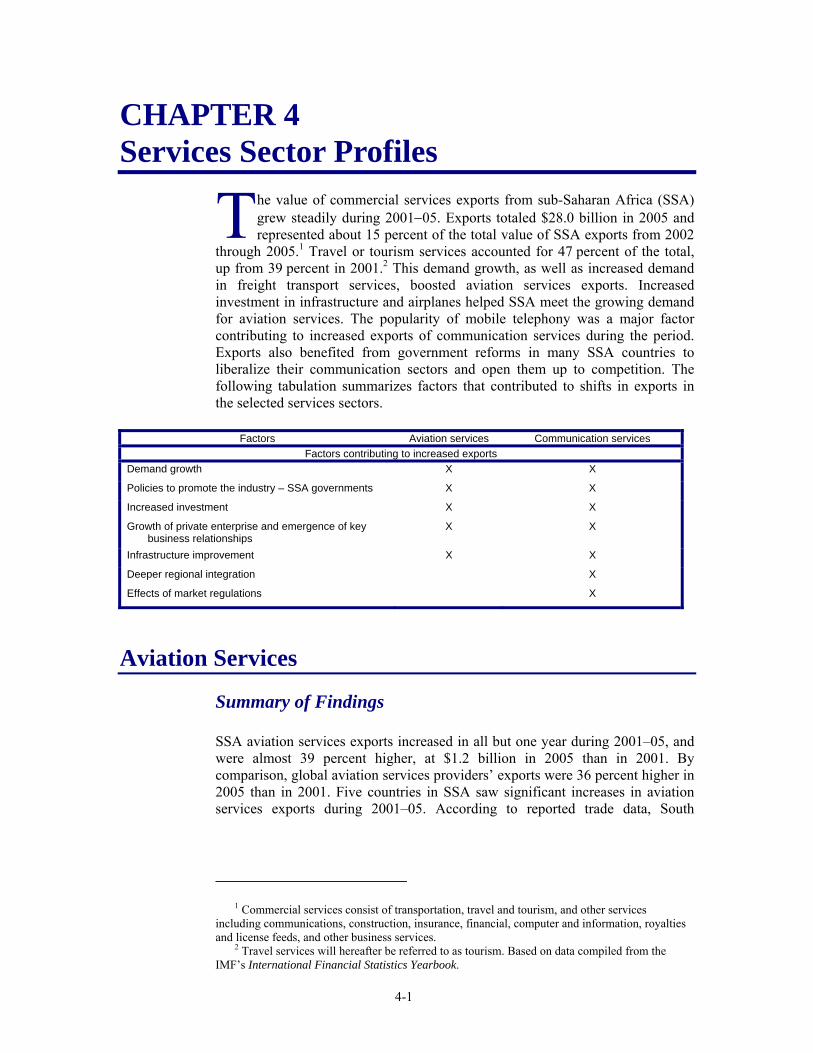
4-1
CHAPTER 4 Services Sector Profiles
he value of commercial services exports from sub-Saharan Africa (SSA) grew steadily during 2001−05. Exports totaled $28.0 billion in 2005 and represented about 15 percent of the total value of SSA exports from 2002
through 2005.1 Travel or tourism services accounted for 47 percent of the total, up from 39 percent in 2001.2 This demand growth, as well as increased demand in freight transport services, boosted aviation services exports. Increased investment in infrastructure and airplanes helped SSA meet the growing demand for aviation services. The popularity of mobile telephony was a major factor contributing to increased exports of communication services during the period. Exports also benefited from government reforms in many SSA countries to liberalize their communication sectors and open them up to competition. The following tabulation summarizes factors that contributed to shifts in exports in the selected services sectors.
Factors Aviation services Communication services
Factors contributing to increased exports Demand growth X X
Policies to promote the industry – SSA governments X X
Increased investment X X
Growth of private enterprise and emergence of key business relationships
X X
Infrastructure improvement X X
Deeper regional integration X
Effects of market regulations X
Aviation Services
Summary of Findings SSA aviation services exports increased in all but one year during 2001–05, and were almost 39 percent higher, at $1.2 billion in 2005 than in 2001. By comparison, global aviation services providers’ exports were 36 percent higher in 2005 than in 2001. Five countries in SSA saw significant increases in aviation services exports during 2001–05. According to reported trade data, South
1 Commercial services consist of transportation, travel and tourism, and other services
including communications, construction, insurance, financial, computer and information, royalties and license feeds, and other business services.
2 Travel services will hereafter be referred to as tourism. Based on data compiled from the IMF’s International Financial Statistics Yearbook.
T
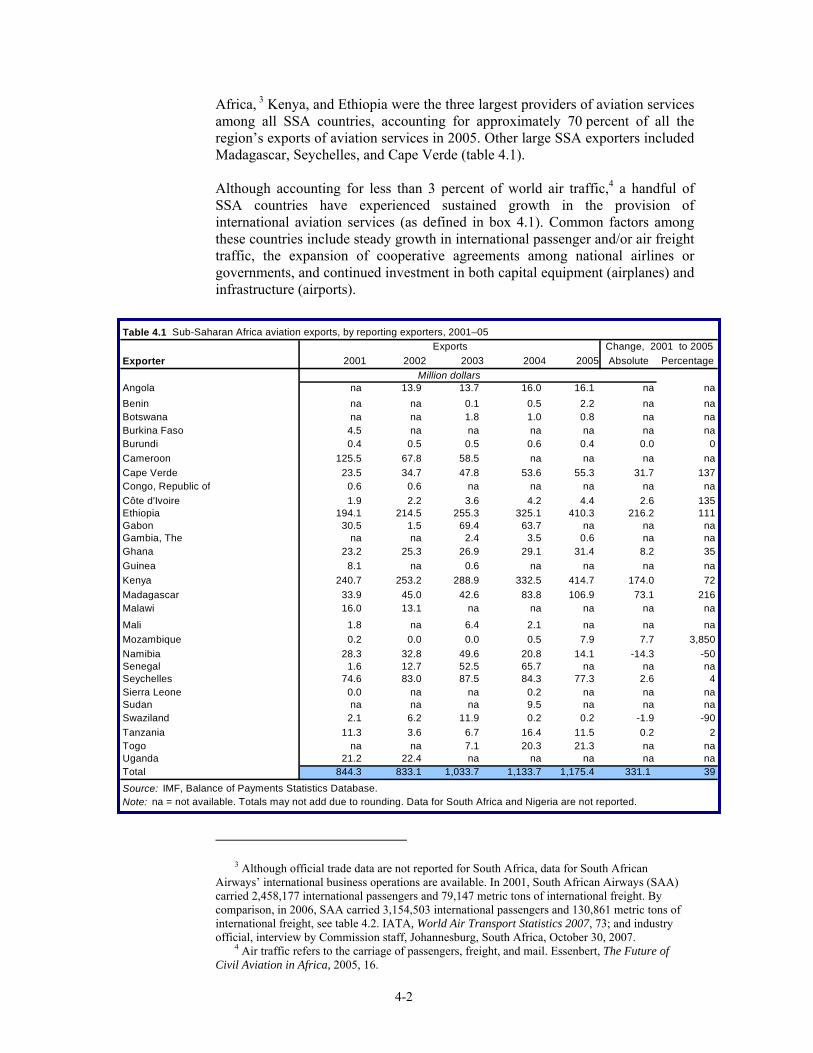
4-2
Exporter 2001 2002 2003 2004 2005 Absolute Percentage
Angola na 13.9 13.7 16.0 16.1 na naBenin na na 0.1 0.5 2.2 na naBotswana na na 1.8 1.0 0.8 na naBurkina Faso 4.5 na na na na na naBurundi 0.4 0.5 0.5 0.6 0.4 0.0 0Cameroon 125.5 67.8 58.5 na na na naCape Verde 23.5 34.7 47.8 53.6 55.3 31.7 137Congo, Republic of 0.6 0.6 na na na na naCôte d'Ivoire 1.9 2.2 3.6 4.2 4.4 2.6 135Ethiopia 194.1 214.5 255.3 325.1 410.3 216.2 111Gabon 30.5 1.5 69.4 63.7 na na naGambia, The na na 2.4 3.5 0.6 na naGhana 23.2 25.3 26.9 29.1 31.4 8.2 35Guinea 8.1 na 0.6 na na na naKenya 240.7 253.2 288.9 332.5 414.7 174.0 72Madagascar 33.9 45.0 42.6 83.8 106.9 73.1 216Malawi 16.0 13.1 na na na na na
Mali 1.8 na 6.4 2.1 na na naMozambique 0.2 0.0 0.0 0.5 7.9 7.7 3,850Namibia 28.3 32.8 49.6 20.8 14.1 -14.3 -50Senegal 1.6 12.7 52.5 65.7 na na naSeychelles 74.6 83.0 87.5 84.3 77.3 2.6 4Sierra Leone 0.0 na na 0.2 na na naSudan na na na 9.5 na na naSwaziland 2.1 6.2 11.9 0.2 0.2 -1.9 -90Tanzania 11.3 3.6 6.7 16.4 11.5 0.2 2Togo na na 7.1 20.3 21.3 na naUganda 21.2 22.4 na na na na naTotal 844.3 833.1 1,033.7 1,133.7 1,175.4 331.1 39
Source: IMF, Balance of Payments Statistics Database. Note: na = not available. Totals may not add due to rounding. Data for South Africa and Nigeria are not reported.
Table 4.1 Sub-Saharan Africa aviation exports, by reporting exporters, 2001–05
Million dollars
Change, 2001 to 2005Exports
Africa, 3 Kenya, and Ethiopia were the three largest providers of aviation services among all SSA countries, accounting for approximately 70 percent of all the region’s exports of aviation services in 2005. Other large SSA exporters included Madagascar, Seychelles, and Cape Verde (table 4.1). Although accounting for less than 3 percent of world air traffic,4 a handful of SSA countries have experienced sustained growth in the provision of international aviation services (as defined in box 4.1). Common factors among these countries include steady growth in international passenger and/or air freight traffic, the expansion of cooperative agreements among national airlines or governments, and continued investment in both capital equipment (airplanes) and infrastructure (airports).
3 Although official trade data are not reported for South Africa, data for South African
Airways’ international business operations are available. In 2001, South African Airways (SAA) carried 2,458,177 international passengers and 79,147 metric tons of international freight. By comparison, in 2006, SAA carried 3,154,503 international passengers and 130,861 metric tons of international freight, see table 4.2. IATA, World Air Transport Statistics 2007, 73; and industry official, interview by Commission staff, Johannesburg, South Africa, October 30, 2007.
4 Air traffic refers to the carriage of passengers, freight, and mail. Essenbert, The Future of Civil Aviation in Africa, 2005, 16.
4-3
Industry Overview
A handful of large transnational carriers based in North America, Europe, and Asia account for the bulk of global aviation services.5 Generally, for air transport firms, the ability to renew aircraft fleets, promote product differentiation, incorporate the newest technologies, and secure greater market access through consolidation and international agreements are some of the key factors in maintaining global competitiveness. In addition, external factors such as fuel costs, global macroeconomic conditions, and, more recently, terrorism also play critical roles in determining the industry’s health.6
In general, SSA aviation services firms face competitive pressures similar to those of their larger global counterparts, but on a much smaller and more regionalized scale. Given the capital-intensive nature of the air transport industry, the majority of SSA aviation services providers are relatively small parastatal enterprises (table 4.2).7 With few exceptions, most of these national carriers (flag carriers) operate with small aircraft fleets (1 to 20 aircraft) that are, on average,
5 USITC, Recent Trends in U.S. Services Trade, 2006, 3–4. 6 Standard & Poor’s, Industry Surveys: Airlines, May 24, 2007, 10–14. 7 Most of these airlines also tend to be undercapitalized. Essenbert, The Future of Civil Aviation
in Africa, 2005, 10.
Box 4.1 Product description for aviation services Aviation services, for the purpose of this discussion, consist of both passenger and freight transportation services. Passenger transport comprises both leisure and business travel. Generally, major passenger airlines (or national carriers) generate more than $1 billion in annual revenue and focus on long-haul flights between and beyond their main alliance hubs. Other regional and low-cost airlines, which serve particular regions or niche markets that major airlines may overlook, are growing in popularity, particularly in Europe and Asia.1 Freight transport providers carry goods on both freighter and passenger aircrafts. Major cargo airlines are generally divisions or subsidiaries of national passenger airlines and tend to use new or recently converted aircraft to carry their cargo. Other airlines tend to use older planes, usually converted from passenger aircraft that have been sold by first-tier carriers. Typical air cargo products include fresh produce or other perishable goods, dangerous/hazardous goods, and livestock. Most air freight transport firms do not provide door-to-door service, but rather transport goods from an airport near the cargo’s origin to an airport near the cargo’s destination.2
Exports of air transportation services occur when an air carrier collects fares to transport foreign residents to and from the resident air carrier’s country or between foreign countries. Similarly, freight transportation exports occur when foreign citizens pay air carriers to transport goods abroad or for transporting goods between two foreign points.3
____________
1 IBIS World, Global Passenger Airlines, May 11, 2007, 7–8. 2 Express delivery services are excluded from this discussion. IBISWorld, Global Logistics –– Air Freight,
May 17, 2007, 8–9. 3 According to balance-of-payments accounting convention, the importer is said to assume ownership of the goods
when they cross the border of the exporting country and, as a consequence, bears all subsequent transportation costs. USITC, Recent Trends in U.S. Services Trade, 2006, 3-1.
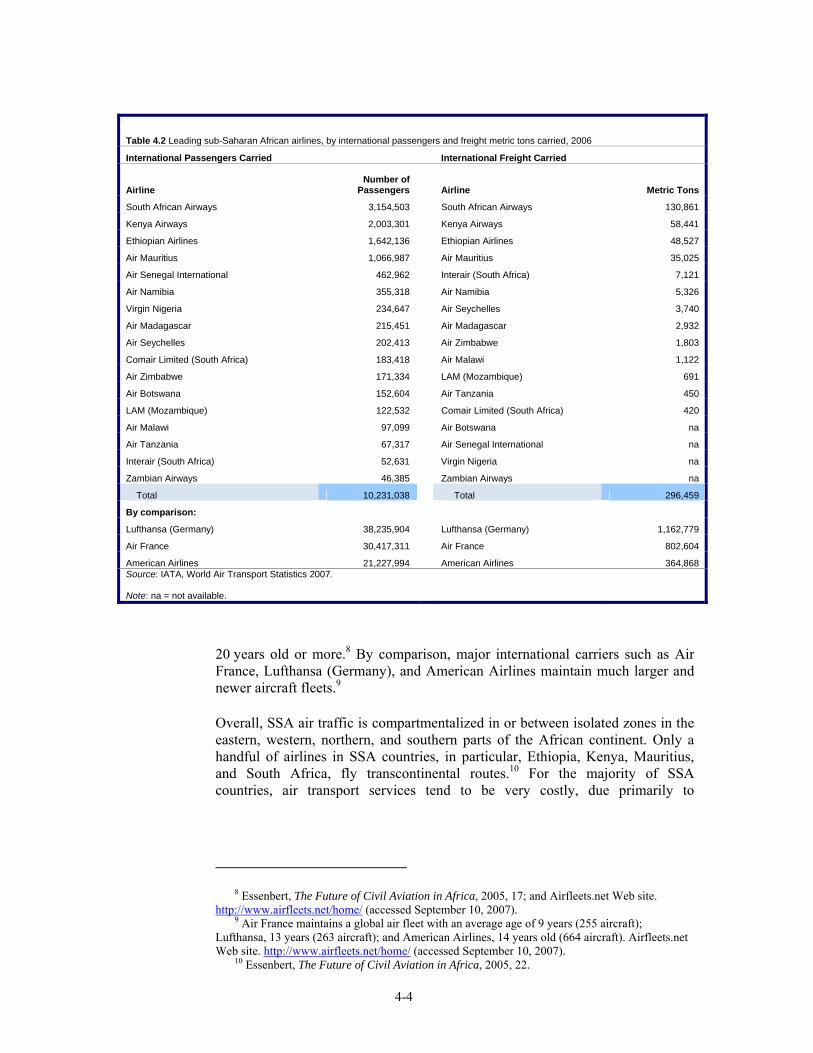
4-4
Table 4.2 Leading sub-Saharan African airlines, by international passengers and freight metric tons carried, 2006
International Passengers Carried International Freight Carried
Airline Number of
Passengers Airline Metric Tons
South African Airways 3,154,503 South African Airways 130,861
Kenya Airways 2,003,301 Kenya Airways 58,441
Ethiopian Airlines 1,642,136 Ethiopian Airlines 48,527
Air Mauritius 1,066,987 Air Mauritius 35,025
Air Senegal International 462,962 Interair (South Africa) 7,121
Air Namibia 355,318 Air Namibia 5,326
Virgin Nigeria 234,647 Air Seychelles 3,740
Air Madagascar 215,451 Air Madagascar 2,932
Air Seychelles 202,413 Air Zimbabwe 1,803
Comair Limited (South Africa) 183,418 Air Malawi 1,122
Air Zimbabwe 171,334 LAM (Mozambique) 691
Air Botswana 152,604 Air Tanzania 450
LAM (Mozambique) 122,532 Comair Limited (South Africa) 420
Air Malawi 97,099 Air Botswana na
Air Tanzania 67,317 Air Senegal International na
Interair (South Africa) 52,631 Virgin Nigeria na
Zambian Airways 46,385 Zambian Airways na
Total 10,231,038 Total 296,459
By comparison:
Lufthansa (Germany) 38,235,904 Lufthansa (Germany) 1,162,779
Air France 30,417,311 Air France 802,604
American Airlines 21,227,994 American Airlines 364,868 Source: IATA, World Air Transport Statistics 2007. Note: na = not available.
20 years old or more.8 By comparison, major international carriers such as Air France, Lufthansa (Germany), and American Airlines maintain much larger and newer aircraft fleets.9
Overall, SSA air traffic is compartmentalized in or between isolated zones in the eastern, western, northern, and southern parts of the African continent. Only a handful of airlines in SSA countries, in particular, Ethiopia, Kenya, Mauritius, and South Africa, fly transcontinental routes.10 For the majority of SSA countries, air transport services tend to be very costly, due primarily to
8 Essenbert, The Future of Civil Aviation in Africa, 2005, 17; and Airfleets.net Web site.
http://www.airfleets.net/home/ (accessed September 10, 2007). 9 Air France maintains a global air fleet with an average age of 9 years (255 aircraft);
Lufthansa, 13 years (263 aircraft); and American Airlines, 14 years old (664 aircraft). Airfleets.net Web site. http://www.airfleets.net/home/ (accessed September 10, 2007).
10 Essenbert, The Future of Civil Aviation in Africa, 2005, 22.
4-5
infrastructure inefficiencies and a general lack of cooperation between airlines and air space regulatory authorities.11
Sub-Saharan Africa Trade in the Global Context
It is difficult to determine how the SSA aviation services markets compare with the global aviation services market, because reliable statistics on SSA services trade are generally not available. However, in 2005, reported SSA exports of aviation services totaled $1.2 billion, or just over 1 percent of the $95 billion world total.12 Leading Exporters In 2005, the United States exported aviation services valued at $26.7 billion, making it the world leader. It was followed by Germany ($10.6 billion), the United Kingdom ($8.1 billion), Japan ($6.1 billion), and Spain ($5.3 billion) (figure 4.1). These five countries combined to account for close to 60 percent of world aviation services exports. In 2005, the five largest SSA exporters (where data were available) were Kenya, Ethiopia, Madagascar, Seychelles, and Cape Verde.13 As noted, Kenya and Ethiopia combined to account for approximately 70 percent of SSA’s total reported aviation services exports. SSA’s overall aviation services exports grew by about 39 percent from $844 million in 2001 to about $1.2 billion in 2005. By comparison, global aviation services receipts grew 36 percent from $69.7 billion in 2001 to $95.1 billion in 2005. The strongest growth among SSA countries with prominent aviation services exports was in Cape Verde, Ethiopia, Kenya, and Madagascar. In all four of these countries, aviation services exports grew by at least 100 percent from 2001 through 2005.14
11 Specifically, operational inefficiencies and protectionist policies adopted by SSA air space
regulatory authorities contribute to the high cost of aviation services on the continent. Moreover, due to the small number of viable domestic airlines, prices for air transport services tend to be high. Essenbert, The Future of Civil Aviation in Africa, 2005, 12.
12 The period 200105 was chosen due to considerations of data availability and consistency. USITC staff calculations used IMF Balance of Payments data. Totals were calculated based on statistics from reporting countries only. The IMF provides the most detailed breakdown of services export data, although the list of reporting countries is limited and trade data are aggregated (no bilateral trade figures are presented).
13 IMF, Balance of Payments Statistics Database and USITC staff calculations. Totals are calculated based on statistics from reporting countries only. Though no trade data are available, South Africa is considered a major SSA aviation services exporter.
14 IMF, Balance of Payments Statistics Database and USITC staff calculations.
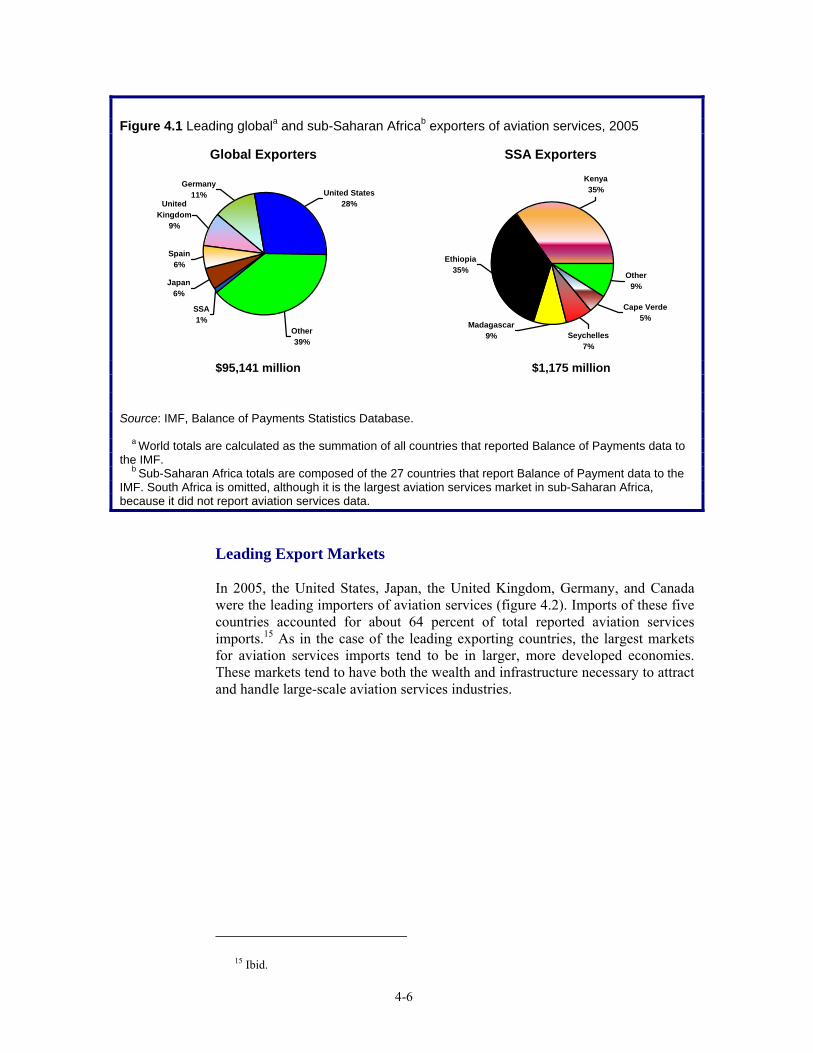
4-6
Figure 4.1 Leading globala and sub-Saharan Africab exporters of aviation services, 2005
Global Exporters
Spain6%
Japan6%
SSA1%
Other39%
Germany11% United States
28%United Kingdom
9%
SSA Exporters
Seychelles7%
Other9%
Ethiopia35%
Kenya35%
Madagascar9%
Cape Verde5%
$95,141 million $1,175 million Source: IMF, Balance of Payments Statistics Database. a World totals are calculated as the summation of all countries that reported Balance of Payments data to the IMF. b Sub-Saharan Africa totals are composed of the 27 countries that report Balance of Payment data to the IMF. South Africa is omitted, although it is the largest aviation services market in sub-Saharan Africa, because it did not report aviation services data.
Leading Export Markets In 2005, the United States, Japan, the United Kingdom, Germany, and Canada were the leading importers of aviation services (figure 4.2). Imports of these five countries accounted for about 64 percent of total reported aviation services imports.15 As in the case of the leading exporting countries, the largest markets for aviation services imports tend to be in larger, more developed economies. These markets tend to have both the wealth and infrastructure necessary to attract and handle large-scale aviation services industries.
15 Ibid.
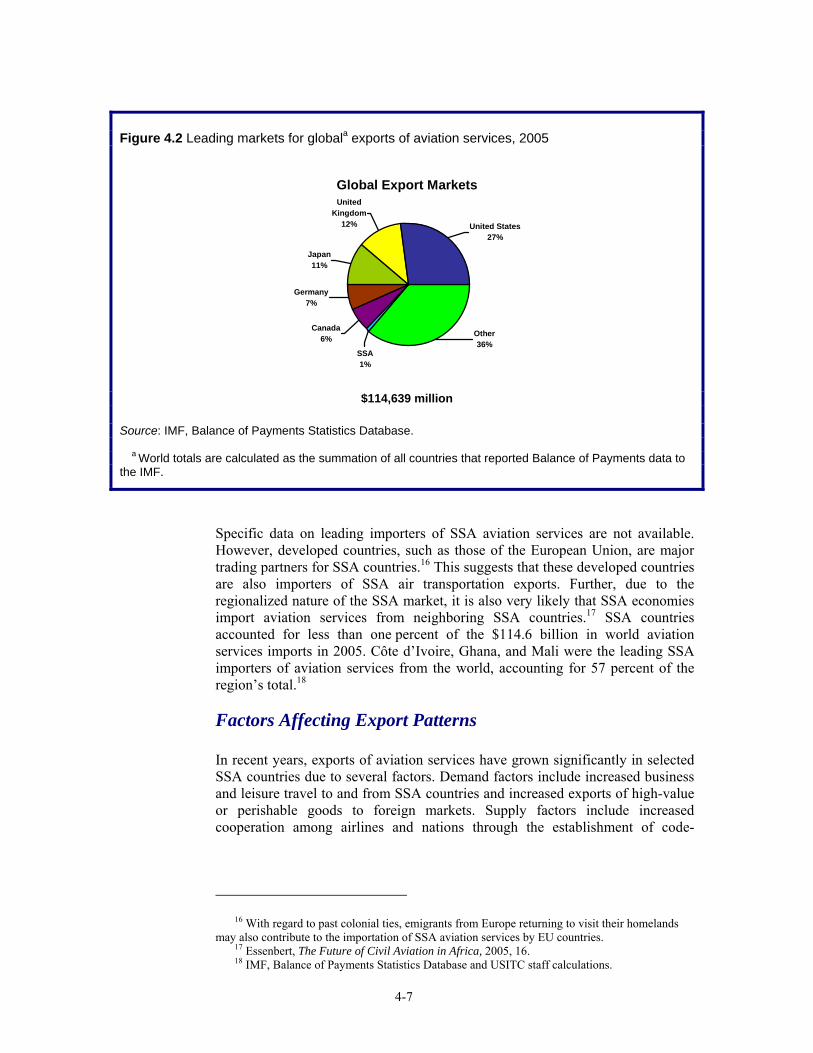
4-7
Figure 4.2 Leading markets for globala exports of aviation services, 2005
Global Export Markets
United States27%
United Kingdom
12%
Japan11%
Germany7%
SSA1%
Canada6% Other
36%
$114,639 million
Source: IMF, Balance of Payments Statistics Database. a World totals are calculated as the summation of all countries that reported Balance of Payments data to the IMF.
Specific data on leading importers of SSA aviation services are not available. However, developed countries, such as those of the European Union, are major trading partners for SSA countries.16 This suggests that these developed countries are also importers of SSA air transportation exports. Further, due to the regionalized nature of the SSA market, it is also very likely that SSA economies import aviation services from neighboring SSA countries.17 SSA countries accounted for less than one percent of the $114.6 billion in world aviation services imports in 2005. Côte d’Ivoire, Ghana, and Mali were the leading SSA importers of aviation services from the world, accounting for 57 percent of the region’s total.18
Factors Affecting Export Patterns
In recent years, exports of aviation services have grown significantly in selected SSA countries due to several factors. Demand factors include increased business and leisure travel to and from SSA countries and increased exports of high-value or perishable goods to foreign markets. Supply factors include increased cooperation among airlines and nations through the establishment of code-
16 With regard to past colonial ties, emigrants from Europe returning to visit their homelands
may also contribute to the importation of SSA aviation services by EU countries. 17 Essenbert, The Future of Civil Aviation in Africa, 2005, 16. 18 IMF, Balance of Payments Statistics Database and USITC staff calculations.
4-8
sharing agreements,19 capital investments by national (flag) airlines, and the upgrade and expansion of international hub airports by governments and foreign investors. Increased Tourist and Business Travel By nature, air transport and tourism are closely interconnected. This link is particularly true for SSA countries because the majority of visitors are from outside the continent. Consequently, as leisure and business travel have increased in several SSA countries,20 in particular Kenya and Seychelles, the need to facilitate access to and from tourist destinations and city centers has increased as well.21 Moreover, in countries such as Ethiopia and Madagascar, where road and rail networks are deteriorating or remain underdeveloped, air travel may be the only viable transport option for international travelers.22 Growth in Time-Sensitive Exports Similarly, increased SSA exports of high-value or perishable products, such as cut flowers, have increased demand for air freight transport services. For example, both Kenya and Ethiopia have become leading exporters of cut flowers to Europe. As a result, both Kenya Airways and Ethiopian Airlines have expanded their air freight shipping capabilities by acquiring additional aircraft or upgrading cargo facilities at their shipping hubs to accommodate growth.23 Additionally, South Africa and Cape Verde have benefited from their geographic locations as regional cross-roads for the shipment of goods.24 Alliances and Route Expansion Among the largest and most successful SSA aviation services industries (Kenya, Ethiopia, and South Africa), the use of code-sharing and other cooperative agreements such as frequent flyer and open skies agreements25 between airlines and nations have been vital to their sustained export growth. Code sharing is a commercial arrangement between two airlines that allows the coordination of schedules to minimize connection times, as well as providing additional customer
19 For example, if airline X has a code-share agreement with airline Y, this enables customers
of airline X to have the benefits of a single airline ticket to destinations in Y’s network, as well. However, a code-share agreement does not mean joint pricing; pricing decisions are made independently by each airline. Chingosho, African Airlines in the Era of Liberalization, 2005, 71−72.
20 For a more in-depth examination of SSA export growth in the tourism sector, See USITC, Sub-Saharan Africa: Factors Affecting Trade Patterns of Selected Industries, First Annual Report, April 2007, 4−18.
21 EIU, Business Africa, June 16, 2006; and EIU, “The Domestic Economy,” December 1, 2006.
22 EIU, “Resources and Infrastructure,” February 9, 2007. 23 Air Cargo World, “Africa: Shipping Looks Beyond the Savannah,” July 2007, 38−41. 24 University of Minnesota ATRIP Project, Project Briefing Book for Africa Air Cargo
Transport Roundtable, November 2002, 2. 25 Open skies refers to the most liberal type of bilateral air transportation agreement between
(but not within) two countries. These agreements allow airlines from both countries to choose routes and destinations. The air carriers of the two countries are free to serve any points they wish in each other’s country, setting fares and service standards based on commercial considerations, not government regulation. Chingosho, African Airlines in the Era of Liberalization, 2005, 157.
4-9
services such as one stop check-in. Historically, alliances and cooperation among SSA airlines and countries have been limited because most African carriers are small, provide service on limited domestic or regional routes, and are generally undercapitalized.26 In the past, established SSA airlines such as Kenya Airways, South African Airways, and Ethiopian Airlines have forged alliances with larger foreign airlines such as Lufthansa (Germany) and Air France because they offer more extensive international route networks.27 Notably, South African Airways became a member of the Star Alliance28 in 2006 and Kenya Airways became an associate member of the Sky Team Airline Alliance29 in 2007.30 Increased Capital Investment The use of aging aircraft is a major constraint to the operations of SSA airlines. As noted previously, the average age of a typical SSA fleet is 20 years. As a result, SSA airlines tend to be burdened with higher fuel, maintenance, and insurance premium costs.31 The reliability of these fleets is adversely affected as technical breakdowns are relatively more frequent compared to those of their competitors from outside the continent. However, in an effort to reverse this trend, airlines such as Kenya Airways and Ethiopian Airlines have made it a priority to consistently renew their air fleets in order to remain competitive with their European and Asian rivals with regard to safety, convenience, comfort, technology, and overall capacity. For example, in January 2004, Ethiopian Airways signed an agreement for five of Boeing’s new 787 Dreamliners and an option for five more. The deal, which is valued at $1.3 billion, makes Ethiopian Airlines the first African carrier to be a launch customer for these jets.32 These jets are set for delivery in 2008.
26 The Yamoussoukro Decision of 1999, which was preceded by the Yamoussoukro
Declaration of 1988, is a pan-African treaty that attempts to liberalize air transport services within the continent (among African nations only). The treaty came into force in August 2000 and was set to become fully operational by August 2002. However, it has yet to be fully implemented by many SSA countries with underdeveloped air transport industries. Nonetheless, countries with more established airlines such as Ethiopia, Kenya, and South Africa have been fully committed to its implementation. Chingosho, African Airlines in the Era of Liberalization, 2005, 78−79.
27 Fatokun, “African Air Transport in the 21st Century,” 2005, 46. 28 Star Alliance members include Air Canada, Air New Zealand, ANA All Nippon Airways
(Japan), Asiana Airlines (Korea), Austrian Airlines, bmi (UK), LOT Polish Airlines, Lufthansa (Germany), SAS Scandinavian Airlines, Singapore Airlines, Spanair, Swiss International Air Lines, TAP Portugal, Thai Airways International, United Airlines (U.S.), and U.S. Airways. Airline Business, “Airline Alliance Survey,” September 2007.
29 Sky Team members include Aeroflot (Russia), Aeroméxico, Air France, Alitalia, China Southern Airlines, Continental Airlines (U.S.), Czech Airlines, Delta Air Lines (U.S.), KLM (Netherlands), Korean Air, and Northwest Airlines (U.S.). Airline Business, “Airline Alliance Survey,” September 2007.
30 An airline alliance is an agreement between two or more airlines to cooperate for the foreseeable future on a substantial basis. The alliances go beyond code sharing as they seek to harmonize the route systems of several international airlines into a single worldwide network. Chingosho, African Airlines in the Era of Liberalization, 2005, 153; and Airline Business, “Airline Alliance Survey,” September 2007.
31 Chingosho, African Airlines in the Era of Liberalization, 2005, 11. 32 African Business, “The Top 200 Companies in Africa,” April 2005, 31.
4-10
Infrastructure Development Investment in airports and air traffic management is essential to the growth and functioning of air transport industries in SSA. Airport upgrades and expansions allow for increases in passenger and cargo capacity, which, in turn, increase exports.33 Examples of recent airport upgrades and expansions (which are described in more detail in the individual country profiles below) include Jomo Kenyatta International Airport in Nairobi, Kenya and Bole International Airport in Addis Ababa, Ethiopia. Country Profiles Kenya, Ethiopia, South Africa, Madagascar, Seychelles, and Cape Verde are among the largest SSA exporters of aviation services and also among the countries that have demonstrated significant growth in recent years. The country profiles below will primarily describe the activities of each country’s major national (flag) airline since they account for the majority of aviation services exports in their respective markets.
Kenya
Aviation services exports from Kenya increased from approximately $241 million in 2001 to $415 million in 2005.34 Kenya Airways, the region’s largest aviation carrier and Kenya’s national airline, has grown significantly since its partial privatization in 1996.35 Factors such as a revitalized tourist industry, greater demand for time-sensitive exports such as cut flowers, expansion of international routes, and recent fleet and airport modernizations have all contributed to Kenya Airways’ rapid growth. Moreover, Kenya’s geographic location has made it a natural stopover point for aircraft flying between Europe and eastern, central, and southern Africa and between West Africa, Asia, and the Middle East.36 Consequently, Nairobi, Kenya’s capital city, has become a regional aviation hub for all of eastern and central Africa.37 Tourism, a vital component of the Kenyan economy, stagnated in the late 1990s and early 2000s due to deteriorating infrastructure, increased competition from other African destinations, and terrorist attacks such as the U.S. embassy bombing in 1998 and the Paradise Hotel bombing in 2002.38 However, since 2003, overseas leisure travel to Kenya’s beach coast and inland game parks, and business and conference travelers to Nairobi has steadily increased, with total arrivals reaching 833,224 in 2005, a 25 percent increase from the previous year.39 These gains in tourism have contributed to Kenya Airways’ sustained
33 Air Transport Action Group, “The Contribution of Air Transport to Sustainable Development
in Africa,” October 2003, 28. 34 IMF, Balance of Payments Statistics Database. 35 KLM Royal Dutch, part of Air France KLM, owns 26 percent of Kenya Airways. African
Business, “The Top 200 Companies in Africa,” April 2005, 30. 36 Otieno, “Aircraft and Aircraft Parts and Service in Kenya,” May 26, 2005. 37 Ibid. 38 EIU, “Resources and Infrastructure,” December 1, 2006. 39 Ibid.
4-11
profitability by increasing air traffic volume on the most popular international routes.40 Moreover, increased tourism flights can reduce the cost of air freight exports, as fresh products may be carried in the freight compartments of passenger aircraft.41 Kenya’s airborne exports of agricultural products, e.g., cut flowers, largely to Europe, already constitute one of the largest industries in the country.42 Over time, Kenya has become the EU’s biggest source of fresh flower imports, with two-thirds of Kenyan blooms going to the Netherlands, where Dutch wholesalers buy flowers for re-export.43 Kenya Airways and Kenya Airfreight Handling Limited, a wholly owned subsidiary of Kenya Airways, handle over 80 percent of the total cargo volume at Jomo Kenyatta International Airport in Nairobi and Moi International Airport in Mombasa.44 Other factors contributing to Kenya Airways’ growth have been the introduction of new routes to foreign destinations such as Hong Kong and Bangkok and the addition of higher-capacity jets, such as the Boeing 777 that was introduced in May 2004. The use of larger aircraft contributed to an increase in passengers carried for Kenya Airways, as the airline announced that it carried 518,844 passengers in its fiscal third quarter ending December 31, 2004, an increase of 15 percent from the same period the previous year.45 The airline has also added frequent flights in and out of Cameroon, Malawi, Nigeria, Uganda, Zambia, and other countries, using Nairobi as a hub.46 Kenya is served by three international airports, Jomo Kenyatta International Airport (JKIA) (Nairobi), Moi International Airport (Mombasa), and Eldoret International Airport (Eldoret).47 JKIA is the largest and busiest airport in eastern and central Africa and serves as a hub for several major airlines as well as a gateway airport for the majority of international tourist and business travelers to Kenya.48 JKIA also serves as a major cargo center for inbound and outbound goods. In March 2006, an airport expansion plan was announced, unveiling a 5-year strategic plan to increase capacity at JKIA from 2.5 million passengers to 5.5 million passengers per year and also to secure “category one” status for JKIA with the U.S Federal Aviation Authority, which would allow for direct flights to U.S. airports.49
40 Kenya Airways’ profits rose to $18 million in 2004, a roughly three-fold increase from the
previous year. African Business, “The Top 200 Companies in Africa,” April 2005, 30. 41 Industry official, interview by Commission staff, Nairobi, Kenya, October 19, 2007;
Subramanian and Matthijs, “Can Sub-Saharan Africa Leap into Global Network Trade,” January 2007, 14; and Goldstein, “Infrastructure Development and Regulatory Reform in Sub-Saharan Africa,” October 1999, 38.
42 Air Transport Action Group, “The Contribution of Air Transport to Sustainable Development in Africa,” October 2003, 31.
43 Subramanian and Matthijs, “Can Sub-Saharan Africa Leap into Global Network Trade,” January 2007, 14.
44 University of Minnesota ATRIP Project, Project Briefing Book for Africa Air Cargo Transport Roundtable, November 2002, 6.
45 African Business, “The Top 200 Companies in Africa,” April 2005, 30. 46 United Nations, Investment Policy Review – Kenya, February 2005, 12. 47 EIU, “Resources and Infrastructure,” December 1, 2006. 48 Otieno, “Aircraft and Aircraft Parts and Service in Kenya,” May 26, 2005. 49 Industry official, interview by Commission staff, Nairobi, Kenya, October 19, 2007; and
EIU, “Resources and Infrastructure,” December 1, 2006.
4-12
Ethiopia
Aviation services exports from Ethiopia increased from approximately $194 million in 2001 to $410 million in 2005.50 Ethiopian Airlines (EAL), a 100 percent government-owned entity and the country’s national carrier, operates a fleet of more than 25 aircraft that service 49 international destinations across Africa, Europe, North America, the Middle East, and Asia from its hub in Addis Ababa.51 EAL flies to more destinations in Africa than any other airline and is one of the few air carriers in SSA to fly directly to the United States.52 EAL also maintains an excellent reputation among travelers and shippers because of its outstanding service and safety record.53 Driven by demand from Ethiopia’s cut flower producers, EAL has significantly expanded its freight transport operations in recent years.54 Ethiopia’s horticulture sector, consisting primarily of cut flower exports, has grown significantly, reaching $23 million in 2005, an increase of over 76 percent from the previous year.55 According to the Ethiopian Horticultural Producers and Exporters’ Association, it is estimated that cut flower exports could earn up to $100 million a year within the next few years.56 To accommodate this growth, EAL has invested $35 million in a modern maintenance hangar and cargo terminal at Bole International Airport in Addis Ababa.57 The new facilities include the latest cargo-handling equipment, including equipment for large perishables, and space for brokers, customs, and freight forwarders.58 The new terminal has a cargo capacity of 250,000 metric tons per year.59 In addition, EAL moved its European cargo operations from Amsterdam to a major cargo hub in Brussels, better linking African freight destinations with international cargo networks.60 EAL also, as mentioned above, renewed its air fleet by purchasing 12 new Boeing
50 IMF, Balance of Payments Statistics Database. 51 EIU, “Resources and Infrastructure,” February 9, 2007. 52 Bole International Airport in Addis Ababa, EAL’s hub, maintains “category one” status,
which allows for direct flights to the United States. Ethiopia has also signed an open skies aviation agreement with the United States in May 2005 facilitating connections and traffic between the two countries. Industry official, interview by Commission staff, Addis Ababa, Ethiopia, October 25, 2007; and EIU, “Resources and Infrastructure,” February 9, 2007. Among SSA nations, South Africa, Ethiopia, and Cape Verde possess “category one” certifications. FAA, IASA Web site. http://www.faa.gov/safety/programs%5Finitiatives/oversight/iasa/ (accessed March 24, 2008).
53 Goldstein, “Infrastructure Development and Regulatory Reform in Sub-Saharan Africa;” October 1999, 29. EAL was awarded African Airline of the Year 2006 by the African Aviation Journal for its “sound financial performance, overall profitability, passenger growth, route network expansion, fleet modernization, in-flight services, and overall customer care.” East African Business Week, “Ethiopian Airlines Wins 2006 Award,” October 16, 2006.
54 EIU, “Resources and Infrastructure,” February 9, 2007. 55 Industry official, interview by Commission staff, Addis Ababa, Ethiopia, October 25, 2007
and EIU, “Resources and Infrastructure,” February 9, 2007. 56 EIU, “Resources and Infrastructure,” February 9, 2007. 57 Ibid. 58 University of Minnesota ATRIP Project, Project Briefing Book for Africa Air Cargo
Transport Roundtable, November 2002, 6. 59 EIU, “Resources and Infrastructure,” February 9, 2007. 60 African Business, “The Top 200 Companies in Africa,” April 2005, 31.
4-13
airplanes from 2003 to 2005 using a $350 million commercial loan from Barclays Capital.61 Infrastructure improvements at Bole International Airport have also allowed EAL to expand its passenger business. In early 2003, a $135 million expansion program at Bole was completed, an expansion which included the construction of a new runway, five taxiways, a new terminal building, parking garage, shopping complex, and restaurant. This expansion has increased Bole’s annual passenger capacity from 500,000 to 6−7 million per year.62
South Africa
Although no official trade data on air transportation are available for South Africa, the South African air transport industry is considered by far the largest and most developed on the continent (table 4.2).63 South Africa’s geographic position offers access to markets, not only throughout Africa, but also to the entire southern hemisphere. In addition, as a member state of the Southern African Development Community (SADC), South Africa plays an important role in developing regional trade and cooperation.64 South African Airways (SAA), the country’s national airline and the continent’s largest, is wholly owned by the South African transport parastatal, Transnet. For the fiscal year that ended March 2005, the company generated sales of $2.7 billion, an increase of approximately 7 percent from the previous year. The company recorded net income of $150 million in 2005.65 In an effort to spur growth, SAA has negotiated code-sharing agreements with several major international airlines, including Air France, Delta Airlines (United States), El Al (Israel), Emirates (UAE), Japan Airlines, and Qantas Airways (Australia).66 Moreover, SAA has expanded its services to other markets within the continent, particularly in the underserved regions of central and West Africa.67 SAA is also the country’s predominant air freight carrier, shipping export goods such as strategic metals, medicine, and data-processing parts in the cargo areas of international passenger flights.68 Overall, SAA operates 61 planes that travel to more than 60 destinations throughout Africa, Asia, Australia, Europe, South America, and the United States.69
61 EIU, “Resources and Infrastructure,” February 9, 2007. 62 University of Minnesota ATRIP Project, Project Briefing Book for Africa Air Cargo
Transport Roundtable, November 2002, 4. 63 Goldstein, “Infrastructure Development and Regulatory Reform in Sub-Saharan Africa,”
October 1999, 29. 64 University of Minnesota ATRIP Project, Project Briefing Book for Africa Air Cargo
Transport Roundtable, November 2002, 3. 65 Datamonitor, Airlines in South Africa: Industry Profile, October 2005, 13. 66 Industry official, interview by Commission staff, Johannesburg, South Africa,
October 30, 2007; and Chingosho, African Airlines in the Era of Liberalization, 2005, 168. 67 Countries include Côte d’Ivoire, Ghana, Nigeria, and Senegal. Peel, “Big Airlines Explore
West Africa,” December 9, 2002. 68 University of Minnesota ATRIP Project, Project Briefing Book for Africa Air Cargo
Transport Roundtable, November 2002, 6. 69 Heydenrych, “Another Perk for Frequent Flyers,” April 2007, 38−39.
4-14
South Africa is serviced by three international airports located in Johannesburg, Durban, and Cape Town. Johannesburg International Airport, with transit of more than 11 million passengers (up to one-half are internationals from Europe and other African countries) and movement of 280 metric tons of freight per year (most of which are destined for Europe), is the leading airport in Africa for both passenger and freight traffic.70
Madagascar
Aviation services exports from Madagascar increased over 215 percent from approximately $34 million in 2001 to $107 million in 2005.71 Air Madagascar, the national carrier, is partly owned by Air France (33 percent stake) and is under the management of Lufthansa Consulting of Germany.72 In recent years, through the management of Lufthansa Consulting, the support of government investments reaching $17 million, and debt reduction arrangements with private creditors, Air Madagascar has been actively restructuring its operations to improve services and increase efficiency.73 Moreover, Air Madagascar has expanded air services to more locations in France, including Marseille, which has a large Malagasy expatriate population, and in Southeast Asia.74
Seychelles
Air Seychelles, the state-owned national airline, with a fleet of two Boeing 767 planes, offers international flights to several destinations including Paris, London, Rome, Singapore, and Johannesburg.75 Although Seychelles adopted a more open air access policy in 2004, which led to the entry of several international airlines, including Emirates (UAE) and Qatar Airlines, domestic air transport services export growth remained steady from 2001 through 2005 (from $75 million to $77 million).76 Air Seychelles, the country’s sole domestic air transport provider, has been able to maintain consistent export growth in recent years despite increased foreign competition. Propelled by strong demand from leisure travelers on European routes, and by restructuring its business operations, Air Seychelles was able to expand its flight options and lower costs—the company returned one of its three leased Boeing aircraft; cut routes; trimmed workforce; and sought alliances with Air Mauritius, Kenya Airways, and Air France (with which it has a code-sharing arrangement).77 Moreover, in an effort to attract high-end tourists, Air Seychelles is planning to replace its two existing Boeing airplanes with two new Boeing 787 Dreamliner aircraft by 2010.78
70 Air Transport Action Group, “The Contribution of Air Transport to Sustainable Development
in Africa,” October 2003, 23. 71 IMF, Balance of Payments Statistics Database. 72 EIU, “Resources and Infrastructure,” June 15, 2007. 73 Ibid. 74 EIU, “The Domestic Economy,” September 5, 2007. 75 U.S. Department of State, U.S. Embassy, Port Louis, “USITC Study on Sub-Saharan Africa,”
August 23, 2007 76 EIU, “Tourism and Travel,” June 16, 2006; and IMF, Balance of Payments Statistics
Database. 77 Ibid. 78 U.S. Department of State, U.S. Embassy, Port Louis, “USITC Study on Sub-Saharan Africa,”
August 23, 2007.
4-15
Cape Verde
Aviation services exports from Cape Verde increased from approximately $24 million in 2001 to $55 million in 2005, representing growth of over 135 percent.79 One of Cape Verde’s most important assets is its location as a crossroads for goods and passengers to and from North and South America and Europe.80 Consequently, the government of Cape Verde has been active in turning the islands into a regional air transport hub by upgrading the country’s airports and air safety infrastructure. Notably, in 2004, Cape Verde’s main international airport, Aeroporto Internacional Amílcar Cabral, on Sal Island, installed a $24 million, state-of-the art air traffic control system; and in 2005, a new international airport near the capital, Praia, was put into operation. The new airport, in addition to significantly increasing air traffic capacity, allows business and leisure travelers to fly directly to the capital instead of having to transfer from Sal Island.81 Cape Verde’s state-owned national airline, Transportes Aéreos de Cabo Verde (TACV), maintains several international routes throughout Europe, West Africa, Brazil, and the United States. Cape Verde became the first Safe Skies for Africa nation to meet international civil aviation safety and security requirements, which allowed TACV to operate direct flights to and from the United States.82
79 IMF, Balance of Payments Statistics Database. 80 University of Minnesota ATRIP Project, Project Briefing Book for Africa Air Cargo
Transport Roundtable, November 2002, 2. 81 EIU, “Resources and Infrastructure,” February 5, 2007. 82 The Safe Skies for Africa program, funded by the U.S. Departments of Transportation and
State, promotes sustainable improvements in African aviation safety and security in order to foster growth in air transportation between Africa and the United States. Specifically, the program aims to improve security at multiple airports and to upgrade air navigation systems throughout Africa. U.S. Department of Transportation, “Remarks for the Honorable Maria Cino,” November 1, 2005.
4-16
Aviation Services Bibliography
African Business. “The Top 200 Companies in Africa,” April 2005. Business Source Premier, EBSCOhost (accessed September 25, 2007). Air Cargo World. “Africa: Shipping Looks Beyond the Savannah,” July 2007. Business Source Premier, EBSCOhost (accessed September 25, 2007). Air Transport Action Group. “The Contribution of Air Transport to Sustainable Development in Africa,” October 2003. Air Transport World, “Africa/Middle East,” July 2005. Business Source Premier, EBSCOhost (accessed September 25, 2007). Airline Business. “Airline alliance survey,” September 2007. Business Source Premier, EBSCOhost (accessed September 25, 2007). ——. “Mister Fix-It,” January 2007. Business Source Premier, EBSCOhost (accessed September 25, 2007). Chingosho, Elijah. African Airlines in the Era of Liberalization. Nairobi: African Airlines Association (AFRAA), 2005. Datamonitor. Airlines in South Africa: Industry Profile, October 2005. Business Source Premier, EBSCOhost (accessed September 25, 2007). East African Business Week. “Ethiopian Airlines Wins 2006 Award,” October 16, 2006. Lexis-Nexis (accessed October 3, 2007). Economist Intelligence Unit (EIU). “Economic Sectors: Agriculture.” Country Profile Ethiopia. February 9, 2007. ——. “Economic Sectors: Other Services.” Country Profile Ethiopia. February 9, 2007. ——. “Economic Sectors: Other Services.” Country Profile Kenya. December 1, 2006. ——. “Resources and Infrastructure: Transport, Communications, and the Internet.” Country Profile Cape Verde. February 5, 2007. ——. “Resources and Infrastructure: Transport, Communications, and the Internet.” Country Profile Ethiopia. February 9, 2007. ——. “Resources and Infrastructure: Transport, Communications, and the Internet.” Country Profile Kenya. December 1, 2006. ——. “Resources and Infrastructure: Transport, Communications, and the Internet.” Country Profile Madagascar. June 15, 2007.
4-17
——. “Resources and Infrastructure: Transport, Communications, and the Internet.” Country Profile Seychelles. October 20, 2006. ——. “Resources and Infrastructure: Transport, Communications, and the Internet.” Country Profile South Africa. July 1, 2006. ——. “The Domestic Economy: Air Madagascar Reports A Profitable 2005.” Country Report Madagascar. September 7, 2006. ——. “The Domestic Economy: Air Madagascar Suffering From High Fuel Prices.” Country Report Madagascar. September 5, 2007. ——. “The Domestic Economy: Air Seychelles Plans to Acquire Next Generation Aircraft.” Country Report Seychelles. June 6, 2006. ——. “The Domestic Economy: Airline Freight Capacity is on the Rise.” Country Report Ethiopia. January 1, 2007. ——. “The Domestic Economy: Foreign Private-Sector Investment is Lively.” Country Report Madagascar. December 1, 2006. ——. “The Domestic Economy: Kenya Plans to Invest in Airport Improvement.” Country Report Kenya. May 8, 2006. ——. “The Domestic Economy: Tourism Grows Rapidly for the Second Year in Succession.” Country Report Kenya. February 8, 2006. ——. “Tourism & Travel: Seychelles” Business Africa. June 16, 2006. Essenbert, Bert. The Future of Civil Aviation in Africa: Restructuring and Social Dialogue. Geneva: International Labour Office, Sector Activities Program, 2005. Fatokun, Oladele Samson. “African Air Transport in the 21st Century: A Case Study of the Contrasting Experience of Nigeria and Kenya.” M.Sc. thesis, Cranfield University, 2005. Goldstein, Andrea E. “Infrastructure Development and Regulatory Reform in Sub-Saharan Africa: The Case of Air Transport.” OECD Development Centre Working Paper No. 154, October 1999. Heydenrych, Frank. “Another Perk for Frequent Flyers,” Speech Technology 12, no. 3 (April 2007): 38-39. IBISWorld. Global Logistics—Air Freight May 17, 2007. ——. Global Passenger Airlines, May 11, 2007. International Air Transport Association (IATA). World Air Transport Statistics 2007. Montreal: IATA, 2007. International Monetary Fund (IMF). Balance of Payments Statistics Database. http://www.imfstatistics.org/BOP/ (accessed various dates).
4-18
Otieno, Tobias. “Aircraft and Aircraft Parts and Service in Kenya,” Industry Subsector Analysis (ISA), The Canadian Business Map, May 26, 2005. http://commercecan.ic.gc.ca/scdt/bizmap/interface2.nsf/vDownload/ISA_2297/$file/X_5304422.DOC (accessed October 28, 2007). Peel, Michael. “Big Airlines Explore West Africa,” Financial Times. December 9, 2002. http://www.ft.com/ (accessed October 27, 2007). Standard and Poor’s. Industry Surveys: Airlines, May 24, 2007. Subramanian, Uma and Matthias Matthijs. “Can Sub-Saharan Africa Leap into Global Network Trade?” World Bank Policy Research Working Paper 4112, January 2007. U.S. Department of State. U.S. Embassy, Port Louis. “USITC Study on Sub-Saharan Africa: Information on Mauritius and Seychelles (PORT LOUIS 000448),” August 23, 2007. U.S. Department of Transportation. “Remarks for the Honorable Maria Cino, Deputy Secretary of Transportation – U.S.-Africa Air Transport Summit (Miami, FL),” November 1, 2005. U.S. International Trade Commission (USITC). Recent Trends in U.S. Services Trade, 2006 Annual Report, USITC Publication 3857. Washington, DC: USITC, 2006. http://hotdocs.usitc.gov/docs/pubs/332/pub3857.pdf ——. Sub-Saharan Africa: Factors Affecting Trade Patterns of Selected Industries, First Annual Report, USITC Publication 3914. Washington, DC: USITC, 2007. http://hotdocs.usitc.gov/docs/Pubs/332/Pub3914.pdf United Nations. Investment Policy Review — Kenya. New York: United Nations, February 2005. University of Minnesota ATRIP Project, Project Briefing Book for Africa Air Cargo Transport Roundtable. Minneapolis: University of Minnesota, November 2002.
4-19
Communication Services
Summary of Findings
Although representing a relatively small share of total world communications trade,83 SSA has experienced explosive growth in international telecommunications services, making it the fastest growing telecommunications market in the world, with an average annual growth rate of 23 percent over the period 2001–05.84 Telecommunications exports involve payments from telecommunications firms in a country placing international calls to telecommunications firms in countries terminating the calls (box 4.2). Therefore SSA countries export telecommunication services when they receive calls originating abroad. Increased SSA telecommunication exports are driven by a number of factors, all of which either increase access to telecommunications networks, a necessary prerequisite for receiving international calls, or decrease the price of international calls. Improved regulatory practices in many African countries, especially those facilitating market-driven competition in the mobile phone sector, have resulted in ever-greater numbers of African citizens obtaining crucial telecommunications access. Technological developments and deployment of new telecommunications infrastructure have also increased availability of modern communication services and drastically reduced prices. Finally, demand growth based on rising incomes, increased global business links, and international migration have all played a role in increasing African telecommunications trade.
83 IMF communications data include both telecommunication and postal trade statistics. This
section uses the term “communications” when referring to IMF data and the term “telecommunications” when referring to other data sources that do not include postal communications.
84 TeleGeography, Traffic Analysis, 2007, 21; IMF, Balance of Payments Statistics Database (accessed September 5, 2007). SSA totals include countries that reported communications export data.
Box 4.2 Product description for communication services Communication services, an infrastructure industry which significantly affects and underpins the entire economy, are made up of two primary components, telecommunication services and postal and courier services. Telecommunication services encompass the transmission of sound, images, or other information by telephone, cable, broadcasting, and satellite, among other things. Postal and courier services encompass the pickup, transportation, and delivery of letters, printed materials, and packages among other things.1 IMF statistics disaggregate postal and courier services for a limited portion of SSA African countries for which they report communications data. For these countries, postal and courier services exports data represent an average of 7 percent of the total value of communications exports.2 This section, therefore, focuses primarily on telecommunications services. Cross-border telecommunications exports involve receiving a call that originates abroad. Since international calls are typically billed in the originating country, carriers whose outbound calling minutes exceed inbound calling minutes make a net settlement payment to their counterparts abroad. Therefore exports of telecommunication services represent receipts of net settlement payments. Cross-border trade data may also include payments for leased channel services, online access services, and telecommunication support services.3 ____________
1 IMF, Balance of Payments Manual, September 1993, 66. 2 IMF, Balance of Payments Statistics (accessed September 5, 2007); and Commission staff calculations. 3 USITC, Recent Trends in U.S. Services Trade, June 2007, 10-1–2.
4-20
Industry Overview
The voice telecommunications market is primarily composed of wireline and mobile voice telephony services. Wireline telecommunications, which involves high capital costs related to infrastructure deployment, has traditionally been viewed as a natural monopoly. Consequently, monopoly providers (in many cases state-owned) were established in many countries. However, beginning in the 1980s, countries throughout the world began to privatize state-owned monopolies and to introduce competition into the wireline market due, in part, to emerging technologies such as wireless telecommunications, which undermined traditional natural monopoly considerations by bypassing large segments of the fixed network.85 Compared to their global counterparts, SSA countries have relatively underdeveloped wireline telecommunication markets. In 2005, SSA countries had an average of just 3 wireline phones per 100 people compared to an average 20 wireline phones per 100 people for the 181 countries for which the International Telecommunications Union (ITU) reports data. Furthermore, the total number of wireline subscribers in SSA has grown at a slower rate in recent years than the rest of the world, with an average annual growth rate of 3 percent during 2001–05, compared with a global annual average growth rate of 5 percent over the same period.86 Wireless telecommunications services, on the other hand, continue to experience explosive growth in SSA countries, whereas developed countries’ growth in wireless services has slowed dramatically in recent years as their mobile markets have matured.87 SSA countries, where wireless services were generally introduced several years later than in the rest of the world, are still catching up in terms of mobile penetration, becoming the fastest growing region for mobile services in the world over the past 5 years.88 The total number of mobile phone subscribers in SSA countries increased from 17 million to 92 million in the period during 2001–05, representing an average annual growth rate of 52 percent. As of 2005, SSA countries had an average of 14 mobile phone subscribers per 100 people compared to an average of 46 subscribers per 100 people in countries for which the International Monetary Fund (IMF) reports data. 89
Sub-Saharan Africa Trade in the Global Context Developed countries tend to have large and well-developed telecommunications markets, especially in Western Europe and the United States, which also led in the amount of international communications trade. SSA, on the other hand, has a
85 Boylaud and Nicoletti, “Regulation, Market Structure and Performance in
Telecommunications,” 2000, 8–9. 86 ITU, World Telecommunication Indicators 2006, (accessed August 23, 2007);
TeleGeography, GlobalComms 3.0 (accessed August 23, 2007); and Commission staff calculations. 87 S&P, “Telecommunications: Wireless Europe,” April 2007, 1. 88 EIU, “Africa Telcoms: Wired,” July 17, 2007. 89 ITU, World Telecommunication Indicators 2006, (accessed August 23, 2007);
TeleGeography, GlobalComms 3.0 (accessed August 23, 2007); and Commission staff calculations.
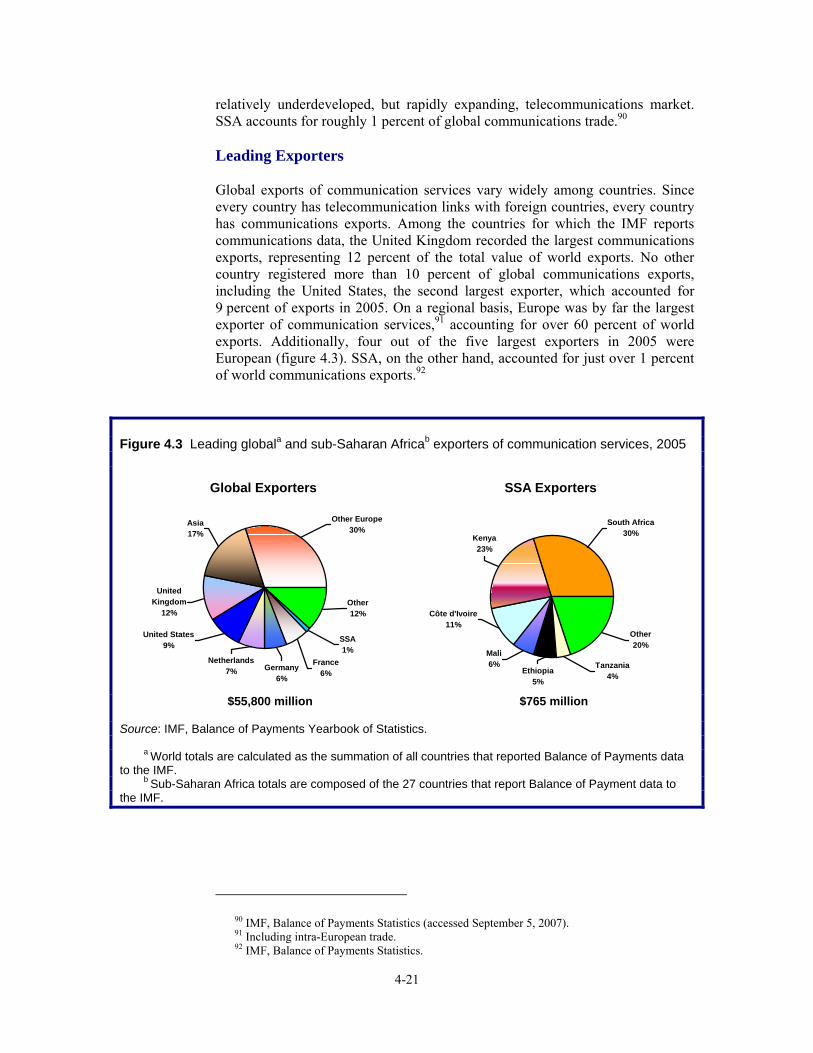
4-21
relatively underdeveloped, but rapidly expanding, telecommunications market. SSA accounts for roughly 1 percent of global communications trade.90 Leading Exporters Global exports of communication services vary widely among countries. Since every country has telecommunication links with foreign countries, every country has communications exports. Among the countries for which the IMF reports communications data, the United Kingdom recorded the largest communications exports, representing 12 percent of the total value of world exports. No other country registered more than 10 percent of global communications exports, including the United States, the second largest exporter, which accounted for 9 percent of exports in 2005. On a regional basis, Europe was by far the largest exporter of communication services,91 accounting for over 60 percent of world exports. Additionally, four out of the five largest exporters in 2005 were European (figure 4.3). SSA, on the other hand, accounted for just over 1 percent of world communications exports.92
Figure 4.3 Leading globala and sub-Saharan Africab exporters of communication services, 2005
Global Exporters
SSA1%
Other12%
Other Europe30%
Asia17%
United Kingdom
12%
United States9%
Germany6%
Netherlands7%
France6%
SSA Exporters
South Africa30%
Ethiopia5%
Côte d'Ivoire11%
Mali6%
Kenya23%
Other20%
Tanzania4%
$55,800 million $765 million
Source: IMF, Balance of Payments Yearbook of Statistics. a World totals are calculated as the summation of all countries that reported Balance of Payments data to the IMF. b Sub-Saharan Africa totals are composed of the 27 countries that report Balance of Payment data to the IMF.
90 IMF, Balance of Payments Statistics (accessed September 5, 2007). 91 Including intra-European trade. 92 IMF, Balance of Payments Statistics.
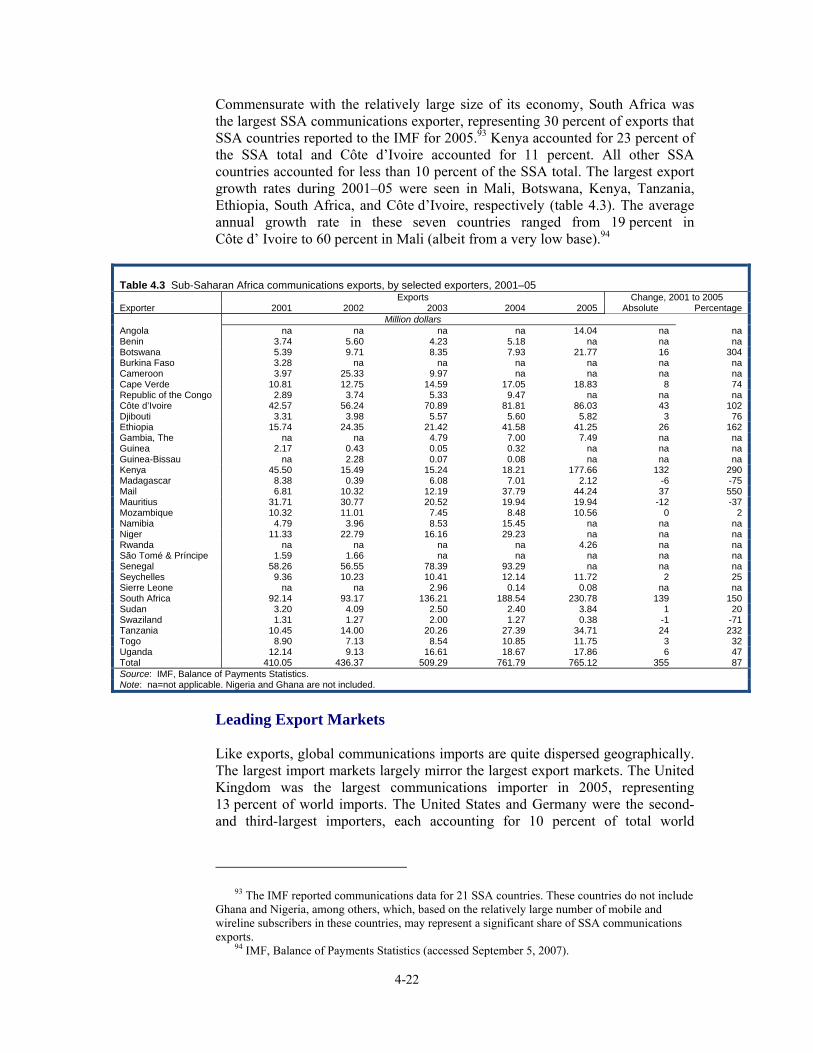
4-22
Commensurate with the relatively large size of its economy, South Africa was the largest SSA communications exporter, representing 30 percent of exports that SSA countries reported to the IMF for 2005.93 Kenya accounted for 23 percent of the SSA total and Côte d’Ivoire accounted for 11 percent. All other SSA countries accounted for less than 10 percent of the SSA total. The largest export growth rates during 2001–05 were seen in Mali, Botswana, Kenya, Tanzania, Ethiopia, South Africa, and Côte d’Ivoire, respectively (table 4.3). The average annual growth rate in these seven countries ranged from 19 percent in Côte d’ Ivoire to 60 percent in Mali (albeit from a very low base).94
Table 4.3 Sub-Saharan Africa communications exports, by selected exporters, 2001–05 Exports Change, 2001 to 2005 Exporter 2001 2002 2003 2004 2005 Absolute Percentage Million dollars Angola na na na na 14.04 na na Benin 3.74 5.60 4.23 5.18 na na na Botswana 5.39 9.71 8.35 7.93 21.77 16 304 Burkina Faso 3.28 na na na na na na Cameroon 3.97 25.33 9.97 na na na na Cape Verde 10.81 12.75 14.59 17.05 18.83 8 74 Republic of the Congo 2.89 3.74 5.33 9.47 na na na Côte d’Ivoire 42.57 56.24 70.89 81.81 86.03 43 102 Djibouti 3.31 3.98 5.57 5.60 5.82 3 76 Ethiopia 15.74 24.35 21.42 41.58 41.25 26 162 Gambia, The na na 4.79 7.00 7.49 na na Guinea 2.17 0.43 0.05 0.32 na na na Guinea-Bissau na 2.28 0.07 0.08 na na na Kenya 45.50 15.49 15.24 18.21 177.66 132 290 Madagascar 8.38 0.39 6.08 7.01 2.12 -6 -75 Mail 6.81 10.32 12.19 37.79 44.24 37 550 Mauritius 31.71 30.77 20.52 19.94 19.94 -12 -37 Mozambique 10.32 11.01 7.45 8.48 10.56 0 2 Namibia 4.79 3.96 8.53 15.45 na na na Niger 11.33 22.79 16.16 29.23 na na na Rwanda na na na na 4.26 na na São Tomé & Príncipe 1.59 1.66 na na na na na Senegal 58.26 56.55 78.39 93.29 na na na Seychelles 9.36 10.23 10.41 12.14 11.72 2 25 Sierre Leone na na 2.96 0.14 0.08 na na South Africa 92.14 93.17 136.21 188.54 230.78 139 150 Sudan 3.20 4.09 2.50 2.40 3.84 1 20 Swaziland 1.31 1.27 2.00 1.27 0.38 -1 -71 Tanzania 10.45 14.00 20.26 27.39 34.71 24 232 Togo 8.90 7.13 8.54 10.85 11.75 3 32 Uganda 12.14 9.13 16.61 18.67 17.86 6 47 Total 410.05 436.37 509.29 761.79 765.12 355 87 Source: IMF, Balance of Payments Statistics. Note: na=not applicable. Nigeria and Ghana are not included.
Leading Export Markets Like exports, global communications imports are quite dispersed geographically. The largest import markets largely mirror the largest export markets. The United Kingdom was the largest communications importer in 2005, representing 13 percent of world imports. The United States and Germany were the second- and third-largest importers, each accounting for 10 percent of total world
93 The IMF reported communications data for 21 SSA countries. These countries do not include
Ghana and Nigeria, among others, which, based on the relatively large number of mobile and wireline subscribers in these countries, may represent a significant share of SSA communications exports.
94 IMF, Balance of Payments Statistics (accessed September 5, 2007).
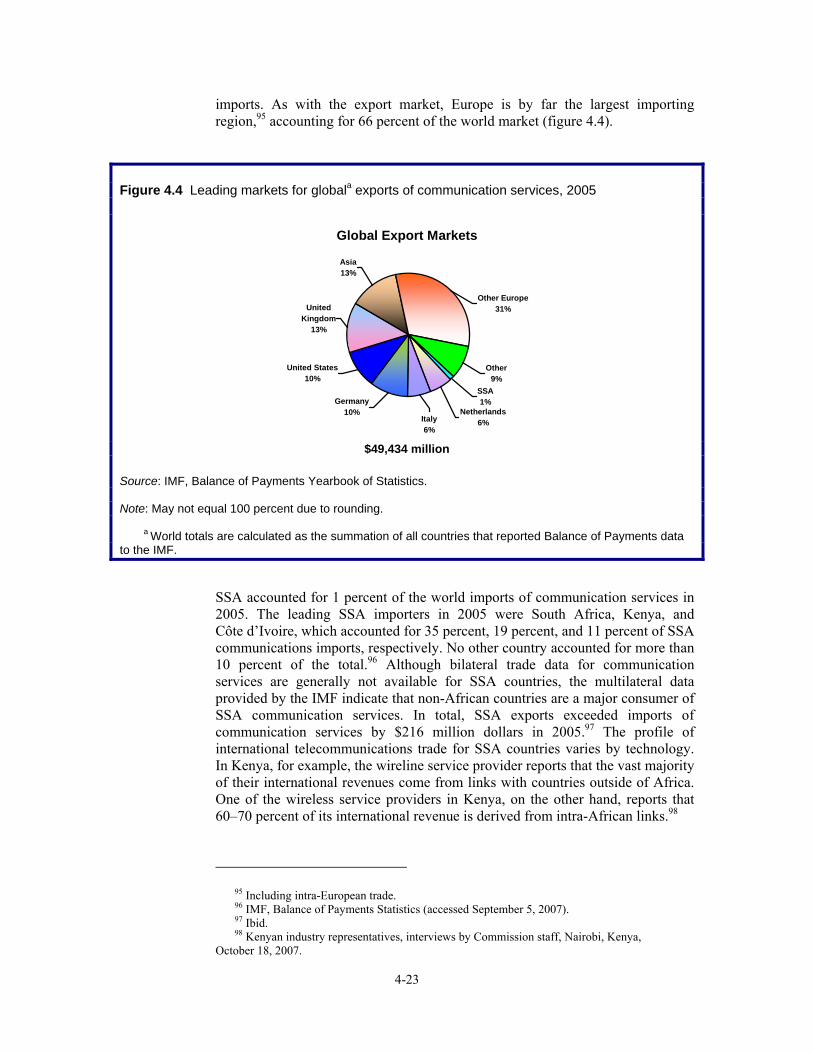
4-23
imports. As with the export market, Europe is by far the largest importing region,95 accounting for 66 percent of the world market (figure 4.4).
Figure 4.4 Leading markets for globala exports of communication services, 2005
Global Export Markets
Other9%
SSA1%
Other Europe31%
Asia13%
United Kingdom
13%
United States10%
Italy6%
Germany10% Netherlands
6%
$49,434 million
Source: IMF, Balance of Payments Yearbook of Statistics. Note: May not equal 100 percent due to rounding. a World totals are calculated as the summation of all countries that reported Balance of Payments data to the IMF.
SSA accounted for 1 percent of the world imports of communication services in 2005. The leading SSA importers in 2005 were South Africa, Kenya, and Côte d’Ivoire, which accounted for 35 percent, 19 percent, and 11 percent of SSA communications imports, respectively. No other country accounted for more than 10 percent of the total.96 Although bilateral trade data for communication services are generally not available for SSA countries, the multilateral data provided by the IMF indicate that non-African countries are a major consumer of SSA communication services. In total, SSA exports exceeded imports of communication services by $216 million dollars in 2005.97 The profile of international telecommunications trade for SSA countries varies by technology. In Kenya, for example, the wireline service provider reports that the vast majority of their international revenues come from links with countries outside of Africa. One of the wireless service providers in Kenya, on the other hand, reports that 60–70 percent of its international revenue is derived from intra-African links.98
95 Including intra-European trade. 96 IMF, Balance of Payments Statistics (accessed September 5, 2007). 97 Ibid. 98 Kenyan industry representatives, interviews by Commission staff, Nairobi, Kenya,
October 18, 2007.
4-24
Factors Affecting Export Patterns Domestic and international telecommunications markets in SSA countries have grown in recent years due to a number of factors. Supply-side factors include the expansion of telecommunications infrastructure and the introduction of competition via new licensing policies. These factors greatly increase the number of individuals with access to telecommunications networks, a vital prerequisite for expanding telecommunications exports. Demand-side factors include increased international migration and trade links. Government policies play a direct role on the supply side of telecommunications and an indirect role in determining most demand factors for African telecommunication services. This section will touch upon major factors affecting export growth patterns continent-wide before providing specific details on how these factors have played out in several important SSA markets in the country profiles section which follows. Introduction of Competition and New Licensing Policies Governments play a key role in the development of telecommunications markets through competition and licensing policies. Traditionally, in many SSA countries, the state maintained complete control over the sector through state-owned monopoly providers. Over the past decade, however, many African governments have moved steadily toward a more market-based system.99 Central to this new market-based system are government policies regarding the issuance of licenses for new entrants, the degree of continued state ownership, and effective regulation of the industry to ensure that the practices of industry players are not anti-competitive.
Liberalization of International Gateway Competition
Of particular importance to international trade in telecommunication services is international gateway competition. International gateways are the facilities through which international calls are received and sent. Approximately one-half of the countries in SSA have fully or partly liberalized their international gateways.100 In these countries, multiple telecommunication services providers are able to obtain international gateway licenses, allowing them to connect directly to the international network. In the countries that have not liberalized, only one monopoly provider is licensed to provide a direct connection to the international network. Other telecommunications service providers, if indeed they are permitted in the country, must access the international network via the monopoly provider’s network. Countries that have liberalized international gateways have seen dramatic reductions in the cost of international calls and substantial increases in call volumes. For instance, Nigeria reduced the price of international calls by 90 percent by liberalizing its international gateways, effectively replacing a monopoly with a competitive international calling market.101 In Kenya, following
99 Keck and Djiofack-Zebaze, “Telecommunications Services in Africa,” November 2006, 7. 100 GSM Association, Gateway Liberalisation, 2007, 11. 101 Ibid., 89.
4-25
the issuance of international gateway licenses to the country’s mobile providers in 2006, these firms reduced prices for international calls by 70 percent and increased the share of international calls from 5 percent to 10−15 percent of the total number of calls. 102
Introduction of VoIP Technology
Other important factors in international telecommunications trade are technological advances, such as Voice over Internet Protocol (VoIP), which involves routing calls over the internet, and related government policies. The costs of international calls placed using VoIP are often substantially lower than calls placed using traditional telecommunications networks. African governments have responded to VoIP in a variety of ways. Certain countries, such as Kenya, South Africa, Uganda, Tanzania, and Mauritius, have legalized VoIP, allowing many new entrants to establish themselves in the telecommunications market, resulting in a substantial reduction in the price of international calls. The majority of SSA countries, however, have proscribed the use of VoIP in order to protect incumbent revenues. Nevertheless, VoIP services are being provided in many of these countries due to the difficulty of enforcing VoIP bans, resulting in dramatically lowered prices for international calls. 103
Liberalization of Competition Policies
Aside from the licensing of international gateways and the use of technologies such as VoIP, the market for international telecommunications services is heavily dependent on competition policy, particularly regarding domestic wireline and wireless firms. Greater domestic competition drives down prices in all telecommunications segments, including international.104 Despite increased licensing of new operators in both the wireline and wireless segments, SSA wireless markets in general have more licensed firms and featured less direct government involvement than found in wireline markets. Wireline telecommunications service remains a state-owned monopoly in many African countries. SSA, on the whole, has been relatively slow to privatize the wireline market compared to other regions of the world. Although a number of SSA countries have proposed full or partial privatization, virtually all African governments retain some level of ownership in the wireline telecommunications industry in their country (table 4.4). Out of 37 SSA countries shown in table 4.4,105 25 countries report one monopoly firm controlling all wireline telecommunications services. Of these, 80 percent are wholly government owned. Even for those countries that allow competition in the provision of wireline services, all countries in this sample, except Somalia, report at least some state ownership in the sector.106
102 Ibid., 54; Kenyan industry representative, interview by Commission staff, Nairobi, Kenya,
October 18, 2007. 103 EIU, “Africa Telecoms: Tariff Tumble; VoIP Rises,” March 8, 2007; Ethiopian government
representative, interview by Commission staff, Addis Ababa, Ethiopia, October 25, 2007. 104 Guislain, et al., “Connecting Sub-Saharan Africa,” 2005, 8. 105 Countries for which TeleGeography reported data. 106 TeleGeography, GlobalComms 3.0 (accessed August 23, 2007).
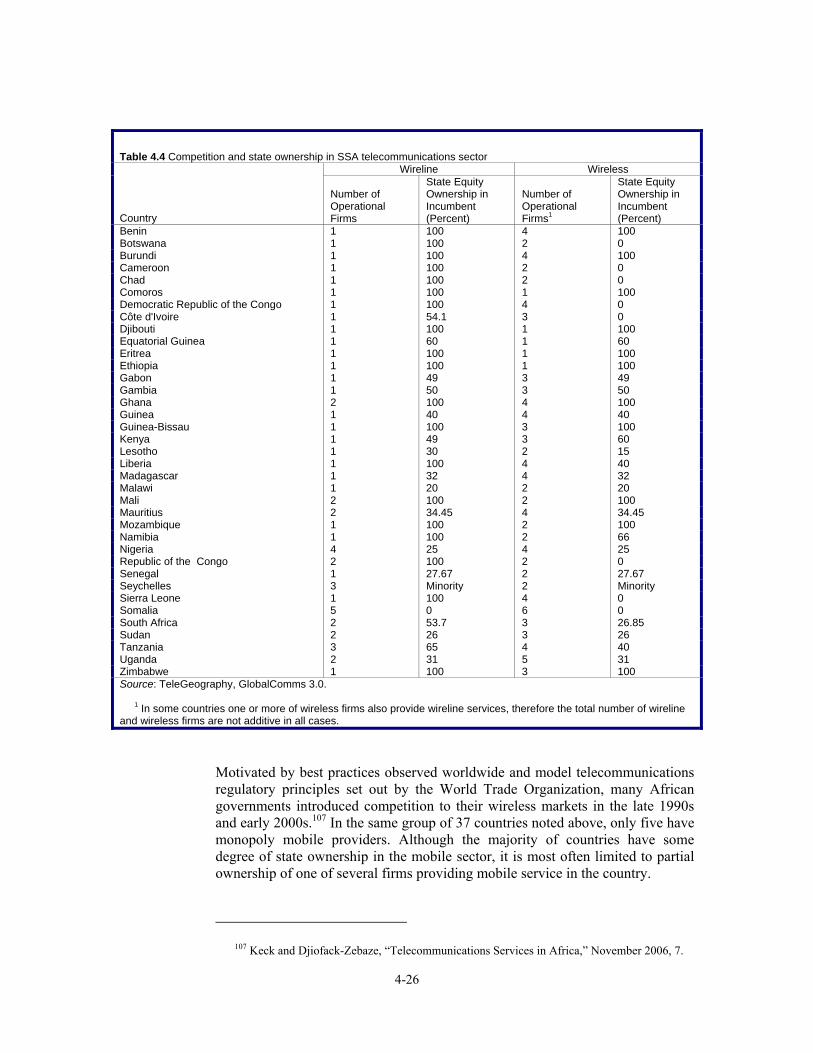
4-26
Table 4.4 Competition and state ownership in SSA telecommunications sector
Wireline Wireless
Country
Number of Operational Firms
State Equity Ownership in Incumbent (Percent)
Number of Operational Firms1
State Equity Ownership in Incumbent (Percent)
Benin 1 100 4 100 Botswana 1 100 2 0 Burundi 1 100 4 100 Cameroon 1 100 2 0 Chad 1 100 2 0 Comoros 1 100 1 100 Democratic Republic of the Congo 1 100 4 0 Côte d'Ivoire 1 54.1 3 0 Djibouti 1 100 1 100 Equatorial Guinea 1 60 1 60 Eritrea 1 100 1 100 Ethiopia 1 100 1 100 Gabon 1 49 3 49 Gambia 1 50 3 50 Ghana 2 100 4 100 Guinea 1 40 4 40 Guinea-Bissau 1 100 3 100 Kenya 1 49 3 60 Lesotho 1 30 2 15 Liberia 1 100 4 40 Madagascar 1 32 4 32 Malawi 1 20 2 20 Mali 2 100 2 100 Mauritius 2 34.45 4 34.45 Mozambique 1 100 2 100 Namibia 1 100 2 66 Nigeria 4 25 4 25 Republic of the Congo 2 100 2 0 Senegal 1 27.67 2 27.67 Seychelles 3 Minority 2 Minority Sierra Leone 1 100 4 0 Somalia 5 0 6 0 South Africa 2 53.7 3 26.85 Sudan 2 26 3 26 Tanzania 3 65 4 40 Uganda 2 31 5 31 Zimbabwe 1 100 3 100 Source: TeleGeography, GlobalComms 3.0. 1 In some countries one or more of wireless firms also provide wireline services, therefore the total number of wireline and wireless firms are not additive in all cases.
Motivated by best practices observed worldwide and model telecommunications regulatory principles set out by the World Trade Organization, many African governments introduced competition to their wireless markets in the late 1990s and early 2000s.107 In the same group of 37 countries noted above, only five have monopoly mobile providers. Although the majority of countries have some degree of state ownership in the mobile sector, it is most often limited to partial ownership of one of several firms providing mobile service in the country.
107 Keck and Djiofack-Zebaze, “Telecommunications Services in Africa,” November 2006, 7.
4-27
The impact of increased competition is often apparent almost immediately. In Côte d’Ivoire, for instance, the annual growth rate of mobile phone subscribers increased from an average of 34 percent over the period 2001–05 to 119 percent during June 2006−June 2007 following the licensing of a third mobile operator in July 2006. The new mobile operator was able to attract 300,000 subscribers in a single month, helping to increase the mobile penetration rate to 25 percent.108 Although recent data is not available, incoming international calls to Côte d’Ivoire (exports) increased by an average annual rate of 32 percent over the period 2001–04.109 Expanded Infrastructure Development The cost and quality of telecommunications services are based primarily on the underlying telecommunications infrastructure. By global standards, SSA’s telecommunications infrastructure is relatively underdeveloped. The role of SSA governments in supporting infrastructure development varies, based on the nature and location of the infrastructure being developed. For wireless infrastructure, especially in urban areas, direct government involvement is often not necessary. Indeed, an average of two-thirds of the SSA population in each of the countries for which the ITU reports data now live within range of a wireless network.110 In other cases, however, such as the construction of wireless networks in sparsely populated areas and the construction of national backbone infrastructure,111 private sector funding is typically inadequate. In the case of wireless service for rural areas, several SSA countries have proposed developing universal service funds, in which telecommunications firms contribute a portion of their revenues to a fund dedicated to building rural infrastructure. For example, Uganda has established a fund administered by the Ugandan Communication Commission that collects one percent of the gross revenue of all telecommunications operators and establishes internet and public phone access points in underserved areas of the country.112 National backbone networks and inter-country connections are especially important for international telecommunications. Currently, most calls between African countries must be routed through Europe, thus hampering intra-African trade and telecommunications. 113 In order to rectify this situation, several major privately funded fiberoptic submarine cables connecting countries on the east coast of Africa are currently under consideration. Although there is some contention between governments and private sector participants regarding the terms under which these cables would be operated, it is likely that at least one of these proposals will come to fruition, reducing the costs of international calls in
108 TeleGeography, GlobalComms 3.0 (accessed August 23, 2007); Ivorian industry
representatives, interviews by Commission staff, Abidjan, Côte d’Ivoire, October 24, 2007. 109 ITU, World Telecommunication Indicators 2006, (accessed January 28, 2008). 110 Ibid. 111 High capacity networks that connect major towns and cities within a country as well as
international connections. 112 Ugandan government representative, interview with Commission Staff, Kampala, Uganda,
October 23, 2007. 113 Guislain, et al., “Connecting Sub-Saharan Africa,” 2005, 31.
4-28
the region.114 National fiberoptic backbone networks are also being built within many SSA countries, linking cities and towns within country as well as providing direct fiberoptic connections between SSA countries, which should within several years eliminate the need for many intra-African calls to be routed through Europe.115 Expanded telecommunication infrastructure, however, is dependent on the provision of reliable electricity. Many rural areas in SSA lack electricity, posing a challenge for the development of telecommunications infrastructure. Telecommunication providers are able, in most cases, to develop certain basic infrastructure such as base stations, which allow nearby subscribers to connect to the network, using technologies such as solar or diesel generators where a local electric grid is unavailable. Power generated from these alternatives sources, however, is typically much more expensive than power provided from an electric grid.116 SSA Telecommunications Demand Growth Aside from supply-side factors such as government licensing and infrastructure development, a number of demand-side factors contributed to increased exports of telecommunications services from SSA countries. Two important factors, which are largely outside the scope of government policies, are geography and migration.
Greater Role of Geographic Links
Countries tend to have greater telecommunications links with neighboring, rather than distant countries. This may be slightly less true in SSA, where many telecommunication links are routed through former colonial powers in Europe rather than directly linking neighboring countries due to historical reasons.117 As African countries upgrade telecommunications infrastructure linking them to neighboring countries, however, close geographic links will play a greater role in determining demand for international telecommunications services.
Increased African Migration
Migration also plays a critical role in the demand for international telecommunication services an increasing number of Africans have emmigrated to foreign countries, especially in North America and Europe. These migrants often maintain strong communication links with friends and relatives in their
114 Economist, “Not so EASSy,” August 13, 2007. 115 Kenyan, Ugandan, and Ethiopian industry representatives, interviews by Commission staff,
Nairobi, Kenya, October 18, 2007, Kampala, Uganda, October 22, 2007, and Addis Ababa, Ethiopia, October 25, 2007.
116 USITC hearing transcript, October 23, 2007, 37; Kenyan industry representative, interview by Commission staff, Nairobi, Kenya, October 18, 2007.
117 Maliti, “Firms Race to Update E. Africa Telecom,” June 5, 2007.
4-29
home countries, which increases telecommunications exports of SSA countries.118
Higher GDP per Capita
GDP per capita growth in SSA countries has also substantially increased demand for international telecommunication services. Higher GDP per capita encourages increased telecommunications penetration as more people are able to afford telecommunications services, including international telecommunications services.119 Simultaneously, increased telecommunication penetration increases GDP growth (by facilitating business transactions, for example).120 Developing countries, therefore may experience a positive feedback cycle in regard to telecommunications markets, where increased penetration results in increased GDP per capita, which in turn further increases penetration.
Increased International Trade and Investment
Increased trade and investment may also be somewhat interrelated with increased international communications trade. During 2001−05, for example, foreign direct investment in SSA countries more than doubled while communications exports from SSA countries increased by 86 percent.121 As developing countries attract non-communications-related trade and investment, communications trade increases along with it as these transactions often require extensive communications between the parties, which encourages local telecommunications firms to compete for this international telecommunications traffic. At the same time, investors and traders are more attracted to markets which have extensive international telecommunications links. Thus a positive feedback cycle exists in this regard as well, where increased trade and investment encourage stronger international telecommunications links, which in turn encourages more trade and investment.122
Innovative Applications of Telecommunications
Demand for telecommunications services in many African countries is also increasing as consumers, firms, governments, NGOs, and international organizations develop an increasing number of applications for telecommunication services. For example, private and donor-funded efforts are underway in a number of SSA countries to provide farmers and other commodity producers with real-time information regarding prices of inputs and outputs at various market centers via text messages on mobile networks.123 Governments are also exploring offering extension services providing farmers with agricultural advice for various crops via telecommunications networks in order to boost
118 Terrazas, “Beyond Regional Circularity,” June 2007. 119 TeleGeography, Traffic Analysis, 2007, 23. 120 Nabyama, “High Tax Regime Hurting Telecoms, Says Survey,” August 20, 2007. 121 UNCTAD, World Investment Report; IMF, Balance of Payments Statistics (accessed
September 5, 2007. 122 UN, Investment Promotion and Enterprise Development Bulletin, 2003, 99. 123 Economic and Social Commission for Asia and Pacific, Economist, “Buy, Cell, Hold,”
January 27, 2007.
4-30
agricultural productivity and farm incomes, although rural applications of telecommunications often require increased investment in expensive rural infrastructure.124 Firms in several SSA countries have also begun to establish virtual banking systems based on mobile phone networks, which would extend financial services to low-income individuals previously excluded from the formal banking system.125 Additional new applications of telecommunication services include e-health and e-education, which use the telecommunications network to provide essential social services.126 Country Profiles
Ethiopia
Ethiopia is one of the few countries in Africa to maintain a state-owned monopoly responsible for providing all telecommunication services, including wireline, wireless, domestic, and international. The country has the second-lowest mobile penetration in SSA, with just 1.4 percent of its population subscribing to mobile services, exceeding only Eritrea, which also maintains a state-owned telecommunications monopoly. Although the lower penetration rate in Ethiopia may be explained in part by Ethiopia’s extremely low per capita GDP, a number of countries in SSA with lower GDP per capita, including Burundi, the Democratic Republic of Congo, Guinea-Bissau, and Liberia, have higher penetration of wireless services. 127 Nevertheless, the Ethiopian market has the potential for extremely rapid growth if competition is introduced. The country has the second-largest population in SSA, after Nigeria, which, as discussed below, experienced dramatic subscriber growth after liberalizing its telecommunications market. The government of Ethiopia has an ambitious infrastructure deployment program, which already deployed over 2,500 miles of fiberoptic cables connecting all outlying cities and is in the process of connecting more rural areas to the network, which it hopes will increase the number of mobile subscribers substantially.128 Additionally, there is a relatively large Ethiopian population living abroad, increasing the potential demand for international telephony services in Ethiopia.129
Kenya
The Kenyan telecommunications market has a relatively low level of competition in terms of number of firms, although recent actions by the government of Kenya promise to increase the level of competition in the country and provide lower prices and greater public access to telecommunications services.130 Kenya is
124 Ugandan government representative, interview by Commission staff, Kampala, Uganda,
October 23, 2007. 125 EIU, “South Africa Telecoms,” July 12, 2007. 126 Guislain, et al., “Connecting Sub-Saharan Africa,” 2005, 23. 127 TeleGeography, GlobalComms 3.0, (accessed August 23, 2007). 128 Ethiopian industry representative, interview by Commission staff, Addis Ababa, Ethiopia,
October 25, 2007. 129 Terrazas, Beyond Regional Circularity, June 2007. 130 EIU, “Africa Telecoms: Ghana and Kenya's Contrasting Fortunes,” March 27, 2007.
4-31
currently served by a single monopoly provider of wireline telecommunications services, Telkom Kenya. The government has attempted to introduce more competition into the wireline market over the past several years by privatizing Telkom Kenya and proposing to license a second national operator to compete with it on a national basis. In order to compete as a private operator, Telkom Kenya has in recent months undertaken a massive restructuring, laying off over 80 percent of its workforce in order to reduce wage expenses, which had consumed 49 percent of revenues. Telkom Kenya is also shifting its strategic focus to its recently launched mobile network and upgrading its wireline network, which will primarily service corporate customers in urban areas.131 Kenya’s wireless service providers, on the other hand, have been on the forefront of innovation in several areas. Safaricom, the country’s largest provider, has introduced a mobile money transfer system that allows subscribers, many of whom have no access to the formal banking system, to make and receive payments on their cellular phones.132 Safaricom’s chief rival in the country, Celtel, established the world’s first borderless mobile phone network in September 2006, allowing their customers in Kenya, Tanzania, and Uganda to use their phones anywhere in the region with no roaming charges.133 Since then, Celtel has added the Republic of the Congo, the Democratic Republic of the Congo, and Gabon to the program. Additionally, Safaricom has established its own borderless mobile network by forging agreements with wireless service providers in nearby countries Tanzania, Uganda, and Rwanda, and has ongoing negotiations with several other African countries.134 These borderless networks have reduced costs and increased volumes of international calls within the region, facilitating non-communications trade. Industry players in other regions such as Europe, have indicated interest in establishing similar borderless networks modeled on those in East Africa.135 Kenya is also attempting to develop an outsourcing and call center industry. Although the industry is still in its infancy, it is more developed than in most SSA countries.136 Currently, the cost of bandwidth is much higher in Kenya than in Asian countries with more established call center industries due to the lack of fiberoptic cable linking Kenya to the global network. In order to counteract this competitive disadvantage, the World Bank is assisting with financing that would offset the higher bandwidth costs in order to make the industry more competitive. Kenya is well placed to compete internationally in the call center industry because of its highly educated workforce and the clarity of the English spoken by the population.137
131 Kenyan industry representative, interview by Commission staff, Nairobi, Kenya,
October 18, 2007. 132 EIU, “Kenya Telecoms: Safaricom Aims for the Big Game,” August 2, 2007. 133 Celtel Kenya, “Celtel launches One Network,” September 27, 2006. 134 Mark, “Safaricom to Expand Seamless Mobile Network,” October 2, 2007. 135 Kenyan industry representative, interview by Commission staff, Nairobi, Kenya,
October 18, 2007. 136 World Bank, Snapshot Africa, January 2007, 76. 137 Kenyan industry representative, interview by Commission staff, Nairobi, Kenya,
October 18, 2007.
4-32
Nigeria
Nigeria became the largest telecommunication services market in SSA during 2007 in terms of the number of phone subscribers, overtaking South Africa. Since the licensing of four firms to provide wireless services in February 2001, the number of wireline and wireless subscribers in the country has increased from fewer than 1 million to over 49 million as of October 2007. The vast majority of this growth has come from increases in mobile rather than wireline services. In 2001, wireline subscribers outnumbered wireless subscribers by more than a two-to-one ratio. Within a year, this situation reversed, with wireless subscribers outnumbering wireline subscribers by more than two to one as newly licensed mobile providers rapidly deployed their networks. As of October 2007, there were over 20 wireless subscribers for every wireline subscriber.138 Increased wireless penetration was also reflected in international services, which the newly licensed wireless service providers were authorized to provide using their own international gateways, with Nigeria experiencing the fastest growth rate in outbound international calls of any country in the world.139 Phenomenal growth has led to some quality concerns, however. For instance, MTEL, the mobile subsidiary of the incumbent wireline operator, was initially quite successful in attracting subscribers due to comparatively lower domestic and international prices. However, due to insufficient network capacity, quality deteriorated, ultimately reducing its market share.140 According to officials at the Nigerian Communications Commission, greater investment in infrastructure is necessary to improve the poor quality of service common in Nigeria.141 A number of firms are attempting to improve quality and expand penetration by investing in infrastructure projects, including satellite, fiberoptic, and third-generation142 mobile networks which are capable of handling a greater number of subscribers, as well as offering more advanced telecommunication services, such as mobile internet service.143
138 Nigerian Communications Commission, “Subscriber Data,” (accessed January 28, 2008). 139 TeleGeography, Traffic Analysis, 2007, 21. 140 Oyewola, “MTELThe Embattled Network,” September 11, 2007. 141 Ashamu, “Telecom Service Providers Require 40,000 Base StationsNdukwe,”
September 11, 2007. 142 Third-generation (3G) systems, the most advanced mobile technology, enable value-added
services such as voice mail, call waiting, text messaging, and online connections; 3G technologies also offer data transfer speeds that are much faster than previous technologies and increase the capacity for a greater number of subscribers. Telecommunications firms are investing heavily in 3G technologies in numerous countries around the world, including several in SSA.
143 The Daily Trust, “GLO, Alcatel Sign 3G Expansion Deal,” May 7, 2007; Iboma, “Telkom to Invest $1bn Over Five Years,” August 24, 2007; and Ayobolu, “NCC: Stalling Nigeria's Advancement,” September 13, 2007.
4-33
South Africa
South Africa had long been SSA’s largest telecommunications market, until being overtaken by Nigeria in 2007, in terms of the total number of wireline and wireless subscribers, which total over 40 million. South Africa remains the largest SSA market in terms of the value of international telecommunications transactions.144 Furthermore, South Africa has the region’s highest wireless penetration, with 78 percent of the population subscribing to a mobile network, and the second-highest wireline penetration, with 8 percent of the population subscribing to wireline services, surpassed only by the Seychelles.145 Wireless telephony services were available relatively early in South Africa, with car phones first deployed in 1990, followed by the creation of Vodacom, which offered mobile services beginning in 1993, and Mobile Telephone Networks (MTN), which began offering mobile services in 1994.146 Based on their early experience in deploying wireless networks domestically, South African companies have aggressively expanded abroad (table 4.5). South African firms are a key source of investment in telecommunications services and infrastructure for many SSA countries. MTN, in particular, has gained a large market share in a number of SSA and Middle Eastern countries.147 Telkom South Africa recently announced it is investing $1 billion in Nigerian telecommunications infrastructure.148 As the South African mobile market nears saturation, this outward investment by South African firms seems likely to continue.
Uganda
The telecommunications reforms undertaken in Uganda are reported to be among the most successful in SSA.149 Uganda issues technology neutral licenses, which means that firms receiving licenses are free to provide telecommunications services over wireline or wireless networks using any technology they choose, including VoIP, fixed, cellular, or satellite technologies. Currently, Uganda is served by a large number of telecommunications firms, including firms offering fixed, wireless, VoIP, and international gateway services. Intense competition may explain how in 2004 (latest available data), Ugandans enjoyed lower per minute local call prices (both wireline and wireless) than the SSA average150 despite paying the second-highest telephone tax rate in the world.151 As of 2005, 70 percent of the Ugandan population lived within range of a telecommunications network. However, only 14 percent of the Ugandan population were mobile phone subscribers, slightly lower than the SSA average of 18 percent in 2006. Telecommunications operators, drawn by these relatively
144 TeleGeography, GlobalComms 3.0 (accessed August 23, 2007); IMF, Balance of Payments
Statistics (accessed September 5, 2007). 145 Ibid. 146 Gibbs, 10 Years of Cellular Freedom, 2004, 18–19. 147 EIU, “World Telecom,” August 16, 2007. 148 Iboma, “Telkom to Invest $1bn Over Five Years,” August 24, 2007. 149 Guislain, et al., “Connecting Sub-Saharan Africa,” 2005, 26. 150 ITU, World Telecommunications Indicators 2006 (accessed August 24, 2007). 151 Nabyama, “High Tax Regime Hurting Telecoms, Says Survey,” August 20, 2007.
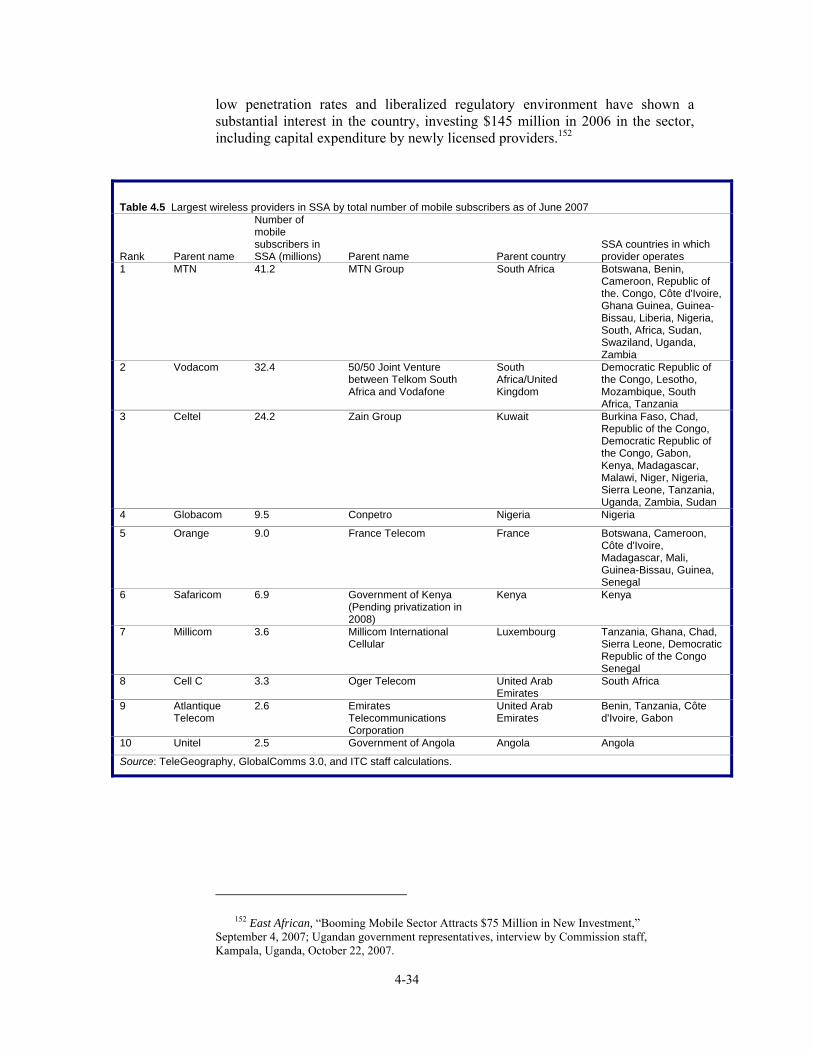
4-34
low penetration rates and liberalized regulatory environment have shown a substantial interest in the country, investing $145 million in 2006 in the sector, including capital expenditure by newly licensed providers.152
Table 4.5 Largest wireless providers in SSA by total number of mobile subscribers as of June 2007
Rank Parent name
Number of mobile subscribers in SSA (millions) Parent name Parent country
SSA countries in which provider operates
1 MTN 41.2 MTN Group South Africa Botswana, Benin, Cameroon, Republic of the. Congo, Côte d'Ivoire, Ghana Guinea, Guinea-Bissau, Liberia, Nigeria, South, Africa, Sudan, Swaziland, Uganda, Zambia
2 Vodacom 32.4 50/50 Joint Venture between Telkom South Africa and Vodafone
South Africa/United Kingdom
Democratic Republic of the Congo, Lesotho, Mozambique, South Africa, Tanzania
3 Celtel 24.2 Zain Group Kuwait Burkina Faso, Chad, Republic of the Congo, Democratic Republic of the Congo, Gabon, Kenya, Madagascar, Malawi, Niger, Nigeria, Sierra Leone, Tanzania, Uganda, Zambia, Sudan
4 Globacom 9.5 Conpetro Nigeria Nigeria
5 Orange 9.0 France Telecom France Botswana, Cameroon, Côte d'Ivoire, Madagascar, Mali, Guinea-Bissau, Guinea, Senegal
6 Safaricom 6.9 Government of Kenya (Pending privatization in 2008)
Kenya Kenya
7 Millicom 3.6 Millicom International Cellular
Luxembourg Tanzania, Ghana, Chad, Sierra Leone, Democratic Republic of the Congo Senegal
8 Cell C 3.3 Oger Telecom United Arab Emirates
South Africa
9 Atlantique Telecom
2.6 Emirates Telecommunications Corporation
United Arab Emirates
Benin, Tanzania, Côte d'Ivoire, Gabon
10 Unitel 2.5 Government of Angola Angola Angola
Source: TeleGeography, GlobalComms 3.0, and ITC staff calculations.
152 East African, “Booming Mobile Sector Attracts $75 Million in New Investment,”
September 4, 2007; Ugandan government representatives, interview by Commission staff, Kampala, Uganda, October 22, 2007.
4-35
Communications Bibliography Ashamu, Adelani. “Telecom Service Providers Require 40,000 Base Stations––Ndukwe.” Daily Champion, September 11, 2007. Ayobolu, Jide. “NCC: Stalling Nigeria's Advancement.” Vanguard, September 13, 2007. Boylaud, Olivier, and Giuseppe Nicoletti. “Regulation, Market Structure and Performance in Telecommunications.” OECD Economics Department Working Papers 237, 2000. Celtel Kenya. “Celtel Launches One Network: The World’s First Borderless Mobile Phone Network,” September 27, 2006. http://www.ke.celtel.com/en/about-us/news/press-release15/index.html (accessed September 17, 2007). East African. “Booming Mobile Sector Attracts $75 Million in New Investment,” September 4, 2007. Economist. “Buy, Cell, Hold,” January 27, 2007. ——. “Not So EASSy,” August 13, 2007. EIU. “Africa Telecoms: Ghana and Kenya's Contrasting Fortunes.” Industry Briefing March 27, 2007. ——. “Africa Telecoms: Tariff Tumble; VoIP Rises.” Industry Briefing, March 8, 2007. ——. “Africa Telecoms: Wired.” Business Africa, July 17, 2007. ——. “Kenya Telecoms: Safaricom Aims for the Big Game.” Industry Briefing, August 2, 2007. ——. “Kenya Telecoms: Second Time Lucky?” Industry Briefing, July 18, 2007 ——. “South Africa Telecoms: From Mattress to Mobile Banking.” Industry Briefing, July 12, 2007. ——. “World Telecoms: Key Player––MTN Group.” Industry Briefing, August 16, 2007. Daily Trust. “GLO, Alcatel sign 3G expansion deal,” May 7, 2007. Gibbs, Caroline. 10 Years of Cellular Freedom, MTN, 2004, Sandton, South Africa. GSM Association. Gateway Liberalisation: Stimulating Economic Growth. 2007. Guislain, Pierre, Mavis A. Ampah, Laurent Besançon, Cécile Niang, and Alexandre Sérot. “Connecting Sub-Saharan Africa.” World Bank Working Paper No. 51, 2005. Iboma, Jonah. “Telkom to Invest $1bn Over Five Years.” Biz-Community, August 24, 2007.
4-36
International Monetary Fund (IMF). Balance of Payments Statistics. http://www.imfstatistics.org/BOP/imfbrowser.aspx?branch=ROOT (accessed September 5, 2007.) ——. Balance of Payments Manual. 5th ed. Washington, DC: IMF, September 1993. ITU. World Telecommunication Indicators 2006 database. Keck, Alexander, and Calvin Djiofack-Zebaze. “Telecommunications Services in Africa: The Impact of Multilateral Commitments and Unilateral Reform on Sector Performance and Economic Growth.” WTO Staff Working Paper ERSD-2006-10, November 2006. Malakata, Michael. “African Telecom Gateway Costs to Come Down,” IDG News Service, January 23, 2007. Maliti, Tom. “Firms Race to Update E. Africa Telecom.” USA Today, June 5, 2007. http://www.usatoday.com/tech/products/2007-06-03-3689249882_x.htm (accessed September 5, 2007). Mark, Okuttah. “Safaricom to Expand Seamless Mobile Network.” Business Daily, October 2, 2007. ——. “Search for Second Telecom Operator put on Hold.” Business Daily, August 9, 2007. Nabyama, Phillip. “High Tax Regime Hurting Telecoms, Says Survey.” East African Business Week, August 20, 2007. Nigerian Communications Commission. “Subscriber Data,” undated. http://www.ncc.gov.ng/index5.htm (accessed various dates). Oyewola, Olusola. “MTEL–– The Embattled Network,” Mobile Africa, September 11, 2007. UNCTAD. World Investment Report. Annex Tables, 19 Inward FDI Stock, by Host Region and Economy, 1980–2006, October 16, 2007. http://www.unctad.org/sections/dite_dir/docs/wir2007_instock_en.xls (accessed various dates). U.S. International Trade Commission (USITC). Recent Trends in U.S. Services Trade, USITC Publication 3925. Washington, DC: USITC, June 2007. Standard & Poors (S&P). “Telecommunications: Wireless Europe.” Global Industry Surveys, April 2007. TeleGeography. GlobalComms 3.0. http://www.telegeography.com/ (accessed August 23 2007.) TeleGeography. Traffic Analysis, 2007. Terrazas, Aaron Mateo. Beyond Regional Circularity: The Emergence of an Ethiopian Diaspora. Migration Policy Institute, June 2007. http://www.migrationinformation.org/Profiles/print.cfm?ID=604 (accessed August 21, 2007).
4-37
UN Economic and Social Commission for Asia and the Pacific. Investment Promotion and Enterprise Development Bulletin for Asia and the Pacific. ST/ESCAP/2259, 2003. http://www.unescap.org/tid/publication/indpub2259.pdf (accessed August 20, 2007). World Bank. Snapshot Africa: Benchmarking FDI Competitiveness in Sub-Saharan African Countries, January 2007. www.fdi.net/snapshot_africa (accessed various dates).


APPENDIX A REQUEST LETTER

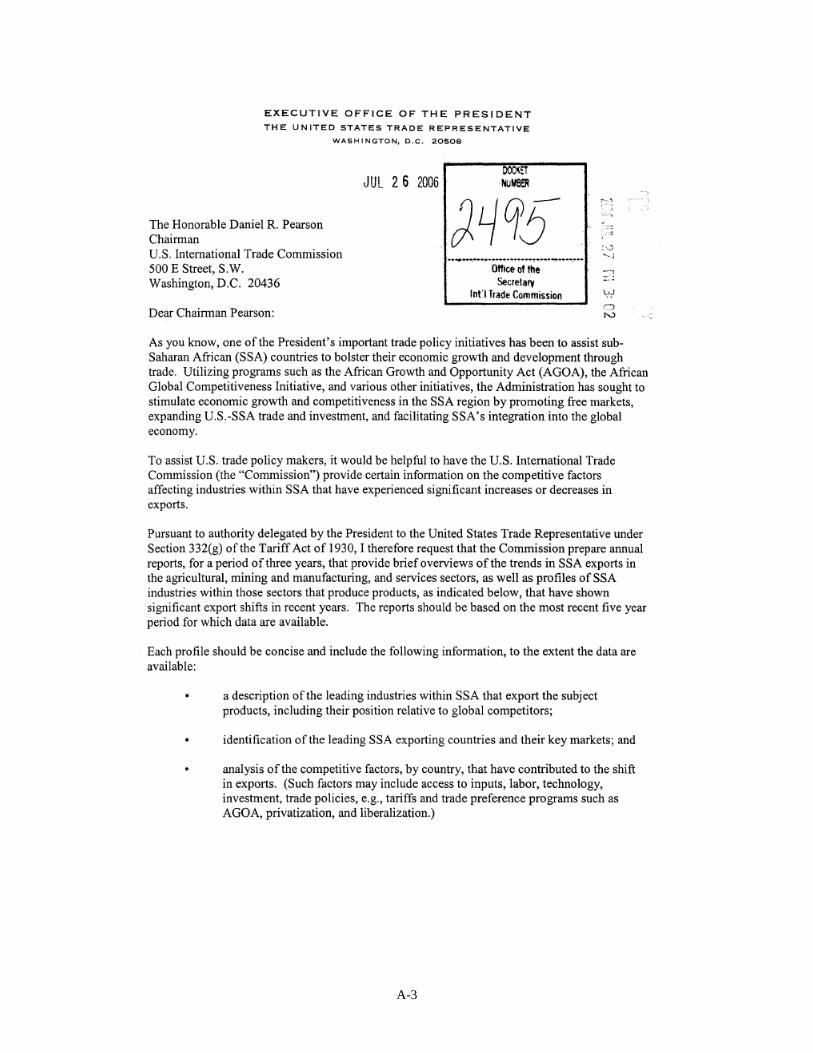
A-3
A-4
APPENDIX B FEDERAL REGISTER NOTICE

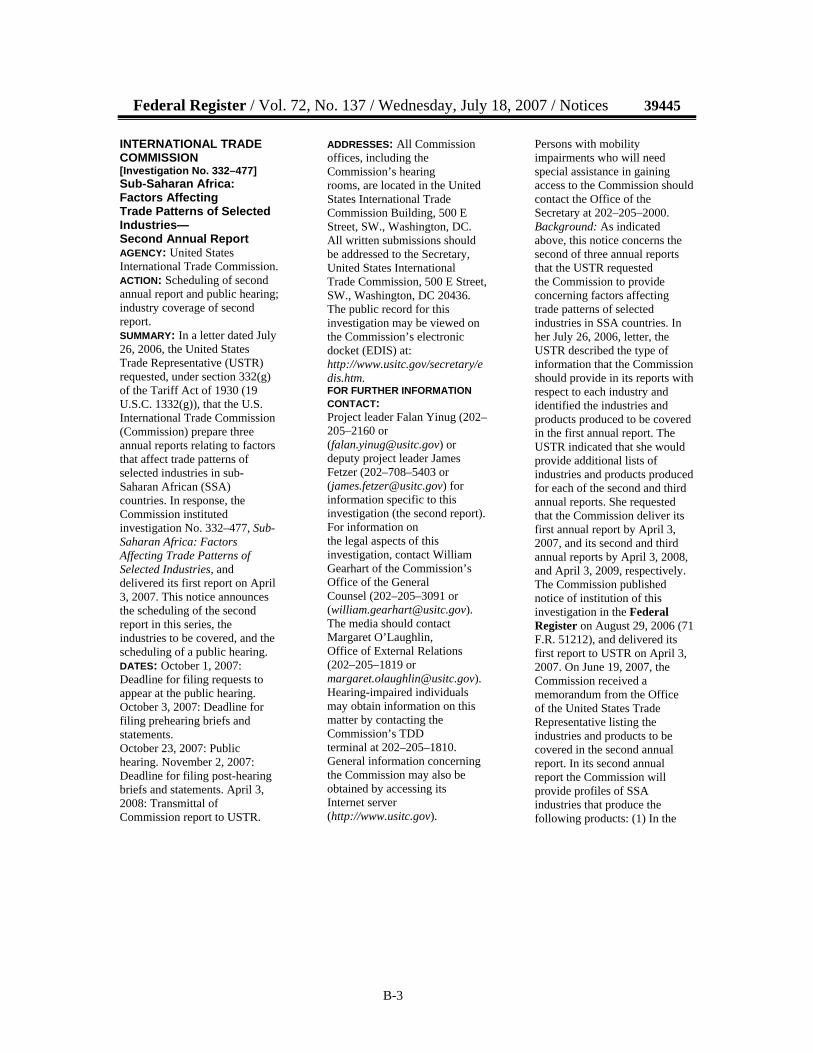
B-3
Federal Register / Vol. 72, No. 137 / Wednesday, July 18, 2007 / Notices 39445
INTERNATIONAL TRADE COMMISSION [Investigation No. 332–477] Sub-Saharan Africa: Factors Affecting Trade Patterns of Selected Industries— Second Annual Report AGENCY: United States International Trade Commission. ACTION: Scheduling of second annual report and public hearing; industry coverage of second report. SUMMARY: In a letter dated July 26, 2006, the United States Trade Representative (USTR) requested, under section 332(g) of the Tariff Act of 1930 (19 U.S.C. 1332(g)), that the U.S. International Trade Commission (Commission) prepare three annual reports relating to factors that affect trade patterns of selected industries in sub-Saharan African (SSA) countries. In response, the Commission instituted investigation No. 332–477, Sub-Saharan Africa: Factors Affecting Trade Patterns of Selected Industries, and delivered its first report on April 3, 2007. This notice announces the scheduling of the second report in this series, the industries to be covered, and the scheduling of a public hearing. DATES: October 1, 2007: Deadline for filing requests to appear at the public hearing. October 3, 2007: Deadline for filing prehearing briefs and statements. October 23, 2007: Public hearing. November 2, 2007: Deadline for filing post-hearing briefs and statements. April 3, 2008: Transmittal of Commission report to USTR.
ADDRESSES: All Commission offices, including the Commission’s hearing rooms, are located in the United States International Trade Commission Building, 500 E Street, SW., Washington, DC. All written submissions should be addressed to the Secretary, United States International Trade Commission, 500 E Street, SW., Washington, DC 20436. The public record for this investigation may be viewed on the Commission’s electronic docket (EDIS) at: http://www.usitc.gov/secretary/edis.htm. FOR FURTHER INFORMATION CONTACT: Project leader Falan Yinug (202–205–2160 or ([email protected]) or deputy project leader James Fetzer (202–708–5403 or ([email protected]) for information specific to this investigation (the second report). For information on the legal aspects of this investigation, contact William Gearhart of the Commission’s Office of the General Counsel (202–205–3091 or ([email protected]). The media should contact Margaret O’Laughlin, Office of External Relations (202–205–1819 or [email protected]). Hearing-impaired individuals may obtain information on this matter by contacting the Commission’s TDD terminal at 202–205–1810. General information concerning the Commission may also be obtained by accessing its Internet server (http://www.usitc.gov).
Persons with mobility impairments who will need special assistance in gaining access to the Commission should contact the Office of the Secretary at 202–205–2000. Background: As indicated above, this notice concerns the second of three annual reports that the USTR requested the Commission to provide concerning factors affecting trade patterns of selected industries in SSA countries. In her July 26, 2006, letter, the USTR described the type of information that the Commission should provide in its reports with respect to each industry and identified the industries and products produced to be covered in the first annual report. The USTR indicated that she would provide additional lists of industries and products produced for each of the second and third annual reports. She requested that the Commission deliver its first annual report by April 3, 2007, and its second and third annual reports by April 3, 2008, and April 3, 2009, respectively. The Commission published notice of institution of this investigation in the Federal Register on August 29, 2006 (71 F.R. 51212), and delivered its first report to USTR on April 3, 2007. On June 19, 2007, the Commission received a memorandum from the Office of the United States Trade Representative listing the industries and products to be covered in the second annual report. In its second annual report the Commission will provide profiles of SSA industries that produce the following products: (1) In the
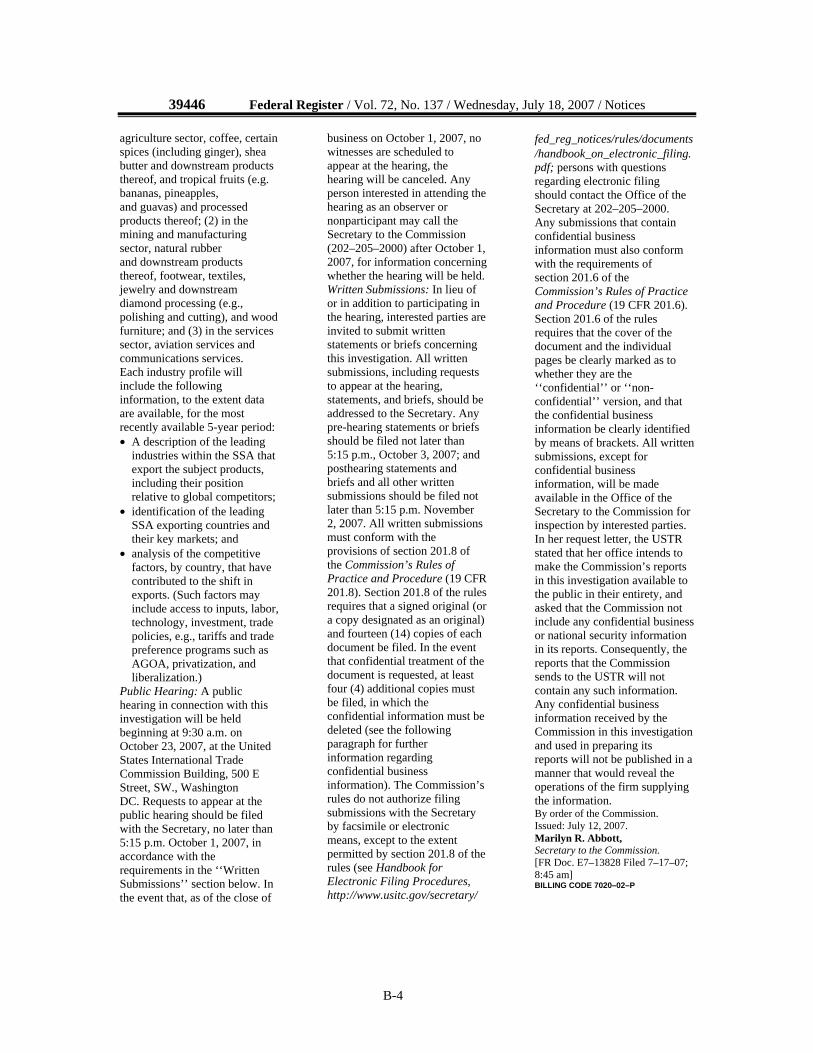
B-4
39446 Federal Register / Vol. 72, No. 137 / Wednesday, July 18, 2007 / Notices agriculture sector, coffee, certain spices (including ginger), shea butter and downstream products thereof, and tropical fruits (e.g. bananas, pineapples, and guavas) and processed products thereof; (2) in the mining and manufacturing sector, natural rubber and downstream products thereof, footwear, textiles, jewelry and downstream diamond processing (e.g., polishing and cutting), and wood furniture; and (3) in the services sector, aviation services and communications services. Each industry profile will include the following information, to the extent data are available, for the most recently available 5-year period: • A description of the leading
industries within the SSA that export the subject products, including their position relative to global competitors;
• identification of the leading SSA exporting countries and their key markets; and
• analysis of the competitive factors, by country, that have contributed to the shift in exports. (Such factors may include access to inputs, labor, technology, investment, trade policies, e.g., tariffs and trade preference programs such as AGOA, privatization, and liberalization.)
Public Hearing: A public hearing in connection with this investigation will be held beginning at 9:30 a.m. on October 23, 2007, at the United States International Trade Commission Building, 500 E Street, SW., Washington DC. Requests to appear at the public hearing should be filed with the Secretary, no later than 5:15 p.m. October 1, 2007, in accordance with the requirements in the ‘‘Written Submissions’’ section below. In the event that, as of the close of
business on October 1, 2007, no witnesses are scheduled to appear at the hearing, the hearing will be canceled. Any person interested in attending the hearing as an observer or nonparticipant may call the Secretary to the Commission (202–205–2000) after October 1, 2007, for information concerning whether the hearing will be held. Written Submissions: In lieu of or in addition to participating in the hearing, interested parties are invited to submit written statements or briefs concerning this investigation. All written submissions, including requests to appear at the hearing, statements, and briefs, should be addressed to the Secretary. Any pre-hearing statements or briefs should be filed not later than 5:15 p.m., October 3, 2007; and posthearing statements and briefs and all other written submissions should be filed not later than 5:15 p.m. November 2, 2007. All written submissions must conform with the provisions of section 201.8 of the Commission’s Rules of Practice and Procedure (19 CFR 201.8). Section 201.8 of the rules requires that a signed original (or a copy designated as an original) and fourteen (14) copies of each document be filed. In the event that confidential treatment of the document is requested, at least four (4) additional copies must be filed, in which the confidential information must be deleted (see the following paragraph for further information regarding confidential business information). The Commission’s rules do not authorize filing submissions with the Secretary by facsimile or electronic means, except to the extent permitted by section 201.8 of the rules (see Handbook for Electronic Filing Procedures, http://www.usitc.gov/secretary/
fed_reg_notices/rules/documents/handbook_on_electronic_filing.pdf; persons with questions regarding electronic filing should contact the Office of the Secretary at 202–205–2000. Any submissions that contain confidential business information must also conform with the requirements of section 201.6 of the Commission’s Rules of Practice and Procedure (19 CFR 201.6). Section 201.6 of the rules requires that the cover of the document and the individual pages be clearly marked as to whether they are the ‘‘confidential’’ or ‘‘non-confidential’’ version, and that the confidential business information be clearly identified by means of brackets. All written submissions, except for confidential business information, will be made available in the Office of the Secretary to the Commission for inspection by interested parties. In her request letter, the USTR stated that her office intends to make the Commission’s reports in this investigation available to the public in their entirety, and asked that the Commission not include any confidential business or national security information in its reports. Consequently, the reports that the Commission sends to the USTR will not contain any such information. Any confidential business information received by the Commission in this investigation and used in preparing its reports will not be published in a manner that would reveal the operations of the firm supplying the information. By order of the Commission. Issued: July 12, 2007. Marilyn R. Abbott, Secretary to the Commission. [FR Doc. E7–13828 Filed 7–17–07; 8:45 am] BILLING CODE 7020–02–P

APPENDIX C HEARING LIST OF PARTICPANTS

C-3
CALENDAR OF PUBLIC HEARING Those listed below are scheduled to appear as witnesses at the United States International Trade Commission’s hearing: Subject: Sub-Saharan Africa: Factors Affecting Trade Patterns of
Selected Industries - Second Annual Report Inv. No.: 332-477 Date and Time: October 23, 2007 - 9:30 a.m. Sessions were held in connection with this investigation in the Main Hearing Room (room 101), 500 E Street, S.W., Washington, D.C. MULTINATIONAL ORGANIZATION APPEARANCE: Common Market for Eastern and Southern Africa (COMESA) Zambia, Africa The Honorable Erastus Mwencha, Secretary General ORGANIZATION AND WITNESS: African Coalition for Trade, Inc. Washington, D.C. Paul Ryberg, President Manchester Trade Ltd. Washington, D.C. Stephen Lande, President
-END-

APPENDIX D SUMMARY OF VIEWS OF INTERESTED PARTIES

D-3
Africa Coalition for Trade, Inc.
The Africa Coalition for Trade, Inc. (ACT) states that it is a non-profit association representing private sector African companies who export to the United States under the African Growth and Opportunity Act (AGOA). ACT indicates that it has been involved in the development, implementation, and amendment of AGOA, and acts as one of the main spokespersons for the African private sector.
In its submission, ACT credits AGOA’s quota free access and duty preferences for SSA increases in apparel exports during 2001–04. ACT states that AGOA preferences were more effective before the Multifiber Agreement (MFA) import restraints were removed in 2005, as U.S. apparel imports from SSA decreased 26 percent during 2005–06. ACT claims that U.S. apparel imports from SSA declined due to increased competition from China. ACT concludes that AGOA preferences alone cannot sustain current levels of apparel trade that have developed in SSA since 2001.
Erastus Mwencha Secretary General, Common Market for Eastern and Southern Africa (COMESA)
In his statement, Erastus Mwencha, Secretary General, Common Market for Eastern and Southern Africa (COMESA) indicated that since the implementation of AGOA there have been remarkable changes in trade patterns between the United States and Africa. Ambassador Mwencha indicated that the Trade and Investment Framework Agreement has also proved a very good avenue for the various government entities that deal with trade to exchange ideas and provide services that support trade. Ambassador Mwencha indicated that since AGOA took effect in 2001, there has been an increase in trade flows between Africa and the United States, with African exports to the United States increasing from $15 billion in 2000 to $59 billion in 2006, and U.S. exports to Africa increasing from $6 billion to $12 billion. However, he indicated that exports from COMESA member countries declined from $3.5 billion in 2005 to $2.2 billion in 2006, likely because of the end of the MFA and competition in the textile and apparel sectors from producers in Bangladesh and China. Ambassador Mwencha indicated that despite the market access provided by AGOA and the comparative advantage that Africa enjoys in agriculture relative to the United States, exports to the United States have been limited because of supply issues such as the high cost of transportation, the limited coverage of agricultural products under AGOA, and pest risk assessment (PRA) and sanitary and phytosanitary (SPS) issues. He indicated that only six products from COMESA member states qualify to enter the U.S. market that have met PRAs—three for Zambia and three for Kenya—and that additional support for trade capacity is needed given the potential for increased exports.
D-4
He indicated that COMESA has developed a comprehensive agriculture development framework that seeks to expand investment and to address the millennium development goals. The ambassador indicated that this framework would also help Africa expand its own markets and help small scale farmers access the U.S. market.
Manchester Trade, Ltd.
As indicated by its website, Manchester Trade, Ltd. (Manchester) provides strategic trade and business advisory services to domestic and international clients in areas such as trade negotiations, export development, investment promotion, and legislative advocacy.1 In its submission to the Commission, Manchester highlights trade policy and infrastructure as factors affecting the shift in textile and apparel exports from SSA countries.2 According to Manchester, there are three existing threats to the “viability” of AGOA exports: the end of Chinese safeguards in the end of 2008, potential legislation proposing duty-free quota-free preferences for other developing countries, and preferences for other countries from other trade agreements. It claims that in order for AGOA countries to continue to take advantage of trade liberalization and global trade, countries must carry out internal reforms and that the international community must offer resources towards Aid for Trade. Manchester added that poor infrastructure puts SSA countries at a disadvantage against their competitors, especially when considering factors such as power costs and availability, telecommunication networks, and overcrowded and outdated port facilities. Manchester concludes by recommending that USTR maintain special preferences for SSA countries for the next 8 to 10 years, while the international community works to improve SSA infrastructure.
The Trade Law Center for Southern Africa (Tralac)
The Trade Law Center for Southern Africa (Tralac), a not-for-profit organization that focuses on building trade law capacity in sub-Saharan African countries so that they can participate effectively in the global economy, identifies key factors that reportedly affect the trade patterns of the textiles and apparel industries in these countries. Tralac notes the Southern African region’s fabric and garment manufacturing has a long history based on an abundant supply of cotton and its countries enjoyed protection in key exports markets under the MFA and the WTO’s Agreement on Textiles and Clothing (ATC).
1 http://www.manchestertrade.com/about.cfm (accessed December 17, 2007). 2 Manchester also noted in its submission that it attached excerpts from a report entitled, Impact
of the End of the MFA Quotas on COMESA’s Textile and Apparel Exports under AGOA, for additional information on factors including inputs, labor, technology, and investment. USAID East and Central Africa Trade Hub, Impact of the End of the MFA Quotas on COMESA’s Textile and Apparel Exports under AGOA, January 2005.
D-5
Tralac states that during the past three decades, however, Southern Africa’s textile and apparel sector has contracted and production has declined in the face of “unsuitable” economic policies, loss of comparative advantage, cheap imports, and difficulties accessing foreign markets. Tralac states that AGOA is widely credited as the single most important positive factor driving the region’s garment exports and attracting investment in new manufacturing capacity in Southern African countries. Tralac notes that the garment sector is an important employer in every country of the Southern African Customs Union (SACU): Botswana, Namibia, Lesotho, Swaziland, and South Africa. Tralac also notes that the garment sector is generally considered a key entry point to “economic upgrading” and diversification of agriculture- and minerals-based economies, and is known to offer one of the lowest investment costs for the creation of employment.
Tralac emphasizes that favorable rules of origin for garment exports from AGOA less developed country (LDC) beneficiaries are the single most important driver of the garment sector in these countries. Tralac states that exports using the third-country fabric provision comprise 99.9 percent of apparel exports in the SACU countries (except South Africa). However, the elimination of quotas under the MFA and lower U.S. tariffs have reduced preference margins for these countries relative to Asian competitors. Tralac notes that global value chain dynamics now require garment and textile exporters to supply products at a competitive price, on time, and within stringent product requirements. To be competitive, producers must be able to source their inputs from the most competitive suppliers worldwide. Tralac asserts that AGOA’s apparel provisions largely take into account the current global value chain dynamics and provide producers with the necessary flexibility to remain competitive. Tralac notes that AGOA distinctions between LDCs and non-LDCs in the rules of origin, and subsequent eligibility for duty-free status, subject South Africa and Mauritius to much more stringent rules of origin. The “triple transformation requirement” has undermined South Africa’s exports to the United States and the differentiated rules of origin requirements under AGOA create confusion and make sourcing from the region less attractive for U.S. apparel buyers.
Consequently, the textile and apparel sector in these four countries has expanded since 2000. In contrast, during the same period, South Africa’s textile and apparel production has contracted. In a final table, tralac summarizes and compares the key barriers to competitiveness and the principal factors driving apparel competitiveness in the apparel export sectors of the countries of BNLS with those of South Africa.
The Whitaker Group
The Whitaker Group, a private consultancy dedicated to supporting Africa’s development in the global economy and ensuring that AGOA helps grow African economies and markets, states that AGOA has led to a doubling of total exports from Africa over the life of the legislation and is credited with adding 150,000
D-6
textile, apparel, and related industry jobs. In 2006, the largest non-oil exports under AGOA came from Africa’s nascent apparel industry. Also, AGOA footwear exports increased by 6,000 percent during 2000-2005, albeit from a low base. The Whitaker Group cautions, however, that despite the growth in AGOA’s exports, AGOA countries face several important trade development challenges: 1) weak private sector capacity; 2) insufficient access to credit and financing; 3) weak infrastructure; and 4) high transportation costs and long lead times to markets. These factors alone are enough to divert trade and investment from Africa to other regions. Furthermore, Africa’s textile and apparel industries face additional challenges; competition has intensified from other apparel suppliers since the 2005 expiration of the MFA. During 2004–06, apparel exports from China doubled and exports from other LDCs such as Bangladesh and Cambodia continued to grow at a double digit pace. The Whitaker Group also indicates that recent legislative changes also pose constraints, noting that the abundant supply provision in AGOA IV provides special rules for fabric or yarns that are produced in commercial quantities in designated sub-Saharan African countries for use in qualifying apparel with a special legislative determination for certain denim fabrics. The Whitaker Group states that subject to this rule certain apparel goods may be excluded from AGOA’s third country benefits and that the rule reduces the incentive for U.S. retailers and apparel manufacturers to source from AGOA beneficiary countries. The Whitaker group recommends that this provision be repealed. SSA apparel exports under AGOA will also face increased competition after December 2008 when the U.S. and EU safeguards on Chinese textiles expire, possibly leading to reduced SSA apparel export volumes and export prices in 2008 and 2009. The Whitaker Group recommends renewing and further restricting the U.S. bilateral apparel and textile agreement with China. The Whitaker Group also voices concerns about the possible dilution of AGOA and potential of capital flight from Africa that could result from new preferential trade arrangements such as the new Partnership for Development Act, which would grant substantial trade preferences to all LDCs, including Bangladesh and Cambodia, if implemented. The Whitaker Group concludes that despite several daunting realities, U.S. efforts to promote trade and investment in Africa have supported some significant gains in recent years. However, the Whitaker Group states that the economic growth of sub-Saharan Africa hinges on efforts to create more robust trade initiatives; to enhance AGOA legislation that would eliminate the abundant supply provision; to include tax incentives for U.S. businesses that invest in value-added, labor intensive manufacturing in Africa; to expand AGOA to include additional products; and to encourage all OECD nations plus China to offer AGOA benefits.
APPENDIX E HARMONIZED TARIFF SCHEDULE CATEGORIES

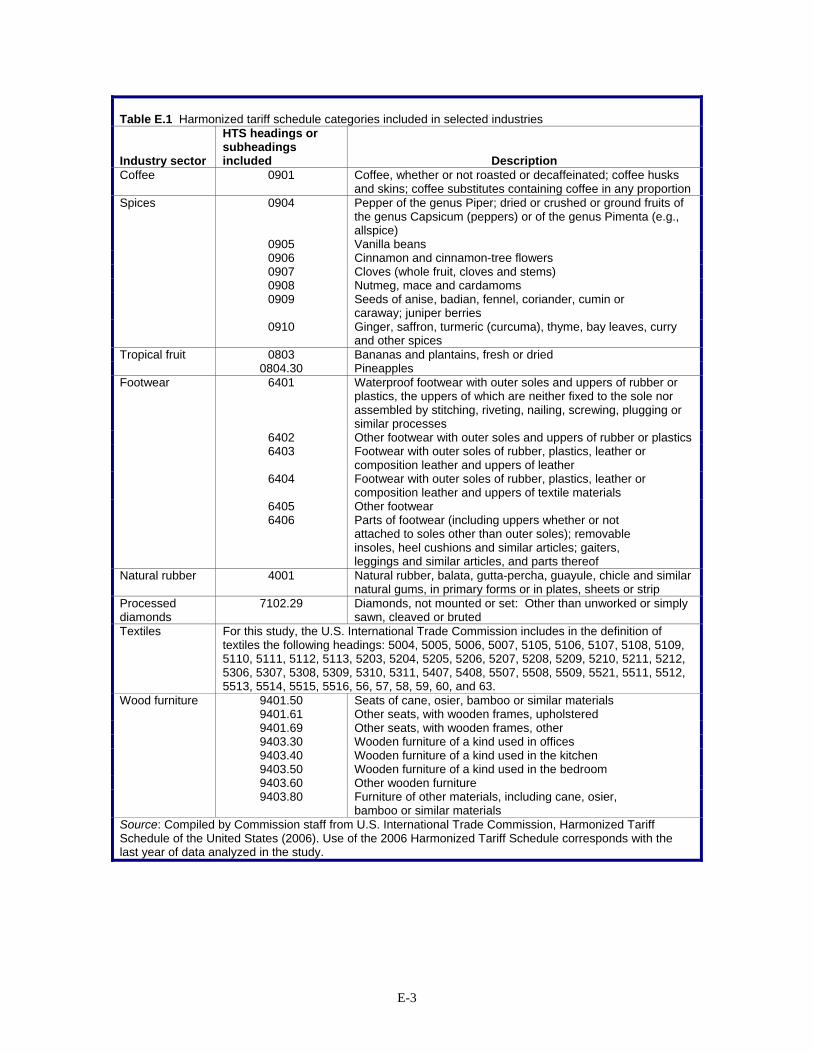
E-3
Table E.1 Harmonized tariff schedule categories included in selected industries
Industry sector
HTS headings or subheadings included
Description Coffee 0901 Coffee, whether or not roasted or decaffeinated; coffee husks
and skins; coffee substitutes containing coffee in any proportion 0904 Pepper of the genus Piper; dried or crushed or ground fruits of
the genus Capsicum (peppers) or of the genus Pimenta (e.g., allspice)
0905 Vanilla beans 0906 Cinnamon and cinnamon-tree flowers 0907 Cloves (whole fruit, cloves and stems) 0908 Nutmeg, mace and cardamoms 0909 Seeds of anise, badian, fennel, coriander, cumin or
caraway; juniper berries
Spices
0910 Ginger, saffron, turmeric (curcuma), thyme, bay leaves, curry and other spices
0803 Bananas and plantains, fresh or dried Tropical fruit 0804.30 Pineapples
6401 Waterproof footwear with outer soles and uppers of rubber or plastics, the uppers of which are neither fixed to the sole nor assembled by stitching, riveting, nailing, screwing, plugging or similar processes
6402 Other footwear with outer soles and uppers of rubber or plastics 6403 Footwear with outer soles of rubber, plastics, leather or
composition leather and uppers of leather 6404 Footwear with outer soles of rubber, plastics, leather or
composition leather and uppers of textile materials 6405 Other footwear
Footwear
6406 Parts of footwear (including uppers whether or not attached to soles other than outer soles); removable insoles, heel cushions and similar articles; gaiters, leggings and similar articles, and parts thereof
Natural rubber 4001 Natural rubber, balata, gutta-percha, guayule, chicle and similar natural gums, in primary forms or in plates, sheets or strip
Processed diamonds
7102.29 Diamonds, not mounted or set: Other than unworked or simply sawn, cleaved or bruted
Textiles For this study, the U.S. International Trade Commission includes in the definition of textiles the following headings: 5004, 5005, 5006, 5007, 5105, 5106, 5107, 5108, 5109, 5110, 5111, 5112, 5113, 5203, 5204, 5205, 5206, 5207, 5208, 5209, 5210, 5211, 5212, 5306, 5307, 5308, 5309, 5310, 5311, 5407, 5408, 5507, 5508, 5509, 5521, 5511, 5512, 5513, 5514, 5515, 5516, 56, 57, 58, 59, 60, and 63.
9401.50 Seats of cane, osier, bamboo or similar materials 9401.61 Other seats, with wooden frames, upholstered 9401.69 Other seats, with wooden frames, other 9403.30 Wooden furniture of a kind used in offices 9403.40 Wooden furniture of a kind used in the kitchen 9403.50 Wooden furniture of a kind used in the bedroom 9403.60 Other wooden furniture
Wood furniture
9403.80 Furniture of other materials, including cane, osier, bamboo or similar materials
Source: Compiled by Commission staff from U.S. International Trade Commission, Harmonized Tariff Schedule of the United States (2006). Use of the 2006 Harmonized Tariff Schedule corresponds with the last year of data analyzed in the study.

APPENDIX F LEADING EXPORT SHIFTS FOR ALL SSA COUNTRIES

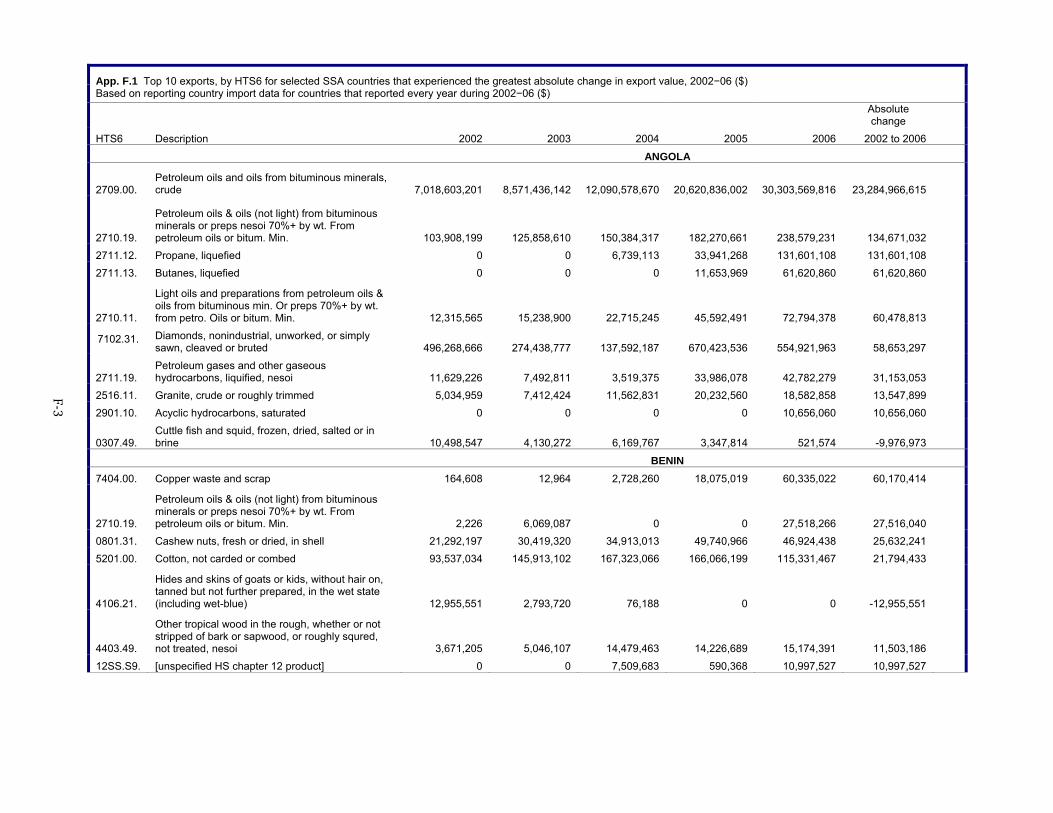
F‐3
App. F.1 Top 10 exports, by HTS6 for selected SSA countries that experienced the greatest absolute change in export value, 2002−06 ($) Based on reporting country import data for countries that reported every year during 2002−06 ($)
Absolute change
HTS6 Description 2002 2003 2004 2005 2006 2002 to 2006 ANGOLA
2709.00. Petroleum oils and oils from bituminous minerals, crude 7,018,603,201 8,571,436,142 12,090,578,670 20,620,836,002 30,303,569,816 23,284,966,615
2710.19.
Petroleum oils & oils (not light) from bituminous minerals or preps nesoi 70%+ by wt. From petroleum oils or bitum. Min. 103,908,199 125,858,610 150,384,317 182,270,661 238,579,231 134,671,032
2711.12. Propane, liquefied 0 0 6,739,113 33,941,268 131,601,108 131,601,108 2711.13. Butanes, liquefied 0 0 0 11,653,969 61,620,860 61,620,860
2710.11.
Light oils and preparations from petroleum oils & oils from bituminous min. Or preps 70%+ by wt. from petro. Oils or bitum. Min. 12,315,565 15,238,900 22,715,245 45,592,491 72,794,378 60,478,813
7102.31. Diamonds, nonindustrial, unworked, or simply sawn, cleaved or bruted 496,268,666 274,438,777 137,592,187 670,423,536 554,921,963 58,653,297
2711.19. Petroleum gases and other gaseous hydrocarbons, liquified, nesoi 11,629,226 7,492,811 3,519,375 33,986,078 42,782,279 31,153,053
2516.11. Granite, crude or roughly trimmed 5,034,959 7,412,424 11,562,831 20,232,560 18,582,858 13,547,899 2901.10. Acyclic hydrocarbons, saturated 0 0 0 0 10,656,060 10,656,060
0307.49. Cuttle fish and squid, frozen, dried, salted or in brine 10,498,547 4,130,272 6,169,767 3,347,814 521,574 -9,976,973
BENIN 7404.00. Copper waste and scrap 164,608 12,964 2,728,260 18,075,019 60,335,022 60,170,414
2710.19.
Petroleum oils & oils (not light) from bituminous minerals or preps nesoi 70%+ by wt. From petroleum oils or bitum. Min. 2,226 6,069,087 0 0 27,518,266 27,516,040
0801.31. Cashew nuts, fresh or dried, in shell 21,292,197 30,419,320 34,913,013 49,740,966 46,924,438 25,632,241 5201.00. Cotton, not carded or combed 93,537,034 145,913,102 167,323,066 166,066,199 115,331,467 21,794,433
4106.21.
Hides and skins of goats or kids, without hair on, tanned but not further prepared, in the wet state (including wet-blue) 12,955,551 2,793,720 76,188 0 0 -12,955,551
4403.49.
Other tropical wood in the rough, whether or not stripped of bark or sapwood, or roughly squred, not treated, nesoi 3,671,205 5,046,107 14,479,463 14,226,689 15,174,391 11,503,186
12SS.S9. [unspecified HS chapter 12 product] 0 0 7,509,683 590,368 10,997,527 10,997,527
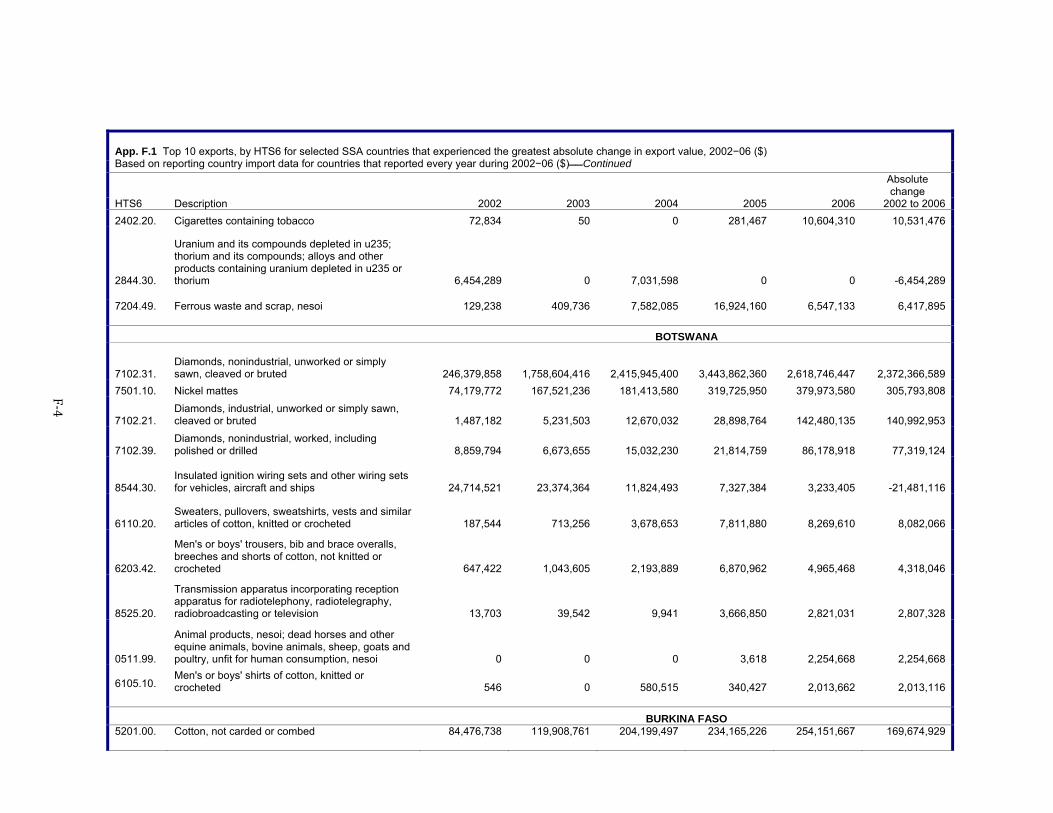
F‐4
App. F.1 Top 10 exports, by HTS6 for selected SSA countries that experienced the greatest absolute change in export value, 2002−06 ($) Based on reporting country import data for countries that reported every year during 2002−06 ($)Continued
Absolute change
HTS6 Description 2002 2003 2004 2005 2006 2002 to 20062402.20. Cigarettes containing tobacco 72,834 50 0 281,467 10,604,310 10,531,476
2844.30.
Uranium and its compounds depleted in u235; thorium and its compounds; alloys and other products containing uranium depleted in u235 or thorium 6,454,289 0 7,031,598 0 0 -6,454,289
7204.49. Ferrous waste and scrap, nesoi 129,238 409,736 7,582,085 16,924,160 6,547,133 6,417,895
BOTSWANA
7102.31. Diamonds, nonindustrial, unworked or simply sawn, cleaved or bruted 246,379,858 1,758,604,416 2,415,945,400 3,443,862,360 2,618,746,447 2,372,366,589
7501.10. Nickel mattes 74,179,772 167,521,236 181,413,580 319,725,950 379,973,580 305,793,808
7102.21. Diamonds, industrial, unworked or simply sawn, cleaved or bruted 1,487,182 5,231,503 12,670,032 28,898,764 142,480,135 140,992,953
7102.39. Diamonds, nonindustrial, worked, including polished or drilled 8,859,794 6,673,655 15,032,230 21,814,759 86,178,918 77,319,124
8544.30. Insulated ignition wiring sets and other wiring sets for vehicles, aircraft and ships 24,714,521 23,374,364 11,824,493 7,327,384 3,233,405 -21,481,116
6110.20. Sweaters, pullovers, sweatshirts, vests and similar articles of cotton, knitted or crocheted 187,544 713,256 3,678,653 7,811,880 8,269,610 8,082,066
6203.42.
Men's or boys' trousers, bib and brace overalls, breeches and shorts of cotton, not knitted or crocheted 647,422 1,043,605 2,193,889 6,870,962 4,965,468 4,318,046
8525.20.
Transmission apparatus incorporating reception apparatus for radiotelephony, radiotelegraphy, radiobroadcasting or television 13,703 39,542 9,941 3,666,850 2,821,031 2,807,328
0511.99.
Animal products, nesoi; dead horses and other equine animals, bovine animals, sheep, goats and poultry, unfit for human consumption, nesoi 0 0 0 3,618 2,254,668 2,254,668
6105.10.
Men's or boys' shirts of cotton, knitted or crocheted 546 0 580,515 340,427 2,013,662 2,013,116
BURKINA FASO 5201.00. Cotton, not carded or combed 84,476,738 119,908,761 204,199,497 234,165,226 254,151,667 169,674,929
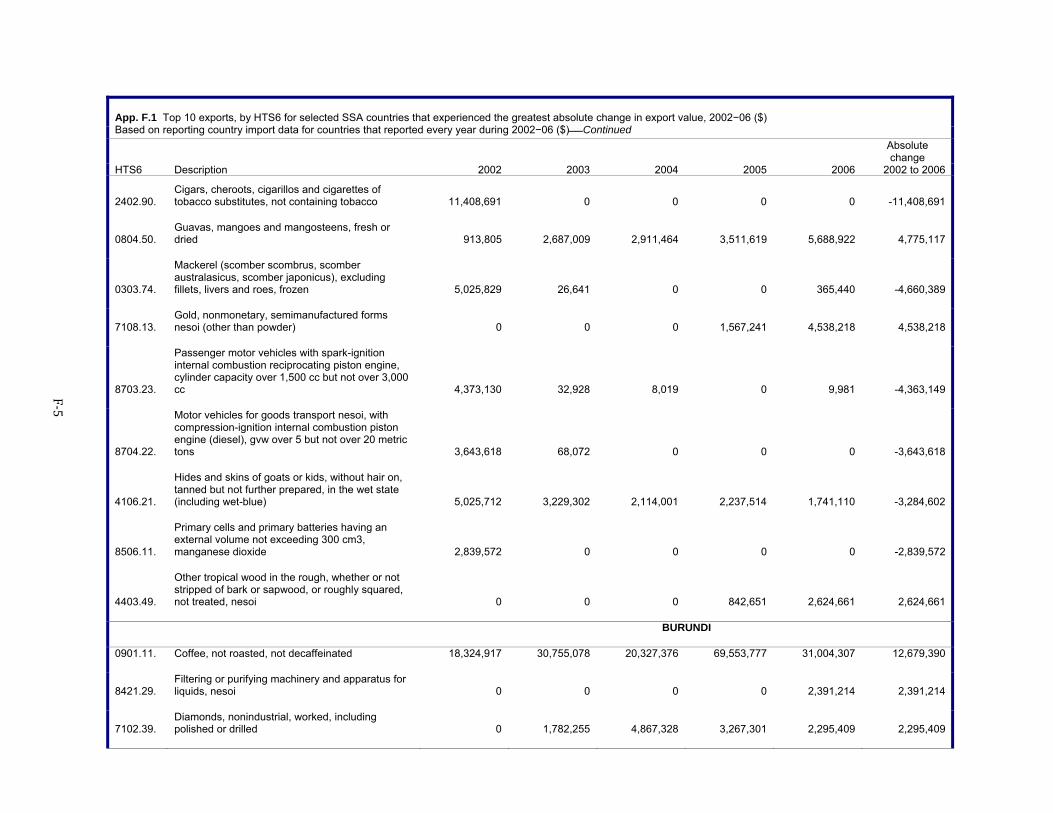
F‐5
App. F.1 Top 10 exports, by HTS6 for selected SSA countries that experienced the greatest absolute change in export value, 2002−06 ($) Based on reporting country import data for countries that reported every year during 2002−06 ($)Continued
Absolute change
HTS6 Description 2002 2003 2004 2005 2006 2002 to 2006
2402.90. Cigars, cheroots, cigarillos and cigarettes of tobacco substitutes, not containing tobacco 11,408,691 0 0 0 0 -11,408,691
0804.50. Guavas, mangoes and mangosteens, fresh or dried 913,805 2,687,009 2,911,464 3,511,619 5,688,922 4,775,117
0303.74.
Mackerel (scomber scombrus, scomber australasicus, scomber japonicus), excluding fillets, livers and roes, frozen 5,025,829 26,641 0 0 365,440 -4,660,389
7108.13. Gold, nonmonetary, semimanufactured forms nesoi (other than powder) 0 0 0 1,567,241 4,538,218 4,538,218
8703.23.
Passenger motor vehicles with spark-ignition internal combustion reciprocating piston engine, cylinder capacity over 1,500 cc but not over 3,000 cc 4,373,130 32,928 8,019 0 9,981 -4,363,149
8704.22.
Motor vehicles for goods transport nesoi, with compression-ignition internal combustion piston engine (diesel), gvw over 5 but not over 20 metric tons 3,643,618 68,072 0 0 0 -3,643,618
4106.21.
Hides and skins of goats or kids, without hair on, tanned but not further prepared, in the wet state (including wet-blue) 5,025,712 3,229,302 2,114,001 2,237,514 1,741,110 -3,284,602
8506.11.
Primary cells and primary batteries having an external volume not exceeding 300 cm3, manganese dioxide 2,839,572 0 0 0 0 -2,839,572
4403.49.
Other tropical wood in the rough, whether or not stripped of bark or sapwood, or roughly squared, not treated, nesoi 0 0 0 842,651 2,624,661 2,624,661
BURUNDI
0901.11. Coffee, not roasted, not decaffeinated 18,324,917 30,755,078 20,327,376 69,553,777 31,004,307 12,679,390
8421.29. Filtering or purifying machinery and apparatus for liquids, nesoi 0 0 0 0 2,391,214 2,391,214
7102.39. Diamonds, nonindustrial, worked, including polished or drilled 0 1,782,255 4,867,328 3,267,301 2,295,409 2,295,409
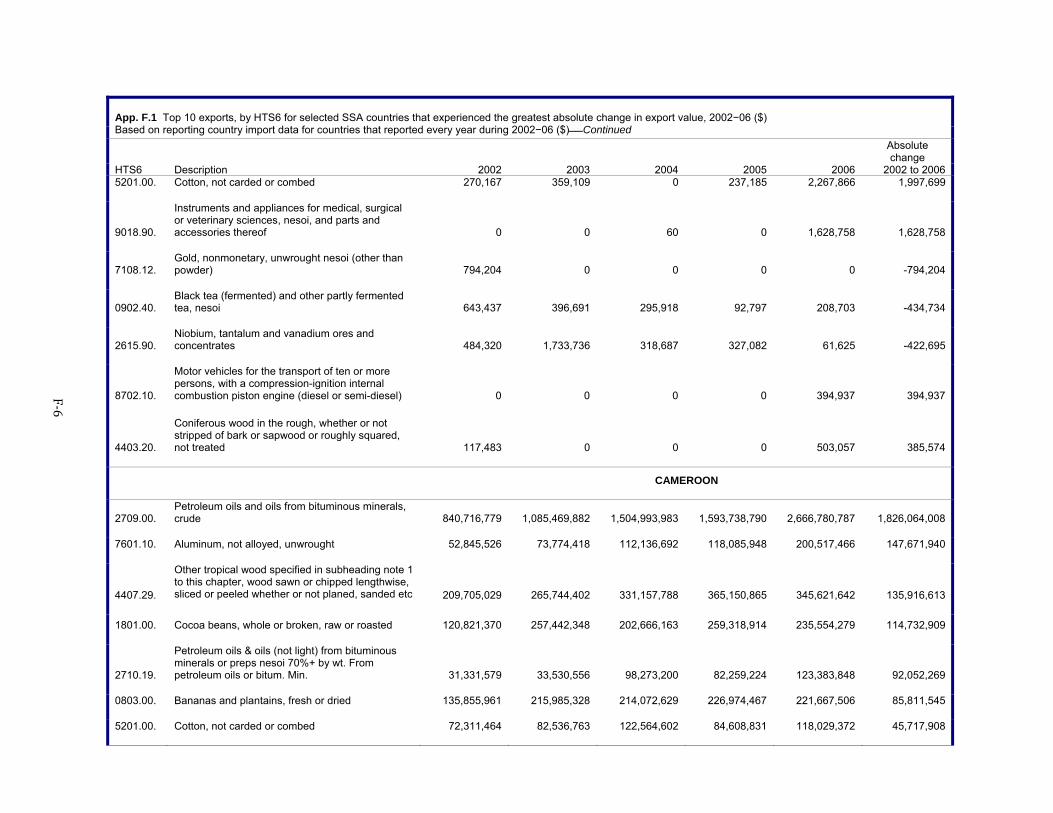
F‐6
App. F.1 Top 10 exports, by HTS6 for selected SSA countries that experienced the greatest absolute change in export value, 2002−06 ($) Based on reporting country import data for countries that reported every year during 2002−06 ($)Continued
Absolute change
HTS6 Description 2002 2003 2004 2005 2006 2002 to 20065201.00. Cotton, not carded or combed 270,167 359,109 0 237,185 2,267,866 1,997,699
9018.90.
Instruments and appliances for medical, surgical or veterinary sciences, nesoi, and parts and accessories thereof 0 0 60 0 1,628,758 1,628,758
7108.12. Gold, nonmonetary, unwrought nesoi (other than powder) 794,204 0 0 0 0 -794,204
0902.40. Black tea (fermented) and other partly fermented tea, nesoi 643,437 396,691 295,918 92,797 208,703 -434,734
2615.90. Niobium, tantalum and vanadium ores and concentrates 484,320 1,733,736 318,687 327,082 61,625 -422,695
8702.10.
Motor vehicles for the transport of ten or more persons, with a compression-ignition internal combustion piston engine (diesel or semi-diesel) 0 0 0 0 394,937 394,937
4403.20.
Coniferous wood in the rough, whether or not stripped of bark or sapwood or roughly squared, not treated 117,483 0 0 0 503,057 385,574
CAMEROON
2709.00. Petroleum oils and oils from bituminous minerals, crude 840,716,779 1,085,469,882 1,504,993,983 1,593,738,790 2,666,780,787 1,826,064,008
7601.10. Aluminum, not alloyed, unwrought 52,845,526 73,774,418 112,136,692 118,085,948 200,517,466 147,671,940
4407.29.
Other tropical wood specified in subheading note 1 to this chapter, wood sawn or chipped lengthwise, sliced or peeled whether or not planed, sanded etc
209,705,029
265,744,402
331,157,788
365,150,865
345,621,642
135,916,613
1801.00. Cocoa beans, whole or broken, raw or roasted 120,821,370 257,442,348 202,666,163 259,318,914 235,554,279 114,732,909
2710.19.
Petroleum oils & oils (not light) from bituminous minerals or preps nesoi 70%+ by wt. From petroleum oils or bitum. Min. 31,331,579 33,530,556 98,273,200 82,259,224 123,383,848 92,052,269
0803.00. Bananas and plantains, fresh or dried 135,855,961 215,985,328 214,072,629 226,974,467 221,667,506 85,811,545
5201.00. Cotton, not carded or combed 72,311,464 82,536,763 122,564,602 84,608,831 118,029,372 45,717,908
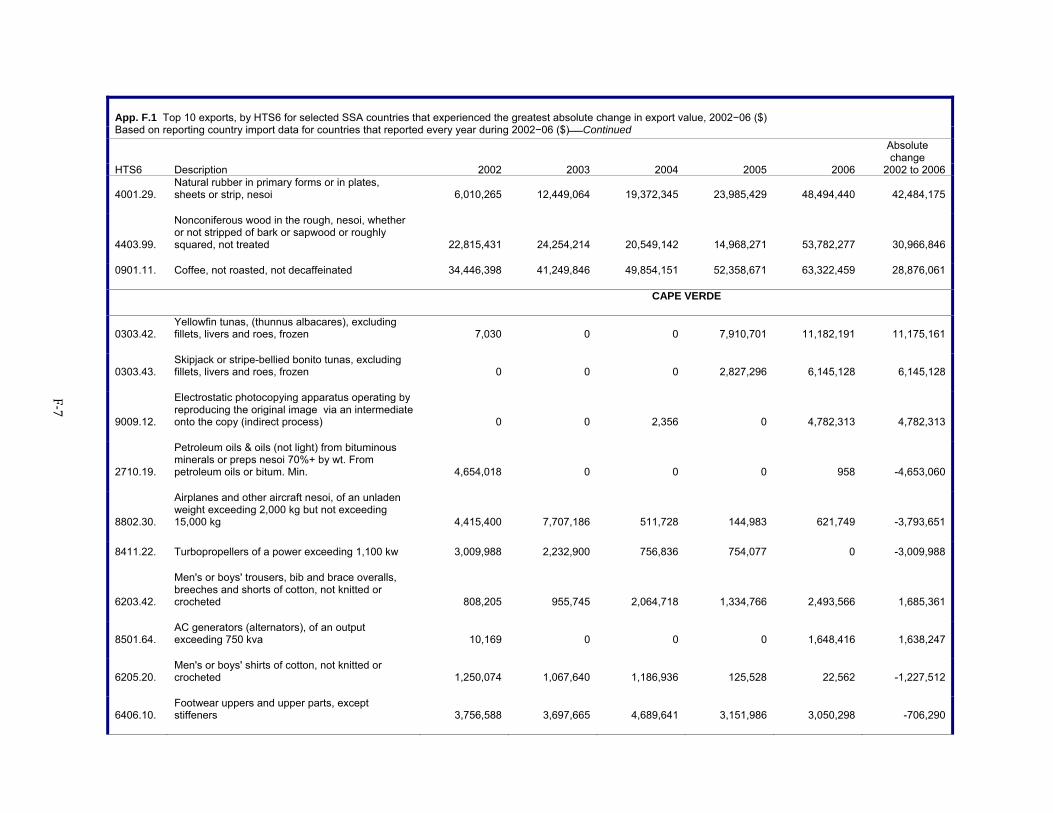
F‐7
App. F.1 Top 10 exports, by HTS6 for selected SSA countries that experienced the greatest absolute change in export value, 2002−06 ($) Based on reporting country import data for countries that reported every year during 2002−06 ($)Continued
Absolute change
HTS6 Description 2002 2003 2004 2005 2006 2002 to 2006
4001.29. Natural rubber in primary forms or in plates, sheets or strip, nesoi 6,010,265 12,449,064 19,372,345 23,985,429 48,494,440 42,484,175
4403.99.
Nonconiferous wood in the rough, nesoi, whether or not stripped of bark or sapwood or roughly squared, not treated 22,815,431 24,254,214 20,549,142 14,968,271 53,782,277 30,966,846
0901.11. Coffee, not roasted, not decaffeinated 34,446,398 41,249,846 49,854,151 52,358,671 63,322,459 28,876,061
CAPE VERDE
0303.42. Yellowfin tunas, (thunnus albacares), excluding fillets, livers and roes, frozen 7,030 0 0 7,910,701 11,182,191 11,175,161
0303.43. Skipjack or stripe-bellied bonito tunas, excluding fillets, livers and roes, frozen 0 0 0 2,827,296 6,145,128 6,145,128
9009.12.
Electrostatic photocopying apparatus operating by reproducing the original image via an intermediate onto the copy (indirect process) 0 0 2,356 0 4,782,313 4,782,313
2710.19.
Petroleum oils & oils (not light) from bituminous minerals or preps nesoi 70%+ by wt. From petroleum oils or bitum. Min. 4,654,018 0 0 0 958 -4,653,060
8802.30.
Airplanes and other aircraft nesoi, of an unladen weight exceeding 2,000 kg but not exceeding 15,000 kg 4,415,400 7,707,186 511,728 144,983 621,749 -3,793,651
8411.22. Turbopropellers of a power exceeding 1,100 kw 3,009,988 2,232,900 756,836 754,077 0 -3,009,988
6203.42.
Men's or boys' trousers, bib and brace overalls, breeches and shorts of cotton, not knitted or crocheted 808,205 955,745 2,064,718 1,334,766 2,493,566 1,685,361
8501.64. AC generators (alternators), of an output exceeding 750 kva 10,169 0 0 0 1,648,416 1,638,247
6205.20. Men's or boys' shirts of cotton, not knitted or crocheted 1,250,074 1,067,640 1,186,936 125,528 22,562 -1,227,512
6406.10. Footwear uppers and upper parts, except stiffeners 3,756,588 3,697,665 4,689,641 3,151,986 3,050,298 -706,290
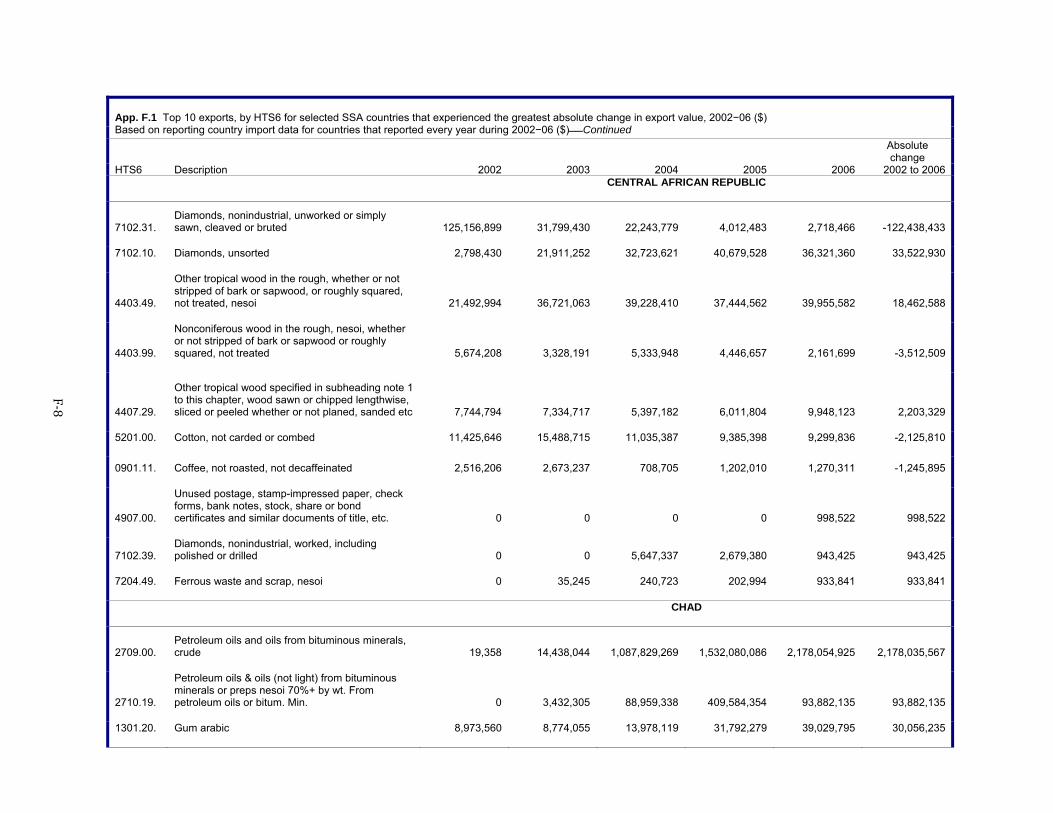
F‐8
App. F.1 Top 10 exports, by HTS6 for selected SSA countries that experienced the greatest absolute change in export value, 2002−06 ($) Based on reporting country import data for countries that reported every year during 2002−06 ($)Continued
Absolute change
HTS6 Description 2002 2003 2004 2005 2006 2002 to 2006 CENTRAL AFRICAN REPUBLIC
7102.31. Diamonds, nonindustrial, unworked or simply sawn, cleaved or bruted 125,156,899 31,799,430 22,243,779 4,012,483 2,718,466 -122,438,433
7102.10. Diamonds, unsorted 2,798,430 21,911,252 32,723,621 40,679,528 36,321,360 33,522,930
4403.49.
Other tropical wood in the rough, whether or not stripped of bark or sapwood, or roughly squared, not treated, nesoi 21,492,994 36,721,063 39,228,410 37,444,562 39,955,582 18,462,588
4403.99.
Nonconiferous wood in the rough, nesoi, whether or not stripped of bark or sapwood or roughly squared, not treated 5,674,208 3,328,191 5,333,948 4,446,657 2,161,699 -3,512,509
4407.29.
Other tropical wood specified in subheading note 1 to this chapter, wood sawn or chipped lengthwise, sliced or peeled whether or not planed, sanded etc 7,744,794 7,334,717 5,397,182 6,011,804 9,948,123 2,203,329
5201.00. Cotton, not carded or combed 11,425,646 15,488,715 11,035,387 9,385,398 9,299,836 -2,125,810
0901.11. Coffee, not roasted, not decaffeinated 2,516,206 2,673,237 708,705 1,202,010 1,270,311 -1,245,895
4907.00.
Unused postage, stamp-impressed paper, check forms, bank notes, stock, share or bond certificates and similar documents of title, etc. 0 0 0 0 998,522 998,522
7102.39. Diamonds, nonindustrial, worked, including polished or drilled 0 0 5,647,337 2,679,380 943,425 943,425
7204.49. Ferrous waste and scrap, nesoi 0 35,245 240,723 202,994 933,841 933,841
CHAD
2709.00. Petroleum oils and oils from bituminous minerals, crude 19,358 14,438,044 1,087,829,269 1,532,080,086 2,178,054,925 2,178,035,567
2710.19.
Petroleum oils & oils (not light) from bituminous minerals or preps nesoi 70%+ by wt. From petroleum oils or bitum. Min. 0 3,432,305 88,959,338 409,584,354 93,882,135 93,882,135
1301.20. Gum arabic 8,973,560 8,774,055 13,978,119 31,792,279 39,029,795 30,056,235
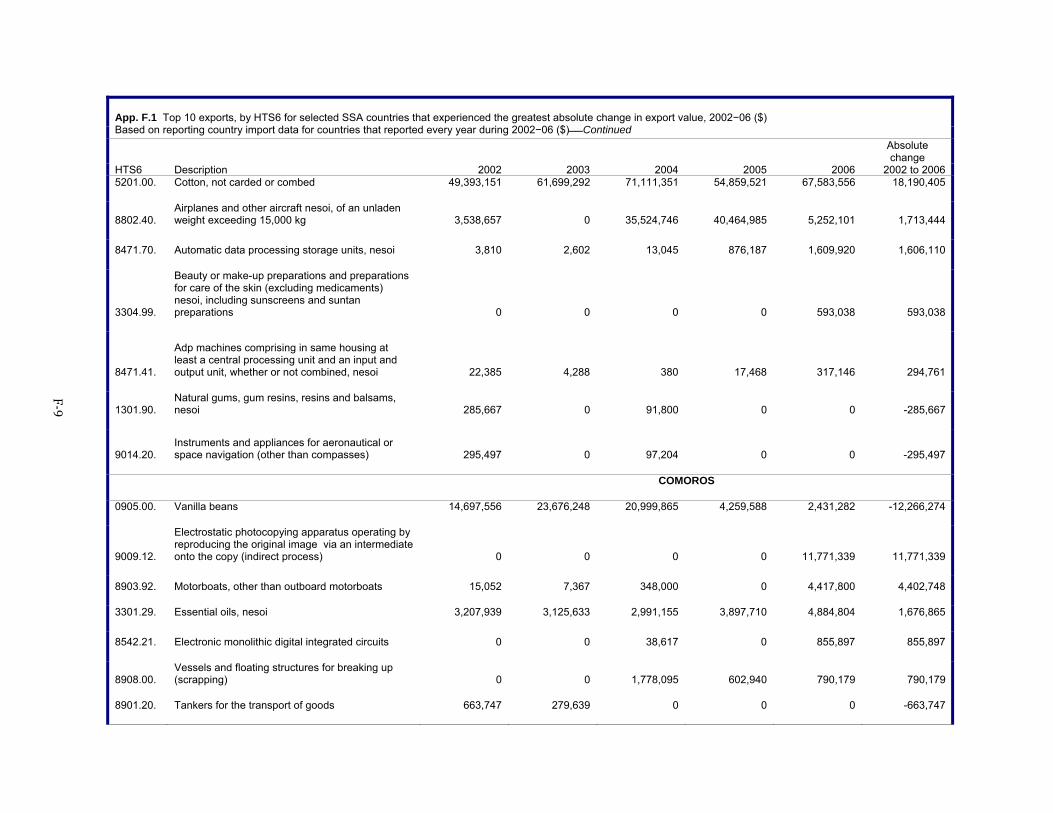
F‐9
App. F.1 Top 10 exports, by HTS6 for selected SSA countries that experienced the greatest absolute change in export value, 2002−06 ($) Based on reporting country import data for countries that reported every year during 2002−06 ($)Continued
Absolute change
HTS6 Description 2002 2003 2004 2005 2006 2002 to 20065201.00. Cotton, not carded or combed 49,393,151 61,699,292 71,111,351 54,859,521 67,583,556 18,190,405
8802.40. Airplanes and other aircraft nesoi, of an unladen weight exceeding 15,000 kg 3,538,657 0 35,524,746 40,464,985 5,252,101 1,713,444
8471.70. Automatic data processing storage units, nesoi 3,810 2,602 13,045 876,187 1,609,920 1,606,110
3304.99.
Beauty or make-up preparations and preparations for care of the skin (excluding medicaments) nesoi, including sunscreens and suntan preparations 0 0 0 0 593,038 593,038
8471.41.
Adp machines comprising in same housing at least a central processing unit and an input and output unit, whether or not combined, nesoi 22,385 4,288 380 17,468 317,146 294,761
1301.90. Natural gums, gum resins, resins and balsams, nesoi 285,667 0 91,800 0 0 -285,667
9014.20. Instruments and appliances for aeronautical or space navigation (other than compasses) 295,497 0 97,204 0 0 -295,497
COMOROS
0905.00. Vanilla beans 14,697,556 23,676,248 20,999,865 4,259,588 2,431,282 -12,266,274
9009.12.
Electrostatic photocopying apparatus operating by reproducing the original image via an intermediate onto the copy (indirect process) 0 0 0 0 11,771,339 11,771,339
8903.92. Motorboats, other than outboard motorboats 15,052 7,367 348,000 0 4,417,800 4,402,748
3301.29. Essential oils, nesoi 3,207,939 3,125,633 2,991,155 3,897,710 4,884,804 1,676,865
8542.21. Electronic monolithic digital integrated circuits 0 0 38,617 0 855,897 855,897
8908.00. Vessels and floating structures for breaking up (scrapping) 0 0 1,778,095 602,940 790,179 790,179
8901.20. Tankers for the transport of goods 663,747 279,639 0 0 0 -663,747
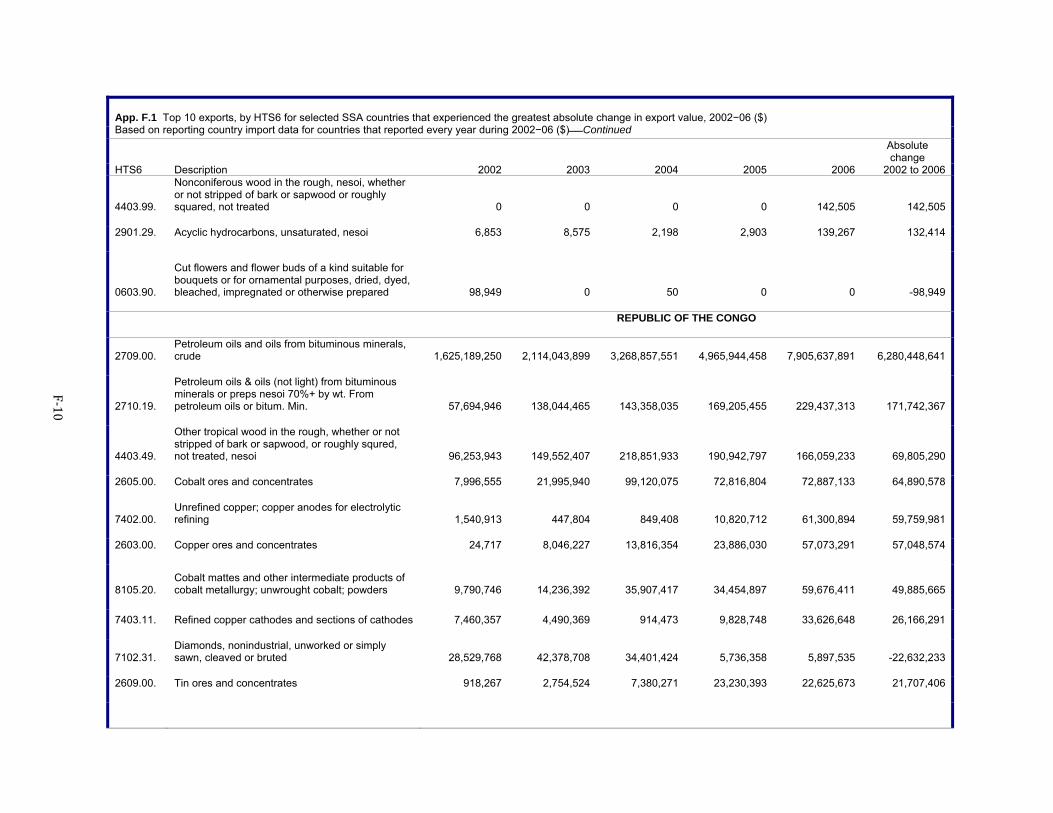
F‐10
App. F.1 Top 10 exports, by HTS6 for selected SSA countries that experienced the greatest absolute change in export value, 2002−06 ($) Based on reporting country import data for countries that reported every year during 2002−06 ($)Continued
Absolute change
HTS6 Description 2002 2003 2004 2005 2006 2002 to 2006
4403.99.
Nonconiferous wood in the rough, nesoi, whether or not stripped of bark or sapwood or roughly squared, not treated 0 0 0 0 142,505 142,505
2901.29. Acyclic hydrocarbons, unsaturated, nesoi 6,853 8,575 2,198 2,903 139,267 132,414
0603.90.
Cut flowers and flower buds of a kind suitable for bouquets or for ornamental purposes, dried, dyed, bleached, impregnated or otherwise prepared 98,949 0 50 0 0 -98,949
REPUBLIC OF THE CONGO
2709.00. Petroleum oils and oils from bituminous minerals, crude 1,625,189,250 2,114,043,899 3,268,857,551 4,965,944,458 7,905,637,891 6,280,448,641
2710.19.
Petroleum oils & oils (not light) from bituminous minerals or preps nesoi 70%+ by wt. From petroleum oils or bitum. Min. 57,694,946 138,044,465 143,358,035 169,205,455 229,437,313 171,742,367
4403.49.
Other tropical wood in the rough, whether or not stripped of bark or sapwood, or roughly squred, not treated, nesoi 96,253,943 149,552,407 218,851,933 190,942,797 166,059,233 69,805,290
2605.00. Cobalt ores and concentrates 7,996,555 21,995,940 99,120,075 72,816,804 72,887,133 64,890,578
7402.00. Unrefined copper; copper anodes for electrolytic refining 1,540,913 447,804 849,408 10,820,712 61,300,894 59,759,981
2603.00. Copper ores and concentrates 24,717 8,046,227 13,816,354 23,886,030 57,073,291 57,048,574
8105.20. Cobalt mattes and other intermediate products of cobalt metallurgy; unwrought cobalt; powders 9,790,746 14,236,392 35,907,417 34,454,897 59,676,411 49,885,665
7403.11. Refined copper cathodes and sections of cathodes 7,460,357 4,490,369 914,473 9,828,748 33,626,648 26,166,291
7102.31. Diamonds, nonindustrial, unworked or simply sawn, cleaved or bruted 28,529,768 42,378,708 34,401,424 5,736,358 5,897,535 -22,632,233
2609.00. Tin ores and concentrates 918,267 2,754,524 7,380,271 23,230,393 22,625,673 21,707,406
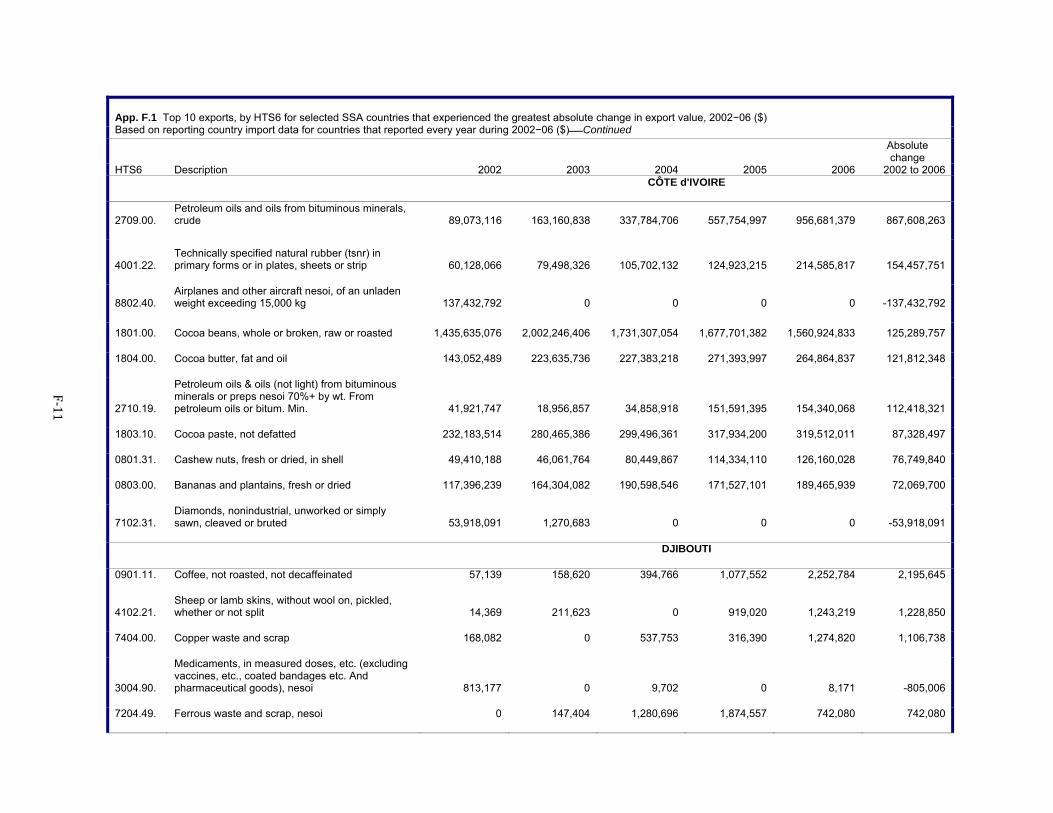
F‐11
App. F.1 Top 10 exports, by HTS6 for selected SSA countries that experienced the greatest absolute change in export value, 2002−06 ($) Based on reporting country import data for countries that reported every year during 2002−06 ($)Continued
Absolute change
HTS6 Description 2002 2003 2004 2005 2006 2002 to 2006 CÔTE d'IVOIRE
2709.00. Petroleum oils and oils from bituminous minerals, crude 89,073,116 163,160,838 337,784,706 557,754,997 956,681,379 867,608,263
4001.22. Technically specified natural rubber (tsnr) in primary forms or in plates, sheets or strip 60,128,066 79,498,326 105,702,132 124,923,215 214,585,817 154,457,751
8802.40. Airplanes and other aircraft nesoi, of an unladen weight exceeding 15,000 kg 137,432,792 0 0 0 0 -137,432,792
1801.00. Cocoa beans, whole or broken, raw or roasted 1,435,635,076 2,002,246,406 1,731,307,054 1,677,701,382 1,560,924,833 125,289,757
1804.00. Cocoa butter, fat and oil 143,052,489 223,635,736 227,383,218 271,393,997 264,864,837 121,812,348
2710.19.
Petroleum oils & oils (not light) from bituminous minerals or preps nesoi 70%+ by wt. From petroleum oils or bitum. Min. 41,921,747 18,956,857 34,858,918 151,591,395 154,340,068 112,418,321
1803.10. Cocoa paste, not defatted 232,183,514 280,465,386 299,496,361 317,934,200 319,512,011 87,328,497
0801.31. Cashew nuts, fresh or dried, in shell 49,410,188 46,061,764 80,449,867 114,334,110 126,160,028 76,749,840
0803.00. Bananas and plantains, fresh or dried 117,396,239 164,304,082 190,598,546 171,527,101 189,465,939 72,069,700
7102.31. Diamonds, nonindustrial, unworked or simply sawn, cleaved or bruted 53,918,091 1,270,683 0 0 0 -53,918,091
DJIBOUTI
0901.11. Coffee, not roasted, not decaffeinated 57,139 158,620 394,766 1,077,552 2,252,784 2,195,645
4102.21. Sheep or lamb skins, without wool on, pickled, whether or not split 14,369 211,623 0 919,020 1,243,219 1,228,850
7404.00. Copper waste and scrap 168,082 0 537,753 316,390 1,274,820 1,106,738
3004.90.
Medicaments, in measured doses, etc. (excluding vaccines, etc., coated bandages etc. And pharmaceutical goods), nesoi 813,177 0 9,702 0 8,171 -805,006
7204.49. Ferrous waste and scrap, nesoi 0 147,404 1,280,696 1,874,557 742,080 742,080
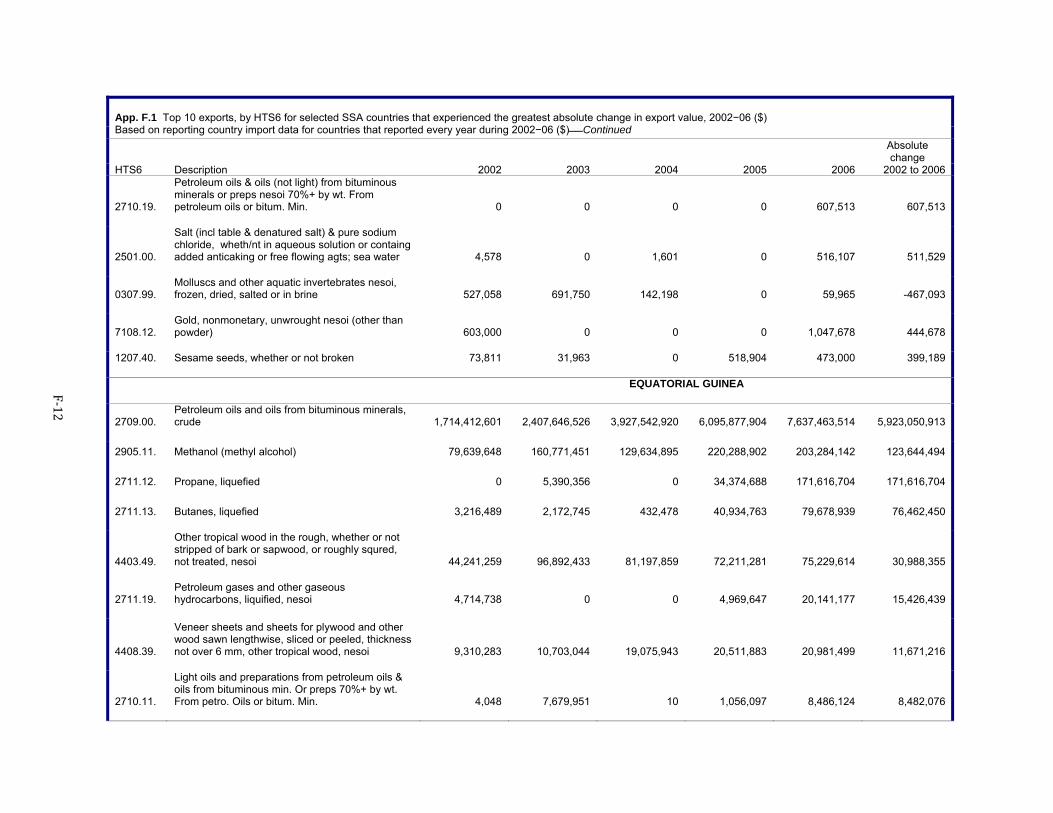
F‐12
App. F.1 Top 10 exports, by HTS6 for selected SSA countries that experienced the greatest absolute change in export value, 2002−06 ($) Based on reporting country import data for countries that reported every year during 2002−06 ($)Continued
Absolute change
HTS6 Description 2002 2003 2004 2005 2006 2002 to 2006
2710.19.
Petroleum oils & oils (not light) from bituminous minerals or preps nesoi 70%+ by wt. From petroleum oils or bitum. Min. 0 0 0 0 607,513 607,513
2501.00.
Salt (incl table & denatured salt) & pure sodium chloride, wheth/nt in aqueous solution or containg added anticaking or free flowing agts; sea water 4,578 0 1,601 0 516,107 511,529
0307.99. Molluscs and other aquatic invertebrates nesoi, frozen, dried, salted or in brine 527,058 691,750 142,198 0 59,965 -467,093
7108.12. Gold, nonmonetary, unwrought nesoi (other than powder) 603,000 0 0 0 1,047,678 444,678
1207.40. Sesame seeds, whether or not broken 73,811 31,963 0 518,904 473,000 399,189
EQUATORIAL GUINEA
2709.00. Petroleum oils and oils from bituminous minerals, crude 1,714,412,601 2,407,646,526 3,927,542,920 6,095,877,904 7,637,463,514 5,923,050,913
2905.11. Methanol (methyl alcohol) 79,639,648 160,771,451 129,634,895 220,288,902 203,284,142 123,644,494
2711.12. Propane, liquefied 0 5,390,356 0 34,374,688 171,616,704 171,616,704
2711.13. Butanes, liquefied 3,216,489 2,172,745 432,478 40,934,763 79,678,939 76,462,450
4403.49.
Other tropical wood in the rough, whether or not stripped of bark or sapwood, or roughly squred, not treated, nesoi 44,241,259 96,892,433 81,197,859 72,211,281 75,229,614 30,988,355
2711.19. Petroleum gases and other gaseous hydrocarbons, liquified, nesoi 4,714,738 0 0 4,969,647 20,141,177 15,426,439
4408.39.
Veneer sheets and sheets for plywood and other wood sawn lengthwise, sliced or peeled, thickness not over 6 mm, other tropical wood, nesoi 9,310,283 10,703,044 19,075,943 20,511,883 20,981,499 11,671,216
2710.11.
Light oils and preparations from petroleum oils & oils from bituminous min. Or preps 70%+ by wt. From petro. Oils or bitum. Min. 4,048 7,679,951 10 1,056,097 8,486,124 8,482,076
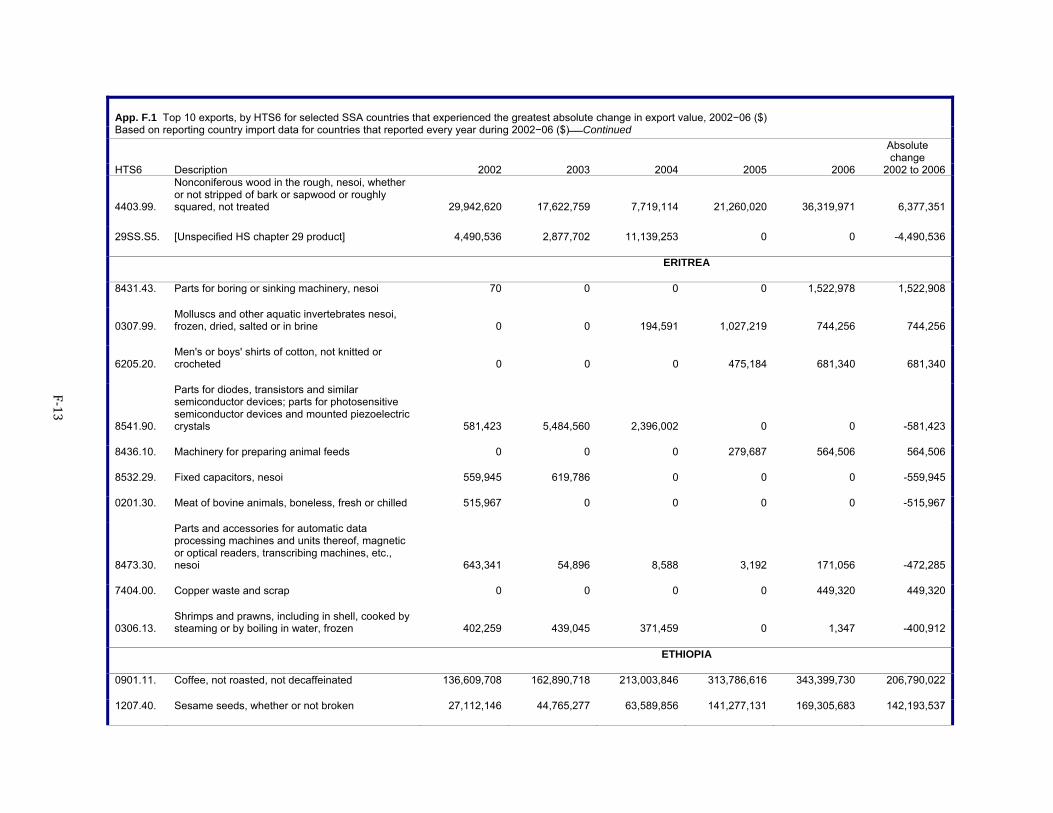
F‐13
App. F.1 Top 10 exports, by HTS6 for selected SSA countries that experienced the greatest absolute change in export value, 2002−06 ($) Based on reporting country import data for countries that reported every year during 2002−06 ($)Continued
Absolute change
HTS6 Description 2002 2003 2004 2005 2006 2002 to 2006
4403.99.
Nonconiferous wood in the rough, nesoi, whether or not stripped of bark or sapwood or roughly squared, not treated 29,942,620 17,622,759 7,719,114 21,260,020 36,319,971 6,377,351
29SS.S5. [Unspecified HS chapter 29 product] 4,490,536 2,877,702 11,139,253 0 0 -4,490,536
ERITREA
8431.43. Parts for boring or sinking machinery, nesoi 70 0 0 0 1,522,978 1,522,908
0307.99. Molluscs and other aquatic invertebrates nesoi, frozen, dried, salted or in brine 0 0 194,591 1,027,219 744,256 744,256
6205.20. Men's or boys' shirts of cotton, not knitted or crocheted 0 0 0 475,184 681,340 681,340
8541.90.
Parts for diodes, transistors and similar semiconductor devices; parts for photosensitive semiconductor devices and mounted piezoelectric crystals 581,423 5,484,560 2,396,002 0 0 -581,423
8436.10. Machinery for preparing animal feeds 0 0 0 279,687 564,506 564,506
8532.29. Fixed capacitors, nesoi 559,945 619,786 0 0 0 -559,945
0201.30. Meat of bovine animals, boneless, fresh or chilled 515,967 0 0 0 0 -515,967
8473.30.
Parts and accessories for automatic data processing machines and units thereof, magnetic or optical readers, transcribing machines, etc., nesoi 643,341 54,896 8,588 3,192 171,056 -472,285
7404.00. Copper waste and scrap 0 0 0 0 449,320 449,320
0306.13. Shrimps and prawns, including in shell, cooked by steaming or by boiling in water, frozen 402,259 439,045 371,459 0 1,347 -400,912
ETHIOPIA
0901.11. Coffee, not roasted, not decaffeinated 136,609,708 162,890,718 213,003,846 313,786,616 343,399,730 206,790,022
1207.40. Sesame seeds, whether or not broken 27,112,146 44,765,277 63,589,856 141,277,131 169,305,683 142,193,537
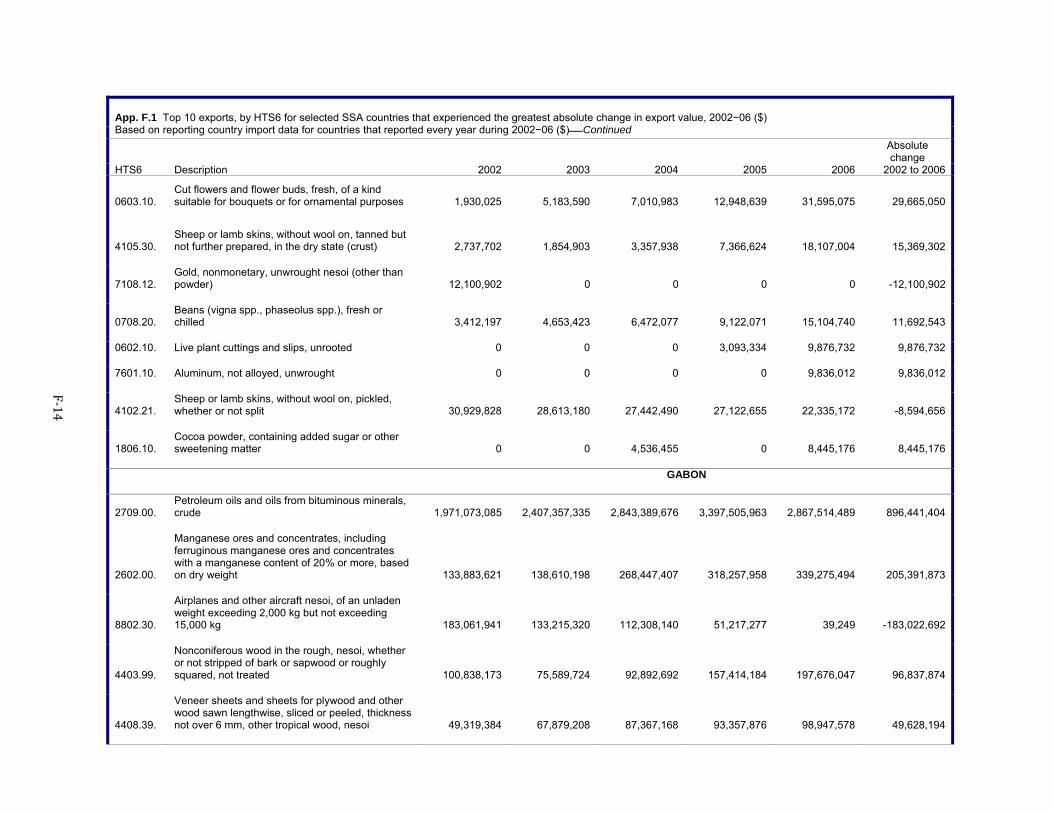
F‐14
App. F.1 Top 10 exports, by HTS6 for selected SSA countries that experienced the greatest absolute change in export value, 2002−06 ($) Based on reporting country import data for countries that reported every year during 2002−06 ($)Continued
Absolute change
HTS6 Description 2002 2003 2004 2005 2006 2002 to 2006
0603.10. Cut flowers and flower buds, fresh, of a kind suitable for bouquets or for ornamental purposes 1,930,025 5,183,590 7,010,983 12,948,639 31,595,075 29,665,050
4105.30. Sheep or lamb skins, without wool on, tanned but not further prepared, in the dry state (crust) 2,737,702 1,854,903 3,357,938 7,366,624 18,107,004 15,369,302
7108.12. Gold, nonmonetary, unwrought nesoi (other than powder) 12,100,902 0 0 0 0 -12,100,902
0708.20. Beans (vigna spp., phaseolus spp.), fresh or chilled 3,412,197 4,653,423 6,472,077 9,122,071 15,104,740 11,692,543
0602.10. Live plant cuttings and slips, unrooted 0 0 0 3,093,334 9,876,732 9,876,732
7601.10. Aluminum, not alloyed, unwrought 0 0 0 0 9,836,012 9,836,012
4102.21. Sheep or lamb skins, without wool on, pickled, whether or not split 30,929,828 28,613,180 27,442,490 27,122,655 22,335,172 -8,594,656
1806.10. Cocoa powder, containing added sugar or other sweetening matter 0 0 4,536,455 0 8,445,176 8,445,176
GABON
2709.00. Petroleum oils and oils from bituminous minerals, crude 1,971,073,085 2,407,357,335 2,843,389,676 3,397,505,963 2,867,514,489 896,441,404
2602.00.
Manganese ores and concentrates, including ferruginous manganese ores and concentrates with a manganese content of 20% or more, based on dry weight 133,883,621 138,610,198 268,447,407 318,257,958 339,275,494 205,391,873
8802.30.
Airplanes and other aircraft nesoi, of an unladen weight exceeding 2,000 kg but not exceeding 15,000 kg 183,061,941 133,215,320 112,308,140 51,217,277 39,249 -183,022,692
4403.99.
Nonconiferous wood in the rough, nesoi, whether or not stripped of bark or sapwood or roughly squared, not treated 100,838,173 75,589,724 92,892,692 157,414,184 197,676,047 96,837,874
4408.39.
Veneer sheets and sheets for plywood and other wood sawn lengthwise, sliced or peeled, thickness not over 6 mm, other tropical wood, nesoi 49,319,384 67,879,208 87,367,168 93,357,876 98,947,578 49,628,194
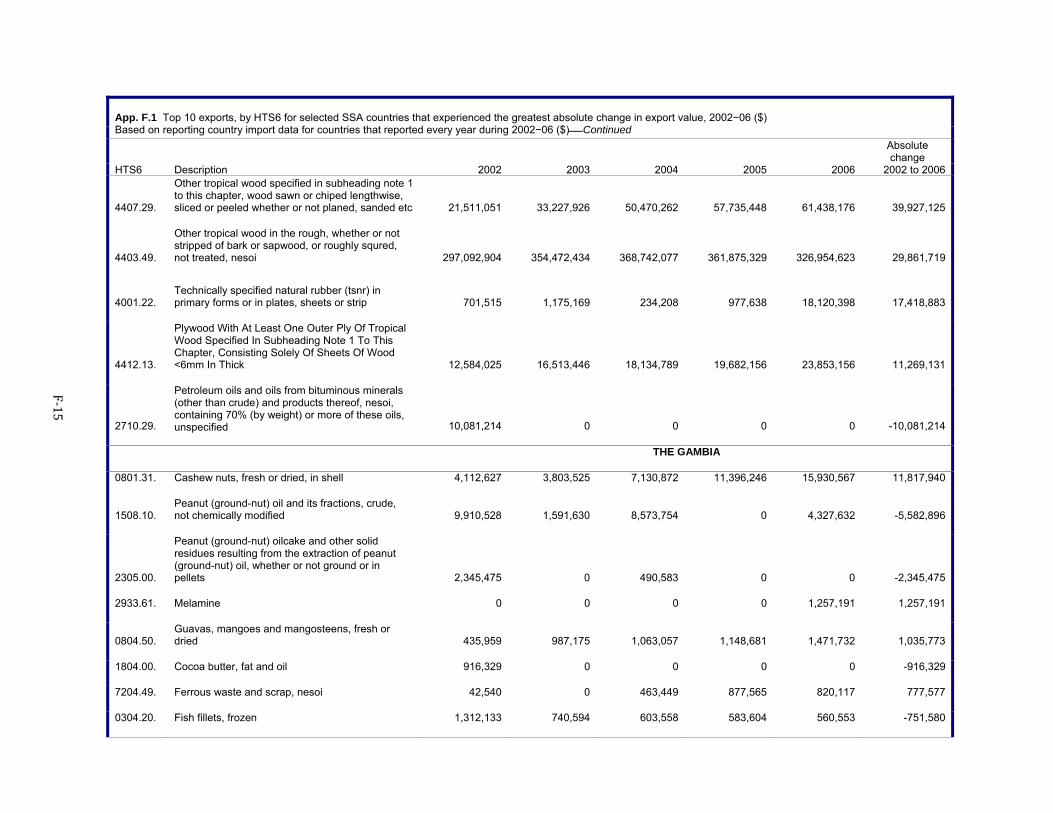
F‐15
App. F.1 Top 10 exports, by HTS6 for selected SSA countries that experienced the greatest absolute change in export value, 2002−06 ($) Based on reporting country import data for countries that reported every year during 2002−06 ($)Continued
Absolute change
HTS6 Description 2002 2003 2004 2005 2006 2002 to 2006
4407.29.
Other tropical wood specified in subheading note 1 to this chapter, wood sawn or chiped lengthwise, sliced or peeled whether or not planed, sanded etc 21,511,051 33,227,926 50,470,262 57,735,448 61,438,176 39,927,125
4403.49.
Other tropical wood in the rough, whether or not stripped of bark or sapwood, or roughly squred, not treated, nesoi 297,092,904 354,472,434 368,742,077 361,875,329 326,954,623 29,861,719
4001.22. Technically specified natural rubber (tsnr) in primary forms or in plates, sheets or strip 701,515 1,175,169 234,208 977,638 18,120,398 17,418,883
4412.13.
Plywood With At Least One Outer Ply Of Tropical Wood Specified In Subheading Note 1 To This Chapter, Consisting Solely Of Sheets Of Wood <6mm In Thick 12,584,025 16,513,446 18,134,789 19,682,156 23,853,156 11,269,131
2710.29.
Petroleum oils and oils from bituminous minerals (other than crude) and products thereof, nesoi, containing 70% (by weight) or more of these oils, unspecified
10,081,214 0 0 0 0 -10,081,214
THE GAMBIA
0801.31. Cashew nuts, fresh or dried, in shell 4,112,627 3,803,525 7,130,872 11,396,246 15,930,567 11,817,940
1508.10. Peanut (ground-nut) oil and its fractions, crude, not chemically modified 9,910,528 1,591,630 8,573,754 0 4,327,632 -5,582,896
2305.00.
Peanut (ground-nut) oilcake and other solid residues resulting from the extraction of peanut (ground-nut) oil, whether or not ground or in pellets 2,345,475 0 490,583 0 0 -2,345,475
2933.61. Melamine 0 0 0 0 1,257,191 1,257,191
0804.50. Guavas, mangoes and mangosteens, fresh or dried 435,959 987,175 1,063,057 1,148,681 1,471,732 1,035,773
1804.00. Cocoa butter, fat and oil 916,329 0 0 0 0 -916,329
7204.49. Ferrous waste and scrap, nesoi 42,540 0 463,449 877,565 820,117 777,577
0304.20. Fish fillets, frozen 1,312,133 740,594 603,558 583,604 560,553 -751,580
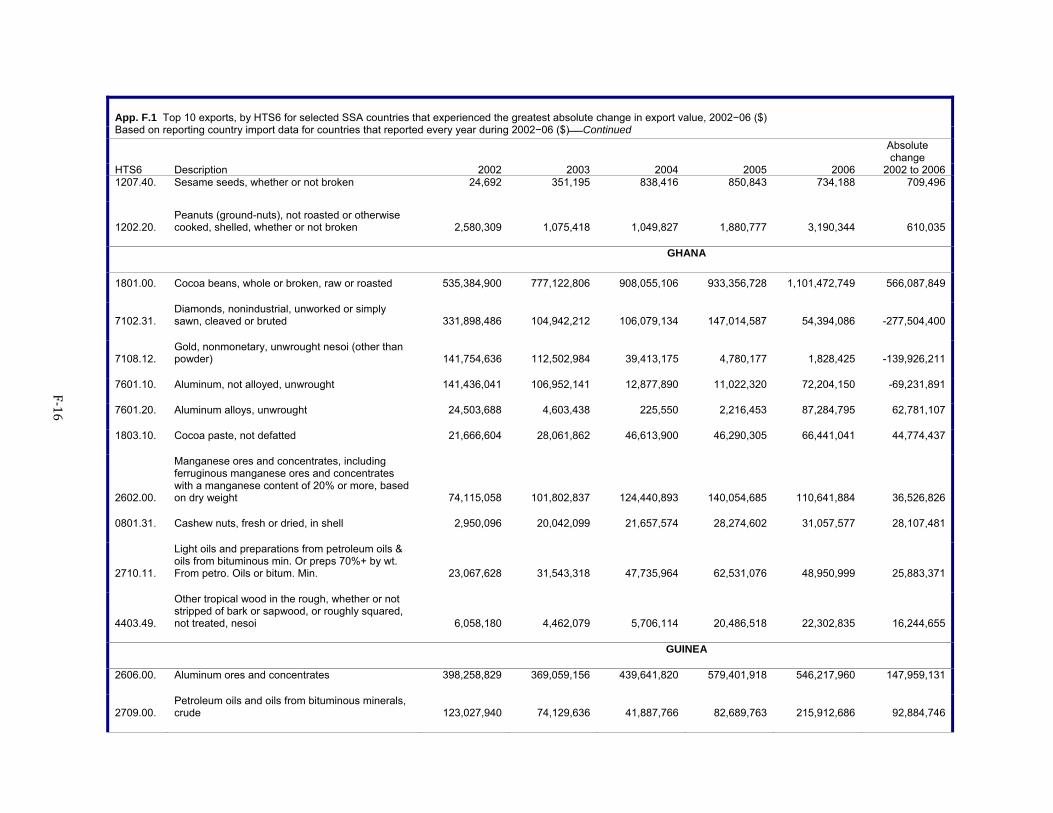
F‐16
App. F.1 Top 10 exports, by HTS6 for selected SSA countries that experienced the greatest absolute change in export value, 2002−06 ($) Based on reporting country import data for countries that reported every year during 2002−06 ($)Continued
Absolute change
HTS6 Description 2002 2003 2004 2005 2006 2002 to 20061207.40. Sesame seeds, whether or not broken 24,692 351,195 838,416 850,843 734,188 709,496
1202.20. Peanuts (ground-nuts), not roasted or otherwise cooked, shelled, whether or not broken 2,580,309 1,075,418 1,049,827 1,880,777 3,190,344 610,035
GHANA
1801.00. Cocoa beans, whole or broken, raw or roasted 535,384,900 777,122,806 908,055,106 933,356,728 1,101,472,749 566,087,849
7102.31. Diamonds, nonindustrial, unworked or simply sawn, cleaved or bruted 331,898,486 104,942,212 106,079,134 147,014,587 54,394,086 -277,504,400
7108.12. Gold, nonmonetary, unwrought nesoi (other than powder) 141,754,636 112,502,984 39,413,175 4,780,177 1,828,425 -139,926,211
7601.10. Aluminum, not alloyed, unwrought 141,436,041 106,952,141 12,877,890 11,022,320 72,204,150 -69,231,891
7601.20. Aluminum alloys, unwrought 24,503,688 4,603,438 225,550 2,216,453 87,284,795 62,781,107
1803.10. Cocoa paste, not defatted 21,666,604 28,061,862 46,613,900 46,290,305 66,441,041 44,774,437
2602.00.
Manganese ores and concentrates, including ferruginous manganese ores and concentrates with a manganese content of 20% or more, based on dry weight 74,115,058 101,802,837 124,440,893 140,054,685 110,641,884 36,526,826
0801.31. Cashew nuts, fresh or dried, in shell 2,950,096 20,042,099 21,657,574 28,274,602 31,057,577 28,107,481
2710.11.
Light oils and preparations from petroleum oils & oils from bituminous min. Or preps 70%+ by wt. From petro. Oils or bitum. Min. 23,067,628 31,543,318 47,735,964 62,531,076 48,950,999 25,883,371
4403.49.
Other tropical wood in the rough, whether or not stripped of bark or sapwood, or roughly squared, not treated, nesoi 6,058,180 4,462,079 5,706,114 20,486,518 22,302,835 16,244,655
GUINEA
2606.00. Aluminum ores and concentrates 398,258,829 369,059,156 439,641,820 579,401,918 546,217,960 147,959,131
2709.00. Petroleum oils and oils from bituminous minerals, crude 123,027,940 74,129,636 41,887,766 82,689,763 215,912,686 92,884,746
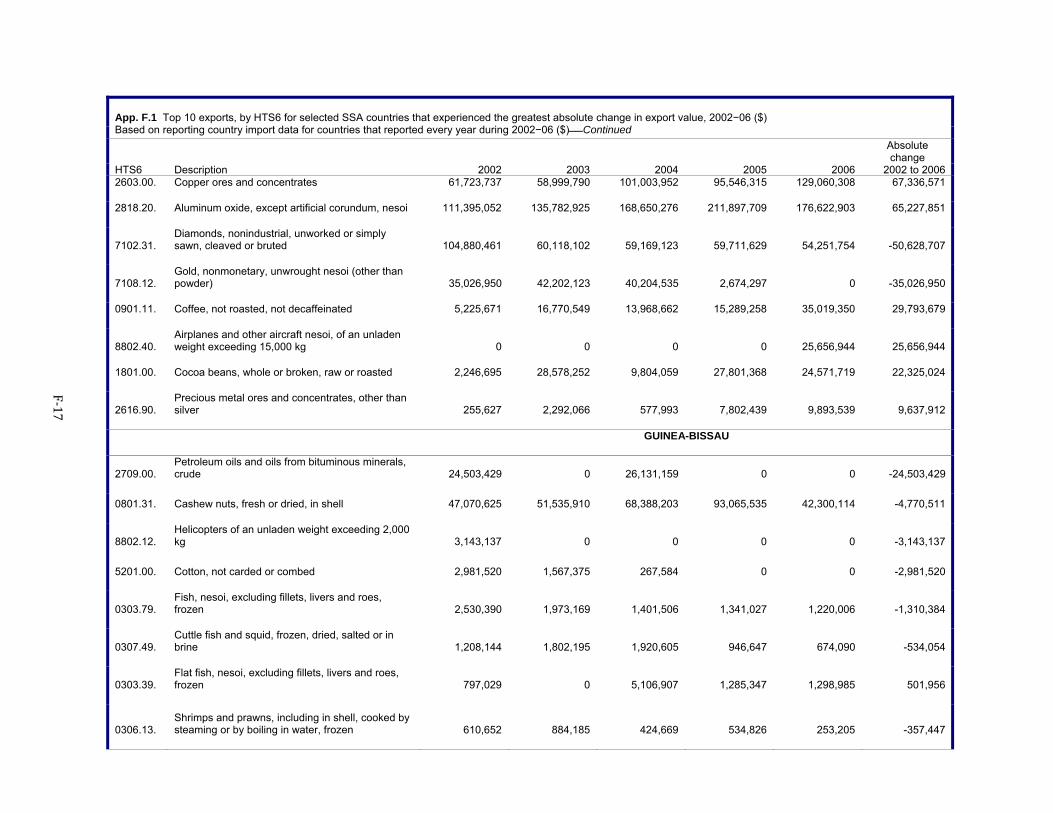
F‐17
App. F.1 Top 10 exports, by HTS6 for selected SSA countries that experienced the greatest absolute change in export value, 2002−06 ($) Based on reporting country import data for countries that reported every year during 2002−06 ($)Continued
Absolute change
HTS6 Description 2002 2003 2004 2005 2006 2002 to 20062603.00. Copper ores and concentrates 61,723,737 58,999,790 101,003,952 95,546,315 129,060,308 67,336,571
2818.20. Aluminum oxide, except artificial corundum, nesoi 111,395,052 135,782,925 168,650,276 211,897,709 176,622,903 65,227,851
7102.31. Diamonds, nonindustrial, unworked or simply sawn, cleaved or bruted 104,880,461 60,118,102 59,169,123 59,711,629 54,251,754 -50,628,707
7108.12. Gold, nonmonetary, unwrought nesoi (other than powder) 35,026,950 42,202,123 40,204,535 2,674,297 0 -35,026,950
0901.11. Coffee, not roasted, not decaffeinated 5,225,671 16,770,549 13,968,662 15,289,258 35,019,350 29,793,679
8802.40. Airplanes and other aircraft nesoi, of an unladen weight exceeding 15,000 kg 0 0 0 0 25,656,944 25,656,944
1801.00. Cocoa beans, whole or broken, raw or roasted 2,246,695 28,578,252 9,804,059 27,801,368 24,571,719 22,325,024
2616.90. Precious metal ores and concentrates, other than silver 255,627 2,292,066 577,993 7,802,439 9,893,539 9,637,912
GUINEA-BISSAU
2709.00. Petroleum oils and oils from bituminous minerals, crude 24,503,429 0 26,131,159 0 0 -24,503,429
0801.31. Cashew nuts, fresh or dried, in shell 47,070,625 51,535,910 68,388,203 93,065,535 42,300,114 -4,770,511
8802.12. Helicopters of an unladen weight exceeding 2,000 kg 3,143,137 0 0 0 0 -3,143,137
5201.00. Cotton, not carded or combed 2,981,520 1,567,375 267,584 0 0 -2,981,520
0303.79. Fish, nesoi, excluding fillets, livers and roes, frozen 2,530,390 1,973,169 1,401,506 1,341,027 1,220,006 -1,310,384
0307.49. Cuttle fish and squid, frozen, dried, salted or in brine 1,208,144 1,802,195 1,920,605 946,647 674,090 -534,054
0303.39. Flat fish, nesoi, excluding fillets, livers and roes, frozen 797,029 0 5,106,907 1,285,347 1,298,985 501,956
0306.13. Shrimps and prawns, including in shell, cooked by steaming or by boiling in water, frozen 610,652 884,185 424,669 534,826 253,205 -357,447
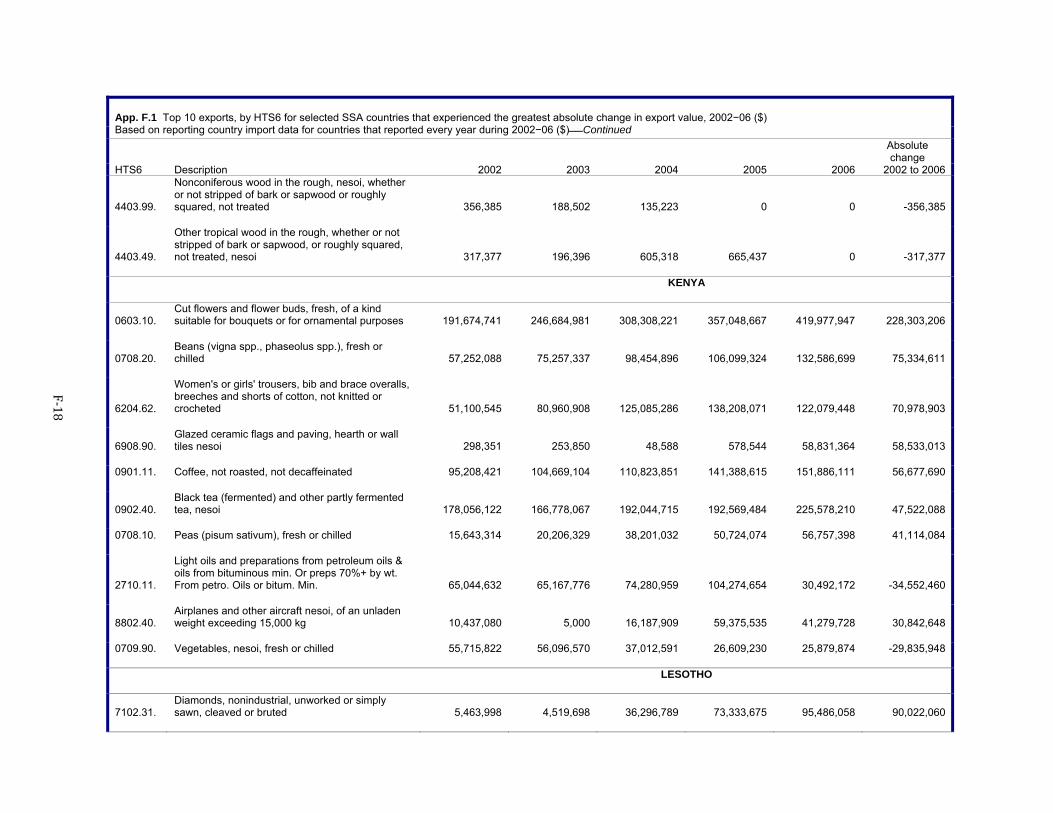
F‐18
App. F.1 Top 10 exports, by HTS6 for selected SSA countries that experienced the greatest absolute change in export value, 2002−06 ($) Based on reporting country import data for countries that reported every year during 2002−06 ($)Continued
Absolute change
HTS6 Description 2002 2003 2004 2005 2006 2002 to 2006
4403.99.
Nonconiferous wood in the rough, nesoi, whether or not stripped of bark or sapwood or roughly squared, not treated 356,385 188,502 135,223 0 0 -356,385
4403.49.
Other tropical wood in the rough, whether or not stripped of bark or sapwood, or roughly squared, not treated, nesoi 317,377 196,396 605,318 665,437 0 -317,377
KENYA
0603.10. Cut flowers and flower buds, fresh, of a kind suitable for bouquets or for ornamental purposes 191,674,741 246,684,981 308,308,221 357,048,667 419,977,947 228,303,206
0708.20. Beans (vigna spp., phaseolus spp.), fresh or chilled 57,252,088 75,257,337 98,454,896 106,099,324 132,586,699 75,334,611
6204.62.
Women's or girls' trousers, bib and brace overalls, breeches and shorts of cotton, not knitted or crocheted 51,100,545 80,960,908 125,085,286 138,208,071 122,079,448 70,978,903
6908.90. Glazed ceramic flags and paving, hearth or wall tiles nesoi 298,351 253,850 48,588 578,544 58,831,364 58,533,013
0901.11. Coffee, not roasted, not decaffeinated 95,208,421 104,669,104 110,823,851 141,388,615 151,886,111 56,677,690
0902.40. Black tea (fermented) and other partly fermented tea, nesoi 178,056,122 166,778,067 192,044,715 192,569,484 225,578,210 47,522,088
0708.10. Peas (pisum sativum), fresh or chilled 15,643,314 20,206,329 38,201,032 50,724,074 56,757,398 41,114,084
2710.11.
Light oils and preparations from petroleum oils & oils from bituminous min. Or preps 70%+ by wt. From petro. Oils or bitum. Min. 65,044,632 65,167,776 74,280,959 104,274,654 30,492,172 -34,552,460
8802.40. Airplanes and other aircraft nesoi, of an unladen weight exceeding 15,000 kg 10,437,080 5,000 16,187,909 59,375,535 41,279,728 30,842,648
0709.90. Vegetables, nesoi, fresh or chilled 55,715,822 56,096,570 37,012,591 26,609,230 25,879,874 -29,835,948
LESOTHO
7102.31. Diamonds, nonindustrial, unworked or simply sawn, cleaved or bruted 5,463,998 4,519,698 36,296,789 73,333,675 95,486,058 90,022,060
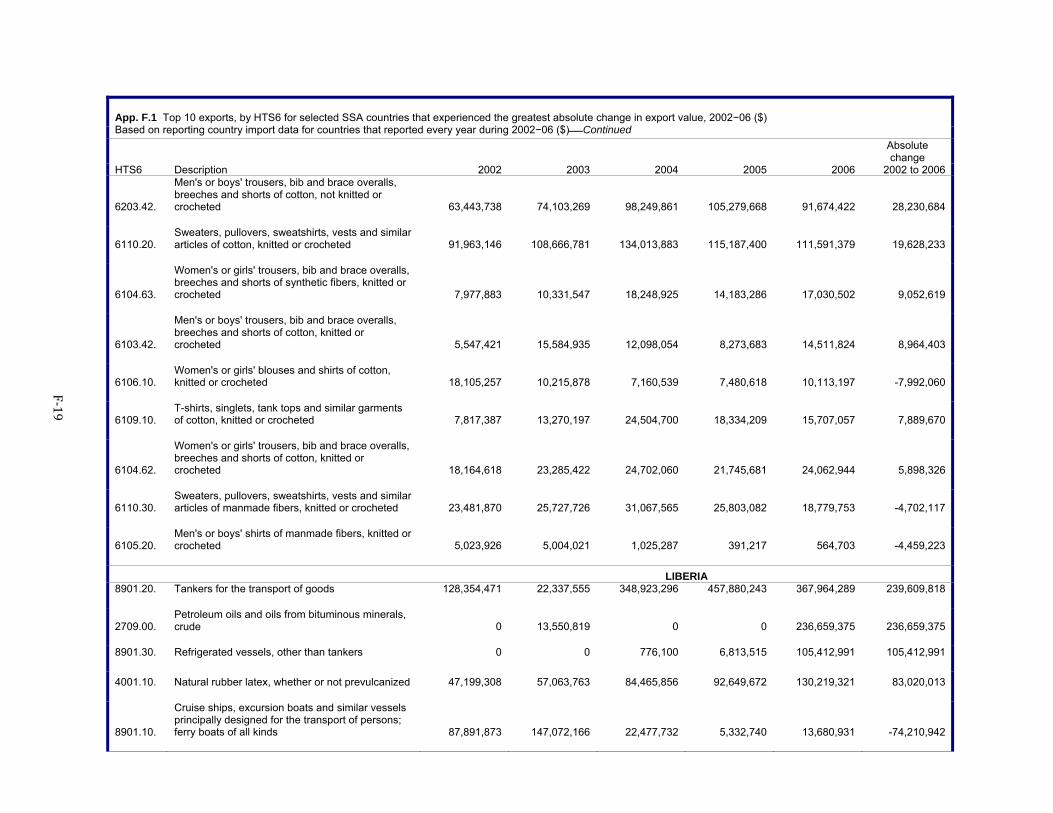
F‐19
App. F.1 Top 10 exports, by HTS6 for selected SSA countries that experienced the greatest absolute change in export value, 2002−06 ($) Based on reporting country import data for countries that reported every year during 2002−06 ($)Continued
Absolute change
HTS6 Description 2002 2003 2004 2005 2006 2002 to 2006
6203.42.
Men's or boys' trousers, bib and brace overalls, breeches and shorts of cotton, not knitted or crocheted 63,443,738 74,103,269 98,249,861 105,279,668 91,674,422 28,230,684
6110.20. Sweaters, pullovers, sweatshirts, vests and similar articles of cotton, knitted or crocheted 91,963,146 108,666,781 134,013,883 115,187,400 111,591,379 19,628,233
6104.63.
Women's or girls' trousers, bib and brace overalls, breeches and shorts of synthetic fibers, knitted or crocheted 7,977,883 10,331,547 18,248,925 14,183,286 17,030,502 9,052,619
6103.42.
Men's or boys' trousers, bib and brace overalls, breeches and shorts of cotton, knitted or crocheted 5,547,421 15,584,935 12,098,054 8,273,683 14,511,824 8,964,403
6106.10. Women's or girls' blouses and shirts of cotton, knitted or crocheted 18,105,257 10,215,878 7,160,539 7,480,618 10,113,197 -7,992,060
6109.10. T-shirts, singlets, tank tops and similar garments of cotton, knitted or crocheted 7,817,387 13,270,197 24,504,700 18,334,209 15,707,057 7,889,670
6104.62.
Women's or girls' trousers, bib and brace overalls, breeches and shorts of cotton, knitted or crocheted 18,164,618 23,285,422 24,702,060 21,745,681 24,062,944 5,898,326
6110.30. Sweaters, pullovers, sweatshirts, vests and similar articles of manmade fibers, knitted or crocheted 23,481,870 25,727,726 31,067,565 25,803,082 18,779,753 -4,702,117
6105.20. Men's or boys' shirts of manmade fibers, knitted or crocheted 5,023,926 5,004,021 1,025,287 391,217 564,703 -4,459,223
LIBERIA 8901.20. Tankers for the transport of goods 128,354,471 22,337,555 348,923,296 457,880,243 367,964,289 239,609,818
2709.00. Petroleum oils and oils from bituminous minerals, crude 0 13,550,819 0 0 236,659,375 236,659,375
8901.30. Refrigerated vessels, other than tankers 0 0 776,100 6,813,515 105,412,991 105,412,991
4001.10. Natural rubber latex, whether or not prevulcanized 47,199,308 57,063,763 84,465,856 92,649,672 130,219,321 83,020,013
8901.10.
Cruise ships, excursion boats and similar vessels principally designed for the transport of persons; ferry boats of all kinds 87,891,873 147,072,166 22,477,732 5,332,740 13,680,931 -74,210,942
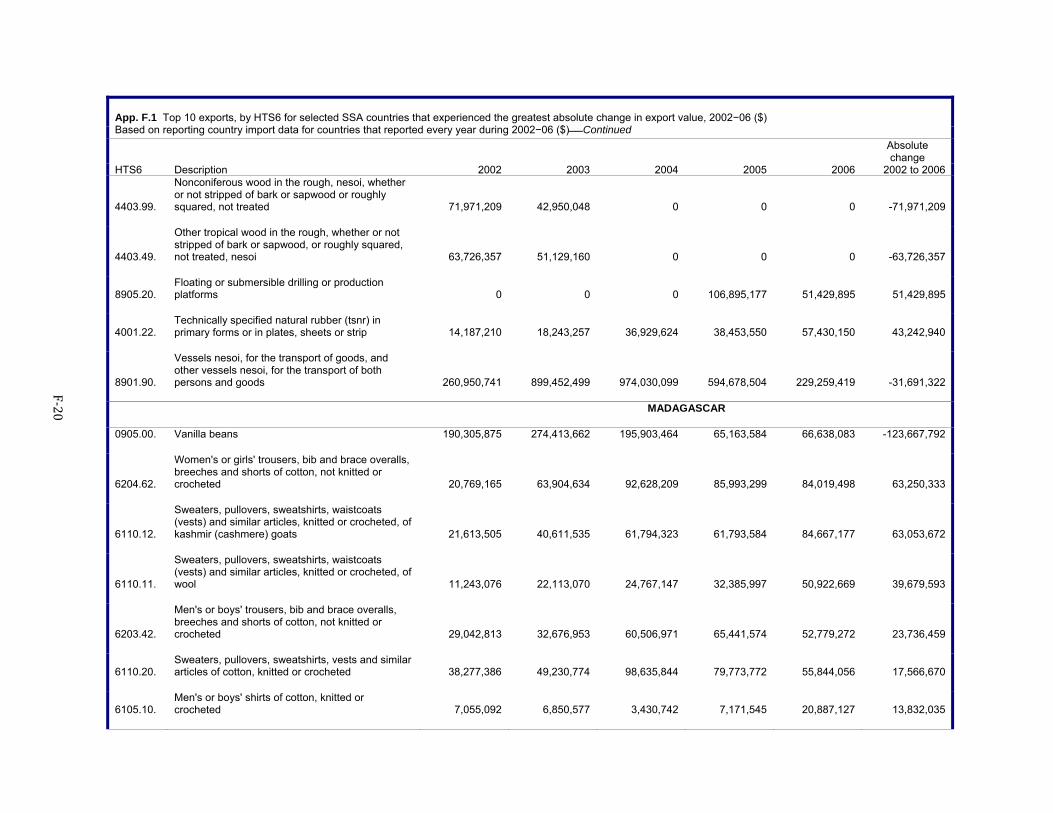
F‐20
App. F.1 Top 10 exports, by HTS6 for selected SSA countries that experienced the greatest absolute change in export value, 2002−06 ($) Based on reporting country import data for countries that reported every year during 2002−06 ($)Continued
Absolute change
HTS6 Description 2002 2003 2004 2005 2006 2002 to 2006
4403.99.
Nonconiferous wood in the rough, nesoi, whether or not stripped of bark or sapwood or roughly squared, not treated 71,971,209 42,950,048 0 0 0 -71,971,209
4403.49.
Other tropical wood in the rough, whether or not stripped of bark or sapwood, or roughly squared, not treated, nesoi 63,726,357 51,129,160 0 0 0 -63,726,357
8905.20. Floating or submersible drilling or production platforms 0 0 0 106,895,177 51,429,895 51,429,895
4001.22. Technically specified natural rubber (tsnr) in primary forms or in plates, sheets or strip 14,187,210 18,243,257 36,929,624 38,453,550 57,430,150 43,242,940
8901.90.
Vessels nesoi, for the transport of goods, and other vessels nesoi, for the transport of both persons and goods 260,950,741 899,452,499 974,030,099 594,678,504 229,259,419 -31,691,322
MADAGASCAR
0905.00. Vanilla beans 190,305,875 274,413,662 195,903,464 65,163,584 66,638,083 -123,667,792
6204.62.
Women's or girls' trousers, bib and brace overalls, breeches and shorts of cotton, not knitted or crocheted 20,769,165 63,904,634 92,628,209 85,993,299 84,019,498 63,250,333
6110.12.
Sweaters, pullovers, sweatshirts, waistcoats (vests) and similar articles, knitted or crocheted, of kashmir (cashmere) goats 21,613,505 40,611,535 61,794,323 61,793,584 84,667,177 63,053,672
6110.11.
Sweaters, pullovers, sweatshirts, waistcoats (vests) and similar articles, knitted or crocheted, of wool 11,243,076 22,113,070 24,767,147 32,385,997 50,922,669 39,679,593
6203.42.
Men's or boys' trousers, bib and brace overalls, breeches and shorts of cotton, not knitted or crocheted 29,042,813 32,676,953 60,506,971 65,441,574 52,779,272 23,736,459
6110.20. Sweaters, pullovers, sweatshirts, vests and similar articles of cotton, knitted or crocheted 38,277,386 49,230,774 98,635,844 79,773,772 55,844,056 17,566,670
6105.10. Men's or boys' shirts of cotton, knitted or crocheted 7,055,092 6,850,577 3,430,742 7,171,545 20,887,127 13,832,035
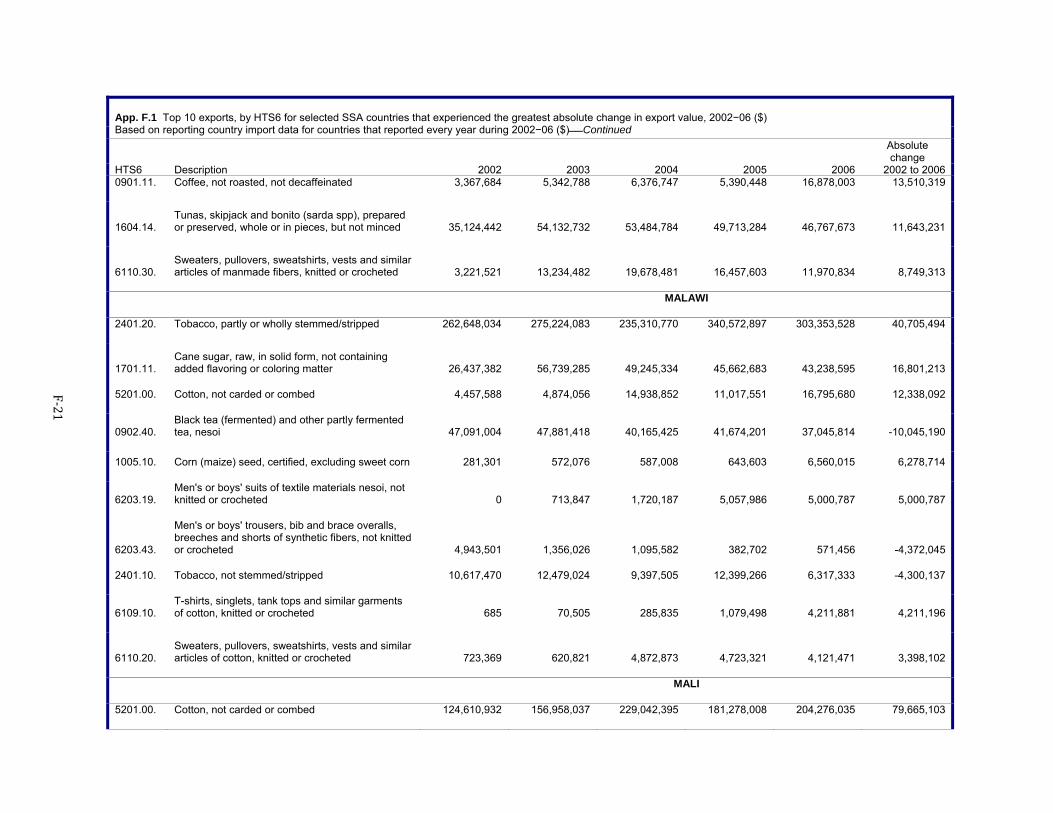
F‐21
App. F.1 Top 10 exports, by HTS6 for selected SSA countries that experienced the greatest absolute change in export value, 2002−06 ($) Based on reporting country import data for countries that reported every year during 2002−06 ($)Continued
Absolute change
HTS6 Description 2002 2003 2004 2005 2006 2002 to 20060901.11. Coffee, not roasted, not decaffeinated 3,367,684 5,342,788 6,376,747 5,390,448 16,878,003 13,510,319
1604.14. Tunas, skipjack and bonito (sarda spp), prepared or preserved, whole or in pieces, but not minced 35,124,442 54,132,732 53,484,784 49,713,284 46,767,673 11,643,231
6110.30. Sweaters, pullovers, sweatshirts, vests and similar articles of manmade fibers, knitted or crocheted 3,221,521 13,234,482 19,678,481 16,457,603 11,970,834 8,749,313
MALAWI
2401.20. Tobacco, partly or wholly stemmed/stripped 262,648,034 275,224,083 235,310,770 340,572,897 303,353,528 40,705,494
1701.11. Cane sugar, raw, in solid form, not containing added flavoring or coloring matter 26,437,382 56,739,285 49,245,334 45,662,683 43,238,595 16,801,213
5201.00. Cotton, not carded or combed 4,457,588 4,874,056 14,938,852 11,017,551 16,795,680 12,338,092
0902.40. Black tea (fermented) and other partly fermented tea, nesoi 47,091,004 47,881,418 40,165,425 41,674,201 37,045,814 -10,045,190
1005.10. Corn (maize) seed, certified, excluding sweet corn 281,301 572,076 587,008 643,603 6,560,015 6,278,714
6203.19. Men's or boys' suits of textile materials nesoi, not knitted or crocheted 0 713,847 1,720,187 5,057,986 5,000,787 5,000,787
6203.43.
Men's or boys' trousers, bib and brace overalls, breeches and shorts of synthetic fibers, not knitted or crocheted 4,943,501 1,356,026 1,095,582 382,702 571,456 -4,372,045
2401.10. Tobacco, not stemmed/stripped 10,617,470 12,479,024 9,397,505 12,399,266 6,317,333 -4,300,137
6109.10. T-shirts, singlets, tank tops and similar garments of cotton, knitted or crocheted 685 70,505 285,835 1,079,498 4,211,881 4,211,196
6110.20. Sweaters, pullovers, sweatshirts, vests and similar articles of cotton, knitted or crocheted 723,369 620,821 4,872,873 4,723,321 4,121,471 3,398,102
MALI
5201.00. Cotton, not carded or combed 124,610,932 156,958,037 229,042,395 181,278,008 204,276,035 79,665,103
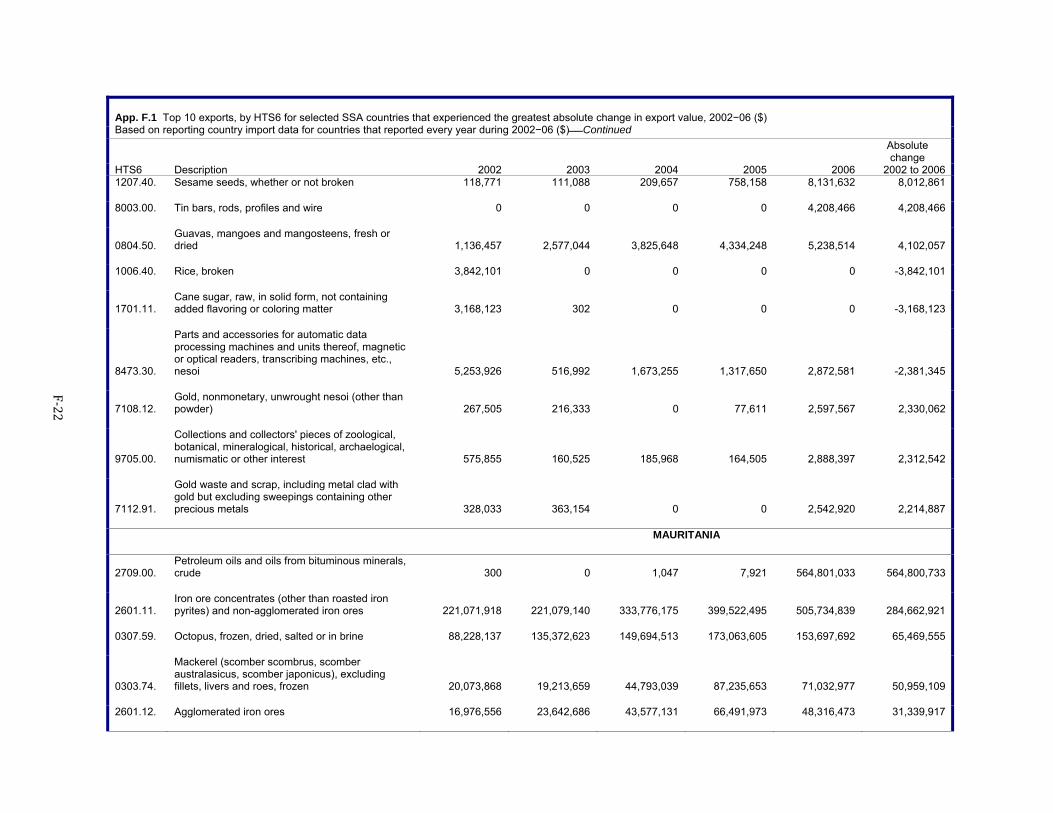
F‐22
App. F.1 Top 10 exports, by HTS6 for selected SSA countries that experienced the greatest absolute change in export value, 2002−06 ($) Based on reporting country import data for countries that reported every year during 2002−06 ($)Continued
Absolute change
HTS6 Description 2002 2003 2004 2005 2006 2002 to 20061207.40. Sesame seeds, whether or not broken 118,771 111,088 209,657 758,158 8,131,632 8,012,861
8003.00. Tin bars, rods, profiles and wire 0 0 0 0 4,208,466 4,208,466
0804.50. Guavas, mangoes and mangosteens, fresh or dried 1,136,457 2,577,044 3,825,648 4,334,248 5,238,514 4,102,057
1006.40. Rice, broken 3,842,101 0 0 0 0 -3,842,101
1701.11. Cane sugar, raw, in solid form, not containing added flavoring or coloring matter 3,168,123 302 0 0 0 -3,168,123
8473.30.
Parts and accessories for automatic data processing machines and units thereof, magnetic or optical readers, transcribing machines, etc., nesoi 5,253,926 516,992 1,673,255 1,317,650 2,872,581 -2,381,345
7108.12. Gold, nonmonetary, unwrought nesoi (other than powder) 267,505 216,333 0 77,611 2,597,567 2,330,062
9705.00.
Collections and collectors' pieces of zoological, botanical, mineralogical, historical, archaelogical, numismatic or other interest 575,855 160,525 185,968 164,505 2,888,397 2,312,542
7112.91.
Gold waste and scrap, including metal clad with gold but excluding sweepings containing other precious metals 328,033 363,154 0 0 2,542,920 2,214,887
MAURITANIA
2709.00. Petroleum oils and oils from bituminous minerals, crude 300 0 1,047 7,921 564,801,033 564,800,733
2601.11. Iron ore concentrates (other than roasted iron pyrites) and non-agglomerated iron ores 221,071,918 221,079,140 333,776,175 399,522,495 505,734,839 284,662,921
0307.59. Octopus, frozen, dried, salted or in brine 88,228,137 135,372,623 149,694,513 173,063,605 153,697,692 65,469,555
0303.74.
Mackerel (scomber scombrus, scomber australasicus, scomber japonicus), excluding fillets, livers and roes, frozen 20,073,868 19,213,659 44,793,039 87,235,653 71,032,977 50,959,109
2601.12. Agglomerated iron ores 16,976,556 23,642,686 43,577,131 66,491,973 48,316,473 31,339,917
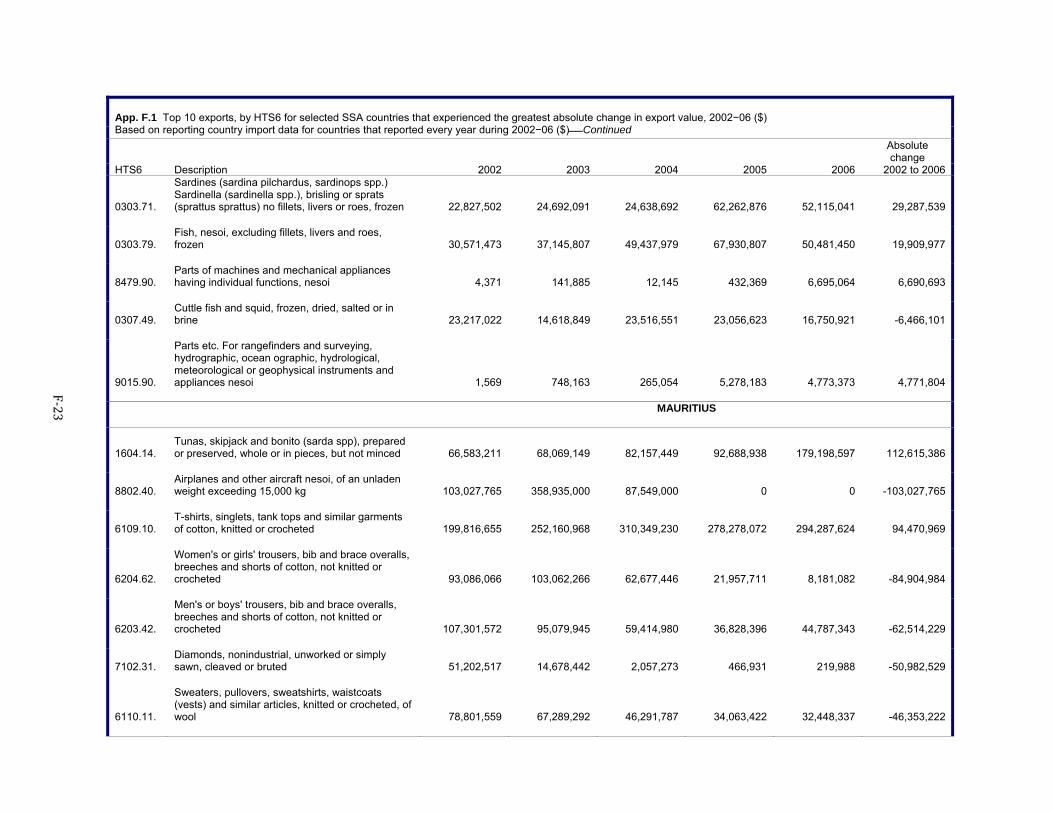
F‐23
App. F.1 Top 10 exports, by HTS6 for selected SSA countries that experienced the greatest absolute change in export value, 2002−06 ($) Based on reporting country import data for countries that reported every year during 2002−06 ($)Continued
Absolute change
HTS6 Description 2002 2003 2004 2005 2006 2002 to 2006
0303.71.
Sardines (sardina pilchardus, sardinops spp.) Sardinella (sardinella spp.), brisling or sprats (sprattus sprattus) no fillets, livers or roes, frozen 22,827,502 24,692,091 24,638,692 62,262,876 52,115,041 29,287,539
0303.79. Fish, nesoi, excluding fillets, livers and roes, frozen 30,571,473 37,145,807 49,437,979 67,930,807 50,481,450 19,909,977
8479.90. Parts of machines and mechanical appliances having individual functions, nesoi 4,371 141,885 12,145 432,369 6,695,064 6,690,693
0307.49. Cuttle fish and squid, frozen, dried, salted or in brine 23,217,022 14,618,849 23,516,551 23,056,623 16,750,921 -6,466,101
9015.90.
Parts etc. For rangefinders and surveying, hydrographic, ocean ographic, hydrological, meteorological or geophysical instruments and appliances nesoi 1,569 748,163 265,054 5,278,183 4,773,373 4,771,804
MAURITIUS
1604.14. Tunas, skipjack and bonito (sarda spp), prepared or preserved, whole or in pieces, but not minced 66,583,211 68,069,149 82,157,449 92,688,938 179,198,597 112,615,386
8802.40. Airplanes and other aircraft nesoi, of an unladen weight exceeding 15,000 kg 103,027,765 358,935,000 87,549,000 0 0 -103,027,765
6109.10. T-shirts, singlets, tank tops and similar garments of cotton, knitted or crocheted 199,816,655 252,160,968 310,349,230 278,278,072 294,287,624 94,470,969
6204.62.
Women's or girls' trousers, bib and brace overalls, breeches and shorts of cotton, not knitted or crocheted 93,086,066 103,062,266 62,677,446 21,957,711 8,181,082 -84,904,984
6203.42.
Men's or boys' trousers, bib and brace overalls, breeches and shorts of cotton, not knitted or crocheted 107,301,572 95,079,945 59,414,980 36,828,396 44,787,343 -62,514,229
7102.31. Diamonds, nonindustrial, unworked or simply sawn, cleaved or bruted 51,202,517 14,678,442 2,057,273 466,931 219,988 -50,982,529
6110.11.
Sweaters, pullovers, sweatshirts, waistcoats (vests) and similar articles, knitted or crocheted, of wool 78,801,559 67,289,292 46,291,787 34,063,422 32,448,337 -46,353,222
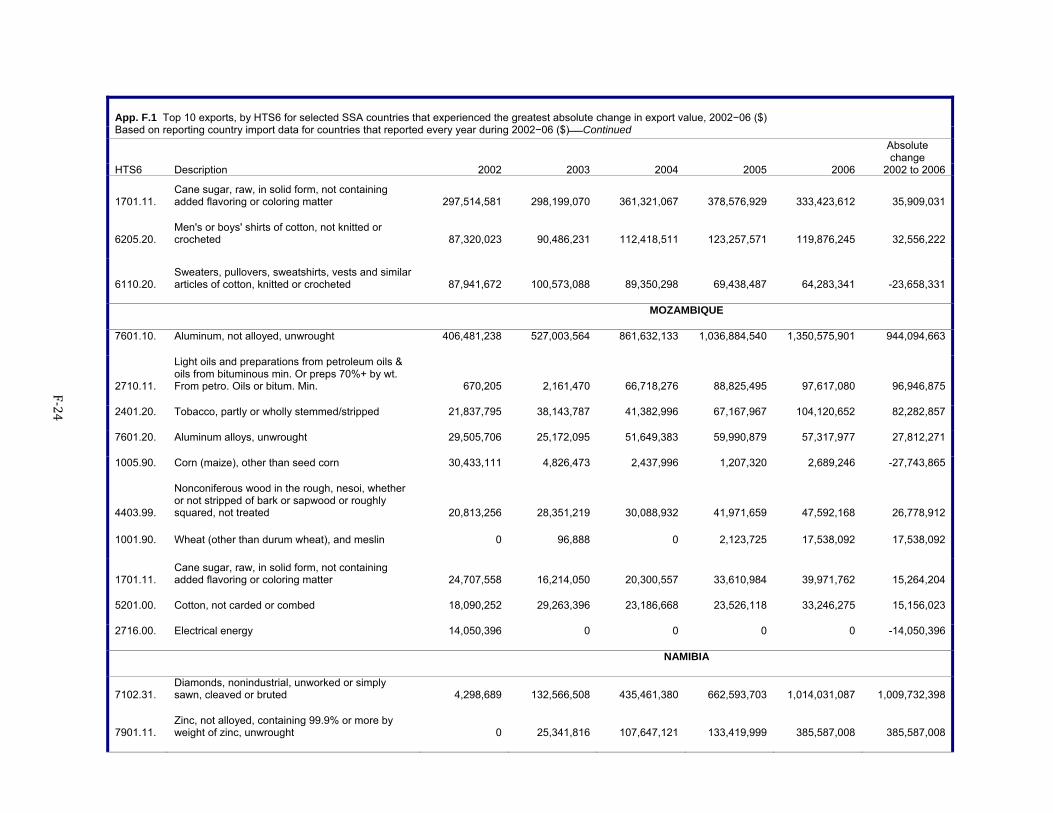
F‐24
App. F.1 Top 10 exports, by HTS6 for selected SSA countries that experienced the greatest absolute change in export value, 2002−06 ($) Based on reporting country import data for countries that reported every year during 2002−06 ($)Continued
Absolute change
HTS6 Description 2002 2003 2004 2005 2006 2002 to 2006
1701.11. Cane sugar, raw, in solid form, not containing added flavoring or coloring matter 297,514,581 298,199,070 361,321,067 378,576,929 333,423,612 35,909,031
6205.20. Men's or boys' shirts of cotton, not knitted or crocheted 87,320,023 90,486,231 112,418,511 123,257,571 119,876,245 32,556,222
6110.20. Sweaters, pullovers, sweatshirts, vests and similar articles of cotton, knitted or crocheted 87,941,672 100,573,088 89,350,298 69,438,487 64,283,341 -23,658,331
MOZAMBIQUE
7601.10. Aluminum, not alloyed, unwrought 406,481,238 527,003,564 861,632,133 1,036,884,540 1,350,575,901 944,094,663
2710.11.
Light oils and preparations from petroleum oils & oils from bituminous min. Or preps 70%+ by wt. From petro. Oils or bitum. Min. 670,205 2,161,470 66,718,276 88,825,495 97,617,080 96,946,875
2401.20. Tobacco, partly or wholly stemmed/stripped 21,837,795 38,143,787 41,382,996 67,167,967 104,120,652 82,282,857
7601.20. Aluminum alloys, unwrought 29,505,706 25,172,095 51,649,383 59,990,879 57,317,977 27,812,271
1005.90. Corn (maize), other than seed corn 30,433,111 4,826,473 2,437,996 1,207,320 2,689,246 -27,743,865
4403.99.
Nonconiferous wood in the rough, nesoi, whether or not stripped of bark or sapwood or roughly squared, not treated 20,813,256 28,351,219 30,088,932 41,971,659 47,592,168 26,778,912
1001.90. Wheat (other than durum wheat), and meslin 0 96,888 0 2,123,725 17,538,092 17,538,092
1701.11. Cane sugar, raw, in solid form, not containing added flavoring or coloring matter 24,707,558 16,214,050 20,300,557 33,610,984 39,971,762 15,264,204
5201.00. Cotton, not carded or combed 18,090,252 29,263,396 23,186,668 23,526,118 33,246,275 15,156,023
2716.00. Electrical energy 14,050,396 0 0 0 0 -14,050,396
NAMIBIA
7102.31. Diamonds, nonindustrial, unworked or simply sawn, cleaved or bruted 4,298,689 132,566,508 435,461,380 662,593,703 1,014,031,087 1,009,732,398
7901.11. Zinc, not alloyed, containing 99.9% or more by weight of zinc, unwrought 0 25,341,816 107,647,121 133,419,999 385,587,008 385,587,008
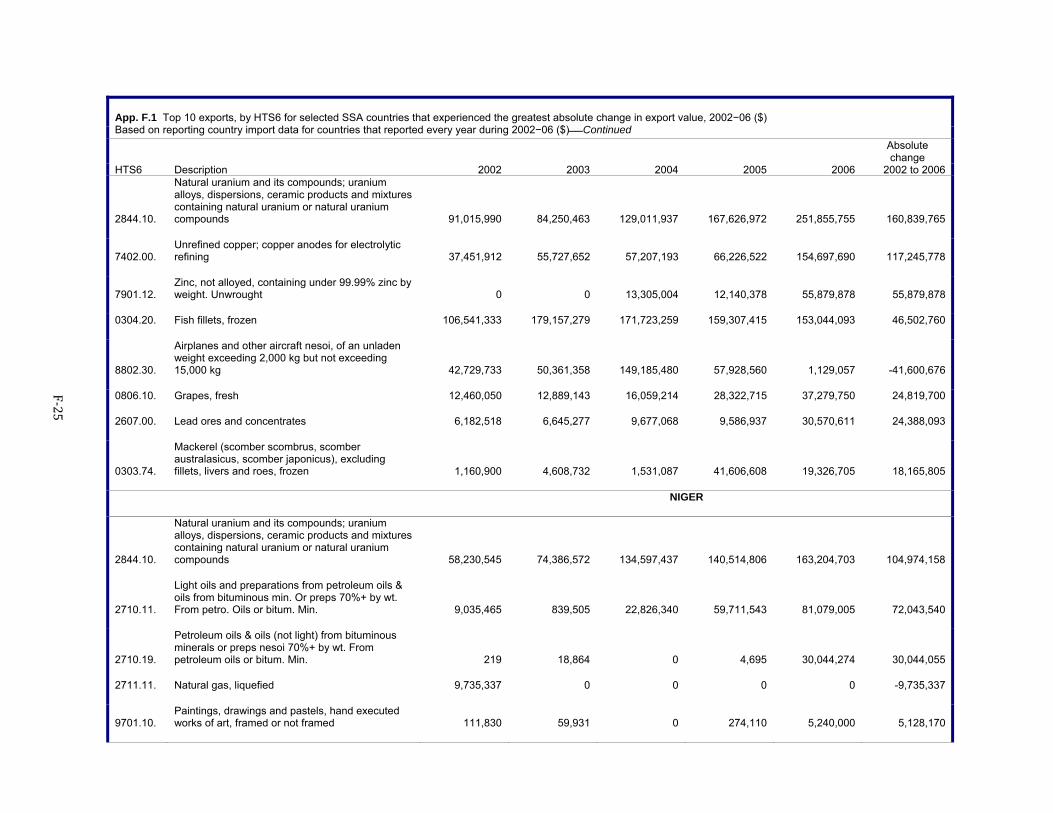
F‐25
App. F.1 Top 10 exports, by HTS6 for selected SSA countries that experienced the greatest absolute change in export value, 2002−06 ($) Based on reporting country import data for countries that reported every year during 2002−06 ($)Continued
Absolute change
HTS6 Description 2002 2003 2004 2005 2006 2002 to 2006
2844.10.
Natural uranium and its compounds; uranium alloys, dispersions, ceramic products and mixtures containing natural uranium or natural uranium compounds 91,015,990 84,250,463 129,011,937 167,626,972 251,855,755 160,839,765
7402.00. Unrefined copper; copper anodes for electrolytic refining 37,451,912 55,727,652 57,207,193 66,226,522 154,697,690 117,245,778
7901.12. Zinc, not alloyed, containing under 99.99% zinc by weight. Unwrought 0 0 13,305,004 12,140,378 55,879,878 55,879,878
0304.20. Fish fillets, frozen 106,541,333 179,157,279 171,723,259 159,307,415 153,044,093 46,502,760
8802.30.
Airplanes and other aircraft nesoi, of an unladen weight exceeding 2,000 kg but not exceeding 15,000 kg 42,729,733 50,361,358 149,185,480 57,928,560 1,129,057 -41,600,676
0806.10. Grapes, fresh 12,460,050 12,889,143 16,059,214 28,322,715 37,279,750 24,819,700
2607.00. Lead ores and concentrates 6,182,518 6,645,277 9,677,068 9,586,937 30,570,611 24,388,093
0303.74.
Mackerel (scomber scombrus, scomber australasicus, scomber japonicus), excluding fillets, livers and roes, frozen 1,160,900 4,608,732 1,531,087 41,606,608 19,326,705 18,165,805
NIGER
2844.10.
Natural uranium and its compounds; uranium alloys, dispersions, ceramic products and mixtures containing natural uranium or natural uranium compounds 58,230,545 74,386,572 134,597,437 140,514,806 163,204,703 104,974,158
2710.11.
Light oils and preparations from petroleum oils & oils from bituminous min. Or preps 70%+ by wt. From petro. Oils or bitum. Min. 9,035,465 839,505 22,826,340 59,711,543 81,079,005 72,043,540
2710.19.
Petroleum oils & oils (not light) from bituminous minerals or preps nesoi 70%+ by wt. From petroleum oils or bitum. Min. 219 18,864 0 4,695 30,044,274 30,044,055
2711.11. Natural gas, liquefied 9,735,337 0 0 0 0 -9,735,337
9701.10. Paintings, drawings and pastels, hand executed works of art, framed or not framed 111,830 59,931 0 274,110 5,240,000 5,128,170
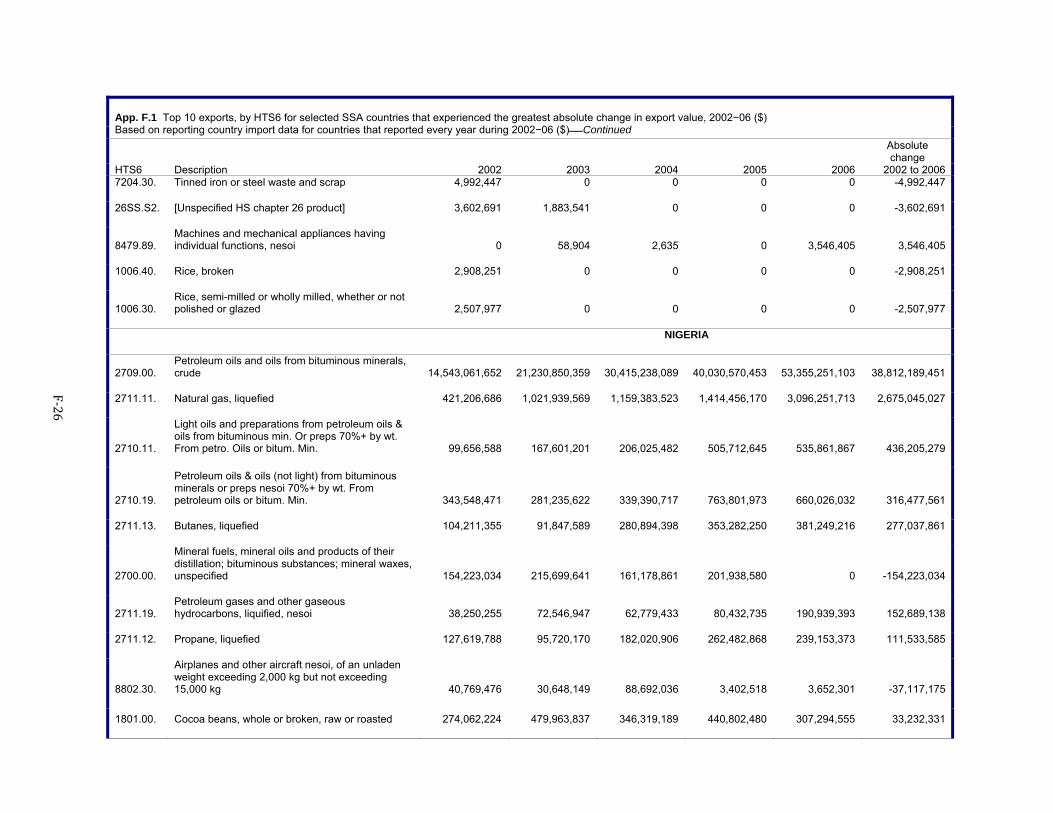
F‐26
App. F.1 Top 10 exports, by HTS6 for selected SSA countries that experienced the greatest absolute change in export value, 2002−06 ($) Based on reporting country import data for countries that reported every year during 2002−06 ($)Continued
Absolute change
HTS6 Description 2002 2003 2004 2005 2006 2002 to 20067204.30. Tinned iron or steel waste and scrap 4,992,447 0 0 0 0 -4,992,447
26SS.S2. [Unspecified HS chapter 26 product] 3,602,691 1,883,541 0 0 0 -3,602,691
8479.89. Machines and mechanical appliances having individual functions, nesoi 0 58,904 2,635 0 3,546,405 3,546,405
1006.40. Rice, broken 2,908,251 0 0 0 0 -2,908,251
1006.30. Rice, semi-milled or wholly milled, whether or not polished or glazed 2,507,977 0 0 0 0 -2,507,977
NIGERIA
2709.00. Petroleum oils and oils from bituminous minerals, crude 14,543,061,652 21,230,850,359 30,415,238,089 40,030,570,453 53,355,251,103 38,812,189,451
2711.11. Natural gas, liquefied 421,206,686 1,021,939,569 1,159,383,523 1,414,456,170 3,096,251,713 2,675,045,027
2710.11.
Light oils and preparations from petroleum oils & oils from bituminous min. Or preps 70%+ by wt. From petro. Oils or bitum. Min. 99,656,588 167,601,201 206,025,482 505,712,645 535,861,867 436,205,279
2710.19.
Petroleum oils & oils (not light) from bituminous minerals or preps nesoi 70%+ by wt. From petroleum oils or bitum. Min. 343,548,471 281,235,622 339,390,717 763,801,973 660,026,032 316,477,561
2711.13. Butanes, liquefied 104,211,355 91,847,589 280,894,398 353,282,250 381,249,216 277,037,861
2700.00.
Mineral fuels, mineral oils and products of their distillation; bituminous substances; mineral waxes, unspecified 154,223,034 215,699,641 161,178,861 201,938,580 0 -154,223,034
2711.19. Petroleum gases and other gaseous hydrocarbons, liquified, nesoi 38,250,255 72,546,947 62,779,433 80,432,735 190,939,393 152,689,138
2711.12. Propane, liquefied 127,619,788 95,720,170 182,020,906 262,482,868 239,153,373 111,533,585
8802.30.
Airplanes and other aircraft nesoi, of an unladen weight exceeding 2,000 kg but not exceeding 15,000 kg 40,769,476 30,648,149 88,692,036 3,402,518 3,652,301 -37,117,175
1801.00. Cocoa beans, whole or broken, raw or roasted 274,062,224 479,963,837 346,319,189 440,802,480 307,294,555 33,232,331
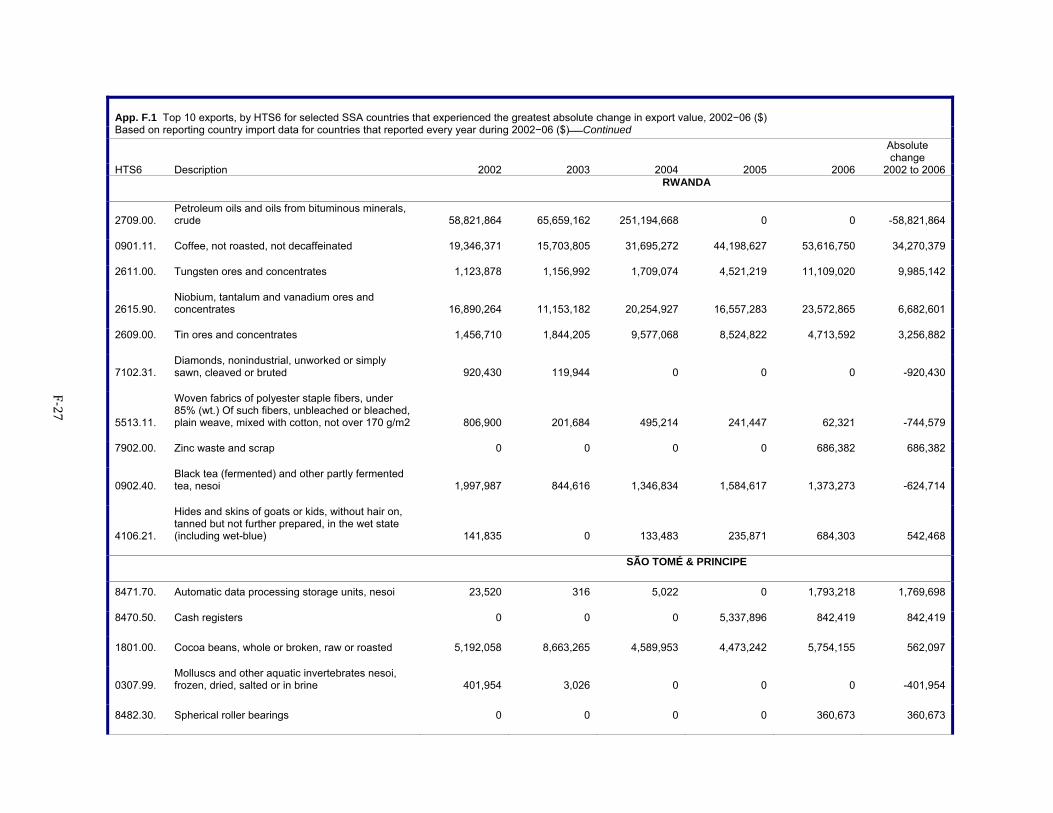
F‐27
App. F.1 Top 10 exports, by HTS6 for selected SSA countries that experienced the greatest absolute change in export value, 2002−06 ($) Based on reporting country import data for countries that reported every year during 2002−06 ($)Continued
Absolute change
HTS6 Description 2002 2003 2004 2005 2006 2002 to 2006 RWANDA
2709.00. Petroleum oils and oils from bituminous minerals, crude 58,821,864 65,659,162 251,194,668 0 0 -58,821,864
0901.11. Coffee, not roasted, not decaffeinated 19,346,371 15,703,805 31,695,272 44,198,627 53,616,750 34,270,379
2611.00. Tungsten ores and concentrates 1,123,878 1,156,992 1,709,074 4,521,219 11,109,020 9,985,142
2615.90. Niobium, tantalum and vanadium ores and concentrates 16,890,264 11,153,182 20,254,927 16,557,283 23,572,865 6,682,601
2609.00. Tin ores and concentrates 1,456,710 1,844,205 9,577,068 8,524,822 4,713,592 3,256,882
7102.31. Diamonds, nonindustrial, unworked or simply sawn, cleaved or bruted 920,430 119,944 0 0 0 -920,430
5513.11.
Woven fabrics of polyester staple fibers, under 85% (wt.) Of such fibers, unbleached or bleached, plain weave, mixed with cotton, not over 170 g/m2 806,900 201,684 495,214 241,447 62,321 -744,579
7902.00. Zinc waste and scrap 0 0 0 0 686,382 686,382
0902.40. Black tea (fermented) and other partly fermented tea, nesoi 1,997,987 844,616 1,346,834 1,584,617 1,373,273 -624,714
4106.21.
Hides and skins of goats or kids, without hair on, tanned but not further prepared, in the wet state (including wet-blue) 141,835 0 133,483 235,871 684,303 542,468
SÃO TOMÉ & PRINCIPE
8471.70. Automatic data processing storage units, nesoi 23,520 316 5,022 0 1,793,218 1,769,698
8470.50. Cash registers 0 0 0 5,337,896 842,419 842,419
1801.00. Cocoa beans, whole or broken, raw or roasted 5,192,058 8,663,265 4,589,953 4,473,242 5,754,155 562,097
0307.99. Molluscs and other aquatic invertebrates nesoi, frozen, dried, salted or in brine 401,954 3,026 0 0 0 -401,954
8482.30. Spherical roller bearings 0 0 0 0 360,673 360,673
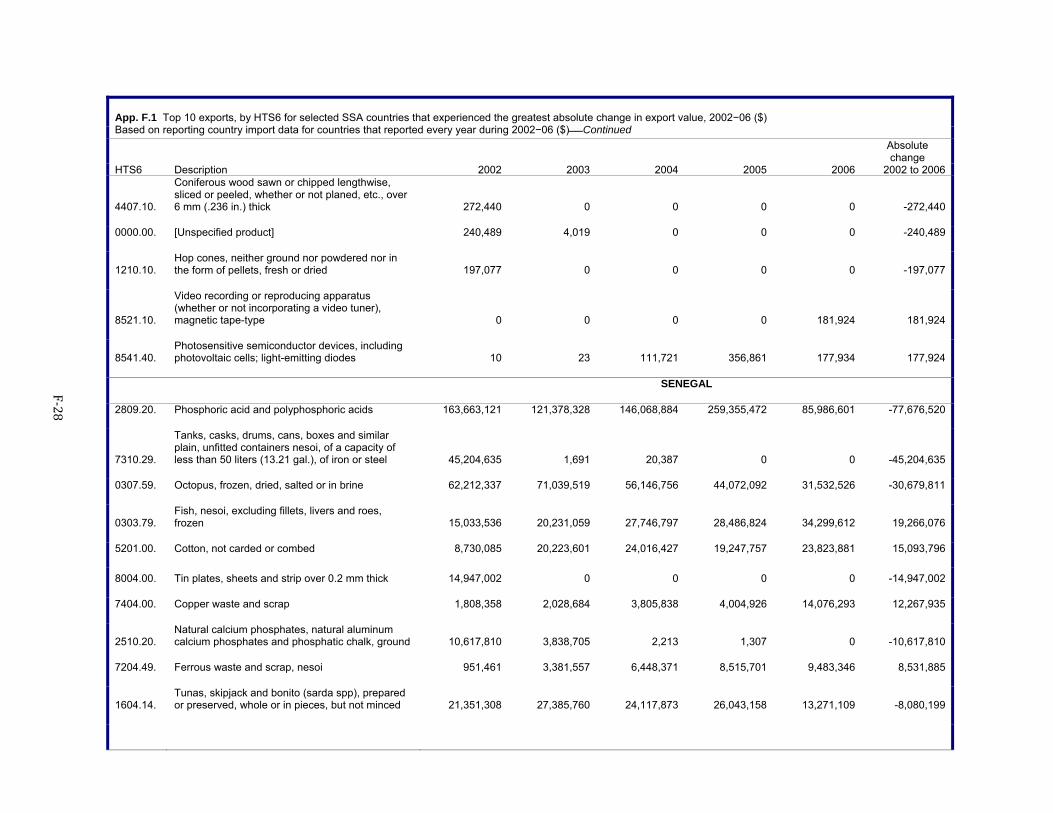
F‐28
App. F.1 Top 10 exports, by HTS6 for selected SSA countries that experienced the greatest absolute change in export value, 2002−06 ($) Based on reporting country import data for countries that reported every year during 2002−06 ($)Continued
Absolute change
HTS6 Description 2002 2003 2004 2005 2006 2002 to 2006
4407.10.
Coniferous wood sawn or chipped lengthwise, sliced or peeled, whether or not planed, etc., over 6 mm (.236 in.) thick 272,440 0 0 0 0 -272,440
0000.00. [Unspecified product] 240,489 4,019 0 0 0 -240,489
1210.10. Hop cones, neither ground nor powdered nor in the form of pellets, fresh or dried 197,077 0 0 0 0 -197,077
8521.10.
Video recording or reproducing apparatus (whether or not incorporating a video tuner), magnetic tape-type 0 0 0 0 181,924 181,924
8541.40. Photosensitive semiconductor devices, including photovoltaic cells; light-emitting diodes 10 23 111,721 356,861 177,934 177,924
SENEGAL
2809.20. Phosphoric acid and polyphosphoric acids 163,663,121 121,378,328 146,068,884 259,355,472 85,986,601 -77,676,520
7310.29.
Tanks, casks, drums, cans, boxes and similar plain, unfitted containers nesoi, of a capacity of less than 50 liters (13.21 gal.), of iron or steel 45,204,635 1,691 20,387 0 0 -45,204,635
0307.59. Octopus, frozen, dried, salted or in brine 62,212,337 71,039,519 56,146,756 44,072,092 31,532,526 -30,679,811
0303.79. Fish, nesoi, excluding fillets, livers and roes, frozen 15,033,536 20,231,059 27,746,797 28,486,824 34,299,612 19,266,076
5201.00. Cotton, not carded or combed 8,730,085 20,223,601 24,016,427 19,247,757 23,823,881 15,093,796
8004.00. Tin plates, sheets and strip over 0.2 mm thick 14,947,002 0 0 0 0 -14,947,002
7404.00. Copper waste and scrap 1,808,358 2,028,684 3,805,838 4,004,926 14,076,293 12,267,935
2510.20. Natural calcium phosphates, natural aluminum calcium phosphates and phosphatic chalk, ground 10,617,810 3,838,705 2,213 1,307 0 -10,617,810
7204.49. Ferrous waste and scrap, nesoi 951,461 3,381,557 6,448,371 8,515,701 9,483,346 8,531,885
1604.14. Tunas, skipjack and bonito (sarda spp), prepared or preserved, whole or in pieces, but not minced 21,351,308 27,385,760 24,117,873 26,043,158 13,271,109 -8,080,199
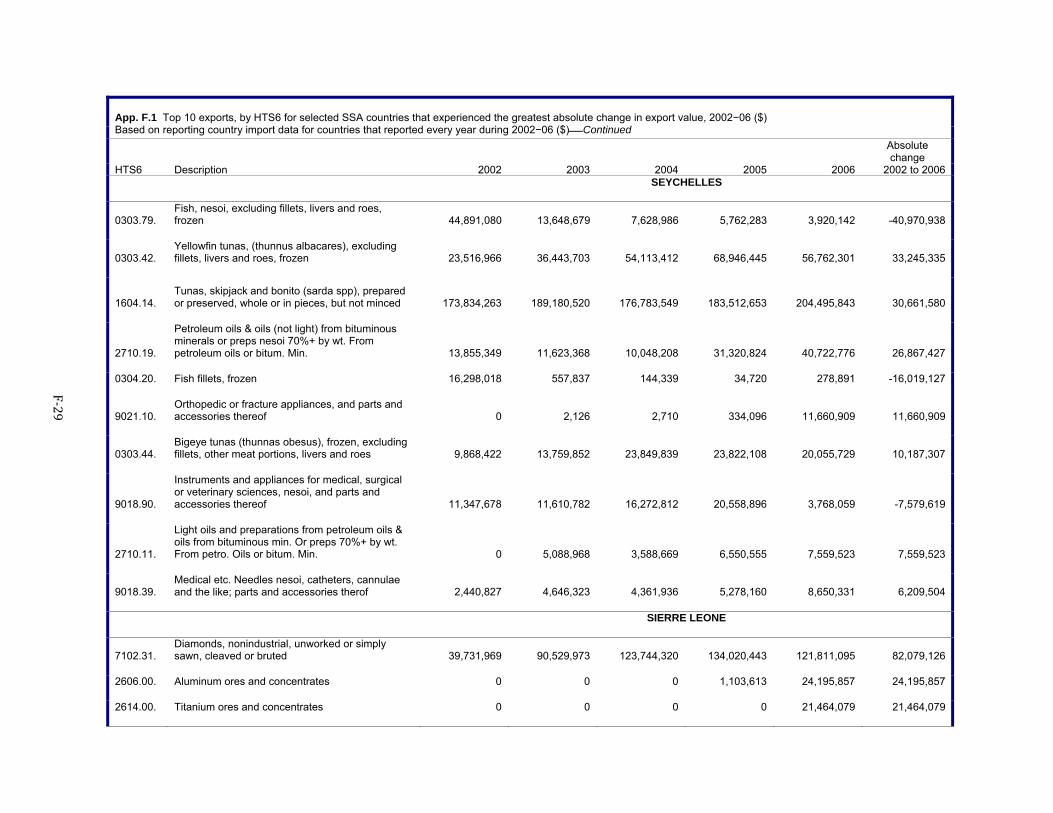
F‐29
App. F.1 Top 10 exports, by HTS6 for selected SSA countries that experienced the greatest absolute change in export value, 2002−06 ($) Based on reporting country import data for countries that reported every year during 2002−06 ($)Continued
Absolute change
HTS6 Description 2002 2003 2004 2005 2006 2002 to 2006 SEYCHELLES
0303.79. Fish, nesoi, excluding fillets, livers and roes, frozen 44,891,080 13,648,679 7,628,986 5,762,283 3,920,142 -40,970,938
0303.42. Yellowfin tunas, (thunnus albacares), excluding fillets, livers and roes, frozen 23,516,966 36,443,703 54,113,412 68,946,445 56,762,301 33,245,335
1604.14. Tunas, skipjack and bonito (sarda spp), prepared or preserved, whole or in pieces, but not minced 173,834,263 189,180,520 176,783,549 183,512,653 204,495,843 30,661,580
2710.19.
Petroleum oils & oils (not light) from bituminous minerals or preps nesoi 70%+ by wt. From petroleum oils or bitum. Min. 13,855,349 11,623,368 10,048,208 31,320,824 40,722,776 26,867,427
0304.20. Fish fillets, frozen 16,298,018 557,837 144,339 34,720 278,891 -16,019,127
9021.10. Orthopedic or fracture appliances, and parts and accessories thereof 0 2,126 2,710 334,096 11,660,909 11,660,909
0303.44. Bigeye tunas (thunnas obesus), frozen, excluding fillets, other meat portions, livers and roes 9,868,422 13,759,852 23,849,839 23,822,108 20,055,729 10,187,307
9018.90.
Instruments and appliances for medical, surgical or veterinary sciences, nesoi, and parts and accessories thereof 11,347,678 11,610,782 16,272,812 20,558,896 3,768,059 -7,579,619
2710.11.
Light oils and preparations from petroleum oils & oils from bituminous min. Or preps 70%+ by wt. From petro. Oils or bitum. Min. 0 5,088,968 3,588,669 6,550,555 7,559,523 7,559,523
9018.39. Medical etc. Needles nesoi, catheters, cannulae and the like; parts and accessories therof 2,440,827 4,646,323 4,361,936 5,278,160 8,650,331 6,209,504
SIERRE LEONE
7102.31. Diamonds, nonindustrial, unworked or simply sawn, cleaved or bruted 39,731,969 90,529,973 123,744,320 134,020,443 121,811,095 82,079,126
2606.00. Aluminum ores and concentrates 0 0 0 1,103,613 24,195,857 24,195,857
2614.00. Titanium ores and concentrates 0 0 0 0 21,464,079 21,464,079
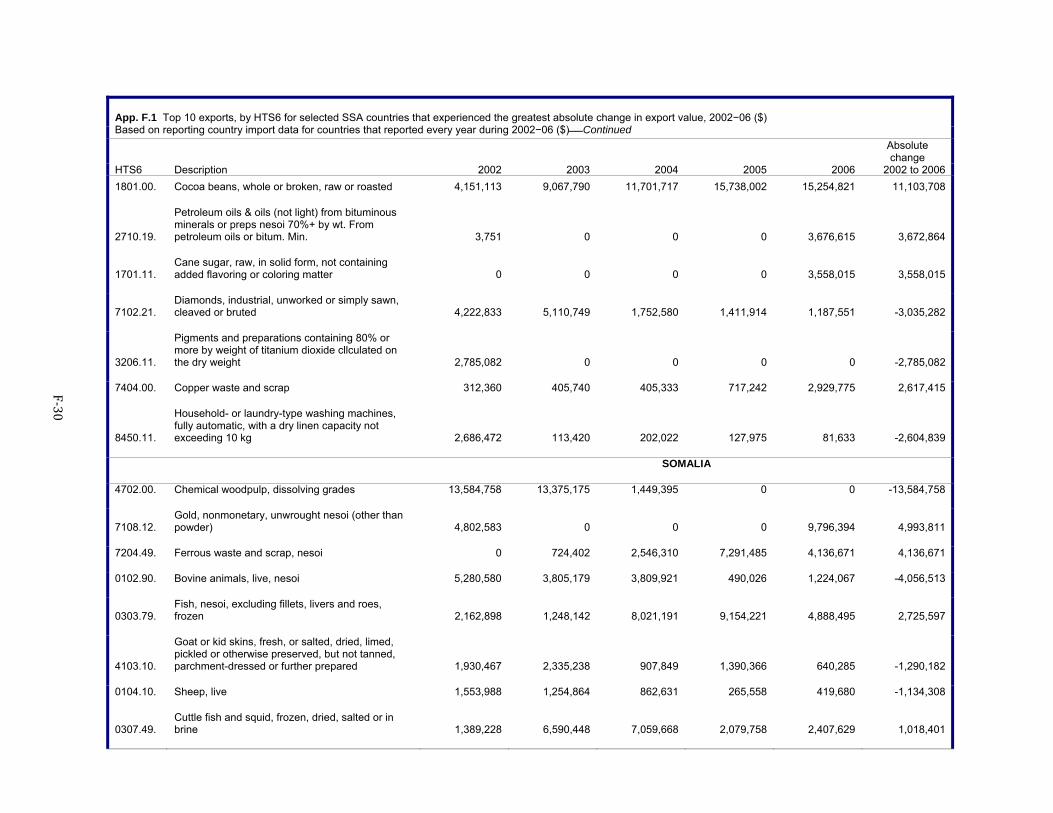
F‐30
App. F.1 Top 10 exports, by HTS6 for selected SSA countries that experienced the greatest absolute change in export value, 2002−06 ($) Based on reporting country import data for countries that reported every year during 2002−06 ($)Continued
Absolute change
HTS6 Description 2002 2003 2004 2005 2006 2002 to 20061801.00. Cocoa beans, whole or broken, raw or roasted 4,151,113 9,067,790 11,701,717 15,738,002 15,254,821 11,103,708
2710.19.
Petroleum oils & oils (not light) from bituminous minerals or preps nesoi 70%+ by wt. From petroleum oils or bitum. Min. 3,751 0 0 0 3,676,615 3,672,864
1701.11. Cane sugar, raw, in solid form, not containing added flavoring or coloring matter 0 0 0 0 3,558,015 3,558,015
7102.21. Diamonds, industrial, unworked or simply sawn, cleaved or bruted 4,222,833 5,110,749 1,752,580 1,411,914 1,187,551 -3,035,282
3206.11.
Pigments and preparations containing 80% or more by weight of titanium dioxide cllculated on the dry weight 2,785,082 0 0 0 0 -2,785,082
7404.00. Copper waste and scrap 312,360 405,740 405,333 717,242 2,929,775 2,617,415
8450.11.
Household- or laundry-type washing machines, fully automatic, with a dry linen capacity not exceeding 10 kg 2,686,472 113,420 202,022 127,975 81,633 -2,604,839
SOMALIA
4702.00. Chemical woodpulp, dissolving grades 13,584,758 13,375,175 1,449,395 0 0 -13,584,758
7108.12. Gold, nonmonetary, unwrought nesoi (other than powder) 4,802,583 0 0 0 9,796,394 4,993,811
7204.49. Ferrous waste and scrap, nesoi 0 724,402 2,546,310 7,291,485 4,136,671 4,136,671
0102.90. Bovine animals, live, nesoi 5,280,580 3,805,179 3,809,921 490,026 1,224,067 -4,056,513
0303.79. Fish, nesoi, excluding fillets, livers and roes, frozen 2,162,898 1,248,142 8,021,191 9,154,221 4,888,495 2,725,597
4103.10.
Goat or kid skins, fresh, or salted, dried, limed, pickled or otherwise preserved, but not tanned, parchment-dressed or further prepared 1,930,467 2,335,238 907,849 1,390,366 640,285 -1,290,182
0104.10. Sheep, live 1,553,988 1,254,864 862,631 265,558 419,680 -1,134,308
0307.49. Cuttle fish and squid, frozen, dried, salted or in brine 1,389,228 6,590,448 7,059,668 2,079,758 2,407,629 1,018,401
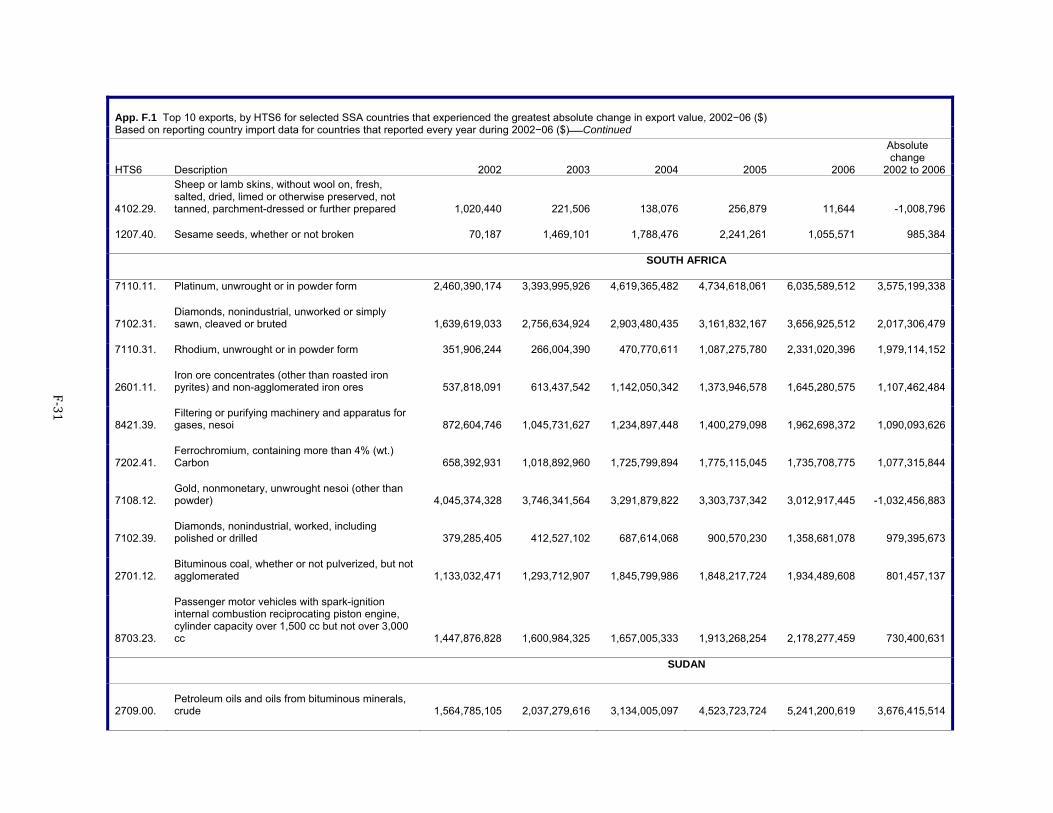
F‐31
App. F.1 Top 10 exports, by HTS6 for selected SSA countries that experienced the greatest absolute change in export value, 2002−06 ($) Based on reporting country import data for countries that reported every year during 2002−06 ($)Continued
Absolute change
HTS6 Description 2002 2003 2004 2005 2006 2002 to 2006
4102.29.
Sheep or lamb skins, without wool on, fresh, salted, dried, limed or otherwise preserved, not tanned, parchment-dressed or further prepared 1,020,440 221,506 138,076 256,879 11,644 -1,008,796
1207.40. Sesame seeds, whether or not broken 70,187 1,469,101 1,788,476 2,241,261 1,055,571 985,384
SOUTH AFRICA
7110.11. Platinum, unwrought or in powder form 2,460,390,174 3,393,995,926 4,619,365,482 4,734,618,061 6,035,589,512 3,575,199,338
7102.31. Diamonds, nonindustrial, unworked or simply sawn, cleaved or bruted 1,639,619,033 2,756,634,924 2,903,480,435 3,161,832,167 3,656,925,512 2,017,306,479
7110.31. Rhodium, unwrought or in powder form 351,906,244 266,004,390 470,770,611 1,087,275,780 2,331,020,396 1,979,114,152
2601.11. Iron ore concentrates (other than roasted iron pyrites) and non-agglomerated iron ores 537,818,091 613,437,542 1,142,050,342 1,373,946,578 1,645,280,575 1,107,462,484
8421.39. Filtering or purifying machinery and apparatus for gases, nesoi 872,604,746 1,045,731,627 1,234,897,448 1,400,279,098 1,962,698,372 1,090,093,626
7202.41. Ferrochromium, containing more than 4% (wt.) Carbon 658,392,931 1,018,892,960 1,725,799,894 1,775,115,045 1,735,708,775 1,077,315,844
7108.12. Gold, nonmonetary, unwrought nesoi (other than powder) 4,045,374,328 3,746,341,564 3,291,879,822 3,303,737,342 3,012,917,445 -1,032,456,883
7102.39. Diamonds, nonindustrial, worked, including polished or drilled 379,285,405 412,527,102 687,614,068 900,570,230 1,358,681,078 979,395,673
2701.12. Bituminous coal, whether or not pulverized, but not agglomerated 1,133,032,471 1,293,712,907 1,845,799,986 1,848,217,724 1,934,489,608 801,457,137
8703.23.
Passenger motor vehicles with spark-ignition internal combustion reciprocating piston engine, cylinder capacity over 1,500 cc but not over 3,000 cc 1,447,876,828 1,600,984,325 1,657,005,333 1,913,268,254 2,178,277,459 730,400,631
SUDAN
2709.00. Petroleum oils and oils from bituminous minerals, crude 1,564,785,105 2,037,279,616 3,134,005,097 4,523,723,724 5,241,200,619 3,676,415,514
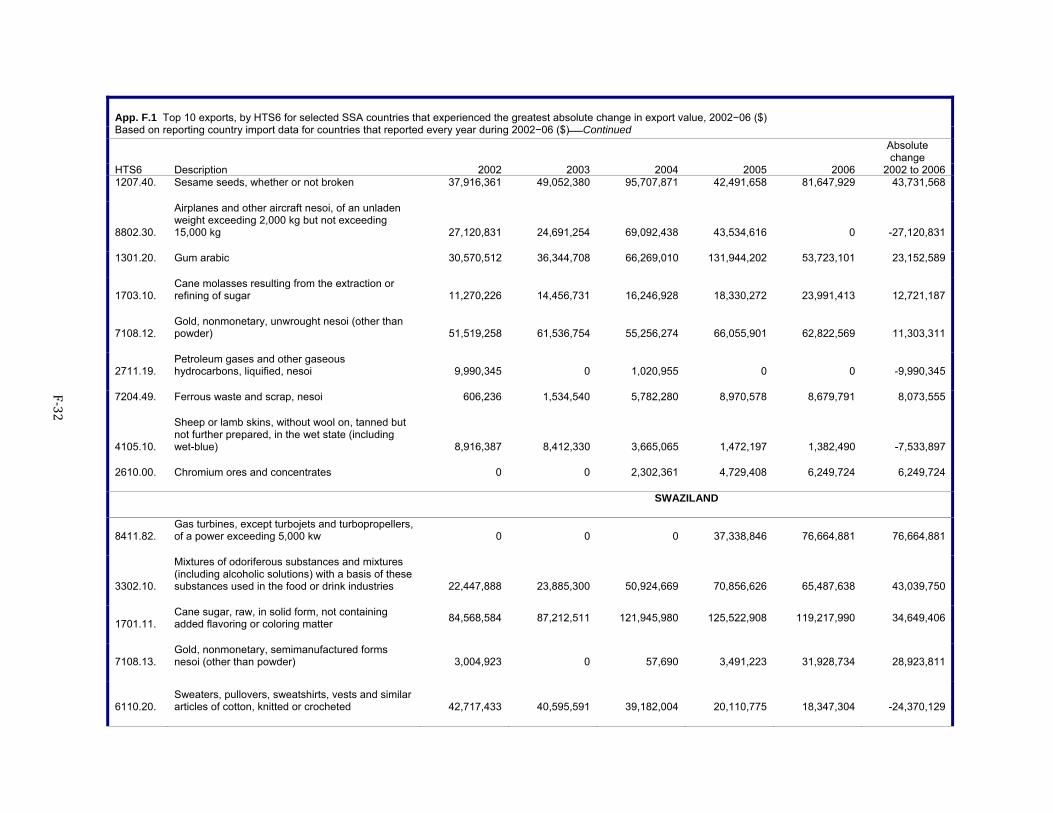
F‐32
App. F.1 Top 10 exports, by HTS6 for selected SSA countries that experienced the greatest absolute change in export value, 2002−06 ($) Based on reporting country import data for countries that reported every year during 2002−06 ($)Continued
Absolute change
HTS6 Description 2002 2003 2004 2005 2006 2002 to 20061207.40. Sesame seeds, whether or not broken 37,916,361 49,052,380 95,707,871 42,491,658 81,647,929 43,731,568
8802.30.
Airplanes and other aircraft nesoi, of an unladen weight exceeding 2,000 kg but not exceeding 15,000 kg 27,120,831 24,691,254 69,092,438 43,534,616 0 -27,120,831
1301.20. Gum arabic 30,570,512 36,344,708 66,269,010 131,944,202 53,723,101 23,152,589
1703.10. Cane molasses resulting from the extraction or refining of sugar 11,270,226 14,456,731 16,246,928 18,330,272 23,991,413 12,721,187
7108.12. Gold, nonmonetary, unwrought nesoi (other than powder) 51,519,258 61,536,754 55,256,274 66,055,901 62,822,569 11,303,311
2711.19. Petroleum gases and other gaseous hydrocarbons, liquified, nesoi 9,990,345 0 1,020,955 0 0 -9,990,345
7204.49. Ferrous waste and scrap, nesoi 606,236 1,534,540 5,782,280 8,970,578 8,679,791 8,073,555
4105.10.
Sheep or lamb skins, without wool on, tanned but not further prepared, in the wet state (including wet-blue) 8,916,387 8,412,330 3,665,065 1,472,197 1,382,490 -7,533,897
2610.00. Chromium ores and concentrates 0 0 2,302,361 4,729,408 6,249,724 6,249,724
SWAZILAND
8411.82. Gas turbines, except turbojets and turbopropellers, of a power exceeding 5,000 kw 0 0 0 37,338,846 76,664,881 76,664,881
3302.10.
Mixtures of odoriferous substances and mixtures (including alcoholic solutions) with a basis of these substances used in the food or drink industries 22,447,888 23,885,300 50,924,669 70,856,626 65,487,638 43,039,750
1701.11. Cane sugar, raw, in solid form, not containing added flavoring or coloring matter 84,568,584 87,212,511 121,945,980 125,522,908 119,217,990 34,649,406
7108.13. Gold, nonmonetary, semimanufactured forms nesoi (other than powder) 3,004,923 0 57,690 3,491,223 31,928,734 28,923,811
6110.20. Sweaters, pullovers, sweatshirts, vests and similar articles of cotton, knitted or crocheted 42,717,433 40,595,591 39,182,004 20,110,775 18,347,304 -24,370,129
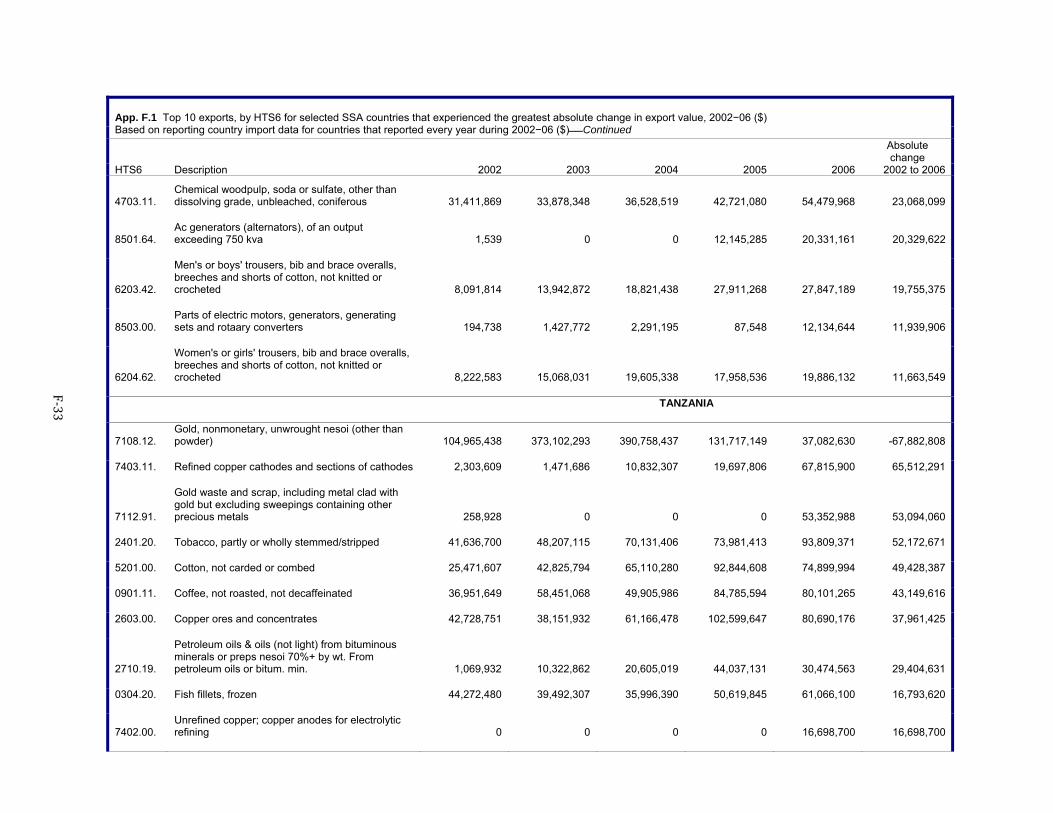
F‐33
App. F.1 Top 10 exports, by HTS6 for selected SSA countries that experienced the greatest absolute change in export value, 2002−06 ($) Based on reporting country import data for countries that reported every year during 2002−06 ($)Continued
Absolute change
HTS6 Description 2002 2003 2004 2005 2006 2002 to 2006
4703.11. Chemical woodpulp, soda or sulfate, other than dissolving grade, unbleached, coniferous 31,411,869 33,878,348 36,528,519 42,721,080 54,479,968 23,068,099
8501.64. Ac generators (alternators), of an output exceeding 750 kva 1,539 0 0 12,145,285 20,331,161 20,329,622
6203.42.
Men's or boys' trousers, bib and brace overalls, breeches and shorts of cotton, not knitted or crocheted 8,091,814 13,942,872 18,821,438 27,911,268 27,847,189 19,755,375
8503.00. Parts of electric motors, generators, generating sets and rotaary converters 194,738 1,427,772 2,291,195 87,548 12,134,644 11,939,906
6204.62.
Women's or girls' trousers, bib and brace overalls, breeches and shorts of cotton, not knitted or crocheted 8,222,583 15,068,031 19,605,338 17,958,536 19,886,132 11,663,549
TANZANIA
7108.12. Gold, nonmonetary, unwrought nesoi (other than powder) 104,965,438 373,102,293 390,758,437 131,717,149 37,082,630 -67,882,808
7403.11. Refined copper cathodes and sections of cathodes 2,303,609 1,471,686 10,832,307 19,697,806 67,815,900 65,512,291
7112.91.
Gold waste and scrap, including metal clad with gold but excluding sweepings containing other precious metals 258,928 0 0 0 53,352,988 53,094,060
2401.20. Tobacco, partly or wholly stemmed/stripped 41,636,700 48,207,115 70,131,406 73,981,413 93,809,371 52,172,671
5201.00. Cotton, not carded or combed 25,471,607 42,825,794 65,110,280 92,844,608 74,899,994 49,428,387
0901.11. Coffee, not roasted, not decaffeinated 36,951,649 58,451,068 49,905,986 84,785,594 80,101,265 43,149,616
2603.00. Copper ores and concentrates 42,728,751 38,151,932 61,166,478 102,599,647 80,690,176 37,961,425
2710.19.
Petroleum oils & oils (not light) from bituminous minerals or preps nesoi 70%+ by wt. From petroleum oils or bitum. min. 1,069,932 10,322,862 20,605,019 44,037,131 30,474,563 29,404,631
0304.20. Fish fillets, frozen 44,272,480 39,492,307 35,996,390 50,619,845 61,066,100 16,793,620
7402.00. Unrefined copper; copper anodes for electrolytic refining 0 0 0 0 16,698,700 16,698,700
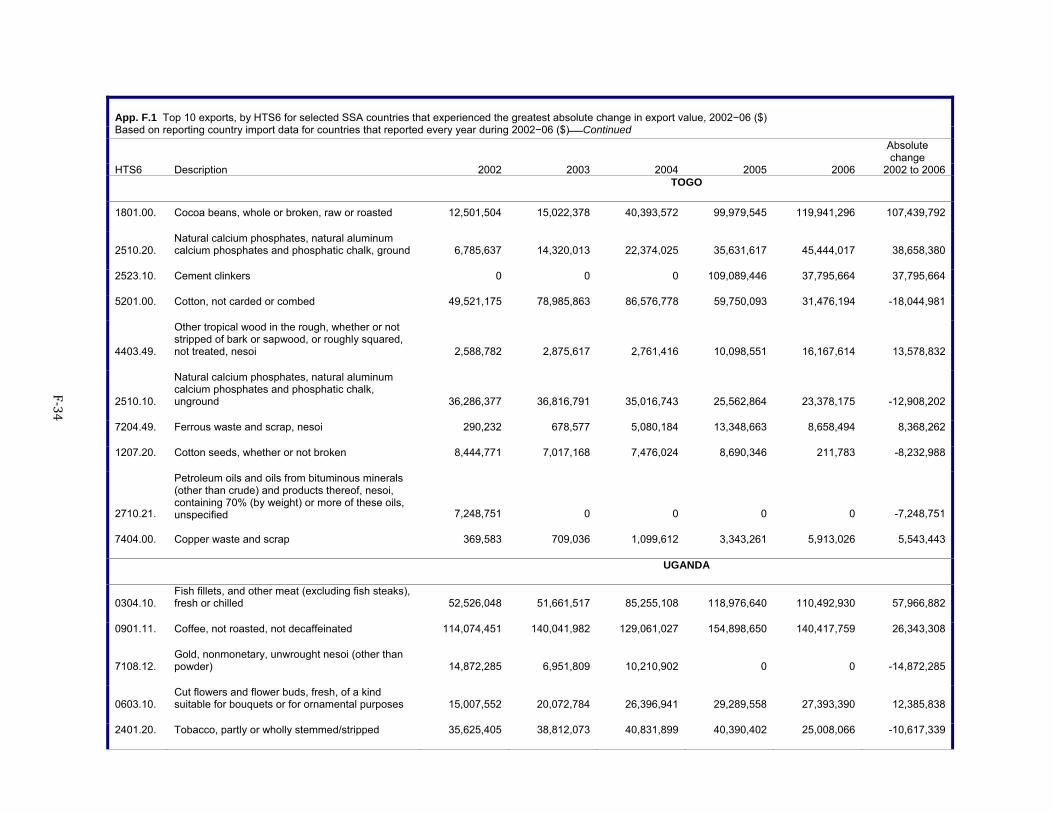
F‐34
App. F.1 Top 10 exports, by HTS6 for selected SSA countries that experienced the greatest absolute change in export value, 2002−06 ($) Based on reporting country import data for countries that reported every year during 2002−06 ($)Continued
Absolute change
HTS6 Description 2002 2003 2004 2005 2006 2002 to 2006 TOGO
1801.00. Cocoa beans, whole or broken, raw or roasted 12,501,504 15,022,378 40,393,572 99,979,545 119,941,296 107,439,792
2510.20. Natural calcium phosphates, natural aluminum calcium phosphates and phosphatic chalk, ground 6,785,637 14,320,013 22,374,025 35,631,617 45,444,017 38,658,380
2523.10. Cement clinkers 0 0 0 109,089,446 37,795,664 37,795,664
5201.00. Cotton, not carded or combed 49,521,175 78,985,863 86,576,778 59,750,093 31,476,194 -18,044,981
4403.49.
Other tropical wood in the rough, whether or not stripped of bark or sapwood, or roughly squared, not treated, nesoi 2,588,782 2,875,617 2,761,416 10,098,551 16,167,614 13,578,832
2510.10.
Natural calcium phosphates, natural aluminum calcium phosphates and phosphatic chalk, unground 36,286,377 36,816,791 35,016,743 25,562,864 23,378,175 -12,908,202
7204.49. Ferrous waste and scrap, nesoi 290,232 678,577 5,080,184 13,348,663 8,658,494 8,368,262
1207.20. Cotton seeds, whether or not broken 8,444,771 7,017,168 7,476,024 8,690,346 211,783 -8,232,988
2710.21.
Petroleum oils and oils from bituminous minerals (other than crude) and products thereof, nesoi, containing 70% (by weight) or more of these oils, unspecified
7,248,751 0 0 0 0 -7,248,751
7404.00. Copper waste and scrap 369,583 709,036 1,099,612 3,343,261 5,913,026 5,543,443
UGANDA
0304.10. Fish fillets, and other meat (excluding fish steaks), fresh or chilled 52,526,048 51,661,517 85,255,108 118,976,640 110,492,930 57,966,882
0901.11. Coffee, not roasted, not decaffeinated 114,074,451 140,041,982 129,061,027 154,898,650 140,417,759 26,343,308
7108.12. Gold, nonmonetary, unwrought nesoi (other than powder) 14,872,285 6,951,809 10,210,902 0 0 -14,872,285
0603.10. Cut flowers and flower buds, fresh, of a kind suitable for bouquets or for ornamental purposes 15,007,552 20,072,784 26,396,941 29,289,558 27,393,390 12,385,838
2401.20. Tobacco, partly or wholly stemmed/stripped 35,625,405 38,812,073 40,831,899 40,390,402 25,008,066 -10,617,339
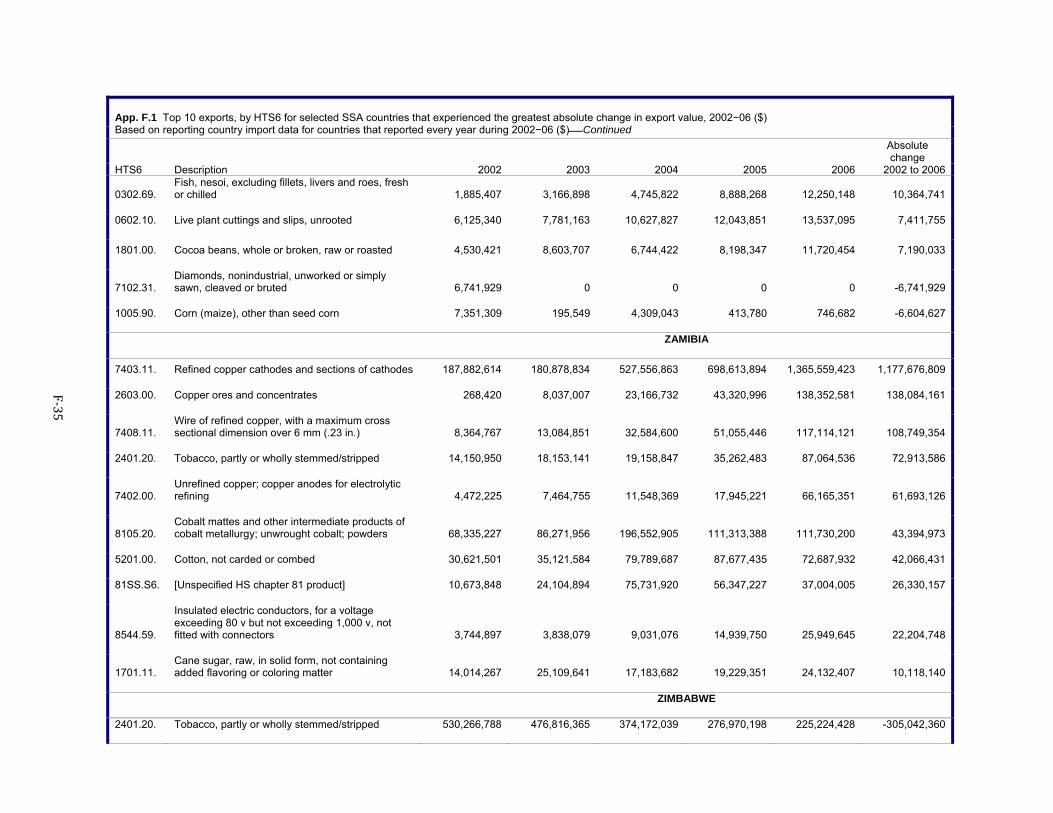
F‐35
App. F.1 Top 10 exports, by HTS6 for selected SSA countries that experienced the greatest absolute change in export value, 2002−06 ($) Based on reporting country import data for countries that reported every year during 2002−06 ($)Continued
Absolute change
HTS6 Description 2002 2003 2004 2005 2006 2002 to 2006
0302.69. Fish, nesoi, excluding fillets, livers and roes, fresh or chilled 1,885,407 3,166,898 4,745,822 8,888,268 12,250,148 10,364,741
0602.10. Live plant cuttings and slips, unrooted 6,125,340 7,781,163 10,627,827 12,043,851 13,537,095 7,411,755
1801.00. Cocoa beans, whole or broken, raw or roasted 4,530,421 8,603,707 6,744,422 8,198,347 11,720,454 7,190,033
7102.31. Diamonds, nonindustrial, unworked or simply sawn, cleaved or bruted 6,741,929 0 0 0 0 -6,741,929
1005.90. Corn (maize), other than seed corn 7,351,309 195,549 4,309,043 413,780 746,682 -6,604,627
ZAMIBIA
7403.11. Refined copper cathodes and sections of cathodes 187,882,614 180,878,834 527,556,863 698,613,894 1,365,559,423 1,177,676,809
2603.00. Copper ores and concentrates 268,420 8,037,007 23,166,732 43,320,996 138,352,581 138,084,161
7408.11. Wire of refined copper, with a maximum cross sectional dimension over 6 mm (.23 in.) 8,364,767 13,084,851 32,584,600 51,055,446 117,114,121 108,749,354
2401.20. Tobacco, partly or wholly stemmed/stripped 14,150,950 18,153,141 19,158,847 35,262,483 87,064,536 72,913,586
7402.00. Unrefined copper; copper anodes for electrolytic refining 4,472,225 7,464,755 11,548,369 17,945,221 66,165,351 61,693,126
8105.20. Cobalt mattes and other intermediate products of cobalt metallurgy; unwrought cobalt; powders 68,335,227 86,271,956 196,552,905 111,313,388 111,730,200 43,394,973
5201.00. Cotton, not carded or combed 30,621,501 35,121,584 79,789,687 87,677,435 72,687,932 42,066,431
81SS.S6. [Unspecified HS chapter 81 product] 10,673,848 24,104,894 75,731,920 56,347,227 37,004,005 26,330,157
8544.59.
Insulated electric conductors, for a voltage exceeding 80 v but not exceeding 1,000 v, not fitted with connectors 3,744,897 3,838,079 9,031,076 14,939,750 25,949,645 22,204,748
1701.11. Cane sugar, raw, in solid form, not containing added flavoring or coloring matter 14,014,267 25,109,641 17,183,682 19,229,351 24,132,407 10,118,140
ZIMBABWE
2401.20. Tobacco, partly or wholly stemmed/stripped 530,266,788 476,816,365 374,172,039 276,970,198 225,224,428 -305,042,360
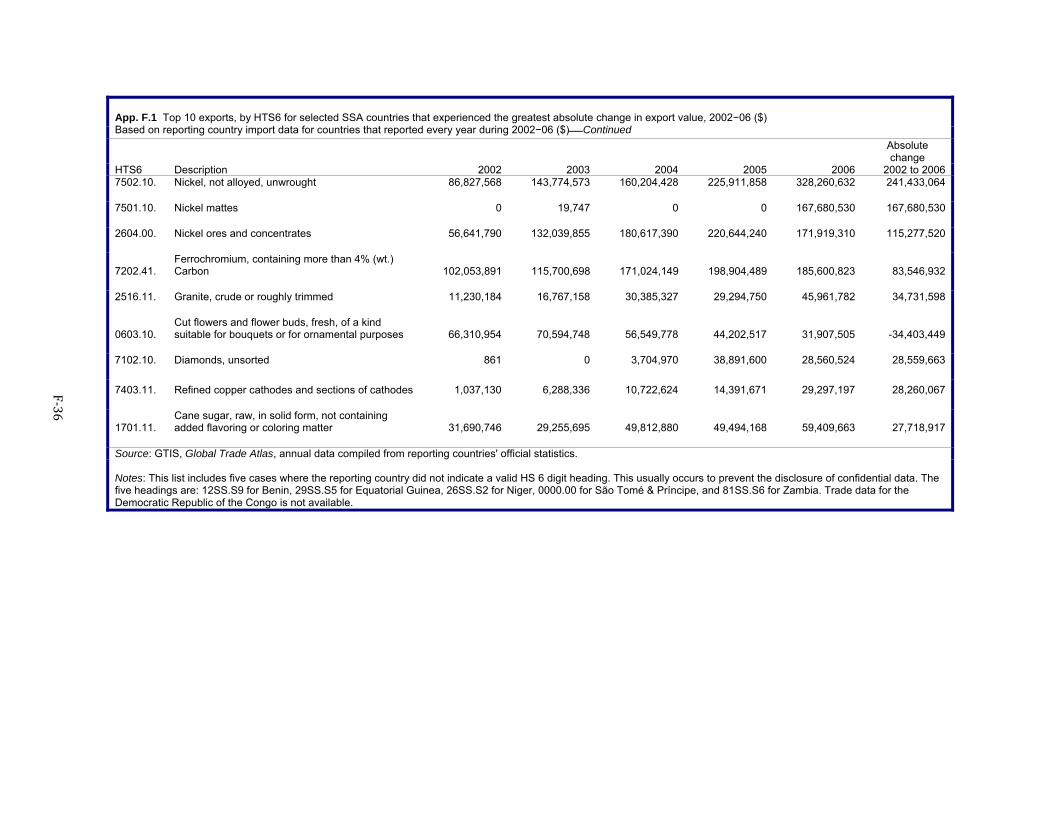
F‐36
App. F.1 Top 10 exports, by HTS6 for selected SSA countries that experienced the greatest absolute change in export value, 2002−06 ($) Based on reporting country import data for countries that reported every year during 2002−06 ($)Continued
Absolute change
HTS6 Description 2002 2003 2004 2005 2006 2002 to 20067502.10. Nickel, not alloyed, unwrought 86,827,568 143,774,573 160,204,428 225,911,858 328,260,632 241,433,064
7501.10. Nickel mattes 0 19,747 0 0 167,680,530 167,680,530
2604.00. Nickel ores and concentrates 56,641,790 132,039,855 180,617,390 220,644,240 171,919,310 115,277,520
7202.41. Ferrochromium, containing more than 4% (wt.) Carbon 102,053,891 115,700,698 171,024,149 198,904,489 185,600,823 83,546,932
2516.11. Granite, crude or roughly trimmed 11,230,184 16,767,158 30,385,327 29,294,750 45,961,782 34,731,598
0603.10. Cut flowers and flower buds, fresh, of a kind suitable for bouquets or for ornamental purposes 66,310,954 70,594,748 56,549,778 44,202,517 31,907,505 -34,403,449
7102.10. Diamonds, unsorted 861 0 3,704,970 38,891,600 28,560,524 28,559,663
7403.11. Refined copper cathodes and sections of cathodes 1,037,130 6,288,336 10,722,624 14,391,671 29,297,197 28,260,067
1701.11. Cane sugar, raw, in solid form, not containing added flavoring or coloring matter 31,690,746 29,255,695 49,812,880 49,494,168 59,409,663 27,718,917
Source: GTIS, Global Trade Atlas, annual data compiled from reporting countries' official statistics. Notes: This list includes five cases where the reporting country did not indicate a valid HS 6 digit heading. This usually occurs to prevent the disclosure of confidential data. The five headings are: 12SS.S9 for Benin, 29SS.S5 for Equatorial Guinea, 26SS.S2 for Niger, 0000.00 for São Tomé & Príncipe, and 81SS.S6 for Zambia. Trade data for the Democratic Republic of the Congo is not available.
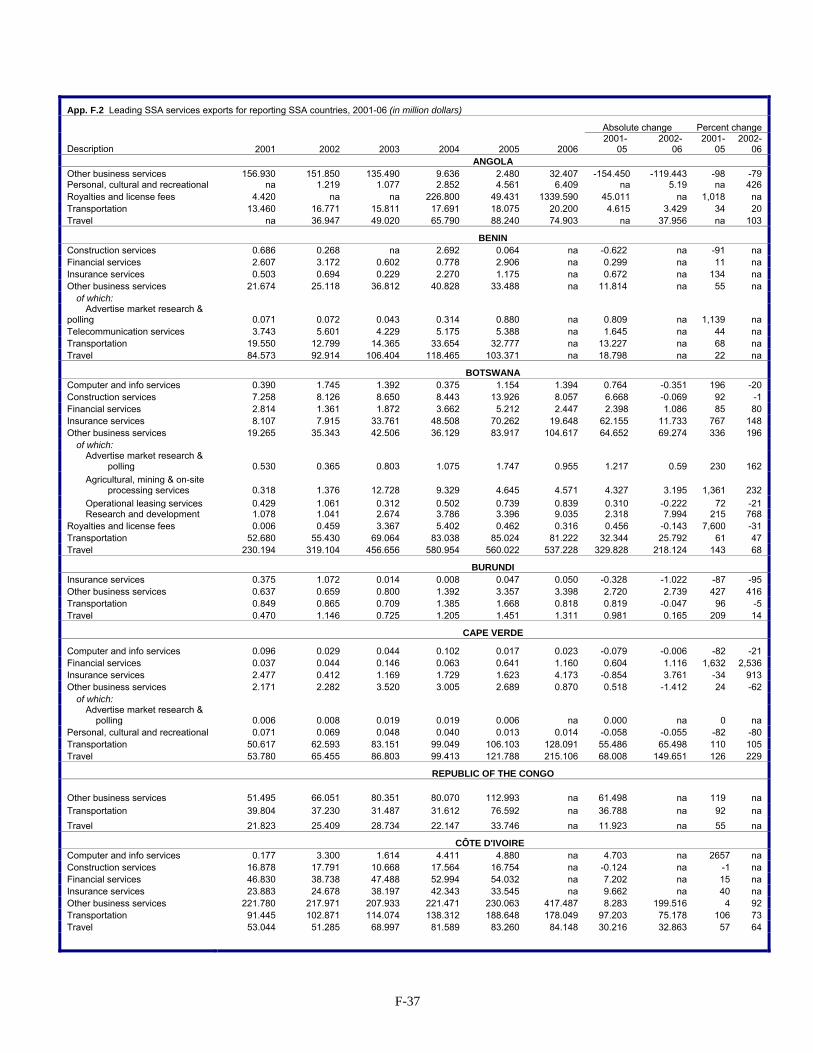
F-37
App. F.2 Leading SSA services exports for reporting SSA countries, 2001-06 (in million dollars)
Absolute change Percent change Description 2001 2002 2003 2004 2005 2006
2001- 05
2002- 06
2001-05
2002-06
ANGOLA Other business services 156.930 151.850 135.490 9.636 2.480 32.407 -154.450 -119.443 -98 -79 Personal, cultural and recreational na 1.219 1.077 2.852 4.561 6.409 na 5.19 na 426 Royalties and license fees 4.420 na na 226.800 49.431 1339.590 45.011 na 1,018 na Transportation 13.460 16.771 15.811 17.691 18.075 20.200 4.615 3.429 34 20 Travel na 36.947 49.020 65.790 88.240 74.903 na 37.956 na 103
BENIN Construction services 0.686 0.268 na 2.692 0.064 na -0.622 na -91 na Financial services 2.607 3.172 0.602 0.778 2.906 na 0.299 na 11 na Insurance services 0.503 0.694 0.229 2.270 1.175 na 0.672 na 134 na Other business services 21.674 25.118 36.812 40.828 33.488 na 11.814 na 55 na
of which: Advertise market research &
polling 0.071 0.072 0.043 0.314 0.880 na 0.809 na 1,139 na Telecommunication services 3.743 5.601 4.229 5.175 5.388 na 1.645 na 44 na Transportation 19.550 12.799 14.365 33.654 32.777 na 13.227 na 68 na Travel 84.573 92.914 106.404 118.465 103.371 na 18.798 na 22 na
BOTSWANA Computer and info services 0.390 1.745 1.392 0.375 1.154 1.394 0.764 -0.351 196 -20 Construction services 7.258 8.126 8.650 8.443 13.926 8.057 6.668 -0.069 92 -1 Financial services 2.814 1.361 1.872 3.662 5.212 2.447 2.398 1.086 85 80 Insurance services 8.107 7.915 33.761 48.508 70.262 19.648 62.155 11.733 767 148 Other business services 19.265 35.343 42.506 36.129 83.917 104.617 64.652 69.274 336 196
of which: Advertise market research & polling 0.530 0.365 0.803 1.075 1.747 0.955 1.217 0.59 230 162 Agricultural, mining & on-site
processing services 0.318 1.376 12.728 9.329 4.645 4.571 4.327 3.195 1,361 232 Operational leasing services 0.429 1.061 0.312 0.502 0.739 0.839 0.310 -0.222 72 -21 Research and development 1.078 1.041 2.674 3.786 3.396 9.035 2.318 7.994 215 768
Royalties and license fees 0.006 0.459 3.367 5.402 0.462 0.316 0.456 -0.143 7,600 -31 Transportation 52.680 55.430 69.064 83.038 85.024 81.222 32.344 25.792 61 47 Travel 230.194 319.104 456.656 580.954 560.022 537.228 329.828 218.124 143 68
BURUNDI Insurance services 0.375 1.072 0.014 0.008 0.047 0.050 -0.328 -1.022 -87 -95 Other business services 0.637 0.659 0.800 1.392 3.357 3.398 2.720 2.739 427 416 Transportation 0.849 0.865 0.709 1.385 1.668 0.818 0.819 -0.047 96 -5 Travel 0.470 1.146 0.725 1.205 1.451 1.311 0.981 0.165 209 14
CAPE VERDE
Computer and info services 0.096 0.029 0.044 0.102 0.017 0.023 -0.079 -0.006 -82 -21 Financial services 0.037 0.044 0.146 0.063 0.641 1.160 0.604 1.116 1,632 2,536 Insurance services 2.477 0.412 1.169 1.729 1.623 4.173 -0.854 3.761 -34 913 Other business services 2.171 2.282 3.520 3.005 2.689 0.870 0.518 -1.412 24 -62
of which: Advertise market research &
polling 0.006 0.008 0.019 0.019 0.006 na 0.000 na 0 na Personal, cultural and recreational 0.071 0.069 0.048 0.040 0.013 0.014 -0.058 -0.055 -82 -80 Transportation 50.617 62.593 83.151 99.049 106.103 128.091 55.486 65.498 110 105 Travel 53.780 65.455 86.803 99.413 121.788 215.106 68.008 149.651 126 229
REPUBLIC OF THE CONGO
Other business services 51.495 66.051 80.351 80.070 112.993 na 61.498 na 119 na Transportation 39.804 37.230 31.487 31.612 76.592 na 36.788 na 92 na Travel 21.823 25.409 28.734 22.147 33.746 na 11.923 na 55 na
CÔTE D'IVOIRE Computer and info services 0.177 3.300 1.614 4.411 4.880 na 4.703 na 2657 na Construction services 16.878 17.791 10.668 17.564 16.754 na -0.124 na -1 na Financial services 46.830 38.738 47.488 52.994 54.032 na 7.202 na 15 na Insurance services 23.883 24.678 38.197 42.343 33.545 na 9.662 na 40 na Other business services 221.780 217.971 207.933 221.471 230.063 417.487 8.283 199.516 4 92 Transportation 91.445 102.871 114.074 138.312 188.648 178.049 97.203 75.178 106 73 Travel 53.044 51.285 68.997 81.589 83.260 84.148 30.216 32.863 57 64
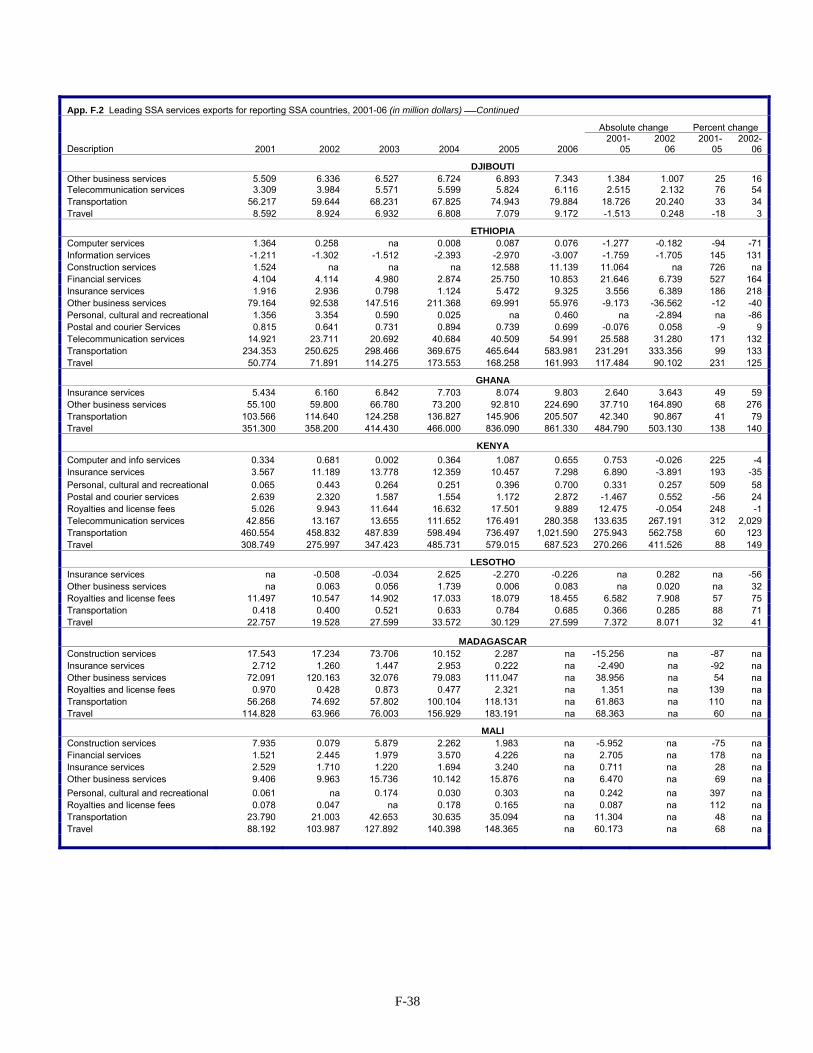
F-38
App. F.2 Leading SSA services exports for reporting SSA countries, 2001-06 (in million dollars) Continued
Absolute change Percent change Description 2001 2002 2003 2004 2005 2006
2001- 05
2002 06
2001-05
2002- 06
DJIBOUTI Other business services 5.509 6.336 6.527 6.724 6.893 7.343 1.384 1.007 25 16 Telecommunication services 3.309 3.984 5.571 5.599 5.824 6.116 2.515 2.132 76 54 Transportation 56.217 59.644 68.231 67.825 74.943 79.884 18.726 20.240 33 34 Travel 8.592 8.924 6.932 6.808 7.079 9.172 -1.513 0.248 -18 3
ETHIOPIA Computer services 1.364 0.258 na 0.008 0.087 0.076 -1.277 -0.182 -94 -71 Information services -1.211 -1.302 -1.512 -2.393 -2.970 -3.007 -1.759 -1.705 145 131 Construction services 1.524 na na na 12.588 11.139 11.064 na 726 na Financial services 4.104 4.114 4.980 2.874 25.750 10.853 21.646 6.739 527 164 Insurance services 1.916 2.936 0.798 1.124 5.472 9.325 3.556 6.389 186 218 Other business services 79.164 92.538 147.516 211.368 69.991 55.976 -9.173 -36.562 -12 -40 Personal, cultural and recreational 1.356 3.354 0.590 0.025 na 0.460 na -2.894 na -86 Postal and courier Services 0.815 0.641 0.731 0.894 0.739 0.699 -0.076 0.058 -9 9 Telecommunication services 14.921 23.711 20.692 40.684 40.509 54.991 25.588 31.280 171 132 Transportation 234.353 250.625 298.466 369.675 465.644 583.981 231.291 333.356 99 133 Travel 50.774 71.891 114.275 173.553 168.258 161.993 117.484 90.102 231 125
GHANA Insurance services 5.434 6.160 6.842 7.703 8.074 9.803 2.640 3.643 49 59 Other business services 55.100 59.800 66.780 73.200 92.810 224.690 37.710 164.890 68 276 Transportation 103.566 114.640 124.258 136.827 145.906 205.507 42.340 90.867 41 79 Travel 351.300 358.200 414.430 466.000 836.090 861.330 484.790 503.130 138 140
KENYA Computer and info services 0.334 0.681 0.002 0.364 1.087 0.655 0.753 -0.026 225 -4 Insurance services 3.567 11.189 13.778 12.359 10.457 7.298 6.890 -3.891 193 -35 Personal, cultural and recreational 0.065 0.443 0.264 0.251 0.396 0.700 0.331 0.257 509 58 Postal and courier services 2.639 2.320 1.587 1.554 1.172 2.872 -1.467 0.552 -56 24 Royalties and license fees 5.026 9.943 11.644 16.632 17.501 9.889 12.475 -0.054 248 -1 Telecommunication services 42.856 13.167 13.655 111.652 176.491 280.358 133.635 267.191 312 2,029 Transportation 460.554 458.832 487.839 598.494 736.497 1,021.590 275.943 562.758 60 123 Travel 308.749 275.997 347.423 485.731 579.015 687.523 270.266 411.526 88 149
LESOTHO Insurance services na -0.508 -0.034 2.625 -2.270 -0.226 na 0.282 na -56 Other business services na 0.063 0.056 1.739 0.006 0.083 na 0.020 na 32 Royalties and license fees 11.497 10.547 14.902 17.033 18.079 18.455 6.582 7.908 57 75 Transportation 0.418 0.400 0.521 0.633 0.784 0.685 0.366 0.285 88 71 Travel 22.757 19.528 27.599 33.572 30.129 27.599 7.372 8.071 32 41
MADAGASCAR Construction services 17.543 17.234 73.706 10.152 2.287 na -15.256 na -87 na Insurance services 2.712 1.260 1.447 2.953 0.222 na -2.490 na -92 na Other business services 72.091 120.163 32.076 79.083 111.047 na 38.956 na 54 na Royalties and license fees 0.970 0.428 0.873 0.477 2.321 na 1.351 na 139 na Transportation 56.268 74.692 57.802 100.104 118.131 na 61.863 na 110 na Travel 114.828 63.966 76.003 156.929 183.191 na 68.363 na 60 na
MALI Construction services 7.935 0.079 5.879 2.262 1.983 na -5.952 na -75 na Financial services 1.521 2.445 1.979 3.570 4.226 na 2.705 na 178 na Insurance services 2.529 1.710 1.220 1.694 3.240 na 0.711 na 28 na Other business services 9.406 9.963 15.736 10.142 15.876 na 6.470 na 69 na Personal, cultural and recreational 0.061 na 0.174 0.030 0.303 na 0.242 na 397 na Royalties and license fees 0.078 0.047 na 0.178 0.165 na 0.087 na 112 na Transportation 23.790 21.003 42.653 30.635 35.094 na 11.304 na 48 na Travel 88.192 103.987 127.892 140.398 148.365 na 60.173 na 68 na
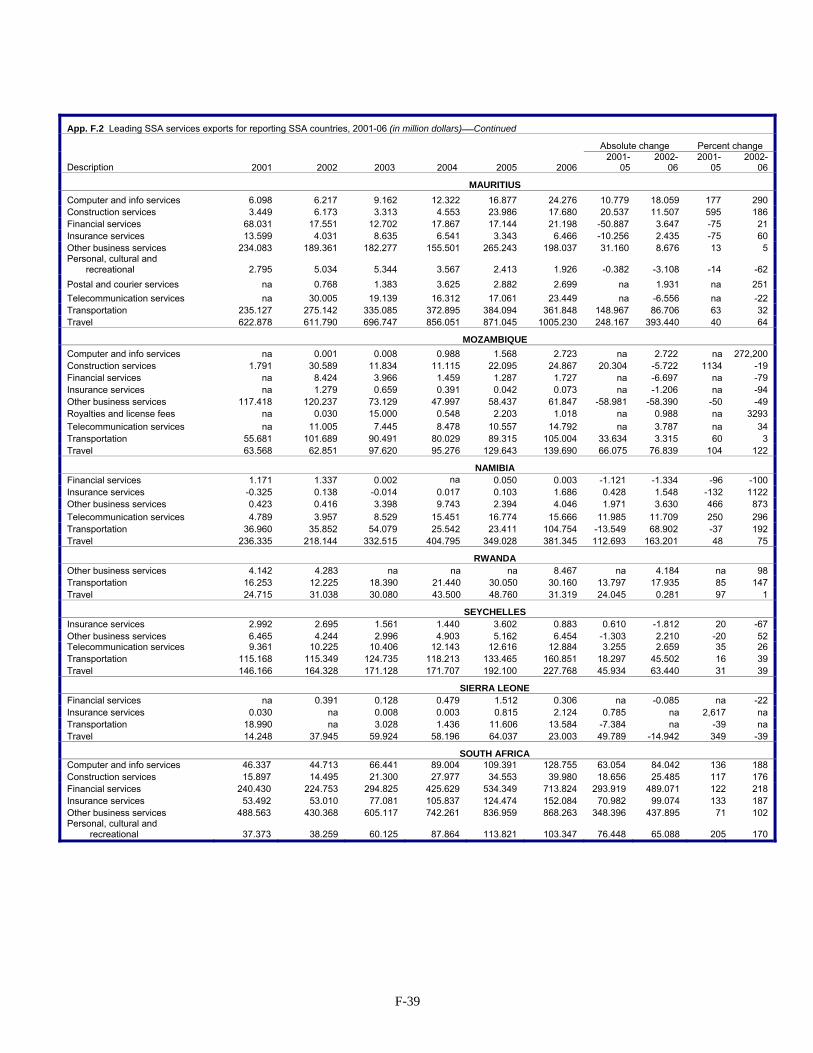
F-39
App. F.2 Leading SSA services exports for reporting SSA countries, 2001-06 (in million dollars)Continued
Absolute change Percent change Description 2001 2002 2003 2004 2005 2006
2001- 05
2002- 06
2001-05
2002- 06
MAURITIUS Computer and info services 6.098 6.217 9.162 12.322 16.877 24.276 10.779 18.059 177 290 Construction services 3.449 6.173 3.313 4.553 23.986 17.680 20.537 11.507 595 186 Financial services 68.031 17.551 12.702 17.867 17.144 21.198 -50.887 3.647 -75 21 Insurance services 13.599 4.031 8.635 6.541 3.343 6.466 -10.256 2.435 -75 60 Other business services 234.083 189.361 182.277 155.501 265.243 198.037 31.160 8.676 13 5 Personal, cultural and recreational 2.795 5.034 5.344 3.567 2.413 1.926 -0.382 -3.108 -14 -62 Postal and courier services na 0.768 1.383 3.625 2.882 2.699 na 1.931 na 251 Telecommunication services na 30.005 19.139 16.312 17.061 23.449 na -6.556 na -22 Transportation 235.127 275.142 335.085 372.895 384.094 361.848 148.967 86.706 63 32 Travel 622.878 611.790 696.747 856.051 871.045 1005.230 248.167 393.440 40 64
MOZAMBIQUE Computer and info services na 0.001 0.008 0.988 1.568 2.723 na 2.722 na 272,200 Construction services 1.791 30.589 11.834 11.115 22.095 24.867 20.304 -5.722 1134 -19 Financial services na 8.424 3.966 1.459 1.287 1.727 na -6.697 na -79 Insurance services na 1.279 0.659 0.391 0.042 0.073 na -1.206 na -94 Other business services 117.418 120.237 73.129 47.997 58.437 61.847 -58.981 -58.390 -50 -49 Royalties and license fees na 0.030 15.000 0.548 2.203 1.018 na 0.988 na 3293 Telecommunication services na 11.005 7.445 8.478 10.557 14.792 na 3.787 na 34 Transportation 55.681 101.689 90.491 80.029 89.315 105.004 33.634 3.315 60 3 Travel 63.568 62.851 97.620 95.276 129.643 139.690 66.075 76.839 104 122
NAMIBIA Financial services 1.171 1.337 0.002 na 0.050 0.003 -1.121 -1.334 -96 -100 Insurance services -0.325 0.138 -0.014 0.017 0.103 1.686 0.428 1.548 -132 1122 Other business services 0.423 0.416 3.398 9.743 2.394 4.046 1.971 3.630 466 873 Telecommunication services 4.789 3.957 8.529 15.451 16.774 15.666 11.985 11.709 250 296 Transportation 36.960 35.852 54.079 25.542 23.411 104.754 -13.549 68.902 -37 192 Travel 236.335 218.144 332.515 404.795 349.028 381.345 112.693 163.201 48 75
RWANDA Other business services 4.142 4.283 na na na 8.467 na 4.184 na 98 Transportation 16.253 12.225 18.390 21.440 30.050 30.160 13.797 17.935 85 147 Travel 24.715 31.038 30.080 43.500 48.760 31.319 24.045 0.281 97 1
SEYCHELLES Insurance services 2.992 2.695 1.561 1.440 3.602 0.883 0.610 -1.812 20 -67 Other business services 6.465 4.244 2.996 4.903 5.162 6.454 -1.303 2.210 -20 52 Telecommunication services 9.361 10.225 10.406 12.143 12.616 12.884 3.255 2.659 35 26 Transportation 115.168 115.349 124.735 118.213 133.465 160.851 18.297 45.502 16 39 Travel 146.166 164.328 171.128 171.707 192.100 227.768 45.934 63.440 31 39
SIERRA LEONE Financial services na 0.391 0.128 0.479 1.512 0.306 na -0.085 na -22 Insurance services 0.030 na 0.008 0.003 0.815 2.124 0.785 na 2,617 na Transportation 18.990 na 3.028 1.436 11.606 13.584 -7.384 na -39 na Travel 14.248 37.945 59.924 58.196 64.037 23.003 49.789 -14.942 349 -39
SOUTH AFRICA Computer and info services 46.337 44.713 66.441 89.004 109.391 128.755 63.054 84.042 136 188 Construction services 15.897 14.495 21.300 27.977 34.553 39.980 18.656 25.485 117 176 Financial services 240.430 224.753 294.825 425.629 534.349 713.824 293.919 489.071 122 218 Insurance services 53.492 53.010 77.081 105.837 124.474 152.084 70.982 99.074 133 187 Other business services 488.563 430.368 605.117 742.261 836.959 868.263 348.396 437.895 71 102 Personal, cultural and recreational 37.373 38.259 60.125 87.864 113.821 103.347 76.448 65.088 205 170
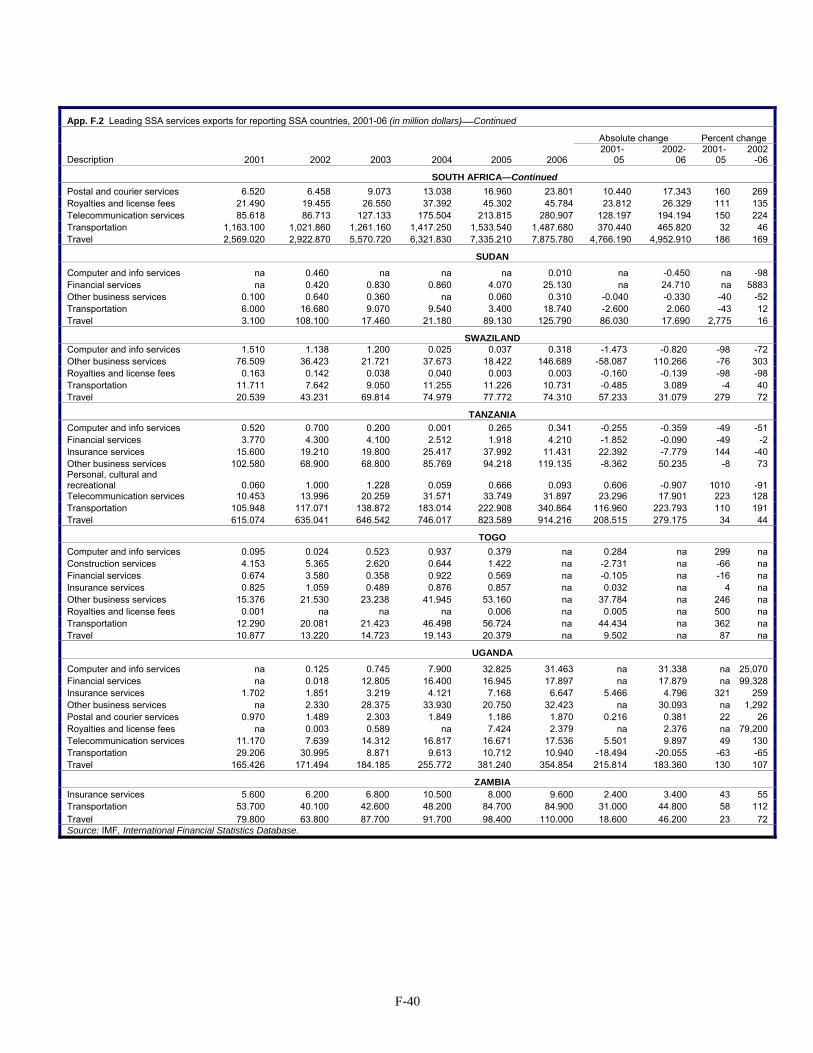
F-40
App. F.2 Leading SSA services exports for reporting SSA countries, 2001-06 (in million dollars)Continued
Absolute change Percent change Description 2001 2002 2003 2004 2005 2006
2001- 05
2002- 06
2001-05
2002-06
SOUTH AFRICA—Continued Postal and courier services 6.520 6.458 9.073 13.038 16.960 23.801 10.440 17.343 160 269 Royalties and license fees 21.490 19.455 26.550 37.392 45.302 45.784 23.812 26.329 111 135 Telecommunication services 85.618 86.713 127.133 175.504 213.815 280.907 128.197 194.194 150 224 Transportation 1,163.100 1,021.860 1,261.160 1,417.250 1,533.540 1,487.680 370.440 465.820 32 46 Travel 2,569.020 2,922.870 5,570.720 6,321.830 7,335.210 7,875.780 4,766.190 4,952.910 186 169
SUDAN
Computer and info services na 0.460 na na na 0.010 na -0.450 na -98 Financial services na 0.420 0.830 0.860 4.070 25.130 na 24.710 na 5883 Other business services 0.100 0.640 0.360 na 0.060 0.310 -0.040 -0.330 -40 -52 Transportation 6.000 16.680 9.070 9.540 3.400 18.740 -2.600 2.060 -43 12 Travel 3.100 108.100 17.460 21.180 89.130 125.790 86.030 17.690 2,775 16
SWAZILAND Computer and info services 1.510 1.138 1.200 0.025 0.037 0.318 -1.473 -0.820 -98 -72 Other business services 76.509 36.423 21.721 37.673 18.422 146.689 -58.087 110.266 -76 303 Royalties and license fees 0.163 0.142 0.038 0.040 0.003 0.003 -0.160 -0.139 -98 -98 Transportation 11.711 7.642 9.050 11.255 11.226 10.731 -0.485 3.089 -4 40 Travel 20.539 43.231 69.814 74.979 77.772 74.310 57.233 31.079 279 72
TANZANIA Computer and info services 0.520 0.700 0.200 0.001 0.265 0.341 -0.255 -0.359 -49 -51 Financial services 3.770 4.300 4.100 2.512 1.918 4.210 -1.852 -0.090 -49 -2 Insurance services 15.600 19.210 19.800 25.417 37.992 11.431 22.392 -7.779 144 -40 Other business services 102.580 68.900 68.800 85.769 94.218 119.135 -8.362 50.235 -8 73 Personal, cultural and recreational 0.060 1.000 1.228 0.059 0.666 0.093 0.606 -0.907 1010 -91 Telecommunication services 10.453 13.996 20.259 31.571 33.749 31.897 23.296 17.901 223 128 Transportation 105.948 117.071 138.872 183.014 222.908 340.864 116.960 223.793 110 191 Travel 615.074 635.041 646.542 746.017 823.589 914.216 208.515 279.175 34 44
TOGO Computer and info services 0.095 0.024 0.523 0.937 0.379 na 0.284 na 299 na Construction services 4.153 5.365 2.620 0.644 1.422 na -2.731 na -66 na Financial services 0.674 3.580 0.358 0.922 0.569 na -0.105 na -16 na Insurance services 0.825 1.059 0.489 0.876 0.857 na 0.032 na 4 na Other business services 15.376 21.530 23.238 41.945 53.160 na 37.784 na 246 na Royalties and license fees 0.001 na na na 0.006 na 0.005 na 500 na Transportation 12.290 20.081 21.423 46.498 56.724 na 44.434 na 362 na Travel 10.877 13.220 14.723 19.143 20.379 na 9.502 na 87 na
UGANDA
Computer and info services na 0.125 0.745 7.900 32.825 31.463 na 31.338 na 25,070 Financial services na 0.018 12.805 16.400 16.945 17.897 na 17.879 na 99,328 Insurance services 1.702 1.851 3.219 4.121 7.168 6.647 5.466 4.796 321 259 Other business services na 2.330 28.375 33.930 20.750 32.423 na 30.093 na 1,292 Postal and courier services 0.970 1.489 2.303 1.849 1.186 1.870 0.216 0.381 22 26 Royalties and license fees na 0.003 0.589 na 7.424 2.379 na 2.376 na 79,200 Telecommunication services 11.170 7.639 14.312 16.817 16.671 17.536 5.501 9.897 49 130 Transportation 29.206 30.995 8.871 9.613 10.712 10.940 -18.494 -20.055 -63 -65 Travel 165.426 171.494 184.185 255.772 381.240 354.854 215.814 183.360 130 107
ZAMBIA Insurance services 5.600 6.200 6.800 10.500 8.000 9.600 2.400 3.400 43 55 Transportation 53.700 40.100 42.600 48.200 84.700 84.900 31.000 44.800 58 112 Travel 79.800 63.800 87.700 91.700 98.400 110.000 18.600 46.200 23 72 Source: IMF, International Financial Statistics Database.